Monthly Archives: January 2020

Cardiac Tamponade: An Acute and Subacute Clinical Challenge

DOI: 10.31038/JCCP.2019222

Background

Pericardial disease resulting in a pericardial effusion is a common clinical finding with numerous etiologies identified including trauma, infection, neoplasm, autoimmune etiology, metabolic cause, or a drug-related process. Once the diagnosis of pericardial effusion has been made, it is important to determine whether the effusion is creating significant hemodynamic compromise resulting in cardiac tamponade. In addition, the timing of accumulation of the pericardial fluid significantly affects the presentation of each case. Typically, a rapid accumulation is seen in acute cases and a delayed accumulation in a subacute presentation. Distinguishing between the diagnoses of pericardial effusion and cardiac tamponade is vital in order to treat a patient appropriately. We report two cases of pericardial effusion with differing etiologies, both resulting in cardiac tamponade physiology and exhibiting components of Beck’s triad. Not only did the two cases differ in etiologies, but in the length of fluid accumulation and timeframe of presentation as one presented as a rapidly accumulating pericardial effusion with acute cardiac tamponade and the other as subacute. Despite these differences, both cases were managed similarly with the creation of a pericardial window and drainage of the pericardial fluid to restore normal hemodynamics.

Case series

Case #1: An 80 year-old Caucasian male with a past medical history of a non-ischemic cardiomyopathy with a left ventricular ejection fraction of 35% and New York Heart Association Class III, left bundle branch block, hypertension, hyperlipidemia, abdominal aortic aneurysm, and previous cerebrovascular accident presented for routine cardiac resynchronization therapy defibrillator (CRT-D) placement. The left pectoral area was sterilely prepped and the left subclavian vein accessed. A defibrillator lead was fixated with a screw-in technique in the apical septal location of the right ventricle (RV); the lead was repositioned twice due to inappropriate parameters.  An atrial-pacing electrode was then advanced and fixed with a similar screw-in technique in the high right atrium. Next, a coronary sinus guiding catheter was advanced into the coronary sinus and into a posterolateral branch. A left ventricle (LV) pacing lead was then advanced to the posterolateral branch; both the guidewire and the lead terminated prematurely in the lateral wall, suggesting a suboptimal position for optimal CRT.  The guide catheter was then advanced into a second lateral wall vessel, and then the pacing lead was successfully placed in the mid lateral wall of the LV. All three leads tested adequately and optimized without extracardiac stimulation noted. The leads were connected to a CRT-D generator, and then the pocket was closed. Thirty minutes postoperatively, the patient’s blood pressure dropped to 92/60mmHg with a heart rate of 88bpm. The patient was in no visible distress, but mild jugular venous distention and muffled heart sounds were noted on physical exam. Stat transthoracic echocardiogram (TTE) demonstrated a moderate pericardial effusion conferential to the heart, with RV diastolic collapse and respirophasic changes of less than 50% variation in the inferior vena cava, suggesting mild cardiac tamponade (Figure1).

JCCP_19_Kara Stout_F1

Figure 1. Acute cardiac tamponade with a moderate pericardial effusion anterior and posterior to the heart, with partial right atrial and right ventricular collapse.

Cardiothoracic surgery took the patient directly to the operating room, and an emergent cardiac window for suspected RV perforation was completed. Although no clear perforation was seen interoperatively; 175mL of blood was evacuated with improvement in systolic blood pressure to over 150mmHg. A chest tube was placed and set to suction with an additional 500ml of blood removed over 48 hours. The patient recovered and was discharged with close cardiology follow up.

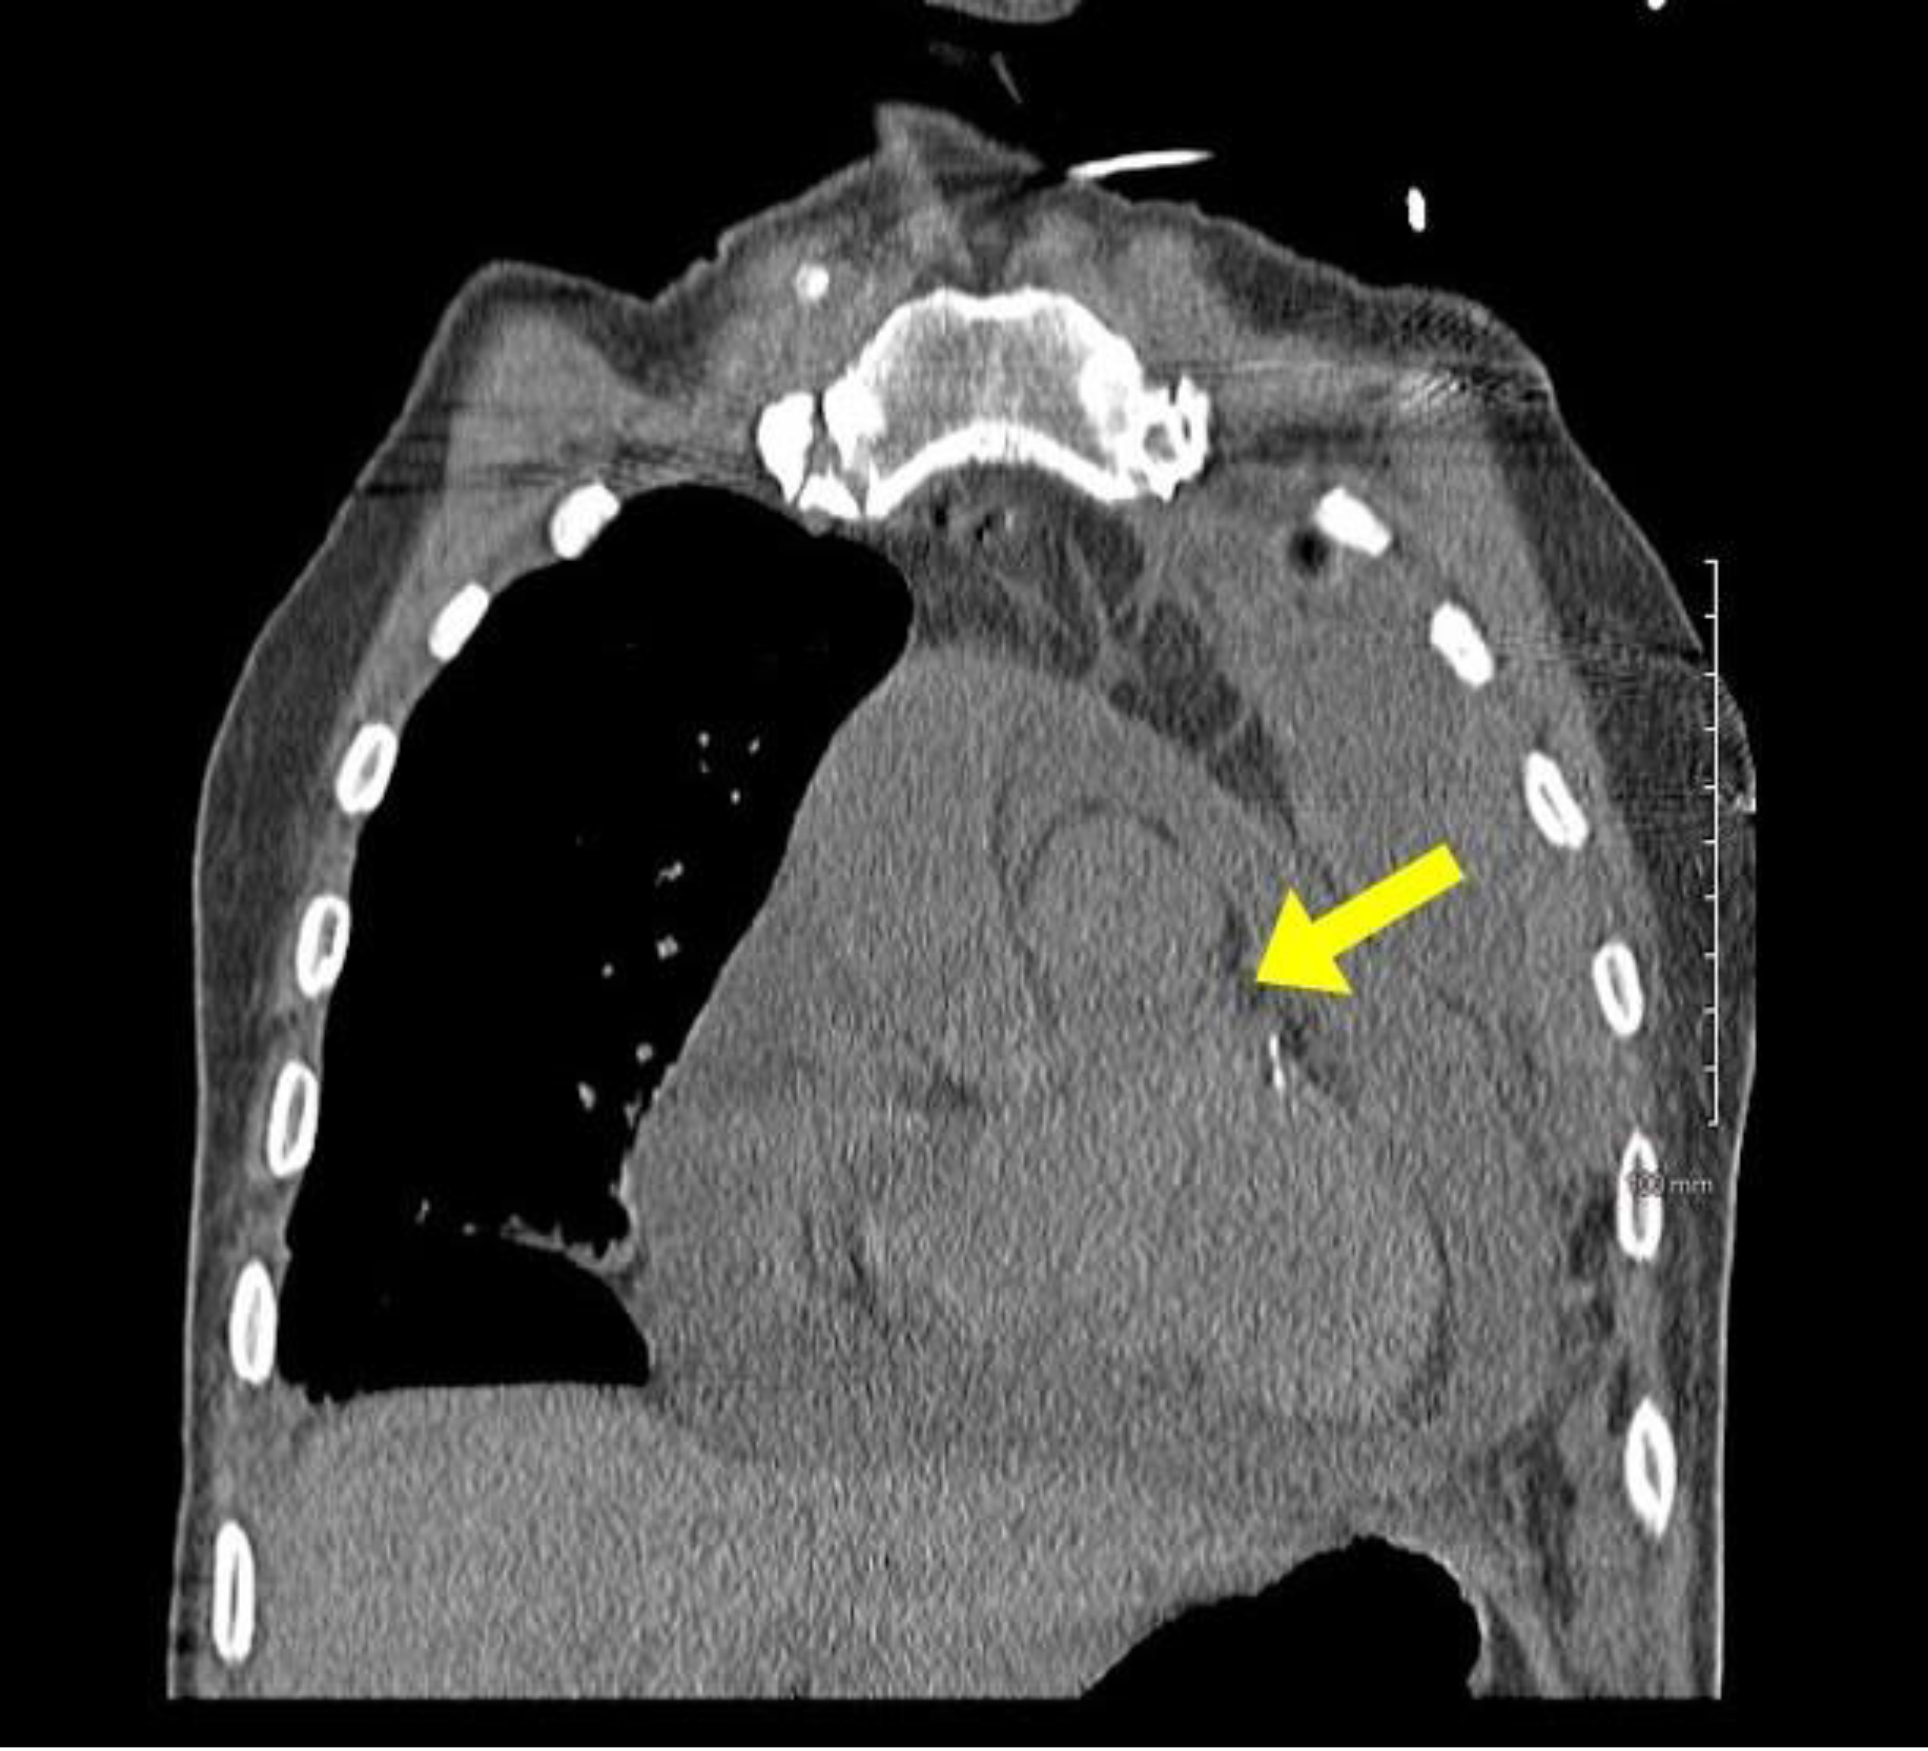
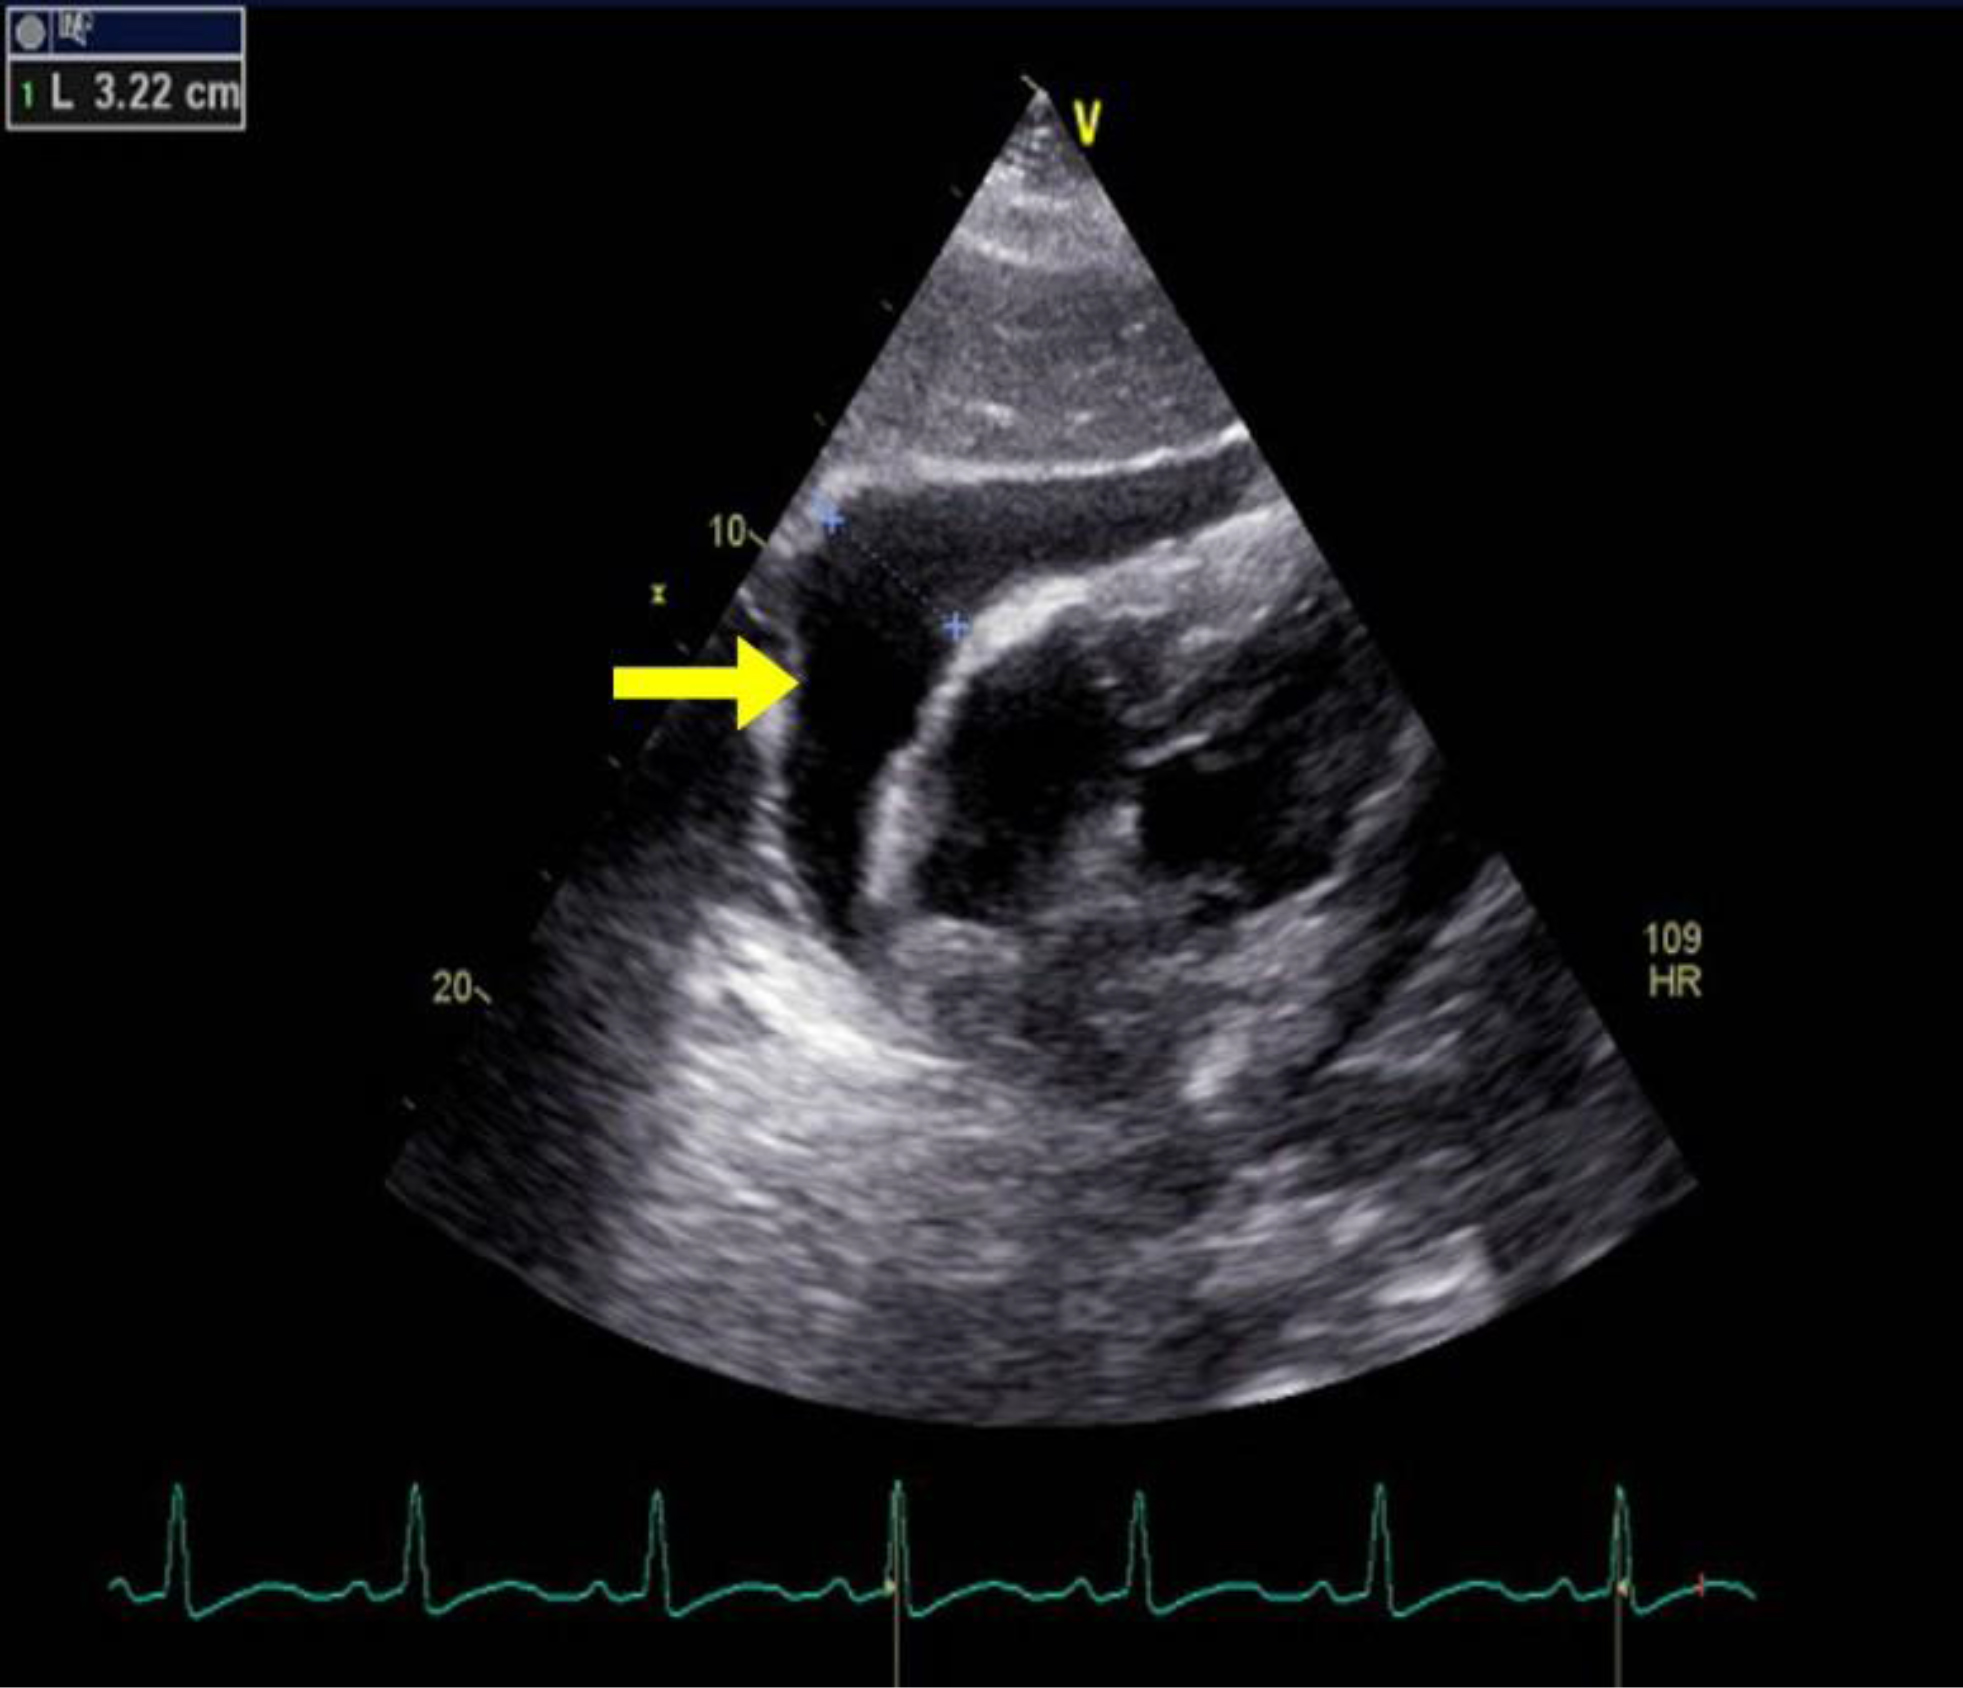
Case #2: A 66 year-old African American male with a past medical history of small cell lung cancer, COPD, tobacco use, and occupational exposure to asphalt presented with a one-day history of a new, tender right clavicular mass and worsening pleuritic chest pain and dyspnea with exertion. The patient was initially diagnosed with a small cell lung cancer in July 2018. He was initially treated with palliative chemotherapy including Etoposide and Cisplatin, and he achieved remission in October 2018. Unfortunately, he subsequently developed a recurrence in the left upper lobe in January 2019. The patient received palliative radiation until he was unable to tolerate treatments. Further mediastinal and osseous metastases were found after the chemotherapy and radiation were discontinued. Nine days prior to this presentation to the hospital, the patient underwent a therapeutic left thoracentesis due to a symptomatic, malignant pleural effusion. On primary assessment in the emergency room, the patient was found to be tachycardiac with a pulse of 121bpm and oxygen saturation of 94% breathing ambient air. The physical examination revealed a large, 7x6cm right clavicular mass extending into the neck. A cardiopulmonary exam revealed sinus tachycardia, jugular venous distention, and decreased breath sounds on the left. An EKG showed sinus tachycardia, a low voltage QRS, and no significant ischemic changes. A chest x-ray and then stat non-contrast CT neck/thorax revealed a new, large pericardial effusion and left greater than right bilateral pleural effusions (Figures 2, 3). Cardiology was consulted and a stat TTE demonstrated a large pericardial effusion, anterior and posterior to the heart, with features consistent with tamponade physiology (Figure 4).

JCCP_19_Kara Stout_F2

Figure 2. Chest x-ray revealing a flask-shaped cardiac silhouette as evidenced in pericardial effusions, as well as a large, left-sided pleural effusion.

JCCP_19_Kara Stout_F3

Figure 3. Stat CT chest with a coronal view demonstrating a large pericardial effusion.

JCCP_19_Kara Stout_F4

Figure 4. TTE with parasternal long axis view demonstrating large pericardial effusion measuring 3.22cm.

Cardiothoracic surgery was then consulted and a therapeutic pericardial window was performed with 700cc of bloody fluid drained. In addition, a portion of the pericardium was resected and sent to pathology. Cytology revealed a malignant pericardial effusion consistent with small cell carcinoma. In addition, the patient underwent left thoracentesis and placement of a chest tube intra-operatively. He tolerated the procedures well and was transferred out of the ICU to the medical-surgical floor the day following surgery. Two days later, he underwent a right thoracentesis for a symptomatic, right-sided pleural effusion. On post-operative day 5, the patient acutely decompensated and was transferred to the ICU. Vital signs upon transfer showed a blood pressure of 67/51mmHg, heart rate of 118bpm, respiratory rate of 45, and pulse oximetry of 60%. An arterial blood gas was obtained that showed pH of 7.153, pCO2 of 54.7, pO2 of 29, and bicarbonate of 19.2. A stat EKG and TTE were obtained, with the EKG revealing atrial fibrillation with rapid ventricular rate, premature ventricular or aberrantly conducted complexes, and a low voltage QRS. Bedside TTE revealed a recurrent, circumferential, small pericardial effusion without signs of tamponade or RV strain. In addition, no recurrence of left pleural effusion was identified. Due to the patient’s condition, the patient’s family made the decision to proceed with comfort measures only and further hospice care. Unfortunately, the patient passed away on post-operative day 7 due to complications related to the underlying small cell carcinoma and the associated malignant pleural and pericardial effusions.

Discussion

The presentation of cardiac tamponade depends on the timing over which the pericardial effusion accumulates. Acute cardiac tamponade occurs within minutes, and this physiology is seen in our first case. It resembles cardiogenic shock, and an emergent reduction in intrapericardial pressure (IPP) is required for treatment [1]. The second type, subacute cardiac tamponade, occurs over days to weeks. This is seen in our second case. Patients initially may be asymptomatic until the IPP reaches a critical limit, at which time symptoms such as chest pain or dyspnea ensue [1]. The pericardium is a fibroelastic sac that encases the heart and proximal great vessels [2]. It is composed visceral and fibrous parietal layers, typically containing 50ml or less of serous fluid which serves as a lubricant to reduce the friction on the epicardium [2,3]. Any processes causing this volume to exceed the typical amount, thus raising the IPP, is known as a pericardial effusion [2]. Pericardial effusions are classified based upon onset, size, location, hemodynamic changes, and composition [3]. Pericardial effusions can be loculated or circumferential and can be composed of transudative fluid, exudative fluid, pus, air, or blood [3]. Inflammatory causes can include viral, bacterial, fungal, or protozoal infections. A pericardial effusion can also be related to autoimmune disease, drug hypersensitivity, or post cardiac procedure syndromes as seen in our first case [2]. Non-inflammatory causes include hypothyroidism, trauma, or a reduction in lymphatic drainage from heart failure, cirrhosis, nephrotic syndrome, or malignancy [2] as seen in the second case.

Under normal physiologic conditions the pericardial pressures are low, and systolic and diastolic changes cause little interventricular interaction. Inspiration causes a decreased pulmonary vascular resistance, leading to an increase in venous return to the right ventricle and a small drop in the pulmonary capillary wedge and left ventricular end diastolic pressures. This leads to a decrease in systolic blood pressure of approximately 5mmHg [2]. An increase in the fluid collection in the pericardial space causes right and left ventricular pressures to increase and equalize. In addition, with the normal increasing pressure in the right ventricle with inspiration, the rigid pericardium prevents the free wall from expanding, leading to bulging of the interventricular septum into the left ventricle [2]. During inspiration in a patient with cardiac tamponade, the drop in pulmonary venous pressure leads to a drop in left atrial and pulmonary capillary wedge pressures. The left ventricular diastolic pressure remains elevated due to a leftward bowing of the interventricular septum and reduced left ventricular compliance. This exacerbates a decline in left ventricular filling pressures, and ultimately leads to a decrease in stroke volume [2].

Beck’s triad of hypotension, elevated jugular venous pressure, and muffled heart sounds are significant for severe cardiac tamponade, and components of this triad are seen on both our cases [4,5]. Patients often appear uncomfortable, with additional signs of cardiogenic shock including tachypnea, cool extremities, diaphoresis, and altered mental status [5]. Hypotension is typically present in acute tamponade, but some patients who initially present with subacute tamponade may be hypertensive on admission [5]. Tachycardia is frequent unless the patient is on a medication which may dampen this response [5]. Pulsus paradoxus is another hallmark of pericardial tamponade, defined by an inspiratory decrease in systolic blood pressure greater than 10mmHg due to a combination of a reduction in intrathoracic pressure, left ventricular stroke volume and pulse pressures [2,6,7]. A differential for these symptoms includes decompensated heart failure, pulmonary embolism, pulmonary hypertension, and a right ventricular myocardial infarction [5].

EKG abnormalities in cardiac tamponade include electrical alternans and reduced voltage, which we saw in the second case. Electrical alternans is more specific, but less sensitive, and is caused by the anterioposterior swinging of the heart during systole and diastole [5]. With larger pericardial effusions, a chest x-ray may show an enlarged cardiac silhouette with a flask-like appearance [5]. The standard non-invasive method for detecting a pericardial effusion is M-mode and two- dimensional Doppler TTE. Small pericardial effusions are typical seen over the posterobasal left ventricle, which with increasing size become circumferential [5]. These are graded in diastole as small (<10mm), moderate (10–20mm), and large (>20mm) [5,8]. Tamponade is distinguished first by early diastolic right ventricular and late diastolic or early systolic right atrial collapse when the IPP transiently exceeds the intracavitary pressures [5,8–10]. Exaggerated interventricular size variability can be appreciated throughout the cardiac cycle, with an interventricular septal bounce towards the left ventricle [8]. IVC plethora can be seen with dilation of the IVC greater than 20mm, and collapse with inspiration less than 50%, which has a 92% sensitivity for cardiac tamponade [8]. Changes in Doppler velocities across the mitral, tricuspid, right/left ventricular outflow tracks, and hepatic/pulmonary veins may add additional clues to this diagnosis [8]. A TTE provides better quality images, but is typically impractical to coordinate due to the need for urgent intervention. A CT or MRI may provide more details on loculated effusions and coexistent pleural effusions [5].

Definitive treatment of cardiac tamponade is through the reduction of IPP by removing pericardial fluid. In early cardiac tamponade where there is no hemodynamic compromise, conservative treatment with close hemodynamic monitoring and serial TTEs may be considered [11]. Acute cardiac tamponade is a medical emergency when hemodynamic compromise is present. Per the European Heart Journal 2015 guidelines [1,11], a pericardiocentesis is the treatment of choice, and the catheter is left in the pericardial space until the fluid return is less than 25ml per day [1,11]. A pericardial window is a surgical alternative requiring anesthesia, and it is used for loculated, malignant, or recurrent pericardial effusions [2,9]. An example of this procedure was seen during both of our cases. A pericardial window is also preferred if a biopsy is desired [2,9]. Intravenous hydration and rarely inotropic support or mechanical ventilation may be required depending on the clinical situation. Surgical drainage is preferred if a pericardial biopsy is needed for recurrent or loculated pleural effusions, or if a coagulopathy is present [1,11]. Pleural fluid studies can help identify the cause of the effusion. Post-operative monitoring includes telemetry for 24–48 hours, and a follow up TTE in 1–2 weeks and then in 6- 12 months [1].

Conclusion

Pericardial effusions can accumulate quickly resulting in acute cardiac tamponade, as seen in our first case, or in a subacute fashion with an insidious onset as evidenced by our second case. Beck’s triad of hypotension, elevated jugular venous pressure, and muffled heart sounds is the classic finding of acute tamponade; however, these clinical findings may not always be present. The diagnosis is typically made by physical findings and echocardiographic evidence. It is important to establish the size and hemodynamic effect of a pericardial effusion. The first line treatment for cardiac tamponade is pericardial drainage, either by pericardiocentesis or pericardial window.

Consent

Both patients provided informed consent.

Disclaimer

This research was supported (in whole or in part) by HCA and/or an HCA affiliated entity. The views expressed in this publication represent those of the author(s) do not necessarily represent the official views of HCA or any of its affiliated entities.

Acknowledgements

We would like to thank Dr. Hartmuth Bittner for his surgical expertise.

References

  1. Leimgruber P, Klopfenstein H, Wann L, Brooks H (1983) The Hemodynamic Derangement Associated with Right Ventricular Diastolic Collapse in Cardiac Tamponade: An Experimental Echocardiography Study. Circulation 68: 612–620.
  2. Vakamudi S, Ho N, Cremer P (2017) Pericardial Effusions: Causes, Diagnosis, and Management. Progress in Cardiovascular Diseases 59: 380–388.
  3. Reddy P, Curtiss E, Uretsky B (1990) Spectrum of Hemodynamic Changes in Tamponade. The American Journal of Cardiology 66: 1487–1491.
  4. Beck C (1935) Two Cardiac Compression Triads. Journal of the American Medial Association 104(714).
  5. Reddy P, Curtiss E, O-Toole J, Shaver J (1978) Cardiac Tamponade: Hemodynamic Observations in Man. Circulation 58: 265.
  6. Hoit B (2017) Pericardial Effusion and Cardiac Tamponade in the New Millennium. Current Cardiology Reports 19(57).
  7. Perez-Caseres A, Cesar S, Brunet-Garcia L, Sanchez-de-Toledo (2017) Echocardiogenic Evaluation of Pericardial Effusion and Cardiac Tamponade. Frontiers in Pediatrics 5(79).
  8. Adler Y, Charron P, Imazio M, Badano L, Baron-Esquivias G, (2015) 2015 ESC Guidelines for the diagnosis and management of pericardial diseases: The Task Force for the Diagnosis and Management of Pericardial Diseases of the European Society of Cardiology (ESC). European Heart Journal 36: 2921–2964.
  9. Gilliam L, Guyer D, Gibson T, King M, Marshall J et al (1983) Hydrodynamic Compression of the Right Atrium: A New Echocardiographic Sign of Cardiac Tamponade. Circulation 68: 294–301.
  10. Hoit B (2019) Cardiac Tamponade. In B. C. Downey (Ed.), UpToDate. Retrieved August, 8, 2019, from https://www.uptodate.com/contents/cardiac-tamponade#H3809498843.
  11. Zipes D, Libby P, Bonow R, Mann D, Braunwald E (2019) Braunwald’s heart disease: A textbook of cardiovascular medicine (Eleventh edition). Philadelphia, PA: Elsevier.

Treatment of Orofacial Pain using Fascial Manipulation: a Case Report

Abstract

Temporomandibular Disorders (TMD) are the most prevalent cause of facial pain without a clear etiopathogenesis and gold standard treatment. There is not an agreement on treatments which involve surgical or conservative interventions. Between the different types of conservative treatments the Fascial Manipulation® could be a promising therapy. Here we describe the case of a patient with orofacial pain that was treated successful with three single sessions of Fascial Manipulation®.

Keywords

TMJ, Fascial Manipulation®, Orofacial pain.

Introduction

Orofacial pain is a heterogeneous group of musculoskeletal and neuromuscular conditions involving the temporomandibular joint complex, surrounding musculature and osseous components [1]. Between these, Temporomandibular Disorders (TMD) are the most prevalent cause of orofacial pain. TMD are highly prevalent and debilitating conditions involving the head and face, with pain affecting the jaw, ears, eyes and frequently causing headache and neck pain [2]. The etiology of chronic TMD is multifactorial and include structural, functional, environmental, social and psychological factors [3]. The prevalence of orofacial pain is between 3% and 12% and is, at least, twice as prevalent in women as men [4]. Musculoskeletal structures disorders include myalgia, usually presents as a dull aching pain due to continued muscle tension, Myofascial Pain (MFP) also presents as a dull, continuous aching pain that varies in intensity. MFP produces pain upon palpation that is local and may refer to other sites, as mapped out by Simons [5]. MFP tends to be seen in muscle pain conditions of a more chronic nature, in which the tension is unremitting. Trigger points can often be seen in MFP and may be localized to a taut band of muscle.

In the literature, treatments for TMD include patient education, home care programs, physical therapy, musculoskeletal manual approach, pharmacotherapy, Non Steroidal Anti-Inflammatory drugs (NSAIDs), local anesthetics, intracapsular injection of corticosteroids, muscle relaxants, antidepressants, occlusal appliance therapy, occlusal adjustment. Surgical care is only indicated when non-surgical therapy has been ineffective [6]. However, the multifactorial pathophysiology of TMJ related pain is far from being completely understood and effective management of pain has not been established yet [7]. Unfortunately, despite the evidence of two systematic reviews that support manual therapy to produce favorable outcomes in TMD [8, 9] the real effectiveness of different types of manual therapy in TMD remains unclear. A manual therapy named Fascial Manipulation® is shown in a preliminary study to be effective in improving tmj disorder when compared to botulin toxin [10]. Here we present to case of a patient with chronic tmd disorder treated successfully treated with Fascial Manipulation.

Case report

A 65 years old woman, mixed race, Brazilian was assessed and treated at the TMD clinic of the Faculty of Dentistry, State University of Rio de Janeiro (UERJ). She complained of orofacial pain and difficulties chewing and eating for the last 25 months, with concomitant neck pain and an history of headache lasting more than 5 years. She referred a history of whiplash following a car accident that occurred 7 years ago.

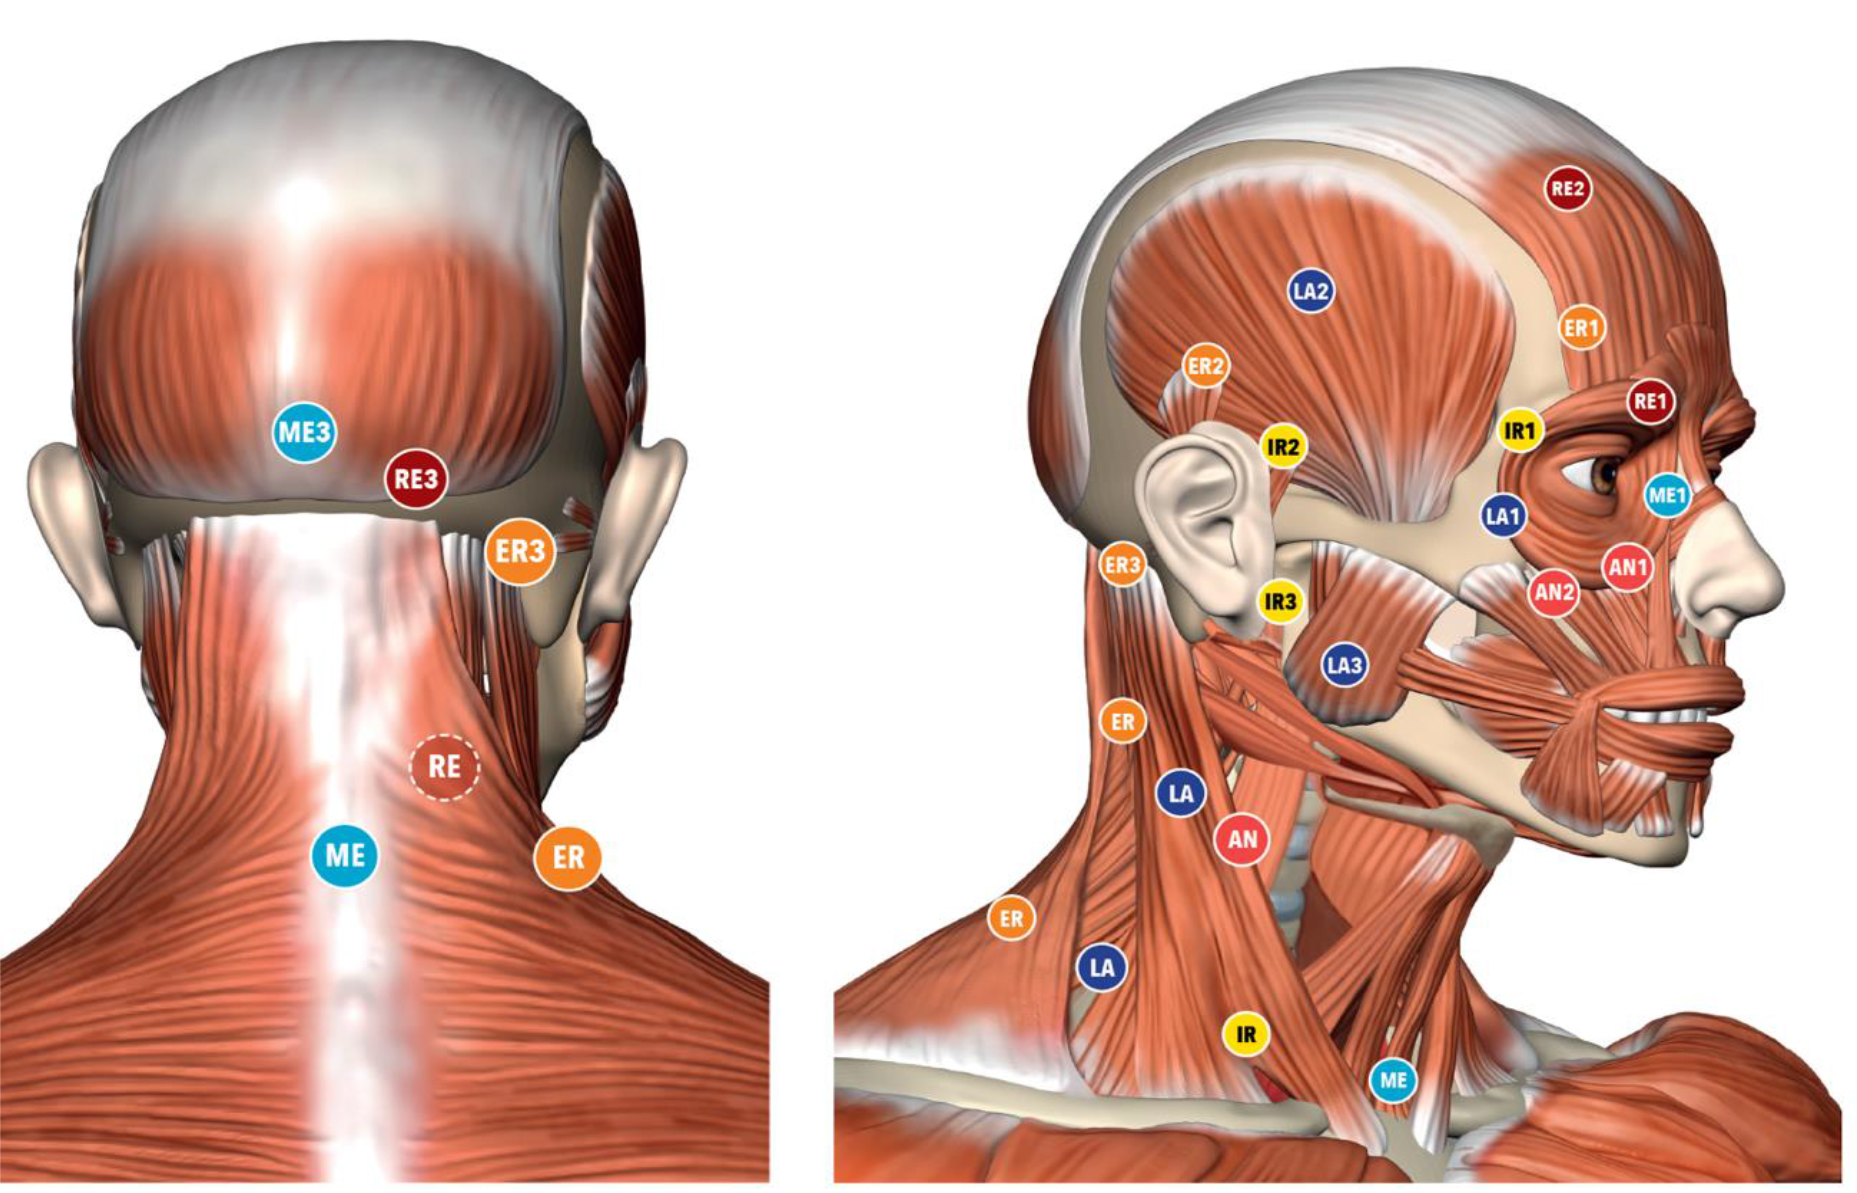
The patient has undergone many months of physical therapy without significative improvement and she has been using an Oral Appliances (OAs) (also known as flat plane stabilization appliance, Michigan splint, muscle relaxation appliance or gnathologic splint) for the last 6 months. Pain was described as constant, burning sensation severe enough to affect sleeping. Perceived pain was assessed with the Visual Analogue Scale (Vas) and scored as 9 on a 0–10 scale (Table 1) The RDC/TMD was utilized as the gold-standard instrument and performed by a sole examiner, trained and calibrated according to specifications established by the International RDC/TMD Consortium. At the initial examination it was recorded the occurrence of TMJ clicking, crepitus, or jaw opening interferences with or without pain. The clinician viewed the patient’s opening and closing patterns to note any mandibular deviations. The evaluation of mandibular ROM consisted of measuring comfort opening, unassisted opening, assisted opening, with a millimeter ruler while noting the severity and location of pain with jaw movement (Table 2) The EMG evaluation of the temporalis and masseter muscles during maximum voluntary contraction (tooth clenching) were carried out using the New miotool (MiotecEquipamentosbiomédicosltda, Petrópolis, Porto Alegre, RS, Brasil) with 14-bit resolution and a sampling frequency of 2000 Hz, IRMC > 126 dB and signal noise rate < 2 LSB, Security insulation 3000 V(rms) (table 3). All procedures were performed three times, with a thirty seconds interval between isometric contractions to avoid muscle fatigue. After electromyography signal acquisition, all the data were processed in Miotec Suite (MiotecEquipamentosbiomédicosltda, Petrópolis, Porto Alegre, RS, Brasil) to analyse the root square mean (RMS) in µV. All the evalution were carried out before the Treatment (T0), after the treatment (T1) and at 3 months follow up (T2). On physical examination the range of motion of the neck (ROM) was limited in the sagittal plane (neck flexion) and on the frontal plane (lateral flexion). The palpatory verification of the CC and CF was carried out according to the Stecco’s method (reference) on the following segments: thorax (TH), Scapula (SC), Neck (CL), Head (CP2, CP3) to identify the densified points (Figure 1). The points are selected after a specific assessment process, guided by a specific chart (FM chart) [11] involving medical record, clinical examination of specific movements and palpatory verifications. Palpation evaluates patient pain rate, radiation and most important, the presence of tissue stiffness, call “densification” [12]. During the clinical history, the segments in dysfunction are identified with an emphasis on the chronology to permit the development of an hypothesis based on the current symptomatology of patients and previous musculoskeletal events, which may be causing compensations. In Fascial manipulation the therapist use the elbow and knuckles generating a deep friction for 3–5 minutes over each point.

IJOT 19 SI - 105_Pintucci M_F1

Figure 1. Location of the Center of Coordination points

The treatment are applied over specific points, call Center of Coordination (CCs) and Center of Fusion (CFs), that are anatomically safe because do not overlie major superficial nerves and veins. Additional guidance for point selection includes avoiding the patients’ excessively painful areas where inflammation, lesions or even fractures could be present. The patient underwent three weekly session of Fascial Manipulation® of 1 hour. The VAS scale, between initial condition (T0) and after the treatment (T1) was maintained at 3 month follow up (T2) (Table 1). The patients passed from the symptomatic condition (VAS 9) to asymptomatic (VAS 1) after the treatment. The comfortable without pain opening of the mounts improved (Table 2). Un-assistant and assistant opening improved after treatment, at T1 and T2 follow up. In the table 3 are presented the value of the isometric contraction which improved for the masseter and temporalis muscles bilaterally.

Table 1. VAS T0 = VAS before treatment; T1 = VAS after treatment; T2 = VRS after 3 months

VAS

T0

136.56

T1

264.60

Discussion

In the light of our case report, Fascial Manipulation® can improve pain, function and myoelectrical activity in patient with orofacial pain. FM was able to diminish the articular loading on the TMJ which translate in a better mandibular kinematics with less muscle pain. Even if FM share some similarity with other techniques, it presents a different rationality and clinical approach. While the deep friction can be compared to other techniques, the reasoning behind the choice of points treated presents major differences. The points are selected after a specific assessment process involving clinical history taking, a clinical examination of specific movements as well as palpatory verifications [12, 11]. Apart from the use of clinical procedures (palpation, auscultation, measuring of active and passive mandibular mobility), FM requires additional orthopedic tests that implies a modern, biomedical approach, thanks to the knowledge of the human fascial system, but, at the same time, uses an individual approach to the patient as recommended by many Authors [13–15].

Table 2. Assisted: maximum opening with help, unassisted: maximum opening without help. T0 = before treatment; T1 = after treatment; T2 = 3 months;

Comfortable
Without opening

Unassisted opening

Assisted opening

T0

32,51

45,30

49,23

T1

42,33

51,14

54,08

T2

40.1

48,18

50,75

Table 3. EMG evaluations of the masticatory muscles in isometric contraction T0= before treatment; T1= after treatment; T2= 3 months

Right
Masseter

Left Masseter

Right Temporal

Left
Temporal

T0

136.56

176.27

154.45

127.50

T1

264.60

260.75

221.47

159.61

T2

411.61

427.30

279.65

215.82

Conclusion

FM could be used as an effective method for facial pain being a rapid, safe and cost effective approach to reduce pain and gain function and mouth opening that can be used before occlusion stabilization appliance. We suggest further studies that compare the combined treatment of FM with temporomandibular disorder treatment in patient with TMD in a Randomized Controlled Trial (RCT).

References

  1. McNeill C (1993) Temporomandibular Disorders: Guidelines for Classification, Assesment, and Management (2nded.). Chicago, IL: QuintessencePublishingCo, Inc.
  2. Germain L, Malcmacher L (2017) Frontline Temporomandibular Joint/Orofacial Pain Therapy for Every Dental Practice. Compend Contin Educ Dent 38: 299–305. [crossref]
  3. Fillingim RB, Ohrbach R, Greenspan JD, Knott C, Diatchenko L et al. (2013) Psychological factors associated with development of TMD: the OPPERA prospective cohort study. J Pain 14: T75–T90. [crosssref]
  4. Okeson JP (2005) Bell’s Orofacial Pains. The Clinical Management of Orofacial Pain (6th ed.). Carol Stream, IL: Quintessence Publishing Co, Inc.
  5. Simons DG, Travell JG (1999) Myofascial Pain and Dysfunction: The Trigger Point Manual. Vol 1. Baltimore: Williams & Wilkins.
  6. Romero-Reyes M, Uyanik JM (2014) Orofacial pain management: current perspectives. J Pain Res 7: 99–115. [crossref]
  7. Lin CS (2014) Brain signature of chronic orofacial pain: a systematic review and metaanalysis on neuroimaging research of trigeminal neuropathic pain and temporomandibular joint disorders. PloS One 9: e94300. [crossref]
  8. McNeely ML, Armijo Olivo S, Magee DJ (2006) A systematic review of the effectiveness of physical therapy interventions for temporomandibular disorders. Phys Ther 86: 710–725. [crossref]
  9. Medlicott MS, Harris SR (2006) A systematic review of the effectiveness of exercise, manual therapy, electrotherapy, relaxation training, and biofeedback in the management of temporomandibular disorder. Phys Ther 86: 955–973. [crossref]
  10. Guarda-Nardini L, stecco A, Stecco C, Masiero S, Manfredini D (2012) Myofascial Pain of Jaw Muscles: Comparison of Short-Term Effectiveness of Botulinum Toxin Injections and Fascial manipulation technique. The Journal of Craniomandibular Practice 30: 95–102. [crossref]
  11. Pintucci M, Simis M, Imamura M, Pratelli E, Stecco A et al. (2017) Successful treatment of rotator cuff tear using Fascial Manipulation® in a stroke patient. Journal of Bodywork & Movement Therapies 21 653–657. [crossref]
  12. Day JA, Copetti L, Rucli G (2012) From clinical experience to a model for the human fascial system. J Bodyw Mov Ther 16: 372–80.
  13. Kordaß B, Fasold A (2012) ManuelleStrukturanalyse. Teil 1: Grundlagen und klinischeUntersuchung. ZWR 212: 8–11.
  14. Badel T, Krapac L, Kraljević A (2012) The role of physical therapy in patients with temporomandibular joint disorder. FizRehabil Med 24: 21–33.
  15. Hoffmann RG, Kotchen JM, Kotchen TA, Cowley T, Dasgupta M et al. (2011) Temporomandibular disorders and associated clinical comorbidities. Clin J Pain 27: 268–274.
  16. Schulze W. Therapeutic communication with CMD patients – Part 2. J Craniomandib Funct 2010; 2: 149–60.

Management of Diabetes Patients across the Peri- Operative Pathway: A Systematic Review

DOI: 10.31038/EDMJ.2020411

Abstract

Peri-operative environments are a hazardous setting for diabetes patients. A systematic review of literature regarding the management of diabetes patients across the peri-operative pathway has been undertaken to assess if the management of patients within this pathway is suitable and effective for patients.

Methods

A database search of Google Scholar, CINAHAL, Embase, OVID, Cochrane Library, Joanna Briggs institute and PUBMED was undertaken from 15th of March 2019 to 30th of March 2019. A total of 57 papers were found and reduced down to 11 final papers that answered the review question and met the inclusion and exclusion criteria. Inclusion criteria were: Full text, English language, human subjects, adult patients only and studies that focused on diabetes care in a section of the peri-operative pathway. Exclusion criteria: children or adults and children, studies that looked a one particular intervention or type of surgery. No date limit was set. PICO tool was used to frame the study question.

Results

Three main themes emerged from the literature. 1. Poor patient outcomes; 2. Longer length of stay (LOS); 3. Lack of adherence to guidance and or protocols and glycaemic control. Elective patients had advantageous outcomes compared to emergency surgical patients. Hyperglycaemia still remained a problem with an increase in other medical complications for diabetes patients. LOS in hospital was found to have increased due to medical complications. Adherence to protocols and guidance was found to be beneficial in monitoring and managing hyperglycaemia. However, this review found that best practice guidance and hospital protocol is not always adhered to. A liberal approach to glycaemic control is beneficial.

Conclusion

This systematic review investigated the management of diabetes patients across the peri-operative pathway. Three main themes emerged from the literature: poor patient outcomes; length of stay; and lack of adherence to guidance and or protocols and glycaemic control. We concluded the peri-operative environment is a hazardous setting for a diabetes patients. Elective patients had slightly more advantageous outcomes than emergency patients. Hyperglycaemia still remains a problem which leads to poor patient outcomes and longer LOS. Adherence to protocols and guidance was found to be beneficial in monitoring and managing hyperglycaemia.

Introduction

The Department of Health and Social Care (DOH) (2001) state that diabetes patients undergoing surgery carry a greater clinical risk than non-diabetes patients. This is due a number of complex factors such as reduced food intake due to a starvation period, and cessation of normal diabetes medications [1]. In addition, the body’s stress response and inhibition of insulin secretion increases the potential for hyperglycaemia [2]. The Association of Anaesthetists of Great Britain and Ireland [3] state that diabetes affects 10–15% of the surgical population, with these patients carrying a greater risk of complication rates, mortality rates and Length of stay (LOS).

Despite these findings, there is very little guidance and research surrounding diabetes management across the peri-operative pathway. There are currently no standardised worldwide guidelines for use by theatre or PACU practitioners [4] and globally, diabetes management during the peri-operative period is widely debated [5]. The aim of this systematic review was to investigate the management of diabetes patients across the peri-operative pathway.

Methodology

A systematic and comprehensive search of databases was carried out between the 15th of March 2019 and the 30th of July 2019. The search involved Google Scholar, CINAHAL, Embase, OVID, Cochrane Library, Joanna Briggs institute and PUBMED. Combinations of key words were inputted into each database. Further restrictions were then applied to reduce the number of papers, such as; English language, full text and used adult human patients as the participants. Studies which examined the care and management of diabetes patients across the peri-operative pathway were included. Studies into specific interventions or surgeries were excluded due to the broadness of the review question. Exclusion criteria: children participants and studies that looked a one particular intervention or type of surgery. No date limit was set.

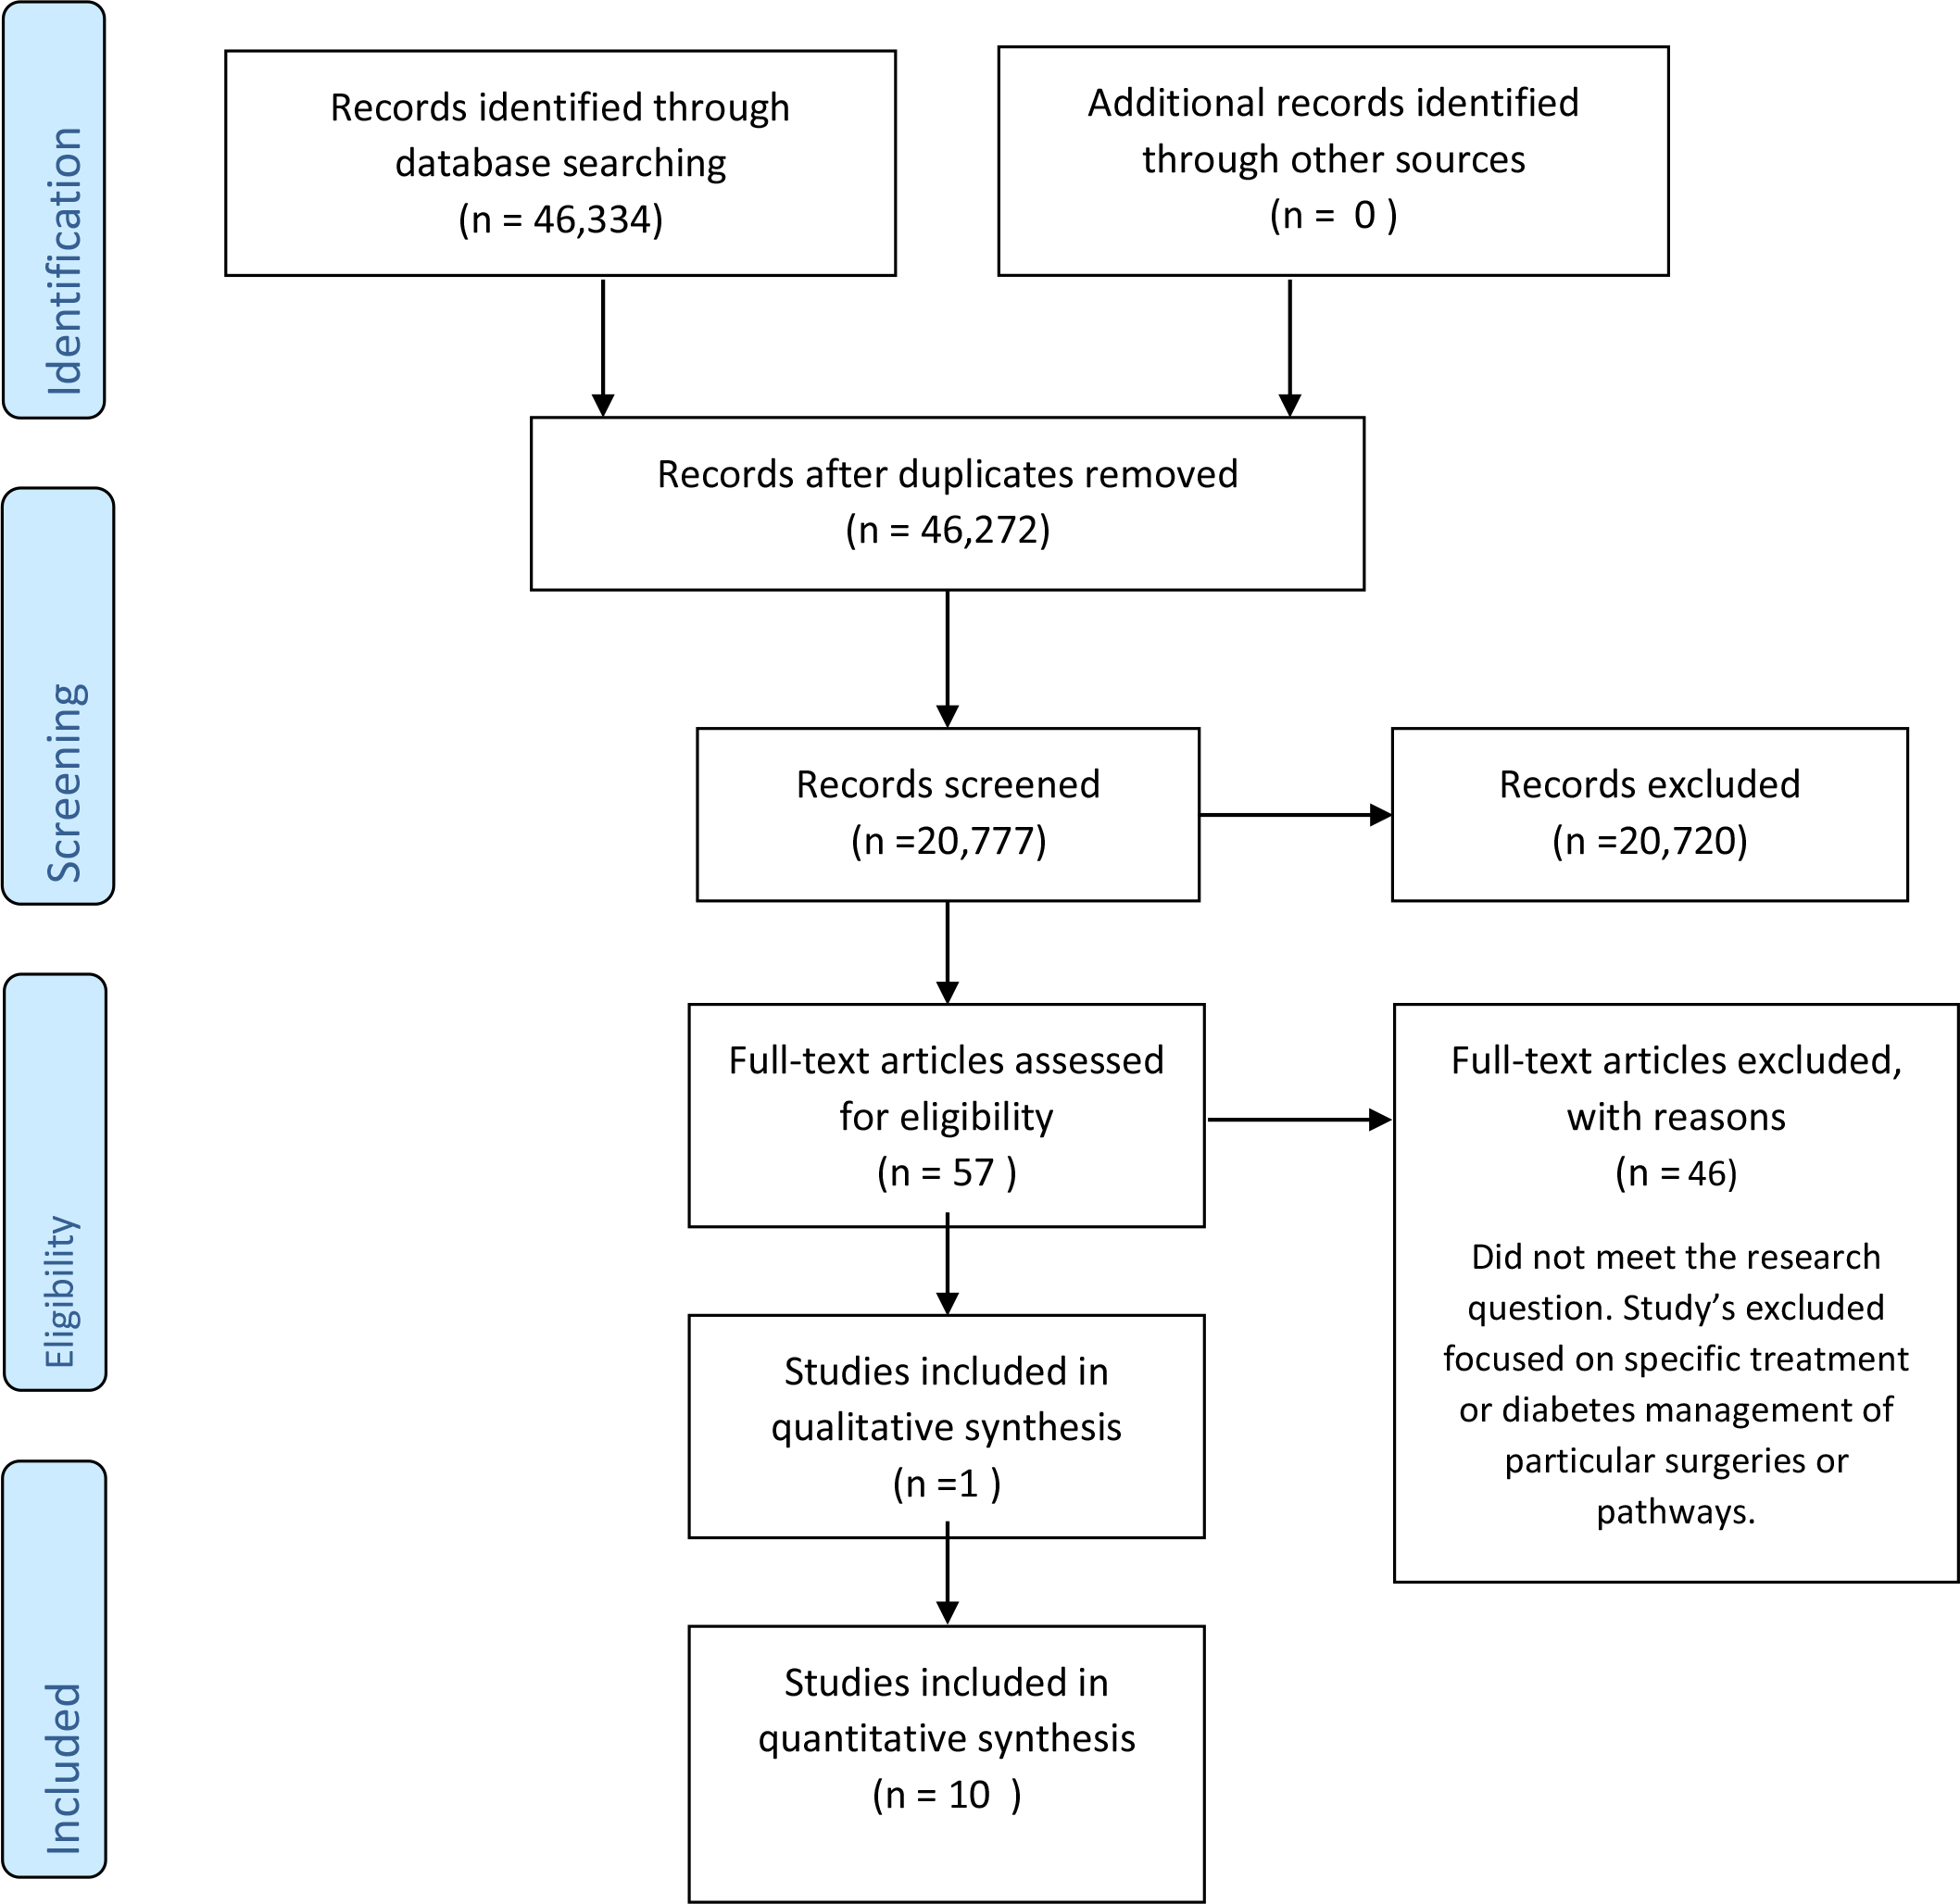
This review followed the Preferred Reporting Items for Systematic Reviews and Meta-Analyses (PRISMA) guidelines to ensure systematic transparency of report [6]. After duplications were removed, 57 papers were read to determine their relevance to the review question.

EDMJ 2020-401_Gary G. Adams_F1

Figure 1. PRISMA flow diagram of Studies included in quantitative synthesis

The Cauldwell, Henshaw and Taylor (2011)  framework was utilised for assessing the meaningfulness or generalisability of qualitative and quantitative research in contemporary nursing practice, which enabled a structured approach to the assessment of each study’s quality, validity and reliability (Clarke, 2011). The final 11 papers were RAG (red amber green) rated [7] to reflect the answer to each of the questions from the tool. Dates ranged from 1983- 2019 and included studies from various countries. 9 of the 11 studies focused on the peri-operative period. 1 study focused on intra-operative and post-operative diabetes management. 1 study looks at diabetes management in the pre-operative period. Full text was then read to extract the results from each paper for the formation of themes.

Results and discussion

A systematic review as undertaken to establish the management of diabetes patients across the peri-operative pathway. Three key themes emerged from the review: poor patient outcomes, length of stay (LOS) which were commonly reported jointly and adherence to guidance and or protocols and standards for glycaemic control.

Poor patient outcomes

8 out of 11 studies reported on the outcomes of patients with diabetes. Studies 2, 3,5,6,8,9,10 and 11 discussed surgical outcomes directly related to diabetes management. McCavert, Monem and Dooher, et al [8] found that best practice of glycaemic control, in-line with hospital protocols, saw a 25.4% reduction of peri-operative complications. Overall complications being 29% (out of 69 patients). Elective patients with T2DM were more prone to complications. 5 out of 17 (29.4%) of T2DM elective patients experienced complications; in contrast, only 4 out of 21 (19.0%) of elective patients with T1DM developed a complication such as wound infection or peritonitis. For emergency patients, the rate of complications was slightly higher for those with T1DM (5 out of 14; 35.7%) versus 6 out of 17 patients (35.3%) with T2DM. Complications such as; Wound dehiscence, septicaemia, wound infection, wound infection, confusion, deep vein thrombosis and lower respiratory tract infection were reported as a complication. Frisch, Chandra, Smiley, et al [9] similarly analysed outcomes of mobility contrasting both diabetes and non-diabetes patients. Outcomes such as pneumonia (12.1 vs 5.4%; p=0.001), wound and skin infections (5 vs 2.3%; p<0.001), systematic blood infection (3.6 vs 1.1%; p<0.001), urinary tract infections (4.5vs 1.4%, p<0.001) acute myocardial infarction (2.6 vs 1.2 %; p< 0.001) were reported. Patients who experienced complications had a strong affiliation with high blood glucose levels pre and post-operatively.

“Haemoglobin A1c, often abbreviated as A1C, is a form of haemoglobin (a blood pigment that carries oxygen) that is bound to glucose” [10]. Underwood, Askari, Hurwitz et al [11] linked to various A1C categories to patient outcomes. It showed that, like McCavert et al and Frisch et al, [8, 9] diabetes patients (specifically group A1C ≤6.5%) had a higher incidence of LOS, acute renal failure death within 30 days and wound class (dirty). Groups ≤6.5%, A1C> 8-10% and A1C > 10% was significantly longer compared with the control subjects (p<0.001,p<0.008, and p=0.002, respectively).

Wang, Chen, Li, et al (2019) found that patients over 65-years old, male, high mean post-operative blood glucose (BG), diabetes complications, abnormal kidney function and have underwent general surgery were the highest risk category for poor patient outcomes. The study compared surgery type and patient outcomes. Of the 301 (19.8%) of all patients with diabetes complications, 295, (98.0%) had major vascular complications, 8 (27. %) had diabetes nephropathy, 3 (0.7%) had diabetes retinopathy, 5 (1.7%) had diabetes foot post-operatively. Post-operative adverse events occurred in 118 (7.7%) including 43 (36.4%) delayed extubation caused by surgery-related respiratory failure or muscle weakness. 15 (12.7%) patients had circulatory disorders, 23 (19.5%) had respiratory and circulatory abnormalities. 11 (9.3%) had non-healing of the incision. 15 (12.7%) had infections at other sites. 8 (6.8%) patients with other complications. 3 (2.5%) patients died due to pulmonary embolism and two cases of septic shock. Kotgal, Symods, Hirsch, lrl, et al [12] did not correlate BG management with patient outcomes, but results showed that patients had a greater chance of poorer outcomes with any level of hyperglycaemia versus those who had better diabetes control.

In contrast, Sathya, Davis, Taveria, et al [13] found that stroke, atrial fibrillation and wound infection were the most significant complications from pooled results of 6 studies. Mixed results were noted; 2 pooled results found that the incidence of post-operative stroke was reduced by liberal glycaemic regimes, but pooled results from a further 3 studies suggested that there was no significant difference between the effect of moderate vs strict control on stroke outcomes (odds ratio, 18.5, 95% CI 0.72-4.74, p=0.020). Sathya et al [13] also examined the relationship between atrial fibrillation as a patient outcome and diabetes control. Again, pooled estimates from 2 pooled studies found that moderate versus liberal control had no direct effect on atrial fibrillation as an outcome (Odds ratio 0.54, 95% CI 0.17-1.76, p =0.31). In addition, pooled results from 3 other studies found that there was no significant difference between strict versus moderate control in relation to atrial fibrillation (odds ratio: 0.71, 95% CI0.39-1.30, p=0.27). Wound infection was also not found to have a significant link to the effects of moderate versus glycaemic control from the results of 2 pooled studies.

Length of stay

LOS was a significant finding in studies 2, 3, 6 and 8. Although not a complication in itself, LOS was linked to or reported alongside poor patient outcomes.

McCavert et al [8] found that Emergency patients had a significantly longer LOS in hospital than the elective groups. Frisch et al (2010) [9] also reports that diabetes patients had a higher rate of complications than non-diabetes counterparts (p=0.105). Patients with diabetes were found to have a greater LOS (and LOS in ICU) than non- diabetes patients. It was also noted that African American patients were not at an increased risk of mortality than other races. No other study compared likelihood of surgical outcomes and race.

Patients with diabetes were also more likely to have greater complications including LOS. Underwood et al, 2014 [11] however, reported that patients with A1C levels >6.5-8% had a similar LOS to the control group. Patients with higher A1C ≤6.5 up to greater than 10% had a significantly longer LOS compared to control subjects. This was the most significant difference of the various A1C groups compared in the study. Higher A1C level was more significant than any other variable such as a diabetes patient’s race, gender or type of surgery in relation to LOS. Longer LOS in the hospital was found by Hommel et al [14] to be associated with higher dissatisfaction of patients regarding patient centred-ness in their assessment of results.

Lack of adherence to guidance and or protocols and glycaemic control

The third key theme that emerged from the literature was adherence to guidance, such as hospital protocols and national guidelines and glycaemic control. This theme was disused in studies 1,2,5,7 and 10.

McCavert et al [8] studied both elective and emergency surgical patients. 60% of elective patients with T1DM were not treated according to hospital protocol. Elective patients who were treated according to protocol had a complication rate of 6.3 %. For emergency surgical patients, 7.3% of T1DM patients who were treated as per protocol developed a complication. 12.3% of scheduled blood glucose measurement were not completed. 11.1% of T1DM elective patients did not have their blood glucose checked, and 6.8% of emergency T1DM patients. For T2DM, blood glucose was not checked in 17.4% of elective patients and 12.7% in emergency cases.

Similarly, Coan, Schlinkert, Brandon et al [15] note that capillary BG was taken in 89% of cases in the pre-operative area, and only52% of patients had a HBA1C. Intra-operatively, 33% of patients had a BG check, and the post- operative figure was 87%. 90% of pre-operative BG was point of care (POC), and 4% was venous sampling. Intraoperatively, 10% of patients had POC BG values, 16% had POC blood gas sampling. In the PACU, 86% of BG were obtained by POC and 1% was venous. Similarly, Jackson, Patvardhan et al (2015) reported that only 71% of patients had a HBA1C recorded pre-operatively and 56% intra-operatively via CBG. 73% of patients had a CBG performed in recovery (PACU) contrary to national guidance. Hommel, Van Gurp, Tack et al’s [16] quality indicators suggest that best-practice involved measuring BG 4 hours pre-operatively, every 2 hours intra-operatively, and 1 hour post-operatively. Hommel et al [14] reported that in relation to patient satisfaction and person centeredness, 20% of 362 patients were not informed about intra-operative BG level and its effect. 15% were also not informed that insulin was administered during surgery. This correlated to overall low score from patients’ involvement in the survey. Sathya et al [13] report that patients undergoing a liberal target for glycaemic control had significantly better post-operative outcomes (less or no complications) than other groups. No difference with wound infection or atrial fibrillation were found. Bibble (1983) commented from the 3 case studies that protocols for glycaemic control were directed towards managing ‘average’ diabetes patients rather than complex ones, making guidance non-beneficial.

Future recommendations would be to undertake extensive quantitative and qualitative research across the peri-operative pathway with staff who have direct responsibility for diabetes patients undergoing surgery. The views and attitudes of staff members regarding diabetes management may shed light on the barriers as to why this is still a problem despite being highlighted by several studies seen in this review since 1983. Any further research conducted needs to be influential on practice in order to drive change.

Conclusion

This systematic review examined the management of diabetes patients across the peri-operative pathway. Three main themes emerged: poor patient outcomes; longer length of stay; and lack of adherence to guidance and or protocols and glycaemic control. We concluded the peri-operative environment can be a hazardous setting for diabetes patients. Elective patients had slightly more advantageous outcomes than emergency patients. Hyperglycaemia still remains a problem which leads to poor patient outcomes and longer LOS. Adherence to protocols and guidance was found to be beneficial in monitoring and managing hyperglycaemia.

Table 1. Characteristics of studies

EDMJ 2020-401_Gary G. Adams_F2

References

  1. McAnulty GR, Robertshaw HJ, Hall GM (2000) Anaesthetic Management of patients with diabetes mellitus. British Journal of Anaesthesia 85: 80-90.
  2. Dagogo-Jack S, Alberti KGMM (2002) Management of Diabetes Mellitus in Surgical Patients. Diabetes Spectrum 15: 44-48 [online].
  3. Association of Anaesthetists of Great Britain and Ireland. (2015) Peri-operative management of the surgical patient with diabetes 2015. Anaesthesia 70: 1427-1440.
  4. Coan KE, Apsey HA, Schlinkert RT, Stearns, JD Cook, CB (2014) Managing diabetes mellitus in the surgical patient. Diabetes management 4: 515-526.
  5. Duggan EW, Carlson K, Umpierrez GE (2017) Perioperative Hyperglycaemia management: an update. Anesthesiology 126: 547-560.
  6. Moher D, Shamseer L, Clarke M, Ghersi D, Liberati A, et al. (2015) Preferred Reporting Items for Systematic Review and Meta-Analysis Protocols (PRISMA-P) 2015 statement. Syst Rev 4: 1.
  7. Webster V, Webster M (2019) How to Use RAG Status Ratings to Track Project Performance. [online]. Available at: https://www.leadershipthoughts.com/rag-status-definition/ (Accessed 12 June 2019).
  8. McCavert M, Mone F, Dooher M, Brown R, O’Donnell ME (2010) Peri-operative blood glucose management in general surgery-a potential element for improved diabetes patient outcomes- An observational cohort study. International Journal of Surgery 8: 494-498.
  9. Frisch A, Chandra P, Smiley D, Peng L, Rizzo M, (2010) Prevalence and clinical outcome of hyperglycaemia in the peri-operative period in noncardiac surgery. Diabetes care 33: 1783-1788.
  10. Stöppler MC (2019) Shiel WC (eds.) Haemoglobin A1c Test (HbA1c) [online]. Available at: https://www.emedicinehealth.com/hemoglobin_a1c_hba1c/article_em.htm#facts_and_definition_of_hemoglobin_a1c_hba1c (Accessed 19 June 2019).
  11. Underwod P, Askari R, Hurwitz S, Chamarthi B, Garg R (2014) Preoperative A1C and clinical outcomes in patients with diabetes undergoing major noncardiac surgical procedures. Diabetes care 37: 611-616.
  12. Kotagal M, Symons RG, Hirsch IB, Umpierrez GE, Dellinger EP, et al. (2015) Perioperative hyperglycaemia and risk of adverse events among patients with and without diabetes. Annals of surgery 261: 97-103.
  13. Sathya B, Davis R, Taveria T, Whitlach H, WU WC (2013) Intensity of peri-operative glycaemic control and postoperative outcomes in patients with diabetes: a meta-analysis. Diabetes research and clinical practice 102: 8-15.
  14. Hommel I, Van Gurp PJ, Tack CJ, Lifers J, Mulder J, et al. (2014) Peri-operative diabetes care: room for improving the person centredness. Diabetes Medicine 32: 561-568.
  15. Coan KE, Schlinkert AB, Beck BR, Haakinson DJ, Castro JC, et al (2013) Perioperative management of patients with diabetes undergoing ambulatory elective surgery. Journal of diabetes science and technology 7: 983-989.
  16. Hommel I, Van Gurp PJ, Tack CJ, Wollersheim H, Hulscher MEJL (2015) Perioperative diabetes care: development  and validation of quality indicators throughout the entire hospital care pathway. British Medical Journal BMJ 25: 525-534.
  17. Coan, K.E., Schlinkert , A.B., Beck, B.R., Haakinson, D.J ., Castro, J.C., Schlinkert, R.T., Cook, C.B (2013) Perioperative management of patients with diabetes undergoing ambulatory elective surgery. Journal of diabetes science and technology. 7 (4) pp: 983-989.
  18. Department of Health and Social Care (2008) National service framework for diabetes [online]. Accessed:  https://www.gov.uk/government/publications/national-service-framework-diabetes [Accessed 15 March 2019].
  19. Diabetes UK (2010) Key statistics on diabetes. Available at: https://www.diabetes.org.uk/resources-s3/2017-11/diabetes_in_the_uk_2010.pdf (Accessed 15 March 2019).
  20. Diabetes UK (2018) Diabetes Prevalence 2018. Available at: https://www.diabetes.org.uk/professionals/position-statements-reports/statistics/diabetes-prevalence-2018 (Accessed 29 May 2019).
  21. Diabetes.co.uk (2019) ISO Standards for Blood Glucose Meters [online]. Available at: https://www.diabetes.co.uk/blood-glucose-meters/iso-accuracy-standards.html (Accessed 19 June 2019).
  22. Gandhi, G.Y., Nutthall, G.A ., Mullany C.J., Schaff H.V., Williams B.A .,Schrader L.M., Rizza R.A and McMahon M.M (2005) Intraoperative hyperglycaemia and peri-operative outcomes in cardiac surgery patients. Mayo clinic. Proc. 80 (7) pp: 862-866.
  23. Godby, M.E (2019) Control Group Science. [online]. Available at: https://www.britannica.com/science/control-group (Accessed 08.06.2019).
  24. Gov.uk (2019) Ethnicity facts and figures: UK population by ethnicity. [online]. Available at: https://www.ethnicity-facts-figures.service.gov.uk/uk-population-by-ethnicity (Accessed: 04.06.2019).
  25. Herman, W.H (2010) Are there clinical implications of racial differences in HbA1c? Yes, to not consider can do great harm! Diabetes Care. 2016; (39) pp: 1458–146 [online]. Available at: http://care.diabetesjournals.org/content/diacare/39/8/1458.full.pdf (Accessed 11 June 2019).
  26. Kang, H (2013) The prevention and handling of the missing data.  Korean Journal of Anesthesiology. 64(5)pp: 402–406. [online]. Available at: https://www.ncbi.nlm.nih.gov/pmc/articles/PMC3668100/ (Accessed 19 June 2019).
  27. Kendall, J.M (2018) Designing a research project: randomised controlled trials and their principles. Emergency Medicine Journal. 20 (0) pp: 164-168. [online]. Available at: https://emj.bmj.com/content/20/2/164.info (Accessed 19 June 2019).
  28. Kumar PR ., Bhansali A., Ravikiran M., Bhansali , S., Dutta., Thakur, J.C., Sachdeva, N., Bahdada, S.K and Walia, R (2010)Utility of glycated hemoglobin in diagnosing type 2 diabetes mellitus: a community-based study. Journal of endocrinology and metabolism. 95 pp: 2832–2835.
  29. Leung, V and Ragbir-toolsie (2017) Perioperative management of patients with diabetes. Health serv insights .:2017 10. [online]. Available at: https://www.ncbi.nlm.nih.gov/pmc/articles/PMC5692120/ (Accessed 29 May 2019).
  30. Moher, D, Liberati, A.,Tetzlaff J and Altman DG, The PRISMA Group (2009). Preferred Reporting Items for Systematic Reviews and Meta-Analyses: The PRISMA Statement. PLoS Medicine.6:(7). [online]. Available at: http://prisma-statement.org/PRISMAStatement/FlowDiagram.aspx (Accessed 20.03.2019).
  31. National Institute of Diabetes and Digestive and Kidney diseases (2019) Diabetes overview : what is Diabetes? [online]. Available at:https://www.niddk.nih.gov/health-information/diabetes/overview/what-is-diabetes (Accessed 08 June 2019).
  32. National Health Service NHS (2016) Diabetes [online].  Available at: https://www.nhs.uk/conditions/diabetes (Accessed 15 March 2019).
  33. National Health Service NHS (2017) Next steps on the five-year forward view [online]. Available at: https://www.england.nhs.uk/wp-content/uploads/2017/03/NEXT-STEPS-ON-THE-NHS-FIVE-YEAR-FORWARD-VIEW.pdf (Accessed 15 March 2019).
  34. New York University NYU libraries (2019) Health (Nursing, Medicine, Allied Health): Search Strategies: Framing the question (PICO) Guide to locating health evidence. [online]. Available at: https://guides.nyu.edu/c.php?g=276561&p=1847897 (Accessed 15 June 2019).
  35. Pal Singh, A (2015) Bone and Spine : What is Hierarchy of Evidence? [online]. Available at : https://boneandspine.com/what-is-hierarchy-of-evidence/ (Accessed 01 July 2019).
  36. Pimentel M.P.T., Choi, S ., Fiumara, K., Kachalia, A and Urman, R.D (2017) Safety Culture in the Operating Room: Variability Among Perioperative Healthcare Workers. Journal of patient safety.  [online]. Available at: https://www.ncbi.nlm.nih.gov/pubmed/28574955 (Accessed 12 May 2019).
  37. Preston, N. Gregory, M (2012) Patient recovery and post-anaesthesia care unit (PACU). Anaesthesia and intensive care medicine. 13: (12) pp: 591–593. [online]. Available at: https://www.anaesthesiajournal.co.uk/article/S1472-0299(12)00234-2/fulltext [Acessed:15.03.2019].
  38. Public health England press release (2016) 3.8 million people in England now have diabetes. [online]. Available at: https://www.gov.uk/government/news/38-million-people-in-england-now-have-diabetes (Accessed 15 March 2019).
  39. Quesada, I ., Tudurı´,E ., Ripoll, C and Nadal, A (2008) Physiology of the pancreatic a-cell and glucagon secretion: role in glucose homeostasis and diabetes. Journal of Endocrinology. (199) pp: 5–19 [online]. Available at: https://joe.bioscientifica.com/view/journals/joe/199/1/5.xml (Accessed 08 June 2019).
  40. Royal College of Nursing RCN (2019) Peri-operative Care. [online]. Available at: https://www.rcn.org.uk/library/subject-guides/perioperative-care (Accessed 08 June 2019).
  41. Sargis, R.M (2015) An Overview of the Pancreas: Understanding Insulin and Diabetes. [online]. Available at: https://www.endocrineweb.com/endocrinology/overview-pancreas (Accessed 12 June 2019).
  42. Shuttleworth, M and Wilson, L.T (2019) Scientific Control Group. [online]. Available at: https://explorable.com/scientific-control-group (Accessed 26 June 2019).
  43. Smiley, DD,. Umpierrez, GE. (2006) Perioperative glucose control in the diabetes or nondiabetes patient. South Med J. 99 (6) pp: 580-9; quiz 590-1. Available at: https://www.ncbi.nlm.nih.gov/pubmed/16800413 (Accessed 15 March 2019).
  44. Swenne, C.L and Alexandrén, K (2012) surgical team members’ compliance and knowledge of basic hand hygiene. Journal of infection and prevention control. 2 (3) pp: 114-119. [online]. Available at: https://pdfs.semanticscholar.org/cd6d/e40147cef4e4010ddb1912fb8c3f3fd00345.pdf (Accessed 12 June 2019).
  45. World Health Organisation WHO (2018) Diabetes. Available at: https://www.who.int/news-room/fact-sheets/detail/diabetes (Accessed 29 May 2019).
  46. Ziemer, DC,., Kolm. P., Weintraub W.S., Vaccarino. V., Rhee, M.K., Twombly, J.G., Narayan, K.M., Koch, D.D and Philips, L.S (2010) Glucose-independent, black-white differences in hemoglobin A1c levels: a cross-sectional analysis of 2 studies. Ann Intern Med. 152 pp:770–777 [online]. Avalible at: https://www.ncbi.nlm.nih.gov/pubmed/20547905 (Accessed : 04 June 2019)

A LIFE IN UROLOGY: Privilege, Obligation and Reward

DOI: 10.31038/IJNUS.2019113

Abstract

A life of an urologist, who thrived in academia after early postgraduate training in the US, was presented. Through this somewhat “game-changing” pathway lessons learned and advices were given for young generation of urologists.

Keywords

Urology, Pathway, Game-changing, Academia

Introduction

My pathway in urology is unusual as described below. The president of Western Society of Japanese Urological Association 2020 meeting (Professor Seichi Saitoh, Ryukyu University) thought this game-changing in a way, and asked me to deliver the lecture based on this life to inspire and advise next generation of urologists. The following is its excerpt.

Early Postgraduate Training:

After medical school Hokkaido University in 1964 and a year of internship I went to the US in 1965. US Educational Commission funded travel grant as a Fulbright scholar. As my internship was not approved in the US I had to take another one and a year of surgery residency in Chicago before eligible for urology program in the US. Hard reality was waiting for this foreign medical graduate with no pulling strings for the well-approved programs. Almost all favored their native sons. Nonetheless I made a tour of interviewing several from mid-west to north-east looking for a glimmering hope. When I received a letter of acceptance from the University of Michigan it was an eureka moment.

Urology training at University of Michigan:

The year 1967 when I started the residency training UM was at the midpoint of century old history [1]. The helm was transiting from Reed M. Nesbit to Jack Lapides. By virtue of happenstance I was lucky to receive training by these two legendary urologists. Dr. Nesbit insisted that he is a clinician and that his close friend and roommate during internship, Nobel Laureate Dr. Charles Huggins, is the true researcher. He knows that basic concept and new ideas could be evolved in the clinic and on the ward without necessity of going to the animal laboratory, which should be volitional and not compulsory [2]. (Fig.1 Reed M. Nesbit (1898~1979) Dr. Lapides always believed that practice of medicine should be based on physiological principle and that unsustainable “facts” should always be questioned. He abhorred simple accumulation of knowledges and insisted on deep thinking or “cerebration” and shrewd skepticism [3]. (Fig.2 Jack Lapides (1914~1995)

IJNUS-19-103_Tomohiko Koyanagi_F1

Figure 1.

IJNUS-19-103_Tomohiko Koyanagi_F2

Figure 2.

Under their auspices this neophyte, who knew nothing about urology when he came to UM, grew to a confident one toward the end of residency. If mentors are the ones worthy of gratitude for the warmth vital for the growth, I have no hesitation to name both as my true ones. Appreciating his insight to pick me up as a sole FMG Japanese resident of UM’s long history I wrote a thanking note to Dr. Nesbit just before the completion of residency. His reply came back promptly. (Fig.3 Nesbit’s hand written letter dated May 14, 1970) He described how I served well and consoled me for withstanding hardship of the training. He concluded by stating that “I hope also that you will enjoy the stimulating privilege of training other young men in your field of specialization. That is one of our obligation as well as caring for the afflicted, and also one of the most rewarding that can come to a man.” With these inspiring words (privileges obligation and reward) in my heart as a leading guide I returned to my alma mater HU in 1970.

IJNUS-19-103_Tomohiko Koyanagi_F3

Figure 3.

An early Academic Life at HU:

Working together with young men at HU became a core activity of early academic life. The following are some from these activities.

Pediatric Urology

1.1 Vesicoureteral reflux: Association of bladder dysfunction (uninhibited bladder) with VUR in children with urinary tract infection was reported very first in the world in 1977 [4], preceding two years ahead of the similar work by Koff and Lapides [5]. When I made an appeal for their mis-stated priority Dr. Lapides was apologetic about Koff’s writing “to be the first” in his reply dated 12/2/79. (Fig.4 Hand-written letter (dated December 2, 1979) from Jack Lapides, Apologizing sentence was encircled in red, and typed out below)

1.2 Disorders of UVJ other than VUR: The role of ureteral sheath in megaureter, be it in refluxing MU or primary MU, was addressed both morphologically and functionally [6]. In view of USh involved in the structure of ureteral hiatus, the role of differences in the hiatus, be it common(C), intermediate (I) and/or separate (S) in duplex anomaly was analyzed [7]. In ectopic ureter this was more relevant than ectopic orifice in associated renal anomaly and also in its surgical management [8]. Duality of USh was confirmed in the study of muscular development of the urinary tract in the human embryo [9].

IJNUS-19-103_Tomohiko Koyanagi_F4

Figure 4.

…Steve Koff was embarrassed to learn of your excellent article and offers his apology. He learned a good lesson in that one should always prefix a positive statement about being the first with “To my knowledge”.…

Neurourology, Urodynamic and BPH

2.1 Sympathetic innervation of the lower urinary tract: In neurogenic bladder the bladder respond supersensitively to para-sympathomimetic, while the urethra not, but rather to sympathomimetic. This is also the very first report of the denervation supersensitivity of the urethra [10]. The mechanism was found to be in the short adnergic system, the activity of which is increased as freed from an inhibitory parasympathetic postganglionic synapse [11] This is the reason for its failure to relax or augmenting activity (DSD) in neurogenic bladder [12]. DS was also confirmed in the refluxing ureter of spinal subjects confirming neural control in the function of UVJ [13]. All these clinical findings are compatible with contemporary basic studies which unfolded intricate innervation pattern of lower urinary tract distinctly different from the traditional one [14, 15].

2.2 Surgical application of neurourology in TURP: TURP is a technique learned at UM. I wanted it not to be a mere operative technique in BPH but also to be applicable in male spinal cord injured. Meanwhile revised concept of the prostate and prostatic urethra was proposed by McNeal [16]. In view of abundant adrenergics in peripheral zone in our study [17] radical TURP by resecting PZ as well was proposed as a manner of surgical sympathectomy to relieve DSD [18]. This surgical application of neurourology in TURP in spinal subjects was a success. Urodynamic confirmations as to relieving voiding dysfunction while not jeopardizing continence were presented [19, 20]. Application of radical TURP in BPH not only yielded high success rate [21], but also shed light on the role of external urethral sphincter [22]. It should be stressed that all these early studies are clinical ones to answer the spectrum of questions from daily practice, literally abiding Nesbit’s admonition. At the same time they exemplify my role as an academic urologist which, I believe, is to bridge basic science and clinical urology.

New Fields in late Academic Life:

In 1982 I was endowed helmsmanship of the department. I focused on two fields to light a way forward. Development of one-stage hypospadias repair (OU) was addressed as ACU lecture on the occasion of 2018 JUA/UAA meeting [23]. The experience in renovacular and renal surgery was presented [24, 25] and addressed as a presidential lecture at JUA meeting in 2000 [26]. Along with reconstructive surgery in kidney transplantation of children [27] stressed that these are the new fields to be tackled by the next generation to make urology a true discipline of surgery.

Lessons and Advices to be heeded:

  1. Study abroad while young to broaden your scope.
  2. Pathway is there to be built not to be walked on.
  3. Seek mentor of your life time.
  4. Have a healthy skepticism for the dogma.
  5. Clinical work is demanding as both intellectually and physically as any basic research.
  6. The role of academic urologist is to bridge the basic science and clinical urology.
  7. Stay tuned to daily clinical problem where study themes are abundant.
  8. Publish preferably in leading journals.
  9. Have working colleagues in the field.
  10. You did well when surpassed by the young generation. These are the words to be heeded albeit the one from by-gone era.

Summary

Early sojourn to US, urology training at UM, and an academic life at HU were reflected personally. Through these lessons learned and advices were given. I was privileged in that my education and trainings (medical school and US training) were supported by the public fund (Japanese and US government, respectively). Subsequently it was a natural obligation to serve as an academic urologist at HU. It was also rewarding in that I was able to train many next generation of urologists who surpass me both surgically and scientifically. By practicing Nesbit’s admonition (privilege, obligation and reward) I may say the life is well lived.

Abbreviations

JUA- Japanese Urological Association

US- United States

FMG- Foreign Medical Graduate

UM- University of Michigan

HU- Hokkaido University

VUR- Vesicoureteral Reflux

UVJ- Ureterovesical Junction

USh- Ureteral Sheath

MU- Megaureter

DS- Denervation Supersensitivity

TURP- Transurethral Resection of Prostate

DSD- Detrusor Sphincter Dyssynergia

BPH-Benign Prostatic Hypertrophy

OU- One stage Urethroplasty

ACU-Asia Congress of Urology

UAA- Urologic Association of Asia

References

  1. Konnak JW, Pardanani DS. A history of urology at the University of Michigan 1920–2001 (2002) Historical center for the health sciences monograph series No.7.
  2. Lapides J, Reed M. Nesbit. His Biography. The University of Michigan Medical Center Journal (1973) 39: 99–100.
  3. Kogan BA (1990) Jack Lapides Clinician, Teacher, Investigator and Innovator. J Urol 144: 514–516.
  4. Koyanagi T, Ishikawa T, Tsuji I (1977) Vesicoureteral reflux and uninhibited neurogenic bladder. Int Urol & Nephrol 9: 217–224.
  5. Koff SA, Lapides J. Piazza DH (1979) Association of urinary tract infection and reflux with uninhibited bladder contractions and voluntary sphincteric obstruction. J Urol 122: 373–376. [crossref]
  6. Tokunaka S, Koyanagi T (1982) Morphologic study of primary non-reflux megaureters with particular emphasis on the role of the ureteral sheath and ureteral dysplasia. J Urol 128: 399–402. [crossref]
  7. Koyanagi T, Tsuji I (1979) Experience of complete duplication of the collecting system. Int Urol & Nephrol 11: 27–38.
  8. Koyanagi T, Hisajima S, Goto T, Tokunaka S, Tsuji I (1980) Everting ureteroceles: Radiographic and endoscopic observation, and surgical management. J Urol 123: 538–543. [crossref]
  9. Matsuno T,Koyanagi T, Tokunaka S (1984) Muscular development in the urinary tract. J Urol 132: 148–152. [crossref]
  10. Koyanagi T (1978) Denervation supersensitivity of the urethra to α-adrenergics in the chronic neurogenic bladder. Urol Res 6: 89–93. [crossref]
  11. Koyanagi T (1979) Further observation on the denervation supersensitivity of the urethra in patients with chronic neurogenic bladder. J Urol 122: 348–351. [crossref]
  12. Koyanagi T, Arikado K, Takamatsu T, Tsuji I (1982) Relevance of sympathetic dyssynergia in the region of external urethral sphincter: Possible mechanism of voiding dysfunction in the absence of somatic sphincter dyssynergia. J Urol 127: 277–282. [crossref]
  13. Koyanagi T, Tsuji I (1981) Study of ureteral reflux in neurogenic dysfunction of the bladder: The concept of neurogenic ureter and the role of periureteral sheath in the genesis of reflux and supersensitive response to autonomic drugs. J Urol 126: 210–217. [crossref]
  14. Elbadawi A (1982) Neuromorphologic basis of vesicourethral function: Histochemistry, ultrastructure, and function of intrinsic nerves of the bladder and urethra. Neurourol & Urodyn 1: 3–50.
  15. Norlen LJ (1982) Influence of sympathetic nervous system on the lower urinary tract and its clinical implications. Neurourol & Urodyn 1: 129–148.
  16. McNeal JE (1972) The prostate and prostatic urethra: A morphologic synthesis. J Urol 107: 1008–1016. [crossref]
  17. Kobayashi S, Demura T, Nonomura K, Koyanagi T (1991) Autoradiographic localization of the adrenoceptors in human prostate: Special reference to zonal difference. J Urol 146: 887–890. [crossref]
  18. Koyanagi T, Arikado K, Tsuji I (1981) Radical transurethral resection of the prostate for neurogenic dysfunction of the bladder in male paraplegics. J Urol 125: 521–527. [crossref]
  19. Koyanagi T, Morita H et al. (1987) Radial transurethral resections of the prostate in male paraplegics revisited: Further clinical experience and urodynamics considerations for its effectiveness. J Urol 137: 72–76.
  20. Shinno Y, Koyanagi T, Kakizaki H, Kobayashi S, Ameda K et al. (1994) Urinary Control after radical transurethral resection of the prostate in male paraplegics: Urodynamic evaluation of its effectiveness in relieving incontinence. Int J Urol 1: 78–84. [crossref]
  21. Machino R, Kakizaki H, Ameda K, Shibata T, Tanaka H et al. ( 2002) Detrusor instability with equivocal obstruction: A predictor of unfavorable symptomatic outcomes after transurethral prostatectomy. Neurourol & Urodynamics 21: 444–449. [crossref]
  22. Koyanagi T (1980) Studies of the sphincteric system located distally in the urethra: The external urethral sphincter revisited. J Urol 124: 400–406. [crossref]
  23. Koyanagi T (2018) ACU lecture: One-stage hypospadias repair- Future is Asia the East. Int J Urol 25: 314–317. [crossref]
  24. Seki T, Koyanagi T, Togashi M, Chikaraishi T, Tanda K et al (1997) Experience with revascularizing renal artery aneurysms: Is it feasible and worth attempting? J Urol 158: 357–362. [crossref]
  25. Nobuo Shinohara, Katsuya Nonomura, Tohru Harabayashi, Masaki Togashi, Satoshi Nagamori et al. (1995) Nephron sparing surgery for renal cell carcinoma in von Hippel Lindau disease. J Urol 154: 2016–2019.
  26. Koyanagi T, Nonomura K, Takeuchi I, Watarai Y, Seki T et al. (2002) Surgery for renovascular diseases: A single center experience in revascularizing renal artery stenosis and aneurysm. Urol Int 68: 24–31. [crossref]
  27. Chikaraishi T, Nonomura K, Kakizaki H, Seki T, Morita K et al. (1998) Kidney transplamtation in patients with neurovesical dysfunction. Int J Urol 5: 428–435. [crossref]

The First Step to Solving any Problem is Recognizing there is one!

DOI: 10.31038/PEP.2020111

Short Communication

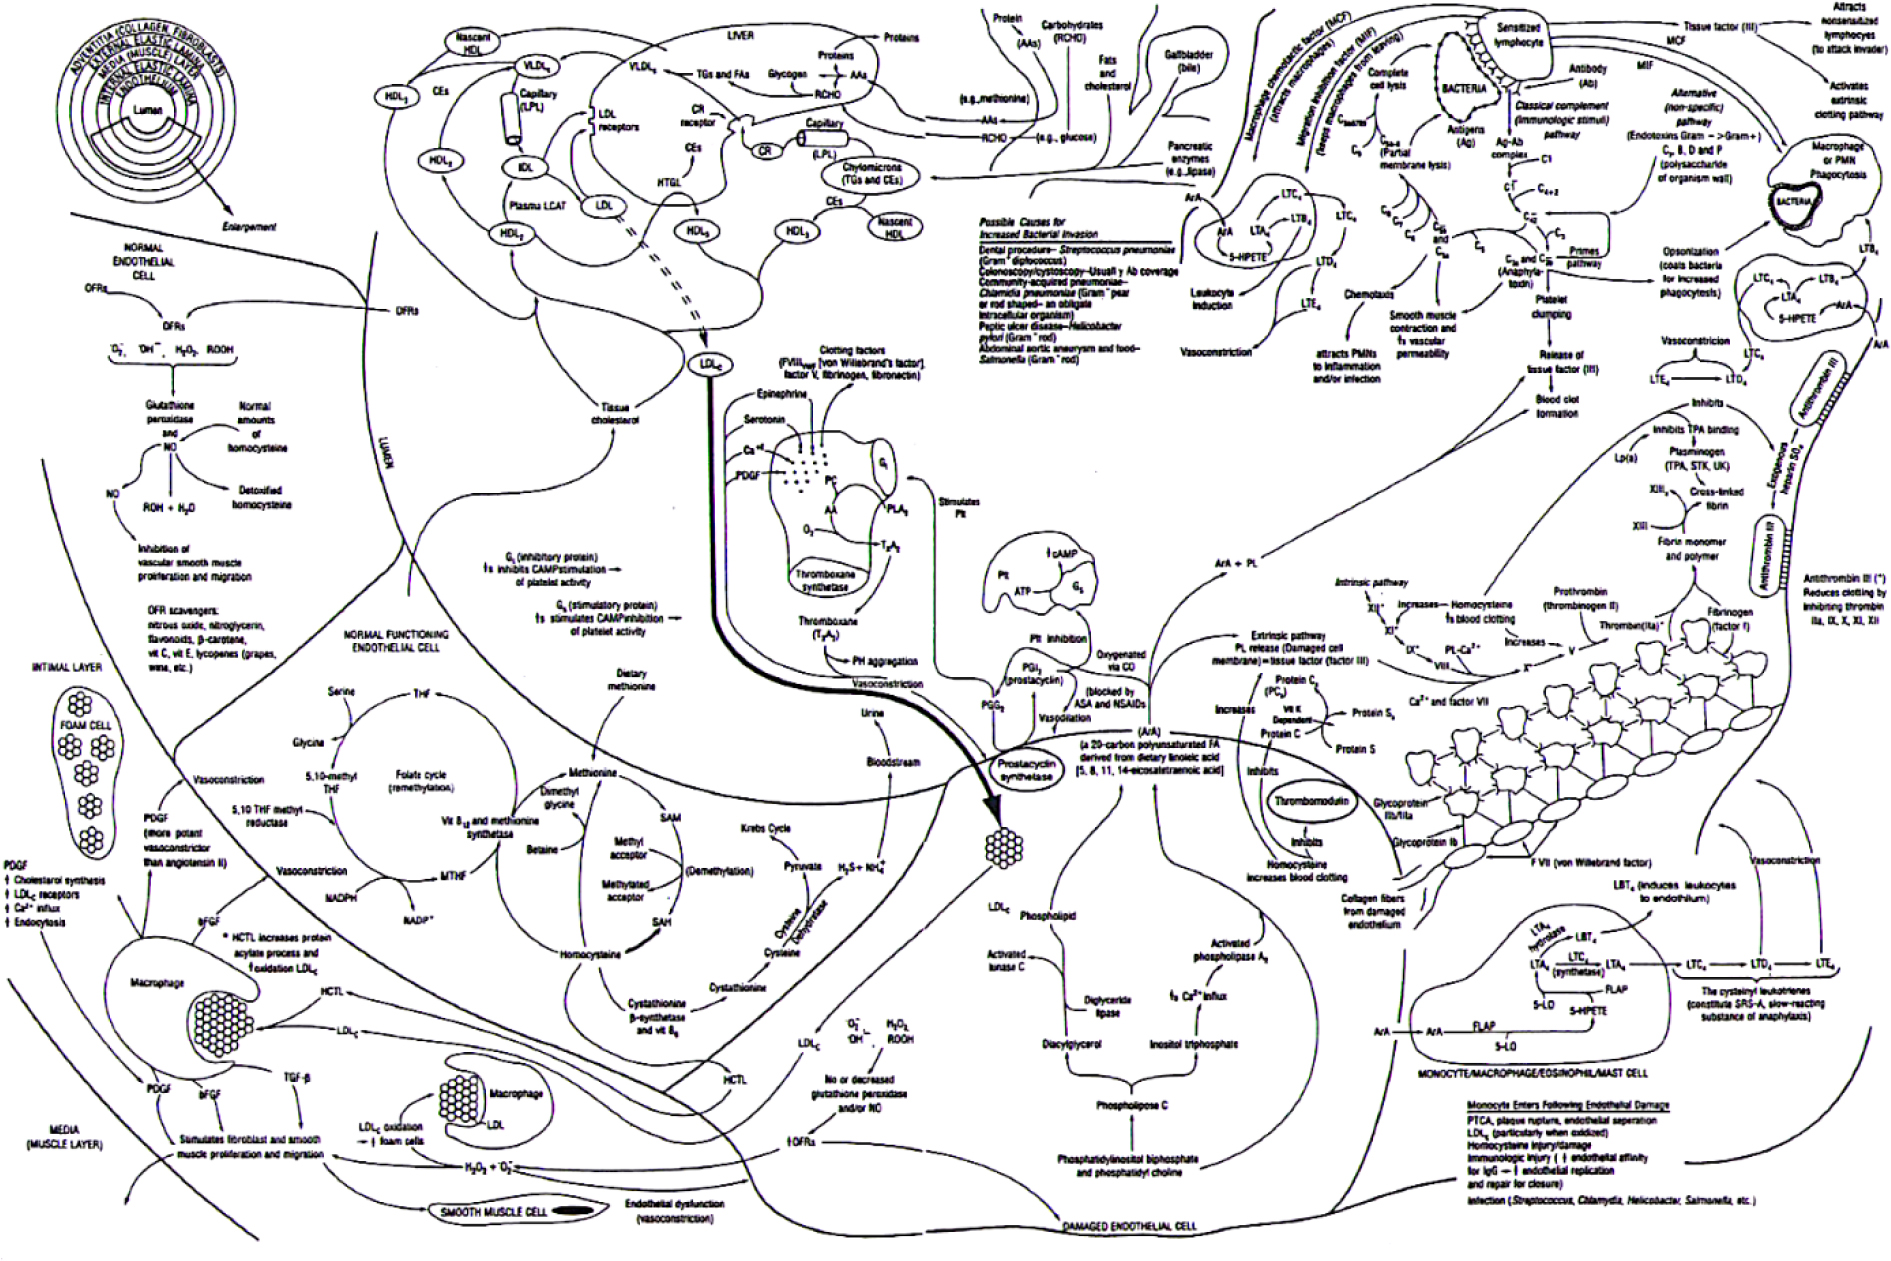
Since the introduction of the Inflammation and Heart Disease Theory [1–3], a shift from a cholesterol only etiology for coronary artery disease (CAD) has occurred. Unfortunately, hundreds if not thousands of research studies – involving millions of dollars in vested funding – have focused on measuring changes in blood tests rather than measuring actual changes in CAD itself [4,5].

The consequence has been an amalgam of misinformation fueled by opposing factions of scientists and pseudo-scientists resembling more of a schoolyard brawl than scientific search for the truth. From this brawl both the media and social scientific neophytes vie for attention – a demonstration of true social desperation and not scientific discourse.

Fundamental questions about the impact of diet and drug treatment [6–9] remain poorly addressed due to this deeply flawed approach – thus the role diet and lifestyle play in preventing CAD remain unanswered.

While we have some information about what may be happening to people [8] who change their diets – the truth is we do not know and we will not know until we decide to scientifically any the question by measuring [5–7] the changes in CAD, which diets and medications [9] have on people with and without underlying CAD. The first step to solving this question of dietary epidemiology and prevention of CAD is to recognize we haven’t been measuring the problem – CAD – itself. The first step to solving any problem is recognizing there is one.

Acknowledgments: FMTVDM issued to first author. Figures expressly reproduced with permission of first author.

Figure 1. Coronary artery disease is an inflammatory process precipitated by more than a dozen variables. Each variable contributes to inflammation within the blood vessels of the body, including the coronary arteries to varying degrees in different individuals [1].

PEP 2020-101_Richard M. Fleming_F1

Figure 1. Fleming Inflammation and Vascular Disease Theory [2].

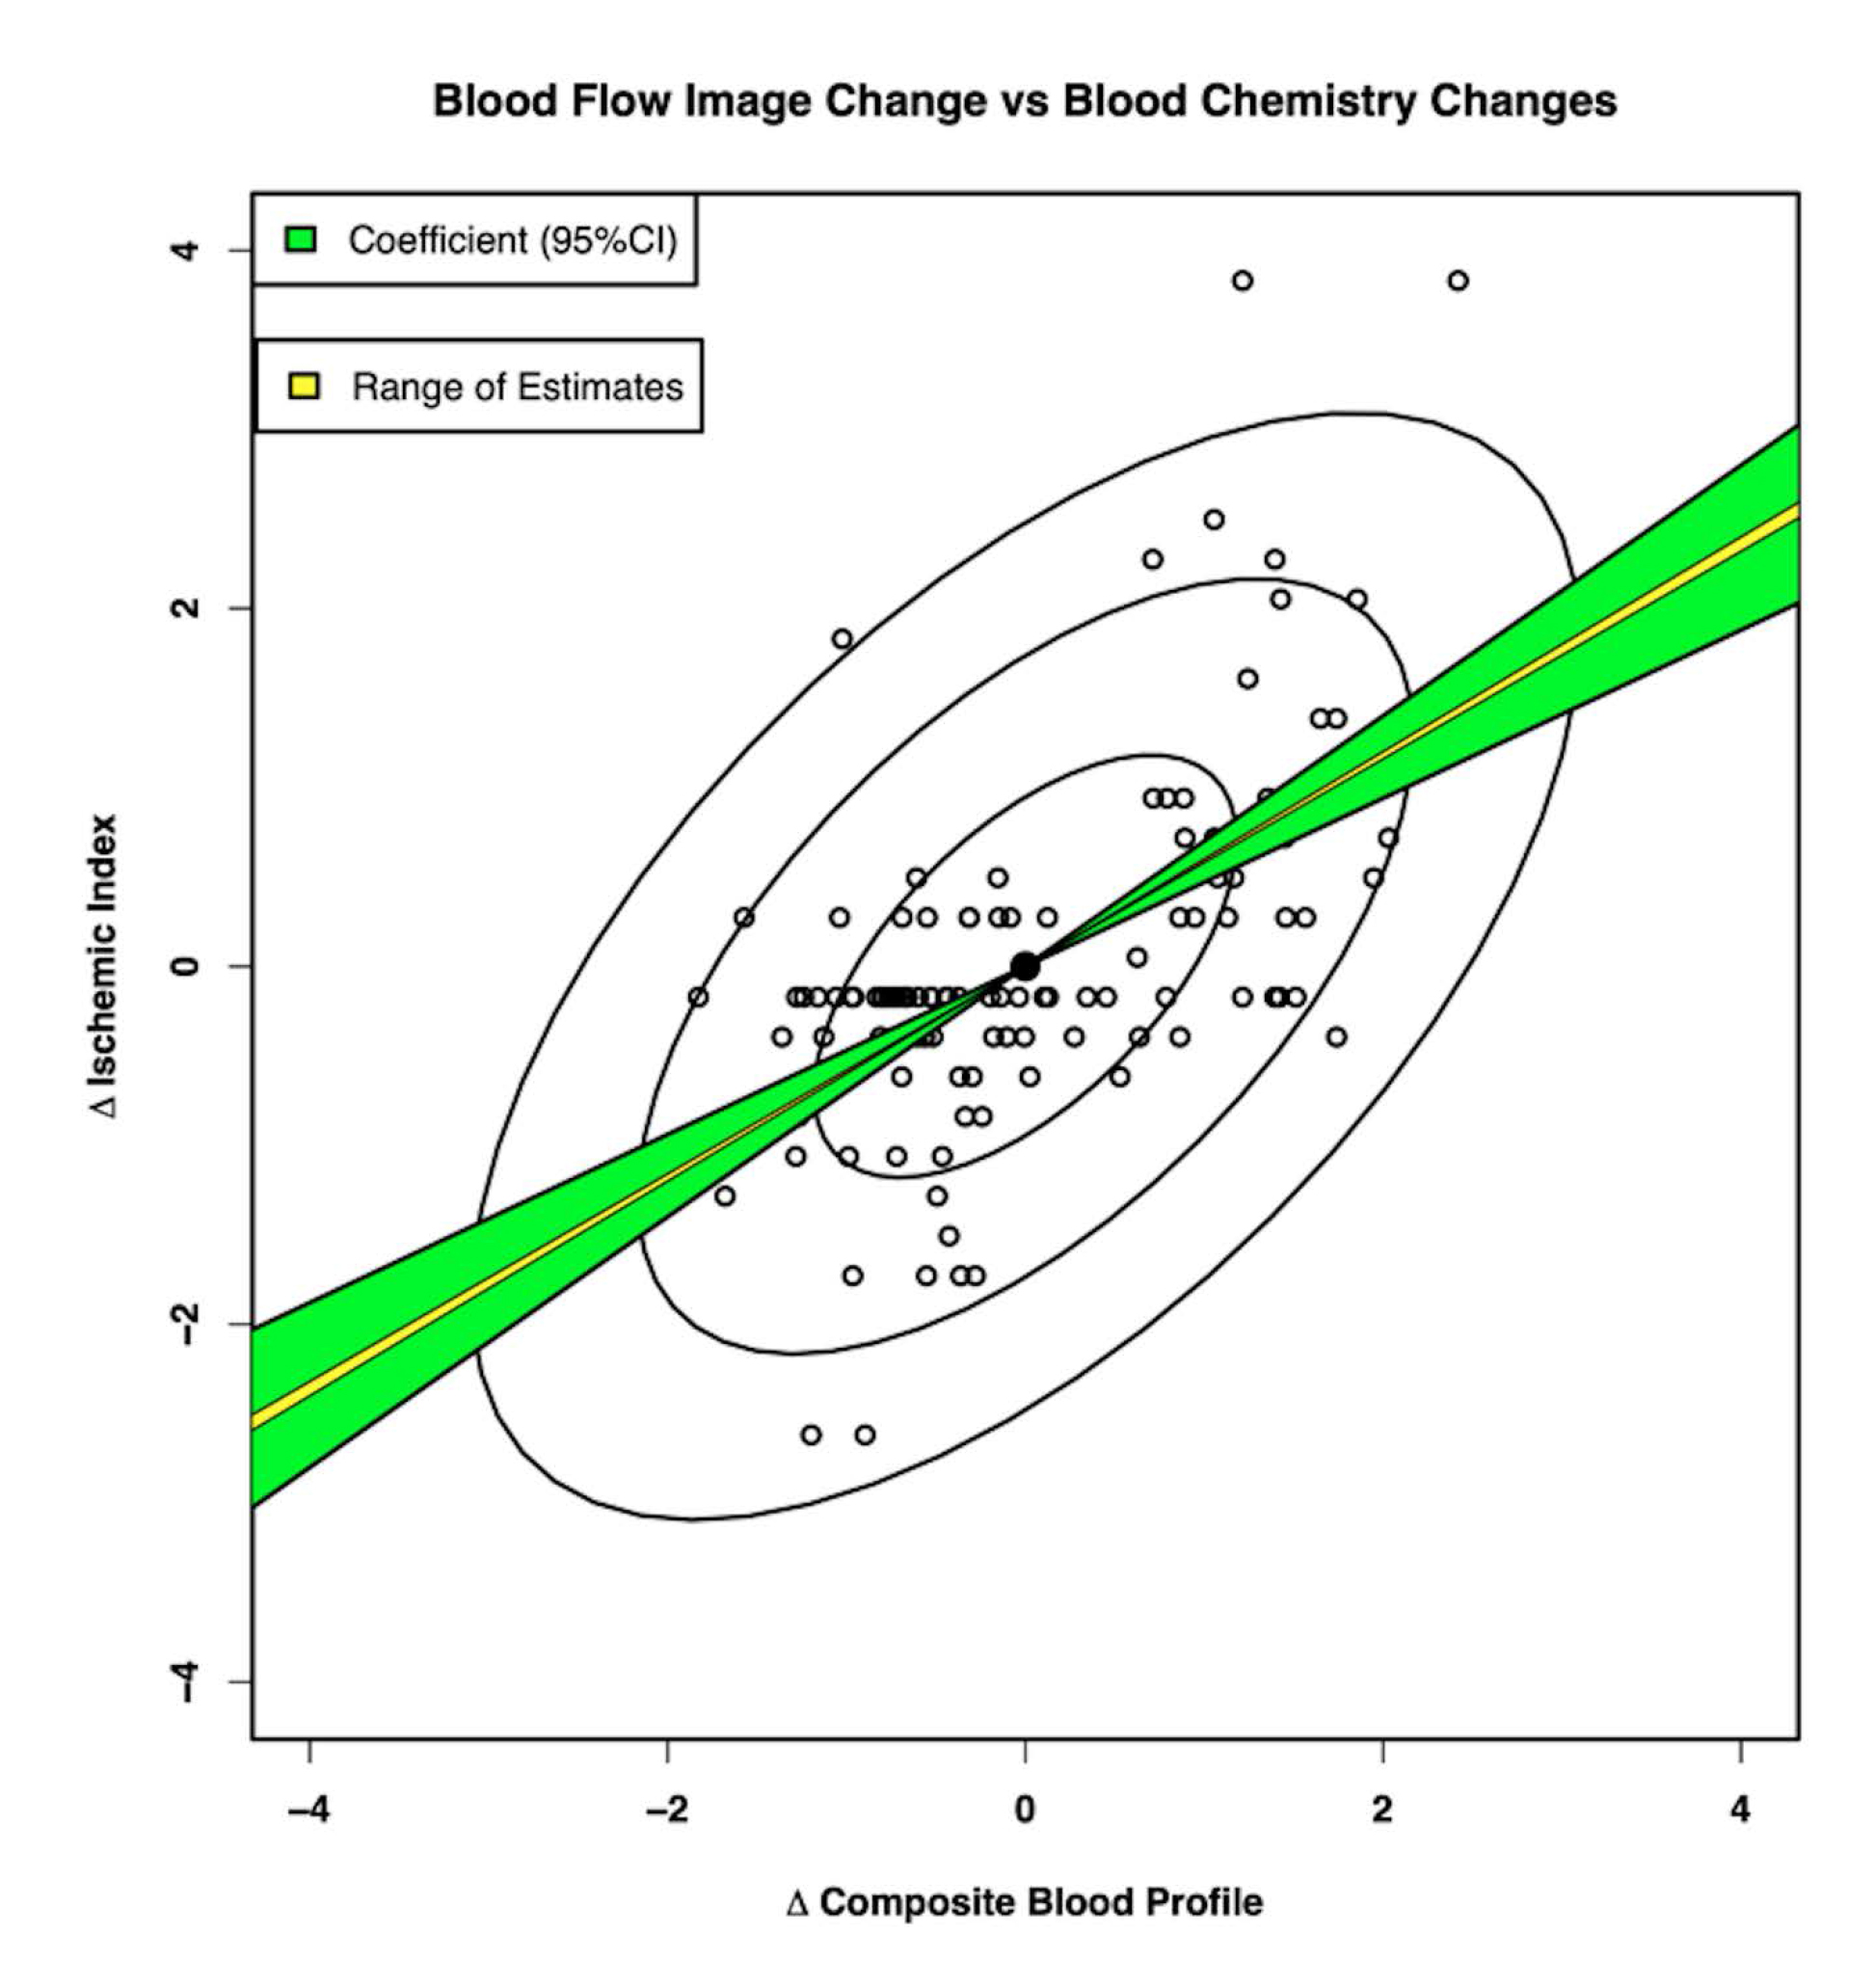
Figure 2. The X-axis displays the composite blood profile including TC, fat, low HDL, IL-6, Lp, and Fib. The Y-axis displays changes in ischemia as measured by nuclear imaging. The standard regression analysis shows both the range of estimates (yellow) and the 95% confidence intervals (green). HDL, high-density lipoprotein; IL-6, interleukin-6; Lp-a, lipoprotein-a; Fib, fibrinogen; Tc, total cholesterol [4].

PEP 2020-101_Richard M. Fleming_F2

Figure 2. Standardized regression of coronary blood flow on composite blood profile [6].

References

  1. Fleming RM. Chapter 64. The Pathogenesis of Vascular Disease.  Textbook of Angiology.  John C. Chang Editor, Springer-Verlag New York, NY. 1999, pp. 787–798.
  2. Fleming RM. Stop Inflammation Now! with Tom Monte. Published by Putnam Books and Avery Books. December 2003. ISBN: 0399151117
  3. https://www.youtube.com/watch?v=Hvb_Ced7KyA&t=22s
  4. Fleming RM, Harrington GM. “What is the Relationship between Myocardial Perfusion Imaging and Coronary Artery Disease Risk Factors and Markers of Inflammation?” Angiology 2008;59:16–25.
  5. The Fleming Method for Tissue and Vascular Differentiation and Metabolism (FMTVDM) using same state single or sequential quantification comparisons. Patent Number 9566037. Issued 02/14/2017.
  6. Fleming RM, Fleming MR, McKusick A, Chaudhuri TK. The Diet Wars Challenge Study: Insulin Resistance, Cholesterol and Inflammation. ACTA Scientific Pharm Sci. 2019;3(6). ISSN: 2581–5423.
  7. Fleming RM, Fleming MR, McKusick A, Ayoob KT, Chaudhuri TK. A Call for the Definitive Diet Study to End the Diet Debate Once and for All. Gen Med. 2019;7(1):322. DOI: 10.24105/2327-5146.7.322.
  8. Fleming RM, Fleming MR, Chaudhuri TK, Harrington GM. Cardiovascular Outcomes of Diet Counseling. Edel J Biomed Res Rev. 2019;1(1):20–29.
  9. Fleming RM, Fleming MR, Chaudhuri TK. How Beneficial are Statins and PCSK9-Inhibitors? Scho J Food & Nutr 2019;2(3):213–218.DOI:10.32474/SJFN.2019.02.000136.

Presurgical MRSA Screening and Subsequent Decolonization in Elective Instrumented Neurosurgery: A Case Descriptive Study

DOI: 10.31038/JCRM.2019254

Abstract

Background

Staphylococcus aureus is one of the main microorganisms causing a surgical site infection. Methicillin resistant staphylococcus aureus (MRSA) surgical site infection treatment may be difficult, requires long-term antibiotic treatment, especially in cases of instrumented procedures, deteriorates the clinical result, and generates a high medical and social cost. Preoperative colonization with MRSA is a risk factor of SSI’s

Purpose

To identify the prevalence of MRSA colonization of patients scheduled for elective and instrumented neurosurgery and the success rate of current MRSA decolonization protocol. Many studies have addressed MRSA colonization rate and impact of MRSA decolonization. However, large studies on this topic in elective and instrumented neurosurgery are sparse.

Materials and methods

A total of 1749 patients, scheduled for elective instrumented neurosurgery, were included for this study. All patients were screened for MRSA and those who were diagnosed as MRSA carriers underwent decontamination preoperatively. The medical files of the patients, who screened MRSA positive, were searched for risk factors of MRSA carriage. In addition, information of postsurgical MRSA positive cultures was collected for detection of surgical site infection caused by MRSA.

Results

The colonization rate of patients scheduled for elective instrumented neurosurgery was 0.74%. After completing the first decontamination protocol, all MRSA carriage was eliminated. At least one risk factor for MRSA carriage was reported for 11 of the 13 patients, MRSA carriers. One patient, who was preoperatively MRSA negative, had an MRSA surgical site infection.

Conclusion

The prevalence of MRSA carriage in elective, instrumented neurosurgery was 0.74% and no resistance was observed against our decolonization protocol. Preoperative MRSA screening can be used to reduce possible complications caused by MRSA after surgery. The preferred strategy for screening and decontamination depends on several, mostly local factors.

Keywords

MRSA screening; MRSA prevalence; MRSA decolonization; Surgical Site Infection; neurosurgery; screening strategy

Introduction

Staphylococcus aureus is one of the main microorganisms causing a surgical site infection (SSI). Methicillin resistant staphylococcus aureus (MRSA) SSI treatment may be difficult, requires long-term antibiotic treatment, especially in cases of instrumented procedures, deteriorates the clinical result, and generates a high medical and social cost [1]. Preoperative colonization with MRSA is a risk factor of SSI’s [2].

S. aureus and MRSA are most frequently identified in the anterior nares. Other common extra-nasal sites are the skin, pharynx and perineum [3]. Several risk factors for MRSA carriage have been identified in the literature and are listed in Table 1 [4–13].

Table 1. Risk factors for MRSA carriage

Male

Older than 75 years

Work in healthcare sector

Hospitalization or surgery during the previous 12 months

Prolonged hospital stay

Close human interaction (elderly home, incarceration, …)

Concomitant diseases such as:

Ischemic heart disease

Tumor

Diabetes Mellitus

Chronic renal insufficiency

Peripheral vascular disease

HIV infection

Antibiotic usage in the past 6 months

Hemodialysis

Injection drug use

Men having sex with men

Farming

*MRSA: methicillin resistant staphylococcus aureus; HIV: human immunodeficiency virus

Preoperative screening and subsequent decolonization of MRSA positive patients prior to surgery is a well-known strategy to reduce the risk of SSI’s with MRSA [14].

Although systematic screening and targeted decolonization involves an additional cost and effort, it may reduce expenditures due to a decrease in complications correlated with MRSA infection [15].

This study examines (a) the prevalence of MRSA colonization in a population of patients scheduled for elective and instrumented neurosurgery, (b) the success rate of MRSA decolonization, (c) the occurrence of a SSI in patients who underwent elective surgery and (d) the presence of risk factors (Table 1) for MRSA carriage in the colonized group.

Materials and Methods

From April 2012 until June 2015, preoperative screening for MRSA carriage was performed in 1997 patients who were scheduled for a neurosurgical procedure in AZ Nikolaas. All urgent and non-instrumented interventions were excluded for this study, which resulted in a final database including 1749 elective and instrumented neurosurgical procedures. Most frequent procedures were posterior lumbar interbody arthrodeses (772), anterior cervical discectomies and arthrodeses (531), screw implantations (129) and anterior lumbar interbody arthrodeses (125). MRSA screening was performed 2 to 3 weeks prior to surgery either at the clinical laboratory of AZ Nikolaas, the general practitioner’s office, at home or abroad. At the clinical laboratory of AZ Nikolaas, screening was performed at three different body sites (anterior nares, pharynx and perineum). These samples were obtained by using swabs suitable for aerobes and anaerobes (Nuova Aptaca, Canelli, Italy). Screening that was performed at AZ Nikolaas was at a cost of €21.6 per patient. Screening outside the hospital (at general practitioner’s office, at home or screening abroad) involved a swab of the anterior nares and was performed at an unknown cost.

Within 24 hours of sampling, swabs were soaked in enrichment broth containing NaCl 6,5% and streaked onto ChromID MRSA (bioMérieux, Marcy l’ Etoile, France). These agar plates contain cefoxitin to inhibit oxacillin susceptible S. aureus strains. The agar plate was incubated for 24–48 hrs at 35±2°C in ambient air. Growth of green colonies was suspected for MRSA, these colonies were identified by means of mass spectrometry (Bruker Biotyper, Germany). S. aureus strains were confirmed for their resistance to cefoxitin by disk diffusion (ROSCO tablets) using EUCAST antimicrobial breakpoint criteria.

In case of a positive MRSA screening, the surgeon contacted the patient to ask his approval for an MRSA decolonization procedure. This decolonization procedure implies: a 2% mupirocin ointment which was topically applied to the anterior nares 3 times daily for 5 days, daily bathe and 1–2 hair washes with 40mg/ml chlorhexidine glucoronate solution or 10% povidone-iodine gel for 5 days. On the 8th day after the start of the decolonization protocol, a new MRSA screening was executed. If tested negative, two consecutive screenings took place on day 10 and 11. If tested positive, a second decolonization was performed. Surgery was performed when the patient initially screened negative or in case of three consecutive negative screening results after the MRSA decolonization procedure. The total cost of a decolonization procedure with three consecutive screenings was €89.3 per patient.

The medical records of presurgical MRSA positive patients were searched for the presence of risk factors shown in Table 1. We registered the results of all MRSA screenings, if screening was carried out in the hospital and the occurrence of SSI caused by MRSA. Furthermore, data of all pre- and postsurgical positive MRSA cultures of neurosurgical patients were collected, for the same time period, from the database of the department of Microbiology. All data were compiled using Excel (Version 15.19.1, 2016, Microsoft, Redmond, WA, USA) for subsequent analyses. This study was approved by the medical ethics committee of AZ Nikolaas, reference number EC17023.

Results

The MRSA colonization rate in our patients undergoing elective instrumented neurosurgery was 0.74% (13 of 1749). Of all screenings, 1227 (70.2%) were performed in AZ Nikolaas and 522 (29.8%) outside the hospital. Of the thirteen MRSA positive screenings, eight (62%) were performed in the hospital lab and five (38%) in other labs. The detection rate using samples from three different body sites was 0.65% (8 of 1227) and 0.96% (5 of 522) in case only the anterior nares were sampled.

After completing the first decolonization protocol, none of the initially MRSA positive patients screened positive again.

Of the thirteen pre-surgical MRSA positive patients, twelve medical files included information about risk factors for MRSA carriage. This search revealed that three patients were male, one was older than 75 years, two were active in the healthcare sector at the moment of surgery and three were working on a farm. In the period of 12 months prior to surgery, three patients had been hospitalized and two of them had undergone surgery.

Assessing the underlying diseases, one patient was known with diabetes mellitus, one with chronic kidney disease and two with peripheral vascular disease (Table 2).

Table 2. Presence of risk factors in MRSA positive patients

Risk factor*

Number of patients

%

Male

3

25%

Older than 75 years

1

8%

Active in healthcare sector

2

17%

Farming

3

25%

Hospitalization previous 12 months

3

25%

Surgery previous 12 months

2

17%

Diabetes mellitus

1

8%

Chronic kidney disease

1

8%

Peripheral vascular disease

2

17%

* One patient can have more than one risk factor; MRSA: methicillin resistant staphylococcus aureus

At least one risk factor was present in eleven (92%) MRSA colonized patients. There were no declared relations with the other assessed risk factors.

No surgical site infection occurred in the preoperative MRSA carrying and decolonized patients. Of all patients who underwent instrumented neurosurgery, one preoperative MRSA negative patient had a deep incisional MRSA SSI, 48 hours after operation, for which reoperation was necessary.

Discussion

To determine the role of MRSA screening in elective instrumented neurosurgery, defining the prevalence of MRSA colonization and MRSA related SSI is essential. Studies identifying preoperative MRSA colonization in elective instrumented neurosurgery are scarce and the local MRSA prevalence must be taken into consideration when interpreting the results.

This study included data of 1749 patients and found a MRSA colonization rate of 0.74%. This is comparable to the reported MRSA prevalence of 0.4% in Belgium [16].

None of the 13 preoperative MRSA positive patients had an SSI. However, one preoperative MRSA negative patient had an SSI caused by MRSA. Although the carriage of MRSA is a known risk factor for surgical site infections with MRSA, Kawabata et al. reported no added value of MRSA nasal swab cultures in spinal surgery for predicting SSI [17].

Evaluation of the screening was only performed for MRSA and not for methicillin sensitive Staphylococcus aureus (MSSA). A significant part of surgical site infections is caused by MSSA and screening for MSSA followed by decolonization may result in a greater reduction of SSI [18].

An important aspect in MRSA screening is the anatomical site sampled for screening. Screening from multiple body sites such as a combination of nasal, throat and perineal or groin sampling perform better than nasal screening alone [19]. We could not verify this statement in our study since the MRSA colonization rate was slightly lower when screening was performed at three different body sites (0.65%) in comparison with sampling of the anterior nares only (0.96%). This could not be elaborated in more detail because we lack the MRSA culture method of the clinical laboratories other than the one of AZ Nikolaas.

Another option for reducing SSI after instrumented surgery is universal decolonization of patients. The latter approach may be more effective in reducing the rates of MRSA SSI infection in comparison to screening and selective decolonization and may also reduce hospitalization cost [20]. However, it should be kept in mind that widespread usage of decolonizing agents can induce an increased resistance against these agents [21] and may compromise the capacity of monitoring the emergence of new clones of S. aureus if previous screening is not performed [22]. Baratz et al. concluded that although an MRSA screening and decolonization protocol reduces the nasal carriage of MRSA in patients undergoing total joint arthroplasty, 22% of the patients remained colonized. This was partly explained by mupirocin resistance [23]. In our study, we did not observe regrowth of MRSA after decolonization procedures on patients. Denis et al. reported a MRSA sensitivity of >90% for mupirocin in Belgium [24].

Of all searched risk factors, there was not a particular one which was remarkably present in MRSA colonized patients this may be due to the low MRSA prevalence. Noteworthy, eleven of the twelve patients had at least one risk factor. De Wouters et al. showed that selective screening of patients based on the presence of risk factors for MRSA colonization does not allow detecting the MRSA carriers when MRSA prevalence is low [25]. The identification of risk factors in individual patients may be interesting, but implementation of this time-consuming patient-based query is not standard.

There are different approaches for reducing the postoperative burden of MRSA SSI such as preoperative screening with subsequent decolonization, screening of high-risk patients with decolonization or universal decolonization. Hereby, the main goal should be a decrease of the MRSA colonization rate and prevention of postoperative complications caused by MRSA SSI. When comparing the abovementioned strategies, the local prevalence of MRSA carriage, a possible increase of resistance against decolonizing agents and the cost-effectiveness of the different approaches should be considered.

In conclusion, preoperative MRSA screening is a tool, which can be used to reduce possible complications caused by MRSA after surgery. In our study, the prevalence of MRSA carriage in elective, instrumented neurosurgery was 0.74% and no resistance was observed against our decolonization protocol. Considering the fact that an SSI requires long-term antibiotic treatment, which in case of MRSA infection should be administered intravenously, the cost of screening and decontamination seems justified.

Competing interest

The authors report no conflict of interest.

Funding information

This expenses for this study were covered by the department of neurosurgery

Abbreviations

MRSA: methicillin resistant staphylococcus aureus

MSSA: methicillin sensitive staphylococcus aureus

S. aureus: staphylococcus aureus

SSI: surgical side infection

References

  1. Anderson, D.J., et al., (2009) Clinical and Financial Outcomes Due to Methicillin Resistant Staphylococcus aureus Surgical Site Infection: A Multi-Center Matched Outcomes Study. Plos One, 4(12). [Crossref]
  2. Cassir, N., et al., (2015) Risk factors for surgical site infections after neurosurgery: A focus on the postoperative period. Am J Infect Control, 43(12): p. 1288–91. [Crossref]
  3. Wertheim, H.F., et al., (2005) The role of nasal carriage in Staphylococcus aureus infections. Lancet Infect Dis, 5(12): p. 751–62. [Crossref]
  4. Harbarth, S., et al., (2006) Evaluating the probability of previously unknown carriage of MRSA at hospital admission. Am J Med, 119(3): p. 275 e15–23. [Crossref]
  5. Dorado-Garcia, A., et al., (2013) Risk factors for persistence of livestock-associated MRSA and environmental exposure in veal calf farmers and their family members: an observational longitudinal study. BMJ Open, 3(9): p. e003272. [Crossref]
  6. Rogers, C., et al., (2014) Duration of colonization with methicillin-resistant Staphylococcus aureus in an acute care facility: a study to assess epidemiologic features. Am J Infect Control, 42(3): p. 249–53. [Crossref]
  7. Couderc, C., et al., (2014) Fluoroquinolone use is a risk factor for methicillin-resistant Staphylococcus aureus acquisition in long-term care facilities: a nested case-case-control study. Clin Infect Dis, 59(2): p. 206–15. [Crossref]
  8. Zervou, F.N., et al., (2014) Prevalence of and risk factors for methicillin-resistant Staphylococcus aureus colonization in HIV infection: a meta-analysis. Clin Infect Dis, 59(9): p. 1302–11. [Crossref]
  9. Nguyen, D.B., et al., (2013) Invasive methicillin-resistant Staphylococcus aureus infections among patients on chronic dialysis in the United States, 2005–2011. Clin Infect Dis, 57(10): p. 1393–400. [Crossref]
  10. Centers for Disease, C. and Prevention, (2003) Methicillin-resistant staphylococcus aureus infections among competitive sports participants–Colorado, Indiana, Pennsylvania, and Los Angeles County, 2000–2003. MMWR Morb Mortal Wkly Rep, 52(33): p. 793–5. [Crossref]
  11. Centers for Disease, C. and Prevention, (2001) Methicillin-resistant Staphylococcus aureus skin or soft tissue infections in a state prison–Mississippi, 2000. MMWR Morb Mortal Wkly Rep, 50(42): p. 919–22. [Crossref]
  12. Centers for Disease, C. and Prevention, (2006) Methicillin-resistant Staphylococcus aureus skin infections among tattoo recipients–Ohio, Kentucky, and Vermont, 2004–2005. MMWR Morb Mortal Wkly Rep, 55(24): p. 677–9. [Crossref]
  13. Diep, B.A., et al., (2008) Emergence of multidrug-resistant, community-associated, methicillin-resistant Staphylococcus aureus clone USA300 in men who have sex with men. Ann Intern Med, 148(4): p. 249–57. [Crossref]
  14. Lefebvre, J., et al., (2017) Staphylococcus aureus screening and decolonization reduces the risk of surgical site infections in patients undergoing deep brain stimulation surgery. J Hosp Infect, 95(2): 144–147(1532–2939). [Crossref]
  15. Slover, J., et al., (2011) Cost-effectiveness of a Staphylococcus aureus screening and decolonization program for high-risk orthopedic patients. J Arthroplasty, 26(3): p. 360–5. [Crossref]
  16. den Heijer, C.D., et al., (2013) Prevalence and resistance of commensal Staphylococcus aureus, including meticillin-resistant S aureus, in nine European countries: a cross-sectional study. Lancet Infect Dis, 13(5): p. 409–15. [Crossref]
  17. Kawabata, A., et al., (2017) Methicillin-resistant Staphylococcus Aureus Nasal Swab and Suction Drain Tip Cultures in 4573 Spinal Surgeries: Efficacy in Management of Surgical Site Infections. Spine (Phila Pa 1976), [Crossref]
  18. Bode, L.G., et al., (2010) Preventing surgical-site infections in nasal carriers of Staphylococcus aureus. N Engl J Med, 362(1): p. 9–17. [Crossref]
  19. Senn, L., et al., (2012) Which anatomical sites should be sampled for screening of methicillin-resistant Staphylococcus aureus carriage by culture or by rapid PCR test? Clinical Microbiology and Infection, 18(2): p. E31-E33. [Crossref]
  20. Huang, S.S., et al., (2013) Targeted versus universal decolonization to prevent ICU infection. N Engl J Med, 368(24): p. 2255–65. [Crossref]
  21. Hernandez-Porto, M., et al., (2014) Risk factors for development of methicillin-resistant Staphylococcus aureus-positive clinical culture in nasal carriers after decolonization treatment. Am J Infect Control, 42(7): p. e75–9. [Crossref]
  22. Humphreys, H., et al., (2016) Staphylococcus aureus and surgical site infections: benefits of screening and decolonization before surgery. J Hosp Infect, 94(3): p. 295–304. [Crossref]
  23. Baratz, M.D., et al., (2015) Twenty Percent of Patients May Remain Colonized With Methicillin-resistant Staphylococcus aureus Despite a Decolonization Protocol in Patients Undergoing Elective Total Joint Arthroplasty. Clin Orthop Relat Res, 473(7): p. 2283–90. [Crossref]
  24. Denis, O., et al., (2006) In vitro activities of ceftobiprole, tigecycline, daptomycin, and 19 other antimicrobials against methicillin-resistant Staphylococcus aureus strains from a national survey of Belgian hospitals. Antimicrob Agents Chemother, 50(8): p. 2680–5. [Crossref]
  25. de Wouters, S., et al., (2015) Selective Methicillin-Resistant Staphylococcus Aureus (MRSA) screening of a high risk population does not adequately detect MRSA carriers within a country with low MRSA prevalence. Acta Orthop Belg, 81(4): p. 620–8. [Crossref]

Acceptability and Accuracy of Cervical Cancer Screening Using a Self-Collected Veil for HPV DNA Testing by Multiplex Real-Time PCR among Adult Women in sub- Saharan Africa

DOI: 10.31038/JCRM.2019253

Abstract

The cross-sectional GYNAUTO-CHAD study compared the acceptability and HPV DNA diagnostic accuracy of clinician-collected endocervical sample with swab (as reference collection) and genital self-collection method with a veil (V-Veil-Up Gyn Collection Device, V-Veil-Up Pharma Ltd., Nicosia, Cyprus) in adult African women. Five of the 10 districts of N’Djamena were randomly selected for inclusion. Peer educators contacted adult women in in community churches and mosques or women association networks to participate to the survey and to come to the clinic for women’s sexual health “La Renaissance Plus”. A clinician performed a pelvic examination and obtained an endocervical specimen using flocked swab. Genital secretions were also obtained by self-collection using veil. Both clinician- and self-collected specimens were tested for HPV and HR-HPV DNA using multiplex real-time PCR. Acceptability of both collection methods was assessed; test positivity was compared by assessing methods agreement, sensitivity and specificity. A total of 253 women (mean age, 35.0 years) was prospectively enrolled. The prevalence of HPV infection was 22.9%, including 68.9% of high risk-HPV (HR-HPV), with unusual HR-HPV genotypes distribution and preponderance (≈70%) of HR-HPV targeted by Gardasil-9® vaccine. Veil-based genital self-collection showed high acceptability (96%), feasibility and satisfaction. Self-collection by veil was non-inferior to clinician-based collection for HR-HPV DNA molecular testing, with “good” agreement between both methods, high sensitivity (95.0%; 95%CI: 88.3–100.0%) and specificity (88.2%; 95%CI: 83.9–92.6%). Remarkably, the rates of HPV DNA and HR-HPV DNA positivity were significantly higher (1.67- and 1.57- fold, respectively) when using veil-based collected genital secretions than clinician-collected cervical secretions by swab. In conclusion, self-collection of genital secretions using the V-Veil-Up Gyn Collection Device constitutes a simple, highly acceptable and powerful tool to collect genital secretions for further molecular testing and screening of oncogenic HR-HPV that could be easily implemented in the national cervical cancer prevention program in Chad.

Keywords

Cervical cancer; HPV detection and genotyping; Self-collection; Clinician-collection; Veil; Sub-Saharan Africa

Introduction

High risk-human papillomavirus (HR-HPV) genotypes are responsible for 7.7% of all cancers in developing countries [1–3]. In sub-Saharan Africa, cervical cancer associated with persistent cervical HR-HPV infection is become the most common cancer in women in many countries, with more than 75,000 new cases and nearly 50,000 deaths registered each year [4–8]. Cervical cancer is a potentially preventable disease, including primary prevention with HPV prophylactic vaccination for women early before the first sexual intercourse, and secondary prevention mainly based on early molecular detection of cervical HR-HPV and cervical smear with Pap test for cytology [7,10]. In order to increase the coverage of screening programs in resource-limited countries, self-sampling of genital samples intended for molecular testing constitutes a promising alternative to Pap smear screening [11–17]. Self-sampling may be easily carry out individually by women at home without special medical qualification and special assistance [18, 19], and allows women to preserve their intimacy [13, 20, 21]. Molecular detection of HR-HPV using self-collected genital secretions (collected at home or at health care center) has proven to be nearly as sensitive as molecular screening performed on samples collected by clinician in specialized health care facility [12, 22–31]. In the African context, self-sampling of genital secretions was generally well accepted and easily feasible [12–14, 16, 17, 30, 32–36], and it may furthermore facilitate the screening of cervical cancer in remote populations far from large health care centers [21, 34–37]. Finally, self-sampling may be especially valuable as an alternative method of cervical cancer screening as a method to enroll women who otherwise would not participate in population-based cervical cancer screening [17], and particularly in resources-constrained areas [10, 28]. Chad is a country of around 15 million people, including more than 3 million women aged more than 25 years [38, 39]. In 2016, Mortier and colleagues reported that HIV-infected Chadian women were at high-risk for low and high-grade cervical lesions, suggesting unsuspected high burden of cervical HPV infection in Chad [40], as further reported in the capital city N’Djamena [41]. However, cervical cancer prevention in Chad remains largely insufficient [40, 42–44]. We recently demonstrated in Chadian women that a novel genital veil (V-Veil-Up Gyn Collection Device, V-Veil-Up Pharma Ltd., Nicosia, Cyprus) constitutes a useful self-collection device to collect female genital secretions for accurate molecular detection of genital bacterial sexually transmitted infections (STIs) [45]. Finally, the main objective of the present study was to assess the acceptability, feasibility and accuracy of the self-sampling V-Veil-Up Gyn Collection Device in adult women living in Chad to collect genital secretions for diagnosing HPV infections by multiplex real-time PCR.

Materials and methods

Study design

The cross-sectional GYNAUTO-CHAD study compared the acceptability and HPV DNA diagnostic accuracy of a clinician-collected endocervical sample with swab and a cervicovaginal self-collection method with veil device in adult women living in N’Djamena, Chad, recruited from the community. The 2015 Standards for Reporting of Diagnostic Accuracy (STARD) guidelines were used for reporting the study [46, 47].

Enrolment and selection criteria

Adult asymptomatic women were recruited from the community after randomization of 5 districts selected out of the 10 districts of N’Djamena, as previously in extenso described [41,45]. After oral consent, the selected women were invited, with paid transportation, to come to the clinic “La Renaissance Plus”, N’Djamena, which is one of the main settings for women’s sexual health in Chad, and to participate in the study. Childbearing-aged and older women living in N’Djamena regularly attend the clinic “La Renaissance Plus” for gynecological examinations and for obstetrical services. The inclusion criteria were being a volunteer, having given signed informed consent, being aged between 25–65 years (consistent with current cervical cancer screening recommendations [7]), being sexually active, having no genital troubles at physical examination, being not menstruating, having no sexual intercourse for at least 48 hours (as recommended for HPV molecular testing in female genital secretions [48]) and having completed the questionnaire. Exclusion criteria included age less than 25 years and more than 65 years, having genital troubles, having menstruations, having recent sexual intercourse less than 48 hours, not willing to participate to the study or to answer the face-to-face questionnaire to collect data. Note that the menstrual cycle phases were not taken into account, since it has been previously demonstrated that they do not affect HPV detection in female genital secretions [49].

Clinical visit procedures and genital samples collection

The Figure 1 depicts the overview of the one-time clinical visit procedures of the GYNAUTO-CHAD study.Women eligible for the study were received by a medical staff (preferably nurse) who explained the progress of the step-by-step protocol and had them to sign the informed consent (Figure 1). After having signed the informed consent form, the selected women benefited from free HIV and hepatitis B (HBV) and C (HCV) testing, by multiplex HIV/HCV/HBsAg immunochromatographic rapid test (Biosynex, Strasbourg, France) [50], clinical services including gynecological examination, family planning counseling, STIs diagnosis, laboratory analysis when necessary and appropriate treatment for those suffering from gynecologic disorders, HIV or other genital infections. All women received an information session on HIV and STIs. At inclusion, a standardized interview was conducted at the clinic “La Renaissance Plus”, by experienced counselors, using a face-to-face questionnaire, to collect socio-demographic characteristics and behavioral data, including age, marital status, social occupation, education level, residence location in N’Djamena, history of STI, HIV status, birth control method, genital hygiene during menses, sexual behavioral characteristics such as the number of lifetime sexual partners and the age at first sexual intercourse, and assessment of knowledge regarding cervical cancer. In order to eliminate any possible bias of sampling method and timing, the participants were further randomly selected to collect the genital secretions by clinician-based swab sampling first, followed by the veil-based self-sampling after the nurse-training, or by the veil-based self-sampling first followed by the clinician-based swab sampling. Thus, after completion of the socio-demographic questionnaire, all the biological specimen were sampled and processed in the following order: i) Samples specific for each patient for medical exams according to the medical prescription following the consultation; ii) Endocervical swab collected by a doctor [Method 1] or self-collection of genital secretions using the V-Veil-Up Gyn Collection Device [Method 2] according to the randomization. The gold standard Method 1 was carried out by a doctor using a flocked swab (Copan Diagnostic Inc., California, USA). Briefly, after placing the speculum (without lubricant prior to insertion), the physician used the swab to perform cervical sampling by introducing it into the cervical canal and performing 5 rotations before being removed and immediately placed in its plastic container. The swab was then placed in the cold (ice pack).
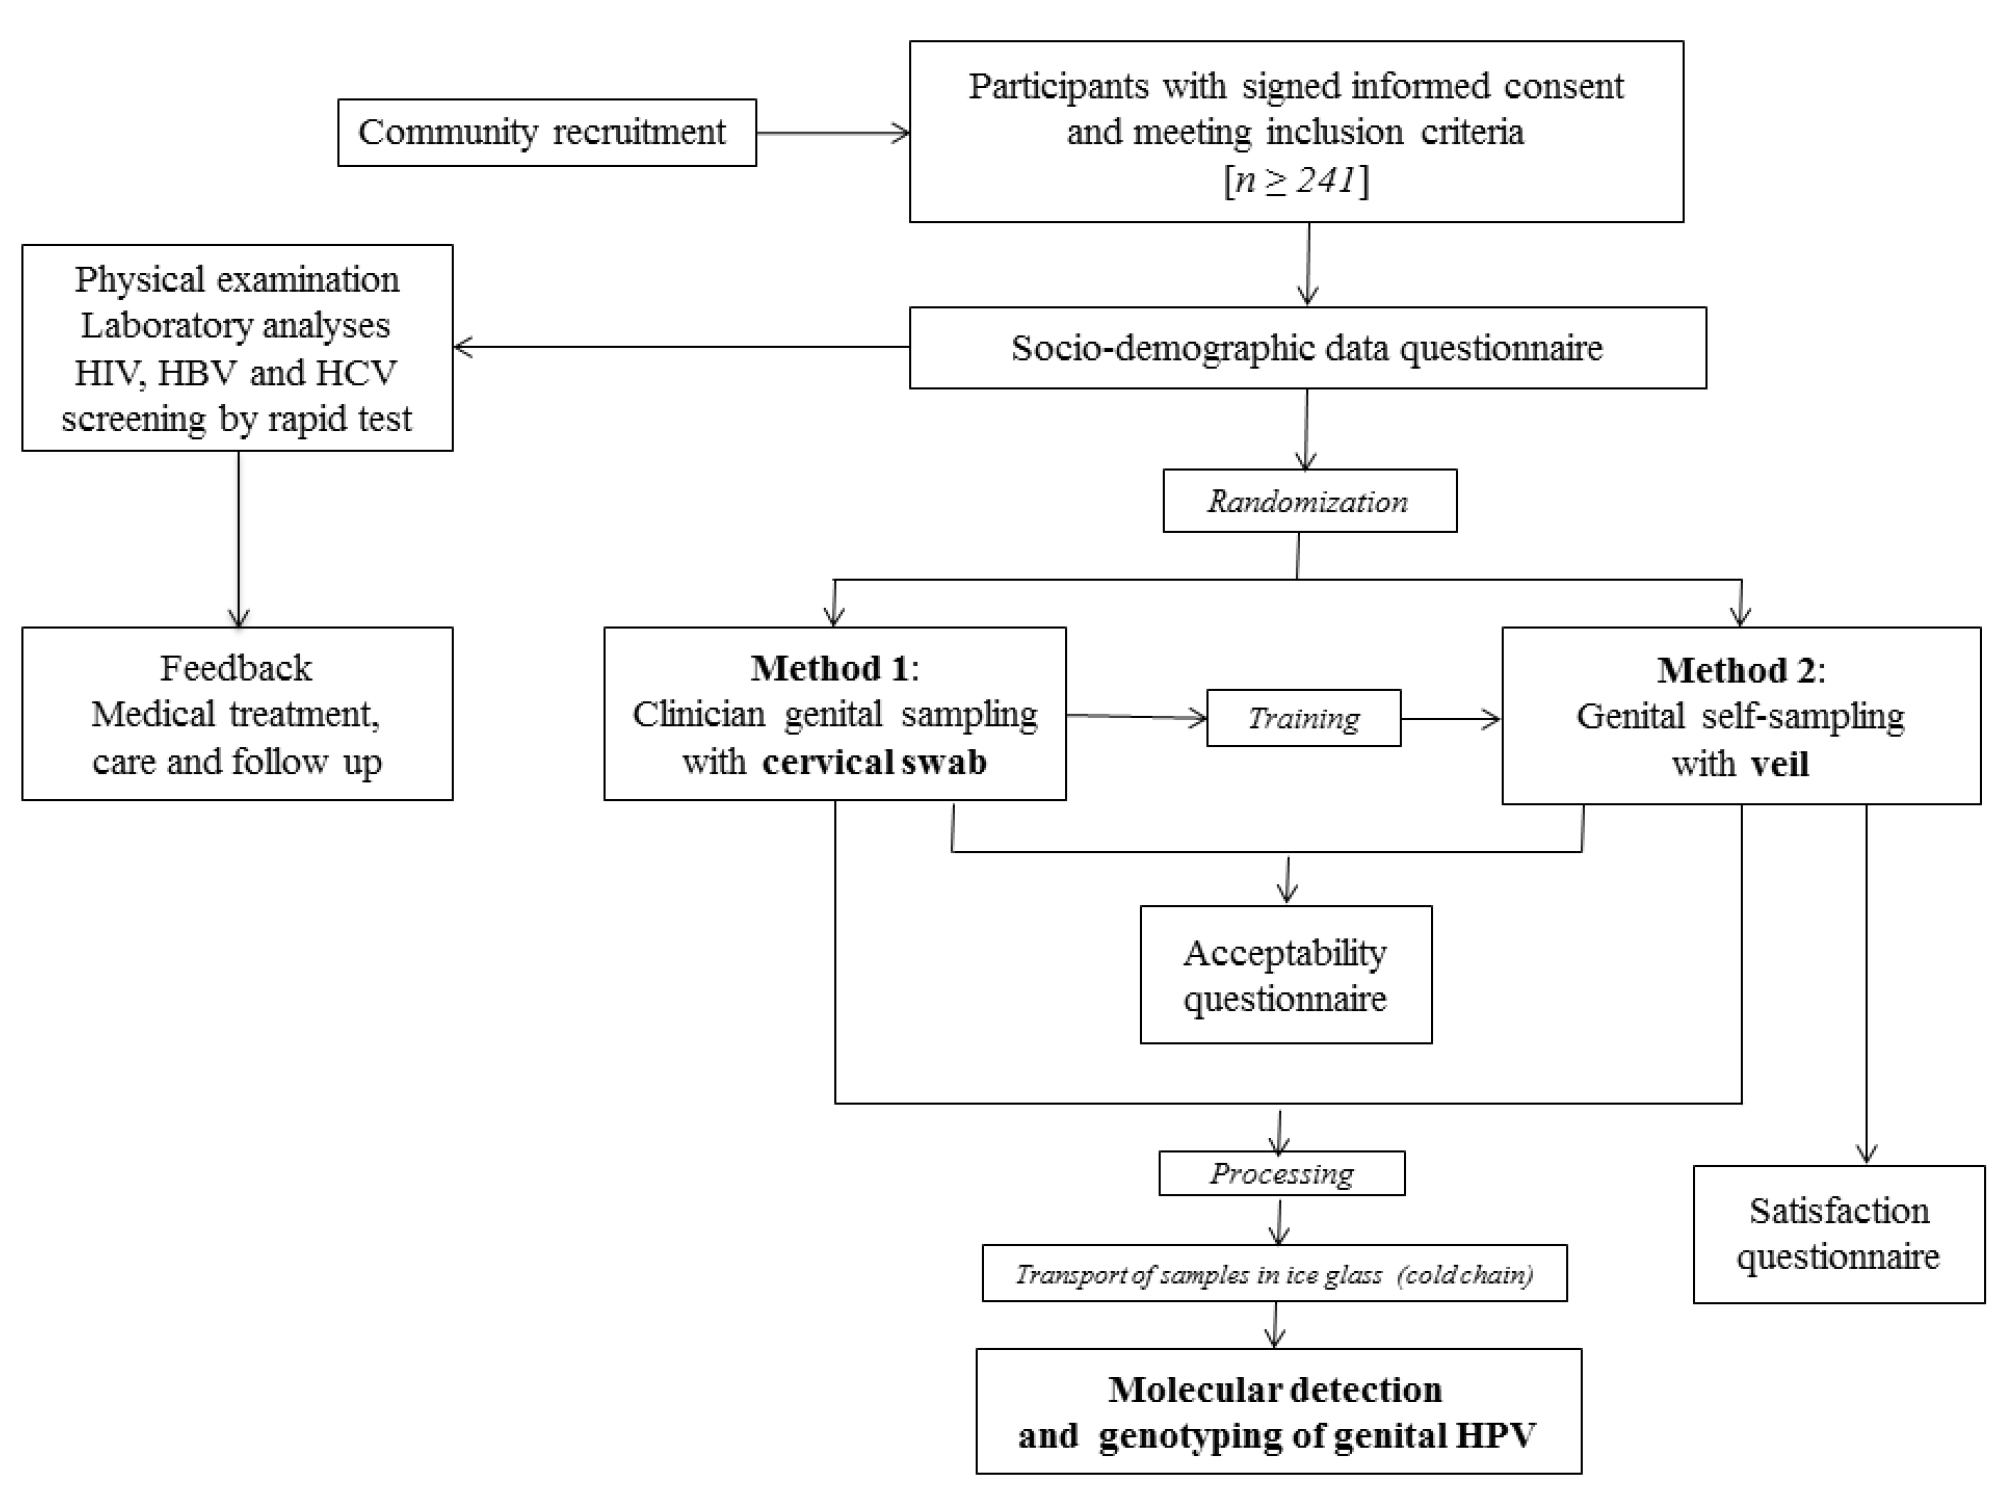
JCRM-2019_Bélec Laurent_F1

Figure 1. Flow diagram of the GYNAUTO-CHAD study. The GYNAUTO-CHAD study consisted in community-based recruitment of at least 261 adult women to be referred to the gynecologic clinic “La Renaissance Plus”, N’Djamena, Chad. The participants meeting the inclusion criteria were subjected to physical examination and care when needed, and tested for 3 chronic viral infections endemic in Chad (HIV, HBV and HCV) by capillary-based immunochromatographic rapid test, and filled in the face-to-face socio-demographic questionnaire. Afterwards, the participants were trained for self-sampling collection using the V-Veil-Up Gyn Collection Device (V-Veil-Up Pharma Ltd.) and randomly submitted to the sampling procedure with Method 1 (clinician-based collection of cervical secretions by swab, as gold standard) followed by the Method 2 (self-collection by veil) or inversely. The acceptability and satisfaction questionnaire were then administrated to the study women and collected samples were processed before molecular detection and genotyping of genital HPV infection.

For the self-collection Method 2, the study participant firstly received from a nurse a 15-minutes training on how to use the V-Veil-Up Gyn Collection Device for vaginal self-sampling, as previously reported [45]. After instructing the participant, the nurse leaved the sampling room and the participant then performed herself the self-sampling, without any help from the nurse. The participant followed the instructions for use of the V-Veil-Up Gyn Collection Device. Briefly, the study woman inserted the veil into her vagina, leaved it in-place for one hour; then removed it with the string, and returned it to the nurse. The study nurse did not witness veil insertion and removal. The nurse placed the veil impregnated with genital secretions into the dedicated collection box and closed it correctly with the cap. The veil collection box consisted of a 15 mL plastic box that contained 10 mL of phosphate-buffered saline (PBS) solution to prevent drying of the sample. The nurse verified that the PBS buffer completely submerged the veil and checked that the identification number in the label on the collection box corresponded effectively to the participant. The veil in its box was then placed in the cold (ice pack). After returning the veil specimen, a second nurse administered acceptability and satisfaction questionnaires on the woman’s experiences about the pelvic examination and clinician-based collection and the veil-based self-collection. To minimize bias, the study nurse who performed the pelvic examination was in another room and did not participate in the post-test questionnaire administration. The objectives of the acceptability questionnaire was to evaluate the study women’s experiences related to the perception of care, comfort, privacy, embarrassment, or pain associated to each collection method. The satisfaction questionnaire consisted in questions regarding the ability to understand the instructions for use of the V-Veil-Up Gyn Collection Device and its component and to perform self-collection, including home collection, and also assessed difficulties encountered during veil-collection.

Genital samples processing

Each genital sample was transported in ice packs within an hour after collection to be stored at -80°C at the virology laboratory of the hôpital Général de Référence Nationale, N’Djamena, Chad. Swabs and veils were further transported in frozen ice packs to the virology laboratory of the hôpital Européen Georges Pompidou, Paris, France, for molecular analyses.

Nucleic acid extraction

DNA was extracted from the tip of swab specimens using the DNeasyBlood and Tissue kit (Qiagen, Hilden, Germany), as recommended by the manufacturer. After extraction, DNA was concentrated in 100 μL of the elution buffer provided in the extraction kit and stored at -80°C before HPV DNA detection and genotyping, as described previously [51]. Veil samples soaked with genital secretions within PBS buffer were carefully removed from their collection box and placed into a syringe to be drained by pulling the syringe’s plunger into a 15 mL tube. The whole genital secretions were then vigorously vortexed to homogenize the fluids and finally aliquoted in 1.5 mL cryotubes (Eppendorf, Hambourg, Germany) and store at -80°C before the nucleic acid extraction procedure. In order to avoid any contamination between different specimens, the working area was sterilized between the processing of each specimen and all the consumables including gloves, syringe, forceps were for single use and were immediately discarded together with the box container. Finally, the nucleic acid extraction procedure was carried out with the DNeasy Blood and Tissue kit (Qiagen), in 1 mL of the concentrated cervicovaginal veil-collected specimen and extracted DNA was placed in 100 μL of the elution buffer provided in the extraction kit and stored at -80°C before HPV DNA detection and genotyping.

HPV detection and genotyping

HPV detection and genotyping was performed on both the clinician- and self- collected specimens using the CE IVD-marked multiplex real-time PCR assay Anyplex™ II HPV28 (Seegene, Seoul, South Korea), as described previously [52]. The kit contains specific primers targeting 28 HPV, and is based on Seegene’s proprietary DPO™ and MuDT™ technologies [53], which allow to avoid mismatch priming and to quantify each target in a single fluorescence channel, respectively. According to the HPV classification nomenclature provided by the International Agency for Research on Cancer (IARC) [54] Anyplex™ II HPV28 technology allows to detect 28 HPV genotypes in a single specimen, including 13 high-risk types (HR-HPV -16, -18, -31, -33, -35, -39, -45, -51, -52, -56, -58, -59, and -68), 9 low-risk (LR) types (LR-HPV -6, -11, -40, -42, -43, -44,-53, -54 and -70) and then, 6 genotypes classified as possibly carcinogenic (HPV-26, -61, -66, -69, -73 and -82). Briefly, 5µL of swab- or veil- extracted DNA were added into two reaction mixtures (20 µL) containing each other, one of the primers sets A and B [52]. The DNA amplification and the genotyping process were carried out in 2 reactions performed on the CFX96™ real-time PCR instrument (Bio-Rad, Marnes-la-Coquette, France) [52]. The Anyplex™ II HPV28 genotyping test has been found to be suitable for HPV detection and genotyping in cervical secretions [52, 55–58]. Data recording and interpretation were automated with Seegene viewer software (Seegene), according to the manufacturer’s instructions. A sample was considered positive for any HPV if containing any of the 28 types targeted by the Anyplex™ II HPV28 detection test; positive for multiple HPV when containing at least 2 types of the 28 HPV types included in genotypic test; HR-HPV positive and multiple HR-HPV positive when containing respectively at least 1 HR-HPV type and at least 2 high-risk types belonging to the 13 high-risk types targeted by the Anyplex™ II HPV28 detection test, irrespective of the presence of LR-HPV. The virology laboratory was accredited in 2013 by the Comité Français d’Accréditation (COFRAC) according to the ISO 15189 norma for the biological markers “HPV detection” and “HPV genotyping”.

Sample size

We hypothesized that Method 2 (self-sampling) would be non-inferior to Method 1 (flocked swab as gold standard), with a tolerated difference of Δ in the detection rate of HPV infections by molecular analysis between the two methods of collection. The requested minimum number (n) of subject to include was obtained by using Epi Info version 3.5.4 (CDC, Atlanta, USA), and by setting 95% confidence level, 80% statistical power, and considering estimated HPV prevalence of two methods in Chad. There are no data on the prevalence of genital HPV infections among women living in the Chad. In order to estimate the HPV DNA positivity in our study population, we used prevalences of genital HPV detection from comparable populations of women living in other Central African countries previously published in the literature, including 12.5% in Democratic Republic of the Congo [59], 18.5% and 34.0% in Cameroon [60, 61], and 22.2% in Rwanda [62]. Based on this assumption, we estimated the mean prevalence (P1) of HPV DNA test results to be 21.7% in the clinician-collected arm. We conducted a non-inferiority comparison with the hypothesis that the difference in HPV DNA positivity between the veil-based self-collection and clinician-collection methods would be less than 10%. With Δ of 10%, the requested minimum number (n) of subject to include was at least 241 participants.

Statistical analyses

Data was entered into an Excel database and analyzed using IBM® SPSS® Statistics 20 software (IBM, SPSS Inc, Armonk, New York, USA). Means and standard deviations (SD) were calculated for quantitative variables and proportions for categorical variables. The results were presented along with their 95% confidence interval (CI) using the Wilson score bounds for categorical variables. The overall prevalences of HPV DNA detection [any genotypes, HR-genotypes and HPV genotypes targeted by the 9-valent Gardasil-9® vaccine (Merck & Co. Inc., New Jersey, USA)] between the two collection methods were compared using the Mac Nemar’s test for paired data. The Wilcoxon’s test of paired data was used for comparison of the mean notes according to the Likert scale of acceptability of the two methods (veil-based self-collection versus swab-based clinician-collection). The agreement between the two collection methods was estimated by Cohen’s κ coefficient, and the degree of agreement was determined as ranked by Landlis and Koch [63]. Percent agreement corresponded to the observed proportion of identical results between veil-based self-collection compared to swab-based clinician-collection. Note that the acceptability of the clinician-based collection by swab and that of the veil self-collection were assessed using an arbitrary quantitative Likert scale [64] based on four different scale ranging from 1 (most difficult), 2 (difficult), 3 (easy) to 4 (= very easy or comfortable). Similarly, the satisfaction regarding the veil self-collection method was assessed using another arbitrary quantitative Likert scale based on four different scale ranging from 1 (less favorable), 2 (moderately favorable), 3 (favorable) to 4 (= most favorable). The mean and standard deviation for Likert scale data were calculated for each acceptability and satisfaction item using face-to-face questionnaires. The clinician-collected HPV DNA test results were used as the reference standard to estimate the sensitivity and specificity, with corresponding 95%CI, of the veil-collection method.

Results

Characteristics of study population

A total of 271 women from the 23 inclusion sites accepted to participate to the study, as previously reported [41,45] (Figure 2). After physical examination, 18 women were excluded because of genital troubles (vaginal discharge: 5; suspicion of STI: 3; genital bleeding: 5; sexual intercourse less than 2 days: 5). Finally, a total of 253 women (mean age, 35.0 years; range, 25–65) referred to the clinic “La Renaissance Plus” were consecutively and prospectively included in the study. Their socio-demographic characteristics, past history of STIs, sexual behavior, contraception and practices of feminine hygiene during menstruation and genital toilet have previously reported [45]. Using multiplex HIV/HCV/HBsAg rapid test, 9 study women (3.5%; 95% CI: 1.3–5.8) were infected by HIV-1, 19 (7.5%; 95% CI: 4.3–10.8) by HBV (positivity for HBsAg) and 8 (3.2%; 95% CI: 1.1–5.3) were seropositive for HCV. Most women (31.6%; 95% CI: 25.9–37.4) were young, aged from 25 to 29 years, engaged in life couple with a male partner (78.3%; 95% CI: 73.2–83.3), with a relatively high education level (32.1%; 95% CI: 26.3–37.7 and 30.4%; 95% CI: 24.7–36.1, in high school level and university, respectively); but most of them were unemployed (54.2%; 95% CI: 48.1–60.3). The majority of study women (82.2%; 95% CI: 77.5–86.9) reported having only one regular sexual partner in their life, while about 20% reported to have had up to 5 different sexual partners. Generally, the study women began sexual activity at 16 to 20 years (56.2%; 95% CI: 50.1–62.3), whereas some of them (13.8%; 95% CI: 9.6–18.1) started their sexual life earlier, before the age of 16 years. The vast majority of women (74.4%) did not take any birth control methods. Concerning the feminine hygiene during menstruation, most women (90.3%) were using sanitary napkins, while a minority (13.0%) used commercially available tampons. Genital (vulva or vagina) toilet was the rule, including post-coital toilet with water and finger in 90.3%. Finally, none of the women included in the GYNAUTO-CHAD study had ever been screened for cervical cancer and nor vaccinated against HPV infection.
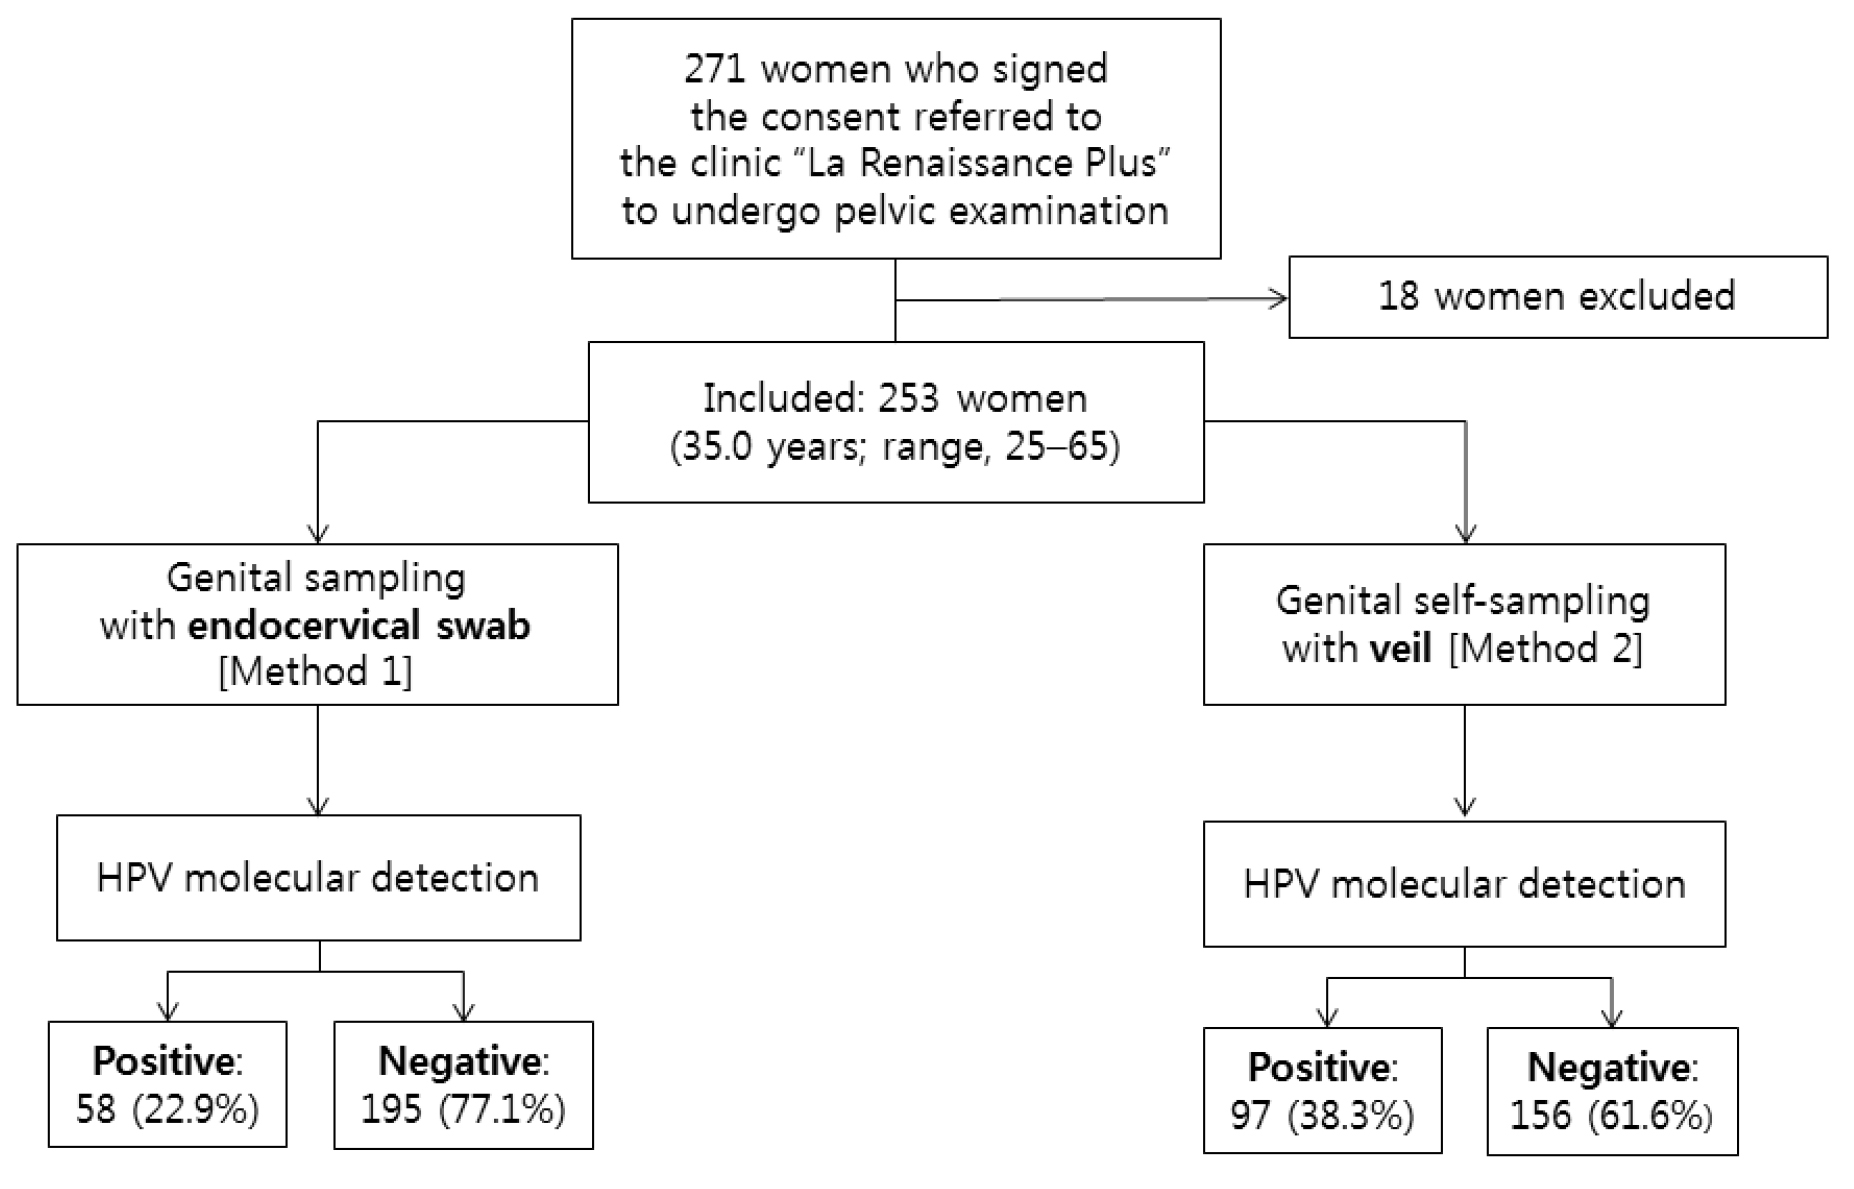
JCRM-2019_Bélec Laurent_F2

Figure 2. Flow diagram of study recruitment, specimen collection, and HPV test results by multiplex real-time PCR.

Acceptability of collection methods

Participants reported feeling much better cared for during the veil-based self-collection (mean note of 3.1 according to the Likert scale of acceptability) compared to swab-based clinician-collection (mean note of 1.4; P < 0.02) and also more in privacy handled during self-collection (mean note of 3.1) compared to clinician-collection (mean note of 1.4; P < 0.005) (Table 1). There were no other significant differences in embarrassment, discomfort or genital pain between the two collection methods (Table 1). When asked to choose one collection method, 243 (96.0%) of study women responded that they would prefer the self-collection method. Furthermore, most participants (237; 89.7%) reported that they would be willing to perform veil-collection at home and bring the specimen with them to clinic.

Table 1. Acceptability of veil-based self-sampling using the V-Veil-Up Gyn Collection Device (V-Veil-Up Pharma Ltd.) compared to swab-based clinician-collection for HPV DNA testing among 253 study women living in N’Djamena, Chad.

Acceptability items*

Veil-based self-collection [mean (SD)]

Swab-based clinician-collection [mean (SD)]

P-value**

How well cared for did you feel?

3.1 (0.8)

1.4 (0.5)

0.011

How well was your privacy handled during the test?

3.1 (0.5)

1.4 (0.5)

0.003

Did you feel embarrassed?

3.3 (1.2)

3.1 (1.4)

0.835

Did the test cause you any genital discomfort?

3.1 (1.3)

3.1 (1.2)

1.000

Did the test cause you any genital pain?

2.9 (1.4)

2.5 (1.4)

0.700

* The scale of acceptability was assessed by a Likert scale ranging from 1 (most difficult) to 4 (= most favorable); the results are mean ± 1 standard deviation (SD);

** Statistical comparisons were assessed by Wilcoxon’s test for paired data.

Satisfaction of self-sampling using the V-Veil-Up Gyn Collection Device

The results of the face-to-face satisfaction questionnaire regarding veil-based self-sampling using the V-Veil-Up Gyn Collection Device are shown in the Table 2. In addition, most women (231; 91.3%) reported that the instructions for use written in French were easy to read and to understand, while the verbal explanations on how to use the collection device showed higher mean note according to the Likert scale of satisfaction (written versus oral explanation: 2.9/4 and 3.6/4, respectively). A significant number of participants (76; 30.0%) reported difficulties in correctly interpreting schemas. The large majority of women (245; 96.8%) were able to recognize correctly the component’s device, with high notes (3.6/4). In addition, the veil was generally (243; 97.6%) correctly placed with the applicator and removed with the string. Difficulties on understanding how to place the veil deep within the vaginal cavity were frequently encountered in one-third of participants (86; 33.9%) with a low mean note of 0.9/4. All items concerning the general satisfaction of the V-Veil-Up Gyn Collection Device showed high mean notes from 2.9 to 3.3. Discomfort when carrying the veil concerned only urges to urinate. Genital pain when placing or wearing the veil was reported in a minority of women (10; 3.9%), all being more than 45 years-old. Finally, only 12 (4.7%) women reported some difficulties with performing the self-collection.

Table 2. Satisfaction questionnaire regarding veil-based self-sampling using the V-Veil-Up Gyn Collection Device (V-Veil-Up Pharma Ltd.) among 253 study women living in N’Djamena, Chad.

Variables*

Veil-based

self-collection

[mean (SD)]

95%CI

Understanding of instruction for use

Instruction for use in French language

2.9 (1.1)

[2.7-3.0]

Verbal explanation of instruction for use

3.6 (0.5)

[3.5-3.7]

Anatomic sketches

2.4 (1.1)

[2.2-2.5]

Understanding of component’s device

Device has three components (veil ; applicator and string)

3.6 (0.4)

[3.6-3.7]

Veil includes pocket for drug or cream

3.6 (0.5)

[3.6-3.7]

Correct use of the veil

Applicator to be placed in the pocket

3.7 (0.5)

[3.6-3.7]

String to be used to remove the veil after use

3.8 (0.4)

[3.8-3.7]

Place the veil deep within the vaginal cavity

0.9 (0.1)

[0.9-1.0]

General satisfaction

Keeping the veil into the vagina for 60 minutes

3.1 (0.8)

[3.0-3.2]

Removing the veil impregnated with genital secretions with the string

3.3 (0.7)

[3.2-3.4]

Comfort when carrying the veil

3.3 (1.2)

[3.2-3.5]

Genital pain when placing or wearing the veil

2.9 (1.4)

[2.7-3.1]

General opinion about veil-based self-sampling

3.1 (0.5)

[3.0-3.1]

* The scale of satisfaction was asses by a Likert scale ranging from 1 (= less favorable) to 4 (= most favorable); the results are mean ± 1 standard deviation (SD); 95% confidence intervals (CI) are given in brackets.

Prevalences of HPV detection and genotypes distribution by collection methods

All 253 study participants had paired clinician-collected and self-collected specimens obtained for laboratory testing. All secretions from swab and veil specimens were positive for the ubiquitous b-globin gene, used as internal control of cell sampling of the Anyplex™ II HPV28 kit. Results from each of the collection method are presented in Tables 3, 4, 5 and 6 and in Figures 3, 4 and 5. Of the clinician-collected specimens included in the analysis, 58 women were positive for genital HPV DNA giving a total HPV prevalence of 22.9% (95% CI: 17.8–28.1), with 68.9% (40/58; 95% CI: 57.1–80.8) harboring cervical HR-HPV infection, providing a total HR-HPV prevalence of 15.8% (95% CI%: 11.3–20.3), as shown in the Table 3. The whole distribution of HPV genotypes in HPV-DNA positive cervical samples is detailed in the Figure 3. The Gardasil-9® vaccine HR-HPV type 58 was the predominant genotype (7/58; 12.1%), followed by the HR-HPV types 31, 35 and 56 and the LR-HPV types 42 and 44 with a prevalence of 10.3% (6/58). The 9-valent vaccine HR-HPV types 16, 45 and 52 and also the LR-HPV types 53 and 70 were present [prevalence of 8.6% (5/58)]. These HPV genotypes were followed by the HR-HPV types 18 and 51, 59 and 68 and the LR-HPV types 6 and 54 and finally the possibly oncogenic HPV types 73 and 82 with a prevalence of 6.8% (4/58). The HR-HPV-39 was present only in 3 women (5.2%) and none of the HPV positive samples was simultaneously positive for HPV-16 and HPV-18.
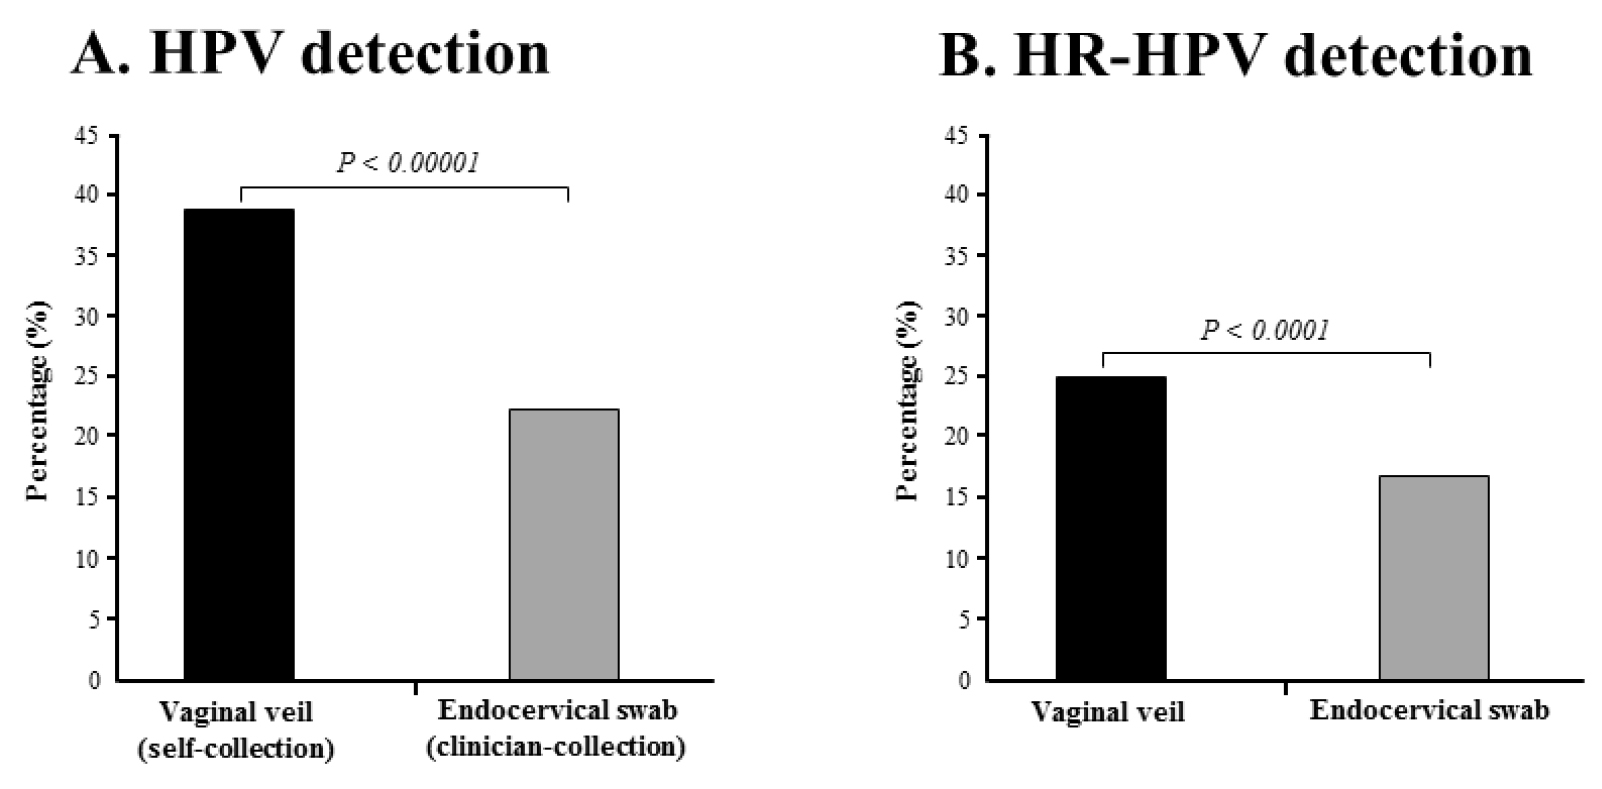
JCRM-2019_Bélec Laurent_F3

Figure 3. Percentages of detection by multiplex real-time PCR assay Anyplex™ II HPV28.
HPV DNA (A) and HR-HPV DNA (B) in paired genital secretions obtained by gold standard clinician-collected endocervical swab and by self-collection using the V-Veil-Up Gyn Collection Device (V-Veil-Up Pharma Ltd.) among 253 study women living in N’Djamena, Chad. P-values of the comparison between the two collection methods using the Mac Nemar’s test for paired data are indicate in italic.

Table 3. HPV DNA detection by clinician-collected swab and by self-collected veil among the 253 study adult women living in N’Djamena, in Chad, and included in GYNAUTO-TCHAD study.

Study women
(N=253)

Characteristics

n (%) [95%CI]*

HPV DNA detection using endocervical swab**

HPV DNA

58 (22.9) [17.8-28.1]

HR-HPV DNA

40 (15.8) [11.3-20.3]

Multiple types of any HPV among HPV-positive swabs

16 (27.6) [16.1–39.1]

Multiple types of HR-HPV among HR-HPV-positive swabs

10 (25.0) [11.6–38.4]

Any 9-valent vaccine types*** among HPV-positive swabs

29 (50.0) [37.1–62.9]

9-valent vaccine HR-HPV types among HR-HPV-positive swabs

27 (67.5) [52.9–82.1]

HPV DNA detection using self-collected veil****

HR-HPV DNA

97 (38.3) [32.4-44.3]

HR-HPV DNA

63 (24.9) [19.6-30.2]

Multiple types of any HPV among HPV-positive veils

42 (43.3) [33.4–53.2]

Multiple types of HR-HPV among HR-HPV-positive veils

16 (25.4) [14.6–36.2]

Any 9-valent vaccine types*** among HPV-positive veils

48 (49.5) [39.5–59.4]

9-valent vaccine HR-HPV types among HR-HPV-positive veils

43 (68.3) [56.8–79.7]

* The frequency of each variable is presented with their 95% confidence interval in brackets;

** HPV testing using endocervical secretions obtained by clinician-collected flocked swab;

*** The 9-valent Gardasil-9® vaccine (Merck & Co. Inc.) is effective against HPV genotypes 6, 11, 16, 18, 31, 33, 45, 52 and 58;

**** HPV testing using cervicovaginal fluid collected from self-administered veil (V-Veil-Up Gyn Collection Device, V-Veil-Up Pharma Ltd.) introduced within the vaginal canal during 60 minutes.

95%CI: 95% confidence interval; HBV: Hepatitis B virus; HCV: Hepatitis C virus; HIV: Human immunodeficiency virus; STI: Sexual transmitted infection; HPV: Human papillomavirus; HR-HPV: High-risk human papillomavirus: SD: Standard deviation.

Of the veil-based self-collected specimens included in the analysis, 97 women showed genital shedding of HPV DNA that represented an overall HPV prevalence of 38.3% (95% CI: 32.4–44.3). Among these HPV positive women, 64.9% [(63/97); 95% CI: 55.45–74.4] were positive for HR-HPV genotypes giving a total HR-HPV prevalence of 24.9% (95% CI: 19.6–30.2) (Table 3). The whole distribution of HPV genotypes in HPV-DNA positive cervical samples collected by veil is detailed in the Figure 3. The distribution of HPV genotypes in the HPV DNA-positive women revealed that the LR-HPV genotype 42 (13/97; 13.4%) was the predominant genotype, followed by the HPV54 (12/97; 12.4%), HPV70 (11/97; 11.3%). The Gardasil-9® vaccine HR-HPV type 58, 52 and 31 were the predominant HR-HPV genotypes (9/97; 9.3%), followed by HPV16 (8/97; 8.2%), HPV18, HPV35, HPV45 and HPV68 (7/97; 7.2%), HPV39 (5/97; 5.2%) and finally HPV33 (2/97; 2.1%). The percent agreements between the two collection methods to detect any HPV, HR-HPV and 9-valent vaccine HPV genotypes were 83.0%, 89.3% and 91.7%, respectively, and all Cohen’s κ coefficients were between 0.61 to 0.80, demonstrating “good” agreement [56] (Table 4).

Table 4. Two-by-two tables of cervicovaginal specimens self-collected using the V-Veil-Up Gyn Collection Device (V-Veil-Up Pharma Ltd.) compared to clinician-collected endocervical swab specimens for the detection by multiplex real-time PCR of any HPV genotypes, HR-HPV genotypes and HPV genotypes targeted by the 9-valent Gardasil-9® vaccine (Merck & Co. Inc.).

Any HPV genotypes

HR-HPV
genotypes

9-valent vaccine HPV genotypes

Clinician-collected
swab specimen

Clinician-collected
swab specimen

Clinician-collected
swab specimen

Positive
(n=58)

Negative
(n=195)

Positive
(n=40)

Negative
(n=213)

Positive
(n=29)

Negative
(n=224)

Veil-based self-collected specimen

Positive
(N*=97)

56

41

Positive
(N***=63)

38

25

Positive
(N$=48)

28

20

Negative
(N**=156)

2

154

Negative
(N****=190)

2

188

Negative
(N£=205)

1

204

Estimate

95% CI

Estimate

95% CI

Estimate

95% CI

Sensitivity (%)

96.5

91.8–100.0

95.0

88.3–100.0

96.5

89.8–100.0

Specificity (%)

78.9

73.3–84.7

88.2

83.9–92.6

91.1

87.3–94.8

Agreement (%)

83.0%

89.3%

91.7%

Cohen’s κ coefficientµ

0.611

0.675

0.682

* : Total number of veil based-self collected specimens positive for any HPV;

** : Total number of based-self collected specimens negative for any HPV;

*** : Total number of veil based-self collected specimens positive for HR-HPV;

**** : Total number of veil based-self collected specimens negative for HR-HPV;

$ : Total number of veil based-self collected specimens positive for any HPV genotypes targeted by the 9-valent Gardasil-9® vaccine (Merck & Co. Inc.) (HPV -6, -11, -16, -18, -31, -33, -45, -52 and -58);

£ : Total number of veil based-self collected specimens negative for any HPV genotypes targeted by the 9-valent Gardasil-9® vaccine;

µ : The Cohen’s k coefficient was interpreted according the Landis and Koch scale [56]: For k value 0, the agreement is considered to be less than what would be expected by chance; for º values 0.01 0.20, only a slight agreement is present; for º values 0.21 0.40, the agreement is considered to be fair; for º values 0.41 0.60, the agreement is said to be moderate; for º values 0.61 0.80, the agreement is considered good; and finally, for º values 0.81 0.99, the agreement is said to be almost perfect.

HPV: Human papillomavirus; HR-HPV: high-risk human papillomavirus.

Using clinician-collected swab as the reference collection method, the sensitivities and specificities of the self-collected veil to detect HPV, HR-HPV and 9-valent vaccine HPV genotypes were 96.5% (95% CI: 91.8 – 100.0%) and 78.9% (95% CI: 73.3 – 84.7%), 95.0% (95% CI: 88.3 – 100.0%) and 88.2% (95% CI: 83.9 – 92.6%), and 96.5% (95% CI: 89.8 – 100.0%) and 91.1% (95% CI: 87.3 – 94.8%), respectively (Table 4). Overall, the percentage of test positivity for HPV DNA was 1.67-fold higher in self-collected specimens than in clinician-collected specimens (38.3% versus 22.9%; P-value < 0.00001) (Figure 3A). The percentage of test positivity for HR-HPV DNA was 1.57-fold higher in self-collected specimens than in clinician-collected specimens (24.9% versus 15.8%; P-value < 0.0001) (Figure 3B). When considering the distribution of the 28 HPV genotypes detected by multiplex real-time PCR assay Anyplex™ II HPV28 detected in paired genital specimens, all genotypes but two (HPV-59 and HPV-82), were more frequently detected by self-collection using the V-Veil-Up Gyn Collection Device than by clinician-collected endocervical swab (Figure 4).
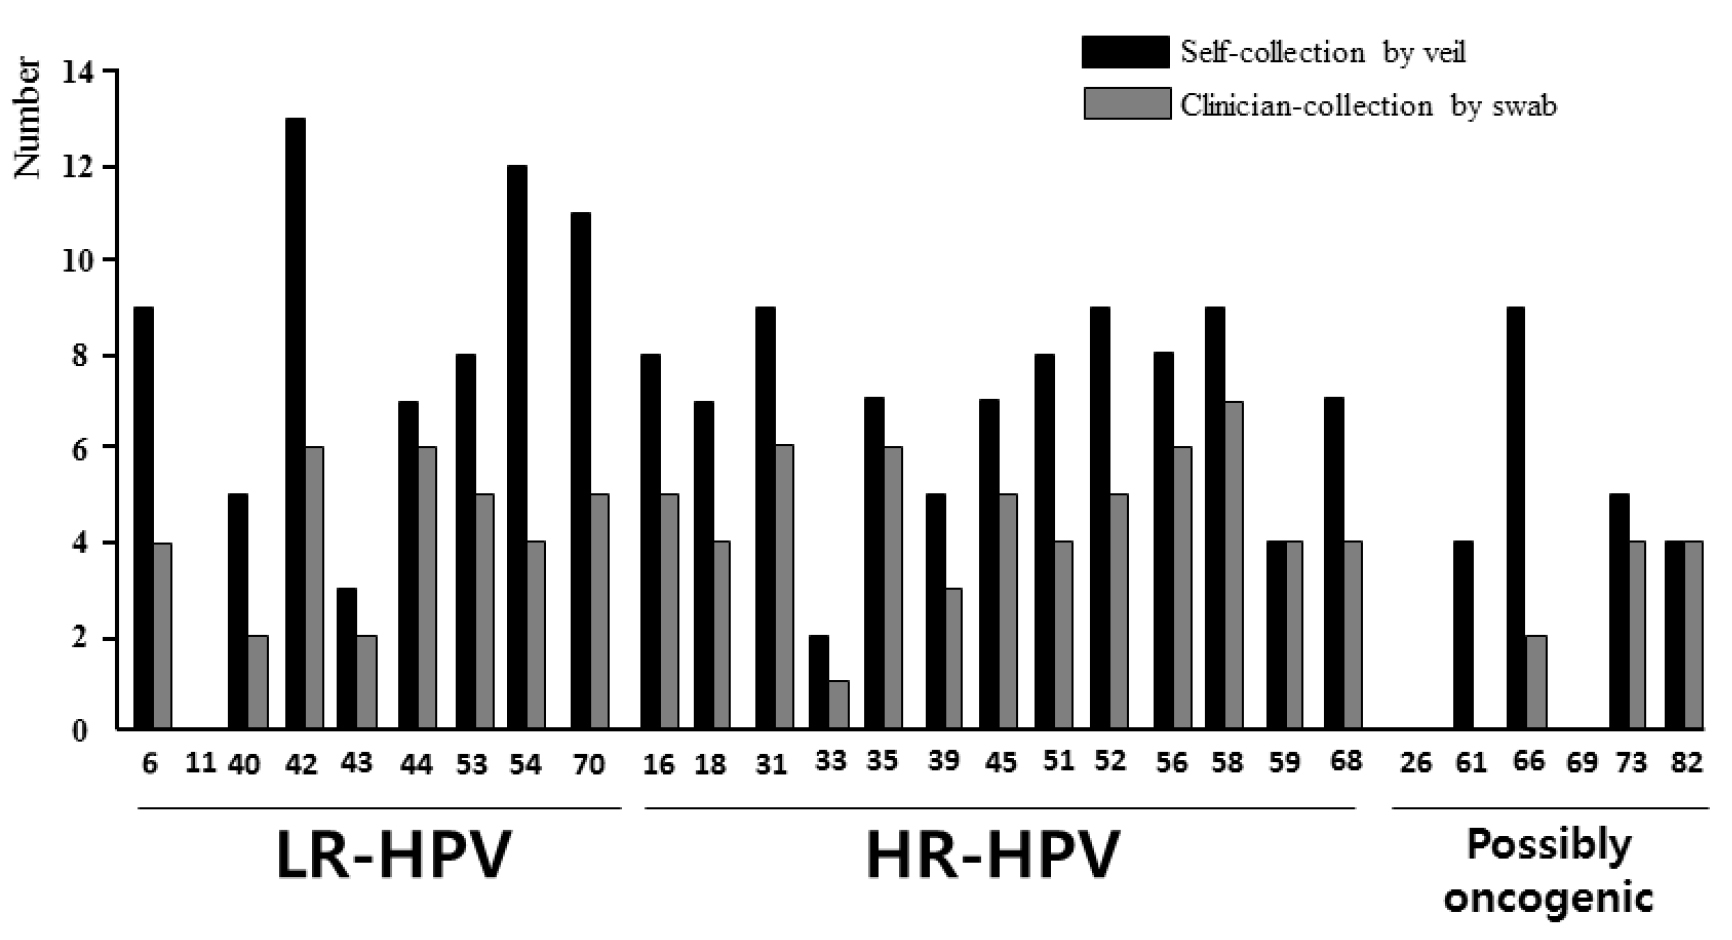
JCRM-2019_Bélec Laurent_F4

Figure 4. Distribution of the 28 HPV genotypes detected by multiplex real-time PCR assay Anyplex™ II HPV28.
The HPV DNA detection was carried out in paired genital secretions obtained by clinician-collected endocervical swab and by self-collection using the V-Veil-Up Gyn Collection Device (V-Veil-Up Pharma Ltd.) among 253 study women living in N’Djamena, Chad. LR-HPV: Low risk- human papillomavirus; HR-HPV: High-risk human papillomavirus.
The 28 HPV genotypes detected by the Anyplex™ II HPV28 kit include 9 low-risk types (LR-HPV), 13 high-risk types (HR-HPV) and 6 genotypes classified as possibly carcinogenic. The HPV genotypes -6, -11, -16, -18, -31, -33, -45, -52 and -58 which are targeted by the 9-valent Gardasil-9® vaccine (Merck & Co. Inc.) are highlighted in grey.

Among the 253 study participants, the mean numbers (± 1 SD) of HPV and HR-HPV detected when using the self-collected veil [1.84±0.96 (range, 1–10) and 1.43±0.64 (range, 1–5), respectively] were similar to those obtained when using the swab-collection [1.79±1.14 (range, 1–9) and 1.5±0.75 (range: 1–5), respectively]. The differential efficiency of detecting HPV and HR-HPV between the two collection methods was better evidenced when considering paired results by genotype. Thus, the correspondence between the 7,084 (=253 x 28) results obtained from the 253 paired swab-collected and veil-collected genital specimens to detect the 28 HPV genotypes included in Anyplex™ II HPV28 kit was further analyzed, genotype by genotype, and depicted in Table 5. The use of self-collection by veil allowed detecting 101 (84+17) additional HPV of all types by reference to the use of swab in 89 (35.2%) participants, while the use of swab allowed detecting only 7 additional HPV in 7 participants (2.8%) by comparison to the use of veil. When considering only the correspondence between the 3,289 (=253 × 13) paired results for oncogenic HR-HPV (Table 6), the use of veil allowed detecting 38 (34+4) additional HR-HPV in 35 (13.8%) study women, while the use of swab allowed detecting only 3 additional HPV in 3 participants (1.2%) by comparison to the use of veil. The Figure 5 depicts some relevant examples of paired results obtained by clinician-collected endocervical swab and self-collected veil using the multiplex real-time PCR assay Anyplex™ II HPV28, showing the capacity of the veil to allow the detection of oncogenic HR-HPV that could not be detected from the paired swab specimens. Finally, genital infections with multiple HPV genotypes were more frequently detected using the veil collection device than swab collection [43.3% (42/97); 95% CI: 33.4–53.2 versus 27.6% (16/58); 95% CI: 16.1–39.1; P < 0.001], while the mean number of HR-HPV detected using positive genital secretions collected by veil was quite similar to that of cervical secretions collected by swab [1.7 HR-HPV genotypes (range, 1 to 5) versus 2.3 HR-HPV (range, 1 to 5)].

Table 5. Correspondence between the 7,084 (= 253 × 28) results obtained from the 253 paired swab-collected and veil-collected genital specimens to detect the 28 HPV genotypes included in Anyplex™ II HPV28 kit (Seegene).

LR-HPV

HR-HPV

Possibly oncogenic

6

11

40

42

43

44

53

54

70

16

18

31

33

35

39

45

51

52

56

58

59

68

26

61

66

69

73

82

Swab

Veil

Number of cases per genotype

Total

Negative

Negative

244

253

248

240

248

244

245

241

242

244

246

244

250

246

248

246

245

244

244

244

249

245

253

249

244

253

248

249

6,891

Positive

Positive with same genotype*

4

0

2

6

0

4

5

4

5

4

4

6

0

6

3

5

4

5

6

7

4

3

0

0

2

0

4

4

97

Positive

Positive with different genotypes **,a

0

0

0

0

1b

2c

0

0

0

0

0

0

1d

0

0

0

0

0

0

0

0

0

0

0

0

0

0

0

4

Negative

Positive

5

0

3

7

3

3

3

8

6

4

3

3

2

1

2

2

4

4

3

2

0

4

0

4

7

0

1

0

84

Positive

Negative

0

0

0

0

2

2

0

0

0

1

0

0

1

0

0

0

0

0

0

0

0

1

0

0

0

0

0

0

7

* i.e., positivity using veil for the same HR-HPV genotype using swab;

** i.e., positivity using veil for at least one another HR-HPV genotype using swab;

a A total of 17 additional HPV genotypes were detected using veil collection;

b Additional HPV genotypes detected using veil collection were HPV -16, -52, -53, -54, -70 and -73;

c Additional HPV genotypes detected using veil collection were HPV -43 and -54;

d Additional HPV genotypes detected using veil collection were HPV -6, -31, -43, -51, -54, -59, -66, -68 and -66.

NA: Not attributable; HPV: Human papillomavirus; HR-HPV: high-risk human papillomavirus; LR-HPV: low-risk human papillomavirus.
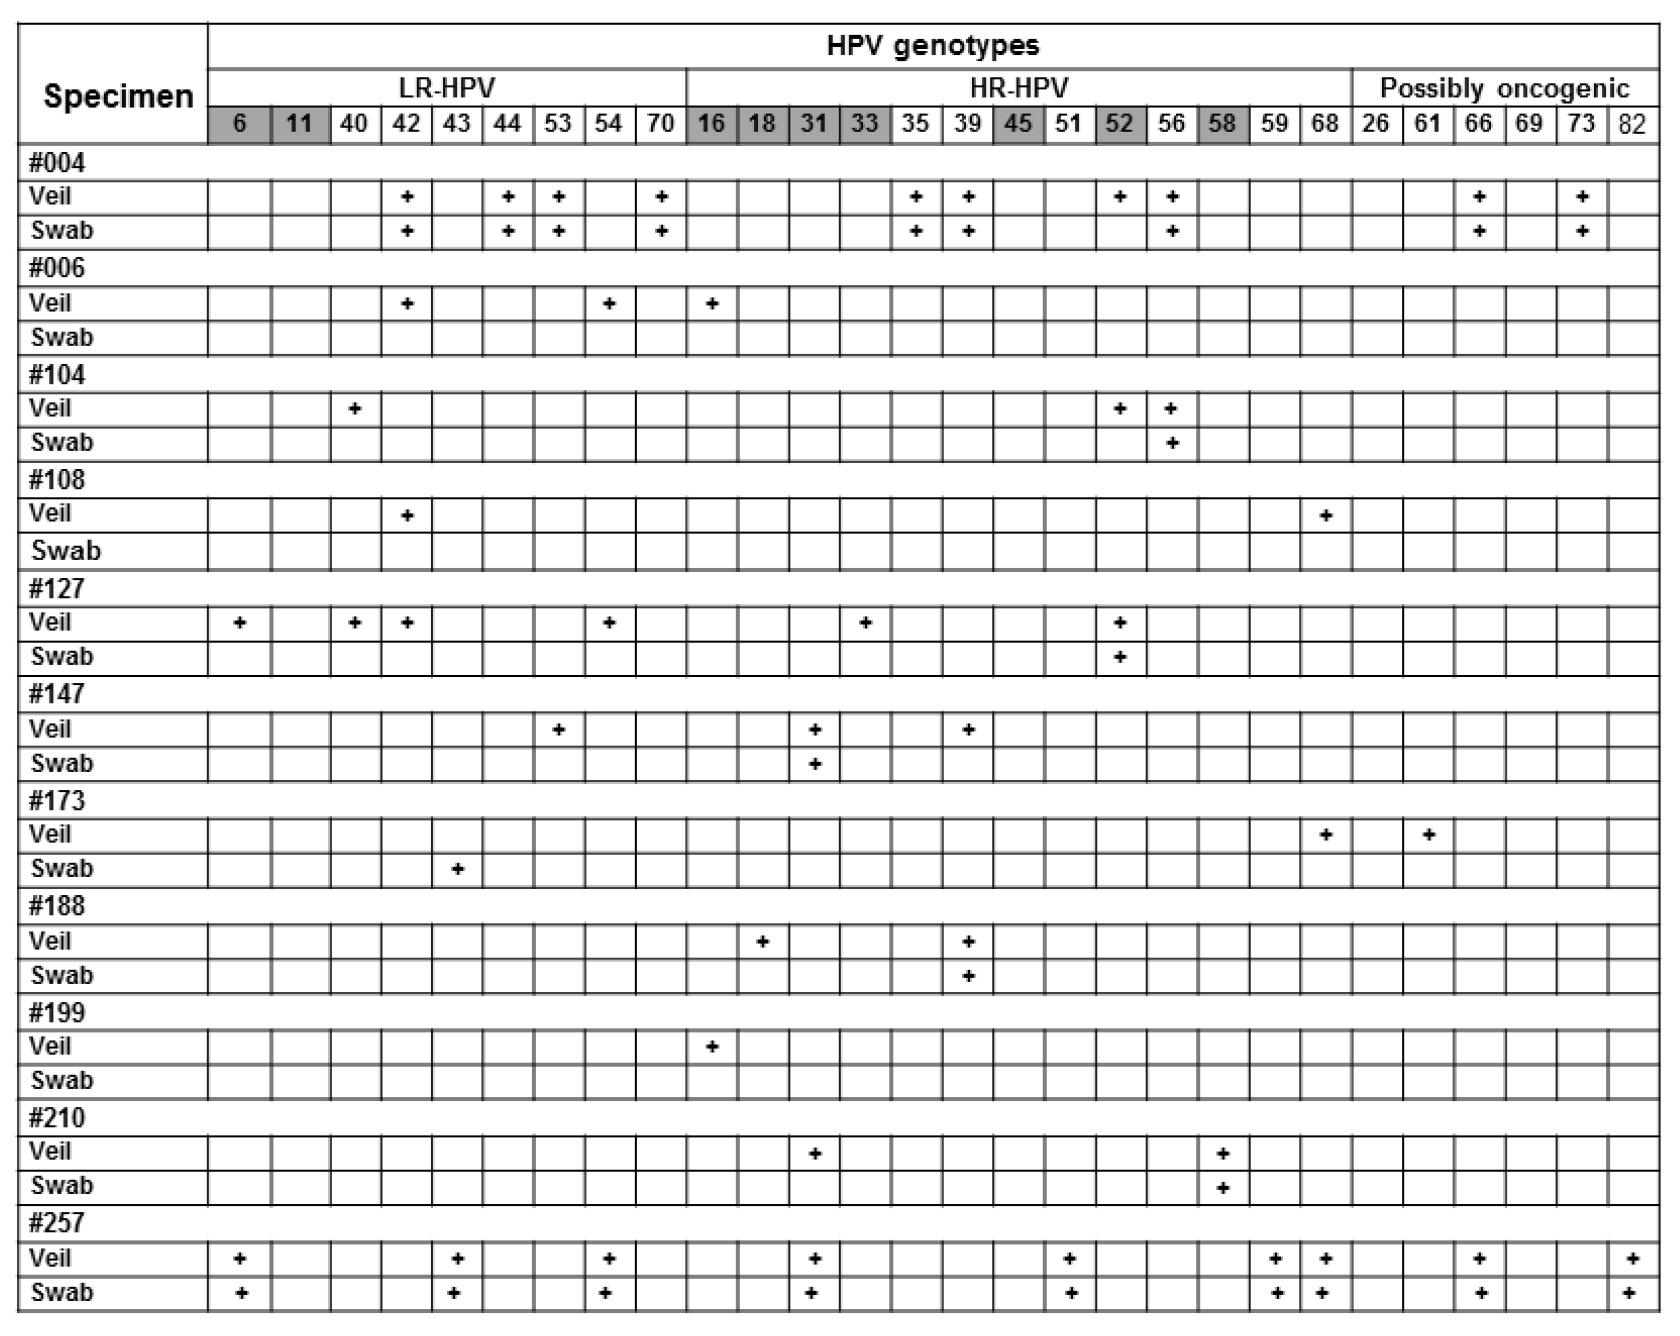
JCRM-2019_Bélec Laurent_F5

Figure 5. Relevant examples of paired results obtained by gold standard clinician-collected endocervical swab and self-collected veil.
Participants #006, #108, #199 and #257 were negative by clinician-collected swab, whereas they were positive by paired self-collected veil, with supplementary detection by veil of oncogenic HR-HPV, including HPV-16 in #006 and #199, HPV-68 in #108, and HPV-31, HPV-51 and HPV-68 in #257. Participants #004, #104, #127, #147, #173, #188 and #210 were positive by clinician-collected swab, and paired self-collected veil allowed supplementary detection of several oncogenic HR-HPV (HPV-18 in #188; HPV-31 in #210; HPV-33 in #127, HPV-39 in #147, HPV-52 in #004 and #104; HPV-68 in #173). Interestingly, all positive HR-HPV detections by clinician-collected swab were also detected by self-collected veil. Positive result for a given genotype is indicated by cross; negative result by white box. All swab and veil specimen were positive for b-globin internal control of the Anyplex™ II HPV28 kit (not shown).

Table 6. Correspondence between the 3,289 (= 253 × 13) results obtained from the 253 paired swab-collected and veil-collected genital specimens to detect the 13 HR-HPV genotypes included in Anyplex™ II HPV28 kit (Seegene).

HR-HPV genotypes

16

18

31

33

35

39

45

51

52

56

58

59

68

Swab

Veil

Number of cases per genotype

Total

Negative

Negative

244

246

244

250

246

248

246

245

244

244

244

249

245

3,195

Positive

Positive with same genotype*

4

4

6

0

6

3

5

4

5

6

7

4

3

57

Positive

Positive with different genotypes**,a

0

0

0

1b

0

0

0

0

0

0

0

0

0

1

Negative

Positive

4

3

3

2

1

2

2

4

4

3

2

0

4

34

Positive

Negative

1

0

0

1

0

0

0

0

0

0

0

0

1

3

* i.e., positivity using veil for the same HR-HPV genotype using swab;

** i.e., positivity using veil for at least one another HR-HPV genotype using swab;

a A total of 4 additional HR-HPV genotypes were detected using veil collection;

b Additional HR-HPV genotype detected using veil collection was HR-HPV -31, -51, -59 and -68.

NA: Not attributable; HPV: Human papillomavirus; HR-HPV: high-risk human papillomavirus.

Discussion

In the present study, the acceptability and HPV DNA diagnostic accuracy of a novel genital veil (V-Veil-Up Gyn Collection Device) was assessed as female genital self-sampling device to collect cervicovaginal secretions. Interestingly, all specimens collected by the veil were found positive for the ubiquitous b-globin gene, demonstrating that they contained cellular DNA, which made HPV detection possible by molecular testing. The results showed high acceptability (96%), feasibility and satisfaction of the veil-based genital self-collection, which was non-inferior to clinician-based collection as reference for HPV DNA molecular testing, with “good” agreement between the two collection methods, high sensitivity of 95.0% and specificity of 88.2%. Outstandingly, the rates of HPV DNA and HR-HPV DNA positivities were significantly higher when using veil-based collected genital secretions than clinician-collected cervical secretions by swab. The self-collection by veil allows detecting 12.7-fold more additional oncogenic HR-HPV in 1 of 8 (12.5%) participants than the detection allowed by the swab-based collection, likely originating from non-cervical areas of the vaginal cavity, including vaginal cul-de-sacs, vaginal walls and vulva. Taken together, our observations highlight that veil-based self-collection of genital secretions appears a convenient tool to collect in a gentle way genital secretions for accurate molecular HPV detection and genotyping that could be easily implemented in the cervical cancer prevention program in Chad.

Most previous studies conducted in sub-Saharan African countries depict high HR-HPV prevalences and wide heterogeneity in the distribution of the main HR-HPV in women [59–62, 65–79]. Our observations confirm that women living in Chad also form a neglected high-risk group for cervical HR-HPV infection and consequently for cervical cancer. The very high prevalence of cervical HR-HPV in adult women clearly demonstrates that cervical HR-HPV infection in Chad constitutes a major public health problem, which remains largely unsuspected. Therefore, there is an urgent need for implementing a cervical cancer prevention program in Chad, as recommended by the World Health Organization (WHO) [80]. According to Mortier and colleagues, the cytology-based cervical cancer screening in women in Chad is feasible with low cost and easy to interpret visual technics; and could be integrated in existing healthcare structures [40]. For these women carrying cervical HR-HPV infection, only secondary prevention with regular screening for precancerous lesions by cytology and the monitoring of the viral persistence by HPV molecular testing, remains the only alternative to prevent the disease progression into invasive cervical cancer. However, in the context of Chad, a very low-income country, there is a serious lack of pathologist specialists, thereby making conventional cytology not suitable and reinforcing on the other hand the great necessity to implement HPV DNA testing with molecular technologies [7]. Indeed, HPV DNA testing constitutes an alternative to cytology for cervical cancer screening, which is furthermore highly sensitive and reproducible [7]. HPV DNA molecular testing could promote the “screen-and-treat” strategy recommended by the WHO to prevent cervical cancer in developing countries [80], thus allowing to maximize the medical support in a single visit and avoiding the loss of women positive for HR-HPV.

Taking into account that most adult Chadian women are living in remote rural areas, or far away of adequate healthcare facilities, self-collection of genital specimen carried out at home by women themselves could represent a relevant alternative allowing increasing the coverage of screening when coupled with adapted HPV DNA testing by molecular biology [7]. In the GYNAUTO-CHAD study, we have had the opportunity to evaluate the acceptability and HPV DNA diagnostic accuracy of a novel genital veil (V-Veil-Up Gyn Collection Device) as female genital self-sampling device to collect cervicovaginal secretions, previously found accurate for the molecular detection of cervicovaginal bacterial infections [45]. Veil-based self-collection proved to be a particularly well acceptable method easily collecting genital secretions within our cohort of community-recruited adult Chadian women. Thus, the veil was in the vast majority of participants (97.6%) correctly placed with the applicator and removed with the string, without any difficulties. When asked to choose one collection method, the vast majority (96.0%) of study women responded that they would prefer the self-collection method, demonstrating high acceptability of the genital sampling using the V-Veil-Up sampler device. Although most women (91.3%) reported that the instructions for use in French were easy to read and to understand, with correct recognizing of the component’s device, the verbal explanations by the nurse on how to use the collection device were better appreciated, particularly to correctly interpret the schemas of the instructions for use, and how placing the veil deep within the vaginal cavity. These observations are in keeping with the frequent ignorance of female genital anatomy in study participants (not shown), who were not generally taking any birth control method, and were not using tampons for feminine hygiene during menstruation. However, in practice, the manipulation of the veil was almost correct, perhaps in relationship with the very frequent usage of genital toilet in study women. Thus, while the majority of participants were not already familiar with using tampons (only 13% in our study population), the genital manipulations during veil-based self-collection were easy to carry out, which might lead to greater preference for the veil much over than other unfamiliar methods, such as a brush or a swab. These findings are reminiscent to the high acceptability of the use of vaginal tampons for self-collection reported in African women living in South Africa [13, 30]. These observations suggest that a large proportion of African women might actually prefer self-collection methods not necessitating good knowledge of the female genital anatomy to other self-collection methods such as brush or swab, for which the women must specifically target their cervix. Furthermore, the answers of study participants demonstrated high satisfaction of the V-Veil-Up Gyn Collection Device. Thus, very few women reported difficulties when performing the veil-based collection and nearly all women reported positive experiences with collection. Only a minority (4.7%) of participants reported some difficulties with performing the self-collection, most frequently genital pain when placing or wearing the veil in a minority of women (3.9%), all being more than 45 years-old, likely because of vaginal dryness in women being in the menopause period.

Otherwise, our observations also point the potential interest of using a supervised self-collection strategy among African women, in which oral counselling processes are aided at all times by a healthcare or non-healthcare professional as a counsellor to understand the instructions for use, the genital anatomy, and provide counselling with a very high rate of acceptability and satisfaction of self-collection. The evidence of high acceptability for supervised strategies was previously reported for another self-collection of capillary blood or saliva during HIV self-testing, especially in resource-constrained settings [81]. Other advantages of veil are that it is inexpensive and easily accessible. Finally, providing options for self-collection based upon women’s preferences is likely to increase screening coverage, and our data suggest that veil is an acceptable option. The percent agreements between clinician-based collection and veil-based self-collection to detect any HPV, HR-HPV and 9-valent vaccine HPV genotypes were above 80%, and all Cohen’s κ coefficients were between 0.61 to 0.80 demonstrating “good” agreement between collection methods [63]. Although it exists no data on the performance of self-collected specimens by veil for HPV DNA testing for which to compare our results, several previous reports evaluating the use of self-collection by vaginal tampons and vaginal lavages for HPV DNA or HR-HPV mRNA may be useful to contextualize our results, since tampons and lavage as well as veil do not target particularly the cervix but are the reflect of the whole secretions of the vaginal cavity [82]. Thus, our findings of agreement between the two collection methods with the kappa-statistic are relatively similar to previous reports evaluating HR-HPV DNA detection by self-collection using vaginal tampons with clinician-collection as reference, with Cohen’s κ coefficients ranging from 0.49 [83], 0.55 [84], 0.50 [12], 0.63 [49], 0.70 [85], 0.75 [84] to 0.76 [86] or vaginal lavage with Cohen’s κ coefficients ranging from 0.47 [18], 0.53 [18], 0.64 [87], 0.65 [88], 0.71 [89] to 0.78 [88], thus indicating “moderate” to “good” agreements [63]. Similarly, the performances of HR-HPV mRNA testing using self-collected vaginal tampons by reference to clinician-collected specimens, with Cohen’s κ coefficient of 0.54 indicating “moderate” agreement [30], were slightly below to the agreement of the veil.

Out of 40 HR-HPV-positive clinician-collected specimens, 38 veil-collected specimens were also positive for HR-HPV, corresponding to a sensitivity of 95.0%. Using vaginal tampon, Adamson and colleagues reported much lower sensitivity of 77.4% of vaginal tampons to detect HR-HPV mRNA by reference to clinician collection by swab [30]. A wide range of sensitivities of tampon collection using clinician-collection as the reference were reported to detect HR-HPV DNA, ranging from 59% to 94% [12, 21, 23, 84, 90–94] and always lower than the sensitivity of the veil observed in our hands. Similarly, the reported sensitivities of vaginal lavage to detect HR-HPV ranged from 88% to 90% [88]. It remains unclear whether these differences are due to different duration of collection time, different order of specimen collection, or whether they reflect the differences in testing methods. One reason for the lower sensitivity of the tampon-based collection might be due to sampling location. The clinician-collected specimen, obtained directly from the cervix, preferentially collects cervical cells in the transformation zone, whereas the tampon-method provides a mix of cells from both the cervix and vagina, and therefore might not collect enough cells from the transformation zone [82]. In contrast, the high sensitivity with the veil to detect cervical HR-HPV demonstrates that the veil likely retains significant amount cells originating from the cervix and more than a simple vaginal tampon. It is possible that extending the time of holding the veil might increase the sensitivity, but it also might lead to decreased acceptability [21]. Finally, it is important to note that the reported sensitivities of self-sampling by vaginal tampons in addition with our own sensitivity with the veil are only for molecular detection of HPV, since no pathological data were recorded to predict dysplastic or pre-invasive lesions such as CIN 2+.

Likewise, of the 213 clinician-collected specimens negative for HR-HPV DNA, 188 veil-collected specimens were also negative for HR-HPV DNA, corresponding to a specificity of 88.2%. The specificity of the veil is of the same order to those previously reported for self-collection to detect cervical HR-HPV DNA by vaginal tampons, ranging from 80% to 92% [12, 21, 84, 90, 91], but higher than that previously reported for self-collection by tampons to detect cervical HR-HPV mRNA (77.7%) [30]. The difference in sampling location between the clinician-based collection using swab targeting the endocervix and the self-collection by veil or tampons collecting global cervicovaginal secretions might explained the higher rate of positive results by veil or tampons than by swab, since the veil as well as vaginal tampons might have picked up vulvovaginal HPV infections, which do not necessarily coincide with cervical infections [82, 94].

Because clinical management and research usually depend on single-point detection of HPV, it is important to use the collection method the most capable to detect HPV by molecular biology. The cumulative presence of HPV in female genital tract is always greater than its point prevalence, suggesting that single-point sampling is less than 100% sensitive [49]. Otherwise, the vaginal epithelium represents a much greater surface area than the cervical epithelium and as such offers a greater number of potentially HPV-infected cells to collect. Thus, the self-sampling approach using veil might not only sample the cervix, but it will also sample the vaginal epithelium, with a potentially greater likelihood of detecting HPV. Indeed, vaginal epitheliums together with the cervix epithelium provides a potentially higher number of HPV-infected cells than the cervix alone. Remarkably, in the present study, the percentages of test positivity for HPV DNA and HR-HPV DNA were 1.67-fold and 1.57-fold higher, respectively, in self-collected specimens by veil than in clinician-collected specimens. Furthermore, when considering the distribution of the 28 HPV genotypes detected by multiplex real-time PCR assay Anyplex™ II HPV28 in paired genital specimens, the vast majority (92.8%) of genotypes were more frequently detected by self-collection using the V-Veil-Up Gyn Collection Device than by clinician-collected endocervical swab. In more than one-third (35.2%) of participants, the self-collection by veil allowed detecting nearly 14.4 (101/7)-fold more additional HPV (not detected by swab) than those detected using the clinician-collection by swab. Likewise, the use of veil allowed detecting 12.6 (38/3)-fold more additional HR-HPV in 1 of 8 (13.8%) participants than the use of swab. These findings suggest that the veil is able significantly releasing genital cells for HPV molecular testing, likely better than vaginal tampon. Indeed, cell clusters embedded in a rayon-covered cotton core tampon are not easily separated from the sampling device [48]. Our observations also demonstrate the high capacity of the veil to allow the detection of oncogenic HR-HPV present within the vaginal cavity that could not be detected from the paired swab specimens. Finally, the veil was more efficient to detect oncogenic HR-HPV in whole cervicovaginal secretions than the swab used to collect cervical secretions. Indeed, the veil collects all types of cervicovaginal secretions of the vaginal cavity, not exclusively the cervical secretions, and thus allows detecting non-cervical HPV. Non-cervical HPV are a priori located at non-cervical vaginal areas (vaginal cul-de-sacs, vaginal walls and vulva). Another possibility may be also to consider that cervicovaginal HPV could also come from the male sexual partner, as previously envisaged [48]. Indeed, recent unprotected vaginal intercourse might affect HPV detection because false-positive tests could result from detecting another person’s HPV DNA, or false- negative tests could occur because vaginal penetration could mechanically remove HPV-infected cells. However, we had verified as an exclusion criterion that participants had not had sexual intercourse for at least 48 hours, as recommended for HPV molecular testing in female genital secretions to exclude the risk to catch semen-associated HPV or male-derived exfoliated HPV-infected epithelial cells [48, 49]. Nevertheless, the detection of HR-HPV in vaginal secretions constitutes strong biological evidence that the woman is exposed to oncogenic HPV, which is the basis of molecular HPV screening. Women screened positive for HR-HPV by veil should then be referred for new cervical molecular testing or cervical Pap smear. Indeed, it is well known that an HPV-positive result, regardless of the cytology result, may cause anxiety, stress and concern [95], making mandatory the triage of women found HPV-positive using veil-collected vaginal secretions

Study limitations

Our study had several strengths. First, we tried to limit the selection bias of the study population in order to make this survey as much representative as possible of the female population in Chad. Howver, the prevalences for HIV-1, HBV and HCV in study population was in accordance with the high endemicity of these three major chronic viral infections in Chad [96, 97]. Second, we recruited and screened a large sample of community-recruited women who represent a high-risk primary screening population. Third, both collection methods were performed sequentially on the same day, allowing for direct comparison of the samples collected. Fourth, we were able to assess both the acceptability as well as the performance of the veil-collection method for HPV DNA testing. However, our study has limitations. Thus, the participants could be not completely representative of the adult women community of Chad, especially regarding the prevalences of HIV and cervical HR-HPV, and the genotypes distribution of cervical HPV. Another limitation is that we were not able to directly evaluate which collection method could be the most favorable to further care HPV-positive women. Finally, we did not perform any pathological evaluation, including Pap smear or cervical biopsies on study participants and do not know the true disease status of these women.

Conclusion

Our observations confirm the high burden of cervical oncogenic HR-HPV infection in Chadian women, and point the potential risk of further development of HPV-associated cervical precancerous and neoplastic lesions in a large proportion of women in Chad. Cervical cancer, its diagnosis and prevention, is thus one of the most important public health challenges that Chad has to face in a near future. Self-collection of genital secretions using the V-Veil-Up Gyn Collection Device constitutes a simple, highly acceptable and powerful tool to collect genital secretions for further molecular testing and screening of oncogenic HR-HPV that could be easily implemented in the national cervical cancer prevention program in Chad. In regions of the world where access to care is limited due to socioeconomic reasons or clinician-collected samples may be limited due to personal and/or sociocultural concerns, self-collection method by veil may provide a way to extend screening to an underserved population.

Abbreviations

COFRAC: Comité Français d’Accréditation; HBV: Hepatitis B virus; HCV: Hepatitis C virus; HIV: human immunodeficiency virus; HPV: Human papillomavirus; HR-HPV; High risk-HPV; LR-HPV; Low risk-HPV; STI: Sexually transmitted infection; WHO: World Health Organization

Declarations

Ethical approval and consent to participate

The study was formally approved by the Scientific Committee of the Faculty of Health Sciences of the University of N’Djamena, constituting the National Ethical Committee. All included women gave their informed signed consent to participate to the study. For each included woman, the record of the consent to participate to the study was documented on each questionnaire. This consent procedure was formally approved by the Ethical Committee. All individual results of HPV detection and genotyping as well as HIV, HBV and HCV serologies were given to each study participant, and women harboring cervical HR-HPV were further retained at the clinic “La Renaissance Plus”, screened for cervical lesions and women showing positive cervical cytology were cared. Furthermore, the study results have been in extenso reported to health authorities of Chad during the national congress of gynecologists and midwives, held from 13 to 17 of November 2018 in the Centre d’Etudes et de Formation pour le Développement (CEFOD), N’Djamena, Chad.

Availability of data and materials

The datasets analyzed during the current study is available from the corresponding author on reasonable request.

Funding

No grant was received for the study.

Authors’ contributions

ZAN, DS, RSMB, DK and LB have conceived and designed the research; DS and AMM carried out the ethical issues; RSMB, LR, MMT and DV carried out the experiments; ZAN, RSMB and STW performed statistical analyses; ZAN, RSMB, STW and HP analyzed the results; ZAN, RBMB, CA, HP, DV and LB drafted the manuscript.

Acknowledgement

Zita Aleyo Nodjikouambaye is a PhD student from the Ecole Doctorale en Infectiologie Tropicale, Franceville, Gabon. Ralph-Sydney Mboumba Bouassa is a PhD student from the Ecole Doctorale en Infectiologie Tropicale, Franceville, Gabon, benefiting from a scholarship of the Gabonese Government and is holder of merit from the Agence Universitaire de la Francophonie.The authors are grateful to Bernard Chaffringeon, V-Veil-Up Pharma Ltd., Nicosia, Cyprus, for providing the V-Veil-Up Gyn Collection Devices and the multiplex PCR kits for the study. We are greatly appreciative to all women who participated in our study.

References

  1. Scheurer ME, Tortolero-Luna G, Adler-Storthz K. (2005) Human papillomavirus infection: biology, epidemiology, and prevention. Int J Gynecol Cancer. 15(5): 727–46. [Crossref]
  2. Parkin DM. (2006) The global health burden of infection-associated cancers in the year 2002. Int J Cancer. 118(12): 3030–44. [Crossref]
  3. Subramanya D, Grivas PD. (2008) HPV and cervical cancer: : updates on an established relationship. Postgrad Med. 120(4): 7–13. [Crossref]
  4. De Vuyst H, Alemany L, Lacey C, Chibwesha CJ, et al. (2013) The burden of human papillomavirus infections and related diseases in sub-saharan Africa. Vaccine. 31 Suppl 5: F32–46. [Crossref]
  5. Ferlay J, Soerjomataram I, Dikshit R, Eser S, et al. (2015) Cancer incidence and mortality worldwide: sources, methods and major patterns in GLOBOCAN 2012. Int J Cancer. 136(5): E359–86. [Crossref]
  6. World health Organization, 2015. Projections of mortality and causes of death, 2015 and 2030. (Last accessed July 2018). Available at: http://www.who.int/healthinfo/global_burden_disease/projections/en/
  7. Mboumba Bouassa RS, Prazuck T, Lethu T, Jenabian MA, et al. (2017) Cervical cancer in sub-Saharan Africa: a preventable noncommunicable disease. Expert Rev Anti Infect Ther. 15(6): 613–627. [Crossref]
  8. Finocchario-Kessler S, Wexler C, Maloba M, Mabachi N, et al. (2016) Cervical cancer prevention and treatment research in Africa: a systematic review from a public health perspective. BMC Womens Health. 16: 29. [Crossref]
  9. Adegoke O, Kulasingam S, Virnig B. (2012) Cervical cancer trends in the United States: a 35-year population-based analysis. J Womens Health (Larchmt). 21(10): 1031–7. [Crossref]
  10. Kuhn L, Denny L, Pollack A, Lorincz A, et al. (2000) Human papillomavirus DNA testing for cervical cancer screening in low-resource settings. J Natl Cancer Inst 92(10): 818–25. [Crossref]
  11. Petignat P, Faltin DL, Bruchim I, Tramèr MR, et al. (2007) Are self-collected samples comparable to physician-collected cervical specimens for human papillomavirus DNA testing? A systematic review and meta-analysis. Gynecol Oncol. 105(2): 530–5. [Crossref]
  12. Alidjinou EK, Ebatetou-Ataboho E, Sané F, Moukassa D, et al. (2013) Cervical samples dried on filter paper and dried vaginal tampons can be useful to investigate the circulation of high-risk HPV in Congo. J Clin Virol. 57(2): 161–4. [Crossref]
  13. Mahomed K, Evans D, Sauls C, Richter K, et al. (2014) Human papillomavirus (HPV) testing on self-collected specimens: perceptions among HIV positive women attending rural and urban clinics in South Africa. Pan Afr Med J. 17: 189. [Crossref]
  14. Tamalet C, Halfon P, Retraite LL, Grob A, et al. (2016) Genotyping and follow-up of HR-HPV types detected by self-sampling in women from low socioeconomic groups not participating in regular cervical cancer screening in France. J Clin Virol. 78: 102–7. [Crossref]
  15. Mbatha JN, Galappaththi-Arachchige HN, Mtshali A, Taylor M, et al. (2017) Self-sampling for human papillomavirus testing among rural young women of KwaZulu-Natal, South Africa. BMC Res Notes. 10(1): 702. [Crossref]
  16. Modibbo F, Iregbu KC, Okuma J, Leeman A, et al. (2017) Randomized trial evaluating self-sampling for HPV DNA based tests for cervical cancer screening in Nigeria. Infect Agent Cancer. 12: 11. [Crossref]
  17. Campos NG, Tsu V, Jeronimo J, Njama-Meya D, et al. (2017) Cost-effectiveness of an HPV self-collection campaign in Uganda: comparing models for delivery of cervical cancer screening in a low-income setting. Health Policy Plan. 32(7): 956–968. [Crossref]
  18. Nobbenhuis MA, Helmerhorst TJ, van den Brule AJ, Rozendaal L, et al. (2002) Primary screening for high risk HPV by home obtained cervicovaginal lavage is an alternative screening tool for unscreened women. J Clin Pathol. 55(6): 435–9. [Crossref]
  19. Garland SM, Tabrizi SN. (2004) Diagnosis of sexually transmitted infections (STI) using self-collected non-invasive specimens. Sex Health. 1(2): 121–6. [Crossref]
  20. Jones HE, Wiegerinck MA, Nieboer TE, Mol BW, et al. (2008) Women in the Netherlands prefer self-sampling with a novel lavaging device to clinician collection of specimens for cervical cancer screening. Sex Transm Dis. 35(11): 916–7. [Crossref]
  21. Gravitt PE, Belinson JL, Salmeron J, Shah KV. (2011) Looking ahead: a case for human papillomavirus testing of self-sampled vaginal specimens as a cervical cancer screening strategy. Int J Cancer. 129: 517–527. [Crossref]
  22. Harper DM, Noll WW, Belloni DR, Cole BF. (2002) Randomized clinical trial of PCR-determined human papillomavirus detection methods: self-sampling versus clinician-directed–biologic concordance and women’s preferences. Am J Obstet Gynecol. 186(3): 365–73. [Crossref]
  23. Herrington CS. (2002) Self testing for human papillomaviruses. J Clin Pathol. 55(6): 408–9. [Crossref]
  24. Bidus MA, Zahn CM, Maxwell GL, Rodriguez M, et al. (2005) The role of self-collection devices for cytology and human papillomavirus DNA testing in cervical cancer screening. Clin Obstet Gynecol. 48(1): 127–32. [Crossref]
  25. Holanda F Jr, Castelo A, Veras TM, de Almeida FM, et al. (2006) Primary screening for cervical cancer through self sampling. Int J Gynaecol Obstet. 95: 179–184. [Crossref]
  26. Morris BJ, Rose BR. (2007) Cervical screening in the 21st century: the case for human papillomavirus testing of self-collected specimens. Clin Chem Lab Med. 45(5): 577–91. [Crossref]
  27. Gök M, Heideman DA, van Kemenade FJ, Berkhof J, et al. (2010) HPV testing on self collected cervicovaginal lavage specimens as screening method for women who do not attend cervical screening: cohort study. BMJ. 340: c1040. [Crossref]
  28. Arbyn M, Verdoodt F, Snijders PJ, Verhoef VM, et al. (2014) Accuracy of human papillomavirus testing on self-collected versus clinician-collected samples: a meta-analysis. Lancet Oncol. 15(2): 172–83. [Crossref]
  29. Porras C, Hildesheim A, González P, Schiffman M, et al. (2014) Performance of self-collected cervical samples in screening for future precancer using human papillomavirus DNA testing. J Natl Cancer Inst. 107(1): 400. [Crossref]
  30. Adamson PC, Huchko MJ, Moss AM, Kinkel HF, et al. (2015) Acceptability and Accuracy of Cervical Cancer Screening Using a Self-Collected Tampon for HPV Messenger-RNA Testing among HIV-Infected Women in South Africa. PLoS One. 10(9): e0137299. [Crossref]
  31. Arbyn M, Smith SB, Temin S, Sultana F, et al. (2018) Collaboration on Self-Sampling and HPV Testing. Detecting cervical precancer and reaching underscreened women by using HPV testing on self samples: updated meta-analyses. BMJ. 363: k4823. [Crossref]
  32. Senkomago V, Ting J, Kwatampora J, Gukare H, et al. (2018) High-risk HPV-RNA screening of physician- and self-collected specimens for detection of cervical lesions among female sex workers in Nairobi, Kenya. Int J Gynaecol Obstet. 143(2): 217–224. [Crossref]
  33. Elliott T, Kohler RE, Monare B, Moshashane N, et al. (2019) Performance of vaginal self-sampling for human papillomavirus testing among women living with HIV in Botswana. Int J STD AIDS.: 956462419868618. [Crossref]
  34. Fall NS, Tamalet C, Diagne N, Fenollar F, et al. (2019) Feasibility, Acceptability, and Accuracy of Vaginal Self-Sampling for Screening Human Papillomavirus Types in Women from Rural Areas in Senegal. Am J Trop Med Hyg. 100(6): 1552–1555. [Crossref]
  35. Fitzpatrick MB, Dube Mandishora RS, Katzenstein DA, McCarty K, et al. (2019) hrHPV prevalence and type distribution in rural Zimbabwe: A community-based self-collection study using near-point-of-care GeneXpert HPV testing. Int J Infect Dis. 82: 21–29. [Crossref]
  36. Fitzpatrick MB, El-Khatib Z, Katzenstein D, Pinsky BA, et al. (2019) Community-based self-collected human papillomavirus screening in rural Zimbabwe. BMC Public Health. 19(Suppl 1): 603. [Crossref]
  37. Racey CS, Withrow DR, Gesink D. (2013) Self-collected HPV testing improves participation in cervical cancer screening: a systematic review and meta-analysis. Can J Public Health. 104(2): e159–66. [Crossref]
  38. Institut National de la Statistique, des Études Économiques et Démographiques (INSEED), Ministère de la Santé Publique (MSP) et ICF International, 2014–2015. Enquête Démographique et de Santé et à Indicateurs Multiples (EDS-MICS 2014–2015). Rockville, Maryland, USA : INSEED Mai 2016, MSP et ICF International. (Last accessed: December 2018). Available at: https://dhsprogram.com/pubs/pdf/fr317/fr317.pdf
  39. Institut National de la Statistique, des Etudes Economiques et Démographiques (INSEED), Ministère de L’Économie et de la Planification du Développement. République du Tchad. TCHAD-POPULATION 2018. (Last accessed: December 2018). Available at: http://www.inseed-td.net/index.php/thematiques/statistique-demographique/population
  40. Mortier E, Doudéadoum N, Némian F, Gaulier A, et al. (2016) Feasibility of cervical smear in HIV-positive women living in Chad. Bull Soc Pathol Exot. 109(3): 180–4. [Crossref]
  41. Mboumba Bouassa RS, Nodjikouambaye ZA, Sadjoli D, Adawaye C, et al. (2019) High prevalence of cervical high-risk human papillomavirus infection mostly covered by Gardasil-9 prophylactic vaccine in adult women living in N’Djamena, Chad. PLoS One. 14(6): e0217486. [Crossref]
  42. Alliance for Cervical Cancer Prevention. The Case for Investing in Cervical Cancer Prevention. Seattle: ACCP; 2004. Cervical Cancer Prevention Issues in Depth, No. 3. (Last accessed: July 2018). Available at: http://screening.iarc.fr/doc/RH_accp_case.pdf
  43. United Nation (UN). Department of Economic and Social Affairs, Population Division. World Population Prospects: The 2017 Revision. Population of Chad (2018 and historical). (Last accessed: July 2018). Available at: http://www.worldometers.info/world-population/chad-population/
  44. ICO/IARC Information Centre on HPV and Cancer: Chad, Human Papillomavirus and Related Cancers, Fact Sheet 2017. (Last accessed: July 2018). Available at: http://www.hpvcentre.net/statistics/reports/TCD_FS.pdf
  45. Nodjikouambaye ZA, Compain F, Sadjoli D, Mboumba Bouassa RS, et al. (2019) Accuracy of Curable Sexually Transmitted Infections and Genital Mycoplasmas Screening by Multiplex Real-Time PCR Using a Self-Collected Veil among Adult Women in Sub-Saharan Africa. Infect Dis Obstet Gynecol. 2019: 8639510. [Crossref]
  46. Bossuyt PM, Reitsma JB, Bruns DE, Gatsonis CA, et al. (2003) Standards for Reporting of Diagnostic Accuracy. Towards complete and accurate reporting of studies of diagnostic accuracy: the STARD initiative. BMJ. 326(7379): 41–4. [Crossref]
  47. Cohen JF, Korevaar DA, Altman DG, Bruns DE, et al. (2016) STARD 2015 guidelines for reporting diagnostic accuracy studies: explanation and elaboration. BMJ Open. 6(11): e012799. [Crossref]
  48. Baay MF, Francois K, Lardon F, Van Royen P, et al. (2011) The presence of Y chromosomal deoxyribonucleic acid in the female vaginal swab: possible implications for human papillomavirus testing. Cancer Epidemiol. 35(1): 101–3. [Crossref]
  49. Harper DM, Longacre MR, Noll WW, Belloni DR, et al. (2003) Factors affecting the detection rate of human papillomavirus. Ann Fam Med. 1(4): 221–7. [Crossref]
  50. Robin L, Mboumba Bouassa RS, Nodjikouambaye ZA, Charmant L, et al. (2018) Analytical performances of simultaneous detection of HIV-1, HIV-2 and hepatitis C- specific antibodies and hepatitis B surface antigen (HBsAg) by multiplex immunochromatographic rapid test with serum samples: A cross-sectional study. J Virol Methods. 253: 1–4. [Crossref]
  51. Mboumba Bouassa RS, Mbeko Simaleko M, Camengo SP, Mossoro-Kpinde CD, et al. (2018) Unusual and unique distribution of anal high-risk human papillomavirus (HR-HPV) among men who have sex with men living in the Central African Republic. PLoS One. 13(5): e0197845. [Crossref]
  52. Estrade C, Sahli R. (2014) Comparison of Seegene Anyplex II HPV28 with the PGMY-CHUV assay for human papillomavirus genotyping. J Clin Microbiol. 52(2): 607–12. [Crossref]
  53. Lee Y-J, Kim D, Lee K, Chun J-Y. (2014) Single-channel multiplexing without melting curve analysis in real-time PCR. Sci Rep. 4: 7439. [Crossref]
  54. Muñoz N, Bosch FX, de Sanjosé S, Herrero R, et al. (2003) Epidemiologic classification of human papillomavirus types associated with cervical cancer. N Engl J Med. 348(6): 518–27. [Crossref]
  55. Kwon MJ, Roh KH, Park H, Woo HY. (2014) Comparison of the Anyplex II HPV28 assay with the Hybrid Capture 2 assay for the detection of HPV infection. J Clin Virol. 59(4): 246–9. [Crossref]
  56. Latsuzbaia A, Tapp J, Nguyen T, Fischer M, et al. (2016) Analytical performance evaluation of Anyplex II HPV28 and Euroarray HPV for genotyping of cervical samples. Diagn Microbiol Infect Dis. 85(3): 318–322. [Crossref]
  57. Marcuccilli F, Farchi F, Mirandola W, Ciccozzi M, et al. (2015) Performance evaluation of Anyplex™ II HPV28 detection kit in a routine diagnostic setting: comparison with the HPV Sign® Genotyping Test. J Virol Methods. 217: 8–13. [Crossref]
  58. Pasquier C, Sauné K, Raymond S, Boisneau J, et al. (2017) Comparison of Cobas® HPV and Anyplex™ II HPV28 assays for detecting and genotyping human papillomavirus. Diagn Microbiol Infect Dis. 87(1): 25–27. [Crossref]
  59. Sangwa-Lugoma G, Ramanakumar AV, Mahmud S, Liaras J, et al. (2011) Prevalence and determinants of high-risk human papillomavirus infection in women from a sub-Saharan African community. Sex Transm Dis. 38(4): 308–15. [Crossref]
  60. Kunckler M, Schumacher F, Kenfack B, Catarino R, et al. (2017) Cervical cancer screening in a low-resource setting: a pilot study on an HPV-based screen-and-treat approach. Cancer Med. 6(7): 1752–1761. [Crossref]
  61. Catarino R, Vassilakos P, Jinoro J, Broquet C, et al. (2016) Human papillomavirus prevalence and type-specific distribution of high- and low-risk genotypes among Malagasy women living in urban and rural areas. Cancer Epidemiol. 42: 159–66. [Crossref]
  62. Ngabo F, Franceschi S, Baussano I, Umulisa MC, et al. (2016) Human papillomavirus infection in Rwanda at the moment of implementation of a national HPV vaccination programme. BMC Infect Dis. 16: 225. [Crossref]
  63. Landis JR, Koch GG. (1977) The measurement of observer agreement for categorical data. Biometrics. 33(1): 159–74. [Crossref]
  64. Likert R. (1932) A Technique for the Measurement of Attitudes. Archives of Psychology. 140: 1–55.
  65. Akarolo-Anthony SN, Famooto AO, Dareng EO, Olaniyan OB, et al. (2014) Age-specific prevalence of human papilloma virus infection among Nigerian women. BMC Public Health. 14: 656. [Crossref]
  66. Mbulawa ZZ, Coetzee D, Williamson AL. (2015) Human papillomavirus prevalence in South African women and men according to age and human immunodeficiency virus status. BMC Infect Dis. 15: 459. [Crossref]
  67. Mbulawa ZZA, van Schalkwyk C, Hu NC, Meiring TL, et al. (2018) High human papillomavirus (HPV) prevalence in South African adolescents and young women encourages expanded HPV vaccination campaigns. PLoS One. 13(1): e0190166. [Crossref]
  68. Akarolo-Anthony SN, Al-Mujtaba M, Famooto AO, Dareng EO, et al. (2013) HIV associated high-risk HPV infection among Nigerian women. BMC Infect Dis. 13: 521. [Crossref]
  69. Manga MM, Fowotade A, Abdullahi YM, El-Nafaty AU, et al. (2015) Epidemiological patterns of cervical human papillomavirus infection among women presenting for cervical cancer screening in North-Eastern Nigeria. Infect Agent Cancer. 10: 39. [Crossref]
  70. Ogembo RK, Gona PN, Seymour AJ, Park HS, et al. (2015) Prevalence of human papillomavirus genotypes among African women with normal cervical cytology and neoplasia: a systematic review and meta-analysis. PLoS One. 10(4): e0122488. [Crossref]
  71. Catarino R, Vassilakos P, Tebeu PM, Schäfer S, et al. (2016) Risk factors associated with human papillomavirus prevalence and cervical neoplasia among Cameroonian women. Cancer Epidemiol. 40: 60–6. [Crossref]
  72. Kennedy NT, Ikechukwu D, Goddy B. (2016) Risk factors and distribution of oncogenic strains of human papillomavirus in women presenting for cervical cancer screening in Port Harcourt, Nigeria. Pan Afr Med J. 23: 85. [Crossref]
  73. Petrelli A, Di Napoli A, Giorgi Rossi P, Rossi A, et al. (2016) Prevalence of Primary HPV in Djibouti: Feasibility of Screening for Early Diagnosis of Squamous Intraepithelial Lesions. J Low Genit Tract Dis. 20(4): 321–6. [Crossref]
  74. Traore IMA, Zohoncon TM, Ndo O, Djigma FW, et al. (2016) Oncogenic Human Papillomavirus Infection and Genotype Characterization among Women in Orodara, Western Burkina Faso. Pak J Biol Sci. 19(7): 306–311. [Crossref]
  75. Traore IM, Zohoncon TM, Dembele A, Djigma FW, et al. (2016) Molecular Characterization of High-Risk Human Papillomavirus in Women in Bobo-Dioulasso, Burkina Faso. Biomed Res Int. 2016: 7092583. [Crossref]
  76. Cubie HA, Morton D, Kawonga E, Mautanga M, et al. (2017) HPV prevalence in women attending cervical screening in rural Malawi using the cartridge-based Xpert® HPV assay. J Clin Virol. 87: 1–4. [Crossref]
  77. Edna Omar V, Orvalho A, Nália I, Kaliff M, et al. (2017) Human papillomavirus prevalence and genotype distribution among young women and men in Maputo city, Mozambique. BMJ Open. 7(7): e015653. [Crossref]
  78. Ginindza TG, Dlamini X, Almonte M, Herrero R, et al. (2017) Prevalence of and Associated Risk Factors for High Risk Human Papillomavirus among Sexually Active Women, Swaziland. PLoS One. 12(1): e0170189. [Crossref]
  79. Mbatha JN, Taylor M, Kleppa E, Lillebo K, et al. (2017) High-risk human papillomavirus types in HIV-infected and HIV-uninfected young women in KwaZulu-Natal, South Africa: implications for vaccination. Infect Dis (Lond). 49(8): 601–608. [Crossref]
  80. World Health Organization (WHO). Human papillomavirus vaccines: WHO position paper, October 2014. (Last accessed: December 2018). Available at: http://www.who.int/wer/2014/wer8943.pdf?ua=1.
  81. Pant Pai N, Sharma J, Shivkumar S, Pillay S, et al. (2013) Supervised and unsupervised self-testing for HIV in high- and low-risk populations: a systematic review. PLoS Med. 10(4): e1001414. [Crossref]
  82. The National Institute for Health Research (NIHR) Horizon Scanning Center. New and emerging self-sampling technologies for Human Papillomavirus (HPV) testing; March 2014; University of Birmingham; United Kingdom. (Last accessed: December 2018). Available at: http://www.io.nihr.ac.uk/wp-content/uploads/migrated/New-and-emerging-technologies-for-self-sampling-for-cervical-cancer-screening-HPV-REVIEW.pdf
  83. Harper DM, Hildesheim A, Cobb JL, Greenberg M, et al. (1999) Collection devices for human papillomavirus. J Fam Pract. 48(7): 531–5. [Crossref]
  84. Jones HE, Allan BR, van de Wijgert JH, Altini L, et al. Agreement between self- and clinician-collected specimen results for detection and typing of high-risk human papillomavirus in specimens from women in Gugulethu, South Africa. J Clin Microbiol. 2007;45: 1679–1683. [Crossref]
  85. Fairley CK, Chen S, Tabrizi SN, Quinn MA, et al. (1992) Tampons: a novel patient-administered method for the assessment of genital human papillomavirus infection. J Infect Dis. 165(6): 1103–6. [Crossref]
  86. Coutlée F, Hankins C, Lapointe N. (1997) Comparison between vaginal tampon and cervicovaginal lavage specimen collection for detection of human papillomavirus DNA by the polymerase chain reaction. The Canadian Women’s HIV Study Group. J Med Virol. 51(1): 42–7. [Crossref]
  87. Morrison EA, Goldberg GL, Hagan RJ, Kadish AS, et al. (1992) Self-administered home cervicovaginal lavage: a novel tool for the clinical-epidemiologic investigation of genital human papillomavirus infections. Am J Obstet Gynecol. 167(1): 104–7. [Crossref]
  88. Deleré Y, Schuster M, Vartazarowa E, Hänsel T, et al. (2011) Cervicovaginal self-sampling is a reliable method for determination of prevalence of human papillomavirus genotypes in women aged 20 to 30 years. J Clin Microbiol. 49(10): 3519–22. [Crossref]
  89. Brink AA, Meijer CJ, Wiegerinck MA, Nieboer TE, et al. (2006) High concordance of results of testing for human papillomavirus in cervicovaginal samples collected by two methods, with comparison of a novel self-sampling device to a conventional endocervical brush. J Clin Microbiol. 44(7): 2518–23. [Crossref]
  90. Ogilvie GS, Patrick DM, Schulzer M, Sellors JW, et al. (2005) Diagnostic accuracy of self collected vaginal specimens for human papillomavirus compared to clinician collected human papillomavirus specimens: a meta-analysis. Sex Transm Infect. 81(3): 207–12. [Crossref]
  91. Lack N, West B, Jeffries D, Ekpo G, et al. (2005) Comparison of non-invasive sampling methods for detection of HPV in rural African women. Sex Transm Infect. 81(3): 239–41. [Crossref]
  92. Stewart DE, Gagliardi A, Johnston M, Howlett R, et al. (2007) Self-collected samples for testing of oncogenic human papillomavirus: a systematic review. J Obstet Gynaecol Can. 29(10): 817–28. [Crossref]
  93. Schmeink CE, Bekkers RL, Massuger LF, Melchers WJ. (2011) The potential role of self-sampling for high-risk human papillomavirus detection in cervical cancer screening. Rev Med Virol. 21(3): 139–53. [Crossref]
  94. Winer RL, Lee SK, Hughes JP, Adam DE, et al. (2003) Genital human papillomavirus infection: incidence and risk factors in a cohort of female university students. Am J Epidemiol. 157: 218–226. [Crossref]
  95. McCaffery K, Waller J, Forrest S, Cadman L, et al. (2004) Testing positive for human papillomavirus in routine cervical screening: examination of psychosocial impact. BJOG 111(12): 1437–43. [Crossref]
  96. UNAIDS. UNAIDS data 2017. July 2017. (Last accessed: December 2018). Available at: http://www.unaids.org/en/resources/documents/2017/2017_data_book
  97. Bessimbaye N, Moussa AM, Mbanga D, Tidjani A, et al. (2014) [Seroprevalence of HBs Ag and of anti-HCV antibodies among HIV infected people in N’Djamena, Chad]. Bull Soc Pathol Exot. 107(5): 327–31. [Crossref]
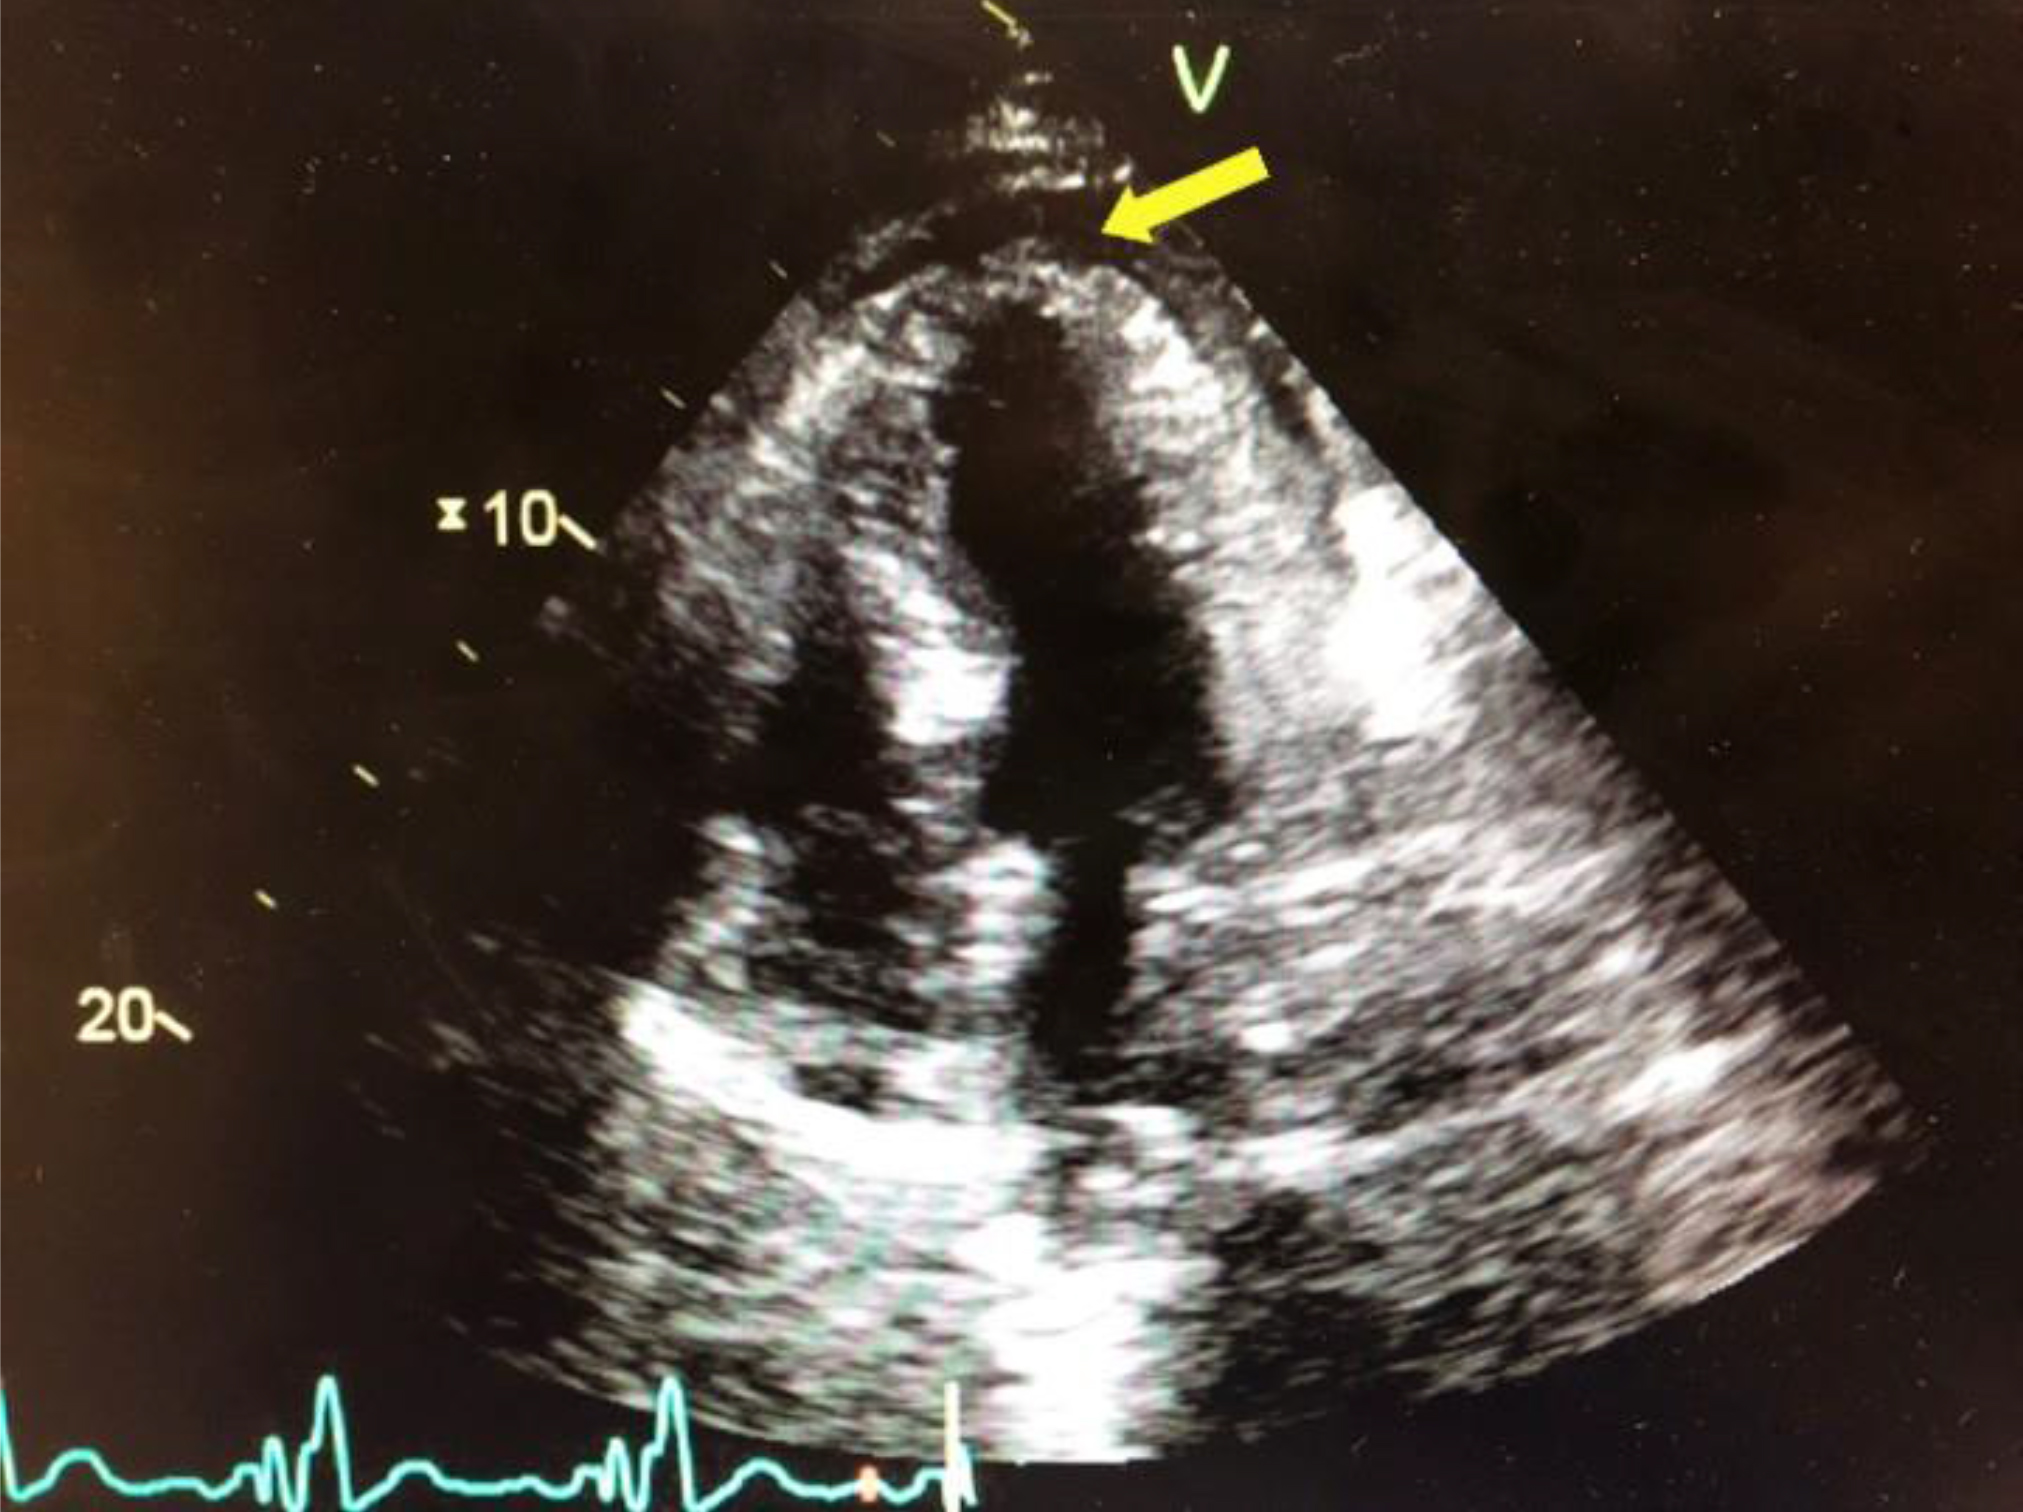
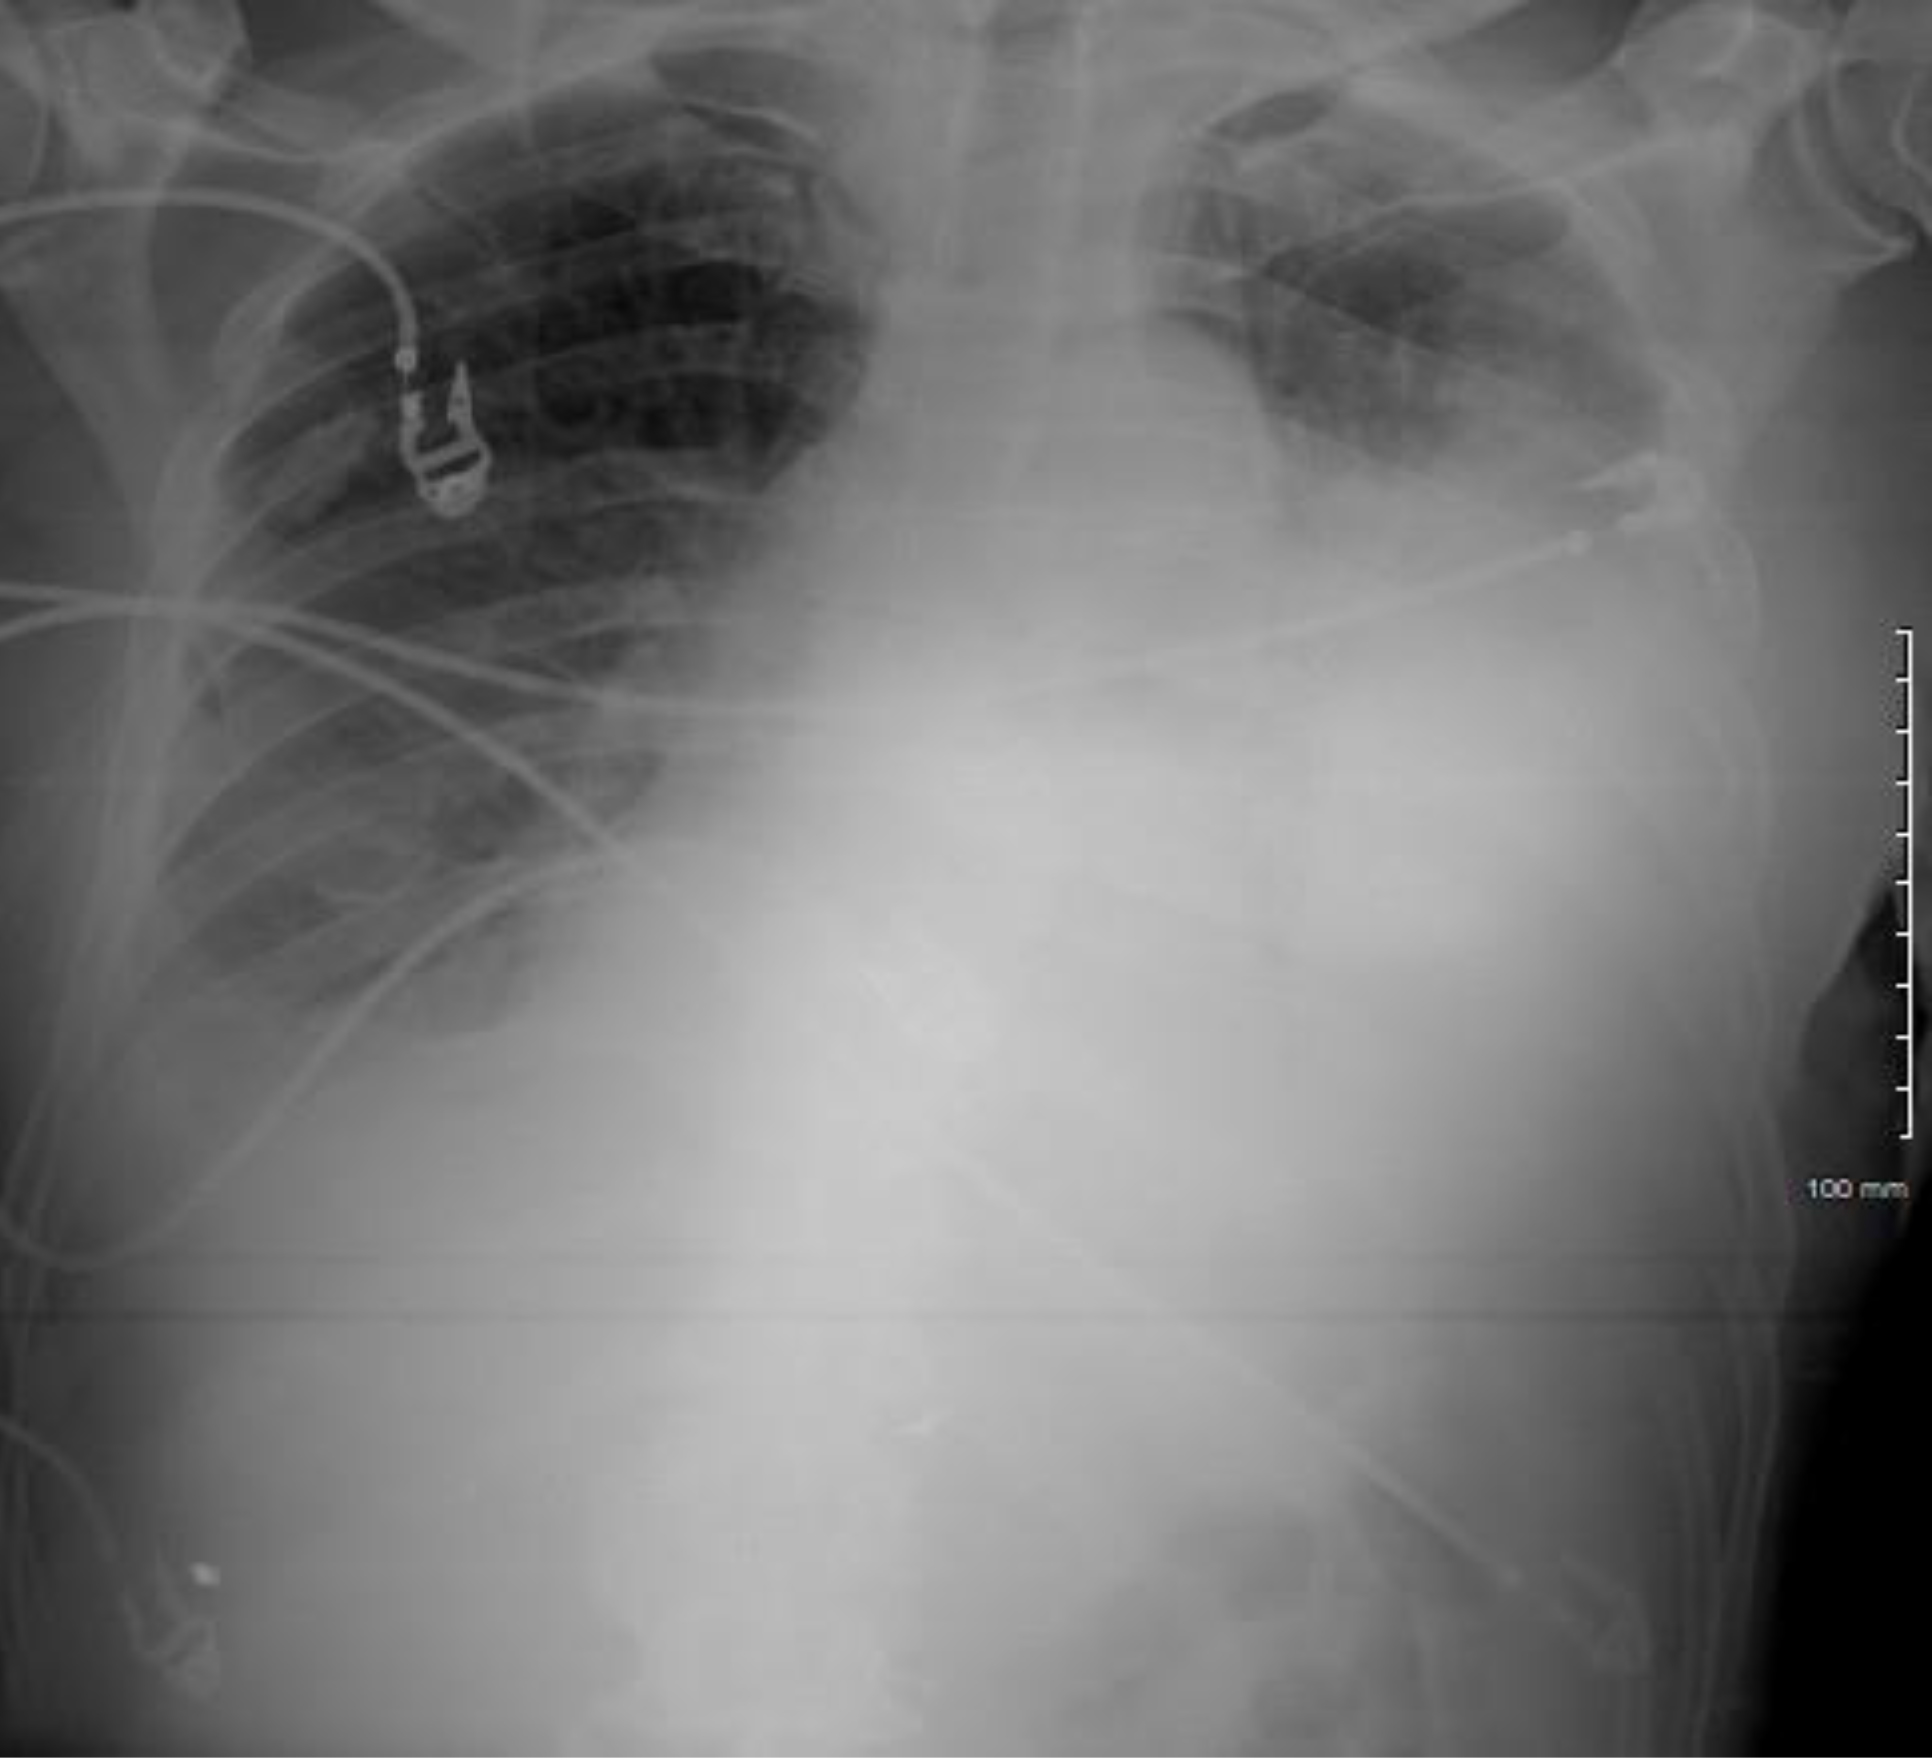
Current Trends in the Field of Bioplastics and Nanotechnology: Polylactide-ZnO Nanocomposites Designed with Multifunctional Properties

DOI: 10.31038/NAMS.2019246

Abstract

The most recent developments in the field of biobased materials are linked to nanotechnology. In order to enlarge the applications of biopolymers and to increase their performances, a large variety of nanofillers can be effectively used to produce bionanocomposites characterized by specific or multifunctional properties. Polylactide (PLA), a biodegradable polyester obtained from renewable resources, has a keyposition in the market of modern biopolymers, being one of the most promising candidates considered for further developments. The addition into PLA of surface modified nanofillers (organo-modified layered silicates, zinc oxide, graphite derivatives, carbon nanotubes, etc.) is considered as a powerful method for obtaining specific end-use characteristics and major improvements of properties.

The case study highlights recent developments, current results and trends in the field of bionanocomposites based on PLA, taking as a key example the original production of PLA-ZnO nanocomposites assessing multifunctional properties (UV screening, antibacterial activity, etc). Utilization of specifically surface-treated ZnO nanoparticles has been the main requirement to limit PLA degradation during melt-compounding and processing at high temperature. To illustrate the possibility to improve and design the properties of these nanocomposites, a special section is devoted to the effects of addition of masterbatches and selected additives (chain extenders, nucleating agents, plasticizers), recent developments that can pave the way to the larger utilization of these new biomaterials. Moreover, are emphasized the last tendencies strongly evidenced in the case of PLA, i.e., the high interest to diversify its properties and uses by moving from packaging (“disposables”) to technical applications (“durables”).

Keywords

Biopolymers; Poly(lactic acid); PLA; Nanocomposites; Nanofillers; ZnO; Silane; Additives; Multifunctional properties; UV protection; Antibacterial activity.

The “Green” Challenge: Current Interest for New Developments in the Field of Biopolymers and of Polylactide-Based (Nano)Composites

The important increase of demands for utilization of biopolymers is ascribed to a huge number of factors including the consumer requests for more environmentally sustainable products, development of new bio-based feed stocks, consideration of recycling options, increasing of price and of restrictions for the use of polymers with high “carbon footprint” of petrochemical origin, particularly in such applications as packaging, automotive, electrical and electronics industry, etc. [1–3]. Moreover, according to a recent report published by BCC Research (Global Markets and Technologies for Bioplastics (PLS050B) – February 2019), for the global bioplastics market (bio-based/non-biodegradable and biodegradable) a compound annual growth rate (CAGR) of 11.7% is estimated for the period 2018–2023.

From the category of biopolymers (Figure 1), poly (lactic acid) or polylactide (PLA) belongs undoubtedly to the most promising candidates considered for further developments, because of its renewability, biodegradability, biocompatibility, good thermal and mechanical properties. Following the current technical progress, PLA grades produced from lactide monomers of high optically purity are characterized by melting temperatures in the range 170–180 °C, while those of PLA stereocomplexes can be even higher than 220 °C [4]. Regarding the mechanical properties, PLA is characterized by a noticeable high tensile strength (50–70 MPa) and rigidity (i.e. Young’s modulus is given in the range 2000–3000 MPa), but it also has some drawbacks, e.g., the brittle behaviour and low ductility, therefore PLA modification is highly considered to have improved characteristics [2,5].

NAMS-2019_Marius Murariu_F1

Figure 1. Global production capacities (2018) for bioplastics by polymer type (adapted, source European Bioplastics, nova-Institute (2018))

PLA is currently receiving a great attention for conventional utilization such as packaging materials, as well as production of textile fibers. As this biodegradable polyester is considered as an important alternative for the partial substitution of polymers of petrochemical origin, there is therefore a strong demand to extend the range of PLA properties [5]. The last tendencies show as evidence that improved PLA products and new grades with higher added value are especially required for engineering applications (transportation, electronic and electrical devices, mechanical and automotive parts, etc.). Consequently, for a larger utilization the profile of PLA properties is tuned up by combining the polyester matrix with reinforcing fibres, micro- and nano-fillers, flame retardants, impact modifiers, plasticizers, other additives of speciality. Furthermore, in order to produce more performant “bio-based” products, there is also the growing trend for the production of blends of biopolymers [6] with petrochemical-based plastics (NB: in the absence or presence of nanofillers [7,8]) and this is seen as a possibility to extend their market as durable products/materials in cars, cell phones, and many other applications.

On the other hand, in relation to the production of PLA nanocomposites, it is important to remind that the polymer-based nanocomposites are known to be a radical alternative to conventionally micro-filled polymers due to their improved characteristics (high strength and rigidity, thermal stability, barrier properties, flammability resistance, electrical and optical, or other specific properties) obtained at low nanofiller loadings as low as 1–5 wt.%. The transition from micro- to nanoparticles yields dramatic changes in the properties of polymers since many important chemical and physical interactions are governed by the properties of high surface nanoscale-dispersed fillers having different morphologies (Figure 2). Thus, the addition into PLA matrix of adequately modified nanofillers with 1–3D nano-dimensions (e.g., organo-modified layered silicates (OMLS), silver, zinc oxide (ZnO), graphite/graphene derivatives, carbon nanotubes (CNT), silica, polyhedral oligomeric silsesquioxanes (POSS), magnetite, (bio) nanoparticles such as starch and cellulose nanocrystals, etc.) is considered as an interesting approach that can lead to major improvements of PLA characteristic features (mechanical, thermal, barrier, etc.) [2]. Furthermore, these nanocomposites can be characterized by specific end-use properties such as anti-UV and anti-bacterial, antistatic to conductive electrical characteristics, enhanced wear resistance, fire-retardancy, superparamagnetic properties, increased biodegradability, higher crystallization speed, and so on. Still, it is assumed by us that especially the “durable” applications are requiring more and more new high-performance materials/nanocomposites showing multifunctional properties.

NAMS-2019_Marius Murariu_F2

Figure 2. Nanofillers with “1–3D” nano-dimensions that are currently used to produce PLA nanocomposites (adapted from [2,10])

As it comes out from the State of the Art, as well as by considering the R&D topics conducted by Authors’ research group, many developments related with the field of nanotechnology are focused on the original production of novel bionanocomposites such as based on bio-sourced and biodegradable PLA [2,9]. Furthermore, designing polymer nanocomposites with multifunctional properties can be considered as one of the last key tendencies. For better illustration of these trends, selected results relied upon the original production of innovative nanocomposite materials using PLA as polyester matrix and ZnO as nanofiller, are summarized hereinafter as representative case study.

PLA-ZnO Nanocomposites with Multifunctional Properties, a Case Study

ZnO is well-known environmentally friendly and multifunctional inorganic filler characterized by effective antibacterial function and intensive ultraviolet absorption [11,12]. Until now, ZnO as well as other zinc-related compounds have been successfully utilized as effective catalysts for lactide polymerization and in “unzipping” depolymerization of PLA that allows its chemical recycling. In this context, it is reasonable to expect that the dispersion of untreated ZnO nanoparticles within PLA matrix will generate its dramatic degradation, especially at high temperature, e.g., along with its melt-processing [13]. Clearly, this is the main reason explaining the low number of studies regarding the production of PLA-ZnO nanocomposites using the melt-compounding approach.

Utilization of specific surface treated ZnO nanoparticles, a main requirement

The first objective was to make PLA matrix less susceptible to the catalytic action of ZnO nanoparticles (NPs) during melt-compounding and subsequent film/fiber or injection molding processing. Our studies have indeed revealed that the addition of untreated ZnO (NPs with a morphology like “rods” of length up to 100 nm, diameter of ~15–30 nm) leads to the dramatic degradation of PLA matrix. Thus, various filler surface treatments with selected additives (stearic acid, stearate derivatives, (fatty) amides, etc.) were tested but they have shown low effectiveness. Contrary to the untreated nanofiller, surface-treated ZnO by a specific silane containing lipophilic caprylyl groups (i.e., 4% triethoxycaprylylsilane) was found to lead to nanocomposites characterized by noticeable thermo-mechanical performances (e.g., tensile strength in the interval 55–65 MPa), while the onset of thermal degradation was significantly increased by 20 to 40 °C with respect to the samples containing 1–5% non-treated nanofiller [13]. Such improvements in view of their utilization in production of films or fibers, injection/extruded products, etc, were ascribed to the effect of –Si-O-Si-O- layers, which cover the surface of nanofiller and behave as barrier, effectively limiting the catalytic degradation effect of ZnO on the surrounding polyester matrix. Furthermore, as highlighted by TEM (Transmission Electron Microscopy) images (Figure 3), the surface coating by silane allows for a finer dispersion and distribution of ZnO nanoparticles through the PLA matrix. Regarding the specific end-use applications of PLA-ZnO (silane-treated) nanocomposites, they show multifunctional properties such as antibacterial effects (against both gram-positive and gram-negative bacteria), barrier and UV protection [13,14]. Indeed, films of PLA-ZnO nanocomposites assess an effective UV protection (Figure 4) evidenced on an amount of nanofiller as low as 1%. On the other hand, mats of PLA-ZnO nanocomposite fibers display a faster antibacterial action as evidenced at 3% ZnO loading (Table 1)[13,15] due to the high surface area of the related fibers. Following these promising results, higher quantities of nanocomposites were produced by melt-compounding PLA (various molecular weights) with ZnO(s) (silane-treated) using laboratory twin-screw extruders and tested for the first time with promising results to produce films and fibers. Lastly, we assume that the melt-blending approach successfully developed by us to produce these specific bionanocomposites can have larger applicability with respect to other techniques, such as solvent casting or 3D-printing method.

NAMS-2019_Marius Murariu_F3

Figure 3. TEM pictures at different magnifications of PLA -1% ZnO nanocomposites obtained by melt-compounding (twin-screw extruders) attesting for the good nanofiller dispersion within PLA matrix.

NAMS-2019_Marius Murariu_F4

Figure 4. UV-vis spectra of PLA- ZnO(s) (silane-treated) films compared to the neat PLA proving the total UV screening in the case of nanocomposites.

Table 1. Results of antibacterial tests (24h) for knitted fabrics (PLA and PLA/3% ZnO) on: (a) gram-positive and (b) gram-negative bacteria, [13]

Type of bacteria

Sample

Average (log CFU)

Growth
(G)

Antibacterial activity (A)

0 h

24 h

a) Staphylococcus aureus gram-positive bacteria

PLA (C)

4.69

6.90

F = 2.21

(A = F – G)
A = 4.3

PLA/3% ZnO

4.66

2.57

G = -2.09

b) Klebsiella pneumoniae gram-negative bacteria

PLA (C)

4.66

7.63

F = 2.97

A = 6.67

PLA/3% ZnO

4.70

1.00

G = -3.70

Abbreviation: CFU = colony forming units; A = antibacterial activity; C= control/reference sample; F = (logC24 − logC0) and G = (logT24 − logT0) represent respectively the growth values in presence of neat PLA sample (control/without ZnO), while G corresponds to the growth values in presence of treated samples (PLA- 3% ZnO nanocomposites).
(NB: Antibacterial activity >3.0 means reduction in bacteria number > 99.9 %)

Recent progress in designing PLA-ZnO nanocomposites with tailored properties

In the great majority of cases, the properties of polymer nanocomposites can be improved, designed and “tailored” to answer to the requirements of end-use applications. As mentioned before, PLA-ZnO nanocomposites were successfully tested in the production of fibers, films or other items, showing multifunctional properties (protection against UV radiation, antibacterial, barrier, etc.). However, for some specific requests they can have some limitations (e.g., low ductility and crystallization rate, relatively low stability at high temperature and long residence time), which can affect their processing and final performances of products.

It is also worth recalling that PLA is very sensitive to temperature, shear and hydrolysis during melt-processing. Besides, in many cases the mixing of PLA with additives and nanofillers is followed by the important drop of molecular weights, together with the loss of thermal, rheological and mechanical properties. Unfortunately, in the case of industrial applications and especially at high processing temperature and/or long residence time, PLA and its nanocomposites do not show the advanced stability that can be required by end users, since the decrease of molecular parameters can strongly affect their melt-fluidity and processing ability, thermal and mechanical properties. Therefore, the control of thermal degradation of PLA-ZnO nanocomposites represents a major challenge.

Utilization of chain-extenders: To improve the processing and performances of PLA nanocomposites such as their stability at high temperature, the addition of selected chain-extenders (CE) can be considered [16]. Indeed, some recent studies revealed that the co-addition of nanofiller (ZnO) and of epoxy functional styrene-acrylate oligomeric CE (Joncryl® ADR 4300F) leads to significant enhancements of the properties (molecular, rheological, thermal, etc.) of PLA-ZnO nanocomposites. As one key result, adding 1% CE into nanocomposites the PLA molecular weights are found to be nearly twofold higher. Moreover, as it is shown in Table 2 the samples containing CE were characterized by a higher T5% (the onset of thermal degradation), while the isothermal tests at high temperature (220°C and 240°C) proved a very significant gain in thermal stability at longer residence time [16]. CE addition also plays a key role refining the processability by extrusion of relatively highly filled nanocomposites (e.g., with 3–5% ZnO) to produce films. This is ascribed to the rheological improvements, i.e., low MFI, increased viscosity and melt-strength in the molten state. The good dispersion/distribution of ZnO nanoparticles at nanoscale level was evidenced once more by TEM, whereas the specific end-use properties following ZnO addition are once more confirmed (e.g., UV protection).

Table 2. Effects of CE addition on initial decomposition temperature (T5%) and max. decomposition temperature (Td) of PLA–ZnO(s) nanocomposites as determined by TGA (under airflow, 20 °C/min)

Sample
composition

Temperature of 5% weight loss (T5%), °C

Temperature of max. rate of degradation (Td), °C

1% ZnO(s)

325

361

1% ZnO(s) /0.5% CE

330

367

1% ZnO(s) /1% CE

336

365

3% ZnO(s)

313

354

3% ZnO(s) /0.5% CE

317

360

3% ZnO(s) /1% CE

325

361

5% ZnO(s)

307

353

5% ZnO(s) /1% CE

318

357

PLA- (20–40)% ZnO as masterbatch: To offer more flexibility to the potential users in relation to the choice of loading in ZnO NPs and to lead to more competitive products by better control of PLA molecular weights and processing, the effects of masterbatch (MB) addition on the properties of PLA nanocomposites have been studied [17]. First, highly filled PLA-ZnO MBs containing up to 40% silane-treated ZnO(s) have been successfully produced by melt-compounding. Subsequently these MBs have been used for producing films containing up to 3% ZnO(s) nanofiller. A shorter residence time of PLA in presence of ZnO (recognized for its degrading effect) using the MB approach is seen as the way to lead to nanocomposites (products) characterized by improved properties. Some key-advantages conferred by utilization of MB techniques in the production of PLA-ZnO(s) nanocomposite films are mentioned hereafter.

  • Processing: a better extrusion ability is typically observed by processing blends of virgin PLA and MBs (PLA- 40% ZnO(s)), which is ascribed to a higher viscosity of the molten polymer and to the lower degradation of PLA during extrusion (better molecular parameters)
  • Thermal properties: the films obtained via the MB approach show improved thermal parameters (the onset of temperature of degradation (T5%) is increased by ca. 20 °C) by comparing to those obtained using the traditional two-step method to produce films (i.e., melt-compounding to obtain nanocomposites, and then, reprocessing by extrusion to produce films)
  • Morphology: remarkable quality of ZnO dispersion trough PLA matrix even using highly filled MBs (i.e., 40% ZnO(s)).

PLA-ZnO nanocomposites with improved crystallization ability and increased ductility: It is important to remind that PLA shows several drawbacks such as the brittle behavior, high sensitivity to hydrolysis and low crystallization rate. Particularly, the low crystallization extent of PLA represents a major limitation with respect to many other thermoplastics. For instance, under usual injection molding conditions, i.e., at high cooling rates, mostly amorphous items can be obtained from most commercially available PLA grades. In fact, this is a kind of “Achilles’ heel” limiting PLA use in high-performance applications [18]. On another side, the degree of crystallinity does represent an essential parameter to control the degradation rate of PLA as well as its thermal resistance, optical, mechanical and barrier properties. Thus, to complete the panel of properties of PLA-ZnO nanocomposites by producing new formulations characterized by significant improvements in crystallization properties, the addition of different nucleating agents (NA) has been considered. A remarkable increase of the degree of crystallization and concomitant important enhancements in the rate of crystallization can be obtained by adding 0.5–1% phenylphosphonic acid zinc (PPA-Zn) as NA in PLA-ZnO(s) nanocomposites. Undeniably, by adding PPA-Zn the degree of crystallinity of PLA as determined by Differential Scanning Calorimetry (DSC) proved to be dramatically increased in the range 40–50% with respect to values of only 3% for nanocomposites without any NA. Furthermore, only nanocomposites containing NA show clear-cut crystallization properties during DSC cooling from the molten state (Figure 5).

NAMS-2019_Marius Murariu_F5

Figure 5. DSC analyses of PLA – ZnO(s) nanocomposites to show the effectiveness of nucleating agent (NA) addition on PLA crystallization properties (DSC method: cooling by 10°C/min from the molten state, followed by a second DSC heating by 10°C/min)

On the other hand, for applications requiring high ductility and impact resistance, addition of plasticizers such as tributyl citrate (TBC, 15 – 20%), is beneficial to tailor their mechanical properties (i.e., decrease of rigidity/Young’s modulus, increase of strain at break, etc.). Accordingly, it means that by finely tuning their formulation, PLA-based bionanocomposites can be delivered with desired mechanical properties (Table 3), going in the case of PLA-ZnO(s) nanocomposites from higher strength and rigidity, to materials with lower stiffness and increased ductility/strain at break [19].

Table 3. Effect of selected additives on the mechanical properties of PLA – 3% ZnO(s) nanocomposites (specimens type V, ASTM D638, v = 1 mm/min; abbreviations: CE = chain extender; NA = nucleating agent; TBC = Tributyl citrate (plasticizer))

Sample

Max. tensile strength, MPa

Young’s modulus,
MPa

Strain at break,
%

PLA- 3% ZnO

62 (± 1)

2300 (± 150)

4.9 (± 0.2)

PLA- 3% ZnO- 1% CE

65 (± 2)

2250 (± 250)

6.6 (± 3.0)

PLA- 3% ZnO- 1% NA

66 (± 2)

2600 (± 100)

4.2 (± 0.4)

PLA- 3% ZnO- 15% TBC

33 (± 2)

1850 (± 100)

200 (± 30)

Synergies of properties and realization of hybrid nanocomposites

By considering the recent trends, it is noteworthy mentioning that another direction of great attention in the field of bionanocomposites is the combination of nanofillers of different nature/morphology to produce hybrid nanocomposites with improved/multifunctional end-use characteristics. In this goal, ZnO (recognized for its photocatalytic properties [20] and antibacterial activity) can be combined with other NPs, e.g., silver nanoparticles [21, 22] to improve the antibacterial effects, while other properties such as UV screening will be preserved. Again, fine dispersion of the nanoparticles remains a challenge for advanced performances, whereas new experimental pathways comprising different synergies (e.g., between ZnO and other NPs), combinations of NPs and special techniques of production can undoubtedly increase the potential of these nanocomposites as “green” products for new applications.

As preliminary conclusion in relation to this case study, these selected examples are revealing that following the specific surface treatment of NPs (i.e., ZnO) and by addition of selected additives it is possible to produce PLA-based nanocomposites tailored with multifunctional properties (UV screening, antibacterial activity, barrier properties, self-cleaning…). As novelty, the production of PLA-ZnO nanocomposites via melt-compounding open the way to environmentally friendly new products that can be of further extrapolated at larger scale to produce fibres, films, other products (Figure 6). The possibility of chemical recycling at the end-use life (ZnO as catalyst) and the biodegradation as option are completing the panel of properties of these bionanocomposites.

NAMS-2019_Marius Murariu_F6

Figure 6. Semi-finished products (films, plates, fibers) produced at laboratory scale using the new PLA-ZnO nanocomposites.

Concluding Remarks and Future Prospects

To summarize, the following conclusions can be drawn in relation to the current trends in the field of biopolymers and particularly for the designing of PLA bionanocomposites with specific end-use properties:

  • High interest for utilization of biopolymers (PLA as one key-candidate) and promotion of environmentally friendly products obtained in the field of nanotechnology.
  • In response to the demand for enlarging PLA applications/properties, a large variety of nano-fillers (1–3D) can be effectively used to produce novel bionanocomposites with specific or multifunctional properties.
  • The adequate surface treatment of NPs is the key-solution for increased performances. Specific ZnO silanization was necessary to limit the decrease of PLA molecular and thermo-mechanical parameters, while the nanocomposites show excellent nanofiller dispersion and specific end-use characteristics.
  • PLA-ZnO nanocomposites: “tailored” formulations obtained by melt-compounding are available for extrapolation at larger scale. By considering the specific end-use properties, these nanocomposites are interesting as new materials for special packaging, textile products, electrical/electronic and household appliances, etc.

By considering the last information from the State of the Art, it is very clear that nanotechnology can further lead to an important technical progress in the field of bio-based materials. At the moment, some expectations are not totally confirmed, thus it can be assumed that this can be only a problem of time by considering that the industrial production of some biopolymers (e.g., PLA) is of recent date. However, in the case of biopolymers that have been initially considered for their biodegradability, it will be a hard work to attest their utilization in durable applications, because this needs a change of perception, that must follow the current state of the development. In this context, it is easier to implement the “nanotechnology” concept by using polymer matrices that have confirmed in the past as materials of high performance (e.g., engineering polymers) and having good resistance to aging. By considering the restrictions connected to the utilization of petrochemical polymers with high carbon footprint, association of nanotechnology and biopolymers can be successfully valorized on the market. Nevertheless, new bionanocomposites (such as the ones based on PLA) are very promising materials since they could show improved performances (high strength and rigidity, thermal stability, low flammability, antistatic to conductive electrical characteristics, anti-UV or antibacterial protection…) while maintaining the specific properties of biodegradability of the polymer matrix. Furthermore, it can be expected an increased interest for the implementation of new PLA grades in engineering (durable) applications without excluding the conventional uses, such as packaging materials, as well as production of fibers. As a final point, it can be assumed that the new bionanocomposites characterized by tailored or multifunctional properties can represent an excellent opportunity for the larger application of biopolymers.

Acknowledgments

Authors thank the Wallonia Region, Nord-Pas de Calais Region and European Community for the financial support in the frame of the IINTERREG IV – NANOLAC project. They also thank to Anne-Laure Dechief and Oltea Murariu for contribution in realization of experiments and all collaborators for helpfully discussions. Authors thank the European Commission and Wallonia Region (FEDER program 2014–2020) for the financial support in the frame of PROSTEM project (Biofunctional microcarriers for production and application at large scale of stem cells) and MACOBIO project (Low carbon footprint).

References

  1. Murariu M, Laoutid F, Dubois P, Fontaine G, Bourbigot S, et al. (2014) Chapter 21 – Pathways to Biodegradable Flame Retardant Polymer (Nano)Composites. In Polymer Green Flame Retardants, Papaspyrides, C.D.; Kiliaris, P., Eds. Elsevier: Amsterdam 709–773.
  2. Raquez JM, Habibi Y, Murariu M, Dubois P (2013) Polylactide (PLA)-based nanocomposites. Progress in Polymer Science 38: 1504–1542.
  3. Babu RP, O’Connor K, Seeram R (2013) Current progress on bio-based polymers and their future trends. Prog Biomater 2: 8.
  4. Tsuji H (2016) Poly(lactic acid) stereocomplexes: A decade of progress. Advanced Drug Delivery Reviews 107: 97–135.
  5. Murariu M, Dubois P (2016) PLA composites: From production to properties. Advanced Drug Delivery Reviews 107: 17–46.
  6. Nofar M, Sacligil D, Carreau PJ, Kamal MR, Heuzey MC (2019) Poly (lactic acid) blends: Processing, properties and applications. International Journal of Biological Macromolecules 125: 307–360.
  7. Ebadi-Dehaghani H, Khonakdar HA, Barikani M, Jafari SH (2015) Experimental and theoretical analyses of mechanical properties of PP/PLA/clay nanocomposites. Composites Part B: Engineering 69: 133–144.
  8. Ploypetchara N, Suppakul P, Atong D, Pechyen C (2014) Blend of Polypropylene/Poly(lactic acid) for Medical Packaging Application: Physicochemical, Thermal, Mechanical, and Barrier Properties. Energy Procedia 56: 201–210.
  9. Basu A, Nazarkovsky M, Ghadi R, Khan W, Domb AJ (2017) Poly(lactic acid)-based nanocomposites. Polymers for Advanced Technologies 28: 919–930.
  10. Kumar AP, Depan D, Singh Tomer N, Singh RP (2009) Nanoscale particles for polymer degradation and stabilization—Trends and future perspectives. Progress in Polymer Science 34: 479–515.
  11. Shankar S, Wang LF, Rhim JW (2018) Incorporation of zinc oxide nanoparticles improved the mechanical, water vapor barrier, UV-light barrier, and antibacterial properties of PLA-based nanocomposite films. Materials Science and Engineering: C 93: 289–298.
  12. Kim I, Viswanathan K, Kasi G, Sadeghi K, Thanakkasaranee S, et al. (2019) Poly(Lactic Acid)/ZnO Bionanocomposite Films with Positively Charged ZnO as Potential Antimicrobial Food Packaging Materials. Polymers 11: 1427.
  13. Murariu M, Doumbia A, Bonnaud L, Dechief AL, Paint Y, et al. (2011) High-Performance Polylactide/ZnO Nanocomposites Designed for Films and Fibers with Special End-Use Properties. Biomacromolecules 12: 1762–1771.
  14. Pantani R, Gorrasi G, Vigliotta G, Murariu M, Dubois P (2013) PLA-ZnO nanocomposite films: Water vapor barrier properties and specific end-use characteristics. European Polymer Journal 49: 3471–3482.
  15. Doumbia AS, Vezin H, Ferreira M, Campagne C, Devaux E (2015) Studies of polylactide/zinc oxide nanocomposites: influence of surface treatment on zinc oxide antibacterial activities in textile nanocomposites. Journal of Applied Polymer Science 2015: 132.
  16. Murariu M, Paint Y, Murariu O, Raquez JM, Bonnaud L, et al. (2015) Current progress in the production of PLA–ZnO nanocomposites: Beneficial effects of chain extender addition on key properties. Journal of Applied Polymer Science  2015: 132.
  17. Murariu M, Benali S, Paint Y, Bonnaud L, Dubois P (2015) In Adding value in production of PLA – ZnO nanocomposites through novel techniques, Conference proceedings MdC, Mons, Belgium.
  18. Murariu M, Dechief AL, Ramy-Ratiarison R, Paint Y, Raquez JM, et al. (2015) Recent advances in production of poly(lactic acid) (PLA) nanocomposites: a versatile method to tune crystallization properties of PLA. Nanocomposites 1: 71–82.
  19. Murariu M, Benali S, Raquez JM, Dubois P (2017) In Designing the properties of PLA – ZnO nanocomposites for new applications, Conference proceedings BIOPOL, Mons, Belgium.
  20. Therias S, Larché JF, Bussière PO, Gardette JL, Murariu M, et al. (2012) Photochemical Behavior of Polylactide/ZnO Nanocomposite Films. Biomacromolecules 13: 3283–3291.
  21. Shameli K, Ahmad MB, Yunus WMZW, Ibrahim NA, Rahman RA, et al. (2010) Silver/poly (lactic acid) nanocomposites: preparation, characterization, and antibacterial activity. Int J Nanomedicine 5:573–579.
  22. Chu Z, Zhao T, Li L, Fan J, Qin Y (2017) Characterization of antimicrobial poly (lactic acid)/nano-composite films with silver and zinc oxide nanoparticles. Materials 2017: 10.

Animal Models of Tinnitus: A Review

DOI: 10.31038/OHT.2020111

Synopsis

Animal models have significantly contributed to understanding the pathophysiology of chronic subjective tinnitus. They are useful because they control etiology, which in humans is heterogeneous; employ random group assignment; and often use methods not permissible in human studies. Animal models can be broadly categorized as either operant, or reflexive, based on methodology. Operant methods use variants of established psychophysical procedures to reveal what an animal hears. Reflexive methods do the same using elicited behavior, e.g., the acoustic startle reflex. All methods contrast the absence of sound and presence of sound, since tinnitus cannot by definition be perceived as silence.

Keywords

Animal models, acoustic startle reflex, operant behavioral methods, tinnitus, psychophysics

Key Points

  1. At present there is no standard animal model of tinnitus. Two contemporary types of models are reflexive and operant; each has positive and negative features.
  2. Reflexive models trace their origin to an experiment of Turner et al. [1]; operant models trace theirs to an experiment of Jastreboff et al. [2].
  3. Caution is advised to distinguish between animal tinnitus studies that independently confirm the presence of tinnitus, and those that do not.

Introduction

Tinnitus in the present review refers to chronic subjective tinnitus, which has no identifiable acoustic correlate. Despite the common name, “ringing in the ears,” its source(s) appear to be primarily in the central nervous system rather than the auditory periphery. Acute tinnitus commonly follows a single exposure to high-level sound or a high dose of aspirin, and typically resolves within minutes to hours. As such it is not of medical concern. In contrast, chronic tinnitus, estimated to affect 35 – 50 million adults in the US [3], most commonly follows auditory trauma or chronic hearing loss and often persists for a lifetime[4]. It has been estimated that about five percent of those experiencing chronic tinnitus seek medical treatment. Although common, and recognized since the time of Galen [5], the pathophysiology of tinnitus is incompletely understood. This contributes to the absence of generally effective treatments, although a standard of care has been established [6, 7]. Tinnitus is typically perceived as a simple sound, a ringing or buzzing sensation, but its pathophysiology is far from simple.

Animal Tinnitus Models

Tinnitus appears to be a primitive hearing disorder. This is not to say that its pathology is simple, but rather that it derives from basic neurophysiological mechanisms likely to be present in animals as well as humans [8]. Animal models have been available since 1988 [2], and have contributed significantly to understanding the neuroscience of tinnitus[9,10]. Although animal models only approximate the human condition, their advantages over clinical studies are several. Most notably: (a) they directly control etiology, (b) they permit application of many experimental tools, from behavioral to molecular, and (c)random assignment to experimental groups enables the use of more powerful inferential statistics as well as attribution of cause. The key problem in developing an animal tinnitus model is objective and reliable assessment, rather than induction. In humans tinnitus can be induced by many conditions. These conditions have in common the reduction of peripheral signal to the brain[11–13].In animals, tinnitus has been induced using systemic treatment with salicylates [2, 14–17], ototoxic exposure [18–20], surgical disruption of the cochlea [21], and acoustic over exposure[19, 22–24]. These methods draw upon factors known to affect tinnitus in humans. The key to solving the assessment problem was provided by Jastreboff and colleagues [25]. Although tinnitus might sound like anything to an animal (or human), it can never sound like silence. All animal models of tinnitus use behavioral methods that differentiate how animals respond to sound versus silence. Typically animal studies also include one or more normal-hearing control groups. Although considerable effort has been invested in finding valid and reliable direct measures of tinnitus that do not involve behavior, at present behavioral methods are used exclusively for at least two reasons: There is no procedure for either reliably producing or determining tinnitus alone, without potential confounds. A presumptive tinnitus state might be derived from associated phenomena such as hearing loss, hyperacusis, or drug side effects. Behavioral methods enable such confounds to be more clearly sorted out. It should be noted that many presumptive tinnitus animal experiments have examined the effects of conditions likely to cause tinnitus, such as high-level sound exposure or ototoxic damage, without directly confirming the presence of tinnitus. These experiments can be informative about the consequences of auditory insults, but should be interpreted cautiously with respect to tinnitus. Not all humans exposed to acoustic trauma, or other insults develop tinnitus [26]. Similarly it has been shown that not all animals exposed to tinnitus-inducing procedures display evidence of tinnitus[27–29]. Therefore, experiments that only examine the consequence of manipulations that typically produce tinnitus, without objective confirmation, are likely to include animals without tinnitus and therefore could be reporting the effects of something other than tinnitus. Unfortunately there is no generally accepted, or standard, animal model of tinnitus against which others can be validated. Existent models have their respective strengths and weaknesses. For overview purposes, animal models can be divided into two broad categories: Models that interrogate animals about their auditory experience, and models that examine alteration of an auditory reflex. Interrogative models, hereafter called operant models, loosely following the terminology of Skinner [30], examine the effect of tinnitus on voluntary, or emitted behavior that is modified by training in an acoustic environment. These models have the general advantage of relying on auditory perception. As such, animals evaluate what they are hearing and differentially respond on the basis of their evaluation. Because operant methods require animals to report what they are hearing, they have conceptual features in common with the interrogation of humans with tinnitus, i.e., analogous to asking “what do you hear?” Operant models tap into functions in many brain areas, including areas outside those commonly defined as auditory. Although this aspect of operant models might be considered a shortcoming, it is also a strength, in that contemporary research has shown tinnitus to be mediated by widely distributed alterations in brain function[11, 31–34]. A shortcoming of operant models is that they require training and motivating subjects, interventions that can be both time consuming and requiring careful experimental control. In contrast, reflexive animal models rely on unconditioned reflexes, such as the acoustic startle response, and do not require either training or motivation management. Reflexive methods, such as sound gap inhibition of acoustic startle (GPIAS), are also rapid, and therefore well suited to determining the time course of tinnitus development. These features probably account for the current widespread use of GPIAS in animal tinnitus experiments. Although widely used, GPIAS models are not without their own issues and complexities. A further consideration is that the acoustic startle reflex, on which GPIAS is based, depends primarily on brainstem circuits [35]. Therefore the neurophysiological substrate driving the reflexive behavior assessed by GPIAS, might not have the same substrate indicated by operant models.

GPIAS Models

Animal research: More than ten years ago a new method for tinnitus screening in laboratory animals was introduced by Turner and colleagues [1]. This paradigm utilizes the acoustic startle reflex which is ubiquitously expressed in mammals and consists of contraction of the major muscles of the body following a loud and unexpected sound [36] (Fig.1, A). This reflex is reduced when preceded by a silent gap embedded in a soft background noise or tone (Fig.1, B). Gap detection is typically assessed by the ratio between the magnitude of the startle stimulus presented alone (no-gap trial) and trials in which a gap preceded startle stimulus (gap trials), also known as gap-prepulse inhibition of the acoustical startle (GPIAS) [1]. Reduced inhibition, following acoustic trauma or sodium salicylate treatments is assumed to reflect tinnitus perception: When tinnitus is qualitatively similar to the background noise, it “fills in” the gap and hence, reduces inhibition (Figure 1).

OHT-19-101_Alexander Galazyuk_F1

Figure 1. Schematic description of the GPIAS assay for tinnitus. A.A startle wideband noise stimulus 20 ms duration (vertical bar) is inserted into a narrowband noise or pure tone background without gap (no gap; top row) and with a gap (middle and lower rows)20 to 50 ms duration and presented 50 ms before the startle. B.An animal startle responses to the startle stimulus. The response amplitude shown by the height of the startle response waveform (top row). In animals without tinnitus, the gap greatly suppresses the startle response amplitude (middle row). In animals with tinnitus (bottom row), the gap is filled by the tinnitus (shaded rectangular within the gap) and the startle response ismuch less compared to the tinnitus free animals (middle row).

This method was enthusiastically adopted and is now widely used by many scientists in the field due to its relative simplicity over the other methods of tinnitus assessment. Since it is based on a reflex, the method is much cheaper and faster than other methods requiring training animals for weeks or months [22, 59]. It also allows for tinnitus screening of a large number of animals testing simultaneously in multiple testing boxes. Comparing of animals’ gap detection performances before and after tinnitus induction allows to separate tinnitus positive from tinnitus negative animals. The possibility of using this method for scientists with little experience in animal behavior and an opportunity to apply this methodology for tinnitus assessment in humans, made GPIAS to dominate in the field of tinnitus research. The GPIAS methodology has been improved upon over the last decade [37, 38]. It has been shown that careful considerations of GPIAS parameters such as the startle stimulus and background intensities, acoustical parameters of the gap of silence preceding the startle, and overall duration of a testing session, greatly improve results of GPIAS testing in laboratory animals [39].Recent research also demonstrated large variability in GPIAS measurements between different days of testing especially in mice [40]. Therefore averaging these results across multiple testing sessions greatly increases statistical power of the obtained data and improves the reliability of tinnitus assessments. Recent improvements to startle response magnitude assessments [41, 42] and various methods of startle response separation from animals’ ambient movements [41, 43] greatly improve GPIAS data analysis. In small rodents the whole body startle reflex is relatively easy to measure, but in larger, less active mammals, such as the guinea pig, it habituates very rapidly. Therefore the pinna reflex measurement technique has been suggested to be used instead of whole body startle reflex during GPIAS sessions [44, 45]. Despite years of using GPIAS for tinnitus assessment in various laboratory animals, the field continues to debate the original “filling-in” interpretation of the paradigm. In a study conducted on mice, the placement of the gap of silence either closer or further away from the proceeding startle stimulus could dramatically alter gap detection performance in mice [46]. Therefore the authors raised a doubt as to whether tinnitus is “filling-in” the gap, otherwise the gap placement before the startle should not have a large effect on animal’s gap detection performance. Importantly however, the most significant debates concerning GPIAS methodology on animals largely depend on successful demonstration that the method is capable of assessing tinnitus in humans.

Human research: One of the main advantages of GPIAS over other methods is that it can be used in both laboratory animals and humans [37]. Several research labs have attempted to apply GPIAS method on humans for tinnitus assessment. Eye blink was proposed to be used instead of whole body startle reflex in these studies. These experiments had a significant advantage over the animals’ studies because in humans, exact tinnitus parameters such as intensity and spectrum we can identified by tinnitus self-reports. If so, during GPIAS testing it is possible to match the background sound parameters to a person’s tinnitus characteristics which would theoretically optimize the success of the GPIAS. Unfortunately, in one of these studies it was found that gap detection performance in tinnitus patients did not depend on whether the individuals have tinnitus or not [47]. Another study showed a difference in dap detection performance between tinnitus patients and controls [48]. However this deficit was not linked to the tinnitus frequency. While these studies raised concerns and emphasized caution, they did not rule out a possibility that GPIAS deficits can indeed be interpreted as an indication of tinnitus. Indeed, if animals or humans constantly experience a phantom sound, it must still be present during the silent gap during GPIAS testing. Therefore a gap, even partially filled by tinnitus, would still be making gap detection more challenging especially when the background spectrum would closely match the spectrum of tinnitus. Further research on the improvements of GPIAS testing paradigm might help to detect gap detection challenges in tinnitus patients. The most recent work has attempted to directly measure human neurophysiological correlates of gap detection with cortical auditory evoked potentials (CAEP) recorded in the electroencephalogram (EEG) [49]. The N1 potentials in response to gaps of silence were recorded from scalp in normal tinnitus-free individuals. Such an approach does not require overt responses from the participant nor measures responses modulated by gaps. Gap-evoked cortical responses were identified in all conditions for the vast majority of participants. The N1 responses were independent on background noise frequencies or background levels. The authors recommend that this experimental design could be used in both animals and humans to identify tinnitus objectively.

Early Operant Models

A variety of operant methods for tinnitus determination in animals have been developed. Two early operant models, those developed by Jastreboff et al. [2] and Bauer et al. [22],illustrate many features common to these models. Operant models examine the effect of tinnitus on emitted behavior that has been modified by auditory training. Both methods are interrogative, in that they require subjects to respond differentially to auditory events. In the Jastreboff model, tinnitus was induced by high systemic doses of sodium salicylate. Rats were conditioned to stop licking a water spout by imposing a mild electric shock, at the end of random periods when the background sound (broad-band noise; BBN, 60 dB, SPL) was turned off, i.e., external silence. The animals were then tested with randomly-inserted silent periods, without shocks, following acute salicylate exposure (300 mg/kg). The salicylate-treated animals showed more persistent licking during the sound-off periods than controls without salicylate [2]. The interpretation was that salicylate induced tinnitus, as it is well known to do in humans, and masked the sound-off silence; therefore the rats continued to lick as they would have if sound were present. In an informative variant procedure, Jastreboff et al. demonstrated the obverse effect with animals that were lick-suppression trained while on salicylate [2]. In this variant, the rats suppressed licking more during sound-off test periods than non-salicylate controls. The interpretation was that suppression training, with tinnitus present, conditioned the animals to not lick when their tinnitus, a salient internal sound, was heard. A limitation of the Jastreboff salicylate lick-suppression model is that it was only suitable for determining acute tinnitus. Reasons for this limitation are twofold: tinnitus induced by salicylate treatment is temporary, subsiding within a day or so after discontinuing the drug, and more importantly, the tinnitus influence on licking was measured during extinction of conditioned suppression (there were no shocks when tinnitus testing).Extinction is a transient behavioral state.

A derivative operant method, well suited to assessing chronic tinnitus and still in use, was developed by Bauer and colleagues[14 22 23]. In the Bauer model, chronic tinnitus was induced using a single unilateral exposure to moderate-level tones (4 kHz at 80 dB SPL) in chinchillas, or high-level band-limited noise centered at 16 kHz (116 – 120 dB, SPL) in rats, for one hour, three or more months prior to tinnitus assessment. Unilateral exposure was used to preserve normal hearing in one ear. It also reflects a condition commonly associated with tinnitus in humans. Asymmetric acoustic trauma or hearing loss in humans is commonly associated with chronic tinnitus, including bilateral tinnitus [50]. All animals were trained to lever press for food pellets in the presence of broadband noise (BBN) (60 dB, SPL) and were tested for tinnitus using randomly introduced 1-min periods of either sound off, or tones at various levels. Lever pressing during sound-off periods was suppressed by delivering a lever-press-contingent foot shock at the end of sound-off periods. In other words, the animals could avoid the foot shock by not lever pressing during sound off. Tinnitus was indicated by decreased lever pressing when tested with tones in the vicinity of 20 kHz (Fig 2A), although tones of various frequency at various levels were tested. Control animals were not exposed to tinnitus induction but were otherwise treated and tested in parallel. The interpretation was that animals with chronic tinnitus could not hear true silence, but instead heard their tinnitus. Because they were trained to suppress lever pressing when their tinnitus was audible (during sound off periods), they suppressed lever pressing to stimulus-driven sensations that resembled their tinnitus[8, 22].Note that in the Bauer model testing and training are integrated into every session. This meant that chronic tinnitus could be measured with undiminished sensitivity over long periods. The model has been used to assess tinnitus in rats for as long as 17 months [22]. It was also found that a proportion of the exposed animals, typically 30 to 40 percent, did not develop tinnitus, although the audiometric profile of all exposed animals was equivalent (Fig. 2B).The Bauer model has also been used to determine acute tinnitus induced by systemic salicylate [14] as well as chronic tinnitus induced by ototoxic exposure [19]. (Figure 2)

OHT-19-101_Alexander Galazyuk_F2

Figure 2. Psychophysical discrimination functions obtained from three groups of rats; relative lever pressing, recorded as a suppression ratio (y-axis) is plotted against test-stimulus sound level (x-axis). A suppression ratio of 0 reflects no lever presses, while a suppression ratio of 0.5 reflects lever pressing at baseline rate preceding the test stimulus. Both experimental groups (n = 8 each; filled square data points) were unilaterally exposed to band-limited noise (120 dB, SPL, octave band centered at 16 kHz) six months prior to testing. The unexposed controls (n = 8; unfilled circular data points) were trained and tested in parallel. Panel A shows the average of 5 sessions using 20 kHz test tones. A subset of exposed subjects suppressed significantly more to the 20 kHz stimuli. The statistical difference between the Exposed-with-tinnitus and Unexposed groups is shown in the inset. Suppression behavior (average of 5 sessions) of the same animals tested with broad band noise (BBN), diagnostic for free-field hearing but not tinnitus, is shown in panel B. Data points are group means averaged over 5 test sessions; error bars indicate the standard error of the mean. Significance levels were determined using a mixed analysis of variance (n = 8 per group). SPL, sound pressure level.

Operant Model Variations

Experimenters have examined a number of variations in an attempt to improve operant models. Several excellent reviews of tinnitus models may be consulted for variant features [51–53]. The extended training required by the Bauer model negatively impacts throughput, and can be shortened by employing an unconditioned indicator such as licking a spout for water. A number of researchers have adopted this modification. Zheng and colleagues developed a model that incorporated many features of the Bauer model, using water deprived rats required to lick a spout for water instead of pressing a lever for food [54]. This considerably decreased training time, although it did not decrease the time required for tinnitus to appear after acoustic induction. A wrinkle that must be addressed when substituting licking for lever pressing is the episodic nature of licking. Spontaneous pauses in licking must be taken into account, so as notto count themas false positive suppressions. Zheng et al., used shortened test sessions to reduce this error. In another operant variation, using licking behavior, May and colleagues trained rats to lick to sound resembling their tinnitus, rather than suppressing to tinnitus-like sound [55]. Chronic tinnitus was induced using high-level sound exposure while acute tinnitus was induced using high-dose salicylate treatment. Episodic features of licking were controlled by using test periods of only a few minutes, and by using a tinnitus score normalized to each animal’s non-test lick rate. They found acoustic-induced chronic tinnitus with characteristics similar to 16 kHz tones, while acute salicylate induced tinnitus was similar to narrow-band noise between 8 and 22 kHz. Licking in combination with conditioned place preference has been used to indicate chronic acoustic-induced tinnitus in hamsters [56]. Two spouts were available from which to drink, each in a distinct location; animals were trained to use the non-preferred spout in the presence of an ipsi lateral external sound. Testing occurred in silence. Licking at the sound-conditioned (non-preferred) spout indicated tinnitus [29]. Using a variant of this method, Heffner trained rats to lick from visual-and-auditory cued left or right water spouts. After unilateral sound exposure, Heffner was able to use left vs right spout choice to indicate tinnitus lateral localization [57]. This informative experiment demonstrates how operant methods have been adapted to answer specific questions, such as tinnitus laterality.

Model Features: Pros and Cons

Using licking as an indicator requires water restriction, typically for 24 hrs. A nontrivial consideration is the physiological stress imposed by water deprivation. It has been shown that restricting water intake in rodents for 24 hrs leads to vasopressin and vascular-induced central neural changes that are reflected in physiological stress indicators and behavioral dysfunction [58]. An interesting lick suppression method not requiring water restriction, and its attendant physiological stress, was developed by Lobarinas and colleagues [59]. The motivation to lick for water was induced in rats by delivering “free” food pellets at regular intervals. Although the animals had to be food deprived, they did not have to be water deprived or extensively trained to lick. Since rats are prandial drinkers, distributed food delivery will induce licking, hence schedule-induced polydipsia (SIPAC). Once SIPAC stabilizes, licking can be suppressed to an acoustic signal, using an electric shock. Sound-off licking can then be compared between animals with tinnitus and those without, with the expectation that tinnitus animals will do less sound-off licking than non-tinnitus controls because their tinnitus provides an auditory signal for suppression. Variability of performance over time and between subjects, however, has been an issue for this model [51]. Unlike reflex-based animal models, operant models are obliged to motivate subjects to respond appropriately to sensory events. As some pet owners and all animal trainers know, animals will not comply with human requests unless they are motivated. Typically motivation is experimentally established by restricting access to food or water, or by imposing an aversive stimulus. These three strategies may be employed singularly or in combination to comprise a given method. Operant models described so far have in common the combined use of positive reinforcement, such as food or water, and punishment procedures, such as foot shock. It is well known that aversive stimulus control lends itself to more rapid conditioning than positive control [60]. With that in mind, some animal models have exclusively used aversive stimulus control to improve efficiency. Guitton et al., trained rats to jump from an electrified floor to an insulated pole when an auditory signal was present [61]. Since the task was moderately strenuous, the animals had a low spontaneous rate of jumping without foot shock. After salicylate treatment the animals were tested without sound and spontaneous pole jumps were recorded; an elevated number of jumps indicated tinnitus. Using this model, both group and individual comparisons could be made, with animals serving as their own control. A limitation was that the method does not lend itself cleanly to testing chronic tinnitus, and as a discrete-trial procedure the animals typically had to be handled between trials in order for a new trial to be initiated. Handling introduces a potential source of error that may not be entirely controlled by treatment blinding, since an increased number of spontaneous jumps would un-blind the experimenter. Relying exclusively on aversive control also interjects a stress factor. However stress could be considered a positive feature, since humans frequently comment that stress exacerbates their tinnitus.

Summary

Features of an Ideal Animal Tinnitus Model

Criteria of validity, sensitivity, and reliability have to be balanced against efficiency, cost, and throughput, in any animal model. An ideal model would be sensitive enough to detect low levels of tinnitus, yet clearly separate tinnitus from confounds such as hearing loss and hyperacusis. The sensitivity of an ideal model would not diminish with repeated testing, allowing measurement of chronic tinnitus and the use of extended test series necessary to test therapeutics. Sensitive and reliable models should also require a low number of animals. Determining validity is never as clear cut as determining reliability; however animal models should be validated against one another and against quantitative human data whenever possible. Tinnitus features such as pitch, loudness, and duration should be reflected in all models. Finally, a more direct, and ideally noninvasive, measure of tinnitus, not requiring extended psychophysical testing would be very advantageous.

Acknowledgement

Preparation of this manuscript was supported by research grantR01 DC016918 from the National Institute on Deafness and Other Communication Disorders of the U.S. Public Health Service (A.V.G.)

References

  1. Turner JG, Brozoski TJ, Bauer CA, Parrish JLMyers K et al. (2006) Gap detection deficits in rats with tinnitus: a potential novel screening tool. Behav Neurosci 120: 188–195. [Crossref]
  2. Jastreboff PJ, Brennan JF, Coleman JK, Sasaki CT (1988) Phantom auditory sensation in rats: an animal model for tinnitus. Behav Neurosci 102: 811–822. [Crossref]
  3. Shargorodsky J, Curhan GC, Farwell WR (2010) Prevalence and characteristics of tinnitus among US adults. The American journal of medicine 123: 711–718. [Crossref]
  4. Bauer CA (2018) Tinnitus. N Engl J Med 378: 1224–1231. [Crossref]
  5. Dan B (2005) Titus’s tinnitus. J Hist Neurosci 14: 210–213. [Crossref]
  6. Tunkel DEBauer CASun GHRosenfeld RMChandrasekhar SS et al. (2014) Clinical practice guideline: tinnitus executive summary. Otolaryngol Head Neck Surg 151: 533–541. [Crossref]
  7. Tunkel DE, Jones SL, Rosenfeld RM (2016) Guidelines for Tinnitus. JAMA 316: 1214–1215. [Crossref]
  8. Brozoski TJ, Bauer CA (2008) Learning about tinnitus from an animal model. Seminars in Hearing 29: 242–258.
  9. Kaltenbach JA (2011) Tinnitus: Models and mechanisms. Hear Res 276: 52–60. [Crossref]
  10. Brozoski TJ, Bauer CA (2016) Animal models of tinnitus. Hear Res 338: 88–97. [Crossref]
  11. Norena AJ, Farley BJ (2013) Tinnitus-related neural activity: theories of generation, propagation, and centralization. Hear Res 295: 161–171. [Crossref]
  12. Schaette R (2014) Tinnitus in men, mice (as well as other rodents), and machines. Hear Res 311: 63–71. [Crossref]
  13. Yang S, Bao S (2013) Homeostatic mechanisms and treatment of tinnitus. Restorative neurology and neuroscience 31: 99–108. [Crossref]
  14. Bauer CA, Brozoski TJ, Rojas R, Boley J, Wyder M (1999) Behavioral model of chronic tinnitus in rats. Otolaryngol Head Neck Surg 121: 457–62. [Crossref]
  15. Mahlke C, Wallhausser-Franke E (2004) Evidence for tinnitus-related plasticity in the auditory and limbic system, demonstrated by arg3.1 and c-fos immunocytochemistry. Hear Res 195: 17–34. [Crossref]
  16. Ruttiger L, Ciuffani J, Zenner HP, Knipper M (2003) A behavioral paradigm to judge acute sodium salicylate-induced sound experience in rats: a new approach for an animal model on tinnitus. Hear Res 180: 39–50. [Crossref]
  17. Yang G, Lobarinas E, Zhang L, Turner JStolzberg D et al. (2007) Salicylate induced tinnitus: behavioral measures and neural activity in auditory cortex of awake rats. Hear Res 226: 244–253. [Crossref]
  18. Alkhatib A, Biebel UW, Smolders JW (2006) Reduction of inhibition in the inferior colliculus after inner hair cell loss. Neuroreport 17: 1493–1497. [Crossref]
  19. Bauer CA, Turner JG, Caspary DM, Myers KS, Brozoski TJ (2008) Tinnitus and inferior colliculus activity in chinchillas related to three distinct patterns of cochlear trauma. J Neurosci Res 86: 2564–2578. [Crossref]
  20. Kaltenbach JA, Rachel JD, Mathog TA, Zhang J, Falzarano PR et al. (2002) Cisplatin-induced hyperactivity in the dorsal cochlear nucleus and its relation to outer hair cell loss: relevance to tinnitus. J Neurophysiol 88: 699–714. [Crossref]
  21. Zacharek MA, Kaltenbach JA, Mathog TA, Zhang J (2002) Effects of cochlear ablation on noise induced hyperactivity in the hamster dorsal cochlear nucleus: implications for the origin of noise induced tinnitus. Hear Res 172: 137–143. [Crossref]
  22. Bauer CA, Brozoski TJ (2001) Assessing tinnitus and prospective tinnitus therapeutics using a psychophysical animal model. J of the Assoc for Res in Otolaryngol 2: 54–64. [Crossref]
  23. Brozoski TJ, Bauer CA, Caspary DM (2002) Elevated fusiform cell activity in the dorsal cochlear nucleus of chinchillas with psychophysical evidence of tinnitus. J Neurosci 22: 2383–2390. [Crossref]
  24. Dehmel S, Pradhan S, Koehler S, Bledsoe S, Shore S (2012) Noise overexposure alters long-term somatosensory-auditory processing in the dorsal cochlear nucleus–possible basis for tinnitus-related hyperactivity?. J Neurosci 32: 1660–1671. [Crossref]
  25. Jastreboff PJ, Brennan JF, Sasaki CT (1988) An animal model for tinnitus. Laryngoscope 98: 280–286. [Crossref]
  26. Tyler RS, Erlandsson S (2000) Management of the tinnitus patient. In:Luxon LM (ed.). Textbook of audiological medicine. Oxford: Isis, Pg 571–578.
  27. Ahlf S, Tziridis K, Korn S, Strohmeyer I, Schulze H (2012) Predisposition for and prevention of subjective tinnitus development. PLoS One 7. [Crossref]
  28. Bauer CA, Wisner K, Sybert LT, Brozoski TJ (2013) The cerebellum as a novel tinnitus generator. Hear Res 295:130–139. [Crossref]
  29. Heffner HE, Harrington IA (2002) Tinnitus in hamsters following exposure to intense sound. Hear Res 170: 83–95. [Crossref]
  30. Skinner BF (1938) The behavior of organisms; an experimental analysis. New York, London,: D. Appleton-Century Company .
  31. Eggermont JJ, Roberts LE (2004) The neuroscience of tinnitus. Trends Neurosci 27: 676–82. [Crossref]
  32. Roberts LE, Eggermont JJ, Caspary DM, Shore SE, Melcher JR, et al. (2010) Ringing ears: the neuroscience of tinnitus. J Neurosci 30: 14972–14979. [Crossref]
  33. Brozoski TJ, Ciobanu L, Bauer CA (2007) Central neural activity in rats with tinnitus evaluated with manganese-enhanced magnetic resonance imaging (MEMRI). Hear Res 228: 168–179. [Crossref]
  34. Brozoski TJ, Wisner KW, Odintsov B, Bauer CA (2013) Local NMDA receptor blockade attenuates chronic tinnitus and associated brain activity in an animal model. PLoS One 8. [Crossref]
  35. Gomez-Nieto R, Horta-Junior Jde A, Castellano O, Millian-Morell L, Rubio ME et al. (2014) Origin and function of short-latency inputs to the neural substrates underlying the acoustic startle reflex. Frontiers in neuroscience 8. [Crossref]
  36. Koch M (1999) The neurobiology of startle. Progress in Neurobiology 59: 107–128. [Crossref]
  37. Galazyuk A, Hébert S (2015) Gap-Prepulse Inhibition of the Acoustic Startle Reflex (GPIAS) for Tinnitus Assessment: Current Status and Future Directions. Front Neurol 6. [Crossref]
  38. Shore SE, Roberts LE, Langguth B (2016) Maladaptive plasticity in tinnitus–triggers, mechanisms and treatment. Nat Rev Neurol 12: 150–60. [Crossref]
  39. Longenecker R, Galazyuk AV (2012) Methodological optimization of tinnitus assessment using prepulse inhibition of the acoustic startle reflex. Brain Res 1485: 54–62. [Crossref]
  40. Longenecker RJ, Galazyuk AV (2016) Variable effects of acoustic trauma on behavioral and neural correlates of tinnitus in individual animals. Front Behav Neurosci 10. [Crossref]
  41. Grimsley CA, Longenecker RJ, Rosen MJ, Young JW, Grimsley JM, et al. (2015) An improved approach to separating startle data from noise. J Neurosci Methods 253: 206–217. [Crossref]
  42. Gerum R, Rahlfs H, Streb M, Krauss P, Grimm J et al. (2019) Open(G)PIAS: r tinnitus screening and threshold estimation in rodents. Front Behav Neurosci 13. [Crossref]
  43. Choe Y, Park I (2019) Proposal of conditional random interstimulus interval method for unconstrained enclosure based GPIAS measurement systems. Biomed Eng Lett 9: 367–374.
  44. Berger JI, Coomber B, Shackleton TM, Palmer AR, Wallace MN (2013) A novel behavioural approach to detecting tinnitus in the guinea pig. J Neurosci Methods 213: 188–95. [Crossref]
  45. Wu C, Martel DT, Shore SE (2016) Increased Synchrony and Bursting of Dorsal Cochlear Nucleus Fusiform Cells Correlate with Tinnitus. J Neurosci 36: 2068–2073. [Crossref]
  46. Hickox AE Liberman MC (2014) Is noise-induced cochlear neuropathy key to the generation of hyperacusis or tinnitus?. J Neurophysiol 111: 552–564. [Crossref]
  47. Fournier P, Hébert S (2013) Gap detection deficits in humans with tinnitus as assessed with the acoustic startle paradigm: does tinnitus fill in the gap? Hearing research 295: 16–23. [Crossref]
  48. Gilani VM, Ruzbahani M, Mahdi P, Amali A, Khoshk MHN, et al. (2013) Temporal processing evaluation in tinnitus patients: results on analysis of gap in noise and duration pattern test. Iranian journal of otorhinolaryngology 25: 221–226. [Crossref]
  49. Paul BT, Schoenwiesner M, Hébert S (2018) Towards an objective test of chronic tinnitus: Properties of auditory cortical potentials evoked by silent gaps in tinnitus-like sounds. Hear Res 366: 90–98. [Crossref]
  50. Davis A, El Refaie (2000) A Epidemiology of Tinnitus. In: Tyler RS (ed.). Tinnitus Handbook. Clifton Park, NY: Delmar Cengage Learning, Pg 1–24.
  51. Hayes SH, Radziwon KE, Stolzberg DJ, Salvi RJ (2014) Behavioral models of tinnitus and hyperacusis in animals. Front Neurol 5. [Crossref]
  52. von der Behrens W (2014) Animal models of subjective tinnitus. Neural Plast 2014. [Crossref]
  53. Stolzberg D, Salvi RJ, Allman BL (2012) Salicylate toxicity model of tinnitus. Front Syst Neurosci 6. [Crossref]
  54. Zheng Y, Vagal S, McNamara E, Darlington CL, Smith PF (2012) A dose-response analysis of the effects of L-baclofen on chronic tinnitus caused by acoustic trauma in rats. Neuropharmacology 62: 940–946. [Crossref]
  55. Jones A, May BJ (2017) Improving the Reliability of Tinnitus Screening in Laboratory Animals. J Assoc Res Otolaryngol 18: 183–195. [Crossref]
  56. Heffner HE, Koay G (2005) Tinnitus and hearing loss in hamsters (Mesocricetus auratus) exposed to loud sound. Behav Neurosci 119: 734–742. [Crossref]
  57. Heffner HE (2011) A two-choice sound localization procedure for detecting lateralized tinnitus in animals. Behav Res Methods 43: 577–589. [Crossref]
  58. Faraco G, Wijasa TS, Park L, Moore J, Anrather J (2014) Water deprivation induces neurovascular and cognitive dysfunction through vasopressin-induced oxidative stress. Journal of cerebral blood flow and metabolism : official journal of the International Society of Cerebral Blood Flow and Metabolism 34: 852–860. [Crossref]
  59. Lobarinas E, Sun W, Cushing R, Salvi R (2004) A novel behavioral paradigm for assessing tinnitus using schedule-induced polydipsia avoidance conditioning (SIP-AC). Hear Res 190: 109–114. [Crossref]
  60. LeDoux JE (2000) Emotion circuits in the brain. Annu Rev Neurosci 23: 155-`184. [Crossref]
  61. Guitton MJ, Caston J, Ruel J, Johnson RM, Pujol R, et al. (2003) Salicylate induces tinnitus through activation of cochlear NMDA receptors. J Neurosci 23: 3944–3952. [Crossref]

Brain Volume during Human Development: A Comparison of Imagej and Linear Measures on MRI

DOI: 10.31038/IMCI.2019222

Abstract

Brain volumes of 73 infants, children, and adolescents were determined in three planes (sagittal, axial, coronal) using ImageJ, and these were then compared separately and collectively to those obtained using simple linear measurements. The “R” package was used for statistical analyses. Correlations were strong for all measured and measured to calculated comparisons, with r values of 0.87 – 0.93 (p <0.001).  Correlation of measured right and left cerebral hemispheric volume (means = 450 and 458 cm3, respectively) was r = 0.94 (p <0.001), and measured compared to calculated right or left cerebral hemispheric volumes were r = 0.90 and 0.86, respectively (p <0.001). The left cerebral hemisphere was greater in 43/73 (58%) brains. There was no correlation between the extent of the hemispheric volume percent differences or side to side asymmetries and age (r = -0.11; p = 0.34). The results indicate that calculated measurements of brain and cerebral hemispheric volumes are near identical to respective measurements obtained with ImageJ. The findings justify the use of linear measurements as a means of calculating regional and global brain volumes

Keywords

brain, development, ImageJ, linear measures, MRI

ImageJ (NIH image-processing program FIJI) is a widely available and frequently used software process to directly obtain a variety of regional and global measurements, including distances, areas, and volumes in multiple tissues and organs [1–6]. The image analysis program recently has been updated to allow for a more diverse and user friendly audience [7]. The brains of animals, including humans, has been extensively studied, both in vitro and in vivo [1–3, 5, 6]. However, few investigations have been accomplished to study macro- and micro-structural aspects of the brain during development [8]. Th major objective of the present investigation was to ascertain developmental aspects of brain growth in human infants, children, and adolescents using ImageJ and to compare the results to those obtained from the use of linear measurements. We have previously employed the latter method to estimate total brain volume as well as aspects of cerebral hemispheric asymmetry and corpus callosal structure [9–12]. The results of the correlative study authenticate the utility of using multiple linear measures and appropriate formulations to determine regional and global areas and volumes of the brain in health and disease [13].

Materials and Methods

Study Cohort

The sampled population included pediatric patients evaluated and managed by neurological, neurosurgical, and other personnel at the Weil Cornell Medical Center (WCMC) in New York, NY. A total of 73 individuals from a larger cohort of 123 patients was selected, each of whom had undergone a brain MRI scan for one of several reasons, and whose scan was interpreted as “normal” by a neuroradiologist, under the directorship of LAH. Eight individuals were 6 – 18 years of age, while the ages of the remaining 65 patients ranged from near birth to six years. Approximately 12 subjects (6 females; 6 males) were selected from each of the following age categories: 1 – 6, 7 – 12, 13 -18, and 19 – 24 months; 2 – 4, and 5 – 6 years. As discussed previously [9], these age categories were chosen to match the period of maximal brain expansion during the early years of postnatal development. Brain expansion is 95% complete by six years of age [9]. All patients were selected from the electronic files of WCMC, extending from January, 2013 through June, 2018. Inclusion criteria included: 1) birth through 18 years; 2) a brain MRI that was interpreted as normal; and 3) an occipto-frontal (head) circumference (OFC) above the fifth percentile for age and sex. Exclusion criteria included: 1) fetuses; 2) premature infants less than 36 weeks gestation with evidence of brain damage; 3) age equal to or greater than 19 years; 4) abnormal MRI scans, excluding normal variants; or 5) absent clinical information. To obtain an equal sex and age distribution in accordance with the age-specific categories (see above), eligible patients were included in the study until each age category was filled with a near equal number of males and females. Thereafter, the MRI scans were retrieved from the electronic files and reviewed. Specific brain measurements then were obtained (see below).

Patient Confidentiality and Institutional Approval

The protocol encompassing the research plan was approved by WCMC Institutional Review Board on July 14, 2017. Given that all data collected were retrospective in nature, a “Waiver of Informed Consent” was approved.

MRI Imaging Protocol

All brain MRI examinations were performed with or without contrast enhancement on a 1.5 or 3.0 T General Electric (GE Medical Systems, Milwaukee, Wisconsin) whole-body imager equipped with high performance gradients and a manufacture-supplied quadrature head coil. Whole brain 3 dimensional T2 weighted localizers, sagittal T1 and axial T1-weighted, T2-weighted, T2-FLAIR, and diffusion wighted images were routinely collected on all subjects at a maximum of 5 mm and a minimum of 1 mm thickness (the majority at 3 mm). To maximize proper alignment, the patients’ heads were positioned in the midline with the aid of a laser centering device focused on the nose, philtrum, and chin.  The axial acquisition of the brain was acquired parallel to the hard palate or parallel to a line joining the anterior and posterior commissures, while the coronal acquisitions were obtained perpendicular to the axial acquisition. All scans were performed for clinically indicated reasons. Infants under the age of 12 months were often fed, swaddled, and scanned without sedation. Despite these maneuvers, some infants required sedation for optimal image acquisition.

Measurements of Brain Volume

To measure brain volume in each of three planes (sagittal, axial, coronal), a modification of the Cavalieri principle was applied to sequential images selected from the Cornell database [1,4]. Between 12 and 18 equidistant images were selected depending upon the total number of images in each plane, ranging from 30 to 178. Screenshots of the entire squares with included images then were obtained and appropriately labeled for individual, dataset, and plane identification. The sets of screenshots then were placed into separate folders also labelled with the dataset number and the plane. Maximal brain length and height were recorded on a near mid-line sagittal image. The height measurement extended from the vertex to the level of the foramen magnum. Maximal length and width also were recorded on an axial image at the level of the frontal horns of the lateral ventricles. Lastly, maximal width and height were recorded on a coronal image at the level of the full appearance of the brain stem. The average of the length measurements was used for the total distance of the collective coronal images, the average of the width measurements for the sagittal images, and the average of the height measurements for the axial images.

Using ImageJ, the MRI images containing the linear measurements were inserted to ascertain their respective distances as determined by the algorithm. The values for these distances were then divided by their respective distances recorded on the screenshots, which resulted in two conversion ratios for each of the three planes. The two ratios from each plane then were averaged and ultimately applied to the calculation of brain volume in each of the three planes. Thereafter, the areas in cm2 for all the images in a single plane were determined using manual planimetry in ImageJ. The values were then added together and divided by the total number of images including the empty ones at the beginning and end of the series [1]. Thus, the average area of the entire series of images was obtained. The averaged area was then divided by the plane conversion ratio squared. The result was then multiplied by the maximal distance in cm to obtain the brain volume in cm3. As previously described, for the sagittal brain volume determination, the maximal width was used; for the axial volume, the maximal height determination was used; and for the coronal volume, the maximal length determination was used. Cerebral hemispheric volumes were determined in a similar manner using only the sagittal images. To ascertain the optimal number of measured images in each plane, a preliminary study was conducted on a single brain (#4). This individual was an 18 year old male, with a height of 182 cm (6.0 feet), a weight of 83 kg (183 lbs), and an occipito-frontal (head) circumference of 53 cm. There were a total of 43 axial images. The following brain volumes were ascertained using various numbers of areas in the volume calculations:

Number

Volume (cm3)

43

1,795

24

1,775

18

1,755

12

1,729

Eighteen and 12 brain images produced brain volumes that were 98 and 96%, respectively, of the brain volume using 43 images. Therefore, between 12 and 18 of the total number of images were assumed to provide a near perfect estimate of overall brain volume [4].

Calculation of Brain Volumes

The other method to determine total brain volume utilized a combination of linear craniometric measurements, which incorporated brain length, width, and height. This method has been described previously as well as the rationale for its use [9, 12–13]. Brain length measures included SCL, FCP, and ACL; brain width measures included AFQ, ASQ, and ATQ; and brain height measures included SFQ, SSQ, and STQ [9]. The component measures of length, width, and height were individually averaged to provide equal weighting of the three dimensions.  Total brain volume was then calculated according to the elliptical equation:

Brain volume (cm3) = (4/3) × pi (3.14) × r (length) × r (width) × r (height)

An adjustment equation was then applied to the volume measurements (Vannucci et al, 2019b):

Adjusted brain volume = (calculated brain volume × 1.2) + 11

For the calculated cerebral hemispheric volumes, the length measurements were ACLr1 and ACLr2, the width measurements were AHR, ASQr, and PHR for the right cerebral hemisphere, and a single coronal height measurement was CRH [11] Comparable “l” designations were determined for the left cerebral hemisphere. As with the whole brain measurements, an adjusted equation was applied to the cerebral hemispheric volume measurements (see above).

Data Analysis

The collected and tabulated data were subjected to statistical analyses by use of correlation and linear regression methods. Both predictor and response variables included the measured brain and cerebral hemispheric volumes in the sagittal, axial, and coronal planes, while other response variables included the calculated brain volume measurements. Two sample t tests also were performed. All statistical tests were performed and graphics produced using “R” software [14].

Results

The volumes of 73 brains were analyzed with ImageJ in the sagittal and axial planes and of 69 brains in the coronal plane. Table 1 shows the relationships between the three measured (ImageJ) variables, where the three correction coefficient (r) values were highly significant at 0.88 – 0.89 (see also Figure 1). Table 1 also shows the relationships between the brain volumes derived from the three separate planes and the combined volumes compared to the calculated brain volumes (see also Figure 2). All relationships were highly statistically significant (p<0.001), with r values ranging from 0.88 to 0.94, and slopes very close to 1.00. Right and left cerebral hemispheric volumes were measured in the 73 brains, with larger left hemispheres in 43 (58%) specimens (Figure 3a). One brain showed an identical hemispheric volume, while 11 brains possessed hemispheres with less than 10 cm3 difference (15%). Sixteen brains showed at least a 50 cm3 difference (22%), while only one brain showed greater than a 100 cm3 difference. The mean volume of the right cerebral hemisphere was 450 cm3, while that of the left hemisphere was 458 cm3, an overall 8 cm3 difference (p = 0.12). There was no correlation between the extent of the measured hemispheric volume differences or side-to-side asymmetries and age (r = -0.11; p = 0.34) (Figure 3b), which was also the case for calculated hemispheric volume differences and age (r = -0.12; p = 0.33). There was also no correlation between the extent of the hemispheric volume differences and calculated brain volume (r = -0.09; p = 0.46). Each measured cerebral hemispheric volume was then correlated with its respective calculated hemispheric volume (Table 1; Figures 3c and d). The percent difference between the measured and calculated right cerebral hemispheric volume ranged from 66 to 119%, with a mean of 97% (p = 0.15) (Figute 3e). The percent difference between the measured and calculated left cerebral hemispheric volume ranged from 60 to 125%, with a mean of 102% (p = 0.06) (Figure 3e).

Figure 1a

IMCI 19 - 114_Robert_F1a

Figure 1b

IMCI 19 - 114_Robert_F1b

Figure 1c

IMCI 19 - 114_Robert_F1c

Figure 1. Relationships between measured brain volumes in the sagittal, axial, and coronal planes.

Shown are linear regression plots, each comparing two of the three variables. Regression lines are shown. The correlation coefficient (r) and probability (p) values are shown in Table 1.

Table 1. Linear Regression Relationships between Measured and Calculated Brain Volumes.

VARIABLES

SLOPE

INTERCEPT

r

p

SV vs AV

0.89

94.0

0.88

<0.001

SV vs CV

0.93

72

0.89

<0.001

AV vs CV

0.91

87

0.89

<0.001

SV vs CBV

0.96

0.6

0.93

<0.001

AV vs CBV

0.89

115

0.88

<0.001

CV vs CBV

0.87

131

0.87

<0.001

Comb. vs CBV

0.99

29

0.93

<0.001

MRHV vs MLHV

1.00

7.2

0.94

<0.001

MRHV vs CRHV

0.88

24

0.90

<0.001

MLHV Vs CLHV

0.77

57.0

0.86

<0.001

The first variable is x, while the second variable is y.

Figure 2a

IMCI 19 - 114_Robert_F2a

Figure 2b

IMCI 19 - 114_Robert_F2b

Figure 2c

IMCI 19 - 114_Robert_F2c

Figure 2d

IMCI 19 - 114_Robert_F2d

Figure 2. Relationships between measured brain volumes and calculated brain volume.

Shown are linear regression plots, each comparing one of the three measured variables to the cal-culated variable.  Regression lines are shown.  The correlation coefficient (r) and probability (p) values are shown in Table 1.

Figure 3a

IMCI 19 - 114_Robert_F3a

Figure 3b

IMCI 19 - 114_Robert_F3b

Figure 3c

IMCI 19 - 114_Robert_F3c

Figure 3d

IMCI 19 - 114_Robert_F3d

Figure 3e

IMCI 19 - 114_Robert_F3e

Figure 3. Relationships between measured and calculated right and left cerebral hemispheric volumes.

Figures 3 a, c, and d are linear regression plots, each comparing the measured variables to each other and to their respective calculated variables.  Regression lines are shown.  The correlation coefficient (r) and probability (p) values are shown in Table 1.  Figure 3b correlates MLHV/MRHV with age to six years.  The horizontal line distinguishes the larger of the two hemispheres; MLHV above and MRHV below the line.  Figure 3e shows  boxplots of MRHV/CRHV and MLHV/CLHV.  The circles are outliers.

Abbreviations: MRHV, measured right cerebral hemispheric volume; MLHV, measured left cer-ebral hemispheric volume; CRHV, calculated right cerebral hemispheric volume; CLHV, calcu-lated left cerebral hemispheric volume.

The measured brain volumes were then correlated with age through seven years (Figure 4). The most dramatic increase in brain size occurs between birth and 18 months, with little further change thereafter. Such age related changes in brain size previously have been observed in the present and other cohorts of infants, children, and adolescents [9, 15]. Comparisons between measured and calculated brain volumes in different age groups were similar. Brain sizes in infants aged near birth to six months were 498 and 504 cm3, respectively (p = 0.95), while the sizes in infants aged 13 – 18 months were 931 and 961 cm3, respectively (p = 0.54), and in children aged 5 – 6 years were 1,092 and 1,145 cm3, respectively (p = 0.17).

Figure 4a

IMCI 19 - 114_Robert_F4a

Figure 4b

IMCI 19 - 114_Robert_F4b

Figure 4. Relationship between measured brain volumes and age.

Figure 4a represents a scattergram, while figure 4b represents boxplots at different ages.  The circles are outliers.

Discussion

The results of the present investigation serve several purposes. Firstly, the brain volumes measured in three separate planes were similar, providing justification for the use of ImageJ and our described procedure to obtain the individual volumes. Secondly, the measured and calculated brain volumes also were similar, providing additional justification for the use of linear measurements as a means of calculating regional and global brain volumes [9,12]. The measured and calculated cerebral hemispheric volumes were less similar, although the majority of the comparisons were within 90% of each other (Figure 3d). Accordingly, calculated measurements of brain and cerebral hemispheric volume are near identical to those of measurements obtained with ImageJ. As in the present study, we previously have examined side to side differences in calculated total cerebral hemispheric volume and found no consistency throughout development, although on a regional basis, the right frontal and left occipital lobes are wider than their left or right counterparts [11]. Right frontal and left occipital protrusions (petalias) also are present in the majority of individuals during development to complement the regional differences. Several other studies have addressed the issue of cerebral hemispheric asymmetries, most or all of which are discussed in Vannucci et al. [11].

There are numerous studies that utilize technologically advanced, computational methods to orient, visualize and measure cerebral hemispheric volumes and shapes as well as gray/white matter and gyral/sulcal patterns [16–21]. Frequently used techniques are Deformation-Based Morphometry (DBM), Tensor-Based Morphometry (TBM), and Voxel-Based Morphometry (VBM) [18, 20, 22, 23]. These methods have both advantages and limitations. The advantages relate to the investigators’ ability to properly orient the brain, to erode unwanted structures (e.g. skull, CSF, ventricles), and then to parcellate specific regions for comparative analyses. The limitations relate to the requirement for multiple steps in pre-processing, processing, normalization, and segmentation; which can reduce anatomical specificity. Thereafter, complex analytical assumptions (e.g. gaussian or Bayesian models) must be met in order for accurate global or regional comparisons to be made. In the present investigation, we found that our previously used simple linear measurements to ascertain regional and global brain volumes closely approximate those measured with one such advanced analytical technique, specifically Image [9, 10]. The method also allows for very accurate inter-hemispheric comparisons, so long as the MRI images are in proper alignment [11].

Acknowledgement

The authors thank Dr. Barry Kosoksky and his associates in the Department of Pediatrics (Child Neurology) and other members of the WCMC physician faculty for allowing us to obtain the clinical files of their patients.

Ethical Approval; Conflicts Of Interest; Funding

All procedures performed in our study involving human participants were in accordance with the ethical standards of the institutional and/or national committee and with the 1964 Helsinki declaration and its later amendments or comparable ethical standards. As indicated in Materials and Methods, the present human research effort was approved by the Weil Cornell Medical Center Institutional Review Board on July 14, 2017. Since the collection of data was retrospective in nature, a “waiver of informed consent” was approved.

This research did not receive any specific grant from funding agencies in the public, commercial, or not-for-profit sectors.

Abbreviations: SV, ImageJ sagittal volume, AV, ImageJ axial volume; CV, ImageJ coronal volume; CBV, calculated brain volume; comb., combined; MRHV, measured right cerebral hemispheric volume; MLHV, measured left cerebral hemispheric volume; CRHV, calculated right cerebral hemispheric volume; CLHV, calculated left cerebral hemispheric volume.

Reference

  1. García-Fiñana M, Cruz-Orive LM, MacKay CL, Pakkenberg B, Roberts N (2003) Comparison of MR imaging against physical sectioning to estimate the volume of human cerebral compartments. NeuroImage 18: 505–516.
  2. Pool M, Thiemann J, Bar-Or A, Fournier AE (2008) Neurite tracer: a novel ImageJ plugin for automated quantification of neurite outgrowth. J Neurosci Methods 168: 134–139.
  3. Brabec J, Rulseh A, Hoyt B, Vizek M, Horinek D, et al. (2010) Volumetry of the human amygdala – an anatomical study. Psychiatry Res 182: 67–72.
  4. Sahin B, Elfaki A (2012) Estimation of the volume and volume fraction of brain and brain structures on radiological images. NeuroQuantology 10: 87–97.
  5. Paletzki R, Gerfen CR (2015) Whole mouse brain image reconstruction from serial coronal sections using FIJI (Image J). Curr Protoc Neurosci 73: 1–21.
  6. Young K, Morrison H (2018) Quantifying microglia morphology from photomicrographs of immunohistochemistry prepared tissue using ImageJ. J Vis Exp doi: 10.3791/57648.
  7. Rueden CT, Schindelin J, Hiner MC, DeZonia BE, Walter AE, (2017) ImageJ: ImageJ for the next generation of scientific image data. BMC Bioinformatics 18: 529 (1–26).
  8. Khalsa SS, Geh N, Martin BA, Allen PA, Strahle J, et al. (2018) Morphometric and volumetric comparison of 102 children with symptomatic and asymptomatic Chiari malformation Type I. J Neurosurg Pediatr 21: 65–71.
  9. Vannucci RC, Barron TF, Lerro D, Antón SC, Vannucci SJ (2011) Craniometric measures during development using MRI. NeuroImage 56: 1855–1864.
  10. Vannucci RC, Barron TF, Vannucci SJ (2017) Development of the corpus callosum: An MRI study. Develop Neurosci 39: 97–106.
  11. Vannucci RC, Heier LA, Vannucci SJ (2019) a.  Cerebral asymmetry during development using linear measures from MRI. Early Human Develop. (in press).
  12. Vannucci RC, Vannucci SJ (2019) b. Brain growth in modern humans using multiple developmental databases. Am J Phys Anthropol 168: 247–261.
  13. Vannucci RC, Barron TF, Vannucci SJ (2012) Craniometric measures of microcephaly using MRI. Early Human Develop 88: 135–140.
  14. R Development Core Team (2009) R: A language and environment for statistical computing. Vienna: The R foundation for Statistical Computing  http://www.R-project.org.
  15. Vannucci RC, Vannucci SJ (2019) b. Brain growth in modern humans using multiple developmental databases. Am J Phys Anthropol 168: 247–261.
  16. Foundas AL, Leonard CM, Heilman KM (1995) Morphologic cerebral asymmetries and handedness. Arch Neurol 52: 501–506.
  17. Good CD, Johnsrude I, Ashburner J, Henson RNA, Friston KJ, (2001) Cerebral asymmetry and the effects of sex and handedness on brain structure: A voxel-based morphometric analysis of 465 normal adult human brains. NeuroImage 14: 685–700.
  18. Hervé P-Y, Crivello F, Perchey G, Mazoyer B, Tzourio-Mazoyer N (2006) Handedness and cerebral anatomical asymmetries in young adult males. NeuroImage 29: 1066–1079.
  19. Keller SS, Roberts N (2009) Measurement of brain volume using MRI: software, techniques, choices and prerequisites.  J Anthropol Sci 87: 127–151.
  20. Lyttelton OC, Karma S, Ad-Dab’bagh Y, Zatorre RJ, Carbonell F, (2009) Positional and surface area asymmetry of the human cerebral cortex. NeuroImage 46: 895–903.
  21. Narr KL, Bilder RM, Luders E, Thompson PM, Woods RP, (2007) Asymmetries of cortical shape: Effects of handedness, sex and schizophrenia. NeuroImage 34: 939–948.
  22. Ashburner J, Friston KJ (2000) Voxel-based morphometry-The methods.  NeuroImage 11: 805–821.
  23. Ashburner J (2009) Computational anatomy with the SPM software.  Mag Res Image 27: 1163–1174.