Monthly Archives: January 2020

The Addition of Valproic Acid to Concurrent Radiation Therapy and Temozolomide Improves Patient Outcome: A Correlative Analysis of RTOG 0525, SEER and A Phase II NCI Trial

DOI: 10.31038/CST.2020511

Abstract

Purpose/Objective(s): Valproic Acid (VPA) is an antiepileptic agent with HDACi (histone deacetylase inhibitor) activity shown to radiosensitize glioblastoma (GBM) cells. We evaluated the addition of VPA to standard radiation therapy (RT) and temozolomide (TMZ) in an open- label, phase II study (NCI-06-C-0112). The intent of the current study was to compare our patient outcomes with modern era standard of care data (RTOG 0525) and general population data (SEER 2006–2013).

Materials/Methods: 37 patients with newly diagnosed GBM were treated in a phase II NCI trial with daily VPA (25 mg/kg) in addition to concurrent RT and TMZ (2006 – 2013) and 411 patients with newly diagnosed GBM were treated in the standard TMZ dose arm of RTOG 0525 (2006 – 2008). Using the SEER database, adult patients (age > 15) with diagnostic codes 9440- 9443 (third edition (IDC-O-3) diagnosed between 2006 – 2013 were identified and 6083 were included in the analysis. Kaplan-Meier method was used to estimate OS and PFS. The effect of patient characteristics and clinical factors on OS and PFS was analyzed using univariate analysis and a Cox regression model. A landmark analysis was performed to correlate recurrence to OS and conditional probabilities of surviving an additional 12 months at diagnosis, 6, 12, 18, 24 and 30 months were calculated for both the trial data and the SEER data.

Results: Updated median OS in the NCI cohort was 30.9m (22.2- 65.6m), compared to RTOG 0525 18.9m (16.8–20.3m) (p= 0.007) and the SEER cohort of 11m. Median PFS in the NCI cohort was 11.1m (6.6 – 49.6m) compared to RTOG 0525 with a median PFS of 7.5m (6.9–8.2m) (p = 0.004). Younger age, class V RPA and MGMT status were significant for PFS in both the NCI cohort and the RTOG 0525 cohort, in addition KPS was also significant for OS. In comparison to RTOG 0525, the population in the NCI cohort had a more favorable KPS and RPA, and a higher proportion of patients receiving bevacizumab after protocol therapy however with the exception of RPA (V) (8% vs 18%) (0.026), the effects of these factors on PFS and OS were not significantly different between the two cohorts.

Conclusion: Previously reported improvements in PFS and OS with the addition of VPA to concurrent RT and TMZ in the NCI phase II study were confirmed by comparison to both a trial population receiving standard of care (RTOG 0525) and a contemporary SEER cohort. These results provide further justification of a phase III trial of VPA/RT/TMZ.

Introduction

In the United States, primary brain tumors represent 2% of tumor subtypes with 23,000 new cases and 14,000 deaths per year with grade 4 glioblastoma (GBM) the most common. Standard therapy consists of maximal surgical resection followed by concurrent radiation therapy (RT) and temozolomide (TMZ) followed by adjuvant TMZ, which results in an overall survival (OS) of 27.2% at 2 years and 9.8% at 5 years [1]. Although, the efficacy of this therapy remains limited, attempts to increase the effectiveness of the RT/TMZ protocol [2, 3] have not been successful.

Since the pattern of recurrence following the RT/TMZ combination indicates failure in or adjacent to the initial RT treatment volume, enhancing the effectiveness of RT could lead to an improved therapeutic response. It is this premise that prompted the use of histone deacetylase inhibitors (HDACi) [4, 5]. Inhibition of HDAC activity has been shown to selectively increase tumor cell radiosensitivity in a variety of in vitro models and enhance radiation-induced growth delay of subcutaneous human tumor xenografts [4, 5]. HDACi reduces the repair of DNA double strand breaks (DSBs) leading to radiation-induced cell death [4, 5].

Valproic acid (VPA), a non-enzyme-inducing antiepileptic drug (non-EI-AED), is orally bioavailable, crosses the blood-brain barrier and has minimal toxicity and thus, it provides an attractive option as a radiation sensitizer. In 2006 we initiated a study designed to investigate the safety, tolerability and effectiveness of concomitant RT/TMZ and relatively high dose VPA followed by adjuvant TMZ in patients with newly diagnosed GBM. The previously published median OS in the study was 29.6 months (range: 21–63.8 months) with a PFS of 10.5 months (range: 6.8–51.2 months) while toxicity was similar to that of other phase II studies involving RT/TMZ [6].

Over the past 10 years the reported median survival data for GBM has increased from 14 months to around 20 months [7]. The reasons for this increase are likely multifactorial including a combination of superior surgical resection, earlier initiation of systemic therapies at first recurrence and the management of patients within subspecialized neuro-oncology teams. Since our Phase II NCI trial did not include a standard of care arm, we compared the outcome of the patients treated on our Phase II trial with concurrent VPA with the outcomes of patients who received standard of care concurrent RT and TMZ in the modern era. Thus, we performed a secondary analysis of the RTOG 0525 standard of care arm in conjunction with our NCI data. The most recent molecular RPA based analysis of the RTOG 0525 standard arm included MGMT, Ki-67, mTOR and survivin in addition to age, KPS, extent of resection, and neurologic function, and revealed the median OS times for the three classes as 21.9, 16.6 and 9.4m [7]. Since both the NCI and the RTOG cohorts represent patients treated on trial who as a result tend to have superior outcomes, an additional comparison with data from GBM patients in the SEER database, who are more likely to be more representative of the GBM patient population at large, was also conducted. The intent was to assess the outcome of patients in the Phase II VPA trial in comparison with both modern era GBM patients treated on trial (RTOG 0525) and the population at large (SEER).

Methods and Materials

Patient population

NCI Phase II study of VPA concurrent with chemoirradiation (CRT)

The NCI study was a two center, open-label, phase II study (NCI-06-C-0112) that was conducted in patients with histologically confirmed GBM, aged 18 years or older and a life expectancy greater than 8 weeks, with surgery no more than 6 weeks prior to enrollment. Pathology review was obtained in all patients. Patients were required to have an ECOG performance status ≤ 2 and adequate hematological, renal and hepatic function. Exclusion criteria included previous VPA, chemotherapy or radiotherapy treatment, a known disorder of urea metabolism and any history of a second malignancy other than non-melanoma skin cancer or cervical cancer < 3 years since diagnosis. The concurrent use of sulfamethoxazole, salicylates or naproxen was not allowed. The protocol was reviewed and approved by the NCI Institutional Review Board, and written informed consent was signed by all patients. 37 patients with newly diagnosed GBM were treated in a phase II NCI trial with daily VPA (25 mg/kg) in addition to concurrent RT and TMZ 2006 – 2013.

RTOG 0525 population

The RTOG 0525 study examined the effect of dose dense TMZ on 833 patients randomized to two arms (dose dense vs standard of care). Inclusion and exclusion criteria were largely similar to those of the phase II NCI study (patients older than age 18 years with a newly diagnosed, histologically confirmed GBM, KPS of at least 60 and adequate hematologic, renal, and hepatic function). Having verified that RTOG 0525 shares inclusion and exclusion criteria with our own study, we were specifically interested in the 411 patients who were randomized to and received standard of care in order to facilitate comparison with the phase II NCI study patient population. A secondary analysis request was submitted to NRG for the baseline characteristics (age, sex, KPS, type of surgical intervention, RPA class and MGMT status) of the patient population randomized to standard of care arm in RTOG0525. To further compare the impact of adjuvant treatment between these two populations, we requested the number of cycles of adjuvant TMZ the patient received and whether the patient did or did not receive Bevacizumab. In order to compare OS and PFS as the relevant endpoints we requested time to death or progression for the standard of care arm from initiation of treatment.

SEER population

Using the SEER database, adult patients (age > 15) with diagnostic codes 9440–9443 (third edition (IDC-O-3) diagnosed between 2006 – 2013 were identified and 6083 were included in the analysis. The intention was to analyze the GBM population captured in SEER over a similar time span as the patient populations captured in the NCI study and the RTOG 0525 studies.

Statistical Analysis

Pretreatment characteristics of the Phase II NCI study population and the RTOG 0525 population were compared using log rank test. Outcomes between the two studies were compared using log rank test and cox regression model for confounders. Kaplan-Meier method was used to estimate OS and PFS. The effect of patient characteristics and clinical factors on OS and PFS was analyzed using univariate analysis and a Cox regression model. A landmark analysis [8, 9] was performed to assess residual survival of additional 12 months.

Results

The NCI cohort represents 37 patients on the NCI phase II trial. Patient characteristics including the patient’s performance status and RPA class as well as treatment details and progression and survival outcomes were available, however MGMT status was only available in 51% of the patients as many patients were accrued prior to standard MGMT testing (Table 1). The RTOG 0525 cohort represents 411 patients included on the standard of care arm of RTOG 0525. Similar to the NCI cohort, patient’s characteristics are available and MGMT status was available in 91% of the patients in this cohort (Table 1). In comparison to RTOG 0525, the population in the NCI cohort had a more favorable KPS and RPA, and a higher proportion of patients receiving bevacizumab as salvage (Table1). However, with the exception of RPA (V) (8% vs 18%), the effects of these factors on PFS and OS were not significantly different between the two cohorts (Table 2 and Table 3). Median OS in the NCI cohort was 30.9m (22.2- 65.6m), compared to RTOG 0525 18.9m (16.8- 20.3) (p= 0.003) (Figure 1), and SEER cohort 11m (supplemental table). Younger age, KPS and class V RPA, were significant for OS in both the NCI cohort and the RTOG 0525 cohort while MGMT status was only significant for the RTOG 0525 cohort (Table 2). Median PFS was 11.1 and 7.5m in the NCI study and the RTOG study respectively (Figure 2). PFS was superior in the NCI study as compared to the RTOG study at 6, 12 and 24 months (p=0.0005) (Figure 2). Younger age, class V RPA and MGMT status were significant for PFS in both the NCI cohort and the RTOG 0525 cohort (Table 3). The SEER cohort represents a population of patients captured in the US SEER database. Unlike the NCI or RTOG cohorts, patient’s performance status, RPA class and MGMT status as well as the extent of systemic management and PFS were not recorded within the database and therefore were not available for comparison.

Table 1. Pretreatment  characteristics. Recursive partitioning analysis (RPA), gross total resection(GTR), sub-total resection (STR), valproic acid (VPA), methylguanine-DNA methyltransferase (MGMT), epidermal growth factor receptor (EGFR)

NCI

RTOG 0525

n

%

n

%

P

Age (y)

median

54.3 (range 31–72)

57 (range 22–84)

0.183

Sex

Male

25

68

239

58

Female

12

32

172

42

0.347

RPA

3

13

35

85

21

4

16

43

251

61

5

3

8

75

18

0.026

Unknown/missing

5

14

0

0

KPS

<=90

18

49

321

78

100

19

51

90

22

<0.001

Resection

GTR

19

51

230

56

STR

17

46

167

41

biopsy

1

3

14

3

0.671

MGMT status

methylated

9

24

122

30

unmethylated

10

27

254

62

0.272

unknown

18

49

35

8

BEV given

No

15

40

296

72

Yes

21

57

115

28

<0.001

unknown

1

3

0

0

Table 2. Univariate analysis for OS.

NCI

RTOG 0525

Difference in HR

HR

95% CI

p-value

HR

95% CI

p-value

Pvalue

Age (continuous variable)*

1.6

1.0–2.4

0.046

1.3

1.2–1.4

<0.001

0.399

Age: 50–60 years

2.2

0.8–6.1

0.147

1.6

1.2–2.1

0.002

0.564

Age: > 60 years

3.2

1.0–10.0

0.043

1.8

1.4–2.4

<0.001

0.331

KPS (<=90)

2.7

1.1–6.4

0.029

1.5

1.1–1.9

0.007

0.205

RPA (class IV)

1.8

0.6–5.0

0.266

1.5

1.1–2.1

0.004

0.773

RPA (class V)

5.7

1.3–26.1

0.024

2.2

1.5–3.2

<0.001

0.231

Extent of resection=STR

1.4

0.6–3.1

0.383

1.1

0.9–1.4

0.448

0.53

Avastin (yes)

0.7

0.3–1.6

0.389

0.7

0.5–0.9

0.002

1.00

MGMT (unmethylated)

3.6

0.9–13.9

0.068

1.9

1.5–2.5

<0.001

0.390

*HR corresponds to increase of age by 10 years

Table 3. Univariate analysis for PFS.

NCI

RTOG 0525

Difference in HR

HR

95% CI

p-value

HR

95% CI

p-value

p-value

Age (continuous variable)*

1.3

0.9–2.0

0.156

1.2

1.1–1.3

<0.001

0.59

Age: 50–60 years

1.6

0.6–4.2

0.297

1.4

1.1–1.8

0.008

0.775

Age: > 60 years

2.9

1.0–8.1

0.048

1.5

1.2–1.9

0.002

0.231

KPS (<=90)

1.8

0.8–3.8

0.128

1.1

0.8–1.4

0.517

0.21

RPA (class IV)

1.4

0.5–3.6

0.517

1.2

0.9–1.6

0.128

0.829

RPA (class V)

12.2

2.4–62.9

0.003

1.7

1.2–2.4

0.002

0.021

Extent of resection=STR

1.1

0.5–2.4

0.743

1.1

0.9–1.3

0.482

0.90

Avastin (yes)

1.4

0.6–3.1

0.462

1.3

1.0–1.6

0.029

0.89

MGMT (unmethylated)

3.9

1.0–14.6

0.045

1.6

1.2–2.0

<0.001

0.187

*HR corresponds to increase of age by 10 years

CST 2020-501_Andra Krauze_F1

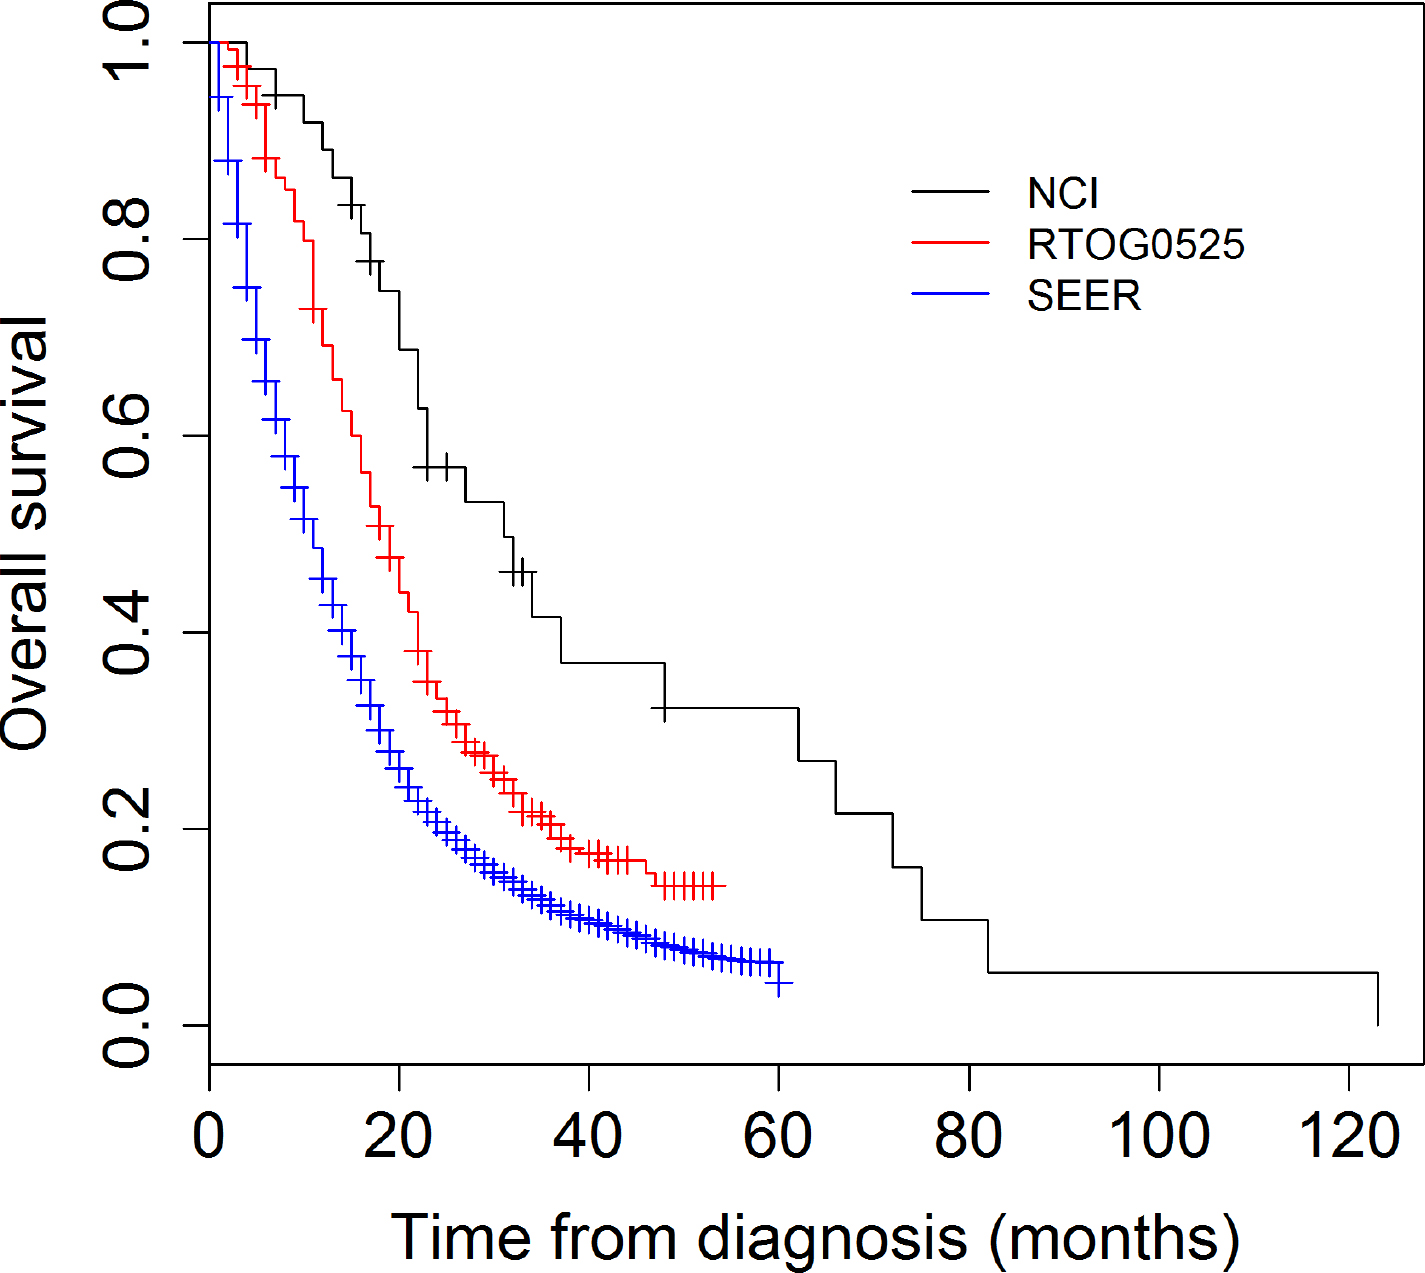
Figure 1. Overall survival (OS) comparison NCI phase II study, RTOG 0525 and SEER 2006–2013.

CST 2020-501_Andra Krauze_F2

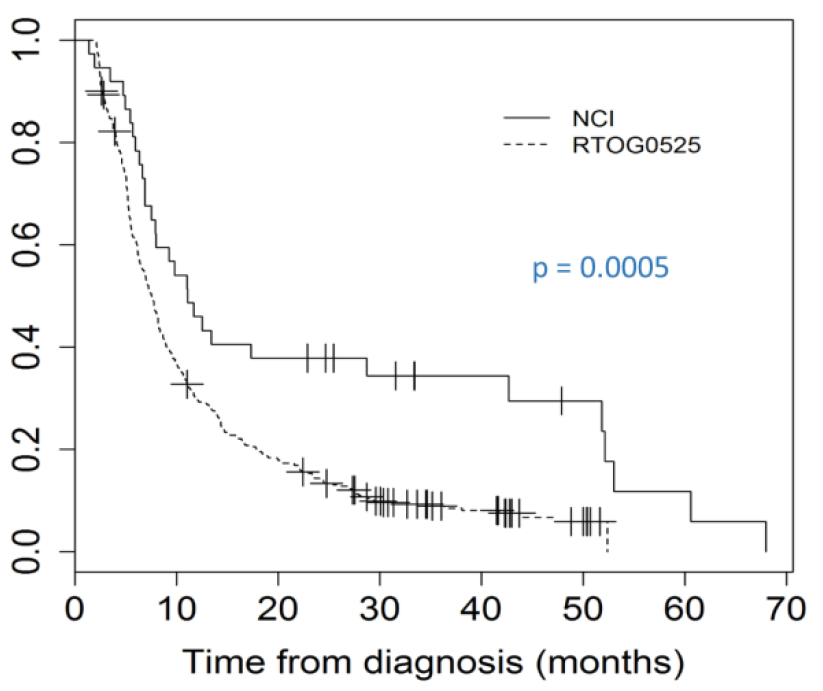
Figure 2. Kaplan-Meier analysis of progression free survival (PFS) between RTOG 0525 and the phase II NCI study examining the addition of Valproic acid (VPA) to concurrent radiation (RT) and temozolomide (TMZ).

Since significant factors that underlie the ability to analyze survival are not available across the all three data sets, a landmark analysis was used to estimate the survival probabilities in each of the data sets conditional on the patients having survived at least 6 months. From the analysis, with a landmark time of 6m, the percent of patients surviving an additional 12m was 77, 57 and 43 in the NCI study, RTOG 0525 and SEER respectively (Table 4). The difference was statistically significant at the initiation of treatment, at 6m and at 18m. VPA patients’ survival was superior to both RTOG and SEER patients up until 30m when they coalesced to a similar likelihood of surviving an additional 12m (Figure 3).

Table 4. Landmark analysis. Probability and 95% CI of surviving additional 12 months.

NCI

RTOG

SEER

Time from initiation of treatment (months)

Probability of surviving additional 12 months

Lower 95% CI

Upper 95% CI

Probability of surviving additional 12 months

Lower 95% CI

Upper 95% CI

P

Probability of surviving additional 12 months

Lower 95% CI

Upper 95% CI

P-value*

0

0.92

0.83

1

0.70

0.66

0.75

<0.001

0.45

0.44

0.47

0.000

6

0.77

0.64

0.92

0.57

0.52

0.62

0.010

0.43

0.42

0.45

<0.001

12

0.61

0.46

0.81

0.49

0.43

0.55

0.167

0.43

0.41

0.44

0.032

18

0.71

0.55

0.92

0.51

0.45

0.59

0.049

0.48

0.46

0.51

0.016

24

0.73

0.53

1

0.62

0.53

0.72

0.385

0.56

0.53

0.59

0.165

30

0.69

0.47

1

0.61

0.5

0.75

0.610

0.62

0.58

0.65

0.587

*Comparing survival probability between NCI and SEER

CST 2020-501_Andra Krauze_F3

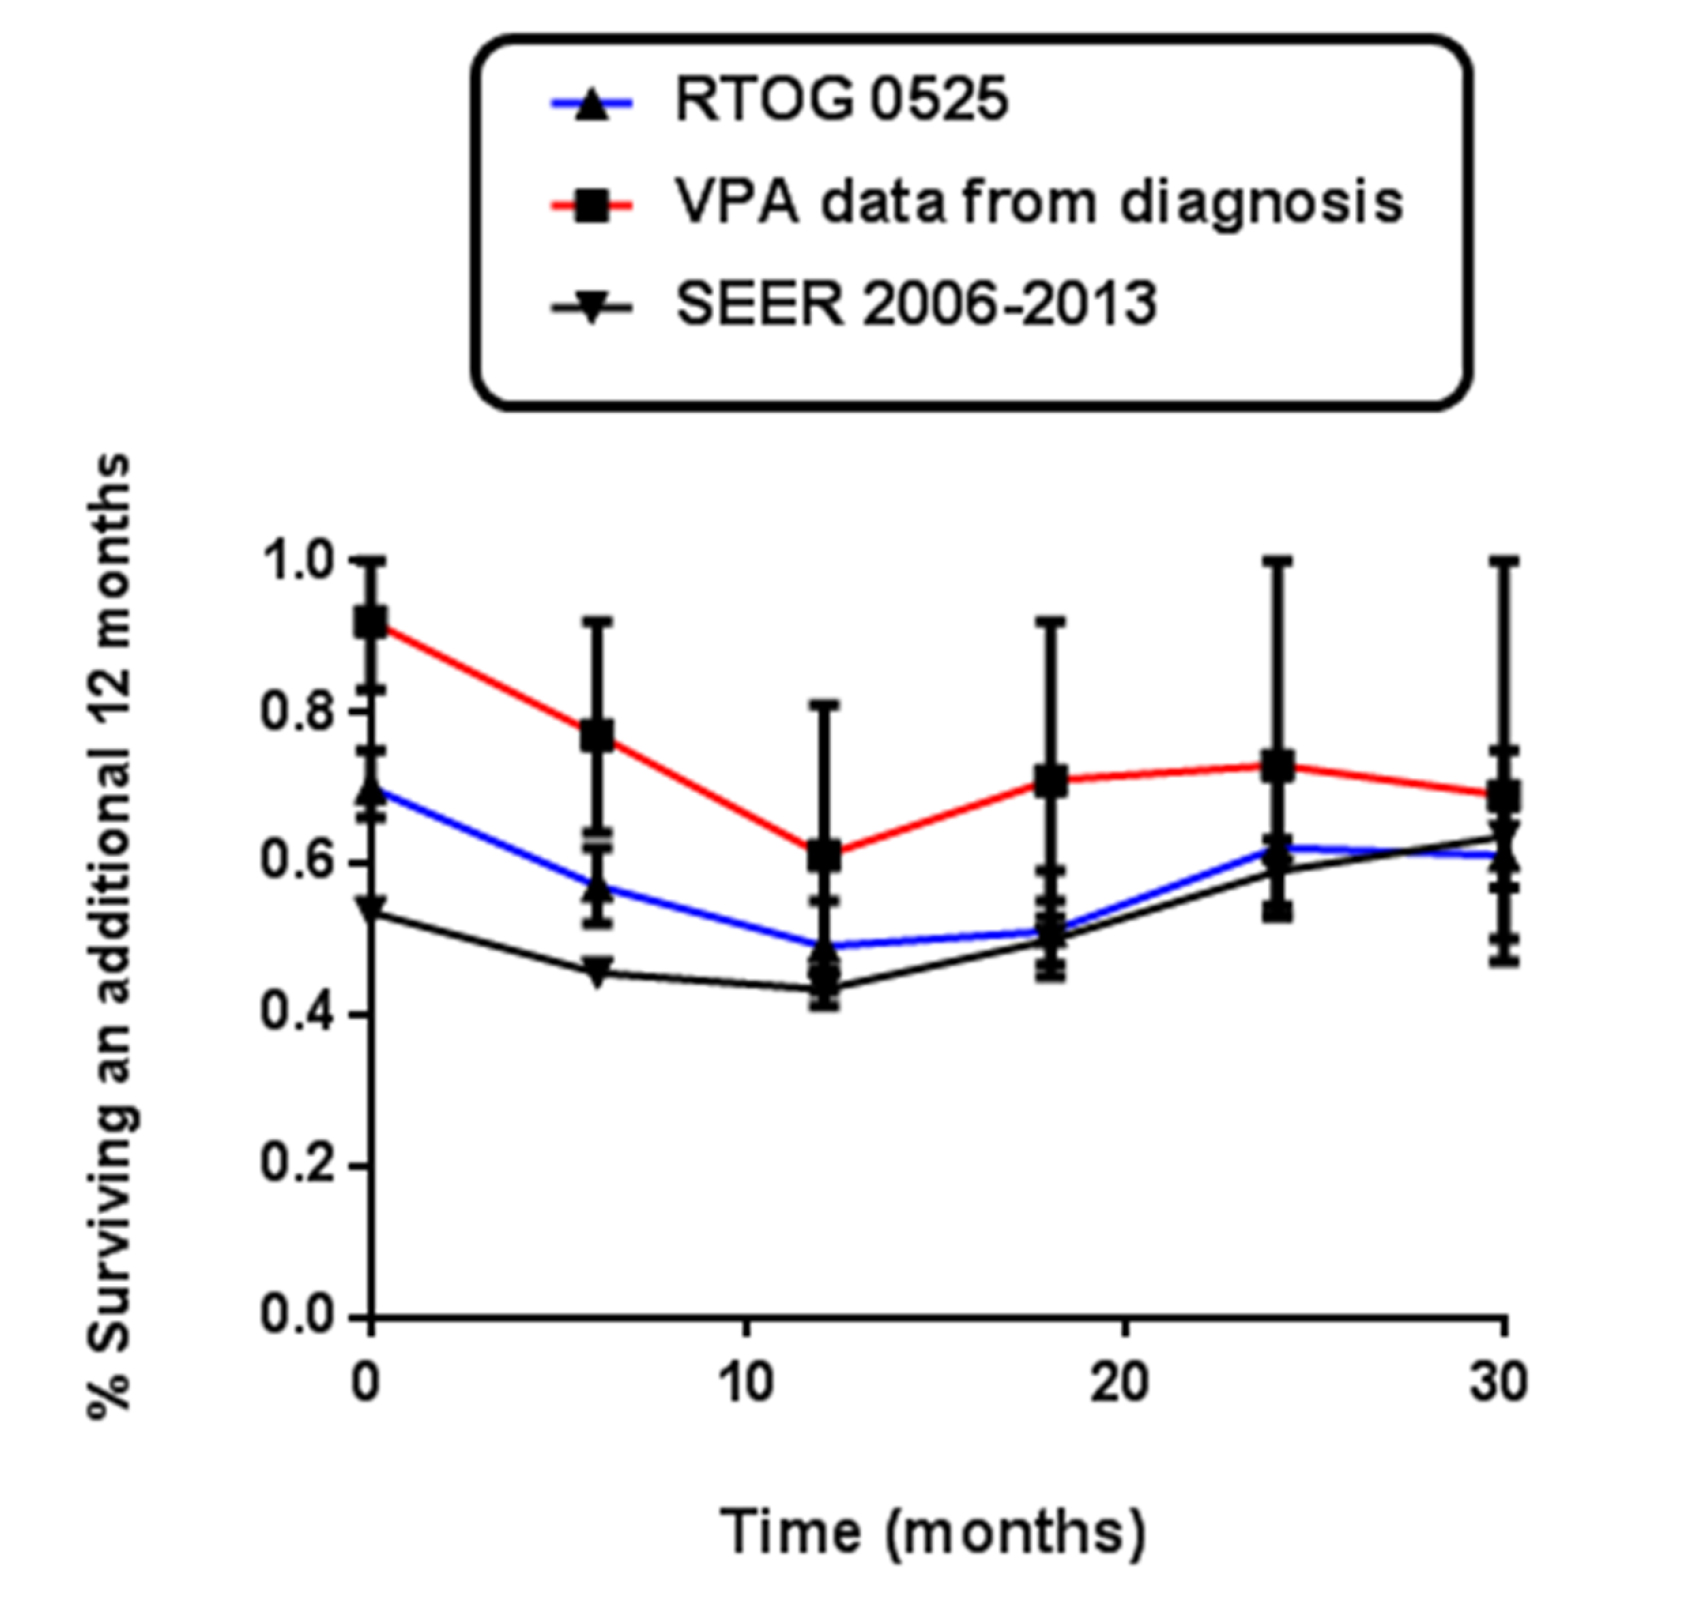
Figure 3. Landmark analysis – Kaplan-Meier survival estimate vs. timing of recurrence using landmark analysis setting the landmark time at 6 months.

Discussion

In recent years the published outcomes of GBM patients on trial has improved as compared to published Stupp data [1, 7], nonetheless, outcomes for GBM patients remain poor. Between 2006 and 2013 we carried out a Phase II trial with the goal of investigating the safety, tolerability and effectiveness of concomitant RT/TMZ and relatively high dose of VPA followed by adjuvant TMZ in patients with newly diagnosed GBM [6]. In order to compare the outcome of our Phase II NCI study with modern GBM treatment and outcomes, we performed a secondary analysis of the standard of care arm of RTOG 0525. To ensure adequate comparison with the GBM population at large, we also carried out a SEER analysis spanning the same time period as the previous two trials (2006–2013). The NCI study and RTOG study patients were sufficiently similar to allow for a meaningful analysis although the NCI patients had superior KPS, RPA and use of Bevacizumab. None of these factors were found to have a statistically significant impact on the analysis. We found that the NCI study patients had a superior PFS and OS compared to either the RTOG 0525 patients or the SEER patients, who in turn had the poorest survival.

Median OS for the NCI patients far surpassed RTOG 0525 and the SEER cohort outcomes at 30.9m (22.2–65.6). It also surpassed other modern published GBM data [2,3,7]. The effect observed on OS was sustained to 30 months post initiation of treatment. In recent years, landmark analyses have been employed in order to contextualize outcome results by clarifying the relationship between progression and survival [8, 9]. We carried out a landmark analysis on the premise that those patients that had not died at the 12 month time point may have superior biological behavior possibly distinguished by biomarkers such as MGMT, Ki-67, survivin or mpTOR as well as other as yet undiscovered biomarkers which may correlate with the administration of VPA. The analysis suggests a significant benefit to the administration of VPA with 71% of patients having a probability of surviving another 12 months at the 18m time point in the NCI study as compared to 51% in the RTOG 0525 and 48% in the SEER cohort. The data also showcases that fact that the modern day RTOG 0525 cohort, presumably representing a highly selected, superior performing population nonetheless has probability of surviving another 12 months that is very similar to the SEER cohort once they pass the 6m time point. By contrast the NCI VPA treated cohort approaches similar probabilities of survival to the SEER cohort much later, approaching 30 months. This could indicate a potential alteration in tumor biology that occurs in patients treated with VPA which could be explored further in larger cohorts.

In our phase II study we explored the effectiveness of VPA as a radiosensitizer [6] and the hypothesis that VPA favorably alters tumors response continues to be explored in the literature [10–18]. While a recent analysis of four contemporary randomized clinical trials [14] showed no improvement in outcome to the addition of VPA, dose dependency was not addressed in this analysis and existing data suggests that the effect of VPA is dose dependent [15]. By contrast a 2014 meta-analysis suggested improved survival of patients with VPA administration [16, 17] although dose response was not addressed. It is possible that the effects of VPA may include modification of tumor behavior that may be both disease and dose dependent. Biomarker studies aimed at exploring possible avenues underlying the effects of VPA are ongoing within the NCI study cohort and in the literature at large [18].

There are several limitations to our analysis, including the fact that the number of patients on the standard of care arm in RTOG 0525 (411) greatly exceeded the number of patients in the NCI study (37), and that MGMT status was unknown in 49% of NCI study patients, as the bulk of the study was carried out preceding the era of wide spread MGMT methylation testing. In the phase II NCI study time to death or progression was calculated from the initiation of VPA which preceded the initiation of RT and TMZ by 1 week, while in RTOG 0525 time to death or progression was calculated from initiation of concurrent CRT and it was not possible to account for this discrepancy, although the difference of 1 week is unlikely to significantly alter our conclusions. In addition, progression on RTOG 0525 was determined according to Macdonald criteria, whereas the NCI study used RECIST criteria, although both studies accounted for pseudoprogression in determining response. However since SEER does not capture patient characteristics such as KPS, RPA, progression data or MGMT status, a comparison of these characteristics between the NCI study and RTOG 0525 and SEER was not possible. We understand that while anticonvulsant (AED) usage was collected on RTOG 0525, the use of VPA specifically, as a type of AED was not collected.

Conclusion

Previously reported improvements in PFS and OS with the addition of VPA to concurrent RT and TMZ in the NCI phase II study were confirmed in comparison to both a trial population receiving standard of care (RTOG 0525) and a contemporary SEER cohort. These results warrant further consideration of VPA for analysis in a phase III trial.

Declarations

Ethics approval and consent to participate

This study reports on data collected from humans. This research was exempt from NCI IRB approval as one of the six exemptions to the regulatory requirements are described in section 46.101(b) of 45 CFR 46, subsection (4): Research involving the collection or study of existing data, documents, records, pathological specimens, or diagnostic specimens, if these sources are publicly available or if the information is recorded by the investigator in such a manner that subjects cannot be identified, directly or through identifiers linked to the subjects.

Supplemental Table. Comparison of PFS and OS between NCI and RTOG  0525 study cohort. Log-rank test was employed to compare PFS and OS between NCI and RTOG 0525 study cohort and between the  NCI and SEER cohort.

NCI (n=37)

RTOG 0525 (n=411)

SEER GBM 2006–2013
(n=6083)

PFS

OS

PFS

OS

OS

# of events (%)

30 (81)

27 (73)

374 (91)

320 (78)

5359 (88)

median (months)(95% CI)

11.1 (8.0,51.9)

30.9 (22.2, 65.6)

7.5 (6.9, 8.2)

18.9 (16.8, 20.3)

11

6 months (%)

78.4 (66.2, 92.8)

97.3 (92.2, 100)

61 (56.5,65.9)

91.9 (89.3,94.6)

65.5 (64.3,66.7)

12 months (%)

45.9 (32.4,65.2)

91.7 (83.2,100)

30 (25.9,34.8)

70.4 (66.1,75)

45.5 (44.2,46.7)

24 months (%)

37.8 (25,57.2)

56.4(41.9,75.8)

14.4(11.3,18.2)

34.2 (29.9,39.2)

20.7 (19.6,21.8)

p-value*

0.0005*

0.003*

<0.001**

*Log-rank test comparing PFS and OS between NCI and RTOG0525 study cohort;

**log-rank test comparing OS between NCI and SEER cohort

Availability of data and material

The datasets supporting the conclusions of this article are included within the article and its additional files.

Funding

This work was supported in part by the Centers for Cancer Research, NCI. #ZIASC 010372.

Authors’ contributions

AVK conceived the study, participated in its design and coordination, collected patient data, performed statistical data analysis and drafted the manuscript.

MSD, CMG, DJH, SS, RL treated patients included in the original phase II study and RTOG 0525 (MG) and collected patient data.

JS performed the statistical data analysis.

KC, PJT conceived the original NCI phase II study.

KC and AVK conceived the secondary analysis and participated in draft of the manuscript.

Acknowledgements

This work was supported in part by the intramural program of the NCI under funding ZIA-SC- 010373.

List of Abbreviations

CRT – Concurrent Chemoirradiation CNS – Central Nervous System

EORTC – European Organisation for Research and Treatment of Cancer GBM – Glioblastoma

KPS – Karnofsky Performance Status MRI – Magnetic Resonance Imaging NCI – National Cancer Institute

OS – Overall Survival

PFS – Progression Free Survival

RPA – Recursive Partitioning Analysis RT – Radiation Therapy

TMZ – Temozolomide

References

  1. Stupp R, Hegi ME, Mason WP, van den Bent MJ, Taphoorn MJ, et al. (2009) European Organisation for Research and Treatment of Cancer Brain Tumour and Radiation Oncology Groups; National Cancer Institute of Canada Clinical Trials Group. Effects of radiotherapy with concomitant and adjuvant temozolomide versus radiotherapy alone on survival in glioblastoma in a randomised phase III study: 5-year  analysis of the EORTC-NCIC trial. Lancet Oncol 10: 459–466.
  2. Gilbert MR, Dignam JJ, Armstrong TS, Terri S. Armstrong, Jeffrey S. Wefel, Deborah T. Blumenthal, et al. (2014) A randomized trial of bevacizumab for newly diagnosed glioblastoma. N Engl J Med 370: 699–708.
  3. Chinot OL, Wick W, Mason W, Roger Henriksson, Frank Saran, et al. (2014) Bevacizumab plus radiotherapy-temozolomide for newly diagnosed glioblastoma. N Engl J Med 370: 709–722.
  4. Camphausen K, Cerna D, Scott T, Sproull M, Burgan WE, et al. (2005) Enhancement of in vitro and in vivo tumor cell radiosensitivity by VPA. Int J Cancer 114: 380–386.
  5. Camphausen K, Scott T, Sproull M (2004) Enhancement of xenograft tumor radiosensitivity by the histone deacetylase inhibitor MS-275 and correlation with histone hyperacetylation. Clin Cancer Res 10: 6066–6071.
  6. Krauze AV, Myrehaug SD, Chang MG, Holdford DJ, Smith S, Shih J, et al. (2015) A Phase 2 Study of Concurrent Radiation Therapy, Temozolomide, and the Histone Deacetylase Inhibitor Valproic Acid for Patients With Glioblastoma. Int J Radiat Oncol Biol Phys 92: 986–992.
  7. Erica Hlavin Bell, Stephanie L. Pugh, Joseph P. McElroy, Mark R. Gilbert, Minesh Mehta, et al. (2018) Molecular- Based Recursive Partitioning Analysis (RPA) Model for Glioblastoma in the Temozolomide Era: A Correlative Analysis Based Upon NRG Oncology RTOG 0525. JAMA Oncol Author manuscript; available in PMC 2018 Jun 1.
  8. Prados M, Cloughesy T, Samant M, Fang L, Wen PY, et al. (2011) Response as a predictor of survival in patients with recurrent glioblastoma treated with bevacizumab. Neuro Oncol 13: 143–151.
  9. Polley MY, Lamborn KR, Chang SM, Butowski N, Clarke JL, et al. (2010) Six-month progression-free survival as an alternative primary efficacy endpoint to overall survival in newly diagnosed glioblastoma patients receiving temozolomide. Neuro Oncol 12: 274–282.
  10. Ochiai S, Nomoto Y, Yamashita Y, Watanabe Y, Toyomasu Y, et al. (2016) Roles of Valproic Acid in Improving Radiation Therapy for Glioblastoma: a Review of Literature Focusing on Clinical Evidence. Asian Pac J Cancer Prev 17: 463–466.
  11. Redjal N, Reinshagen C, Le A, Walcott BP, McDonnell E, et al. (2016) Valproic acid, compared to other antiepileptic drugs, is associated with improved overall and progression- free survival in glioblastoma but worse outcome in grade II/III gliomas treated with temozolomide. J Neurooncol 127: 505–514.
  12. Eckert M, Klumpp L, Huber SM (2017) Cellular Effects of the Antiepileptic Drug Valproic Acid in Glioblastoma. Cell Physiol Biochem 44: 1591–1605.
  13. Thotala D, Karvas RM, Engelbach JA, Garbow JR, Hallahan AN, et al. (2015) Valproic acid enhances the efficacy of radiation therapy by protecting normal hippocampal neurons and sensitizing malignant glioblastoma cells. Oncotarget 6: 35004–35022.
  14. Happold C, Gorlia T, Chinot O, Gilbert MR, Nabors LB, et al. (2016) Does Valproic Acid or Levetiracetam Improve Survival in Glioblastoma? A Pooled Analysis of Prospective Clinical Trials in Newly Diagnosed Glioblastoma. J Clin Oncol 34: 731–739.
  15. Riva G, Butta V, Cilibrasi C, Baronchelli S, Redaelli S, et al. (2016) Epigenetic targeting of glioma stem cells: Short-term and long-term treatments with valproic acid modulate DNA methylation and differentiation behavior, but not temozolomide sensitivity. Oncol Rep 35: 2811–2824.
  16. Yuan Y, Xiang W, Qing M, Yanhui L, Jiewen L, et al (2014) Survival analysis for valproic acid use in adult glioblastoma multiforme: a meta-analysis of individual patient data and a systematic review. Seizure 23: 830–835.
  17. Lu VM, Texakalidis P, McDonald KL, Mekary RA, Smith TR (2018) The survival effect of valproic acid in glioblastoma and its current trend: a systematic review and meta-analysis. Clin Neurol Neurosurg 174: 149–155.
  18. Adam Louis Cohen, Leigh Neumayer, Rachel Factor, Kenneth Boucher, Mark L. Wade, et al. (2016) A phase 1 window of opportunity study of valproic acid (VPA) in breast cancer testing a gene expression biomarker. Journal of Clinical Oncology 34: 1084–1084.

Vegetation in Semi-Arid Areas as a Direct Meso and Macro Climatic Factor: First Evidence of Duplicate Climate Protective Effect of Large Scale Afforestation?

Abstract

Management of climate via vegetation mainly focuses on the CO₂ sequestration activity of plants. Ecologists and Meteorologists so far agree that vegetation has an impact on micro and meso climatic level. Settlement of new vegetation on bare steppe ground over thousands of square km created within short time as seen in a “Great Green Wall” (GGW) – this still is a “new” engineering event, climatic evaluation of greening of entire regions is only starting. Large scale vegetation in semi-arid areas may have a role as direct meso – and macro climatic factor, developing over decades. Discrepant results are found in simulation models (afforestation related risk of heat in same or neighboring region) versus biophysical analysis of satellite data (warming effect of deforestation in dry climate). In trying to explain this discrepancy the reported effects of large scale afforestation in the Chinese GGW on regional and continental climate are reviewed, as reported for model regions sized a few thousand square km. Long term data showing a mitigating effect on wind, temperature and dryness, an important function of trees in breaking hot dry desert wind, a change to moderately humid climate and the critical minimum density of tree cover are reported. Potential errors underlying the simulation models are being discussed. We derive that the first signs of a potential direct meso and macroclimatic effect of additional vegetation in dry semi-arid and arid areas may become visible in the Chinese GGW, which would mean a duplicate climate mitigating effect here. As more and more afforestation areas of this GGW are established this effect is expected to develop in even larger regions during the next two decades.

Keywords

semi-arid, macro climatic, afforestation, CO₂ independent, climate protection, Great Green Wall

Introduction

There is an increasing interest in managing climate, globally. The topic of managing global climate by means of additional vegetation so far is focused mainly on the CO₂ sequestration activity of plants. Natural climate solution projects are aiming to gain a maximum amount of CO₂ fixation, therefore plantation projects were started preferably in regions where high amount of CO₂ can be sequestered within short time, ie where fast growth of trees is supported by humidity of the local climate. The direct climatic impact of vegetation observed in hot dry regions is: breaking of hot desert winds, cooling effect via evapotranspiration and shadow, increasing water storage capacity of the ground, introduction of a hydrate cycle, etc. Ecologists and Meteorologists agree in that direct effects of vegetation can be demonstrated on micro and meso climatic level. The reason for limiting it to a local and regional scale possibly is because the settlement of new tree vegetation over ten thousands of square km, developing, e.g. on bare steppe ground within short time as seen in the “Great Green Walls” (GGW)– this rarely happened before in human history, so there was no opportunity to observe a macro climatic impact. If afforestation of a huge area with desert-like climate and formerly very sparse vegetation has an impact on climate – how long would it take for such new „savannah plantation“ to really show an impact on the dominating semi-arid (almost desert like) climate?

Evidence of such effects of vegetation so far can only be shown indirectly from analysing the meteorological outcome of large scale deforestation, which is leading to weather extremes. If taking place on several continents at the same time (as is the case with tropical forests) such deforestations are expected to bear risk of global temperature rise [1]. Climatic evaluation of the newly existing large scale GGW in Northern China is only starting [2, 3]. This “North Shelterbelt Development Program” was built on the Southern edges of the Gobi and Taklamakan deserts, predominantly in semi-arid climate, an area measuring up to 4,800 km from West to East.

The oldest GGW was started in the early 1970s in Algeria (1,500 km), and the so far largest GGW is planned since 2005 in the South (Sahel) and North of the Sahara Desert. Today the idea is to create a network of vegetation areas over a territory of more than 7,500 km from coast to coast across the North African continent. It is coordinated by the African Union Commission [4, 5]. New large scale afforestation in hot dry climate needs several decades to get established, vegetation here may directly reduce ground temperature, cause regularity of precipitation and humidity of soil and air. Additional evidence of trees and shrubs in semi-arid areas to have a possible cooling effect on surface temperature is coming from the biophysical investigation of vegetation changes on the energy balance in a global context [6]. On the other hand, two studies simulating the impact of large scale afforestation in semi-arid climate are reviewed here which are finding a risk of surface temperature warming in the planted area or the neighboring regions. The warming trend typically found in simulations is connected to the expected changes in albedo. To better understand the discrepant finding I will review the first long-term real life climate data published for the Chinese GGW.

Review

Afforestation in dry climate – Biophysical analysis and Simulation models

Only recently it has become possible to evaluate the effects of vegetation changes on the energy balance in a global context by means of satellite data analysis. Duveiller et al. [6] have shown that the conversion of forests into grassland or agricultural land in dry climate will lead to rise in mean land surface temperatures. The local effects of vegetation loss or land degradation are an increase in the reflected portion of the short wave radiation, and this was most significant in dry climate regions. The resulting emitted long wave radiation is higher in dry regions and lower in northern latitudes. In addition, vegetation loss will lead to strongly reduced latent heat stream, particularly in tropical climate.

„The type of vegetation covering the landscape has a direct influence on local climate through its control of water and energy fluxes. The albedo (brightness) of the vegetation cover will determine how much energy is reflected back into space as shortwave radiation. Its roughness determines how much mixing of air occurs between the atmosphere and the vegetation canopy. The depth and structure of its rooting system can determine how much soil moisture and groundwater might be tapped and thus how much heat can be dissipated through evapotranspiration or latent heat flux. The balance of all these surface properties determines the direct influence of vegetation on the surface energy budget and ultimately on the local temperature” [7]. It therefore seems that changes in surface properties resulting in reduced number of trees in regions with dry and warm climate can lead to a local warming effect. Can we derive from this finding that, vice versa plantation of trees on bare ground in dry climate will have a cooling effect on surface temperatures? The albedo changing effect of vegetation cover is a strong factor in current climate simulation models. Typically, these models are finding that albedo will be reduced by vegetation, i.e. in comparison with the highly reflective bare ground of steppe or desert, the reduced reflection of sun heat radiation will lead to warming of surface temperature via the non-reflected portion absorbed by vegetation.

Simulation of a Western African GGW [8] has investigated how a seamless vegetation cover with evergreen broad leafed plants in a several hundred km wide area (here called „Savannah“) in the South of the Sahel would impact the number of days with extreme hot temperature, since heat waves are becoming more frequent in some areas of the world and they could as well become a risk for man and agriculture here in the South of the Sahel. The simulation is finding that indeed the number of days with extremely hot temperature will increase over the Savannah region, whereas temperature reduction will be found in the „Guinea“ region in the South along the Ivory Coast and in the Sahel region in the North. The increase in days with hot temperature in the afforested „Savannah“ region would predominantly occur during the dry season. At the end of this article it is stated that further analysis work is needed due to some uncertainty factors in order to come to more robust conclusions but that afforestation would lead to increased risk of heat waves in the „Savannah“ and a reduced risk for regions of comparable size in the North and South of it. Another investigation has been conducted to simulate afforestation in the East of South Africa [9], and the results are similar: In the simulated scenario afforestation would lead to reduced albedo and an increase in surface temperature over the plantation area, as well as a certain cooling effect on the neighbouring regions. Some areas would become more dry, other areas of South Africa may get more precipitation than before. Therefore, afforestation could lead to unfavourable changes in local climate in unpredictable areas, which is why besides the positive biogeochemical impact of large scale afforestation also its possible biophysical effects needed to be considered. In trying to overcome the dilemma of the conflicting results, I will review the first real life climate data published for the world´s largest GGW in China, separated by their potential regional (meso climatic) and continental (macro climatic) effects.

Examples of direct meso climatic effects of vegetation in semi-arid climate

The Chinese state and part of its population have been tackling the “Northern Shelter Belt” project since the 1970’s by planting a reported 66 billion trees along the roads, ditches, ponds, and cultivated land ridges, with the aim of a total of 100 billion trees and shrubs planted by 2050.Today these activities are supported by increasingly sophisticated technology resulting in the (re-) greening of steppes and even sand deserts in a gigantic large scale, on an area of 4,800 x 1,500 km. By 2050 these measures are hoped to improve soil degradation on 40% of China´s total area [2, 3].  A detailed case study by Zhuang et al. [10] published in 2017 is based on long-term data from a ”show case“ region of 152,000 hectars (an area of about 50 x 30 km) in Northern Jiangsu. Some 132,600 hectares of the total ground had been desertified until the early 1950´s when afforestation with millions of trees was started here as one of the first regions in the fight against desertification. It is not reported but the proximity to the Yellow River may have made afforestation easier. A marked improvement of the regional climate data is reported: air humidity has increased, the number of days with dust winds is decreased and the formerly steppe landscape was transformed into a green patchwork of forests and agriculture. Reliable publications of detailed afforestation related climate parameters are still rare, therefore the findings are presented in more detail.

The authors claim that today, “the formerly extremely severe climate along the old course of the Yellow River has been fundamentally changed. The improved quality of the regional environment is verified by the greatly increased productivity and welfare of the people. The saline alkali soil has been treated, along with poverty, transforming a beggar’s hometown into a modern region, famous as a producer of food, fruits, vegetables and wood.“ [10]. Regional climate data for the last 66 years were documented by the Fengxian Meteorological Bureau. Data are showing a reduction in strong wind days per year by 80%, reduction in maximum wind speed from 26 to 11 m/sec and reduction of the average wind speed over the ground by 90%. The forested area has been expanded within 60 years, starting from 3% in the 1950´s to 36.9% in the 2010´s. This would have transformed the long term trend of sand storms and desertification into more humid climate in which catastrophic droughts have become rare, despite the underlying global warming mega trend. The local climate has benefitted from reduced temperature extremes, reduced strength and frequency of sand storms and more days with fog.

Precipitation data before / after afforestation are not presented in this paper. However, from 1958 to 1980 the average relative humidity in June had been between 55 and 80%, then during the last 30 years it has varied from 78 to 90%. The increase in relative humidity possibly would result from an increase in evapotranspiration of trees and shrubs and on the other hand from the markedly reduced frequency of strong winds and decreased average yearly wind speed. The number of foggy days per year in this region is reported to have increased from 10 to 20 days (1958 -1971), to 18 to 35 days (1972 – 2000), and 35 to 45 days (2001 – 2013). Before 1960 there were 1 to 22 days with hot dry wind per year, this value has gone down to 0 to 6 (1981 – 2005) and 0 to 3 per year (2005 – 2013). This finding is interesting as it is showing an important impact of vegetation on hot dry desert wind that had caused extreme temperatures in the past – and it contradicts the expected role of a reduced albedo that is to be assumed for an increase in vegetation coverage by 33%. Today this feature of hot dry desert winds seems to have mostly gone and a reduced average wind speed is caused by the additional vegetation. In China, as in many other countries a recent trend of warming and increase in droughts is found, as shown for the period from 1982 to 2011 in [7]. Despite this fact, Zhuang et al report that the June average temperatures have remained constant over the last 60 years in this Northern Jiangsu region. Given the global warming trend (with a reported increase of about 1.5 degrees for China during the last three decades) this arguably may be considered a net decrease of surface temperature.

The authors conclude that, “with constant application of reforestation for 50 years, the regional climate in the old course of Yellow River has improved greatly, from its former long term status as a region of sandstorms and desertification, into a region that can be considered as being intermediate between mesic and humid in weather, and with few natural disasters. Sandstorms, dry-hot wind and saline alkali soil have been eliminated at the root source, along with poverty of the local population.”[10]. The authors propose that, “even though a single or several plots of trees might be net consumers of water in arid and half arid region, millions of trees may have a ‘‘mass effect function on improving regional climate.’’

Furthermore, based on long term climate data a „critical mass“, i.e. a minimum number of trees per area required to find measurable climatic effects of vegetation was discovered. In the hostile semi-arid basic climate a reported 16% and higher tree coverage had led to the moderately sub humid conditions observed today. Less marked results so far are reported in another example. The arid Kubuqi desert is located in the Ordos prefecture of Inner Mongolia, an Autonomous Region in the Northwest of China. Here, a total area of almost 6,000 square km of sand desert has been greened. This achievement was sponsored by a private ecology and investment company, Elion Research Ltd. since 1988 [11, 12]. “Emerging private enterprises such as Elion have played an important role in desertification control and governance in the Kubuqi Desert with the support of local government in terms of policies, planning, and infrastructure construction” [12]. Along the south bank of the Yellow River, Elion has established shelter forest in a belt of 242 km length and 5 to 20 km wide, consisting of trees, bushes and grass. Kubuqi has a temperate continental arid monsoon climate (Köppen class BWk, desert climate), with a long cold winter and warm short summer. January is the coldest month with average of –11.7ºC, July is the hottest month with average of 22.1ºC [12].

In a newspaper article precipitation is reported to have increased during the last 30 years from 100 mm to more than 400 mm in 2018 in this part of the desert [11]. However, there is a constant risk for such reports to originate from biased source. A reliable report including meteorological long term data published by the United Nations (UNEP) in 2015 [12] has found only around 10 % increase in precipitation. The shape of the main tree plantation area is a stretched, rather narrow belt. Evapotranspiration is reported to be generally low due to the low temperatures in autumn and winter. Precipitation results published in [12] are between 260 and 280 mm from the 1960´s to the 2000´s, and 310 mm for the 2010´s decade.

As to sand storms, the UNEP report concludes: “The Kubuqi Project area displays a consistent greening trend that could have caused a decrease in dust storms. This is supported by evidence from the meteorological records at Hangjin Qi which indicated that the number of sandstorm days per year decreased dramatically after the 1970s. Although the decreasing trend was evident before the Kubuqi Project started it has continued until now.”

Days of sandstorm per year until 1985 was between 10 and 50, and since then has decreased to 0 to 8 days.

Annual air temperatures recorded at Hangjin Qi station seems to follow the continental trend as given in [7].

The UNEP report identifies a risk typical for large scale afforestation in semi-arid areas: “While there is currently some risk of overuse of the water table, that is… mitigated by the fact that high water use species, such as non-native vegetables and trees, are only a portion of the developed area, the remainder being mostly plants native to desert areas.” The report recommends “a thorough assessment of water resources before extending to new areas so that the risk of water table depletion can be managed in terms of planting the appropriate species at suitable densities for the local hydrological conditions” [12]. In summary, in both example regions which may belong to the most advanced areas of the Chinese GGW, a reduction in sand storms and events of strong wind can be found following afforestation. In addition, for Jiangsu region an increase in air humidity and constant temperatures over the last 6 decades are found which on basis of global warming trend could indicate a slight cooling effect resulting from afforestation. This may be evidence of direct effects of afforestation on meso climatic level, leading to mitigation of dryness, heat, wind and sand storms in semi-arid and arid climate. Regional transformation from semi-arid to now moderately humid climate was reported.

Direct macro climatic effect of vegetation

During the last three decades, increased drought severity has led to loss of biomass in China, particularly around the year 2000 [7]. This trend clearly will have impacted the Chinese GGW afforestation efforts but plantations may have recovered since then. However, significant increase of forested area in Northern China also has been confirmed for other regions of the GGW. In a study published in 2013 the forested area in the district of Yulin (Shaanxi province) was analysed by mapping afforestation and deforestation from 1974 to 2012. Here, the forested area grew from 14.8% (380,394 hectares) in 1974 to 43.9% (1,128,380 hectares) in 2010. This was determined in a validated evaluation of time series stacks taken by Landsat satellite [13]. The semi-arid continental climate here has an average annual precipitation as low as 400 mm, falling mostly in the hot months of July and August.

In the last century sand and dust from the Gobi and Taklamakan deserts have been reported to be blown over thousands of km, leading to regular heavy air pollution in the capital of Beijing, and even causing coloration of rain and surfaces in Korea and Japan. These dust storm events, so called “Yellow dragon”, probably have been worsened in the last century by deforestations and over use of vegetation and ground water in the climatically sensitive semi-arid Northern territories of China, thereby leading to desertification of wide areas. A publication of Feng Wan et al. (2013) is showing that the frequency of sand storms of different strength in China indeed has gone down since 1954. According to this study, until 2010 the last strong sand storm in Beijing has been registered in 1995 [2]. The reduction of these events has been connected by local meteorologists to the large scale fixation of sand dunes and steppes of Northern and Northwest China. Evidence is given in a study (2015) of time trends in vegetation index in the GGW region, showing that, when compared with adjacent regions the GGW has improved the vegetation index and effectively reduced dust storm intensity (frequency, visibility, duration) in Northern China [14]. The Normalized Vegetation Difference Index (NDVI) is a measure of green vegetation cover from satellite imagery. For this parameter time trends were analyzed together with rainfall and dust storm data from weather stations. An index of dust storm intensity was deployed that takes frequency, visibility, and duration of dust storm events into account. The study found that NDVI was not related to rainfall trends, whereas dust storm intensity was decreased, resulting from increase in NDVI.

An investigation published by the same author in 2016 [15] has analysed air pollution data as generated by 186 observational stations across China. Average NDVI values in the 20-km radius of the 186 stations for six selected years in the period from 1983 to 2003 were analysed. Tan concludes that sand storms and dust storm intensity had decreased markedly during this time period in the area of the GGW and that in parallel the vegetation had recovered here. Thus, reduction in sand and dust storm events seems to be the first and most obvious climatic change introduced by afforestation. It is mentioned in all studies on the subject and noticed on regional as well as on continental level.

Discussion

The biophysical analysis of satellite derived data by Duveiller et al. [6] is showing that in dry climate, when compared to any other form of vegetation, forests have a cooling effect on surface temperature. This finding is surprising and it may necessitate a correction of the existing albedo simulation models for this climate zone. The review of simulation results in contrast suggests that afforestation of steppes and desert bordering areas may lead to a rise in surface temperature and risk of extreme hot temperatures in the same or neighbouring regions.

The West African simulation study [8] is mentioning uncertainty factors to be considered, e.g., choice of simulation model, and definition of extreme heat. At least for the vegetation found naturally in this climate it is fair to say that it would not show dark green colour throughout the year: Leaves and bark of sclerophylls often show bright wax cover, white „hair“, spines, prickles or thorns reflecting the sun light, thereby protecting them from UV radiation. In the typical savannah landscape trees are not standing very close and the grass in between will show light yellow colour during the hot dry season, i.e. for 7 to 9 months of the year. During this time fresh green leaves will dry out and fall off, they typically do not exist on the local species during most of the year. Therefore it seems doubtful whether the standard used here (“evergreen broad leafed plants“) can be applied to simulations of semi-arid conditions. Any existing or newly developed savannah vegetation cover that is adapted to this climate would probably not present dark green colour during dry season thus have a lower effect on albedo most time of the year.

With more and more simulations and investigations being undertaken to analyse the climatic impact of trees and forests scientists are now heavily discussing the overall net contribution of afforestation on global warming. In this situation it may help to search for afforestation related real life (semi-arid) climate data. The dilemma being that for such experiment we would need 1. about 50 years of time to establish tree vegetation cover in semi-arid area, 2. perfect baseline regional climate data and 3. to come to a reliable conclusion the temperature rise of global warming trend over these decades is to be taken into account. Afforestation in the Chinese example areas more or less is those 50 years ahead. By using long term climate data collected in one and the same meteorological station an interesting regulation mechanism was found that may not be as predominant in simulation models [10]. In the Jiangsu region, an actual tree coverage as high as 36% (starting from 3%) led to significantly reduced wind speed so that days of hot dry desert wind and extreme temperature in this region are almost gone. Where did the heat go, has it led to warming of the neighbouring regions?

We do not know, but certainly part of the energy will have gone into evapotranspiration of the newly developed forests. In the context of a GGW we need to ”think big“, we should find similar, maybe weaker cooling trends in other parts of the gigantic large Chinese GGW. The example described in above is a simple cause-and-effect relationship but it seems to have large meso climatic effect. It is questionable whether simulation would have shown that the vegetational impact on wind speed would by far overweight the impact of reduced albedo in the investigated region – and probably to some degree in all surrounding regions that have been enriched with vegetation. Albedo change and reduction in wind speed – these are only two of the factors of the complex regional interaction between vegetation, ground and climate. Other single factors that speak against warming effect of afforestation in dry hot climate which seem difficult to analyse or simulate are:

  1. Shade: Shade reduces temperature, increases humidity, leading to constant soil moisture and thereby an increased uptake of rare precipitation. In this climate partial shadow may enable life, whereas absence of shadow does not. On a ground that is entirely dried out water can stay for long time without being taken up. During this time the majority of precipitation may already have run away in a wadi.
  2. Root system: Deep root penetration of the ground will give it structure that allows for infiltration and long term storage of precipitation in deeper zones of the ground, leading to rise of the ground water level. Strong main roots will break up soil compaction in deep ground, fibre roots will increase the water holding capacity of desert sand… All of which will contribute to the water cycle, thereby increasing the cooling effect via evapotranspiration. In this climate zone water is of ultimate importance as it dominates life here in a “all or nothing rule”.

Can these and other biophysical single factors related to afforestation be simulated appropriately, with their specific intensity and meaning in semi-arid regions? Today, where would we get reference data to underlie a realistic simulation, even if these were given for an area of ”only“ 1,500 square km, like the Jiangsu region in China? When in this climate it takes at least 4, 5 or more decades until such „test area“ is established? Probably it is not a simple task to simulate an overall cooling effect of new vegetation that may evolve to its full extent in nature only after 5 to 7 decades, as can be derived from review of dry climate ecological data [16].

Often questions around publication of data of the Chinese GGW are raised: Where do data come from, what is the source? Analysts may be over motivated to sell a positive outcome of such huge project leading to biased reporting of results. As shown in the Kubuqi example, true facts (increase in precipitation) can be mixed with “half truth” (100 mm instead 260 mm initial value, 400 mm instead of 310 mm averaged value today) which is disappointing as it may mask any helpful interpretation based on true data. The UNEP (2015) report in this respect seems trustworthy, doing only interpretation of long term data, gathered from a local weather station.

Likewise, climate data from the Jiangsu region do meet these criteria. They are also underlined by positive agro economical facts on the development from steppe land in the 1950´s to farming land and fruit garden today. The authors even complain that, because harvests here are so rich farmers would now start to cut trees on the field borders in order to gain more arable land, they see a risk that very soon such behaviour could bring back the old days of hot sand storms.

The Northern Jiangsu region seems to be a “show case” or “model” region: Its´ proximity to the Yellow River is likely to have enabled irrigation of young plants, maybe there is a high water table as in the example of Kubuqi where the stretched narrow green belt was built along the banks of Yellow River. Here a high water table in a few meters depth is reported which clearly has made afforestation easier. Other regions of the Chinese GGW may not have this luxury. Their development into a state of 16, 20 or more percent tree cover when transition to sub-humid climate can be expected (as in Jiangsu) – this is likely to take more years here.

In this review we do not cover the question of which kind of species or vegetation to be chosen for which climate situation. Reports of the Chinese GGW make clear that also plantation of grassland and shrubs is part of the afforestation campaign. The high mortality rate of trees in this climate and a preferably lower water consumption rate of grassland are typical points of criticism of scientists [17]. Today China looks back on three generations of large scale planting efforts, and correction of some of the ecological parameters has been and will need to be done.

Any improvement of climate parameters may only develop over years and decades, hand in hand with the establishment of the new vegetation. Such improvement likely will be counteracted by the effects of global warming. It is therefore difficult to measure any balancing climate effect of new vegetation since these two activities minimize each other. In addition, the larger the region being analysed the more difficult it seems to relate any change in climate parameters to afforestation activity. Long term investigations over the next decades will show whether a still growing new vegetation cover in semi-arid Northern China, besides sand storm events also will modify temperature and humidity on a continental level, similar to the reports on regional level.

Conclusion

It is surprising that we may be able to already find meso and macro climatic effects of vegetation only 50 years after the first plantations were started. In comparison to afforestation in humid climate, newly planted vegetation in semi-arid climate is expected to need significantly more time to take root and get established. Based on semi-arid ecological observations it may take up to 70 years until new vegetation in steppes is well established [16] and only then would also have developed its´ full climatic potential for increased deposition of precipitation in the ground, for the activation of hydrate cycle, formation of clouds, reduction of wind speed, and stabilized surface temperatures. Similarly, a recent report from a Chinese science journalist indicates that it is expected to take another 20 years until we will see the full spectrum of positive results from the Chinese GGW that was started in 1978 (“France 24”, online news 2018). We need to „think big“ in terms of geography – and time. The ability of such plantation to develop, spread and expand further, this certainly can be used as a measure of persistence and success of semi-arid afforestation.

Striking discrepancy was found between the theoretical impact of albedo changes outweighing afforestation results in simulation studies when compared to the importance of wind breaking activity of vegetation on the border of deserts, as seen in real life. The difficult afforestation of steppes and desert border regions may be of high value, functioning as a „vegetational climate barrier“, in addition to the climate protective effect via CO₂ fixation. Here the desert climate parameters are being controlled, vegetation here is buffering the climatic impact of deserts on their adjacent regions.

The first results from Jiangsu region with a size of about 30 x 50 km are showing a threshold with 16 to 20 % of minimum tree cover that is leading to beneficial regional climate changes, i.e. an increase in humidity that is enabling agricultural production in an area dominated by hostile semi-arid climate before. Especially in semi-arid and arid climate it seems obvious that vegetation should have a minimum density over a larger area, a certain minimum percentage in order to show climatic impact and to support or enable agriculture via humidity and precipitation induced by the additional vegetation.

Current natural climate solution projects are focused on maximum fixation of CO₂ amounts, consequently plantation projects were supported preferably in regions where high amount of CO₂ can be sequestered within short time, i.e. where fast growth of trees is supported by humidity of the local climate. In the semi-arid climate of desert border regions however, viability of vegetation depends on a certain regularity of precipitation, additional vegetation may create a duplicate climate mitigating effect, leading to additional humidity and reduced surface temperatures on formerly bare ground.

What if many or most of the desert bordering regions and semi-arid areas with signs of desertification, globally are considered as GGW candidates, getting re-greened in order to maintain soil fertility and a balanced regional and continental climate? Regions in question for respective activities are the Sahel, South Africa, the entire region from Syria to Pakistan, parts of India, and Australia. GGWs and networks of existing and new vegetation in desert bordering areas may be stabilizing in many regards, leading to a more balanced climate regionally and perhaps, globally – in addition to the benefit for agriculture and economy.

Acknowledgement

I would like to thank Professor Dr. Klaus Becker, University of Hohenheim, Germany for all helpful feedback and discussion of the topic.

References

  1. Sven Ploeger, Frank Boettcher: Klimafakten“, Westend Verlag GmbH, Frankfurt (2013). ISBN 978-3-86489-048-2. Pg No: 124–125.
  2. China’s ‘Great Green Wall’ Fights Expanding Desert by Alexandra Petri E (2017) National Geographic, Apr 21.
  3. Feng Wan, Xubin Pan, Dongfang Wang, ChongyangShen, Qi Lu (2013) Combating desertification in China: Past, present and future“. Land Use Policy 31: 311–313.
  4. World leaders renew commitment to strengthen climate resilience through Africa’s Great Green Wall“. Article based on The African Union Commission Press Release, Paris, France, 02 December 2015. In: The African Union, Link: http://www.au.int/en/
  5. Eduardo Mansur in Great Green Wall’ initiative offers unique opportunity to combat climate change in Africa. UN agency. 17 November 2016. Link: http://www.un.org/sustainabledevelopment/blog/2016/11/great-green-wall-Ca-un-agency/
  6. Gregory Duveiller, Giovanni Forzieri, Eddy Robertson, Wei Li, Goran Georgievski, et al. (2018) Biophysics and vegetation cover change: a process-based evaluation framework for confronting land surface models with satellite observations. Earth Syst Sci Data 10: 1265-1279, https://doi.org/10.5194/essd-10-1265-2018
  7. WAD – World Atlas of Desertification, European Commission, Joint Research Center Update 21.11.2018, Link: https://wad.jrc.ec.europa.eu/
  8. Odoulami RC, Abiodun BJ, Ajayi AE, Diasso UJ, Saley MM (2017) Potential impacts of forestation on heatwaves over West Africa in the future. Ecological Engineering 102: 546–556.
  9. Myra Naik, Babatunde J (2016) Potential impacts of forestation on future climate change in Southern Africa”. Int. Journal of Climatology 36: 4560–4576.
  10. Jia-Yao Zhuang, Jin-Chi Zhang, Yangrong Yang, Bo Zhang, Juanjuan Li (2017) Effect of forest shelter-belt as a regional climate improver along the old course of the Yellow River, China. AgroforestSyst 91: 393–401.
  11. Li Yang: Kubuqi a successful example of desert greening.China Daily, Updated: 2018-08-06, 07:39h.
  12. UNEP: Review of the Kubuqi Ecological Restoration Project: A Desert Green Economy Pilot Initiative.” 2015. United Nations Environment Programme, Nairobi.
  13. Liangyun Liu,Huan Tang, Peter Caccetta, Eric A. Lehmann, Yong Hu,Xiaoliang Wu (2013) Mapping afforestation and deforestation from 1974 to 2012 using Landsat time-series stacks in Yulin District, a key region of the Three-North Shelter region, China Environ Monit Assess. 185: 9949–9965.
  14. Minghong Tan, Xiubin Li (2015) Does the Green Great Wall effectively decrease dust storm intensity in China? A study based on NOAA NDVI and weather station data. Land Use Policy 43: 42–47.
  15. Minghong Tan (2016) Exploring the relationship between vegetation and dust-storm intensity (DSI) in China. Journal of Geographical Science 26: 387–396.
  16. Lorenz Huebner (2019) Der Gruene Rettungsring. MitvernetzterSteppenbegruenung global der Klimakrisebegegnen”.OekomVerlag, Munich, Germany.
  17. Alexandra E. Petri (2017) China’s ‘Great Green Wall’ Fights Expanding Desert”. National Geographic Link: https://news.nationalgeographic.com/ 2017/04/china-great-green-wall-gobi-tengger desertification/