Abstract
Aims: Accelerated cognitive decline frequently complicates traumatic brain injury. Obesity and type 2 diabetes mellitus drive peripheral inflammation which may accelerate traumatic brain injury-associated neurodegeneration. The Zucker rat harbors G-protein coupled receptor agonist IgG autoantibodies and in vitro neurotoxicity caused by these autoantibodies was prevented by a novel synthetic fragment of the serotonin 2A receptor. The aim of the present study was to test whether genetic obesity manifested in Zucker diabetic fatty rat is associated with greater spatial memory impairment before and after mild traumatic brain injury compared to Zucker lean rats. Furthermore, we investigated whether these neurodegenerative complications can be lessened by administration of a novel putative neuroprotective peptide comprised of a fragment of the second extracellular loop of the serotonin 2A receptor.
Methods: Age-matched lean and fatty diabetic Zucker rats were tested in the Morris water maze (spatial memory) prior to receiving a sham-injury or lateral fluid percussion (LFP) mild traumatic brain injury. Behavioral testing was repeated at 1-week, 1-month, and 3-month intervals following injury. A synthetic peptide consisting of a portion of the 5-hydroxytryptamine (serotonin) 2A receptor (2 mg/kg) (vehicle, or an inactive scrambled version of the peptide (2 mg/kg)) was administered via intraperitoneal route every other day for 7 days after sham or LFP injury to lean rats or 7 days before and after sham or LFP injury to fatty rats.
Results: Mild traumatic brain injury impaired recall of spatial memory in fatty and lean rats. Zucker fatty rats subjected to sham-injury or mild TBI experienced a significantly greater longitudinal decline in recall of spatial memory compared to lean Zucker rats. A synthetic peptide fragment of the 5-hydroxytryptamine 2A receptor significantly enhanced acquisition of spatial learning and it appeared to strengthen recall of spatial learning (one-week) after sham injury in Zucker rats.
Conclusions: These data suggest that the Zucker diabetic fatty rat is a suitable animal model to investigate the role of metabolic factor(s) in accelerated cognitive decline. A novel synthetic peptide comprised of a fragment of the second extracellular loop of the human serotonin 2A receptor appeared to have neuroprotective effects on both acquisition and recall of spatial memory in subsets of Zucker rats, with relatively greater benefit in sham-injured, lean Zucker rats.
Introduction
Cognitive dysfunction increases substantially following Traumatic Brain Injury [1] (TBI) contributing to substantial morbidity and mortality in affected persons. Peripheral and central inflammation drive neurodegeneration via activation of innate and adaptive immune mechanisms which may target (in part) neurovascular antigens released during traumatic brain injury. Owing to a global epidemic of obesity and type 2 diabetes mellitus [2], lifetime TBI-sufferers having metabolic derangements associated with peripheral inflammation may be at increased risk for experiencing certain neurodegenerative complications [3].
The Zucker diabetic fatty rat (ZDF) is a model of morbid obesity, type 2 diabetes mellitus and hypertension [4] which exhibits high level of innate immunity, i.e. pro-inflammatory cytokines [5]. Previously, we reported spontaneously-occurring neurotoxic agonist autoantibodies targeting the 5-hydroxytryptamine (serotonin) 2A receptor in plasma from both ZDF rat and Zucker lean rat (ZLR) sub-strains with the ZDF rats having persistently high level at 5 months of age [6]. The serotonin 2A receptor is a known treatment target in major depressive disorder and Parkinson’s disease, two neurodegenerative complications following TBI. Here we tested for changing in the acquisition and/or recall of spatial learning in substrains of Zucker fatty and lean rats following mild TBI (induced by lateral fluid percussion) or sham injury.
In addition, a putative neuroprotective peptide comprised of a 5-hydroxytryptamine (5HT) 2A receptor second extracellular loop region fragment was effective in preventing in vitro neurotoxicity caused by autoantibodies targeting the serotonin 2A receptor from both ZDF rat plasma [6] and human neurovascular disorders plasma [7]. Therefore the efficacy of this peptide in modulating TBI- (or sham-injury associated spatial memory impairments in fatty and lean Zucker rats was tested. The mechanism of the action of the 5HT2AR peptide fragment was explored using alanine substitution of key functional amino acid residues.
Materials and Methods
Peptides
A linear synthetic peptide, SCLLADDN (SN..8 or “P4”) having a sequence identical to that of a fragment of the second extracellular loop region of the human 5-hydroxytryptamine 2A receptor was synthesized at Lifetein, Inc (Hillsborough, NJ) and had ≥95% purity. Substitutions of SCLLADDN containing a single alanine amino acid replacement, e.g. SALLADDN, SCLLADAN were synthesized at Lifetein, Inc (Hillsborough, NJ) and had purity of ≥95%. A “scrambled” peptide containing the same amino acids as SCLLADDN had a sequence of LASNDCLD (LD.8) and a purity of 96.37%, MW 849.91. The lyophilized peptides were stored (in the presence of dessicant) at −40 degrees C prior to use. On the day of an experiment, an aliquot of lyophilized peptide was reconstituted in sterile saline at the indicated concentration. Reconstituted peptide(s) were prepared fresh before each experiment.
Animals
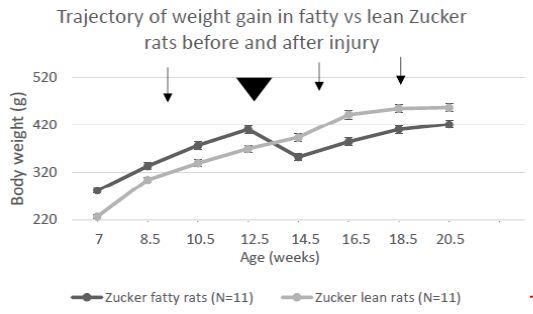
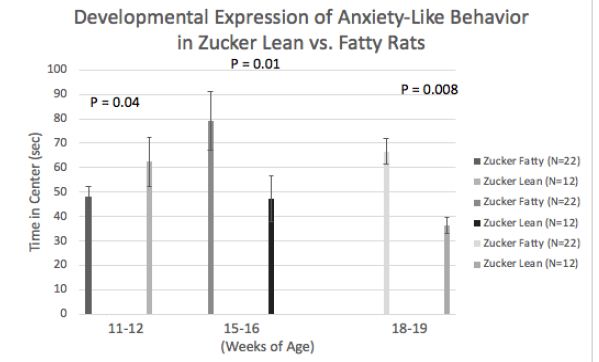
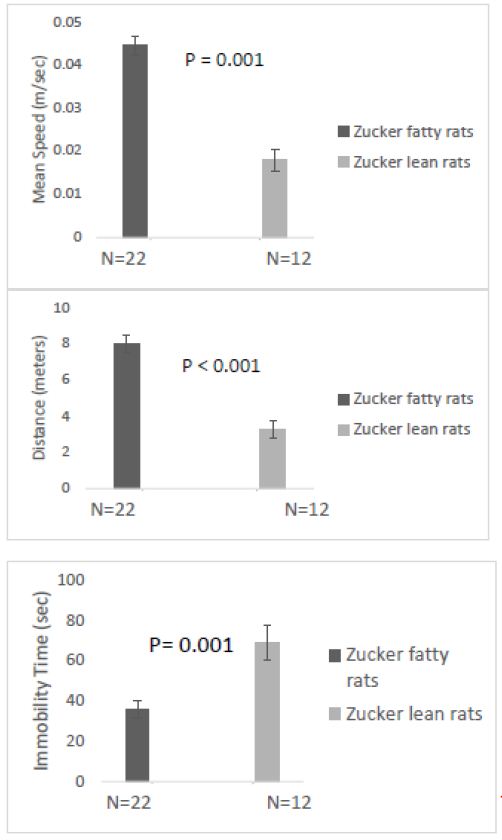
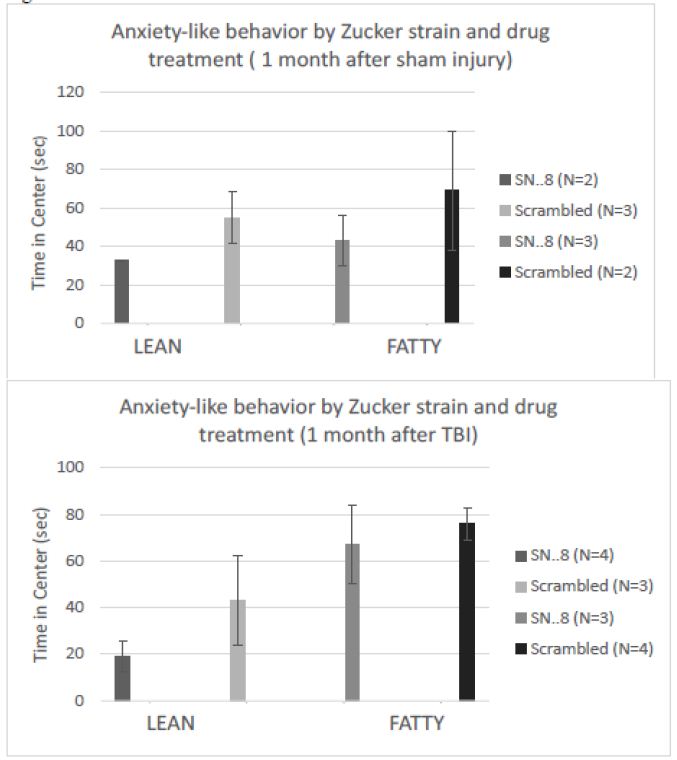
All procedures were conducted according to the National Institutes of Health (NIH) Guide for the Care and Use of Laboratory Animals and approved by the Institutional Animal Care and Use Committee of the Veterans Affairs Medical Center (East Orange, New Jersey). Male ZDF (fa/fa) and lean (+/?) Zucker rats were obtained from Charles River Laboratories (Kingston, NY) at approximately 6-7 weeks of age. All rats were single housed upon arrival, with modest enrichment (a PVC tube). Rats were provided ad libitum access to food and water and maintained in a 12 h light/dark cycle with lights on at 0630. All procedures occurred during the light phase of the circadian cycle and a timeline of procedures is shown in Figure 1. Results of the open field test (OFT) for anxiety-like behavior and sucrose preference test results (a measure of anhedonic behavior) are not reported here.
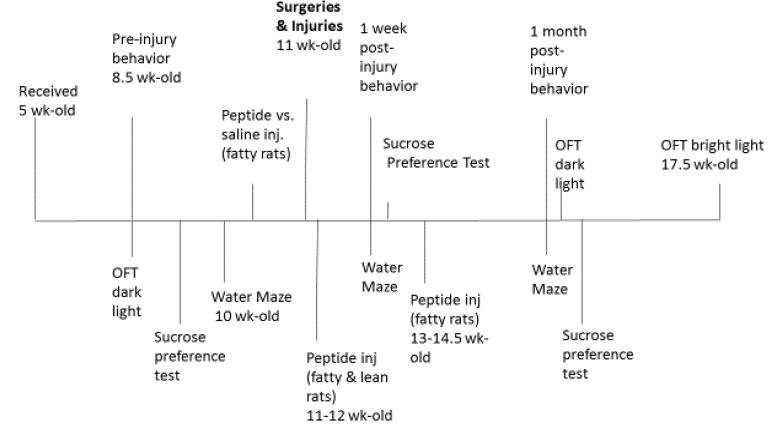
Figure 1: Timeline of treatments, exposures and behavioral assessments in Zucker rats
Injections
Peptide (SN..8 or LD.8) was dissolved in sterile saline (2 mg/kg) and SN.8 peptide vs. vehicle (sterile saline) or LD..8 peptide intraperitoneal (IP) injections were administered every other day according to the schedule shown in Figure 1. Peptide (SN.8) (vs. saline or LD..8) injections commenced 1-week prior to surgery/injury in ZDF rats to prevent (excess) acute post-injury mortality in ZDF rats thought to be related (in part) to pre-injury moderate hypertension. The peptide SN..8 was previously reported to substantially lower blood pressure in the ZDF rat [8].
Surgeries/Injury
All animals underwent a surgical procedure to attach a luer-lock connector to a craniectomy, positioned either on the left or right parietal bone plate. Rats were anesthetized with 1-4% isoflurane (5 L/min O2 for 60 s) and transferred to a stereotactic instrument with 1-4% isoflurane mixed with 1-1.5 L/min O2 delivered via a nosecone to maintain anesthesia throughout the surgery. A craniectomy (2 mm in diameter, centered at 3 mm posterior to bregma and 3.5 mm lateral to midline) was made in the skull and super glue was used to secure a luer-lock connector around the edge of the craniectomy. A plastic cylinder (cut from a 10 mL syringe) was placed on the skull surrounding the luer-lock connector; this was placed to provide stability and protect the area around the craniectomy. Dental cement was used to fill the space in between the connector and the plastic cylinder. A small amount of sterile saline was deposited into the connector along with a small piece of Kimwipe to keep the dura clean of debris.
One day following implantation of the surgical hub, fluid percussion injury is achieved with a device using a computer-controlled voice-coil to deliver defined pressure waves to the dura through a water piston [9]. Water is first placed in the surgical cap to prevent any air displacing the pressure waves. Rats were anesthetized with isoflurane in an induction chamber followed by fluid percussion injury or sham. The injury procedure occurs one day after surgery to prevent the dura from drying out and thereby reducing the injury of the brain tissue. Mild to moderate severity TBI will occur at pressure amplitudes of 20-30 psi (±3 psi) and rates of rise between 10-20 ms. To reduce the effects of anesthesia as much as possible, rats are connected to the device by the syringe hub and allowed to recover from anesthesia until they respond lightly to a foot pinch before injury occurs. Therefore, the rats were lightly anesthetized at the time of injury. Sham rats are treated the same way as injured rats including isoflurane anesthesia and connection of the device to the rat, but the pressure wave was not delivered. The animal is monitored for startle in response to the pressure wave and then placed on its back in a recovery cage and evaluated for apnea. Latency for the righting reflex to return is recorded and used as an index of traumatic unconsciousness.
Behavioral Tests
Morris Water Maze
The Morris water maze is a test of short-term recall of a spatial learning task. Zucker lean and fatty rats subjected to sham vs. traumatic brain injury were tested for the ability to locate a submerged platform in a swimming pool. Sample phase corresponds to acquisition of learning; the choice phase measures recall of newly-acquired spatial learning task. Distance is a measure of how far the rats swam before locating the submerged swim platform. Longer distance (choice phase) is indicative of impairment of recall of short-term spatial learning acquired in the sample phase. Path efficiency (efficiency) is the ratio of the shortest path to the platform vs. the actual swim path taken by the animal. Maximum path efficiency has a value of 1.0 and is a measure of recall of swim platform location.
Delayed Match to Position in Morris Water Maze
Before injury, the animals underwent extensive training in the Morris water maze apparatus. The delayed match to position (DMTP) test is a short-term recall of a spatial memory task. Rats were tested for the ability to locate a submerged platform in a swimming pool. The swimming pool was made opaque by non-toxic paint (Crayola washable paint, 16 oz, white 54-2016-053). Submerged in the pool was a platform on which the rat could escape from swimming, with the surface of the escape platform approximately 1 cm below the surface of the water. During the first acclimation session, the rat was initially placed on the platform and allowed to remain on the platform for 10 – 20 seconds. In subsequent training trials, the rat was placed further from the escape platform so that the rats learned that there was a place to escape from swimming, learned to climb onto the escape platform, and acclimated to swimming in the pool. During this training phase, the escape platform was in the same location and rats were started twice from 3 distinct locations (6 trials/session). Rats were trained for 4 days with one session per day. Each trial lasted a maximum of 60 seconds and if the rat had not located the platform during that time the rat was led to the platform using a wooden stick. The rat was then allowed to climb onto the platform where they remained for 10-20 seconds. After this, the rat was dried and moved to a holding cage with a heater if necessary.
One day after the 4th training session, a single probe trial was given in which the platform was removed from the pool and the rat was allowed to swim from one of the start locations for 60 seconds, after which the rat was removed from the pool, dried, and placed back in the home cage. For both training and probe sessions, the swim path of the rat was recorded and analyzed for multiple measures to assess spatial learning using AnyMaze (AnyMaze version 6.21 (64-bit) (Stoelting Co., 620 Wheat Lange, Wood Dale, IL 60191 USA).
Testing of spatial working memory commenced approximately 2-3 days after the probe trial using a DMTP procedure that consisted of 6 trials per rat with each trial having two phases, a sample phase and a choice phase. At the beginning of each trial, an animal entered sample phase by being placed in the water at a novel start position and has 60 seconds maximum swim time to find the platform. After either successfully finding the platform or being led to it after the 60 seconds swim time, the rat was left on the platform for 15 seconds, and then returned to its home cage for 30 seconds. That same animal then began choice phase, was placed back in the water at the same location as in sample phase and had 60 seconds maximum swim time to locate the platform. Each trial has a novel combination of start and platform positions. All rats were tested at the same start-platform positions. The pool was divided by AnyMaze into three equal-area zones, covering 120° of circumference each. At the beginning of the sample phase, each rat was placed in the water facing the perimeter of the tank in a selected zone. The escape platform was in a different zone than that of the start position and remained in that zone for both phases. The rat was allowed a maximum of 60 seconds to find the platform. After either successfully finding the platform or being led to it after 60 seconds, the rat was left on the platform for 10-20 seconds, and then returned to its home cage for approximately 30 seconds. The same animal then began the choice phase, where it was placed back in the water at the same start location as in sample phase and allowed 60 seconds to locate the platform. On each subsequent trial, the starting location and the platform location were changed across trials, not within trials, within the session. Approximately 1 hour separated each trial.
The swim path was recorded for later analysis. One to two days of working memory testing was required. Swim Distance was used as a measure of how far the rats swam before locating the submerged swim platform.
Statistics
Student’s t-test for single comparisons, two-way ANOVA for differences between two or more factors (strain, injury, drug) and their interaction, and repeated measures ANOVA for differences over time (pre-injury, 1-week, 1-month and 3-months post injury). The post hoc Bonferroni test was employed in all ANOVA. All statistical analyses were conducted using the SPSS software. A P-value <0.05 was considered significant and values are expressed as means ± SEM.
Results
Morris Water Maze – A Test of Spatial Memory
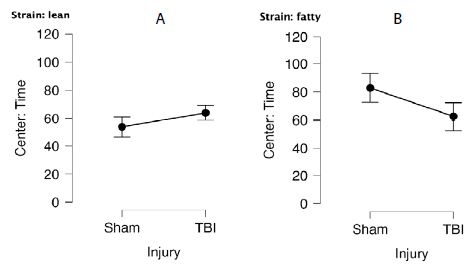
In fatty and lean Zucker rats exposed to TBI, distance (needed to locate swim platform) in the choice phase (CP) significantly exceeded that of sham-injured Zucker rats (Figure 2A and 2B) (F(1,12)=8.314, p=0.014) indicative of TBI-associated spatial memory impairment. In a repeated measures ANOVA, there was a trend of a significant time x injury interaction, F(3,36)=2.401, p=0.084, which did not reach statistical significance. Path efficiency was significantly lower in fatty vs. lean Zucker rats at all timepoints post-baseline (Figure 3) including TBI and sham-injured fatty rats. These data suggest factors associated with obesity, hypertension and type 2 diabetes likely contribute to accelerated decline in cognitive function (spatial memory recall) in fatty vs. age-matched lean Zucker rats.
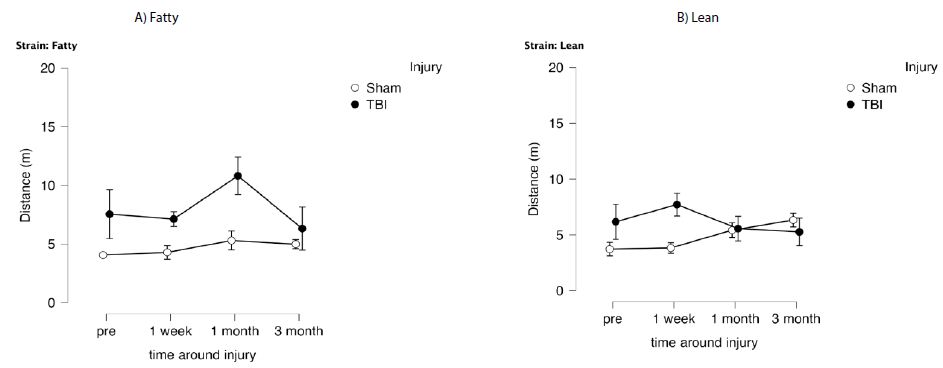
Figure 2: Delayed match to position in the Morris water maze: distance (meters) as a function of time before and after injury in Zucker lean and fatty rats. Results are mean ± SEM. Distance was determined by Any Maze software as described in Methods. Fatty: sham (N=6), tbi (N=6) Lean: Sham (N=9), tbi (N=8).
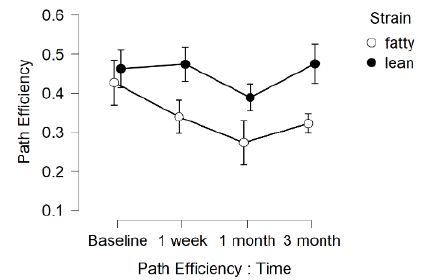
Figure 3: Delayed match to position in the Morris water maze: path efficiency as a function of time before and after injury in Zucker lean and fatty rats. Results are mean ± SEM. Path efficiency was determined by Any Maze software as described in Methods. Fatty (N=12); Lean (N=17) rats.
Effect of Short-term Peptide Administration on Spatial Memory
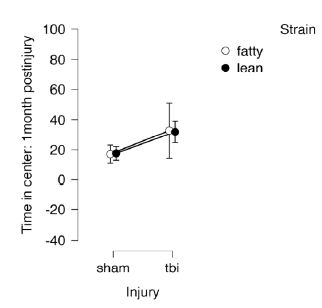
Peptide (SCLLADDN=SN..8) was administered to fatty rats (every other day) for seven days before and after injury and in lean rats for seven days after injury. The fatty rats received three additional doses of SN..8 or saline (before injury) because of prior work showing that SN..8 significantly lowered blood pressure in ZDF rats and appeared cardioprotective [8]. Zucker diabetic fatty (vs. lean) rats experienced a disproportionate excess mortality associated with TBI which was reduced by pre-treatment with SN..8 (Grinberg M, Burton J, Pang K, Zimering MB, unpublished observations). Path efficiency difference is defined as [choice phase efficiency – sample phase efficiency] and is a measure of the strength of spatial memory recall. One-week post-injury, SN..8 peptide-treated, sham-injured fatty and lean Zucker rats displayed significantly larger gain in path efficiency difference compared to saline-treated, sham-injured fatty and lean rats (F(1,10)=5.777, p=0.037) (Figure 4). There was a significant (drug x injury) interaction F(2,20)=4.442, P=0.025. Post-hoc Bonferroni test showed significantly higher (one-week) path efficiency difference in Sham, SN..8-treated vs. Sham, Saline-treated Zucker rats (Pbonf=0.039) (Figure 4). Our sample size (N=29) was only powered to detect two-way, but not three-way interactions. There was no significant (strain x drug) interaction F(2,23)=0.584, P=0.566. There was no significant (strain x injury) interaction F(1,25)=0.328, P=0.572.
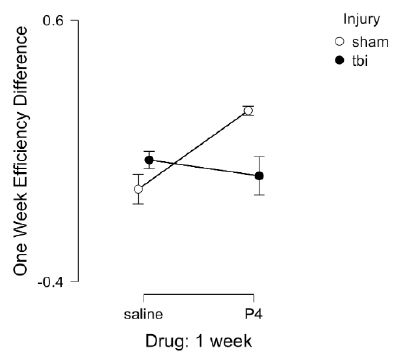
Figure 4: Delayed match to position in the Morris water maze: Path efficiency difference at 1-week post injury in Zucker fatty and lean rats. Path efficiency difference was calculated as described in Methods and is a measure of the strength of recall of spatial learning. Results are mean ± SEM. Sham (N=9); TBI (N=11). Sham, saline (N=5), Sham, P4 (N=4), TBI, saline (N=4), TBI, P4 (N=7). P4= SN..8 peptide.
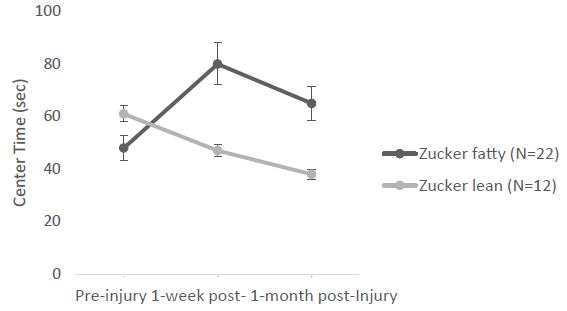
Cohorts 1 and 2 combined sample size (N=29 rats) lacked sufficient power to detect statistically significant differences in behavior in peptide- vs. saline-treated rats analyzed at repeated intervals following injury. Next we tested three additional cohorts of Zucker fatty (N=22) and lean rats (N=12), total N=34 rats in the Morris water maze using an identical (2 mg/kg) concentration of scrambled peptide (LD..8) as control for SN..8 peptide treatment. Duration to locate the swim platform in the choice phase (CP) was an outcome measure of (recall of spatial learning), in a repeated measures ANOVA (preinjury, 1-week, and 1-month post-injury) which demonstrated a main effect of time, F(2, 56)=6.214, P=0.004 (Figure 5). There was a main effect of strain F(1,28)=7.797, P=0.009 with leans requiring less time than fatty Zucker rats to locate the platform. There was a main effect of injury F(1,28)=11.300, P=0.002 with sham-injured rats requiring less time than TBI rats to locate the platform (Figure 5). There was a significant time x injury interaction F(2,56)=9.584, P < 0.001, post-hoc: sham, 1 week x tbi, 1 week, P bonf <0.001 & sham, 1 month x tbi, 1 month, P bonf=.013.
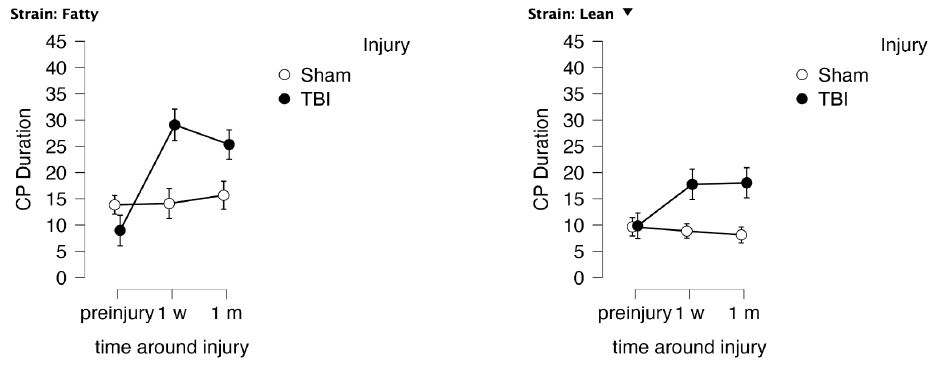
Figure 5: Delayed match to position in the Morris water maze: duration in the choice phase CP (recall of spatial learning) as a function of time before and after injury in Zucker lean (N=12) and fatty rats (N=22). Results are mean ± SEM. Duration (seconds) was determined by Any Maze software as described in Methods.
Duration (to locate swim platform) in the Sample Phase (SP) was a measure of (spatial learning acquisition). A repeat measures ANOVA of duration in the sample phase demonstrated main effects of strain (F(1,28)=12.613, P=0.001 with leans having reduced duration compared to Zucker fatty rats; and injury F(1, 28)=9.335, P=0.005 with sham-injured rats having reduced duration compared to TBI (Figure 6A). There was a significant injury x drug interaction F(1,28)=7.788, p=0.009 with sham, SN..8-treated animals having shorter duration (to locate platform) than sham, scrambled-LD..8-treated rats (P bonf=0.001), (Figure 6B). There was no significant difference in post-hoc tests of TBI, SN..8 vs. TBI, LD..8-treated rats (Figure 6B). There was a significant (strain x drug) interaction F(1,28)=4.589; P=0.041 (Figure 6C). In post-hoc testing, fatty P4 had significantly higher SP duration than lean P4; P bonf=0.002; and fatty, scrambled had significantly higher SP duration than lean P4; Pbonf=0.021 (Figure 6C). There was no significant (strain x injury) interaction F(1,25)=0.328; P=0.572. Sample size limitations prevented testing for a strain x drug x injury interaction.
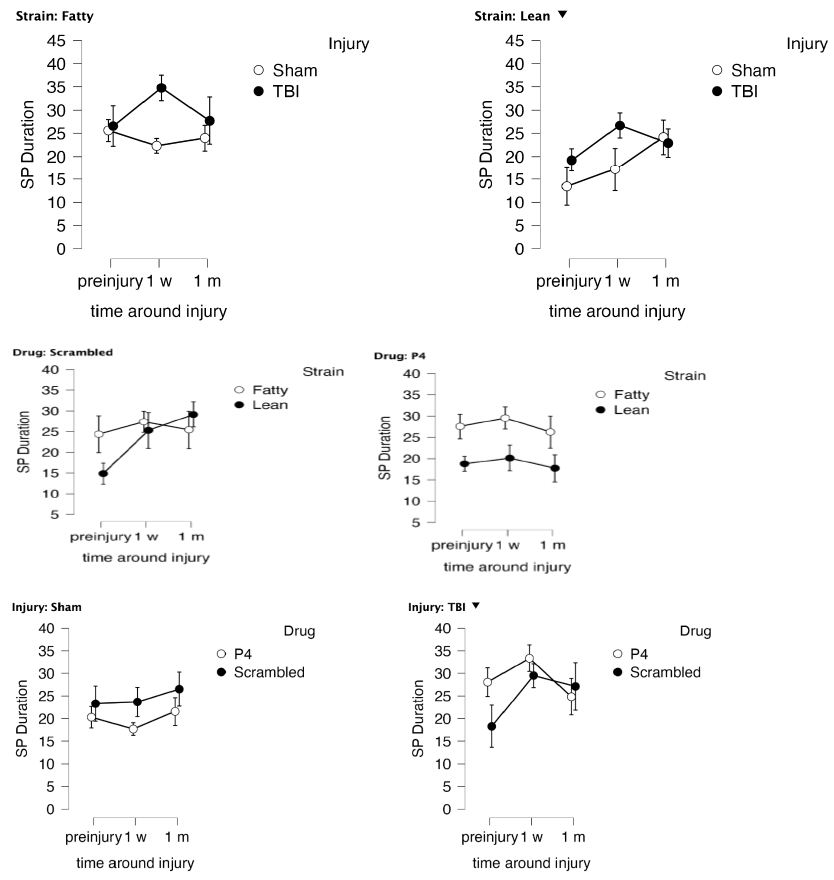
Figure 6: Delayed match to position in the Morris water maze: duration in the sample phase SP (acquisition of spatial learning) as a function of time, A) and injury or B) peptide (P4= SN..8, scrambled = LD..8) treatment group or C) strain before and after injury in Zucker lean (N=12) and fatty rats (N=22). Results are mean ± SEM. Duration was determined by Any Maze software as described in Methods.
In vitro Neuroprotection by SN.8 in Mouse Neuroblastoma N2A cells
The SN..8 peptide dose-dependently inhibited Zucker lean heterozygote rat Ig-induced neurite retraction in vitro exhibiting an IC50 of ~ 9 mg/L (Figure 7).
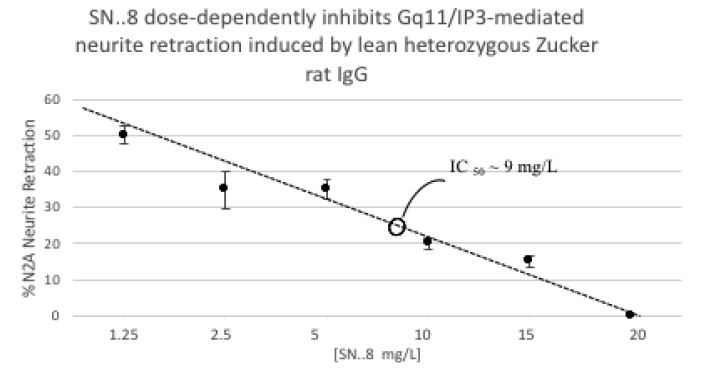
Figure 7: Dose-dependent inhibition of N2A neurite retraction from 100 nanomolar concentration of Zucker heterozygous lean by SN..8. Neurite retraction assay were performed as described in Methods. Results are mean ± SEM.
Mechanism of Action of SCLLADDN (SN….8) Peptide
The precise mechanism of SN..8 peptide’s in vitro and in vivo neuroprotective action is unknown. We had proposed that the epitope-specific SN..8 peptide may act as a ‘decoy’ which directly binds 5-HT2AR agonist IgG preventing receptor activation. Although we can’t exclude this possibility, we now provide evidence for an additional possible mechanism. Using linear synthetic peptides containing an alanine substitution for a highly conserved cysteine at EL2.50 (Ballesteros-Weinstein residue numbering system [10]) SALLADDN or for an aspartic acid residue at position EL2.55 (SCLLADAN) we compared the in vitro neuroprotective effects (Gq11/IP-mediated neurite retraction) of mutant vs. ‘wild-type’ SCLLADDN peptide. A 50-100 nanomolar concentration of Zucker heterozygous lean rat IgG caused 50% acute N2A neurite retraction which was completely prevented by co-incubation with twenty mg/mL concentration of wild-type SN..8 (Figure 8). Pre-incubation of IgG with twenty mg/mL concentration of either ‘C to A’ or ‘D to A’ mutant peptides had no inhibitory effect on Zucker rat IgG-induced neurite retraction. Although (20 ug/mL) wild-type peptide alone had no effect on N2A neurite retraction, we found unexpectedly that incubation of N2A cells with a twenty mg/mL concentration of either ‘C to A’ or ‘D to A’ mutant peptides alone caused transient, reversible (after 5 minutes), Gq11/IP-mediated N2A neurite retraction (not shown in Figure 8).
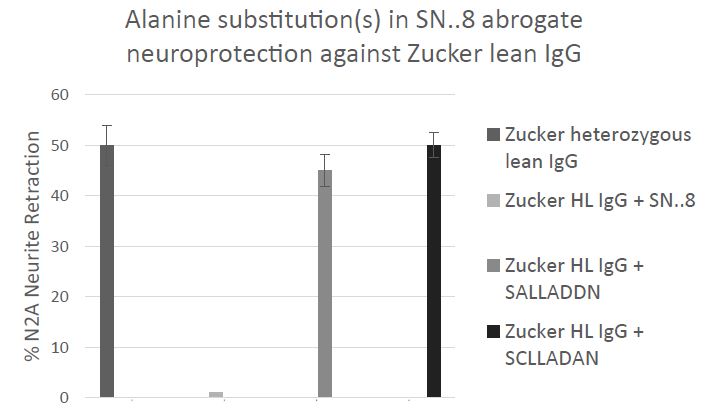
Figure 8: Effect of targeted ‘C to A’ or ‘D to A’ amino acid substitutions in ‘wild-type’ SCLLADDN peptide on the resulting mutant peptides’ (SALLADDN) or (SCLLADAN) ability to prevent acute N2A neurite retraction in the presence of 50-100 nanomolar concentration of Zucker heterozygous lean rat IgG. Results are mean ± SEM of three experiments. Similar results were obtained in experiments using the IgG fraction of plasma from four different middle-aged human TBI patients. Neurite retraction assay in mouse N2A neuroblastoma cells was carried out as described in Methods.
The wild-type SCLLADDN (SN..8) is identical to a subregion of the second extracellular loop (ECL) of the human serotonin 2A receptor reported by Wacker et al [11] to function as a ‘lid’ modulating the ingress and egress of ligands into and out of the 5HT2(B, or A) receptor’s orthosteric binding pocket (OBP). For example, closure of the lid prevented egress of the hallucinogenic ligand lysergic acid diethylamine (LSD) from the OBP causing an unusually long off-reaction time of LSD at the 5HT2B and 5HT2A receptors [11]. Mobility of the lid peptide is dependent on its specific amino acid residues which in turn determines the kinetics of the open and closed receptor conformations [11]. The lid function is conserved among many different aminergic GPCRs [12] and a highly conserved cysteine residue EL2.50 involved in intrachain disulfide bonding normally prevents constitutive aminergic GPCR activation [12]. The observation that C to A (SCLLADDN to SALLADDN) or D to A (SCLLADDN to SCLLADAN) single amino acid residue substitution(s) each led to transient constitutive receptor Gq11/IP activation (in the presence of serotonin in the culture medium) is of interest since it suggests a possible direct effect of exogenously administered short lid peptides on stabilizing an active vs. inactive conformation of the receptor. We speculate that cysteine-containing ‘wild-type’ SN..8 (SCLLADDN) may spontaneously form aggregates important in antigen-antibody binding or which interfere with hydrogen bonding between GPCR transmembrane helices [13] required for receptor activation. The Asp at position EL 2.54, shown in bold SCLLADDN in the wild-type peptide, is also highly conserved among family A GPCRs [13] and it mediates hydrogen bonding between helix 2 and helix 7 underlying receptor activation [13]. Replacement of the adjacent Asp (EL2.55) with Ala to form SCLLADAN may have led to a more highly mobile lid peptide which mediated transient receptor activation by increasing the probability of hydrogen bonding between helices 2 and 7. To our knowledge, these are the first data suggesting that small peptide mimics of an aminergic GPCR receptor ‘lid’ region in which key amino acid residues (Cys EL2.50 or Asp 2.55) have been replaced by alanine not only mediate transient receptor activation, but also abrogate neuroprotection associated with ‘wild type’ SN…8 lid peptide.
Discussion
Obese type 2 diabetes mellitus and hypertension are associated with accelerated age-related cognitive decline in older adults [14], and in a recent study of lifelong TBI-sufferers, (obesity and hypertension) were significant predictors of an increased hazard rate for the occurrence of major depressive disorder, Parkinson’s disease or dementia [3]. The Zucker fatty rat is a widely-used genetic model of morbid obesity [4]. Morbid obesity promotes peripheral inflammation associated with increased risk for neuropsychiatric and neurodegenerative disorders in humans [15], yet there have been relatively few prior neurobehavioral studies in the Zucker fatty rat strain which might shed light on underlying mechanisms.
Here we report that the Zucker diabetic hypertensive fatty rat experienced significantly greater spontaneous decline in spatial memory compared to age-matched lean Zucker rats.
It is not clear to what extent diabetes or hypertension (in Zucker fatty rats) may have affected the rate of decline in recall of spatial memory. In human studies, older adult type 2 diabetes populations experienced increased rate(s) of decline in executive function and processing speed; and hypertension, hypertriglyceridemia, and diabetes duration, (but not glucose level per se) was each a significant predictor of accelerated cognitive decline [14]. Severe hypertriglyceridemia which paralleled the development of morbid obesity in Zucker fatty rat may have contributed in part to observed sub-strain behavioral differences. In a prior report, male albino rats on a high-fat (vs. normal diet) developed obesity, and elevated lipid profile and had worse performance (on spatial memory task) in the Morris water maze [16] suggesting a role for metabolic factors in the Zucker fatty rat spatial memory impairment.
It is unclear how the SN..8 serotonin 2A receptor peptide fragment mediated its apparent in vivo neuroprotective effects, but one possibility may involve hippocampal neurogenesis. Neurogenesis occurs in the dentate gyrus (DG) region of the hippocampus in adult mammals, and it affects acquisition and recall of spatial learning [17]. Hippocampal neural progenitor cells (NPC) develop in a unique vascular niche [18] exposed to the general circulation. Circulating serotonin 2A receptor modulatory Ig (from morbidly-obese, and adult diabetic patients and in Zucker rats) not only had anti-endothelial effects [19] which could adversely impact neurogenesis, but also adversely affected the maturation, survival and electrical excitability of rat dentate gyrus NPC in vitro [20]. Serotonergic receptors expressed in the hippocampus have a well-established role in the regulation of mood and emotional disorders [21]. In addition, systemic administration of 5-HT2A receptor agonists (psilocin, or TCB-2) in rodents significantly impaired spatial memory recall in the Morris water maze (MWM) [22]. Taken together, it is possible that SN..8 peptide administration could act at the level of the dentate gyrus region of the hippocampus in modulating neurogenesis important in both acquisition and recall of spatial memory.
Another major hormone system which influences dentate gyrus neurogenesis are glucocorticoid (GR) and Mineralocorticoid Receptors (MR). Both receptors are highly expressed in hippocampal brain regions [23] and participate in the complex regulation of the effects of stress on the hypothalamic/pituitary/adrenal axis. It is possible that stress associated with mild TBI (LFP) causes greater GR activation in the hippocampus leading to stronger suppression of neurogenesis compared to sham-injury. An SN.8 peptide which targets the serotonin 2AR may have little effect on GR-induced suppression of neurogenesis. A future study of serotonergic and glucocorticoid receptor expression in Zucker rat brain following sham vs. TBI is needed to clarify the underlying mechanisms. A possible role for DG neurogenesis in mediating the putative neuroprotective effects of a serotonin 2A receptor peptide on acquisition and recall of spatial learning also requires more direct study.
Our data that a 5HT2AR-specific lid peptide SCLLADDN (SN..8) significantly enhanced acquisition of spatial memory and strength of spatial memory recall (1-week post-injury in sham-injured rats) is consistent with the possibility that the receptor peptide may prevent 5HT2A receptor activation by endogenous 5-HT2AR ligand agonists including possibly circulating 5HT2AR agonist IgG.
Taken together, these data suggest that a novel serotonin 2A receptor peptide may have neuroprotective effects in sham-injured Zucker rats under conditions in which hippocampal neurogenesis is not already strongly suppressed by other hormonal factors principally, increased hippocampal GR and possibly MR activity in obese, hypertensive Zucker rats [24,25].
In summary, systemic administration of a small peptide mimic of the 5HT2A receptor lid peptide appeared to confer neuroprotective effects on acquisition and strengthening of recall of spatial learning tasks in sham-injured Zucker rats. Larger studies are needed to confirm these preliminary results and further test for any possible strain differences. Injections of both SN..8 and LD..8 peptides were well-tolerated and not associated with chronic pain, or local tissue injury. TBI was associated with greater impairments in spatial memory recall, and the neuroprotective peptide appeared less likely to significantly modulate the behavioral impairment(s) in brain-injured Zucker rats, especially fatty rats susceptible to the additional adverse cognitive effects of abnormal metabolic factors.
Acknowledgements
This work was supported in part by a grant CBIR 22 PIL022 from the New Jersey Commission on Brain Injury Research (Trenton, NJ) to MBZ, and by grants from the Technology Transfer Program/BLRD, Office of Research and Development, Department of Veterans Affairs (Washington, DC) to MBZ. The opinions expressed herein are solely those of the authors and do not reflect the official position of the US Government.
References
- Walker KR, Tesco G (2013) Molecular mechanisms of cognitive dysfunction following traumatic brain injury. Front Aging Neurosci 5: 29. [crossref]
- Jaacks LM, Vandevijvere S, Pan A, McGowan CJ, Wallace C, et al. (2019) The obesity transition: stages of the global epidemic. The lancet. Diabetes & endocrinology 7: 231-240. [crossref]
- Zimering MB, Patel D, Bahn G (2019) Type 2 Diabetes Predicts Increased Risk of Neurodegenerative Complications in Veterans Suffering Traumatic Brain Injury. J Endocrinol Diabetes 6: 137. [crossref]
- Kurtz TW, Morris RC, Pershadsingh HA (1989) The Zucker fatty rat as a genetic model of obesity and hypertension. Hypertension 3: 896-901. [crossref]
- Shibata T, Takeuchi S, Yokota S, Kakimoto K, Yonemori F, et al. (2000) Effects of peroxisome proliferator-activated receptor-alpha and -gamma agonist, JTT-501, on diabetic complications in Zucker diabetic fatty rats. Br J Pharmacol 130: 495-504. [crossref]
- Zimering MB, Grinberg M, Burton J, Pang K (2020) Circulating Agonist Autoantibody to 5-Hydroxytryptamine 2A Receptor in Lean and Diabetic Fatty Zucker Rat Strains. Endocrinol Diabetes Metab J 4: 413. [crossref]
- Zimering MB (2019) Autoantibodies in Type-2 Diabetes having Neurovascular Complications Bind to the Second Extracellular Loop of the 5-Hydroxytryptamine 2A Receptor. Endocrinol Diabetes Metab J 3: 118. [crossref]
- Zimering MB (2021) A serotonin 2A receptor decoy peptide potently lowers blood pressure in male Zucker diabetic fatty rats. Endo Diab Metab J 5: 1-13. [crossref]
- Wahab RA, Neuberger EJ, Lyeth BG, Santhakumar V, Pfister BJ (2015) Fluid percussion injury device for the precise control of injury parameters. J Neurosci Methods 248: 16-26. [crossref]
- Ballesteros JA, Weinstein H (1995) Integrated methods for the construction of three-dimensional models and computational probing of structure-function relations in G protein-coupled receptors. Methods Neurosci 25: 366-428.
- Wacker D, Wang S, McCorvy JD, Betz RM, Venkatakrishnan AJ, et al. (2017) Crystal Structure of an LSD-Bound Human Serotonin Receptor. Cell 168: 377-389.e12. [crossref]
- Michino M, Beuming T, Donthamsetti P, Newman AH, Javitch JA, et al. (2015) What can crystal structures of aminergic receptors tell us about designing subtype-selective ligands?. Pharmacol Rev 67: 198-213. [crossref]
- Sanchez-Reyes OB, Cooke ALG, Tranter DB, Rashid D, Eilers M, et al. (2017) G Protein-Coupled Receptors Contain Two Conserved Packing Clusters. Biophys J 112: 2315-2326. [crossref]
- Zimering MB, Knight J, Ge L, Bahn G (2016) VADT Investigators. Predictors of Cognitive Decline in Older Adult Type 2 Diabetes from the Veterans Affairs Diabetes Trial. Front Endocrinol (Lausanne) 7: 123. [crossref]
- Castanon N, Lasselin J, Capuron L (2014) Neuropsychiatric comorbidity in obesity: role of inflammatory processes. Front Endocrinol (Lausanne) 5: 74. [crossref]
- Wahid RM, Samy W, El-Sayed SF (2021) Cognitive impairment in obese rat model: role of glial cells. Int J Obes (Lond) 45: 2191-2196.
- Dupret D, Revest JM, Koehl M, Ichas F, De Giorgi F, et al. (2008) Spatial relational memory requires hippocampal adult neurogenesis. PLoS One 3: e1959. [crossref]
- Palmer TD, Willhoite AR, Gage FH (2000) Vascular niche for adult hippocampal neurogenesis. J Comp Neurol 425: 479-494. [crossref]
- Zimering MB, Alder J, Pan Z, Donnelly RJ (2011) Anti-endothelial and anti-neuronal effects from auto-antibodies in subsets of adult diabetes having a cluster of microvascular complications. Diabetes Res Clin Pract 93: 95-105. [crossref]
- Zimering MB, Behnke JA, Thakker-Varia S, Alder J (2015) Autoantibodies in Human Diabetic Depression Inhibit Adult Neural Progenitor Cells In vitro and Induce Depressive-Like Behavior in Rodents. J Endocrinol Diabetes 2. [crossref]
- Bohn LM, Schmid CL (2010) Serotonin receptor signaling and regulation via β -arrestins. Crit Rev Biochem Mol Biol 45: 555-566. [crossref]
- Zhang G, Stackman RW Jr (2015) The role of serotonin 5-HT2A receptors in memory and cognition. Front Pharmacol 6: 225. [crossref]
- Van Eekelen JA, Jiang W, De Kloet ER, Bohn MC (1988) Distribution of the mineralocorticoid and the glucocorticoid receptor mRNAs in the rat hippocampus. J Neurosci Res 21: 88-94. [crossref]
- Wong EY, Herbert J (2005) Roles of mineralocorticoid and glucocorticoid receptors in the regulation of progenitor proliferation in the adult hippocampus. Eur J Neurosci 22: 785-792. [crossref]
- Fredersdorf S, Endemann DH, Luchner A, Heitzmann D, Ulucan C, et al. (2009) Increased aldosterone levels in a model of type 2 diabetes mellitus. Exp Clin Endocrinol Diabetes 117: 15-20. [crossref]