Monthly Archives: November 2022

Prevalence of Tuberculosis in Patients Visiting Massawa Hospital: Cross-Sectional Study, 2021

DOI: 10.31038/EDMJ.2022622

Abstract

Background: Despite the availability of efficacious drugs, tuberculosis remains a major public health problem in low- and middle-income countries. This study was aimed to determine the prevalence of tuberculosis in Massawa Hospital, Eritrea.

Methods: Laboratory and medical records of tuberculosis patients in Massawa Hospital were reviewed. All patients who did sputum exam by Xpert Gene from January 01, 2018 to May 1, 2021 in Massawa Hospital were enrolled in this study. Categorical variables were presented in percent, frequencies, Chi-square test, and odds ratio with 95% confidence interval. P value <0.05 was considered significant.

Results: Sputum examination was done on 2178 patients and the prevalence of bacteriologically positive tuberculosis was 7%. Moreover, the prevalence of rifampicin resistant tuberculosis among the total tested and bacteriologically positive patients was 0.4% and 5.9% respectively. The main reason for sputum examination was presumptive diagnosis of tuberculosis (85.5%). Tuberculosis spondylitis (15.6%) and adenitis (13.6%) were found to be the most common types of extra pulmonary tuberculosis. The prevalence of tuberculosis in HIV patients was 5.2% and all started highly active antiretroviral therapy. Patients aged 15 to 24 years were having higher prevalence of tuberculosis (8.8%, 95%CI 0.68-4.72, OR-1.79). And, those from Ghelaelo subzone were having about two times higher prevalence of tuberculosis (9.9%, 95%CI 1.39-3.06, OR-2.06). Patients who had previous history of tuberculosis were having about five times higher prevalence of tuberculosis (27.5%, 95%CI 2.65-11.17. OR-5.4, p<0.001) and Rifampicin resistant tuberculosis (9.1%, p<0.002).

Conclusion: The prevalence of tuberculosis and the multidrug resistant tuberculosis among the confirmed cases was comparatively increased than the average WHO estimates for Eritrea and similar to a study conducted in Nakfa subzone, Eritrea. The prevalence of tuberculosis in HIV patients was higher to the WHO estimates and previous studies in the country. Previous history of tuberculosis was significantly associated with the prevalence tuberculosis and multidrug resistant tuberculosis. Further prospective studies to evaluate the national prevalence of tuberculosis and rifampicin resistant tuberculosis are highly recommended.

Keywords

Tuberculosis, Prevalence, Multidrug resistance tuberculosis, Eritrea

Introduction

Tuberculosis (TB) is a life-threatening disease caused by Mycobacterium tuberculosis having an increased prevalence in developing countries [1]. It is a major global health problem and ranks alongside HIV as a leading cause of mortality worldwide [2]. Mycobacterium tuberculosis is an intracellular bacterium, causing respiratory illness, tuberculosis. The bacilli infect about one-third of the world’s population, leaving the majority with an asymptomatic state of a disease called latency [3]. While only a few proportions (10%) of those latently infected develop active TB, the majority (90%) will remain asymptomatic [4].

According to World Health Organization (WHO) 2019 tuberculosis report, there are an estimated 10 million people infected with TB and 1.2 million tuberculosis deaths among peoples living with HIV/AIDS globally [5]. Worldwide, millions of people continue to fall sick and die from TB, a preventable and curable infectious disease [6].

Treatment outcome is an important indicator to evaluate the effect of TB prevention and control program. Globally, in 2012, the treatment success rate (TSR) was 86% among all new TB cases and in the African region, it was 81% [7]. WHO recommends that at least 90% TSR for all persons diagnosed with TB and initiated on TB treatment services [8]. The latest global TB treatment outcome data for new bacteriologically confirmed pulmonary TB cases indicates a global fall in TSR from 86% in 2014 to 83% in 2017 [9].

According to the recent WHO estimate report, a total of 3100 new TB cases were present in 2018 in Eritrea which correspond to 89 cases per 100,000 populations [10]. Of these cases 140 were patients with TB and HIV co-infection and 66 of the cases had multidrug resistant TB. Nationally, 550 patients died from tuberculosis and related complications and 47 of them had HIV [10]. The 2018 conducted survey also revealed that the incidence rate of estimated proportion of TB cases with MDR-TB was 2% and 4.1% of them were from previously treated cases [10].

Study conducted in Nakfa subzone, one of the 58 subzones of Eritrea; showed prevalence of smear positive pulmonary TB cases was 7.8%, relatively increased prevalence of smear positive pulmonary tuberculosis than the average WHO estimate for the country [11]. This study also showed that females (8.2%), the adult age group of 41- 60 years (11%) and during the year 2014 (16.8%) had the highest rate of pulmonary TB infection [11].

From observational point of view and work experience, the prevalence of pulmonary, extra pulmonary and multi-drug resistant tuberculosis seems higher in Massawa Hospital starting in 2020.  This study was aimed to determine the prevalence of tuberculosis in Massawa Hospital, Eritrea.

Materials and Methods

Study Design and Population

This was a retrospective cross-sectional type of study that medical profile and laboratory results of all TB suspected patients, who did sputum exam by Xpert Gene from January 01, 2018 to May 1, 2021 in Massawa Hospital was retrieved, reviewed and analyzed in the study.

Data Collection, Analysis and Interpretation

Sputum results of patients were retrieved from the Xpert Gene machine register by experienced laboratory technicians from May 2-20, 2021. The socio-demographic characteristics and treatment outcomes were collected from the medical profile of patient’s treatment cards using a pre designed checklist.

Data was entered in CSPro 7.3 and analyzed by SPSS software. Categorical variables were presented in proportions, frequencies and Chi-squared test were implemented to assess association between  the dependent and independent variables. Besides, odds ratio with 95% confidence interval was also presented and P value <0.05 was considered significant.

Ethical Clearance

Ethical approval was obtained from the Ministry of Health Ethical Review and Clearance Committee on 03/05/2021. Patient’s data confidentiality was kept secured and personal identifiers were not collected. A unique number was assigned to each patient in the data set and it was coded and interpreted in aggregates. Further permission was requested from the Zonal and Hospital Medical Directors.

Results

Socio Demographic Characteristics of the Patients

A sputum exam of 2178 patients was retrieved and about forty percent of them were requested by medical doctors. Majority of the patients who did sputum exam were in the age group of 35-54 years (36.1%) and the main reason was presumptive diagnosis of tuberculosis (85.5%). The prevalence of bacteriologically positive tuberculosis was 7%. The prevalence of Rifampicin resistant tuberculosis from all those who did sputum exam and the confirmed cases was 0.4% and 5.9% respectively (Table 1).

Table 1: Socio demographic characteristics of patients

Variables

Categories

Frequency (N)

Percent (%)


Diagnosis year

2018

404

18.5

2019

562

25.8

2020

878

40.3

May 2021

334

15.3


Age of respondent (years)

< 15

98

4.5

15-34

701

32.2

35-54

785

36.1

55 and above

594

27.2


Sex of respondent

Female

1086

49.9

Male

1092

50.1


Subzone of respondent

Massawa

1087

49.9

Ghelaelo

535

24.6

Foro

336

15.4

Others

220

10.1


Reason for sputum exam

Presumptive

1796

82.5

Previous TB

40

1.8

contact trace

121

5.6

Others

221

10.2


Requested by

Doctor

961

44.1

Nurse degree

572

26.3

Nurse 645 29.6
 

Sputum result by Xpert Gene

MTB detected 152 7.0
MTB not detected 2026 93.0


Rifampicin Resistance

Resistant 9 0.4
Indeterminate 12 0.6
Sensitive 131 6.0
Total 2178 100.0

Association of Background of Patients with Prevalence of Tuberculosis

The prevalence of bacteriologically confirmed tuberculosis cases was higher on patients aged 15 to 24 years (8.8%, 95%CI 0.68-4.72, OR-1.79). Patients from Ghelaelo subzone were having about two times higher prevalence of tuberculosis compared to patients from Massawa subzone (9.9%, 95%CI 1.39-3.06, OR-2.06). Patients who had previous history of tuberculosis were having about five times higher prevalence of tuberculosis compared to the other groups (27.5%, 95%CI 2.65-11.17, OR-5.4, p<0.001). Other background of patients did not show significant association with the prevalence of tuberculosis (Table 2).

Table 2: Association of background characteristics with prevalence of Tuberculosis

Variables Sputum result N (%) P value Odds Ratio 95%CI
Negative Positive
Diagnosis year
2018 373 (92.3) 31 (7.7)  


0.802

1
2019 527 (93.8) 35 (6.2) 0.80 (0.48-1.32)
2020 814 (92.7) 64 (7.3) 0.95 (0.61-1.48)
May, 2021 312 (93.4) 22 (6.6) 0.08 (0.48-1.50)
Age of respondents (years)
< 15 93 (94.9) 5 (5.1)  


0.828

1
15-24 333 (91.2) 32 (8.8) 1.79 (0.68-4.72)
25-34 314 (93.5) 22 (6.5) 1.30 (0.48-3.54)
35-44 345 (92.7) 27 (7.3) 1.46 (0.55-3.88)
45-54 385 (93.2) 28 (6.8) 1.35 (0.51-3.60)
55-64 288 (93.8) 19 (6.2) 1.23 (0.45-3.38)
65 and above 268 (93.4) 19 (6.6) 1.31 (0.48-3.63)
Sex
Female 1008 (92.8) 78 (7.2)  

0.710

1
Male 1018 (93.2) 74 (6.8) 0.94 (0.68-1.31)
Subzone
Massawa 1032 (94.9) 55 (5.1)  


0.018

1
Ghelaelo 482 (90.1) 53 (9.9) 2.06 (1.39-3.06)
Foro 310 (92.3) 26 (7.7) 1.57 (0.97-2.55)
Others* 202 (91.2) 18 (8.2) 1.67 (0.96-2.91)
Reason for sputum exam
Presumptive 1679 (93.5) 117 (6.5)  


0.001

1
Previous TB 29 (72.5) 11 (27.5) 5.4 2.65-11.17
contact trace 119 (98.35) 2 (1.65) 0.24 0.06-0.98
Others* 199 (90.0) 22 (10.0) 1.59 0.98-2.56
Requested by
Nurse degree 531 (92.8) 41 (7.2)  

0.238

1
Doctor 903 (94.0) 58 (6.0) 0.83 (0.55-1.26)
Nurse 592 (91.8) 53 (8.2) 1.16 (0.76-1.77)
Total 2026 (93.0) 152 (7.0) 2178 (100.0)
*Dahlak, Gindae, Afabet, Nakfa, Shieb

**Follow up, HIV patient, unresponsive Smear negative

Association of Background of Patients with MDR Tuberculosis

The highest prevalence of Rifampicin resistant (MDR) tuberculosis was detected in 2020 (9.4%) and was higher on patients aged 55 years an above (10.5%). The prevalence of MDR tuberculosis was higher on males (9.5%) and, residents of Foro and Ghelaelo subzones showed higher MDR prevalence compared to the other subzones. Patients who had history of tuberculosis were having higher prevalence of MDR tuberculosis (p<0.002). Background of patients did not show significant association to the MDR-TB prevalence. Patients’ with indeterminate Rifampicin resistance results were put on follow up and sputum exam was repeated after an interval of several days in which all of them were negative for rifampicin resistant tuberculosis (Table 3).

Table 3: Association of background characteristics with MDR Tuberculosis

Variables Rifampicin resistance N (%) P value
Indeterminate Sensitive Resistant
Diagnosis year
2018 0 (0.0) 30 (96.8) 1 (3.2)  


0.085

2019 1 (2.9) 32 (91.4) 2 (5.7)
2020 7 (10.9) 51 (79.7) 6 (9.4)
2021 4 (18.2) 18 (81.8) 0 (0.0)
Age of respondents (years)
Under 15 1 (20.0) 4 (80.0) 0 (0.0)  


0.335

15-34 3 (6.8) 39 (88.6) 2 (4.6)
35-54 5 (9.1) 47 (85.5) 3 (5.5)
55 and above 3 (7.9) 31 (81.6) 4 (10.5)
Sex
Female 4 (5.1) 72 (92.3) 2 (2.6)  

0.071

Male 8 (10.8) 59 (79.7) 7 (9.5)
Subzone
Ghelaelo 5 (9.4) 44 (83.0) 4 (7.5)  


0.927

Massawa 3 (5.5) 49 (89.1) 3 (5.5)
Foro 1 (3.8) 23 (88.5) 2 (7.7)
Others 3 (16.7) 15 (83.3) 0 (0.0)
Reason for sputum exam
Presumptive 10 (7.8) 110 (86.0) 8 (6.2)  


0.002

Previous TB 0 (0.0) 10 (90.9) 1 (9.1)
Others 2 (15.4) 11 (84.6) 0 (0.0)
Requested by
Nurse degree 1 (2.4) 37 (90.2) 3 (7.3)  


0.205

Doctor 4 (6.9) 49 (84.5) 5 (8.6)
Nurse 7 (13.2) 45 (84.9) 1 (1.9)
Total 12 (7.9) 131 (86.2) 9 (5.9) 152 (100.0)

Treatment Success of Tuberculosis

A total of 154 patients had started treatment for tuberculosis in the hospital in the study time and about nineteen percent were below 15.  Two third (66.2%) of patients had pulmonary tuberculosis, and tuberculosis spondylitis (15.6%) and adenitis (13.6%) were the most common causes of extra pulmonary tuberculosis. The prevalence of tuberculosis in HIV patients was 5.2% and all patients these tested  positive  for  HIV  had  started  anti-retroviral  treatment  and co-trimoxazole preventive therapy. The prevalence of Rifampicin resistant tuberculosis from these started treatments was 5.8% and all were referred to Merhano National MDR-TB treatment hospital for management. The treatment success of tuberculosis was 81.2% with a death rate of 7.1% (Table 4).

Table 4: Treatment successes of tuberculosis patients

Variables Categories Frequency (N) Percent (%)
 

Address

Massawa 131 85.1
Foro 19 12.3
Others 4 2.5


Age of respondent (years)

< 15 29 18.8
15-34 39 25.3
35-54 51 33.1
55 and above 16 22.7
 

Sex of respondent

Female 81 52.6
Male 73 47.4
 

Treatment started year

2018 52 33.8
2019 40 26.0
2020 62 40.3
 

Site of infection

Extra pulmonary 52 33.8
Pulmonary 102 66.2
 

If Extra pulmonary; Specify

Bone TB 24 15.6
Skin TB 6 3.9
TB adenitis 21 13.6
 

Type of patient

New 147 95.5
Relapse 7 4.5
 

HIV status

Negative 146 94.8
Positive 8 5.2
Ante-retroviral therapy started No 146 94.8
Yes 8 5.2
Co-trimoxazole preventive therapy No 146 94.8
Yes 8 5.2
 

Rifampicin resistant

No 118 94.2
Yes 9 5.8


Treatment outcome

Cured + Completed 125 81.2
Died 11 7.1
Failure 1 0.6
Not evaluated 8 5.2
Referred 9 5.8
Total 154 100.0

Discussion

Determining the prevalence of tuberculosis is very crucial for  the management of the disease. This study was aimed to evaluate this challenge in Massawa Hospital. The prevalence of bacteriologically confirmed tuberculosis was 7%, (152 cases per 2178). This was almost similar to a study conducted in Nakfa subzone, Eritrea; which showed that the overall prevalence of 7.8% [11]. According to the recent WHO estimate report, the prevalence of tuberculosis in 2018 in Eritrea corresponds to 89 cases per 100,000 populations [10]. Estimated tuberculosis incidence in the Horn of Africa ranges from 65 cases per 100,000 people per year in Eritrea [12]. This higher prevalence could be attributed to the higher detection rate of tuberculosis after the introduction of diagnostic modalities like Xpert Gene and increasing community awareness about the disease and early health seeking behavior. The contributions of the community tuberculosis agents are also remarkable [13].

The prevalence of Rifampicin resistant tuberculosis in the bacteriologically confirmed new cases and previously treated was 5.9% and 9.1% respectively. This was higher to the national average based on the WHO estimates for Eritrea; the prevalence of MDR-TB among new cases and previously treated cases was 2.6% and 18% respectively [14]. It was also higher to a preliminary survey done in Eritrea that Rifampicin resistance among new cases and previously treated cases was 2% and 7.5% [14]. The introduction of the new diagnostic modalities could have a value on the higher incidence of MDR cases.

This study revealed that the prevalence of extra-pulmonary cases was 33.8% and tuberculosis spondylitis and adenitis were the most common cause. This was similar to the national average that the proportion of extra pulmonary notified in 2016 was 34% but higher to 16% for Africa [14]. This result showed that the disease is not contained in the lung which seeds it to different extra pulmonary sites that leads to different complications.

The prevalence of tuberculosis in HIV patients was 5.2%, which was slightly lower to the national average (6%) in 2017 [14] and higher to other study (3.7%) [13]. This shows that the impact of the previously introduced strategy by the Ministry of Health to screen all TB patients for HIV had increased to detect the co-infection and burden of these diseases.

This study showed that 85.7% of patients that were on treatment were new TB cases and 4.5% were with relapse. This was lower to other study that 92.6% of the patients were new TB cases, but there were 1.9% relapses cases [13]. Furthermore, this research reported that, 76.6% of the patients were bacteriologically positive before starting treatment. This was higher to the national average that of these notified 58% were bacteriologically positive compared to 64% in Africa in 2015 [14]. This was also higher to other study that 73% [15] and 45.1% [13] of the patients were bacteriologically positive pulmonary TB. This result explained that, some cases of the extra pulmonary cases, mostly the TB adenitis and skin TB were bacteriologically positive for mycobacterium tuberculosis.

This study revealed that the treatment success rate was 81.2%. Even though this was lower to the national average in 2016, 90% [14], it was similar to the 2012 treatment success rate in the African region, which was 81% [7]. When compared to other countries, this was similar to studies in South Africa 80% [16], Ethiopia 79.4% [17] and 81.8% [18]. But, it was lower to studies in South Africa 82.2% [19] and Ethiopia 90.1% [20], 86.8% [21]. It was higher to studies in Uganda 39% [22], Zimbabwe 70% [23], Nigeria 57.7% [24], and Russia 77% [25]. Since some patients (5.8%) were referred for MDR treatment and some were not evaluated (5.2%) as they didn’t yet complete their treatment, this could significantly decreased the success rate from the national average.

This study reported that majority of tuberculosis cases were in the age group of 15-54 years (58.4%) and children less than 15 years contribute 18.8%. This was similar to the national average in Eritrea in 2017 that the age of 15-54 years and children < 15 years was 61.5% and 17.1% respectively [14]. A study in Nakfa, Eritrea; showed that the adult age group of 41-60 years had the highest rate of pulmonary TB infection [11]. The higher prevalence in the pediatric and geriatric population could be due to their poor containment of the latent infection that leads to pulmonary or extra-pulmonary tuberculosis.

The mortality rate of tuberculosis in the hospital was 7.1%. This was higher to other studies, 5% [25] and 3.7% [13]. This higher rate of mortality could be due to other comorbid diseases, delayed health seeking behaviors and treatment complications.

Patient with previous history of tuberculosis showed significant association with the prevalence of tuberculosis and MDR tuberculosis. This could be mainly due to the presence of other smear positive cases in the family which didn’t get treated and spread the infection. Besides, treatment defaulters could be another cause for the higher prevalence of MDR cases in the previously treated patients.

Conclusion

The prevalence of tuberculosis was higher to the national average and the WHO estimates for the African region. Majority of the bacteriologically positive tuberculosis patients were new cases. The prevalence of extra pulmonary and tuberculosis in HIV patients was slightly lower to the national average but higher to other studies and WHO estimates for Eritrea. The treatment success rate was lower to the national average and patients with previous history of tuberculosis had showed significant association to the prevalence of tuberculosis and MDR tuberculosis.

Recommendations

To estimate the current prevalence of tuberculosis and MDR– tuberculosis, a national survey is highly recommended. Awareness of the community about adherence, disease and treatment complications are essential. Further prospective studies to evaluate the difference of tuberculosis prevalence by subzone and the impact of nutritional status are indispensable. Routine contact tracing for  MDR-tuberculosis and the directly observed treatment strategy should be advocated to decrease the relapse and MDR-tuberculosis.

Declarations

Ethics Approval and Consent to Participate

Ethical approval was obtained from the Ministry of Health Ethical Review and Clearance Committee on 03/05/2021 and that informed consent was obtained from all subjects and/or their legal guardian (s). All methods were carried out in accordance with relevant guidelines and regulations.

Acknowledgment

Authors acknowledges for the patients for using their data.

Author’s Contribution

The proposal was drafted by BT, FK and further edition was done by all the authors. Data was analyzed by FK and all authors have participated on data interpretation. The draft of the manuscript was written by BT and the final form was shaped by BT, HG and FK. All authors have contributed by interpretation, analysis, critical discussion and approved for publication.

Abbreviations

TB: Tuberculosis, MDR: Multi Drug Resistant, TSR: Treatment Success Rate, HIV: Human Immunodeficiency Virus, ART: Antiretroviral Therapy, WHO: World Health Organization, MTB: Mycobacterium Tuberculosis, CSPro: Census and Survey Processing System, SPSS: Statistical Package for the Social Sciences.

References

  1. Kassa J, Dedefo M, Korsa A, Dibessa T (2018) Factors affecting treatment outcome of tuberculosis among tuberculosis patients in West J Bioanal Biomed. 10(1): 24-29. [crossref]
  2. Taye G, Defar A, Taddele T, et al. (2018) Treatment outcome and associated factors among TB patients in Ethiopia: hospital-based retrospective Am J Epidemiol Infect Dis 6 (1): 14-19.
  3. Dorhoi A, Reece ST, Kaufmann SH (2011) For better or for worse: the immune response against Mycobacterium tuberculosis balances pathology and protection. Immunol Rev 240 (1): 235-251. [crossref]
  4. Lee S-W, Wu LS-H, Huang G-M, Huang K-Y, Lee T-Y (2016) Gene expression profiling identifies candidate biomarkers for active and latent tuberculosis. BMC Bioinform 17: S3. [crossref]
  5. World Health Organization. Global tuberculosis report; WHO/CDS/TB/2019:
  6. World Health Organization Global tuberculosis report 2018. Geneva, Switzerland, 2018: 27-67.
  7. World health organization, Global tuberculosis report. Geneva, Switzerland: WHO; 2015
  8. Stop TB Partnership First Global Plan to End TB Progress Report shows need for huge efforts and scale-up to reach 90-(90)-90 TB targets,
  9. Stop TB Partnership 90 (90) 90 The tuberculosis report for heads of state and governments. Geneva, Switzerland,
  10. World Health Organization, “Eritrea Tuberculosis profile 2018,” Geneva, Switzerland, 2018.
  11. Yafet Assessment of the Prevalence of Pulmonary Tuberculosis Patients at Nakfa Hospital from 2014-2019, Eritrea. [crossref]
  12. World Health Organization (WHO), Global tuberculosis report 2017, Geneva,
  13. Berihun, T. Nguse, G. Gebretekle (2018) Prevalence of Tuberculosis and Treatment Outcomes of Patients with Tuberculosis among Inmates in Debrebirhan Prison, North Shoa Ethiopia. Ethiop J Health Sci 28(3): 347-354. [crossref]
  14. The National Guidelines for Tuberculosis and Leprosy Control, the national TB control program, communicable disease control division, Ministry of Health, Eritrea, December
  15. GETIE, B. Alemnew (2020) Tuberculosis Treatment Outcomes and Associated Factors among Patients Treated at Woldia General Hospital in Northeast Ethiopia: An Institution-Based Cross-Sectional Study. Infect Drug Resist 13: 3423-3429. [crossref]
  16. Budgell EP, Evans D, Schnippel K, et al. (2016) Outcomes of treatment of drug- susceptible tuberculosis at public sector primary healthcare clinics in Johannesburg, South Africa: a retrospective cohort S Afr Med J 106: 1002-1009. [crossref]
  17. Tefera F, Dejene T, Tewelde T (2016) Treatment Outcomes of Tuberculosis Patients at Debre Berhan Hospital, Amhara Region, Northern Ethiopia. Ethiop J Health Sci 26(1): 65-72. [crossref]
  18. Zenebe T, Tefera E (2016) Tuberculosis treatment outcome and associated factors among smearpositive pulmonary tuberculosis patients in Afar, Eastern Ethiopia: a retrospective Braz J Infect Dis 20(6): 635-636. [crossref]
  19. Jacobson KB, Moll AP, Friedland GH, et (2015) Successful tuberculosis treatment outcomes among HIV/TB coinfected patients Down-Referred from a district hospital to primary health clinics in rural South Africa. PLoS One 10: e0127024. [crossref]
  20. Worku S, Derbie A, Mekonnen D, et al. (2018) Treatment outcomes of tuberculosis patients under directly observed treatment short-course, Debre Tabor General Hospital, Northwest Ethiopia: nine-year retrospective Infect Dis Poverty 7: 16. [crossref]
  21. Getnet F, Sileshi H, Seifu W, et al. (2017) Do retreatment tuberculosis patients need special treatment response follow-up beyond the standard regimen? Finding of five- year retrospective study in pastoralist BMC Infect Dis 17: 762. [crossref]
  22. Nakanwagi-Mukwaya A, Reid AJ, Fujiwara PI, et al. (2013) Characteristics and treatment outcomes of tuberculosis retreatment cases in three regional hospitals, Uganda. Public Health Action 3: 149-155. [crossref]
  23. Takarinda KC, Harries AD, Srinath S, et (2011) Treatment outcomes of new adult tuberculosis patients in relation to HIV status in Zimbabwe. Public Health Action 1: 34-39. [crossref]
  24. Ukwaja KN, Ifebunandu NA, Osakwe PC, et al. (2013) Tuberculosis treatment outcome and its determinants in a tertiary care setting in south-eastern Niger Postgrad Med J 20: 125-129. [crossref]
  25. Shin SS, Pasechnikov D, Gelmanova IY (2006) Treatment outcomes in an integrated civilian and prison MDR-TB treatment program in Russia. Int J Tuberc Lung Dis 10(4): 402-408. [crossref]

Use of Cytosorb in Pediatric Septic Shock due to Untreated Systemic Lupus Erythematotus since the Childhood Onset

DOI: 10.31038/PSC.2022222

Abstract

Systemic Lupus Erythematosus (SLE) is an autoimmune disease characterized by unpredictable multiorgan involvement and a broad range of age of onset and unspecific manifestations. The identification of the onset of the SLE is very complex. The incidence is higher in young women with a peak between 15 and 40 years and a female to male ratio of 6-10:1. In childhood, the incidence is lower by a factor of ten with a female/male ratio=2:1. The variable prevalence is higher in Afro-Caribbean and Asians (207 and 50/100,000 cases, respectively), lower in Caucasians with an incidence of 20/100,000. The disease results from complex and multifactorial interaction of genetic, epigenetic and environmental factors that led to immune dysregulation and loss of tolerance to self antigens. An exaggerated defense response of the body to a noxious stressor as quiescent Epstein Barr Virus infection involves the release of acute-phase reactants, by uncontrolled activation of cytotoxic T lymphocytes, natural killer cells, and macrophages that can lead to a cytokine storm and can cause a massive inflammatory cascade leading to end-organ dysfunction (kidney and liver more frequently) and even death due to a self-mantaining process. We present a case of Septic shock and MOF on childhood untrated SLE.

Keywords

Lupus Eritematosus sistemico, Immunology, Etiopatology, Clinical manifestation, Voluntary avoided therapeutic treatment, Cytosorb, Rescue therapy

Introduction

A 16-year-old female was transferred to our hospital (tertiary care hospital with the only pediatric intensive care of country) on 17 February with a diagnosis of deep respiratory and cardiovascular insufficiency and anuria (Tables 1 and 2).

Table 1: Clinical features of SLE

Mucocutaneous Manifestations. (face and shoulder)
Musculoskeletal Manifestations
Hematologic and reticuloendothelial manifestations
Neuropsychiatric and Gastrointestinal Manifestations
Renal and Liver Manifestations (late onset and life-threatening)
Cardiovascular and Pulmonary Manifestations (late onset and life-threatening)
Exitus due to MODs.

Table 2: Epidemiology of SLE

Male Age > 40 y 10.1 on 1000000
Female  15< age <40 y  6 on 1000000
Pediatric Ages  Age <16 y  M/F=2:1
Carribean 207 on 1000000
Caucasians 50 on 100000
 Asian 20 on 100000

Past Medical History

Previous diagnosis at 10 years age of “Bullous systemic lupus erythematosus” (BSLE) an uncommon cutaneous presentation that occurs even less frequently in the pediatric population. Unfortunately the patient received inadequate therapeutic treatment with consequent rapid evolution in a severe form of SLE, and in the last two years there wa a rapid worsening of desease expressions in the whole body function leading till the observed rapid evolution in MOF. On admission the patient presented agonic clinical conditions, respiratory failure, bilateral pleural effusion and pulmonary consolidation throughout the area, state of coma (GCS 6-7), hyporesponsiveness to painful stimulation, discrasic oedema of the face and of the lower and upper limbs. A blood gas analysis showed values incompatible with the correct functioning of the metabolic-respiratory systems: PaO2< 50, PCo2 >89; PH 6.86: HCo3-12, BE: -20, Lactacidemia >25.

We proceeded to emergency intubation, mechanical ventilation in PCV and positioning of central vascular accesses to initiate inotropic support in the need to recover the respiratory and metabolic function. Brain protection was performed with morphine, dexdemetomidine and propofol. Fenoldopam infusion, 1 mg/kg/h was started On careful physical examination resulted the presence of muscle-tendon retractions of the major joints due to prolonged immobility and untreated lupus skin lesions. She also presented with an ulcerated bullous lesion, deepened to the tibial bone, suppurating and bleeding in the left lower leg. There were: cold cyanotic skin (rectal temperature 33°C) and the presence of unidentifiable patches spread throughout the body that showed generalized rigidity, a so called “rigor mortis precox”-like state. To study the anasarca state a scan was performed at bedside that found 6,000 ml of ascites,pericardial effusion and bilateral pulmonary consolidations.

Laboratory testing revealed: hypoalbuminemia and significant dysprotidemia, creatininemia> 3 times the basal value, proteinuria>3 gr/dl, persistent anuria from> 12 h (Tables 1-3).

Table 3: Laboratory tests on admission

Laboratory tests

 T.I. Ped Admission

 WBC 14430 uL
 Neu 95.39%
 Linf 2.72%
 RBC 2.200000 uL
 HGB 5.7 gr/dl
 HCT 17.48%
 PLT 103000 u/L
Glicemia 92 mg/dl
Azotemia 262 mg/dl
Creatinina 3.59 mg/dl
Prot. Tot. 5.8 gr/dl
Albumina 17 gr/L
 AST 22 U/L
 ALT 11 U/L
 GGT 16 U/L
 LDH 285 U/L
Bil Tot. 0.27 mg/dl
Bil ind. 0.15 mg/dl
Bil dir. 0.12 mg/dl
 CPK 132 U/l
 Mioglob. 325 ng/ml
 PCR 178 mg/L
 PCT 9.44 ng/ml
troponina 17.3 ng/ml
PT-INR 1.16
PTT-Ratio 1.54
Fibrinog. 218 mg/dl
 ATIII 62%
D-dimero 34072 mg/L
Pro-BNP 72906 pg/ml
Presep. 2748 pg/ml

CT scan was performed looking for hemorrhagic-ischemic cerebral lesions, with negative result but confirming the massive ascitic effusions in the pelvic cacities and between the viscera as well as in the Epiplon retrocavity, with no other acute organ lesions, except for renal congestion and bilateral alteration of the cortical density of the kidneys. Invasive ventilation and cardiovascular support were modulated. Management included continuous administration of packed Red Blood Cell, repeated administration of Fresh Frozen Plasma, Albumin 19% at 2 ml/h in continuous infusion, heparin infusion 50 IU/Kg/day, provertinum, AT III, Fibrinogen, diuretics and Glucose in adequate percentage (Table 4).

Table 4: Fluids, hematologic therapeutics, cardiovascular support intake after admission

Concentrated Blood Red Cells

 250 mls

250 ml after three/hours

Fresh Frozen Plasma 200 mls plus 200 mls 200 ml bidaily for 1 week
Albumine 19% %0 ml at 2 ml/hts IV continuos infusio The same regimen for 10 days
Provertinum 250 mg and 250 mg after 5 hrs As per needed 150 mg IV
AT III 400 IU and 250 IU after 5 hrs As per needed on lab test referral
Fibrinogen 259 mg and 250 after 5 hrs As per needed on lab tests
Diuretics 60 ml bolus followed by 10 mg Hr IV infusion Untilldismission from ICU
Glucose 33% 10 ml/hr for 6 hrs IV continuous infusion Only as per parenteral nutrition at 50% of total caloric daily requiring
Fenoldopam 1 mg/kh/day 1 week (Titrate)
Noradrenaline 0,1 mcg/kg/min 1 week (Titrate)
Adrenaline 0,1 mcg/kg/min 8 days (Titrate)
Milrinone 0,5 mcg/kg/min 25 days (Titrate)

Blood samples were taken, skin wound swab for PCR’s bacteria detection was negative as weel as throat swab for PCR for viruses and bacteria. Bronchoculture was positive for enterococcus faecium, subsequently, even for Aspergillus Niger treated with Voriconazole. Blood culture and urine culture positive for Candida Albicans treated with Fluconazole. A further examination of the biological parameters showed: leukopenia=2730, lymphopenia and thrombocytopenia 47000 uL, CRP=100 mg/dl, PCT> 1.5 pgr/ml, D-Dimers: 10000 UI/ml, PT INR 2.5 and PTT ratio: 2.7, Fibrinogen=500 mg/dl, LDH> 400 mg/dl, creatinine> 3 mg/l, reduced transaminase values such as chronic liver failure, altered values of ferritin and triglycerides compatible with the initial macrophage-histocytic activation process, albuminemia 12 mg/dl, total protein 2.0 Mg/dl, proteinuria> 3 g/l. Broad-spectrum antibiotic therapy was started and then targeted on antibiogram and culture outcomes, with Teicoplanin, fosfomycin and fluconazole, in rotation during the same hospitalization with Meropemen, Vancomycin, Voriconazole and Sulfamethoxazole trimetropin.

Due to worsening anasarca following the capillary leak and deteriorating renal function Treatment with CVVHD-F was initiated. Under this therapeutic management at the maximum support, in the following hours there wasn’t any improvement, especially persisting the state of severe acidosis mixed with Ph value never above 7.10. In order to control the multiorgan dysfunction caused by septic shock and the state of total functional anergy and dysregulation, presumably triggered by auto cannibalism process, we proposed to the parents the option to aply as rescue therapy the “Cytosorb Adsorber” to try to block the “Cytokine Storm” (that we where convinced was the principal cause of the functional dysfunctions), in an desperate attempt to restore an acceptable energy and metabolic production capable of supporting the life-saving needs of the patient [1-24].

Materials and Methods

Since 2016, in our Unit, a therapeutic project started, initially experimental, later well-defined and applied, for the Adsorber Cytosorb (Cytosorb Corporation-GmBH-Berlin D (E) – (USA) use in immunity dysregulations case in order to stop Cytokine Storm Progression and to initiate a “Rescue Therapy Treatment”, for compassionate purpose in patient in “Imminentia Mortis” condition. In this case, three cycles of CytoSorb Absorber were performed, mounted on Dialysis Machine Prismaflex (Baxter) in a downstream position to the filter used for CVVHD-F. Each cycle lasted 24 hours, circuit anticoagulation was maintained with low molecular weight Enoxaparin at a dose of 15-30 IU/kg/h (while continuing systemic administration of 50 U/I of heparin per day in continuous infusion). The PTT value was maintained at 70 sec and the act (200-220); the dialysis flow was established at 150 ml/min and a blood filtration flow of 200 ml. The priming of the circuit was integrated with 90 ml of concentrated RBCs for filling the Cytosorb. In the first two days about 4000 ml of ascitic fluid were removed with CVVHDF, and then another 2000 ml removed with permanent peritoneal drainage until the fourth day. After each suspension of use of Cytosorb, a cycle of albumin plasmapheresis was performed for other seven days.

Results

Right after the application of the first Cytosorb Adsorber, about eight hours later, there was a greater respiratory metabolic stability of the patient, a regression of lactates and a normalization of NaHCO3 values. The inothropic weaning began thanks to improved metabolic state and completely stopped within 36 hours. Fenoldopam, Furosemide and Milrinone continuous infusions (Triteted) were maintained longer because the renal function was never recovered. After the second application of Cytosorb the improvement of the pleural effusion was observed and sierositys resolved as well as the improvement of the pulmonary interstitial-alveolar function leading to a rapid reduction of the ventilatory support and FiO2 and successful extubation in the sixth day after the third cytokines apheresis with Cytosorb. At daily physical examination the neurological status improved after discontinuation of the neuroprotective drugs, and the patient showed attention and obeying to command, even if with limitation due to severe osteotendinous and muscle lesions. On the twelfth day the patient was transferred to Nephrology department of the same hospital with a specific pharmacological program and for dialysis treatment due to persistent anuric renal failure.

In the following 72 hours from the transfer, she developed malignant arterial hypertension and posterior reversible encephalopathy syndrome (PRES), heart failure and respiratory failure, so she needed intensive care setting for ventilatory assistance and control of blood pressure with angiotensin-converting-enzyme inhibitor and calcium channel blockers. In addition, an episode of angina occurred requiring enzymatic monitoring and therapy with nitratesTransthoracic critical care echocardiography was used to evaluate biventricular function and complications following acute coronary syndromes: hypertrophic-dilated myocardiopathy was highlighted and controlled by inotropic, lusitropic, and vasodilatory properties of milrinone and levosimendan.

Brain stem MRI was performed showing acute/subacute developmental hemorrhagic foci of posterolateral white and gray matter hemispheres, basal nuclei, brainstem (pons and midbrain) images consistent with posterior reversible encephalopathy (PRES) in addition to the presence of arteritis and narrowing of the arteries of the Polygon of Willis, compatible with the probable presence of the factor Lupus anticoagulants and the development of a picture of diffuse vasculitis and nervous and cardiac involvement during the progression of previously untreated Les. All the necessary pharmacological and depurative support therapies was resumed with a daily cycle of albumin plasmapheresis than scheduled on alternate days meanwhile continuing dialysis for anuria. Corticosteroid treatment with prednisolone was well tolerated and stabilized with a bolus of 0.5 mg/kg/day IV, followed by 50 mg/day through day 7 and progressive tapering during the 2 weeks treatment course up to a fixed dosage of 5 mg/day.

Fortunately, throughout this period of time the patient did not suffer infectious-inflammatory insults, even from the laboratory test point of view Immunosuppressive therapies currently in use was not taken into consideration given the exceptional nature of the case and. The poor clinical state of the patient and mostly because we were not able to find any specific references in the literature treating cases like this. Finally, a single dose of Intravenous Immunoglobulins of 75 mg/kg was administered because a biological fluids (blood, plasma, derivatives of both) administration strategy was preferred in an attempt to accompany, stimulate and regain her spontaneous immunity rather than replace or inhibit it with synthetic and/or semi-synthetic substitutes ( plasma, apheresis ). This therapeutic strategy is very frequent in our group during treatment with MOF sepsi related treated with Cytosorb apply. And it seems to us a well-founded opinion if related to our clinical results already well presented in letterature. Table 5 presents the lab test evolution before and after each single Cytosorb application, 48 hrs after application suspension and at 6 days from the end of Cytosorb application.

Table 5: Cytosorb application lab data timing

table 5

The progression of the systemic SLE was completely stopped in ten weeks. We witnessed complete regression of imaging (except for acute evolution of PRES signs) and laboratory parameters, as well as restoration of cardiovascular function with optimal pressure control, complete recovery of neurological status and total functional reactivity, even if paresis of the left upper limb hesitated. At 3 months there was no recovery of renal function consisting in the lupus nephritis picture. The patient, discharged from Intensive Care Unit on March 17th to Nephrology Ward, was then transferred to another hospital for physical rehabilitation on May 31st.

Discussion

The “Rescue Therapy” with compassionate purposes, in a patient in “Imminentia Mortis”, with CytoSorb and cycles of plasmapheresis for uncontrolled macrophage-histocyte activation syndrome (MAS), secondary to infectious trigger evolved in septic state with organ damage, is a consolidated reality. As such, however, the scientific community unconditionally accepts it only in 50% of cases. The majority of patients with pediatric sepsis has favorable outcomes except when sepsis leads to multiple organ dysfunction syndrome (MODS) and the risk death increases in proportion to the number of organs affected. Immune dysregulation is a hallmark of pediatric severe sepsis and MODS, triggered by the uncontrolled and amplified activation of the cytokine cascade leading to prolonged hospitalization and increased late mortality.

Organ dysfunction can be identified as a 2-point variation of the Pediatric Sequential Organ Failure Assessment Score (p-SOFA) assuming that the score is zero in the previously healthy patient, in the absence of comorbidities. A pSOFA score of 2 corresponds to a 10% increased mortality risk in the hospital population with suspected infection associated with organ dysfunction. p-SOFA is computed every day, providing a dynamic assessment of the progression of the disease. It is clear that the further aggravation of organ damage conditions, in the presence of pre-existing dysfunctions, amplifies the severity of state needing the institution of prompt and appropriate treatment.

The initial trigger response of the host is activated by the recognition of a Pathogen Associated Molecular Patterns (PAMPS) or by tissue damage caused by cellular apoptosis and the release of Damage Associated Molecular Patterns (DAMPS). These in turn activate receptors such as the Toll-like receptor and C-type Lectin receptor which, through the activation of Th1 and Th2, activate the cytokine cascade with the release of IL1, IL6 and TNFα. The release of cytokines is trigger for the further activation of numerous pathways of innate and acquired immunity, which results in the migration and activation of macrophages and other cells of the innate immune system, in the release of many others cytokines, chemokines, proteases and reactive oxygen species and amplification of cell damage. The activation of the coagulation system amplified by the notable release of cellular tissue factor and by the imbalance of the anticoagulation system due to protein C deficiency leads, in turn, through the protease activated receptor (PAR’s), resulting in the amplified production and thrombin deposition, to the interruption of the integrity of the endothelial barrier and the Leak Syndrome with tissue edema, dysproteinemia and hypoalbuminemia (and loss of the redox power of the latter). the renin-angiotensin system with increased incidence of renal insufficiency, hyperlactacidemia, cardiovascular instability, respiratory distress.

This condition of SLE has evolved into severe sepsis, favored by a high underlying pathological activity due to the high title of autoantibodies responsible for the exacerbation of organ damage (demonstrated by the high level of ANA and Anti dsDNA and by the low immunoglobulin title of specific immunity and the decrease of C3 and C4, Proteinuria> 3 gr/dl in the urine of 24 h). The meeting point in this state of dysregulation is the initial and final path of the altered innate and acquired immunity during the SLE. In the past, MAS was considered an exclusive complication of rheumatic disease. The progression of SLE in MODS due to the MAS is supported and initiated by a genetic, epigenetic and environmental basis (infections or severe septic state, vitamin D deficiency) which leads to self-persistence of autoantigens and cell damage in the presence of humoral dysregulation with increased cytokines TH1 (IL2), TH2 and TH17 (IL5, IL6, IL21) amplified by the innate immune response and by the self-maintenance of the T cell response and by the production of autoantibodies. The latter is amplified by the increase of INFϒ concentration supported by TNF-dependent factors, through the toll-receptors. The stimulation of B lymphocytes and the uncontrolled macrophage activation with cyclic amplification of the increasing organ damage, is worsened by a break-down of immunological regulation due to TGF-β production and deficit or dysregulation of the TREG/TH17 system.

With an innate substrate of severe immunological dysregulation pathognomonic of SLE, the overlap, as in our case, of the septic trigger with uncontrolled and amplified cytokine cascade aggravating the organ damage and increasing the activity of the disease, was the cause of an abnormal and unstoppable secondary lymphohistocyte-macrophage activation (MAS) which resulted in a serious risk of life for the patient. Rescue therapy with cytokine apheresis through CytoSorb absorber, established early at the onset of organ dysfunction, allowed its reduction with restoration of consciousness, reduction of support and rapid respiratory weaning within 48 hours of treatment with CytoSorb and the reduction until the suspension of the inotropic support at 24 h. There has never been recovery of renal function but only stabilization of renal organ damage with AKI KIDNO SCORE 2 which has attested to dependence on CRRT. The initial calculated pSOFAscore was 13 with an increased risk of mortality of 95% and an APACHE II score of 27 with an estimated non-operative mortality of 55%. Thanks to the Cytosorb treatments, a net reduction in the risk of death was observed: final SOFA calculated equal to 1 with expected mortality lower than 33.3% and an APACHE II calculated equal to 2 with estimated non-operative mortality <4%. The subsequent exacerbation of organ damage at the second admission was controlled with boluses steroid therapy of 500-750 mg/ml for 3 days and subsequent administration of 0.5-1 mg/kg/day subsequently reduced in 2 weeks to 5 mg/day of maintenance in addition to twice a week plasmapheresis. Heavier immunosuppressive therapy with cyclophosphamide or methotrexate and/or azathioprine was contraindicated. Biological immunological therapy with Rituxumab was also evaluated but was not administered due to the worst patient conditions.

Rescue therapy with CytoSorb has been shown to be safe and effective, reducing both the risk of morbidity from 95% to 33% in untreated SLE linked to sepsis and MODS and mortality. Early diagnosis and improved management of SLE significantly increased the probability of survival over the last decade from 5% vs. 95% at 5 years and from 0% vs. 92% at 10 years, from 1995 to 2003. Mortality is essentially linked to disease activity and organ damage as well as bacterial infections that occur in immunosuppressed or immunodeficient patients, as in the case of our patient, subjected to a high dose of glucocorticoids. Immunoapheresis with CytoSorb, in our case, interrupted the self-maintained course of the inflammatory cascade, amplified and mitigated the effects of immunological dysregulation and the imbalance of immune regulation at the basis of SLE, avoiding the progression towards massive lymphohistiocytosis (LHS) and the activation of macrophages (MAS). We await the results of the assay of the cytokines IL6, IL10 and TNFα, before and after each cycle of immunoapheresis performed in another German laboratory, for desirable and precise confirmation of these data.

Conclusion

Immunoapheresis with cytokines has proved effective, in our case, in the treatment of sepsis with organ damage and even more it has been shown to reduce the mortality associated with it, even in the presence of acute and amplified dysregulation of innate immunity. and insufficient and acquired immunological regulation of systemic inflammation as in SLE. It has been shown, as in previous clinical cases, to control uncontrolled lymphohistocytic and macrophage hyperactivation secondary to infectious triggers (MAS). However, further randomized controlled trials in pediatric patients are needed to better frame and define the role of apheresis with CytoSorb as a targeted therapy of amplified systemic inflammation and in the reduction of related organ damage, even more in the context of potent immunological dysregulation. of the acquired and innate immunity, amplified by the septic state.

Author’s Note

The case report of this paper represents a clinical rarity, I would say an exceptionality, since nowadays it has not been found, by us, in the available literature any description of patient like this, suffering from a pathology such as well recognized SLE, has come to medical observation so defied and in so severe clinical state as to require intensive treatment (described in this paper).

References

  1. Gliwińska A, et al. (2020) A rare complication of systemic lupus erythematosus in a 9-year-old girl: Questions. Pediatr Nephrol. [crossref]
  2. Leonardo Milella, Maria Teresa Ficarella, Gerolmina Calabresel, Michele Sisto, sorption in Rito Launa Grieco, et al. (2019) Application of Hemoadsorption in Neonatal and Pediatric Hyperinflammatory States:A case Series. American Journal of Pediatrics 5(2): 34.
  3. Milella Leonardo, Raimondo Pasquale, Ficarella MariaTeresa, Calabrese Gerolmina, Sisto Michele, et al. (2021) Application of combined hemadsorption with eculizumab as rescue treatment of a pediatric patient with multiple organ failure related to severe hemolytic uremic syndrome. J Clin Rev Case Rep 6(8): 718.
  4. Zhang L, et al. (2022) Continuous renal replacement therapy combined with double filtration plasmapheresis in the treatment of severe lupus complicated by serious bacterial infections in children: A case report. Open Life Sci. [crossref]
  5. Milella L, Ficarella MT (2017) First application of CVVHDF, Plasmapheresis and “Cytosorb Absorber” to solve Pediatric Haemophagocitic Histyocitosis case. Research in Neonatology and Pediatrics 1.
  6. LisaMaria Steurer, et al. (2019) Hemadsorption as rescue therapy for patients with multisystem organ failure in pediatric intensive care-Report of two cases reports and review of the literature. Artif Organs. [crossref]
  7. Leonardo Milella. (2019) Hemoadsorbtion to treate Neonatal and pediatric septic shock and sepsis. World Neonatology and Pediatric Care Meeting 2019.
  8. L Milella. P RaimondoESA (2020) Hemoadsorption: A promising Rescue Therapy in the Treatment of Critical ill Pediatric Patients. Oral Presentation-European society of Anesthesia.
  9. Milella Leonardo, Raimondo Pasquale, Ficarella Maria Teresa, Calabrese Gerolmina1, Sisto Michele1 et al. (2021) Hemoadsorption as Bridge to Liver Transplant in A Six-Month Old Patient with Hepatic Failure.Journal of Pediatrics and Neonatology. J Pediatr Neonatol 2(2): 1017.
  10. Milella, P. Raimondo, N. Lombardi, Maldera M. F. Cito, et al. Hemoadsorption: A Promising Rescue Therapy In The Treatment Of Critical Ill Paediatric Patients.. Conference Paper · May 2020
  11. Milella L MD, Ficarella MT, MD, Raimondo P MD, Moliterni P MD, Cito F MD, et al. (2016) “Is Cytosorb® a Rescue Therapy in neonatal and pediatric patients?
  12. Milella, P. Raimondo, N. Lombardi, F. Cito, M.L. Lasorella, MT. Et al. (2019) Hemoadsorption in the rescue treatment of a pediatric patient with MOF related to severe Hemolytic Uremic Syndrome. Bologna 5-6 december 2019
  13. Scobell, Rebecca (2020) Management of Lupus Nephritis in Children. Indian Pediatr. [crossref]
  14. Onengiya Harry, et al. (2018) Onset Systemic Lupus Erythematosus: A Review and Update. J Pediatr.[crossref]
  15. P Srivastava, et al. (2016) Outcome of lupus nephritis in childhood onset SLE in North and Central India: single-centre experience over 25 years. [crossref]
  16. L Milella (2020) Our experience with Cytosorb in Children and Newborns with Hyperinflammatory states. Ostrawa-News in Pediatric Intensive care.
  17. Milella Leonardo, Cito Fabiana, Raimondo Pasquale, Ficarella Maria Teresa, Moliterni Paola, et al. (2020) “Our Four Years Experience of Hemoadsorption, Albuminand Heparin Treatment for Paediatric Sepsis: Let’s Give a Chance in Multifactorial Pathological Conditions”. American Journal of Pediatrics 6(3): 207.
  18. Milella Leonardo1, Cito Fabiana1, Raimondo Pasquale, Ficarella Maria T eresa1, Moliterni Paola, et al. (2021) Our Four Years of Paediatric Sepsis Treatment with Hemoadsorption, Albumin and Heparin: Let’s Give it a Chance in Multifactorial Pathological Conditions. Highlights on Medicine and medical Research 14.
  19. Vahid Ziaee, et al. (2013) Peripheral gangrene: A rare presentation of systemic lupus erythematosus in a child. Am J Case Rep. [crossref]
  20. Raimondo P, Ficarella M, Moliterni P, Sisto M, Cito F, Calabrese G, Milella L (2019) Rapid treatment of unexpected septic shock: a single pediatric case recovery for Septic Shock due to Streptococcal Arthritis using early extracorporeal cytokine adsorber treatment. PurificationTherapies-Le idee per la ricerca clinica”-Milano.
  21. Anadi Mahajan, et al. (2020) Systemic lupus erythematosus, lupus nephritis and end-stage renal disease: a pragmatic review mapping disease severity and progression. Lupus. [crossref]
  22. Leonardo Milella (2018) Use of CytoSorb in a pediatric case of acute hemorrhagic encephalitis and multiple organ failure. Cytosorb Library. Case of the week.
  23. Pasquale Raimondo, Maria Teresa Ficarella, Paola Moliterni, Michele Sisto, Fabiana Cito, et al. (2019) Use of CytoSorb in a pediatric patient with septic shock due to streptococcal arthritis. Purification Therapies Workshop – The ideas for clinical research. Milan, Italy March 15-16 2019.
  24. Milella L (2021) Webinar.“Pediatric use of “Cytosorb”Marijana Matejc –“Cytosorbent”–USA-Stefania magnani,“Aferetica”, Italy.

Prevention of Sepsis in the Elderly with Diabetic Foot Ulcers: Letter to the Editor

DOI: 10.31038/ASMHS.2022665

What is Sepsis?

It is a dangerous disease that is caused by an overreaction of the body’s immune system to infection and gradually covers the whole body. This disease occurs due to a strong reaction to the infection; to deal with the threat, the body sends a large volume of chemicals into the bloodstream. This causes severe inflammation that over time slows blood supply and damages organs.

Diabetes in Old Age

One of the common chronic diseases of old age is diabetes, which has many effects on the quality of life of the elderly and sometimes causes death in the elderly due to its many complications.

Diabetic Foot Ulcer

One of the serious complications of diabetes is the diabetic foot ulcer, which increases the possibility of amputation if not treated and controlled. And it has irreparable effects on the life of the elderly and their families. Elderly people who do not have enough self-care or are neglected by their family are more likely to suffer from diabetic foot ulcers [1].

Sepsis and Diabetic Foot Ulcer

Failure to properly treat small leg wounds in the early stages and negligence provides the basis for the wound to spread to higher parts of the body. And on the other hand, the contamination of the hospital environment, non-observance of sterile technique in wound treatment and weakness of the immune system provide the basis for local wound infections and finally in an acute form of sepsis, which increases the risk of death due to the special physiological conditions of the elderly [2]. The question is, how can we prevent sepsis caused by diabetic foot ulcers in the elderly? Below are some strategies that can help.

  1. Accurate control of blood sugar at the appointed time and adherence to the insulin protocol.
  2. Sterile dressing by the wound nurse and use of new dressings instead of traditional ones.
  3. Adhering to a high-protein and vitamin-rich diet, according to the patient’s body conditions.
  4. Regular use of antibiotics and other medicines for the patient at the right time.
  5. Cultivation from the wound site in case of suspicion of infectious symptoms.
  6. Periodically and regularly check the condition of the nerves and blood vessels of the body.
  7. Encouraging the patient to move and move to establish organ perfusion.
  8. Prevention of secondary infections (urinary, respiratory, digestive catheters, non-sterile procedures, etc.)
  9. Antibiotics should be prescribed based on the results of the anti-bio-gram culture.
  10. According to the kidney condition of the patient, adequate hydration should be done.
  11. Reporting symptoms such as fever and chills, tachycardia, shortness of breath, decreased urination, dizziness, weakness, sweating, and low blood pressure.
  12. In case of distal limb necrosis, the patient’s consent for amputation should be obtained as soon as possible, in order to prevent further limb necrosis.
  13. Conducting psychiatric consultations for patients who do not consent to amputation.
  14. Correction of secondary problems of patients (kidney failure, electrolyte disorders, cardiovascular problems Arterial and venous insufficiency).
  15. Extensive cooperation of the treatment team with patients to improve the treatment process.

Conclusion

If any hospital follows the above simple platform at the beginning of admitting diabetic elderly, it will greatly help the process of treatment and timely discharge of patients.

References

  1. Dellinger RP, Levy MM, Rhodes A, Annane D, Gerlach H, et al. (2013) Surviving sepsis campaign: International guidelines for management of severe sepsis and septic shock (2012) Critical Care Medicine 41: 580-637.
  2. Phillips A, Mehl AA (2015) Diabetes mellitus and the increased risk of foot injuries. J Wound Care 24: 4-7. [crossref]

Immediate Effects of Task-Oriented Training on Walking and Balance in Patients with Stroke: A Preliminary Study

DOI: 10.31038/ASMHS.2022664

Abstract

Objective: The purpose of this study was to evaluate the immediate effects of task-oriented training on walking and balancing in-patient clients with chronic stroke.

Design: A randomized trial with pre-training and post-training evaluations.

Subjects: Ten participants were randomly assigned to an experimental group (N=6) or a control group (N=4).

Methods: The GAITRite (GAITRITE)? The system was used to assess the spatial and temporal walking parameters and the “Timed Up & Go” Test (TUG) was used to assess functional mobility. The Berg Balance Scale (BBS) was used to assess balance. Both groups received a single session of exercise training. Patients in the experimental group received task-oriented training that involved task-specific activities and functional tasks. Patients in the control group received conventional physical therapy training focused on facilitation and normalization of movement.

Results: Analysis of the data indicates that the experimental group performed significantly better than the control group with respect to walking speed (p<0.001) and stride length (p<0.001). Following intervention, the task-oriented training group exhibited a statistically significant (p<0.04) decrease in TUG scores compared with the control group. There was no significant difference in BBS scores between the two groups after intervention.

Conclusions: Task-oriented training can improve walking and functional mobility in patients with stroke. The findings of this study provide preliminary evidence supporting the short-term benefits of task-oriented training for patients with chronic stroke.

Keywords

Stroke, Hemiplegia, Exercise, Rehabilitation

Introduction

It is estimated that each year about 1.2 million people experience a new or recurrent stroke in Europe and 700,000 in the United States [1,2], making it by far the most common cause of long-term disability [3,4]. About one-third of stroke survivors are functionally dependent at one year post stroke and are unable to walk without assistance; and of those who are independent ambulators, 60% of them experience limitations in community ambulation [5,6].

Walking and balance disorders have been reported to be common impairments in people with stroke [5,7,8], and are frequently the common cause of long-term disability and handicap, which contributes to overall increased risk of falls [7]. Improving walking and balance has been the primary goal in the rehabilitation of patients with stroke [4]. Many of the traditional neurofacilitation approaches have been designed to target walking and balance, with many of these approaches focused on managing impairments [9]. Since improvements in impairments may not be generalized to function, the effectiveness of these approaches in improving walking and balance is limited [9].

Current evidence suggests that rehabilitation training is most effective when the related task is specific to the intended outcome [9], and the training allows patients to perform activities in real-time situations [10]. Numerous recent studies have demonstrated that task-oriented training is a critical rehabilitation strategy to improve the functional status of individuals with stroke [11-16]. A published systematic review [17] analyzed 151 trials on the effects of physical therapy on functional outcomes in patients with stroke and found that there is strong evidence that patients with stroke benefit from task-oriented training intervention in which functional asks are directly trained [17].

Relatively, very few studies have explored the effects of task-oriented training on walking and balance in individuals with chronic stroke. A Cochrane review conducted by Pollack et al. [18] reported that there is a need for high quality randomized trials to determine the efficacy of task-oriented training. Although improvements in walking and balance in people with stroke have been reported as the results of participation in a task-oriented program over a period of time, evidence regarding the immediate effect of a task-oriented training on walking and balance has not been reported in the literature. Therefore, the purpose of this study was to examine the immediate effects of task-oriented training on walking and balance in people with chronic strokes.

Methods

Study Design

A randomized controlled trial with pre-training and post-training evaluations was used. All participants completed the pre-training evaluation and then were randomly assigned to the experimental (n=6) or control (n=4) group. The randomization process was carried out by a person independent of the study. The investigator who collected the data is a physical therapist who is a Neurology Certified Clinical Specialist with 12 years of clinical experience working with patients with neurological disorders.

Participants

The participants included ten community-dwelling individuals with a first-time stroke who were recruited from outpatient physical therapy clinic in a university setting. The volunteer convenience sample was selected based on the following criteria: (1) a stroke experienced more than 6 months prior to study enrollment; (2) age between 35 and 80 years; (3) able to walk 10 meters independently with or without walking aids or orthotics; and (4) able to follow verbal commands. Exclusion criteria included: (1) debilitating illness before or during the study; (2) surgical procedure up to six months prior to the study; (3) inability to follow commands; or (4) a medical condition that precluded exercising. All subjects were blinded to their group assignment. All the assessment and intervention procedures were carried in the same treatment area. After having been informed about the study procedures, each participant signed an informed consent before enrolling in the study. The study was reviewed and approved by the Institutional Review Board of …………BLINDED…………………. University.

Examination

Subjects were evaluated twice, immediately before (pre-test) and immediately after (post-test) the intervention. The outcome measures included a self-paced walk over the GAITRite system, the “Timed Up & Go” Test (TUG), and the Berg Balance Scale (BBS).

GAITRite System

Temporal and spatial parameters of walking were measured using the GAITRite system (CIR Systems, Havertown, PA). The GAITRite system is a computerized system developed to measure and record temporal and spatial walking parameters. The GAITRite system uses an electronic walkway approximately four meters long with grids of embedded pressure sensors that detect footfalls as the subject walks the length of the walkway. It is a valid and reliable clinical measure for spatial and temporal walking parameters [19]. Each subject was instructed and then asked to practice one walking trial before the actual data were collected. Each subject was instructed to walk over the walkway at a comfortable walking speed. Subjects started walking at a point one meter in front of the walkway and stopped at a point one meter behind the walkway to eliminate the effects of acceleration and deceleration. Subjects who were using walking aids were allowed to use their preferred walking aid. Temporal and spatial parameters of walking including walking speed and stride length were recorded.

The “Timed Up & Go” Test

The TUG is a performance-based test designed to assess functional mobility. The TUG test is a useful tool to monitor the progress of mobility function in ambulant patients with chronic stroke. This test demonstrated good (ICC=.99) and interrater (ICC=.99) reliability as well as validity for people after stroke [20]. The examiner first demonstrated how to perform the TUG test and then instructed the participant to rise from a standard armchair, walk to a line on the floor three meters away, cross the line, turn, walk back to the chair, and sit down again while being timed with a stopwatch. Each participant was allowed to practice one trial before the actual data were collected. Participants performed the test at their own pace, and those who were using walking aids were allowed to use their preferred walking aid.

Berg Balance Test

The BBS was identified as one of the most commonly used assessment tools to measure balance function across the continuum of stroke rehabilitation [20,21]. The BBS is a task-oriented performance-based test that has been used to assess balance function in people after stroke and evaluate response to treatment. The scale consists of 14 functional tasks frequently performed in everyday life. The BBS has strong psychometric properties and has been shown to be a valid test with excellent interrater (ICCs=0.95-0.99) and intrarater reliability (ICC=0.97) for people with stroke [20,21].

Intervention

Both groups received a single session (60 minutes in length) of physical therapy intervention designed to improve walking and balance. Subjects in the control group received conventional intervention focusing on improving walking and balance through facilitation and normalization of movement patterns. Subjects in the experimental group practiced task-oriented activities that focused on walking and balance. The task-oriented training included overground walking, standing up, sit to stand, rising from a chair then walking a short distance, performing step-ups/step-downs, stepping forward, backwards and sideways, walking through an obstacle course, walking while carrying an object, walking at maximal speed, walking backwards and sideways, tandem stance, single leg stance, and functional weight shifting exercises. In all cases, activities were set up on an individual basis and were adapted to the individual’s performance and ability. Assistance or manual guidance was provided, if required, and participants received feedback as needed. Participants were allowed to use their assistive devices as needed. Throughout the therapy session, the therapist emphasized the importance of speed, the number of repetitions was modified according to the participants’ ability. During the testing time, participants were allowed to rest as needed.

Data Analysis

Frequency distributions as well as means and standard deviations were used for descriptive purposes. At the baseline, differences in age and time since the onset of stroke between the two groups were analyzed with an independent 2-sample t-test. Differences in gender and side of hemiplegia were compared between intervention groups using chi-square. The 2-way repeated measure analysis of variance (ANOVA) for repeated measures on the time factor was used to compare the difference between groups (experimental and control) and timing (preintervention, postintervention) for each studied outcome. The alpha level of statistical significance was set at p<0.05. The SPSS statistical software package was used for the analysis.

Results

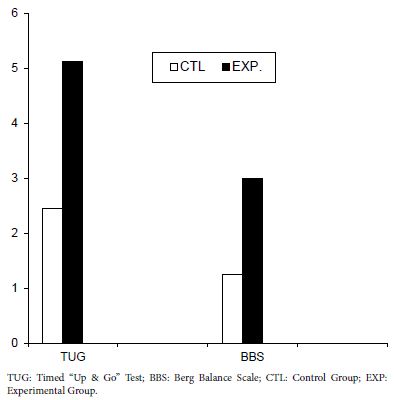
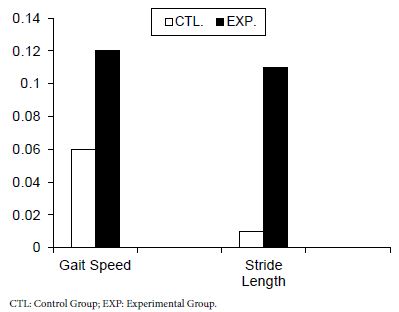
Ten subjects participated in this study. Participant demographic information, group assignment, side of stroke, and time since strokes are shown in Table 1. There were no statistically significant differences between groups at baseline with respect to demographic, characteristics, or outcome measures. Table 2 shows the group means, and standard deviations of the pre and post scores for time and distance walking parameters, the TUG scores, and the Berg Balance Scale scores. Analysis of the data indicates that the experimental group performed significantly better than the control group with respect to walking speed (p<0.001), and stride length (p<0.001) (Figure 1). Following the intervention, the task-oriented training group exhibited statistically significant (p<0.04) decrease in TUG scores compared with the control group (Figure 2). There was no significant difference in BBS between the two groups after intervention.

Table 1: Subject demographics, characteristics and group assignments

Subject

Group

Age (year)

Gender

Side of Hemiplegia

Time Since Stroke (month)

1 Experimental

72

Male Right

22

2 Experimental

49

Male Left

6

3 Experimental

55

Female Left

9

4 Experimental

68

Male Right

15

5 Experimental

62

Female Left

18

6 Experimental

71

Male Right

17

7 Control

65

Male Right

11

8 Control

53

Female Left

14

9 Control

69

Female Right

13

10 Control

79

Male Left

25

Table 2: Pre-test, post-test, and change scores, means, standard deviations, and mean changes by group

Variable

Score

Change scores


Experimental

Control

Experimental

Control

P-value

Pre

Post

Pre

Post

Post-pre

Post-pre

Walking speed (m/s)

0.43 ± 0.14

0.55 ± 0.14

0.49 ± 0.16

0.55 ± 0.15

±0.12

±0.06

< 0.001

Stride length (m)

0.59 ± 0.15

0.70 ± 0.14

0.61 ± .15

0.62 ± 0.15

±0.11

±0.01

< 0.001

TUG (s)

60.8 ± 10.6

55.67 ± 10.83

58.7 ± 14.0

56.25 ± 13.70

-5.53

-2.45

0.04

BBS

32.5 ± 4.85

35.5 ± 6.06

34.5 ± 5.32

35.75 ± 5.38

±3

±1.25

0.17

TUG: Timed “Up & Go” test; BBS: Berg Balance Scale

fig 1

Figure 1: Mean changes for walking speed and stride length for both groups

fig 2

Figure 2: Mean changes for the Timed “Up & Go” test and the Berg Balance Scale for both groups

Discussion

There is a growing body of evidence that supports task-oriented training as a beneficial intervention for patients with stroke. The purpose of this study was to examine the immediate effects of task-oriented training on walking and balance in subjects with chronic strokes. The findings of this study demonstrate that task-oriented training is associated with improvements in walking and balance in people with chronic stroke.

Spatial and temporal walking variables were significantly improved with task-oriented training. The results of the present study are in agreement with the findings of Knox et al. Salbach et al. and Dean et al. [11,15,16], who reported significant improvements in walking speed of individuals with stroke who participated in task-oriented training relative to participants in the control groups. Knox et al. [11] showed improvements in participants following participation in task-oriented circuit gait training as compared to the control group. Salbach et al. [15] showed that 6 weeks of task-oriented training induced an increase in walking speed as compared to the control group. Dean et al. [16] evaluated the effects of task-oriented training, including circuit training, on a small sample of individuals with chronic stroke and found a significant effect on walking speed after 4-week of task-oriented training.

Following the intervention, the task-oriented training group required less time to perform the TUG. Improvement in the TUG scores was statistically significant between the experimental and control groups. This result came in agreement with the finding of Knox et al. Leroux et al,. and Malik et al. [11,14,22] who examined the effect of an 8-week exercise program aimed at improving balance and mobility through various functional tasks in 10 subjects with chronic stroke. Knox et al. [11] reported improvements in TUG score in the experimental group who participated in task-oriented circuit gait training. Malik et al. [22] reported improvements in four weeks of task-oriented training. TUG scores following participation in Leroux et al. [14] concluded that task-oriented exercise program significantly improved the TUG scores in subjects with stroke. In contrast to the improvement in the TUG scores in the present study, Chan et al. Salbach et al. and Dean et al. [13,15,16] reported that task-oriented training did not have statistically significant improvement in the TUG scores. In the Dean et al. study [16], the results reflect a ceiling effect for this measurement tool for two subjects from the experimental group (N=5), these two subjects were able to obtain scores comparable with healthy subjects; in contrast, one subject from the control group (N=4) improved by 10 seconds and this may account for lack of significance in the TUG scores in the Dean et al. study [16]. Several factors may account for the improvements in the TUG scores in the task-oriented training group. Perhaps the most important aspect of task-oriented training is the specificity of training, the task-oriented training in the present study involved rising from a chair and walking this activity which was similar to testing conditions during training was specifically targeting the TUG scores, and may account for the improvement seen in this variable. In addition, previous studies [21,23] showed that there is high correlation between the TUG scores and walking speed in patients with chronic stroke. This high correlation is not surprising since TUG test incorporates walking speed. Given the association between walking speed and the TUG, improvements in walking speed were partially responsible for the improvement seen in the TUG scores in the experimental group.

Although changes in the BBS scores were not statistically significant between the study groups, there were trends toward greater gains in the balance scores in the experimental group compared with the control group. This result is similar to the findings of Salbach et al. study [15] who found no significant effects of task-oriented training on BBS. This is in contrast with the results of Knox et al. Chan et al. and Leroux et al. [11,13,14] who reported significant improvement in the balance following task-oriented training. The differences in the amount of practice and stages of recovery between the present study and Chan et al. and Leroux et al. [13,14] studies may be responsible for the lack of significance in the BBS reported in the present study. However, given the small number of subjects, lack of statistical significance between groups in regard to the BBS scores may be due to a lack of statistical power rather than a lack of effect.

Evidence has shown that task-oriented training is an effective intervention strategy to promote meaningful improvement in motor function [14,18,24] The effect of intervention involving task-oriented training is highly specific and the effectiveness of the training is related to the training parameters used with the maximum training occurs when training activities are similar to real-life tasks [18,22,25]. The intervention activities used in this study were specific and included walking and balance activities. The intervention activities used in the task-oriented group allowed the participants to practice functional tasks used in everyday activities, in real-time situation taking into consideration normal biomechanics, strength, balance, and lower limb function. The improvements in walking and balance may be related to the specificity of training used in this study.

In interpreting the results of this study, several limitations must be considered. The sample size was small in the current study. The results of this study are preliminary for this small sample size, limiting external validity. There was potential for bias since the researcher was not masked to the group assignments. In the present study we did not consider a single-session of task-oriented training to be a major study weakness, because the purpose of the present study was to determine the immediate effects of the task-oriented training, rather than the additive effects of multiple sessions.

The findings of this study demonstrated that task-oriented walking and balance intervention improved walking function in people after stroke. The application of task-specific activities may promote improvements in spatial and temporal walking parameters and functional mobility. The results of the present study suggest that people with chronic stroke may benefit from a task-oriented training program. Further research with a larger sample size is warranted to see if the results of the current study can be replicated. Further study is needed to document the efficacy of a task-oriented home program in people after stroke. Further research is necessary to document the effect of multi-sessions and different schedules of task-oriented training on walking and balance functions. The results of the present study concern the immediate effects of task-oriented training, research should be performed to examine the long-term effects after a training period on recovery of walking and balance functions after stroke.

Conclusions

The findings of this study provide preliminary evidence supporting the short-term benefits of task-oriented training for patients with chronic stroke. Although the generalization of the results of this study is limited due to the small sample size, this study provided preliminary data for a larger controlled trial to examine the effects of task-oriented training in people after stroke. The intervention activities in this study included repetitive practice of functional activities used in everyday activities and did not involve the use of any specific exercise equipment; these activities can be easily incorporated into a home exercise program. The results of the present study indicate that patients with chronic stroke would benefit from task-oriented training.

References

  1. Virani SS, Alonso A, Benjamin EJ, Bittencourt MS, Callaway CW, et al. (2020) Heart Disease and Stroke Statistics-2020 Update: A Report From the American Heart Association. Circulation 141: e139-e596. [crossref]
  2. Wafa HA, Wolfe CDA, Emmett E, Roth GA, Johnson CO, et al. (2020) Burden of Stroke in Europe: Thirty-Year Projections of Incidence, Prevalence, Deaths, and Disability-Adjusted Life Years. Stroke 51: 2418-2427. [crossref]
  3. Center for Disease Control and Prevention (CDC) Stroke Facts. 2022. Accessed November 3, 2022. https: //www.cdc.gov/stroke/facts.htm
  4. Hatem SM, Saussez G, Della Faille M, Prist V, Zhang X, et al. (2016) Rehabilitation of Motor Function after Stroke: A Multiple Systematic Review Focused on Techniques to Stimulate Upper Extremity Recovery. Front Hum Neurosci 10: 442. [crossref]
  5. Johnston TE, Keller S, Denzer-Weiler C, Brown L (2021) A Clinical Practice Guideline for the Use of Ankle-Foot Orthoses and Functional Electrical Stimulation Post-Stroke. J Neurol Phys Ther 45: 112-196. [crossref]
  6. Tashiro H, Isho T, Takeda T, Nakamura T, Kozuka N, et al. (2019) Life-Space Mobility and Relevant Factors in Community-dwelling Individuals with Stroke in Japan: A Cross-sectional Study. Prog Rehabil Med 4: 20190014. [crossref]
  7. Choo YJ, Chang MC (2021) Effectiveness of an ankle-foot orthosis on walking in patients with stroke: a systematic review and meta-analysis. Sci Rep 11: 15879. [crossref]
  8. Salbach NM, Mayo NE, Robichaud-Ekstrand S, Halney JA, Richards CL, et al. (2005) The effect of a task-oriented walking intervention on improving balance self-efficacy poststroke: a randomized, controlled trial. Journal of the American Geriatric Society 53: 576-582. [crossref]
  9. Rensink M, Schuurmans M, Lindeman E, Hafsteinsdóttir T (2009) Task-oriented training in rehabilitation after stroke: systematic review. J Adv Nurs 65: 737-54. [crossref]
  10. Lennon S, Ashburn A, Baxter D (2006) Gait outcome following outpatient physiotherapy based on the Bobath concept in people post stroke. Disability and Rehabilitation 28: 873-881. [crossref]
  11. Knox M, Stewart A, Richards CL (2018) Six hours of task-oriented training optimizes walking competency post stroke: a randomized controlled trial in the public health-care system of South Africa. Clin Rehabil 32: 1057-1068. [crossref]
  12. Kim B, Park Y, Seo Y, Park S, Cho H, et al. (2016) Effects of individualized versus group task-oriented circuit training on balance ability and gait endurance in chronic stroke inpatients. J Phys Ther Sci 28: 1872-5.
  13. Chan D, Chan C, Au D (2006) Motor relearning programme for stroke patients: A randomized controlled trial. Clinical Rehabilitation 20: 191-200. [crossref]
  14. Leroux A, Pinet H, Nadeau S (2006) Task-oriented intervention in chronic stroke: Changes in clinical and laboratory measures of balance and mobility. American Journal of Physical Medicine and Rehabilitation 85: 820-830. [crossref]
  15. Salbach NM, Mayo NE, Wood-Dauphinee S, Hanley JA, Richards CL, et al. (2004) A task-orientated intervention enhances walking distance and speed in the first year post stroke: a randomized controlled trial. Clinical Rehabilitation 18: 509-519. [crossref]
  16. Dean CM, Richards CL, Malouin F (2000) Task-related circuit training improves performance of locomotor tasks in chronic stroke: a randomized, controlled pilot trial. Archives of Physical Medicine and Rehabilitation 81: 409-417. [crossref]
  17. Van Peppen RPS, Kwakkel G, Wood-Dauphinees S, Hendricks HJM, Van der Wees PhJ, et al. (2004) The impact of physical therapy on functional outcomes after stroke: what’s the evidence? Clinical Rehabilitation 18: 833-862. [crossref]
  18. Pollack A, Baer G, Pomeroy V, Langhorne P (2007) Physiotherapy treatment approaches for the recovery of postural control and lower limb function following stroke. Cochrane Database of Systematic Review CD001920. [crossref]
  19. Scully A, Tan D (2019) Within-Assessment Variability of the GAITRite System in People with Stroke. Am J Phys Med Rehabil 98: 446-449. [crossref]
  20. Alghadir AH, Al-Eisa ES, Anwer S, Sarkar B (2018) Reliability, validity, and responsiveness of three scales for measuring balance in patients with chronic stroke. BMC Neurol 18: 141. [crossref]
  21. Blum L, Korner-Brtnsky N (2008) Usefulness of the Berg balance Scale in stroke rehabilitation: a systematic review. Physical Therapy 88: 559-566,. [crossref]
  22. Malik AN, Masood T (2021) Task-oriented training and exer-gaming for improving mobility after stroke: A randomized trial. J Pak Med Assoc 71: 186-190. [crossref]
  23. NG SS, Hui-Chan CW (2005) The Timed Up & Go test: its reliability and association with lower-limb impairments and locomotor capacities in people with chronic stroke. Archives of Physical Medicine and Rehabilitation 86: 1641-1647. [crossref]
  24. Bayona NA, Bitensky J, Salter K, Teasell R (2005) The role of task-specific training in rehabilitation therapies. Topics in Stroke Rehabilitation 12: 58-65. [crossref]
  25. Lewthwaite R, Winstein CJ, Lane CJ, Blanton S, Wagenheim BR, et al. (2018) Accelerating Stroke Recovery: Body Structures and Functions, Activities, Participation, and Quality of Life Outcomes From a Large Rehabilitation Trial. Neurorehabil Neural Repair 32: s150-165. [crossref]

Mini-Open Carpal Tunnel Release in Carpal Tunnel Syndrome

DOI: 10.31038/IJOT.2022521

Abstract

Background: Carpal tunnel syndrome is considered the most common nerve compression disorder of the arm and an important cause of pain, neurologic symptoms and functional limitation of the wrist and hand. Carpal tunnel syndrome is a complex disorder associated with localized compression of the median nerve at the carpal tunnel.

Aim and objectives: To assess the functional outcome of Mini open carpal tunnel release.

Patients and methods: The present study was conducted on 25 patients in Post graduate Department of Orthopaedics, Govt. Hospital for Bone and Joint Surgery, an associated hospital of Govt. Medical College Srinagar from July 2019 to August 2021.

Results: The average symptom severity score improved from 3.5 preoperatively to 1.3 at final follow up of 6 months. The average functional status score improved from 3.3 preoperatively to 1.42 at the final follow up of 6 months. The mean DML and mean DSL decreased from 5.9 mS and 5.2 mS pre operatively to 4.7 mS and 3.9 mS respectively at the final follow up of 6 months. The mean sensory conduction velocity at 6 months post-operative was 39.6 m/s with range from 22.6 to 60.9 m/s. The mean sensory conduction velocity increased from 28.4 m/s pre operatively to 39.6 m/s at the final follow up of 6 months. 2 patients (8%) in our study experienced persistent symptoms 1 patient (4%) had superficial infection which settled with oral antibiotics.

Conclusion: Mini open carpal tunnel release is an effective procedure which gives excellent symptomatic and functional outcome with very few complications. The mini open technique gives an additional advantage of less operative time, less wound related complications, improved cosmesis and quicker return to routine activity as compared to the open release.

Keywords

Carpal tunnel syndrome, Mini-open, Median nerve, Transverse carpal ligament

Introduction

Carpal Tunnel Syndrome (CTS) is a fairly common peripheral neuropathy, caused by median nerve compression at the wrist level. The prevalence of CTS is believed to be 3.8% of general population around the world. The syndrome is more common in females than in males, with a peak age range of 40-60 years. On the basis of clinical examinations and nerve conduction studies, it had been approximated that one ·in every 5 subjects who complain of symptoms such as pain, numbness and a tingling sensation in hands could have CTS.

In recent years there has been an increase in incidence of CTS, may be due to the awareness of people about this disease, the upward disease detection rate, the work is more and more meticulous and delicate requiring using wrist continuously [1-7]. The etiology of CTS is largely structural, genetic and biological, with environmental and occupational factors. 70% of CTS cases are of unknown causes, the others are due to intrinsic and extrinsic factors. Intrinsic factors which exert pressure within the tunnel are pregnancy, hemodialysis, gout, diabetes, Rheumatoid arthritis, various other inflammatory and connective tissue disorders and systemic diseases like hypothyroidism, etc. Extrinsic factors which exert pressure outside the tunnel are lipomas, ganglion and vascular formations. Patients with CTS present with a constellation of symptoms including numbness and tingling of hand in the distribution of median nerve, nocturnal paresthesias as well as weakness and atrophy of the thenar muscles [8-11].

CTS may be managed conservatively at first with local corticosteroid injections, splints, and other techniques. However, in recent practice, treatment is selected considering various factors such as the stage of disease, the severity of symptoms or the patient preference. Splinting, local steroid injections and oral steroids have proven effective in some cases. The rationale for wrist splint is based on observations that CTS symptoms improve with rest and aggravate with activity. Subsequent research has suggested that the therapeutic effect of wrist splinting arises from minimizing carpal tunnel pressures. Corticosteroid treatment is effective in reducing inflammation and edema of synovium and tendons. It also has harmful effect on tenocyte function by reducing collagen and proteoglycan synthesis. However non operative modalities are preferred in the early stages of the disease. Advanced stages with persistent clinical features need a surgical release from the compression. Surgery offers an effective way of treating the condition. The basic principle of CTS surgery is to increase the volume of the carpal tunnel by releasing the transverse carpal ligament (TCL) thereby releasing pressure on the median nerve. A wide variety of surgical techniques have been described for CTS. However, as of yet, no strong evidence has suggested that any one approach is superior to the others [12-17].

Mini incision release is a less invasive technique with lower rate of complications, shorter operative time and more cost effectiveness. Although each technique has advantages and disadvantages, a few studies reported that mini incision release technique decreases the pathologic swelling of the median nerve and scar formation at the inlet of the carpal tunnel [18,19]. Thus in this study we aim to evaluate the safety, effectiveness and recurrence rate of mini-open carpal tunnel release technique.

Patients and Methods

This was a prospective study that was conducted from July 2019 to July 2021 which included 25 consenting patients who presented to the Post graduate Department of Orthopaedics, Govt. Hospital for Bone and Joint Surgery, an associated hospital of Govt. Medical College Srinagar and diagnosed as having carpal tunnel syndrome following approval by institutional ethical committee.

Inclusion Criteria

  • Signs, symptoms and electro-diagnostic tests characteristic of carpal tunnel syndrome
  • No response to conservative treatment for at least 6months
  • Age >18 years
  • All sexes

Exclusion criteria

  • Peripheral Neuropathy
  • Prior Carpal Tunnel release
  • Inflammatory arthropathy
  • Deformity of hand/wrist
  • Prior trauma (<2weeks)
  • Pregnancy
  • Operation for excision of neoplasm

Surgical Technique

Prophylactic Antibiotic (IV Cefuroxime 1.5 gm) was given half an hour before surgery. The surgical intervention was performed under regional Anaesthesia (Axillary / Supra clavicular block) using a tourniquet. The patient placed in the supine position with the hand, wrist and fingers stretched in slight extension position, a small support placed under the wrist. A 1.5-2 cm longitudinal incision, located on the vertical line drawn from the third inter digital space and extending proximally to the distal wrist crease, was performed. The skin subcutaneous tissue dissected, the proximal end of the transverse carpal ligament visualized, and the dorsal and ventral surfaces of the ligament were dissected. Using scissors, the transverse carpal ligament was cut in the proximal to distal direction. After achieving hemostasis, the surgical field was irrigated with a physiological saline solution and the skin closed with silk. The patients’ hands and palms dressed with ample cotton padding and elevated (Figure 1).

fig 1

Figure 1: Intra-operative pictures.
(A) On Table Skin Marking for Incision (B) Skin Incision(C) Superficial Dissection (D) Cutting of Transverse Carpal Ligament (E) Exposure of Median Nerve (F) Skin Closure (G) Bulky Antiseptic dressing.

Post-operative Rehabilitation and Follow-up

Single dose of IV antibiotic was given Post Operatively followed by oral Antibiotics for 5 days. Finger ROM exercises were started immediately after surgery. Dressing was changed to a lighter one at 3 to 4 days to start wrist motion. Patients were allowed to return daily normal activities at 3 to 4 weeks post operatively. Patients were followed up at 3 and 6 months post operatively and NCV was repeated at 6 months post operatively. Outcome was assessed by Boston Carpal Tunnel Questionnaire-1993 (Tables 1 and 2).

Table 1: Symptom severity scale according to BOSTON CARPAL TUNNEL

1 2 3 4 5
1. How severe is the hand or wrist pain that you have at knight? Normal Slight Medium Severe Very serious
2. How often did hand or wrist pain wake you up during a typical knight in the past two weeks? Normal Once 2-3 times 4-5 times More than 5 times
3. Do you typically have pain in your hand or wrist during the daytime? No pain Slight Medium Severe Very serious
4. How often do you have hand or wrist pain during the daytime? Normal 1-2 times/day 3-5 times/day More than 5 times Continued
5. How long on average does an episode of pain last during the daytime? Normal <10 minutes 10-60 continued >60 minutes Continued
6. Do you have numbness (loss of sensation) in your hand? Normal Slight Medium Severe Very serious
7. Do you have weakness in your hand or wrist? Normal Slight Medium Severe Very serious
8. Do you have tingling sensation in your hand? Normal Slight Medium Severe Very serious
9. How severe is numbness (loss of sensation) or tingling at knight? Normal Slight Medium Severe Very serious
10. How often did hand numbness or tingling wake you up during a typical knight from last two weeks? Normal Once 2-3 times 4-5 times More than 5 times
11. Do you have difficulty with the grasping and use of small objects such as keys or pens? Without difficulty Little difficulty Moderate difficulty Very difficulty Very difficulty

Table 2: Function status scale according to BOSTON CARPAL TUNNEL

No difficulty Little difficulty Moderate difficulty Intense difficulty Cannot perform the activity due to hand and wrist symptoms
Writing 1 2 3 4 5
Buttoning in cloths 1 2 3 4 5
Holding a book while reading 1 2 3 4 5
Gripping of a telephone handle 1 2 3 4 5
Opening of jars 1 2 3 4 5
Household chores 1 2 3 4 5
Carrying of grocery basket 1 2 3 4 5
Bathing and dressing 1 2 3 4 5

Results

In our study, the mean age of patients was 50.4 (range 35-60) years. The mean duration of surgery was 10.8 (range 8-15) minutes. Demographic and baseline clinical data for the patient cohort are shown in Table 3. In our study, the average symptom severity score at 3 and 6 months post-operative was 1.8 (range 1.45 to 3.18) and 1.58 (range 1.27 to 2.9) respectively. The average symptom severity score improved from 3.5 preoperatively to 1.3 at final follow up of 6 months. The average functional status score at 3 and 6 months postoperative was 1.68 (range 1.33 to 3) and 1.42 (range 1.6 to 2.5). The average functional status score improved from 3.3 preoperatively to 1.42 at the final follow up of 6 months (Table 4). The mean DML and DSL at 6 months post-operative was 4.6 mS (range 3.3 to 6.2 Ms) and 3.9 mS (range 3.1 to 6.5 mS) respectively. The mean DML and mean DSL decreased from 5.9 mS and 5.2 mS pre operatively to 4.7 mS and 3.9 mS respectively at the final follow up of 6 months. The mean sensory conduction velocity at 6 months post-operative was 39.6 m/s with range from 22.6 to 60.9 m/s. The mean sensory conduction velocity increased from 28.4 m/s pre operatively to 39.6 m/s at the final follow up of 6 months (Table 5). 2 patients (8%) in our study experienced persistent symptoms 1 patient (4%) had superficial infection which settled with oral antibiotics (Table 6). Overall, most of the patients achieved satisfactory results.

Table 3: Descriptive Statistics of the Study Population (N=25)

Variables No. of patients Percentage
Sex Male 2 8
Female 23 92
Age group <34 years 0 0
34-45 years 5 20
46-55 years 15 60
>55 years 5 20
Side Right 13 52
Left 7 28
Bilateral 5 20
Pre-operative symptom duration <6 months 0 0
6-12 months 11 44
13-24 months 11 44
25-36 months 3 12

Table 4: Symptom severity score and function status scale according to BOSTON CARPAL TUNNEL


Average score Pre-operative 3 months post-operative 6 months post-operative
No. of patients Percentage No. of patients Percentage No. of patients Percentage
Symptom severity score 1-2 0 0 21 84 23 92
2.01-3 0 0 3 12 2 8
3.01-4 23 92 1 4 0 0
4.01-5 2 8 0 0 0 0
Mean 3.5 (range3.09-4.09) 1.8 (range 1.45-3.18) 1.58 (range 1.27-2.9)
Functional status score 1-2 0 0 24 96 24 96
2.01-3 11 44 1 4 1 4
3.01-4 14 56 0 0 0 0
4.01-5 0 0 0 0 0 0
Mean 3.15 (range 2.66-4) 1.68 (range1.33-3) 1.42 (1.16-2.25)

Table 5: Distal motor latency, Distal sensory latency and Sensory conduction velocity Pre-operatively and 6 months post-operative

  Average score Pre-operative 6 months post-operative
No. of patients Percentage No. of patients Percentage
Distal motor latency (mS) <4 0 0 7 28
4-6 16 64 16 64
6.01-8 7 28 2 8
>8 2 8 0 0
Mean 5.6 (range 4.2-8.1) 4.6 (range 3.3-6.2)
Distal sensory latency (mS) <4 4 16 13 52
4-6 16 64 11 44
6.01-8 3 12 1 4
>8 2 8 0 0
Mean 5.2 (range 3.45-8.5) 3.9 (range 3.1-6.5)
Sensory conduction velocity (m/s) <20 6 24 0 0
20-30 9 36 1 4
30.01-40 6 24 15 60
>40 4 16 9 36
Mean 28.4 (range 12.3-44) 39.6 (range 22.6-60.9)

Table 6: Superficial infection which settled with oral antibiotics

Complications No. of patients Percentage
Persistent symptoms 2 8
Superficial infection 1 4
Nil 22 88
Total 25 100

Discussion

Conventional open carpal tunnel release has been widely accepted as an effective method for treating carpal tunnel syndrome after failed conservative management. This prospective study demonstrated the benefits of mini-open carpal tunnel release under local anesthesia, in terms of clinical recovery and relief of symptoms in the short and long term (3 and 6 months respectively). These improvements were of both statistical significance and clinical relevance. These procedures have shown comparable postoperative pain, earlier recovery and return to work, improved grip strength, and reduced complication rate. These are easier to perform and safer procedures as compared to endoscopic ones and do not require any special equipment. The technique requires limited dissection and little interruption of tissue planes as compared to the open method and doesn’t divide the subcutaneous tissue or the palmar fascia as much as the open method does [20-24].

In this study we found that the mean age of development of carpal tunnel was 50.4 years, which is comparable to Thanh Ma Ngoc et al. (2017) which showed that the mean age was 50.3 years. Hamid Reza Aslani et al. (2012) noted high incidence of carpal tunnel syndrome in females, which is similar to our study. In our study the mean pre-operative symptom duration was 17.4 months with range from 6 to 36 months. In other previously done studies, the mean pre-operative duration ranged from 10.8 to 13.3 months. In our study, the average pre-operative DML was 5.6mS with range from 4.2 to 8.1. In other previously done studies this mean ranged from 5.44 to 7.3 which is comparable to our study. The mean operative time in our study was 10.8 minutes with a range from 8 to 15 minutes which is comparable Keykhosro Mardanpour et al. (2018) who noted in his study the mean operative time was 12 minutes. In our study, the average 3 months post-operative symptom severity score was 1.8 which is comparable with previously done study by Seyho Cem Yucetas et al. (2012) as 1.95. In our study, the average functional severity score at 3 months was 1.68 and the average DML at 6 months post-operative was 4.6mS which is comparable with the results obtained in study done by Heybeli et al. (2002) as 1.5 and 4.7 mS respectively. Majority of patients in our study had no complications. 2 patients experienced persistent symtoms (8%). In other studies inadequate symptom relief ranged from 2% to 3.8%. 1 patient (4%) in our study had has superficial infection. The percentage of infection ranged from 0% to 1.9% in other studies.

One weakness of our study is the group of the patients is small. In addition, the follow up may be too short. However, for a preliminary report, the result is quite encouraging, i.e., the procedure improves the symptom of the patients even in short term follow-up and improve the cosmetic appearance compare to a long incision. We hope to collect more patients and carry out longer follow-up in the future [25-29].

Conclusion

Mini open carpal tunnel release is an effective procedure which gives excellent symptomatic and functional outcome with very few complications. The mini open technique gives an additional advantage of less operative time, less wound related complications, improved cosmesis and quicker return to routine activity as compared to the open release.

References

  1. Alfonso C , Jann S , Massa R, Torreeggiani A.(2010). Diagnosis , treatment and follow up of the carpal tunnrl syndrome: a review. Neural Sci .31:243-252. [crossref]
  2. Aroori S, Spence RA.(2008). Carpal tunnel syndrome. Ulster Med 77:6-17
  3. Atroshi I, Gummesson C, Johnsson R, Ornstein E, Ranstam J, etal.(1999). Prevalence of carpal tunnel syndrome in a general population. JAMA. 282:153-158. [crossref]
  4. Phalen GS.(1966). The carpal tunnel syndrome. Senventeen years’ experience in diagnosis and treatment of 654 hand. J Bone Joint Surg Am.48:211-228.
  5. Atroshi I, Gummesson C, Johnsson R, Ornstein E, Ranstam J, etal.(1999). Prevalence of carpal tunnel syndrome in a general population. JAMA. 282(2):153-158. [crossref]
  6. Jenkins PJ, Duckworth AD, Watts AC, McEachan JE (2012). The outcome of carpal tunnel decompression in patients with diabetes mellitus. J Bone Joint Surg 94:811-814. [crossref]
  7. Palmer AK, Toivonen DA (1999) Complications of endoscopic and open carpal tunnel release. J Hand Surg 24: 561-565. [crossref]
  8. Lozano-Calderon S, Anthony S, Ring D.(2008). The quality and strength of evidence for etiology: Example of carpal tunnel syndrome. J Hand Surg Am. 33:525-38. [crossref]
  9. Wong KC, Hung LK, Ho PC, Wong JMW (2003) Carpal tunnel release – A prospective, randomized study of endoscopic versus limited-open methods. J bone Joint Surg. 85-B:863-868. [crossref]
  10. Kasdan ML (2000) Complications of endoscopic and open carpal tunnel release. J Hand Surg 25:185. [crossref]
  11. Muller M,TsuiD, Schnur R, HardJ, Biddulph D L,etal.( Effectiveness of hand therapy intervention in primary management of carpi tunnel syndrome: a systemic review. J Hand therapy. 17:210-228.
  12. Padua L, Coraci D, Erra C, Pazzaglia C, Paolasso I et al.(2016). Carpal tunnel syndrome: clinical features, diagnosis, and management. Lancet Neurol. 15:1273-4. [crossref]
  13. Piazzini DB, Aprile I, Ferrara PE, et al.(2007). A systematic review of conservative treatment of carpal tunnel syndrome. Clin Rehabil. 21:299-314.[crossref]
  14. Walker WC, Metzler M, Cifu DX, Swartz Z.(2000). Neutral wrist splinting in carpal tunnel syndrome: a comparison of nightonly versus full-time wear instructions. Arch Phys Med Rehabil. 81:424-429.[crossref]
  15. Graham B, Peljovich AE, Afra R, et al.(2016). The American academy of orthopaedic surgeons evidence-based clinical practice guideline on: management of carpal tunnel syndrome. J Bone Joint Surg Am.98:1750-4.[crossref]
  16. Huisstede BM, Randsdorp MS, Coert JH, Glerum S, van-Middelkoop M, etal.(2010). Carpal tunnel syndrome. Part II: effectiveness of surgical treatments-a systematic review. Arch Phys Med Rehabil. 91:1005-1024.[crossref]
  17. Standring S.(2005). Gray’s Anatomy: The Anatomical Basis of Clinical Practice. New York: Elsevier .p.913.
  18. lsogai S, Murakami G, Wada T, Akita K, YamashitaT, etal.(2002). Laminar configuration of the transverse carpal ligament. J OrthopSci .7:79-83.[crossref]
  19. Phalen GS.(1966). The carpal-tunnel syndrome. Seventeen years’ experience in diagnosis and treatment of 654 hands. J Bone Joint Surg. 48:211-28.
  20. Cellocco P, Rossi C, Bizzarri F, Patrizio L, Costanzo G.(2005). Mini-open blind procedure versus limited open technique for carpal tunnel release: a 30-month followup study. J Hand Surg Am. 30:493-9.[crossref]
  21. Wong KC, Hung LK, Ho PC, Wong JMW.(2003). Carpal tunnel release. A prospective, randomized study of endoscopic versus limited-open methods. J Bone Joint Surg Br. 85:863-8. .[crossref]
  22. Lee WP, Strickland JW.(1998). Safe carpal tunnel release via a limited palmar incision. Plast Reconstr Surg.101:418-6.
  23. Abdel-Moneim H, Said A-B.(2016). Double mini incision in the treatment of carpal tunnel syndrome. Egypt Orthop J.51:90-3.
  24. Ngoc TM, Dung TT, Huu MN, Le KT, Tran Q, et al. (2017) The Result of Mini-Open Surgery for Carpal Tunnel Syndrome. Ann Musculoskelet Med 1: 046-049.
  25. R. Aslani et al.(2012). Comparison of carpal tunnel release with three different techniques. Clinical Neurology and Neurosurgery 114: 965-968.[crossref]
  26. Mardanpour K, Rahbar M, Mardanpour S.(2019). Functional outcomes of 300 carpal tunnel release: 1.5 cm longitudinal mini-incision. AsianJ Neurosurg 2019; 14:693-7. [crossref]
  27. Seyho Cem Yücetaş1 Adem Yildirim2.(2013). Comparative Results of Standard Open and Mini Open, Knife Light Instrument-Assisted CarpalTunnel Release.J Neurol Surg A Cent Eur Neurosurg. 74:393-9. [crossref]
  28. Heybeli, Kutluhan S, Demirci S, Kerman M , Mumcu EF.(2002). Assessment of outcome of carpal tunnel syndrome: a comparison of electrophysiological findings and a self-administered boston questionnaire. Journal of Hand Surgery.27B: 3: 259-264.

Effect of Bifenthrin and Reduced Salinity Exposure on Larval Sheepshead Minnows (Cyprinodon variegatus) and Grass Shrimp (Palaemon pugio)

DOI: 10.31038/AFS.2022453

Abstract

In 2016 America’s coastal counties were home to more than 40 percent of the total population despite accounting for less than 10 percent of the country’s landmass. Large-scale changes in land use lead to proportional increases in impervious ground cover, ultimately resulting in increased input of stormwater runoff into adjacent waterways. Stormwater runoff reduces salinity and increases contaminant loads as rainwater washes pollutants, including pesticides such as bifenthrin, into receiving waters. The present study examined bifenthrin toxicity and the potential combined effect of reduced salinity for larval sheepshead minnows (Cyprinodon variegatus) and grass shrimp (Palaemon pugio). LC50 values were established in salinities of 20, 10, and 5 psu as 0.431, 0.415, 0.377 µg/L and 0.00650, 0.00640, 0.000109 µg/L for larval C. variegatus and P. pugio, respectively. Salinity did not significantly affect bifenthrin toxicity to larval C. variegatus, but mortality rates increased to 90% when larval P. pugio were exposed to 0.0015 µg/L of bifenthrin in 5 psu compared to 20 psu. Given that stormwater input is increasing as a result of increasing impervious cover, it is critical to understand how exposure to bifenthrin in low-salinity regimes affects estuarine organisms.

Keywords

Pesticides, Bifenthrin, Fish, Crustaceans, Toxicity, Salinity, Tidal creeks, Runoff

Introduction

Impervious surface, a result of urbanization, reduces rainwater infiltration and promotes runoff which accelerates input of sediments, microplastics, metals, pesticides, fertilizers, and bacteria into surface waters [1-3]. A study from 2001 found that pesticides are pervasive in waterways nationwide, with at least one pesticide found in more than 95% of streams sampled and in about 85% of fish sampled [4]. The influx of contaminants such as pesticides often result in habitat degradation and impaired ecosystem functions [5,6]. Impervious cover has also been directly linked with ecosystem effects including changes to community structure, a decline in density, as well as reduced species diversity [2,5,7,8].

Pyrethroids currently account for more than 25% of world-wide insecticide use and are widely applied to crops, turf, golf courses, lawns and home gardens in the U.S. [9,10]. Bifenthrin ((2-methyl-1, 1-biphenyl-3-yl)-methyl-3-(2-chloro-3, 3, 3-trifluoro-1-propenyl)-2,2-dimethylcycloprpanecarboxylate) is a fourth generation synthetic pyrethroid insecticide. The use of bifenthrin has increased in the last 20 years as a result of bans on pesticides such as DDT, the establishment of the Federal Clean Water Act, which mandates the reduced use of organophosphate insecticides, as well as the increased effectiveness and stability of this new insecticide [9]. However, with greater photostability and insecticidal efficacy than previous generations of pyrethroids, bifenthrin has the potential to be more toxic to non-target species [11,12].

More than one million pounds of bifenthrin was used agriculturally in the U.S. in 2016, mainly applied to corn, soy, cotton, and orchards [13]. There has also been an increasing trend in urban applications of bifenthrin [14]. Urban applications of bifenthrin in the Central Valley of California were reported at 45,000 pounds, over double that of agricultural applications at 20,000 pounds, in California in 2005 [15]. Additionally, pesticide use by acre on golf courses has been reported as equivalent as or greater than use on agricultural crops [16].

Bifenthrin is currently one of the most frequently detected contaminants in California surface waters in areas of urban and agricultural land development [17,18]. Reported surface water concentrations of bifenthrin ranged from 0.005 to 3.79 μg/L (parts per billion – ppb) and bottom and suspended sediment concentrations have been reported in the range of 1.2 to 437 ng/g (ppb) dry weight. The 96-hour LC50 (estimated concentration in which fifty percent of the test organisms die) for rainbow trout, bluegill sunfish, sheepshead minnow, and mysid was 0.15, 0.35, 17.8, and 0.00397 μg/L (ppb), respectively [19-21].

In general, pyrethroid pesticides, like bifenthrin, have octanol/water partition coefficient (log Kow) values of 5 to 7 and, therefore, partition into the organic carbon fraction of sediments. Although sediment sequestration may lead to confinement in areas of application, pyrethroids are often transported into surface waters via runoff, moving with suspended sediments and dissolved organic matter [22,23]. Additionally, these hydrophobic compounds can become stored in creek-bed sediments to later become resuspended as runoff increases turbidity [18]. Beyond entering waterways via runoff, spray drift, and release of agricultural tailwater also contribute to pyrethroid contamination [22,24,25].

The primary mechanism of pyrethroid toxicity is interference with sodium channel polarization in synaptic nerve terminals [26]. Effectively, this interaction simulates neurotransmission when there is none, causing spastic activity followed by paralysis [20,26]. Additionally, pyrethroids have been shown to inhibit ATPase enzyme production [27]. As pyrethroids impede the ATPase enzyme the critical concentration gradient built to maintain ionic balance and osmoregulation is degraded [27]. Sublethal toxicity has also been reported in organisms exposed to pyrethroids, including altered behavior, reduced growth, immune system effects, endocrine/reproductive effects, histopathological effects, as well as biochemical responses [28-30].

Beyond increased contamination, stormwater runoff as a result of increased impervious cover can also unpredictably and rapidly reduce salinity, with reported drops greater than 26 psu in less than 6 hours [31,32]. While estuarine species have mechanisms to cope with predictable environmental variability (such as tidal phases and seasonal conditions) the rapid and unpredictable effects of stormwater runoff can have serious implications for the biological communities of receiving waterways [1,33]. Numerous studies have demonstrated that reduced salinity can have vastly negative impacts on planktonic larval organisms, including decreased rates of yolk sac absorption, growth, development of feeding apparatus, respiratory tissues, and mortality [1,34-37].

Chemical toxicity may intensify salinity stress, causing an increase in sublethal and lethal effects. In fact, chemical toxicity in combination with salinity stress has been attributed to decreased physiological functions, specifically in the physiological pathways that are responsible for contaminant metabolism and detoxification [38]. Salinity has also been shown to affect biotransformation rates and toxicity for several classes of chemicals [38]. It has been reported that salinity generally decreases water solubility and increases Kow values for pesticides [39]. The water solubility of bifenthrin has been reported as <1 mg/L, with reported log Kow in deionized water as 6.27 ± 0.16, and with 6.78 ± 0.04 in seawater (35 psu) [12,20]. These data suggest that salinity should be considered when bifenthrin toxicity estimates are made for estuarine organisms.

Two abundant, widely distributed, euryhaline, common estuarine test organisms, the grass shrimp, Palaemon pugio, and the sheepshead minnow, Cyprinodon variegatus, in their larval stages, were selected for the current study [40]. Grass shrimp are generalist foragers that may feed as primary or secondary consumers and play a key role in coastal nutrient cycling as detritivores [40]. Additionally, P. pugio are an important prey item for numerous commercially and recreationally important estuarine species [40,41]. Larval P. pugio are approximately 2.6 mm at hatching and subsequently undergo a multistage larval development period that can take from 11 days to several months [42]. Planktonic larvae feed on other zooplankton, phytoplankton, and detritus [40]. South Carolina grass shrimp tolerate salinities from nearly freshwater to full strength seawater, and those collected from low salinity sites were of smaller size than those from higher salinity waters. Ultimately, salinities between 20 and 25 psu are optimal for larval development [40].

C. variegatus can live in ambient salinities ranging from 0 psu to greater than 140 psu but a preference for salinities near or less than 20 psu has been documented [43,44]. They feed mostly on plant matter, algae, detritus, mosquito larvae, and smaller fish [45,46]. Sheepshead minnows serve as an important link in the food chain as a source of nutrient cycling and as prey for larger commercially and recreationally important species such as the spotted sea trout, red drum, Atlantic croaker, turtles, and wading birds [41]. Fertilized C. variegatus eggs incubate for 4 to 12 days before planktonic larvae of ~4 mm hatch [45]. Larval C. variegatus feed on other zooplankton, phytoplankton, and detritus [45,46].

To mitigate negative effects of bifenthrin on natural communities, it is imperative to examine how bifenthrin affects survival rates of important estuarine species. Standard toxicity bioassays, conducted under laboratory conditions, may not be predictive of how changing environmental conditions such as salinity may alter the chemical toxicity of these compounds. The current study sought to evaluate the impacts of acute salinity reduction in combination with bifenthrin exposure on larval estuarine species by using C. variegatus and P. pugio as model species.

As part of a SC Department of Natural Resources study examining the relationship between urbanization and salinity profiles in estuarine tidal creeks, sediment samples were collected from the same tidal creek sites and analyzed for bifenthrin contamination. The measured field concentrations are reported herein and compared to the laboratory-derived toxicity thresholds to assess relative risk to larval estuarine organisms.

Materials and methods

Animal Acquisition and Holding

Sheepshead minnows, Cyprinodon variegatus, collected from a tidal pond on the Fort Johnson campus (32° 44’ 53.60” N; 79° 54’ 4.45” W) were acclimated and maintained in laboratory conditions of recirculating filtered, aerated seawater at 25°C, 20 psu salinity, and a 16-hour light: 8-hour dark photoperiod. Brooding groups of 2-3 males and 4-6 females were placed in spawning chambers within 75-L aquaria. Adult fish were fed once daily with TetraminVR flake food. Fish eggs collected every day were placed in 20 psu aerated seawater, examined on a light box for hatching events, and hatched larvae were counted, separated, held in aerated 20 psu seawater, and fed daily with Artemia.

Adult grass shrimp, Palaemon pugio, were collected from Leadenwah Creek, Wadmalaw Island, South Carolina (32° 38’ 51.00” N; 80° 13’ 18.05” W). Shrimp were acclimated and maintained in 75-L aquaria with aerated, 25°C, 20 psu seawater, and a 16-hour light: 8-hour dark photoperiod. Adult shrimp were fed once daily with TetraminVR flake food. Gravid female shrimp were separated, held in hatching chambers containing 20 psu aerated seawater, and examined daily for hatching events. Chambers were removed after hatching event. Larvae were counted, separated, held in aerated 20 psu seawater and fed daily with Artemia.

Seawater Processing

Seawater collected from Charleston Harbor (32° 45’ 11.52” N; 79° 53’ 58.31” W) was allowed to settle, polished via a sand filtration unit, UV sterilized, and filtered again with 5 μm nominal filtration. The polished seawater was subsequently pumped through a 10 μm carbon filtration before being diluted to 20 psu with deionized water. All water used for testing was additionally pumped through a sterile 0.22-μm filter.

Larval Aqueous Assay

Range finder tests were conducted with both species to determine the definitive test concentrations. A 96-hour aqueous static-renewal toxicity test was conducted to determine the LC50 of bifenthrin in 20, 10, and 5 psu filtered seawater for C. variegatus and P. pugio. All testing started within 48 hours of hatching. Fish and shrimp larvae were fed Artemia prior to testing and at each 24-hour renewal during the 96-hour test. Stock solutions of bifenthrin were made using pesticide-grade acetone and the final acetone concentration in all treatments and the seawater control was 0.1%. Each species was tested using 5 nominal concentrations of bifenthrin plus a control (0.00 μg/L); 0.17, 0.25, 0.37, 0.56, 0.84 μg/L for the C. variegatus assay, and 0.0015, 0.0025, 0.0045, 0.0065, and 0.016 μg/L in the P. pugio assay; at each of the three salinities (20, 10, and 5 psu). Three replicate beakers were loaded with 400 mL of seawater dosed with bifenthrin at the target exposure concentration. Larvae (24-48 h old) were taken through a step-wise reduction in salinity. Individuals were allowed to acclimate in a glass finger bowl containing 20 psu water for 90 minutes before being transferred to 15 psu seawater. This process of 90-minute acclimation followed by a transfer into filtered seawater reduced by 5 psu was repeated until the desired exposure concentration was reached (20, 10 or 5 psu). All larvae were transferred each time regardless of salinity reduction to account for any handling stress. After salinity acclimation was complete, 10 larvae were added to each replicated beaker. Beakers were covered with clean foil and aerated through a hole in the foil using a sterile glass pipette tip. Beakers were randomly distributed in an incubator maintained at 25°C and a16-hour light: 8-hour dark photoperiod. Every 24 hours the water was renewed in the same process as above. Temperature, salinity, pH, and dissolved oxygen values were recorded, and each individual was assessed for survival and survivors were transferred to the renewed beaker.

Tidal Creek Sediment Sampling

Tidal creeks in the greater Charleston area were analyzed in ArcGIS Pro using National Land Cover Data, NOAA Coastal Change Analysis Program land use data, and digital elevation models. Four tidal creeks, Guerin Creek, Seaside Creek, Toomer Creek, and Dupont-Wappoo Creek, with similar watershed area and creek volume but representing a range of development and impervious cover within the watershed were selected. Guerin Creek is the most natural creek with less than 1% impervious cover and development, Seaside and Toomer Creek watersheds have roughly 11% impervious cover and 25.9% and 30.2% of land development respectively. Dupont-Wappoo Creek watershed is the most urbanized with about 64% of the watershed developed and around 36% impervious cover. Within each creek four sampling sites were distributed along the length of the creek, from headwaters to the mouth, with the exception of Guerin Creek, where a site in each branch of the headwaters was selected (Figure 1). In late September, bottom sediment samples were collected at each site using a pre-cleaned stainless steel 0.04 m2 Young grab. A sample was also collected from the Leadenwah Creek control site where P. pugio were collected for testing. The surficial sediment (top ~3 cm) was homogenized and placed in a pre-cleaned container and stored on ice while in the field. Samples were stored at -40°C until analytical chemistry was conducted.

fig 1

Figure 1: Satellite image of creeks sampled with watershed boundaries and collection sites marked

Analytical Chemistry

Sediment samples collected from each segment of the study site tidal creeks and one sample collected from the reference creek (Leadenwah Creek) were analyzed for a suite of pyrethroid insecticides, including bifenthrin, using accelerated solvent extraction. Sediment samples were weighed (~10 g) and mixed with anhydrous sodium sulfate in a mortar bowl to remove water from the sample. The samples (including method blanks and reference spikes) were transferred to stainless steel ASE cells, spiked with a suite of isotopically labeled internal standards, and extracted with 100% dichloromethane (DCM). Sulfur was removed from the sample extracts using coiled copper strands activated with ~10% hydrochloric acid. Residual water was removed by filtering the sample extract through additional anhydrous sodium sulfate after which the sample was then concentrated to 0.5 mL using TurboVap II Concentration Workstation (40°C, nitrogen at 14 psi). Concentrated samples were cleaned up using activated carbon and alumina solid phase extraction. Eluents were concentrated to 0.5 mL and solvent-exchanged to hexane. Samples were run on an Agilent 6890/5973 gas chromatograph mass spectrometer using a programmable temperature vaporizer inlet connected to a DB-XLB analytical column (30 m x 0.25 mm x 0.25 µm). The mass spectrometer was operated using electron impact and selected ion monitoring modes. Sample chromatograms were analyzed using MSD Chemstation software (ver. E.02.02.1431). An eight-point calibration curve (0. 5-100 ng) was run prior to running samples; r2 values for all analytes of interest were at least 0.995. The method detection limit (MDL) was calculated according to Ragland et al. [47] detectable concentrations of bifenthrin were reported in ng/g dry weight concentrations.

Data Analysis

Two-way analysis of variance with interaction was used to determine significant differences among treatments (RStudio, PBC, Boston, MA). Dunnett’s test was used to assess treatment differences from the control and to determine no observable effects concentration (NOEC) and lowest observable effects concentration (LOEC) values. Median lethal concentration (LC50) values with a 95% confidence interval were determined using nominal chemical concentrations (SAS Probit Analysis, PROC PROBIT, SAS V.9.1.3, Cary, NC). Significant differences (α=0.05) in toxicity thresholds among salinity treatments and between species was determined using the LC50 ratio test [47].

Results and discussion

Cyprinodon variegatus Aqueous Assay

Changes in salinity alone did not significantly affect C. variegatus survival (p value=0.1633) (Figure 2). Results from a two-way analysis of variance with interaction revealed that bifenthrin concentration was the only factor that significantly affected mortality (Table 1). Less than 10% mortality was observed in the 5, 10, and 20 psu control treatments. The LOEC was 0.37 μg/L bifenthrin at all salinity exposures (Table 2). The NOEC was 0.25 μg/L bifenthrin at all salinity exposures. There was 100% mortality in the highest bifenthrin treatment of 0.84 μg/L for all salinity treatments. The 96-hour LC50 values for the 20, 10, and 5 psu salinity treatments were determined to be 0.432 μg/L (95% CI=0.381-0.484); 0.415 μg/L (95% CI=0.367-0.463), and 0.377 μg/L (95% CI=0.337-0.414), respectively (Table 2). These values are in the range of a previously reported LC50 of 0.47 μg/L for larval sheepshead minnows [48]. Previously published bifenthrin LC50 values for adult sheepshead minnows include 17.8 μg/L and 19.8 μg/L [21,30,49-51]. Greater larval sensitivity is often attributed to higher surface-area-to-volume ratio, underdeveloped fat stores that could sequester lipophilic compounds, and immature immune systems and organs that are important for detoxification and elimination of toxicants [52]. The threshold of toxicity and lack of significant effect due to reduced salinity is not surprising for C. variegatus. This species has been reported as a notably hardy organism able to survive in salinities ranging from 0 to 140 psu [43,44,53].

fig 2

Figure 2: Cyprinodon variegatus mean percent mortality at each bifenthrin treatment and salinity exposure. For each salinity exposure, significant differences in percent mortality from the respective control (p value <0.05) are indicated with an asterisk.

Table 1: Cyprinodon variegatus two-way analysis of variance with interaction

Response: Mortality rate

Sum squared

Df

F value

Pr (>F)

Salinity

226

2

1.906

0.1633

Bifenthrin Dose

77009

5

259.906

< 0.0001*

Salinity: Bifenthrin Dose

1019

10

1.7187

0.1140

Residuals

2133

36

Table 2: C. variegatus median lethal concentration (LC50), 95% confidence intervals, lowest observable effects concentration (LOEC), no observable effects concentration (NOEC). There were no significant differences in LC50 values at the different test salinities (LC50 ratio test p>0.05).

Salinity

LC50 (μg/L)

95% CI (μg/L)

LOEC (μg/L)

NOEC (μg/L)

20 psu

0.431

0.381-0.484

0.37

0.27

10 psu

0.415

0.367-0.463

0.37

0.27

5 psu

0.377

0.337-0.414

0.37

0.27

Palaemon pugio Aqueous Assay

There was no mortality observed in the 5, 10, and 20 psu control treatments for the P. pugio 96-hour assay (Figure 3). However, 90% mortality was observed in the lowest bifenthrin treatment of 0.0015 μg/L in 5 psu. Results from a two-way analysis of variance with interaction revealed that salinity and bifenthrin dose both significantly affected mortality (p-values <0.0001) and there was a significant interaction between the two variables (Table 3). LOEC values were 0.0065 μg/L at 20 psu, 0.0045 μg/L at 10 psu, and 0.0015 μg/L at 5 psu. NOEC values were 0.0045 μg/L for 20 psu, 0.0025 for 10 psu, and <0.0015 at 5 psu (Table 4). There was 100% mortality in the highest bifenthrin treatment of 0.016 μg/L for all salinity treatments (Figure 3). The 96-hour LC50 values for the 20, 10, and 5 psu salinity treatments were determined to be 0.00650 μg/L (95% CI=0.00637-0.00664); 0.00646 μg/L (95% CI=0.00639-0.00652), and 0.000109 μg/L, respectively (Table 4). Due to the high mortality rates in every bifenthrin concentration tested at 5 psu, 95% confidence intervals could not be calculated. A ratio test comparing the LC50 values revealed no statistically significant difference between 20 and 10 salinity treatments (p=0.9660). Although the lack of confidence intervals in the 5 psu treatment prohibited running a ratio test, salinity clearly affected the mortality rates for larval P. pugio, with the LC50 at 20 psu calculated to be 65 times higher than at 5 psu. The 96-hour LC50 of 0.0065 μg/L in 20 psu found in this study was lower than a previously published 96-hour LC50 value of 0.013 μg/L for larval P. pugio [30] but was consistent with the LC50 of 0.0056 μg/L reported by [48]. While there was no significant difference in mortality between the 20 psu and 10 psu treatment, a marked increase in grass shrimp mortality occurred in the 5 psu treatments. In fact, there was over 90% mortality in the lowest bifenthrin concentration of 0.0015 μg/L at 5 psu compared to less than 10% mortality at the same concentration in the 20 psu salinity exposure.

fig 3

Figure 3: Palaemon pugio mean percent mortality at each bifenthrin treatment and salinity exposure. For each salinity exposure, significant differences in percent mortality from the respective control (p value <0.05) are indicated with an asterisk.

Table 3: P. pugio two-way analysis of variance with interaction

Response: Mortality rate

Sum squared

Df

F value

Pr (>F)

Salinity

16411

2

49.233

<0.0001*

Bifenthrin Dose

56622

5

67.947

<0.0001*

Salinity: Bifenthrin Dose

10900

10

6.54

<0.0001*

Residuals

6000

36

Table 4: P. pugio median lethal concentration (LC50), 95% confidence intervals, lowest observable effects concentration (LOEC), no observable effects concentration (NOEC). A ratio test comparing the LC50 values revealed no statistically significant difference between 20 and 10 salinity treatments (p=0.966). Although the lack of confidence intervals in the 5 psu treatment prohibited running a ratio test, salinity clearly affected the mortality rates for larval P. pugio, with the LC50 at 20 psu calculated to be 65 times higher than at 5 psu.

Salinity

LC50 (μg/L)

95% CI (μg/L)

LOEC (μg/L)

NOEC (μg/L)

20 psu

0.006500

0.006367-0.006635

0.0065

0.0045

10 psu

0.006459

0.006395-0.006523

0.0045

0.0025

5 psu

0.000109

*

0.0015

<0.0015

*Unable to calculate confidence interval

Larval grass shrimp were two orders of magnitude more sensitive than the larval sheepshead minnows to bifenthrin, an expected result based on previously reported LC50 values for these organisms [30,48]. While salinity did not significantly affect bifenthrin toxicity in the sheepshead minnow, the grass shrimp LC50 value for bifenthrin decreased 65-fold for shrimp tested at 20 psu compared to 5 psu. These findings clearly suggest species-specific interactions, increased toxicity with reduced salinity for grass shrimp, and potential sublethal effects due to combined salinity and chemical stress.

Tidal Creek Pyrethroid Contamination

Detectable levels of bifenthrin were found only in the two watersheds; these watersheds had the highest levels of impervious cover. Dupont Wappoo Creek, within the most developed watershed sampled, returned dry mass concentrations of 16.79, 2.23, 1.39, and 2.40 ng/g bifenthrin, at collection site, 1, 2, 3, and 4, respectively, decreasing in concentration from headwater to mouth of the creek (Figure 4). These concentrations are within the range of previously measured bifenthrin concentrations from sediments sampled in an agriculturally influenced creek in California, reporting values from 1.2 ng/g to 437 ng/g [54]. Sediment from sites 3 and 4 in Toomer Creek had bifenthrin concentrations of 0.479 and 0.155 ng/g, respectively (Figure 4). No pesticides were detected in the sediment sampled from the reference site where the shrimp were collected.

fig 4

Figure 4: Bifenthrin concentrations (ng/g dry mass) measured in Charleston area tidal creek sediments. Each creek was sampled along a transect from headwater (site 1) to mouth (site 4). Bifenthrin was not detected (<MDL of 0.06-0.17 ng/g) in Guerin Creek or Seaside Creek.

Evaluation of Risk

Given the toxic effect of bifenthrin on aquatic organisms, and the lack of studies examining the interaction between salinity and bifenthrin, ecological impacts of bifenthrin have likely been underestimated. This is the first ecotoxicology study to examine salinity impacts on bifenthrin toxicity in larvae of estuarine ecosystems. This study, among others, demonstrated that the larval stages of two important estuarine species, C. variegatus and P. pugio, are sensitive to acute bifenthrin exposure. Field measurements of aquatic bifenthrin concentrations reported in California exceed previously and currently reported LC50 values [10,15,55]. Current estimated environmental concentrations for bifenthrin range from 0.005 μg/L to 19.5 μg/L in water samples and 0.155 ng/g to 437 ng/g in sediment samples, and concentration may fluctuate based on localized application patterns and impervious ground cover [55,56]. The LC50 values determined for larval C. variegatus and P. pugio at the standard test salinity of 20 psu were 40x and 2500x lower, respectively, than the maximum sediment concentration measured in this study. Compared to the reported surface water concentrations that range from 0.01 to 3.79 μg/L for bifenthrin, the LC50 value determined for larval P. pugio at the standard test salinity of 20 psu was below published concentrations, and the LC50 value determined for larval C. variegatus at the standard test salinity of 20 psu was below three published values [21,57-60]. This indicates significant risk to larval fish and shrimp from bifenthrin at environmentally relevant concentrations. The additional decrease in toxicity thresholds established for grass shrimp at lower salinities further increases their risk for bifenthrin-related mortality during storm water runoff events.

Conclusion

The present study found that bifenthrin was toxic to larval C. variegatus, and larval P. pugio with laboratory 96-hour aqueous LC50 values, in the standard testing salinity of 20 psu, of 0.431 μg/L and 0.0065 μg/L, respectively. Also noting a statically significant increase in mortality was observed in all bifenthrin concentrations in 5 psu for larval P. pugio. However, salinity did not significantly affect toxicity of bifenthrin to C. variegatus. These findings suggest that the toxicity of bifenthrin and the influence of combined salinity stress may vary significantly by species and life stage.

Additionally, bifenthrin concentrations ranging from 0.155 to 0.479 ng/g (dry wt.) were measured in South Carolina tidal creek sediments. Bifenthrin concentrations were highest in sediments with the highest level of anthropogenic development near the creek.

Further it must be considered that salinity drops greater than 26 psu in 24 hours have been recorded in South Carolina tidal creeks after rain events. This freshwater inundation induces salinity stress on the organisms in the receiving waters and reduces salinity to potentially lethal ranges for larval P. pugio. Simultaneously, the salinization of fresh inland waters, as a result of anthropogenic pressures, has been increasingly reported [61-64]. The present study substantiates the need to take salinity into account when performing toxicity assays and conducting pesticide risk assessments.

Acknowledgements

The authors wish to thank South Carolina Sea Grant and SC Department of Natural Resources for graduate research funding and providing tidal creek project data through SC DNR Project #R/CG-4. They also wish to thank Craig Plante and William Roumillat for experimental advice; Pete Key and Cameron Collins for lab assistance; Blaine West for animal collection; Ed Wirth and Brian Shaddrix for assistance with chemical analysis. Fish bioassay protocols were approved by the College of Charleston Institutional Animal Care and Use Committee (IACUC-2019–014). The NOAA, National Ocean Service (NOS) does not approve, recommend, or endorse any proprietary product or material mentioned in this publication.

Statements and Declarations

Funding

The authors declare that no funds, grants, or other support were received during the preparation of this manuscript.

Competing Interests

The authors report there are no competing interests to declare.

Author Contributions

All authors contributed to the study conception and design. Material preparation, data collection and analysis were performed by Breanne Y. Hanson, Katy W. Chung and Emily C. Pisarski. The first draft of the manuscript was written by Breanne Y. Hanson and all authors commented on previous versions of the manuscript. All authors read and approved the final manuscript.

Data Availability Statement

The data that support the findings of this study are available from the corresponding author (Katy W. Chung) upon reasonable request.

References

  1. Alderdice DF, Velsen FPJ (1971) Some Effects of Salinity and Temperautre on Early Development of Pacific Herring (Clupea pallasi). J Fish Res Board Canada 28: 1545-1562.
  2. Anderson G (1985) Species Profiles: Life Histories and Environmental Requirements of Coastal Fishes and Invertebrates (Gulf of Mexico)–grass shrimp.
  3. Amweg EL, Weston DP, Ureda NM (2005) Use and Toxicity of Pyrethroid Pesticides in the Central Valley, California, USA. Environ Toxicol Chem 24: 966-972. [crossref]
  4. Arnold CL, Gibbons CL (1996) Impervious Surface Coverage: The Emergence of a Key Environmental Indicator. J Am Plan Assoc 62: 243-258.
  5. Bacey J, Spurlock F, Starner K, Feng H, Hsu J, et al. (2005) Residues and Toxicity of Esfenvalerate and Permethrin in Water and Sediment, in Tributaries of the Sacramento and San Joaquin Rivers, California, USA. Bull Environ Contam Toxicol 74: 864-871. [crossref]
  6. Beggel S, Werner I, Connon RE, Geist JP (2010) Sublethal Toxicity of Commercial Insecticide Formulations and Their Active Ingredients to Larval Fathead Minnow (Pimephales promelas). Sci Total Environ 408: 3169-3175. [crossref]
  7. Bilkovic D, Roggero M (2008) Effects of Coastal Development On Nearshore Estuarine Nekton Communities. Mar Ecol Prog Ser 358: 27-39.
  8. Blood ER, Vernberg FJ (1992) Characterization of the Physical, Chemical and Biological Conditions and Trends in Winyah Bay and North Inlet Estuaries: 1970-1985. South Carolina Sea Grant Consort.
  9. Budd R, Bondarenko S, Haver D, Kabashima J, Gan J (2007) Occurrence and Bioavailability of Pyrethroids in a Mixed Land Use Watershed. J Environ Qual 36: 1006-1012. [crossref]
  10. Clark JM, Matsumura F (1982) Two Different Types of Inhibitory Effects of Pyrethroids on Nerve Ca and Ca + Mg-Atpase Activity in the Squid, Loligo pealei. Pestic Biochem Physiol 18: 180-190.
  11. Cuomo A (1991) Toxic Fairways: Risking Groundwater Contamination From Pesticides On Long Island Golf Courses, Office of the Attorney General, Environmental Protection Bureau: New York, NY.
  12. DeLorenzo ME, Eckmann CA, Chung KW, Key PB, Fulton MH (2016) Effects of Salinity on Oil Dispersant Toxicity in the Grass Shrimp, Palaemonetes pugio. Ecotoxicol Environ Saf 134: 256-263. [crossref]
  13. DeLorenzo ME, Serrano L, Chung KW, Hoguet J, Key PB (2006) Effects of the Insecticide Permethrin on Three Life Stages of the Grass Shrimp, Palaemonetes pugio. Ecotoxicol Environ Saf 64: 122-127.
  14. Dunson WA, Paradise CJ, Dunson DB (1998) Inhibitory Effect of Low Salinity on Growth and Reproduction of the Estuarine Sheepshead Minnow, Cyprinodon variegatus. Copeia 1998:235.
  15. Fecko A (1999) Environmental Fate of Bifenthrin. Environmental Monitoring and Pest Management Branch, Department of Pesticide Regulation: Sacramento, CA.
  16. Floyd W (1977) The Effects of Temperature and Salinity on the Larval Development of the Grass Shrimp Palaemonetes pugio Reared in the Laboratory. Virgina J Sci 28.
  17. Gan J (2008) Synthetic pyrethroids : occurrence and behavior in aquatic environments. American Chemical Society: Washington, DC.
  18. Gilliom RJ (2001) Pesticides in the Hydrologic System – What Do We Know and What’s Next? Hydrol Process 15: 3197-3201.
  19. Haney DC (1999) Osmoregulation in the Sheepshead Minnow, Cyprinodon variegatus: Influence of a Fluctuating Salinity Regime. Estuaries 22: 1071-1077.
  20. Harper HE, Pennington PL, Hoguet J, Fulton MH (2008) Lethal and Sublethal Effects of the Pyrethroid, Bifenthrin, on Grass Shrimp (Palaemonetes pugio) and Sheepshead Minnow (Cyprinodon variegatus). J Environ Sci Heal – Part B 43: 476-483. [crossref]
  21. Herkovits J, Cardellini P, Pavanati C, Perez-Coll CS (1997) Susceptibility of Early Life Stages of Xenopus laevis to Cadmium. Environ Toxicol Chem 16: 312-316.
  22. Hildebrand SF (1919) Notes on the Life History of the Minnows Gambusia affinis and Cyprinodon variegatus. Bureau of Fisheries: Washington, DC.
  23. Hladik ML, Kuivila KM (2008) Occurrence of Pyrethroids in Bed and Suspended Sediments in California. J Am Chem Soc 46: 55-71.
  24. Holland AF, Sanger DM, Gawle CP, Lerberg SB, Santiago S, et al. (2004) Linkages Between Tidal Creek Ecosystems and the Landscape and Demographic Attributes of Their Watersheds. J Exp Mar Bio Ecol 298: 151-178.
  25. Hunt JW, Anderson BS, Phillips BM, Tjeerdema RS, Richard N, et al. (2006) Spatial Relationships Between Water Quality and Pesticide Application Rates in Agricultural Watersheds. Environ Monit Assess 121: 245-262. [crossref]
  26. Hutchinson TH, Solbe J, Kloepper-Sams PJ (1998) Analysis of the ECETOC Aquatic Toxicity (EAT) Database. III – Comparative Toxicity Of Chemical Substances To Different Life Stages Of Aquatic Organisms. Chemosphere 36: 129-142.
  27. Mohammed A (2013) Why are Early Life Stages of Aquatic Organisms more Sensitive to Toxicants than Adults? New Insights into Toxicity and Drug Testing.
  28. Johnson W (1974) Morphological Variation and Local Distribution of Cyprinodon variegatus in Florida. Retrosp Theses Diss 191.
  29. Kelley K, Starner K (2004) Preliminary Results For Study 219: Monitoring Surface Waters and Sediments of the Salinas and San Joaquin River Basins for Synthetic Pyrethroid Pesticides, Sacramento, CA, 2004.
  30. Key P, Chung K, Collins C, DeLorenzo M (2020) Toxicity of Common Environmental Contaminants on Two Estuarine Species Following Multi-Stressor Impacts, Gulf of Mexico Oil Spill and Ecosystem Science Conference, Tampa, FL. February 3-6, 2020.
  31. Kilby JD (1955) The Fishes of Two Gulf Coastal Marsh Areas of Florida. Tulane Study Zool 2: 175-247.
  32. Krebs JM, McIvor CC, Bell SS (2014) Nekton Community Structure Varies in Response to Coastal Urbanization Near Mangrove Tidal Tributaries. Estuaries and Coasts 37: 815-831.
  33. Kuivila KM, Hladik ML, Ingersoll CG, Kemble NE, Moran PW, et al. (2012) Occurrence and potential sources of pyrethroid insecticides in stream sediments from seven U.S. metropolitan areas. Environ Sci Technol 46: 4297-4303. [crossref]
  34. Laskowski DA (2002) Physical and Chemical Properties of Pyrethroids. Rev Environ Contam Toxicol 174:49–170. [crossref]
  35. LeBlanc LA, Orlando JL, Kuivila KM (2004) Pesticide Concentrations in Water and in Suspended and Bottom Sediments in the New and Alamo Rivers, Salton Sea Watershed, California, April 2003: S. Geological Survey Data Series 104.
  36. Lerberg SB, Holland AF, Sanger DM (2000) Responses of Tidal Creek Macrobenthic Communities to the Effects of Watershed. Estuaries 23: 838-853.
  37. Lund A, Narahashi T (1981) Modification of Sodium Channel Kinetics by the Insecticide Tetramethrin in Crayfish Giant Axons. Neurotoxicology 2: 213-229. [crosssref]
  38. Meertens P (2018) Monitoring Pyrethroid Pesticides in Sediment and Stormwater Runoff in the Gabilan Creek Watershed, Monterey Co., Calif. Central Coast Regional Water Quality Control Board: San Luis Obispo, CA.
  39. Mohammed A, Halfhide T, Elias-Samlalsingh N (2009) Comparative Sensitivity Of Three Life Stages Of The Tropical Mysid, Metamysidopsis Insularis To Six Toxicants. Toxicol Environ Chem 91: 1331-1337.
  40. Oros DR, Werner, I (2005) Pyrethroid Insecticides: An Analysis of Use Patterns, Distributions, Potential Toxicity and Fate in the Sacramento-San Joaquin Delta and Central Valley, Oakland, CA.
  41. Overstreet RM, Heard, RW (1982) Food Contents of Six Commercial Fishes From Mississippi Sound. Gulf Res Reports 7: 137-149.
  42. Pattillo ME, Czapla TE, Nelson DM, Monaco ME (1997) Distribution And Abundance Of Fishes And Invertebrates In Gulf Of Mexico Estuaries, Volume II: Species Life History Summaries. ELMR Rep. No. 11, Silver Spring, MD.
  43. Ragland JM, Liebert D,Wirth E (2014) Using Procedural Blanks To Generate Analyte-Specific Limits Of Detection For Persistent Organic Pollutants Based On GC-MS. Analysis Anal Chem 86: 7696-7704.
  44. Ramos S, Amorim E, Elliott M, Cabral H, Bordalo AA (2012) Early Life Stages of Fishes as Indicators of Estuarine Ecosystem Health. Ecol Indic 19: 172-183.
  45. Richmond CE, Woodin SA (1999) Effect of Salinity Reduction on Oxygen Consumption by Larval Estuarine Invertebrates. Mar Biol 134: 259-267.
  46. Richmond C, Woodin S (1996) Short-Term Fluctuations in Salinity: Effects on Planktonic Invertebrate Larvae. Mar Ecol Prog Ser 133: 167-177.
  47. Santos RVS, Ramos S, Bonecker ACT (2017) Can We Assess the Ecological Status of Estuaries Based on Larval Fish Assemblages? Mar Pollut Bull 124: 367-375.
  48. Saranjampour P, Vebrosky EN, Armbrust KL (2017) Salinity Impacts on Water Solubility and n-Octanol/Water Partition Coefficients of Selected Pesticides and Oil Constituents. Environ Toxicol Chem 36: 2274-2280. [crossref]
  49. Siepmann S, Holm S (2000) Hazard Assessment of the Synthetic Pyrethroid Insecticides Bifenthrin, Cypermethrin, Esfenvalerate, and Permethrin to Aquatic System Organisms in the Sacramento-San Joaquin River System; California Department of Fish and Game Pesticide Investigations Unit: Rancho Cordova, CA.
  50. Smith Jr S, Cooper CM, Lizotte RE, Shields FD (2006) Storm pesticide concentrations in Little Topashaw Creek, USA. Int J Ecol Environ Sci 32: 173-182.
  51. Spurlock F, Lee M (2008) Synthetic Pyrethroids. American Chemical Society: Washington, DC 991: 3-25.
  52. Szöcs E, Coring E, Bäthe, J, Schäfer, RB (2014) Effects of Anthropogenic Salinization on Biological Traits and Community Composition of Stream Macroinvertebrates. Sci Total Environ 468-469: 943-949.
  53. TDC Environmental (2007) In Pesticides in Urban Surface Water. Urban Pesticide Use Trends Annual Report 2007; San Mateo, CA.
  54. Timpano AJ, Zipper CE, Soucek DJ, Schoenholtz, SH (2018) Seasonal Pattern of Anthropogenic Salinization in Temperate Forested Headwater Streams. Water Res 133: 8-18.
  55. Tweel A, Sanger D, Blair A, Montie E, Turner A, Leffler J (2015) Collaborative Research to Prioritize and Model the Runoff Volume Sensitivities of Tidal Headwaters. National Estuarine Research Reserve System Science Collaborative: Beaufort, SC.
  56. United States Geological Survey (2018) In Estimated Annual Agricultural Pesticide Use, Washington, DC.
  57. United States Environmental Protection Agency. (1988) Bifenthrin Technical Fact Sheet; USEPA: Washington, DC.
  58. United States Environmental Protection Agency (2009) In Pesticides – Revised Reregistration Eligibility Decision (RED) for Permethrin. Washington, DC.
  59. Ware GW (1991) In Fundamentals of Pesticides: A Self Instruction Guide. Third edition. Thompson Publications: Fresno, CA.
  60. Washburn T, Sanger, D (2011) Land Use Effects on Macrobenthic Communities in Southeastern United States Tidal Creeks. Environ Monit Assess Sep 180: 177-188. [crossref]
  61. Weston DP, Zhang M, Lydy MJ (2008) Identifying the Cause and Source of Sediment Toxicity in an Agriculture‐Influenced Creek. Environ Toxicol Chem 27: [crossref]
  62. Weston DP, You J, Lydy MJ (2004) Distribution and Toxicity of Sediment-Associated Pesticides in Agriculture-Dominated Water Bodies of California’s Central Valley. Sci. Technol 38: 2752-2759.
  63. Wheeler MW, Park RM, Bailer AJ (2006) Comparing Median Lethal Concentration Values Using Confidence Interval Overlap or Ratio Tests. Environ Toxicol Chem 25: 1441-1444. [crossref]
  64. Williams WD (2001) In Anthropogenic Salinisation of Inland Waters, in Saline Lakes, Springer: Netherlands 329-337.

Unique COVID/Anti-Spike Protein Immune Responses in Two Elderly Patients without COVID-19 Vaccination

DOI: 10.31038/MIP.2022311

Abstract

Published reports continue to emerge regarding different health outcomes in patients immunized and not immunized against the SARS-CoV-2 antigen (i.e., spike protein) that were infected with the virus. Because of the vast array of protein isoforms made from the laboratory-created SARS-CoV-2 viral genome, patients with different innate immune systems and underlying health issues responded differently upon coronaviruses/cold virus infection and re-infection. The current perspective highlights two patients during the calendar years 2020/21 and 2022, that presented with cold virus symptoms, tested positive for coronavirus antigens on lateral flow strips, developed bacterial sinus infections, were hospitalized, and treated with pooled antibody plasma. Throughout their medical sequela each patient maintained strong antibody titers against spike protein based on IgG levels in their saliva.

Keywords

Spike protein, antibody, infection, immunity, vaccination, COVID-19, mRNA vaccine

Introduction

The following article provides a perspective on two unique medical cases of male individuals that contracted severe acute respiratory syndrome coronavirus 2 (SARS-CoV-2 virus) and subsequent bacterial infections and did not receive any vaccine against the virus during the calendar years 2020-22. Both patients had underlying health issues that negatively impacted their daily activities and quality of life, and each received convalescent donor plasma enriched with anti-SARS-CoV-2 antibodies. Table 1 is a summary of their health profiles and indicates that each patient had a poor quality of health (Patient A profile described in detail at end of article).

Table 1: General Health Status of Elderly Two Male Patients

Body System – Conditions

Patient A

Patient B

Age 82 65
Cardiac High BP High BP
Metabolic Status Low-Moderate Low
Immunity Compromised Normal
Body Mass Index (BMI) 120% overweight 125% overweight
Activity/Exercise/Lifestyle Inactive/minimal Inactive/minimal
Pulmonary status Below normal Moderate
Glucose and Insulin scores Diabetic Mild Diabetic
Diet Quality Sub-optimal Sub-optimal
Stressors in Life Aging Aging, ADHD
Lifestyle drug ED medication ED medication
Inflammation Joint issues Requires joint replacement
Hormone status Low testosterone Low testosterone

One of the main findings in the article published October 2022, by Rotello et al. is that the collected saliva antibodies were easily isolated, bound robustly to spike protein (as measured using an ELISA) and were IgG hyperimmune as determined by isotyping. In addition, the patients’ antibodies recognize different isoforms of the early and mature spike protein produced from the Moderna mRNA vaccine after introduction into mammalian cells in cell culture. Each patient indicated that the COVID-19 virus behaved more like a “cold virus” and would have made it difficult to provide immunity protection and overall immunity like typical vaccines, for example, shingles, polio, and respiratory syncytial virus. Recently, a Nature paper described over 100,000 genomes of the COVID virus, demonstrating that these coronaviruses are unlike the shingles virus that rarely mutates. An additional factor is that while dipstick (lateral strip) antigen-based diagnostic tests are sensitive, they do not discriminate between different types of coronaviruses (personal communication from Moderna). In the natural environment, viruses with similar sequences exist and patients that continually self-test are faced with health decisions to treat specifically or generally with a so-called COVID specific dual-acting agent, Paxlovid. This strategy initiates a perpetual test-treat cycle, which can lead to the development of a strong economic forecast that would encourage an emergency use authorization by large pharmaceutical companies (e.g., Pfizer). This combination drug consists of a protease inhibitor that disables viral replication and a CYP3A inhibitor to prevent the drug from being inactivated. Addition of a CYP3A inhibitor is not the most efficient way to combat a respiratory virus specifically for patients that might be taking other medications whose activity is dependent on being metabolized by CYP3A [1-4]

In this mini-review, patient A has a very selective autoimmune disease, received convalescent antibodies, and still contracted the SARS-CoV-2 virus. This individual had no previous history of compromised airflow, except on excursion, which resulted in extreme shortness of breath and tiredness. Patient A was also diagnosed with Myasthenia Gravis (MG) and currently has atypical eye and nasal secretions related to MG.

Patient B has a history of health issues including severe arthritis, gout, and mild diabetes. Patient B routinely suffers from sinus infections and has had previous surgery to remove fluid from frontal sinuses. Key characteristics of both patients, which put them at risk for future infections by cold viruses, include being overweight and diabetic, inactivity, poor diet, and below normal pulmonary status. The inactivity and reduced respiratory capacity generally led to more sickness and allowed fluid to rapidly accumulate in lungs, which contributed to other issues related to cardiac output, oxygen levels, and quality of life. Another consistent finding is each male patient occasionally use erectile dysfunction medication (e.g., Viagra). The other general conclusion is vaccination does not seem to prevent severe disease or viral transmission, but symptoms from infection are determined by a patient’s overall medical history. It appears that mRNA vaccines work for a short period of time and boosters don’t appear to prime the immune system like a bona fide vaccine, which are commonly designed against the most antigenic peptide/protein and allows the subject to create strong memory B-cells and hyper-immune IgGs (personal communication, Moderna 2021). This latter approach was recently adopted by Novavax and approved for targeting COVID variants that includes the adjuvant Matrix-M extract from soapbark tree and the highly variable spike protein with its numerous post-translation modifications, including extensive glycosylation. Each patient’s saliva IgA antibodies were reactive on separate occasions to spike protein, which is one of the predominant antibody isotypes found in saliva [6].

Discussion

Patient A is a 82-year-old male who was diagnosed with COVID-19 on 1/21/2021. He has a history of gout, hyperlipidemia, diabetes mellitus, hypertension, chronic pain syndrome, myasthenia gravis, and chronic kidney disease, type III. He was admitted to an emergency room for evaluation of worsening symptoms of cough and shortness of breath attributable to COVID infection on 1/24/2021. The patient was placed on nasal cannula oxygen and started on an IV of ceftriaxone and doxycycline for bacterial pneumonia. Procalcitonin was negative. The patient met with an infectious disease specialist and was started on IVs of remdesivir, dexamethasone and convalescent plasma. Patient was weaned off oxygen and provided supportive care. Patient completed convalescent plasma transfusions on 1/26/2021. He continued to improve but continued to require nasal cannula oxygen support for hypoxemia. Inflammatory markers began to decrease. On 1/29/2021, the patient planned to receive his last dose of remdesivir and be discharged home, however, after speaking with his daughter he felt he may benefit from rehabilitation and therefore therapy teams were consulted and COVID testing was re-ordered. The repeat COVID test was negative. Infectious disease was narrowed, antibiotics IV ceftriaxone and IV doxycycline were converted to PO doxycycline for bacterial pneumonia. The patient completed all treatments for COVID virus. On 01/29/2021, the patient was discharged to short-term rehabilitation. Patient A on his final discharge report indicated that he had confirmed acute sepsis with fever and tachycardia that required hospitalization. His status/release from hospital and post remdesivir remained as acute viral pneumonia, along with acute possible bacterial pneumonia due to gram negative and gram-positive bacteria. His signs and symptoms present on admission, were acute respiratory failure, elevated D-dimer, hypertension, chronic kidney disease stage lll and Myasthenia Gravis, positive autoantibodies to acetylcholine receptor.

Patient B has fewer details in his medical report and differs from patient A in medications and underlying health issues. Patient B presented with COVID-19 in September 2020 and exhibited a number of symptoms including low grade fever, achy joints, loss of taste and smell, lots of phlegm and sinus drainage, extreme bouts of coughing mild pneumonia and severe fatigue. In bed for 10 days at home. The saliva antibodies evaluated for spike protein reactivity were obtained one month after this episode of COVID. The second bout of COVID for patient B was July 2022, however, he had no loss of taste or smell. The following is a list of medications for patient B; metformin HCL – 500 mg once a day; lisinopril-HTCZ – 20 – 25 mg 2 doses every morning; doxazosin mesylate – 4 mg 1 dose at bedtime; labetalol HCL 200 mg, twice a day, morning and bedtime; spironolactone 25 mg 1 tablet in the morning; potassium chloride 20 meq once day; amlodipine besylate 10 mg at night; magnesium 250 mg once a day; fish oil 1200 mg twice a day and Cholestoff (nature made brand) 2 tablets in the morning.

Conclusion

Patient A is currently managing his Myasthenia Gravis and pursuing enrollment in a clinical trial for a novel antibody therapy. Patient A has unique B-cells that could be used to develop high affinity humanized monoclonal antibodies to target bacteria and/or viruses. Figure 1 demonstrates that saliva from Patient A has robust antibodies that can detect spike protein made from the Moderna vaccine introduced into normal fibroblasts.

fig 1

Figure 1: This figure shows that antibodies in the saliva from Patient A recognize three high molecular proteins made from the Moderna vaccine that was introduced into normal fibroblasts. These bands are primarily the mature processed forms of the spike protein. The antibodies in patient A saliva were isotype IgG, IgA and IgM (BioRad Laboratories). Lane 10 molecular weight markers, 220 kd-14 kd, lane 2 is 10 ug, lane 3 20 ug of protein loaded. Lanes 4-9 are protein lysates at different concentrations 1, 4, 6, 8 10 and 12 ugs, at early time points after Moderna vaccine introduction into cells.

Various platforms exist in industry to isolate the B-cells from patient A, analyze their IgG genes, produce humanized antibodies against infectious disease targets, and harvest disease-specific antigens. This strategy would be like that used by Regeneron to make its REGEN-COV antibodies from Chinese patients in Wuhan during the initial COVID outbreak. The humanized antibodies from patient A may be useful in terms of targeting bacterial and viral antigens in the next coronavirus (cold virus) outbreak. Patient B very similar to patient A but has chronic inflammation and joint issues mainly within his shoulders and knees. He has had hyaluronic acid injections in his joint spaces to relieve symptoms. His most recent diagnosis recommends full knee replacement. The B-cells present within this patient would also be informative as most elderly patients with chronic health issues have inflammation that is not remedied by OTC medications. In addition, patient B has ADHD and suffers from low testosterone or andropause. The main conclusion is most subjects exposed to the coronavirus/cold virus of 2019 suffered long term side effects because of underlying health issues that impacted brain function and cardiovascular function. As with most serious health concerns, patients are at risk for survival if health issues exist that compromise quality of life [7-11].

Acknowledgement

Authors would like to thank Bradley Pauley for his laboratory management and coordination of sample acquisition and handling. Katie Schultz, for assistance with spike protein analysis and saliva antibody isotyping, she is currently a pre-PharmD student at Ohio State University.

Conflict of Interest

The authors have no conflict of interest.

References

  1. Rocco J. Rotello, Timothy D. Veenstra, Brad Pauley, Elisha Injeti (2022) In vitro Characterization of SARS-CoV-2 Protein. Medrxiv.
  2. https://eua.modernatx.com/covid19vaccine-eua/
  3. Kousathanas A, Pairo-Castineira E, Rawlik, K, et al. (2022) Whole-genome sequencing reveals host factors underlying critical COVID-19. Nature 607: 97: 103.
  4. https://www.paxlovidhcp.com/ accessed October 6, 2022.
  5. Personal Communication Moderna, September 7, 2021. Thank you for your inquiry regarding the Moderna COVID-19 Vaccine. The following information is enclosed in response to your medical inquiry. The molecular weight of the spike (S) protein that the body produces after receiving the Moderna COVID-19. Vaccine is a proprietary information that Moderna cannot release. We thank you for your understanding. We have attached the Fact Sheet for Health Care Providers Administering Vaccine (Vaccination Providers) along with the Full EUA Prescribing Information for the Moderna COVID-19 Vaccine for your information. The EUA Letter of Authorization can be found at https://eua.modernatx.com/covid19vaccine-eua/
  6. https://www.novavax.com/science-technology/coronavirus-disease-2019-covid-19 Accessed October 6, 2022.
  7. https://www.regeneron.com/pipeline-medicines/approved-medicines Accessed October 10, 2022.
  8. Alina Baum, Benjamin O Fulton, Elzbieta Wloga, Richard Copin, Kristen E Pascal al, (2020) Antibody cocktail to SARS-CoV-2 spike protein prevents rapid mutational escape seen with individual antibodies. Science Vol 369. [crossref]
  9. Richard Copin, Christos A. Kyratsous, Angel Coppola, George D.Yancopoulos, et al. (2022)The monoclonal antibody combination REGEN-COV protects against SARS-CoV-2 mutational escape in preclinical and human studies. A Cell Journal Press 148: 15.
  10. David M. Weinreich, M.D., Sumathi Sivapalasingam,D., Thomas Noton M.D., Shazia Ali, (2021) REGN-COV2, a Neutralizing Antibody Cocktail, in Outpatients with Covid-19. New England Journal of Medicine 1: 2021.
  11. Florent Besnier, Beatrice Berube, Jacques Malo, Christine Gagnon, Catherine Alexandra, et.al (2022) Cardiopulmonary Rehabilitation in Long-COVID-19 Patients with Persistent Breathlessness and Fatigue: The COVID-Rehab Study. Int J Environ Res Public Health 19:7: 4133. [crossref]

Ambivalent and Conjectural-Synovial Sarcoma

DOI: 10.31038/CST.2022734


Synovial sarcoma is a malignant, soft tissue neoplasm of uncertain histogenesis demonstrating variable epithelial differentiation. Synovial sarcoma represents as a monophasic or biphasic malignant mesenchymal neoplasm characteristically demonstrating chromosomal translocation t(X;18) (p11; q11) incriminating genes SS18 and SSX1, SSX2 or SSX4. Neoplasm displays variable morphologies as monophasic spindle-shaped cell or monophasic epithelial cell or may manifest biphasic, myxoid, ossifying and poorly differentiated variants. Characteristic morphological features emerge as monotonous spindle-shaped cells permeated with vesicular, plump and overlapping nuclei. Cellular component is intermingled with haemangiopericytoma-like vascular articulations [1,2].

Median age of disease emergence is 35 years although no age of tumour emergence is exempt, and neoplasm may be discerned up to ninth decade (Figures 1 and 2).

fig 1

Figure 1: Synovial sarcoma depicting fascicles of spindle-shaped cells with uniform, vesicular, overlapping nuclei and minimal atypia. Branching, staghorn vascular articulations appear intermingled with neoplastic component (5).

fig 2

Figure 2: Synovial sarcoma composed of intersecting bundles of spindle-shaped cells within monotonous, uniform, overlapping nuclei and few mitotic figures (6).

Around ~18% instances occur within children and adolescents. A mild male predominance is observed with male to female proportion of ~1.2:1 [1,2]. Synovial sarcoma preponderantly incriminates extremities, trunk, head and neck, intrathoracic or intra-abdominal region or may arise within diverse locations although no site of tumour emergence is exempt. Soft tissue sarcomas depicting chromosomal translocation t (X;18; p11; q11) are contemplated to be synovial sarcomas. Synovial sarcoma is posited to occur due to chromosomal translocation t(X;18) (p11; q11) incriminating genes SS18 along with SSX1, SSX2 or SSX4 [1,2].

Majority (~90%) of synovial sarcomas manifest characteristic chromosomal translocation t(X;18) (p11.2; q11) along with SYT-SSX1 genetic fusion. Besides, chromosomal translocation t(X;18) (p11.21; q11) and SYT-SSX2 genetic fusion may occur [1,2]. Synovial sarcoma frequently depicts p16INK4A genetic deletion. Enhanced expression of EZH2 differentiates poorly differentiated neoplasms from monophasic or biphasic synovial sarcoma [1,2]. Aforesaid chromosomal translocation variably influences diverse oncogenetic pathways as initiation of SWI/SNF chromatin remodelling complex, polycomb repressor complex or canonical Wnt pathway. Partners of chromosomal translocation guide epithelial differentiation.

Chromosomal translocation SS18-SSX1 is preponderantly associated with monophasic synovial sarcoma (~70%) or biphasic neoplasms (~40%) whereas translocation SS18-SSX2 is predominant within monophasic tumours (~97%) and biphasic neoplasms (~3%). Translocation SS18-SSX1 prohibits Snail gene whereas amalgamation SS18-SSX2 prohibits Slug gene [1,2]. In contrast to Slug gene, intervention within Snail gene engenders intense de-repression of E-cadherin [1,2]. Intense expression of E-cadherin and extracellular matrix protein MMP2 functions as a prerequisite for occurrence of biphasic synovial sarcoma. Of obscure aetiology and pathogenesis, synovial sarcoma is posited to arise from multipotent mesenchymal stem cells or satellite cells as immature myoblasts [1,2].

Preceding radiation therapy exceptionally induces synovial sarcoma. Neoplastic concurrence with diverse syndromes or various diseases remains undocumented [1,2].

Grossly, synovial sarcoma represents as a soft to firm, well circumscribed or infiltrative, multinodular neoplasm. Upon initial representation, tumour magnitude varies from 3 centimetres to 10 centimetres although minute lesions < 1 centimetre diameter may occur, especially upon hands and feet. Cut surface is tan, grey/white, yellow, or pink. Foci of myxoid change necrosis, calcification and metaplastic ossification may be observed [1,2]. Upon microscopy, tumefaction exhibits mild cellular and nuclear pleomorphism [1,2].

Generally, neoplasm depicts subtypes as biphasic or monophasic, spindle-shaped or epithelial cell neoplasm [1,2]. Subcategories as monophasic epithelial, calcifying, ossifying, myxoid or poorly differentiated round cell synovial sarcoma may be exceptionally delineated [1,2]. Biphasic synovial sarcoma is constituted of dual components denominated by spindle-shaped cells and gland-like configurations of epithelial cells. Glandular lumens appear permeated with mucin. Neoplastic epithelial cells depict moderate, distinct amphophilic cytoplasm with spherical to elliptical nuclei. Squamous metaplasia can exceptionally occur [1,2]. Monophasic synovial sarcoma emerges as a hyper-cellular neoplasm with an infiltrative tumour perimeter. Fascicles of tumour cells appear intermingled with minimal stroma. Focal hyalinization or myxoid change is infrequent [1,2]. Neoplastic cells are monotonous and permeated with scanty, amphophilic cytoplasm, elliptical to spindle-shaped, vesicular nuclei with uniformly disseminated chromatin and inconspicuous nuclei. Indistinct nuclear palisading with nuclei overlapping adjacent nuclei may be exemplified [1,2].

Poorly differentiated synovial sarcoma is extensively cellular and is composed of spherical cells imbued with hyperchromatic nuclei. Mitotic activity is significant. Focal calcification and necrosis may ensue. Characteristically, focal staghorn vasculature, haemangiopericytoma-like foci or branching vascular configurations simulating solitary fibrous tumour may be observed. Mast cells are frequently discerned. Commonly discerned biphasic synovial sarcoma demonstrates commingling or distinct foci of dual neoplastic components. Metastatic neoplasms depict variable predominance of epithelial and spindle cell components [1,2].

Epithelial component commonly delineates enlarged; pale, columnar epithelial cells permeated with spherical, vesicular nuclei. Alternatively, cuboidal, flattened or spindle-shaped epithelial cells may occasionally be observed [1,2]. Epithelial cells may configure glandular articulations or tubules imbued with mucin. Papillary articulations or foci of squamous differentiation may exceptionally be discerned. Mucin rich variant of synovial sarcoma is infrequent [1,2]. Spindle cell component is composed of sheets or fascicles of miniature, uniform, plump, elongated cells pervaded with scanty cytoplasm, nuclei with dark, stippled nuclear chromatin and an indistinct cellular perimeter [1,2]. Tumour nodules or myxoid foci are infrequently discerned. Characteristically, intervening stroma enunciates thick, ropy collagen bundles. Commonly, stroma circumscribes cellular tumour nodules which appear intermingled with haemangiopericytoma-like vascular articulations. Foci of calcification may arise [1,2].

Monophasic synovial sarcoma is commonly composed of pure spindle-shaped cellular component demonstrating aforesaid morphological features [1,2].

Synovial sarcoma may minimally demonstrate a singular manifestation denominated as:

  • Chromosomal translocation t (X;18; p11; q11)
  • Immune reactivity to keratin
  • Singular or multiple, aforesaid characteristic stromal features.

A pure epithelial cell component is negligibly observed (1,2). Frequently discerned nonspecific histological features occur as:

  • Cellular palisading
  • Pseudo rosettes
  • Herringbone pattern
  • Retiform or micro-cystic tumour configuration
  • Occurrence of metaplastic bone or cartilage
  • Foci of minimally enlarged cells.

Poorly differentiated synovial sarcoma may delineate a focal or pure, predominantly epithelial or mesenchymal tumour pattern [1,2].

Ultrastructural examination exhibits glandular configurations composed of epithelioid tumour cells demonstrating sparse luminal microvilli [1,2].

Staging of soft tissue sarcoma may be designated as:

  • Stage I: Tumour is miniature and low grade as GX or G1
  • Stage II: Tumour is miniature and high grade as G2 or G3
  • Stage III: Tumour is enlarged and high grade G2 or G3
  • Stage IV: Tumour dissemination into various body sites. Original tumour may be of variable magnitude (any T), any grade (any G) and may or may not demonstrate regional lymph node metastasis (any N) (2,3) (Table 1).

Table 1: Grading of non- rhabomyomatous paediatric soft tissue sarcoma as per Paediatric Oncology Group (POG) (2-3)

table 1

Synovial sarcoma is immune reactive to TLE1 and various cytokeratin wherein epithelial component is consistently immune reactive to CK7, CK8, CK14, CK18, CK19 and variably reactive to CK17, CK13, CK6 or CK16. Spindle cell component is focally and variably immune reactive to CK7, CK19, CK18, CK8, CK14, CK17 or CK20 [3,4]. Synovial sarcoma is immune reactive to epithelial membrane antigen (EMA), BCL2, β-catenin, calponin, CD99, CD56, CD57 or calretinin [3,4]. Epithelial component is comprehensively (100%) immune reactive to keratin or epithelial membrane antigen (EMA) whereas spindle cell component is immune reactive in ~80% instances [3,4]. Besides, neoplasm is immune reactive to SS18-SSX fusion specific antibody, SSX C terminus antibody or NY-ESO-1 [3,4]. Synovial sarcoma is immune non-reactive to CD34, desmin, h-caldesmon, myogenin, MyoD1, FLI1, WT1, SOX10, S100 protein or H3K27me3 [3,4].

Biphasic synovial sarcoma requires segregation from neoplasms such as adenocarcinoma, biphasic mesothelioma, glandular nerve sheath tumour, branchial analage mixed tumour or ectopic hamartomatous thymoma [3,4]. Monophasic synovial sarcoma necessitates demarcation from neoplasms as malignant peripheral nerve sheath tumour, cellular schwannoma, solitary fibrous tumour, leiomyosarcoma, spindle cell rhabdomyosarcoma, adult fibrosarcoma, dermatofibrosarcoma, protuberans with fibrosarcomatous transformation, epithelioid sarcoma, biphenotypic sinonasal sarcoma or sarcomatoid carcinoma [3,4]. Poorly differentiated synovial sarcoma mandates distinction from small round blue cell tumours as alveolar rhabdomyosarcoma, Ewing’s sarcoma, undifferentiated round cell sarcoma or Ewing-like sarcoma. Characteristic genomic modifications may be appropriately discerned upon reverse transcription polymerase chain reaction (RT-PCR). Cogent tissue sampling is mandated for confirmation of synovial sarcoma [3,4].

Corroborative tumour detection may be obtained with molecular or cytogenetic assessment for SS18-SSX genetic fusion with fluorescent in situ hybridization (FISH), reverse transcription polymerase chain reaction (RT-PCR) or next generation sequencing (NGS) [3,4]. Plain radiographs depict a site-specific spherical to elliptical, lobulated tumour mass. Incrimination of bone is infrequent [3,4]. Ossifying synovial sarcoma typically delineates spotty radio-opacities engendered due to focal calcification. Comprehensive surgical resection of neoplasm is a recommended therapeutic strategy [3,4]. Additionally, radiotherapy or adjuvant chemotherapy can be employed to manage challenging clinical scenarios as neoplasms >5 centimetre magnitude or tumours unamenable to surgical resection [3,4]. Adjuvant radiation therapy ameliorates prognostic outcomes and overall disease survival [3,4].

Neoplasms subjected to preceding radiation therapy may demonstrate moderate cellular and nuclear pleomorphism. Adjuvant chemotherapy can be beneficially adopted to treat neoplasms of advanced grade or tumours unamenable to pertinent therapy [3,4]. Agents such as ifosfamide or novel therapies as tyrosine kinase receptor inhibitor pazopanib or EZH2 inhibitor tazemetostat can be beneficially employed for therapeutic purposes. Also, T cell receptor-based immunotherapy implicating NY-ESO-1 within subjects demonstrating HLA-A*0201 is associated with clinical and radiological neoplastic melioration [3,4].

Inferior prognostic outcomes are associated with:

  • SS18-SSX1 chromosomal translocation
  • Monophasic and poorly differentiated synovial sarcoma
  • Incriminated males
  • Initial disease representation in elderly subjects
  • Tumour magnitude ≥5 centimetres
  • Neoplasm confined to centric, non-extremity sites
  • Deep seated neoplasms
  • Extensive tumour necrosis
  • Mitotic activity ≥ 10 per high power field
  • Elevated Ki67 proliferative index
  • Precise tumour grade contingent to Fédération Nationale des Centres de Lutte Contre le Cancer (FNCLCC), as defined in incriminated adults
  • Immunoreactivity to CXCR4 and IGF1R
  • Tumour discernible within resected surgical perimeter

Expression of H3K27me3 and VEGF in concurrence with histological grade and stage of neoplasm along with emergence of distant metastasis (3,4).

References

  1. Manizhe AK, Mohseni I et al. 2022 Recurrent primary intracranial synovial sarcoma, a case report and review of the literature. Clin Case Rep 10. [crossref]
  2. Eliason L, Grant L et al. 2022 Qualitative study to characterize patient experience and relevance of patient-reported outcome measures for patients with metastatic synovial sarcoma. J Patient Rep Outcomes. 6. [crossref]
  3. Fice M, Almajnooni A et al. 2022 Does synovial sarcoma grade predict oncologic outcomes, and does a low-grade variant exist? J Surg Oncol. 125: 1301-1311. [crossref]
  4. Ren MY, Li J et al. 2022 Primary orbital monophasic synovial sarcoma with calcification: A case report. World J Clin Cases 10: 1623-1629. [crossref]

The Susceptibility of South Asians to Cardiometabolic Disease as a Result of Starvation Adaptation Exacerbated During the Colonial Famines

DOI: 10.31038/EDMJ.2022621

Abstract

South Asians, representing one quarter of the world’s population, have disproportionally high rates of obesity and cardiometabolic disease thus resulting an epidemic health crisis. This crisis could be the consequence of epigenetic effects exacerbated during the colonial-era famines resulting in a unique starvation-adapted physiology. Due to evolutionary mismatch in circumstances of abundance, this starvation-adapted physiology can become harmful. Evidence for this starvation adaptation in South Asians includes high body fat and unfavorable adipokines; low lean body mass; lower resting energy expenditure (compounded by lack of brown adipose tissue); greater insulin resistance and insulin response; exaggerated lipemic response to fat and sugar intake; less capacity to handle an overabundance of food; lower fat burning (oxidative capacity) and VO2max during aerobic exercise; and energy- conserving response to resistance exercise, as well as increased lipoprotein (a) levels. The Roma people, also of South Asian ancestry, may represent an interesting pre-colonial historical control. Physician and patient knowledge of this unique physiology in South Asians will promote a stronger physician- patient relationship and foster compliance with treatment.

Introduction

At approximately one-quarter of the world’s population, South Asians represent one of the largest populations globally [1]. It is widely recognized that South Asians have higher cardiometabolic risks than people of other ethnicities. South Asians have the highest abdominal and visceral fat (truncal obesity) per given BMI [2,3]. South Asians are up to four to five fold more likely to develop type II diabetes when compared to the white populations of both the United States (US) and United Kingdom (UK), respectively [4,5]. Additionally, South Asians are more than twice as likely to develop metabolic syndrome than Europids in the UK [6]. Their risk of atherosclerotic cardiovascular disease (ASCVD) is four times greater than the general US population [7,8]. Moreover, ethnic Asian-Indians were reported to have higher median coronary artery calcium scores (CAC score, one of the most important predictors for ASCVD risk) [9] than all other ethnicities studied (i.e., Caucasian, Hispanic, African-Americans and East Asians) [8]. This is a veritable health crisis, given the size of the South Asian population and their higher risk of cardiometabolic disease [7].

Some of this risk could be due to lifestyle and dietary factors. South Asians on average spend less time exercising than the general population [10-12]. Studies have shown that the intake of refined carbohydrates, saturated fats, fried foods, and processed foods is high among South Asians [13-19]. However, there is a large amount of evidence pointing to a unique physiology among South Asians that likely has a genetic basis and represents resistance or adaptation to starvation. These adaptations have been suggested to predispose South Asians to cardiometabolic disease in an environment of abundance [20-23]. Therefore, it can be argued that the susceptibility of South Asians to cardiometabolic disease may be linked to starvation and famine adaptation. Furthermore, it is proposed that the near 200- year period of recurring, severe famines that occurred under British colonial rule may have had a role in shaping the current physiology of South Asians. The current review will shed light on the connection between the emerging evidence correlating nutritional deprivation and transgenerational susceptibility to cardiometabolic disease with the culprit being the colonial famines.

The Multiple Famines and Starvation in South Asia During the British Colonial Period

Prior to British colonial rule in South Asia, from the early fourteenth to the end of the seventeenth centuries, major famines occurred once every fifty years. These famines were also limited in geographical extent [24].

During colonial rule the nature and frequency of famines changed drastically. Famines were quite prevalent in South Asia during the British colonial period (1757 to 1947). The economic historian Mike Davis recounts 31 major famines in the 190 years of British colonial rule, compared to only 17 famines in the 2000 years prior [25]. Famines accelerated in frequency as British rule consolidated and spread. This spread is demonstrated by the occurrence of twelve serious famines and four severe scarcities between 1765 and 1858 (roughly the first 90 years of British rule) [24]. This is compared to acceleration in the frequency of severe famines during the period between 1850 and 1899 (50 years during ongoing British rule) where there were 24 major famines in South Asia [26].

The severity of the famines in South Asia made them some of the worst in world history. Three of the ten deadliest famines and six of the twenty-five worst drought-associated famines that were coupled with drought occurred in colonial India [27,28]. Additionally, the geographically widespread nature of the South Asian famines during colonial times was unprecedented in South Asian history. These famines affected areas of South Asia that were previously immune  to famine, such as Marwar and Bengal [24]. Thus, the famines were more frequent, widespread, affected larger numbers of people, and increased in intensity (as nationwide catastrophes) during British rule. Even when famines did not occur, undernourishment was the norm during the colonial period [29]. Food grain availability per capita, a quantifiable parameter of the degree of undernourishment, decreased due to impoverishment from 200 kg in 1900 to 157 kg on the eve of World War II and further declined to 137 kg by 1946 [30]. Given South Asians continual exposure to severe famines, it makes sense to look at how that may have had long-term effects.

How Does Famine Affect Cardiometabolic Risk in Future Generations (Epigenetics)?

It has been shown that an adverse environment for a community in the past can have a long-term negative health consequence in the present [31]. Exposure of a population to just one famine is known to increase the risk of diabetes and ASCVD via multigenerational epigenetic effects [32]. These effects and their duration over multiple generations have been observed in worm and mouse models [32,33]. In humans, this epigenetic effect of famines has also been shown to increase cardiometabolic risk. Specifically, multiple studies of different populations in Sweden, China, and the  Netherlands  have  shown this epigenetic-induced increase in cardiometabolic risk among descendants (including the grandchildren) of famine survivors [34- 36]. One evidence of epigenetic change in Chinese famine survivors is the high incidence of DNA methylation [21,22,37].

Based on the severity and frequency of the famines in South  Asia during the colonial period, we postulate that these famines had a lasting epigenetic effect on the predisposition of South Asians to cardiometabolic disease. Indeed, South Asians who develop type II diabetes have a much higher rate of DNA methylation, an established indicator of epigenetic change, than do Caucasians. This finding may explain the increased incidence of type II diabetes. The relationship of DNA methylation to type II diabetes is so strong that it has been postulated that this biomarker may be a potential future screening tool for early intervention prior to diabetes onset [38].

The Recent Overabundance of Food Availability in South Asia Causes Evolutionary Mismatch

During the last 25 years, there has been a rapid increase in prosperity, and thus, food availability, in South Asia and amongst the South Asian diaspora [39]. This increase has led to rising incidence rates of noncommunicable diseases (NCDs) such as heart disease, stroke, and type II diabetes. This implies that there may be an evolutionary mismatch of genetic traits that were once advantageous for survival during food scarcity and have since become detrimental in the current environment of abundance; this is also known as the “thrifty gene” or “thrifty phenotype” hypothesis [40].

How do the Unique Physiological Traits of South Asian Populations Point to Starvation Adaptation?

In support of the “thrifty gene” hypothesis, studies in animal models have revealed starvation adaptation (or starvation resistance) after exposure to food shortages. For example, in Drosophila, these adaptations include sequestering greater energy reserves (greater lipid accumulation) and reducing the rate at which energy reserves are used (reduction in the metabolic rate and lower activity level of the organism) [41]. Additionally, the physiological equivalence of insulin resistance has also been demonstrated in Drosophila as a  sign of starvation adaptation [42]. These traits of starvation adaption appear to be transgenerational in Caenorhabditis elegans as well [33]. Further investigation is needed, but, on the basis of these animal studies and the historical famines in South Asia, it is hypothesized that South Asians may express some of these traits due to generations of starvation adaptation [43].

The Unique and Different Physiology of South Asians

As suggested above, the physiology of South Asians is different from that of other ethnicities regarding important cardiovascular and metabolic measures. The topics discussed below outline the specific physiological differences seen in South Asians and relate them to starvation/famine adaptation.

High Body Fat and Unfavorable Adipokines

It is reasonable to assume that a propensity to store body fat is conducive to surviving famine. South Asians have a form of obesity that is different from that of most populations, which is referred to as the “thin-fat phenotype.” This characterization refers to a disproportionate amount of body fat typically concentrated in the abdomen in an otherwise lean individual, who often has a normal BMI. In fact, South Asians have the highest body-fat percentages and lowest lean mass of any ethnicity in the USA [44,45]. Compared with populations of European ancestry, South Asians have a total body- fat composition that is 3-5% higher for any given BMI [46]. Notably, South Asians have especially high levels of body fat and are more prone to developing obesity [47,48].

Higher body-fat percentages in South Asians is characterized by increased secondary storage in deep and visceral fat (though superficial subcutaneous fat is reduced); ectopic fat (such as intramyocellular and intrahepatic fat deposition); adipocyte hypertrophy; and a less favorable adipokine profile, which are cytokines produced in fat cells that regulate metabolism, energy, and inflammation; this condition  is referred to by some as “ethnic lipodystrophy” [44,49-52]. Of note, South Asians have been shown to have the tendency to store ectopic fat as hepatic fat compared with other ethnicities, which is associated with greater hepatic insulin resistance [53]. Regarding the adipokine profile, the levels of adiponectin, which promotes peripheral insulin sensitivity, are lower in South Asians, and the levels of resistin, another adipokine that promotes insulin resistance and obesity, are higher in South Asians [44,54,55].

Low Lean Body Mass

In addition to having higher body fat percentages, South Asians have lower lean body mass levels than do people of other ethnicities. It is hypothesized that part of the reason for this is that South Asians have higher expression of the gene encoding myostatin [50,56]. Myostatin is a protein found in skeletal muscle that inhibits its growth. This hypothesized effect would explain why a higher body fat percentage and low lean mass exists among newborns of South Asian migrants to the UK, Netherlands, and Surinam that persists for at least four to five generations [57,58]. Low lean body mass is associated with higher rates of insulin resistance and cardiovascular disease (CVD) risk [59-61].

Numerous severe famines affected South Asia throughout the 19th and first half of the 20th centuries. The effects were worsened by British colonial policy, which led to a high mortality rate from the starvation that occurred [57]. Lean mass (especially, muscles and organs) is known to consume calories at a higher rate than fat. Therefore, the intense selection pressure from the numerous severe famines of the 19th and first half of the 20th centuries would have favored low levels of lean mass in addition to a higher body fat percentage.

The low lean mass of South Asians has been postulated to be  one of the evolutionary reasons for the higher incidence rates of NCDs, such as cardiometabolic disease, in this population. Previous research has implicated colonial famines as a major exacerbator of the development of low lean mass due to starvation adaptation [58]. One study suggested that South Asians have had historically low lean mass for at least 11,000 years due to a variety of factors (such as delayed transitions from foraging to agriculture and the change to a predominantly vegetarian diet) [57]. However, we believe that the epigenetic effects of the famines on the South Asian physiology during the colonial period cannot be discounted.

Three factors that support the severity of the effects of these colonial famines are the exceedingly high death toll (up to 85 million deaths); the documented decrease in life expectancy during this period; and the decrease in stature (height) compared to an increase in stature in most of the other populations worldwide) [25,58,62-66].

Lower Resting Energy Expenditure

Thermoneutral resting energy expenditure is the energy expended necessary for basic physiological functioning at rest while awake, fasting, and without needing to use energy to regulate body temperature. As a result of their lower lean mass and higher body fat at the same height, weight, and BMI compared with people of other ethnicities, South Asians have lower thermoneutral resting energy expenditure (burning less energy at rest, approximately 32% less than Caucasians) [67-69]. This is another adaptation that may have helped some South Asians survive famines. One study showed that at the cellular level, South Asians seem to have higher mitochondrial efficiency, evidenced by the higher oxidative phosphorylation capacity in this group compared with Americans of North European origin [70]. The excess ATP-produced and higher oxidative state has been shown to prevent insulin receptor deactivation, resulting in insulin resistance [71,72].

One other reason contributing to the relative lower energy expenditure at rest, besides higher percentages of body fat, amongst South Asians is the lower amount of brown adipose tissue (BAT, or brown fat) [69,73]. BAT is a type of adipose tissue that is specialized for heat generation and can be responsible for up to 20% of total energy expenditure in its activated mode [74]. In  South  Asians, BAT volumes have been shown to be approximately 34% less than Caucasians [69]. BAT is responsible for nonshivering thermogenesis (heat generation). For  South Asians this means a reduced capacity  to generate nonshivering thermogenesis or waste heat [69]. In cold-adapted populations, higher levels of BAT are protective for cardiometabolic health (including diabetes), as BAT produces uncoupled mitochondrial respiration for heat generation that burns off excess calories (nonshivering thermogenesis) [73]. The protective mechanism likely involves the use of BAT burn or its metabolism of excess calories in states of caloric overabundance [73,75].

These phenomena may explain why amongst diaspora populations of East Asians (who, like Caucasians, are a cold-adapted population with relatively elevated levels of thermogenic capacity) have a much lower predisposition to cardiometabolic disease than South Asian diaspora populations [73]. In fact, among individuals aged 20-29 years living in the US, the incidence of diabetes in South Asians is threefold higher than in Chinese, as well as two times higher when compared with individuals of European origin [53]. This finding occurs despite a similar famine laden history in both South Asia and China [53,76,77].

In summary, regarding energy expenditure, South Asians were substantially impacted by starvation adaptation. These adaptations would have promoted hyperefficient mitochondria and a lack  of BAT. Both adaptations would have been helpful in promoting energy efficiency. Having less brown fat is thought to be a tropical adaptation, although an additional benefit may have been less energy consumption during starvation [73]. However, in times of abundance, this lack of BAT predisposes South Asians to cardiometabolic disease.

Greater Insulin Resistance/Insulin Response

Certain genetic factors involved in cardiometabolic processes including prediabetes/diabetes have also been found to be contributing factors to the unique South Asian physiology [43]. A single-nucleotide polymorphism (SNP) of the MC4R gene associated with higher levels of visceral (including hepatic) fat and insulin resistance is highly prevalent in South Asians [78]. Furthermore, at least six genetic variants associated with the premature onset of insulin-resistant diabetes have been found to be much more prevalent in South Asians than in Europeans [79]. Another study suggested that based on genetic data (polygenic risk score), South Asians had about a four times higher risk of type 2 diabetes than the European population [80]. South Asians have a higher postprandial insulin response, with a higher tendency toward insulin resistance in the overfed state (Figures 1 and 2) and there is a three- to four-fold higher prevalence of insulin resistance in lean South Asian men than in lean men of other ethnic groups [81,82].

fig 1

Figure 1: Plasma insulin (A), glucose (B) and nonesterified fatty acid (NEFA) (C) responses to a 75 g oral glucose load.82 Note the higher insulin response, but the equivalent serum glucose and NEFA responses, to the same glucose load in South Asians (than that in Europeans). Thus, thriftiness with glucose as seen in South Asians would be a useful starvation adaptation. [Reproduced from Hall, et al. (2010) with permission from PLOS].

fig 2

Figure 2: Comparison of European men to South Asian men shows that South Asian men have a lower insulin sensitivity index (reflecting a higher insulin response to an oral glucose load). The horizontal bars denote mean values. The P values shown are for the difference between the European and South Asian groups, either unadjusted or adjusted for age, BMI and fat mass.82 This finding suggests higher insulin resistance overall in South Asian men. Higher insulin resistance may be a useful starvation adaptation by preserving glucose. [Reproduced from Hall, et al. (2010) with permission from PLOS].

Regarding fat intake, one study showed that five days of consuming a high-fat and high-calorie diet resulted in the development of insulin resistance, manifesting as a reduced nonoxidative insulin-stimulated glucose disposal rate, in all South Asian participants (but in none of the Caucasian participants) [83]. Therefore, high fat intake produces insulin resistance more readily in South Asians. A physiological mechanism underpinning this was recently determined to be related to lipid droplet dynamics linked to perilipin-5 (PLIN5), a protein  that interacts with intramyocellular lipids to transport them to mitochondria. High PLIN5 levels typically maintain insulin sensitivity in Caucasians in response to high fat intake.

South Asians have even higher levels of PLIN5 in response to high fat intake, yet despite these higher levels, toxic fat breakdown products accumulate in the muscle, resulting in insulin resistance. Lipid droplet dynamics (which involve the release of fatty acids to fuel mitochondrial oxidation) in South Asians are therefore likely impaired or compromised [84]. Even early in life insulin resistance is more prominent in South Asians as the umbilical cord blood of newborns of South Asian ancestry manifest elevated insulin levels [85,86].

It is known that insulin resistance predisposes and correlates to cardiometabolic risk. Insulin resistance can be ameliorated by exercise. However, in the setting of higher insulin resistance, a greater duration of exercise may be needed to improve insulin sensitivity [87,88]. This occurrence could explain why South Asians may need more exercise. It is known that South Asians may need up to 80% more exercise to stave off cardiometabolic disease. Specifically, to maintain the same level of cardiometabolic health as Caucasians, South Asians need to exercise much more than their Caucasian counterparts. For instance, 150 minutes of moderate intensity exercise per week is recommended for Caucasians, but the time needed for South Asians to achieve the equivalent cardiometabolic benefits of moderate intensity exercise is 232–266 minutes per week [89,90].

Insulin resistance is believed to be beneficial in the starvation- adapted individual by reducing glucose uptake by muscles [91]. More importantly, glucose would be diverted to the brain, which  does not need insulin for glucose uptake; this is known as the selfish brain hypothesis [92-94]. Alternatively, it has been suggested that  the benefits provided by insulin resistance during starvation may actually be by preventing the net degradation of proteins [95]. Insulin resistance also promotes lipogenesis and fat retention, both of which would be helpful in a starvation state; this would explain why South Asians develop insulin resistance at much lesser levels of body fat and why the lower BMI/waist circumference (WC) cutoffs were established (see below).

Exaggerated Lipemic Response to Excess Sugar and Fat Intake (Predisposes to Insulin Resistance as a Starvation Survival Mechanism)

Due to an elevated predisposition to insulin resistance, South Asians have demonstrated different physiological responses to sugar and fat intake. Dietary sugar intake, like fructose and glucose, in healthy South Asians with normal indices of insulin sensitivity generates a much higher lipemic response when compared with Caucasians, due to an enhanced hepatic de novo lipogenesis (DNL). There is a known negative correlation between de novo lipogenesis and insulin sensitivity [96]. Additionally, when given a high-fat diet, South Asians had greater adverse effects on their lipid profile and insulin sensitivity than Europeans/Caucasians [97]. Such an exaggerated lipemic response would be beneficial as a starvation adaptation to promote fat storage.

Less Capacity to Handle Overabundance of Food

Despite the higher tendency toward insulin resistance and high insulin levels, South Asians have a lower beta cell reserve for insulin secretion compared to people of any other ethnicity [50]. This phenomenon may have been a response to the repeated famines South Asians endured [53]. Physiological changes associated with insulin resistance and metabolic syndrome (dysglycemia and dyslipidemia) occur at much lower body fat levels in South Asians than they do in people of other ethnicities [98]. These data support the establishment of lower BMI/ WC cutoffs for obesity by the World Health Organization (WHO) and International Diabetes Federation (IDF) for the South Asian population [99].

Possible explanations for this inability to handle a surplus of energy is called the adipose tissue overflow hypothesis [100]. The primary compartment in which fat is stored is in the superficial subcutaneous adipose tissue, where excess fat is inert metabolically. As a consequence of enduring severe famine, there would be no physiological need for a fully developed store of excess fats in the superficial subcutaneous adipose tissue. Due to the smaller capacity of subcutaneous fat storage available to South Asians, this compartment is overfilled much earlier than it is in Caucasians. Therefore, fat storage resumes in more metabolically active compartments (deep subcutaneous and visceral adipose tissues), resulting in metabolic complications such as dysglycemia and dyslipidemia at smaller BMIs than other ethnic groups, such as Caucasians.

Such a starvation-adapted body would also need a lower beta  cell reserve for insulin secretion, possibly due to hypostimulation of these beta cells [101,102]. Less insulin is necessary to function in a starvation/undernourished state; however, this reduced beta cell reserve would be more easily exhausted during a state of chronic overnutrition (i.e., chronic insulin resistance) [103]. Interestingly, Chinese individuals have the second lowest level of pancreatic beta cell reserve after South Asians [50]. This finding could also be a vestige of adaptation to survival during numerous famines in China.

Lower Fat Burning (Oxidative Capacity) and VO2max during Aerobic Exercise

South Asians have a lower fatty acid oxidation capability in states of aerobic exercise, with a trend towards lower fatty oxidation in the sedentary state [82,97,104]. Normally in the exercise state, fatty acids are released through lipid droplet lipolysis to fuel  mitochondrial fatty acid oxidation demands [84]. Related to this, it has been found that the fat oxidative capacity during aerobic exercise is up to 40% lower in South Asians than in Caucasians [82]. In that study, fitness and VO2max were much lower in South Asians than in Caucasians even though mitochondrial content and function were similar or higher in South Asians than in Caucasians [82]. In other words, the intramuscular expression of oxidative and lipid metabolism genes in South Asians is not reduced, but there is still a lower oxidative capacity in the muscle during aerobic exercise. This finding is thought to be another manifestation of insulin resistance in South Asians that may originate as a result of impaired lipid droplet dynamics [84]. Starvation adaptation can explain why the South Asian phenotype favors a lower capability to burn fat during exercise, as well as in sedentary and overfed states.

Starvation  adaptation  would  also  explain  the  accumulation  of intramyocellular fat due to the mitochondrial oxidation issues described above. This accumulation allows the oxidation of fat at a lower rate, thereby conserving fat stores. Additionally, intramyocellular fat accumulation impairs insulin receptors, leading to insulin resistance, which in turn prevents the utilization of glucose by muscles [91]. A starvation-adapted body would also be more likely to become insulin resistant more readily from the intake of saturated fat to maximize the storage of calories (in the form of fat, rather than burning it in muscle).

Energy-Conserving Response to Resistance Exercise

Besides differences in fatty acid oxidation during aerobic exercise, there is also a difference in response to resistance exercise among South Asians. The physiological response to identical resistance exercise training is less favorable among South Asians than among Caucasians. Although muscle protein synthesis was equivalent, South Asians had a poorer response with regard to body fat reduction, resting carbohydrate level reduction, fat metabolism increase, VO2max increase, and upper body strength increase [104].

Regarding systolic blood pressure reduction, South Asians also had a worse response to exercise. It was hypothesized this was due  to reduced bioavailability (seen in prior studies with South Asians) of nitric oxide (NO2 a potent vasodilator) in resistance endothelial vessels that supply muscle [104-106]. It would be expected there would be a less favorable muscle response to resistance exercise (in regard to VO2max, less upper body muscle strength, and less fat reduction) [104]. Instead, in the starvation-adapted individual, this muscle response would aim to conserve calories and would be blunted. Additionally, in the starvation state, there would be a decrease in blood pressure reduction in response to exercise because of reduced NO2 bioavailability [104]. A decrease in the level of NO2, which has a vasodilatory effect in muscle, would be beneficial for reducing blood flow to the muscle and the subsequent calorie expenditure by muscle to preserve calories for use by the brain (selfish brain hypothesis). This may have taken place in South Asians to conserve energy in a starvation adapted state.

Higher Lipoprotein(a) in South Asians

Vitamin C scarcity during times of famine may have led to an adaptation that predisposes South Asians to cardiovascular disease during times of prosperity. During famine in some areas of colonial India the estimated prevalence of scurvy (or acute vitamin-C deficiency) by a British colonial medical official was as high as 60- 70% [107]. To compensate for this, lipoprotein(a) or Lp(a), may have become elevated in South Asians. This is because Lp(a) is a vitamin C analog that is hypothesized to be protective against vitamin C deficiency [108]. Moreover, Lp(a) as a surrogate of vitamin C helps in wound healing and protects against the effects of scurvy, which   is characterized by capillary fragility, hemorrhage, and inadequate wound healing [108]. Here is how Lp(a) and cardiovascular disease are connected. Subclinical vitamin C-deficiency can occur in  modern society. This deficiency can weaken arterial walls since vitamin C is critical to maintaining the collagen framework [109]. Lp(a), in functioning as a replacement for vitamin C, tends to also bring LDL-cholesterol to weakened arterial walls and incite plaque development [109]. A study in mice that could not produce vitamin C for themselves, and were enabled to produce Lp(a), showed that mice (lower order mammals that do not usually develop atherosclerotic plaques) developed atherosclerotic plaque when exposed to Lp(a) just like humans [110].

It would follow that starvation-adapted populations, such as South Asians, would have a high prevalence of elevated Lp(a) levels. In fact, South Asians have one of the highest prevalence (40-45%)  of abnormal Lp(a) levels [111]. Lp(a) promoted survival during famine and undernourishment when life expectancy was low such   as occurred in colonial India when it was as low as 20 years between 1910-1920 [62,63,66]. Lp(a) becomes problematic during times of prosperity and higher life expectancy as an elevated Lp(a) level is one of the strongest independent risk factor for premature cardiovascular disease [110,112].

A Pre-Colonial South Asian Historical Control Population

The Roma people (historically referred to as “gypsies”) in Europe emigrated from northern South Asia during the eleventh century.     It is interesting to note that the Roma peoples’ rates of diabetes are similar to or significantly higher than rates of diabetes among white Caucasians [113-117]. However,  reports  of  increased  prevalence of diabetes among Roma populations are thought to occur due to predisposing factors of lower socioeconomic status, and increased smoking rates of the Roma people compared with the general population who on average have higher socioeconomic status [117- 119]. This increase contrasts sharply with the four to five times higher rate of diabetes in South Asians living in Western countries compared with white populations [4,5].

Additional evidence has found that the Roma people have no increased genetic susceptibility to diabetes compared with the general population [119]. This finding contrasts with the South Asian populations, which has a known genetic predisposition to diabetes [80].

The Roma may represent a historical control on the rate of diabetes in people of South Asian ancestry without the effect of the colonial famines. This control could potentially show how the colonial famines may have adversely impacted the South Asian rates of diabetes.

Conclusion

Taken together, the data indicate that South Asians have a  unique physiology that may have evolved via epigenetic effects to ensure survival during severe and frequent famines. It is likely that these adaptations have predisposed the South Asian population to cardiometabolic diseases in an environment of abundance.

We suggest this perspective of the unique South Asian physiology based on a history of famines will help explain why this population is in a veritable health crisis of cardiometabolic disease and engender future studies. This research could be done using similar methodologies as those used in studies on the multigenerational effects of the Great Chinese Famine or the Överkalix Famine [34,35].

Physicians who are knowledgeable of this physiology will be appropriately more aggressive in diagnosing and treating South Asian patients in an ethnically sensitive fashion [120]. Physicians will also have higher empathy for and credibility with their South Asian patients that may ultimately lead to a higher compliance via a stronger physician-patient relationship [121]. South Asian patients who have a greater insight into their own bodies and history may be able to improve their vigilance and motivation to adhere to suggested lifestyle and medical therapies [122].

References

  1. Population, total – South Asia. The World Bank (2022) available at: https: //data. worldbank.org/indicator/SP.POP.TOTL?locations=8S
  2. Raji A, Seely EW, Arky RA, Simonson DC (2001) Body fat distribution and insulin resistance in healthy Asian Indians and J Clin Endocrinol Metab 86(11): 5366-5371. [crossref]
  3. Lear SA, Humphries KH, Kohli S, Chockalingam A, Frohlich JJ, et (2007) Visceral adipose tissue accumulation differs according to ethnic background: results of the Multicultural Community Health Assessment Trial (M-CHAT). Am J Clin Nutr 86(2): 353-359. [crossref]
  4. Farmaki AE et (2022) Type 2 diabetes risks and determinants in second-generation migrants and mixed ethnicity people of South Asian and African Caribbean descent in the UK. Diabetologia. 65(1): p. 113-127. [crossref]
  5. Gadgil MD, Anderson CAM, Kandula NR, Kanaya AM (2014) Dietary patterns in Asian Indians in the United States: an analysis of the metabolic syndrome and atherosclerosis in South Asians Living in America J Acad Nutr Diet 114(2): 238-243. [crossref]
  6. Tillin T, Forouhi N, Johnston DG, McKeigue PM, et (2005) Metabolic syndrome and coronary heart disease in South Asians, African-Caribbeans and white Europeans: a UK population-based cross-sectional study. Diabetologia 48(4): 649- 656. [crossref]
  7. Krishnan S. (2019) South Asians and Cardiovascular Disease: The Hidden Threat. American College of Cardiology. [crossref]
  8. Volgman AS, Palaniappan LS, Aggarwal NT, et al. (2018) Atherosclerotic Cardiovascular Disease in South Asians in the  United  States:  Epidemiology,  Risk Factors, and Treatments: A Scientific Statement from the American Heart Association. Circulation 138(1): e1-e34. [crossref]
  9. Greenland P, Blaha M J, Budoff M J, Erbel R, & Watson K E (2018) Coronary Calcium Score and Cardiovascular Journal of the American College of Cardiology. 72(4): 434–447. [crossref]
  10. Fischbacher CM, Hunt S, Alexander L (2004) How physically active are South Asians in the United Kingdom? A literature review. J Public Health (Oxf) 26(3): 250-258. [crossref]
  11. Ranasinghe CD, Ranasinghe P, Jayawardena R, Misra A (2013) Physical activity patterns among South-Asian adults: a systematic review. Int J Behav Nutr Phys Act 10: 116. [crossref]
  12. Biddle GJH, Edwardson CL, Rowlands AV, et al. (2019) Differences in objectively measured physical activity and sedentary behaviour between white Europeans and south Asians recruited from primary care: cross-sectional analysis of the PROPELS trial. BMC Public Health 19(1): 95. [crossref]
  13. Subhan FB, Chan CB (2019) Diet quality and risk factors for cardiovascular disease among South Asians in Applied Physiology, Nutrition, and Metabolism 44(8): 886-893. [crossref]
  14. Joshi P, Islam S, Pais P, et al. (2007) Risk Factors for Early Myocardial Infarction in South Asians Compared With Individuals in Other JAMA 297(3): 286-294. [crossref]
  15. Misra A, Khurana L, Isharwal S, Bhardwaj S (2009) South Asian diets and insulin resistance. Br J Nutr. Feb 2009;101(4): 465-73. [crossref]
  16. Misra A, Singhal N, Khurana L (2010) Obesity, the metabolic syndrome, and type 2 diabetes in developing countries: role of dietary fats and oils. J Am Coll Nutr 29(3 Suppl): 289s-301s. [crossref]
  17. Gadgil MD, Anderson CAM, Kandula NR, Kanaya AM (2014) Dietary patterns in Asian Indians in the United States: an analysis of the metabolic syndrome and atherosclerosis in South Asians Living in America J Acad Nutr Diet 114(2): 238-243. [crossref]
  18. Martyn-Nemeth P, Quinn L, Menon U, Shrestha S, Patel C, Shah G (2017) Dietary Profiles of First-Generation South Asian Indian Adolescents in the United States. J Immigr Minor Health 19(2): 309-317. [crossref]
  19. Bhavadharini B, Mohan V, Dehghan M, et (2020) White Rice Intake and Incident Diabetes: A Study of 132,373 Participants in 21 Countries. Diabetes Care 43(11): 2643-2650. [crossref]
  20. Roseboom TJ, van der Meulen JHP, Osmond C, et al. (2000) Coronary heart disease after prenatal exposure to the Dutch famine, 1944–45. Heart 84(6): [crossref]
  21. Srichaikul K, Hegele RA, Jenkins DJA (2022) Great Chinese Famine and the Effects on Cardiometabolic Health for Future Generations. Hypertension 79(3): 532-535. [crossref]
  22. Wang Z, Song J, Li C, et (2020) DNA methylation of the INSR gene as a mediator of the association between prenatal exposure to famine and adulthood waist circumference. Scientific Reports 10(1): 12212. [crossref]
  23. Li J, Yang Q, An R, et (2022) Famine and Trajectories of Body Mass Index, Waist Circumference, and Blood Pressure in Two Generations: Results From the CHNS From 1993-2015. Hypertension 79(3): 518-531. [crossref]
  24. Nand B (2011) Nature and Causes of Famines in Colonial India Brahma Nand AAS- ICAS Special Joint Conference 2011 Association for Asian Studies International Convention of Asia Scholars. [crossref]
  25. Davis M (2001) Late Victorian Holocausts: El Nino Famine and the Making of the Third Verso Books. [crossref]
  26. Sourabh NC, Myllynaus Timo. (2015) Famines in  Late  Nineteenth-Century  India: Politics, Culture, and Environmental Justice. Rachel Carson Center Virtual Exhibitions. 9: 48-50 [crossref]
  27. Bird (2020) The Worst Droughts And Famines In History. [crossref]
  28. Dodd (2020) The Deadliest Famines In History. [crossref]
  29. Muraleedharan VR (1994) Diet, Disease and Death in Colonial South Economic and Political Weekly 29: 55-63. [crossref]
  30. Sreevatsan A. (2018) British Raj siphoned out $45 trillion from India: Utsa Patnaik. [crossref]
  31. Motairek I, Lee Eun K, Janus S, et (2022) Historical Neighborhood Redlining and Contemporary Cardiometabolic Risk. Journal of the American College of Cardiology 80: 171-175. [crossref]
  32. Hanafi MY, Saleh MM, Saad MI, Abdelkhalek TM, Kamel MA (2016) Transgenerational effects of obesity and malnourishment on diabetes risk in F2 generation. Molecular and Cellular Biochemistry 412: 269-280. [crossref]
  33. Rechavi O, Houri-Ze’evi L, Anava S, et (2014) Starvation-induced transgenerational inheritance of small RNAs in C. elegans. Cell 158: 277-287. [crossref]
  34. Bygren LO, Tinghög P, Carstensen J, et (2014) Change in paternal grandmothers’ early food supply influenced cardiovascular mortality of the female grandchildren. BMC Genet 15: 12. [crossref]
  35. Li J, Liu S, Li S, et al. (2017) Prenatal exposure to famine and the development of hyperglycemia and type 2 diabetes in adulthood across consecutive generations: a population-based cohort study of families in Suihua, The American Journal of Clinical Nutrition 105: 221-227. [crossref]
  36. Tobi Elmar W, Slieker Roderick C, Luijk R, et al. (2018) DNA methylation as a mediator of the association between prenatal adversity and risk factors for metabolic disease in Science Advances 4: eaao4364. [crossref]
  37. Wang Z, Song J, Li Y, Dong B, Zou Z, Ma J (2019) Early-Life Exposure to the Chinese Famine Is Associated with Higher Methylation Level in the INSR Gene in Later Adulthood. Scientific Reports 9(1): 3354. [crossref]
  38. Chambers JC, Loh M, Lehne B, et al. (2015) Epigenome-wide association of DNA methylation markers in peripheral blood from Indian Asians and Europeans with incident type 2 diabetes: a nested case-control Lancet Diabetes Endocrinol 3: 526-534. [crossref]
  39. Bishwajit G (2015) Nutrition transition in South Asia: the emergence of non- communicable chronic diseases F1000Res 4:8. [crossref]
  40. Venniyoor A (2020) PTEN: A Thrifty Gene That Causes Disease in Times of Plenty? Hypothesis and Theory Frontiers in Nutrition Jun 5; 7:81. [crossref]
  41. Rion S, Kawecki TJ (2007) Evolutionary biology of starvation resistance: what we have learned from J Evol Biol. Sep 20: 1655-64. [crossref]
  42. Honegger B, Galic M, Köhler K, et (2008) Imp-L2, a putative homolog of vertebrate IGF-binding protein 7, counteracts insulin signaling in Drosophila and is essential for starvation resistance. J Biol 7: 10. [crossref]
  43. Venugopal (2016) Increased prevalence of type 2 diabetes in south asian population – a genetic perspective. Journal of Diabetes, Metabolic Disorders & Control. 3(3): p. 57-58. [Crossref]
  44. Shah AD, Kandula NR, Lin F, et al. (2016) Less favorable body composition and adipokines in South Asians compared with other US ethnic groups: results from the MASALA and MESA Int J Obes (Lond) 40: 639-645. [crossref]
  45. Kurpad AV, Varadharajan KS, Aeberli I (2011) The thin-fat phenotype and global metabolic disease Curr Opin Clin Nutr Metab Care 14: 542-547. [crossref]
  46. Deurenberg P, Deurenberg-Yap M, Guricci S (2002) Asians are different from Caucasians and from each other in their body mass index/body fat per cent relationship. Obes Rev 3: 141-146. [crossref]
  47. Misra A, Khurana L (2009) The metabolic syndrome in South Asians: epidemiology, determinants, and Metab Syndr Relat Disord 7: 497-514. [crossref]
  48. Misra A, Vikram NK (2004) Insulin resistance syndrome (metabolic syndrome) and obesity in Asian Indians: evidence and Nutrition 20: 482-91. [crossref]
  49. Gujral UP, Narayan KMV, Kandula NR, Liu K, Kanaya AM (2020) Incidence of diabetes and prediabetes and predictors of glycemic change among South Asians in the USA: the MASALA study BMJ Open Diabetes Res Care. [crossref]
  50. Narayan KMV, Kanaya AM (2020) Why are South Asians prone to type 2 diabetes? A hypothesis based on underexplored Diabetologia 63: 1103-1109. [crossref]
  51. Forouhi NG, Jenkinson G, Thomas EL, et (1999) Relation of triglyceride stores in skeletal muscle cells to central obesity and insulin sensitivity in European and South Asian men. Diabetologia 42: 932-935. [crossref]
  52. Anand SS, Tarnopolsky MA, Rashid S, et (2011) Adipocyte hypertrophy, fatty liver and metabolic risk factors in South Asians: the Molecular Study of Health and Risk in Ethnic Groups (mol-SHARE). PLoS One 6: e22112. [crossref]
  53. Ke C, Narayan KMV, Chan JCN, Jha P, Shah BR (2022) Pathophysiology, phenotypes and management of type 2 diabetes mellitus in Indian and Chinese populations. Nature Reviews Endocrinology 18: 413-432. [crossref]
  54. Nguyen TMD (2020) Adiponectin: Role in Physiology and Pathophysiology. Int J Prev Med 11: 136-136. [crossref]
  55. Forny-Germano L, De Felice FG, Vieira MNdN (2019) The Role of Leptin and Adiponectin in Obesity-Associated Cognitive Decline and Alzheimer’s Disease. Review. Frontiers in Neuroscience Jan 14; 12: [crossref]
  56. Metspalu M, Romero Irene G, Yunusbayev B, et al. (2011) Shared and Unique Components of Human Population Structure and Genome-Wide Signals of Positive Selection in South Asia. The American Journal of Human Genetics 89(6): 731-744. [crossref]
  57. Pomeroy E, Mushrif-Tripathy V, Cole TJ, Wells JCK, Stock JT (2019) Ancient origins of low lean mass among South Asians and implications for modern type 2 diabetes susceptibility. Scientific Reports 9: 10515 [crossref]
  58. Wells JC, Pomeroy E, Walimbe SR, Popkin BM, Yajnik CS (2016) The Elevated Susceptibility to Diabetes in India: An Evolutionary Front Public Health 4: 145. [crossref]
  59. Khazem S, Itani L, Kreidieh D, et al. (2018) Reduced Lean Body Mass and Cardiometabolic Diseases in Adult Males with Overweight and Obesity: A Pilot Int J Environ Res Public Health 15: 2754. [crossref]
  60. Nomura K, Eto M, Ogawa S, et (2020) Association between low muscle mass and metabolic syndrome in elderly Japanese women. PLOS ONE 15: e0243242. [crossref]
  61. Srikanthan P, Karlamangla AS (2011) Relative Muscle Mass Is Inversely Associated with Insulin Resistance and Prediabetes. Findings from The Third National Health and Nutrition Examination Survey. The Journal of Clinical Endocrinology & Metabolism 96: 2898-2903. [crossref]
  62. Meena HK. (2016) Railway and Famines in British India. Silpakorn University Journal of Social Sciences, Humanities, and 16(1):1-18. [crossref]
  63. Klein (1973) Death in India, 1871-1921. The Journal of Asian Studies. 32(4):639- 659. [crossref]
  64. Brennan L, Donald MJ, Shlomowitz R (1997) Towards an anthropometric history of Indians under British Res Econ Hist. Emerald Group Publishing Ltd. 17:185-246. [crossref]
  65. Baten J, Blum M (2012) An anthropometric history of the World, 1810-1980: did migration and globalization influence country trends? J Anthropol Sci 90: 221-224. [crossref]
  66. O’Neill (2022) Life Expectancy in India 1800-2020. [crossref]
  67. Wulan SN, Raza Q, Prasmita HS, et (2021) Energy Metabolism in Relation to Diet and Physical Activity: A South Asian Perspective. Nutrients 13: 3776. [crossref]
  68. Soares MJ, Piers LS, O’Dea K, Shetty PS (1998) No evidence for an ethnic influence on basal metabolism: an examination of data from India and Br J Nutr. Apr 79: 333-41. [crossref]
  69. Bakker LE, Boon MR, van der Linden RA, et (2014) Brown adipose tissue volume in healthy lean south Asian adults compared with white Caucasians: a prospective, case-controlled observational study. Lancet Diabetes Endocrinol 2: 210-217. [crossref]
  70. Nair KS, Bigelow ML, Asmann YW, et al. (2008) Asian Indians Have Enhanced Skeletal Muscle Mitochondrial Capacity to Produce ATP in Association With Severe Insulin Resistance. Diabetes 57: 1166-1175. [crossref]
  71. Fisher-Wellman KH and Neufer (2012) Linking mitochondrial bioenergetics to insulin resistance via redox biology. Trends Endocrinol Metab. 23(3): p. 142-53. [crossref]
  72. Conley KE (2016) Mitochondria to motion: optimizing oxidative phosphorylation to improve exercise J Exp Biol 243-249. [crossref]
  73. Sellayah D (2018) The Impact of Early Human Migration on Brown Adipose Tissue Evolution and Its Relevance to the Modern Obesity Journal of the Endocrine Society 3: 372-386. [crossref]
  74. Marlatt KL, Ravussin E (2017) Brown Adipose Tissue: an Update on Recent Curr Obes Rep 6(4): 389-396. [crossref]
  75. Becher T, Palanisamy S, Kramer DJ, et (2021) Brown adipose tissue is associated with cardiometabolic health. Nature Medicine 27: 58-65. [crossref]
  76. Roy T (2016) Were Indian Famines ‘Natural’ Or ‘Manmade’? : London School of Economics. [Crossref]
  77. Li LM (2007) Fighting Famine in North China. Stanford University Press 284. [crossref]
  78. Chambers JC, Elliott P, Zabaneh D, et al. (2008) Common genetic variation near MC4R is associated with waist circumference and insulin resistance. Nat Genet 40: 716-718. [crossref]
  79. Kooner JS, Saleheen D, Sim X, et al. (2011) Genome-wide association study in individuals of South Asian ancestry identifies six new type 2 diabetes susceptibility loci. Nature genetics 43: 984-989. [crossref]
  80. Loh M, Zhang W, Ng HK, et al. (2022) Identification of genetic effects underlying type 2 diabetes in South Asian and European populations. Communications Biology 5: 329. [crossref]
  81. Gujral UP, Pradeepa R, Weber MB, Narayan KMV, Mohan V (2013) Type 2 diabetes in South Asians: similarities and differences with white Caucasian and other populations. Annals of the New York Academy of Sciences 1281: 51-63. [crossref]
  82. Hall LML, Moran CN, Milne GR, et al. (2010) Fat Oxidation, Fitness and Skeletal Muscle Expression of Oxidative/Lipid Metabolism Genes in South Asians: Implications for Insulin Resistance? PLOS ONE 5:e14197. [crossref]
  83. Bakker LE, van Schinkel LD, Guigas B, et (2014) A 5-day high-fat, high-calorie diet impairs insulin sensitivity in healthy, young South Asian men but not in Caucasian men. Diabetes 63: 248-258. [crossref]
  84. Gemmink A, Bakker LEH, Guigas B, et (2017) Lipid droplet dynamics and insulin sensitivity upon a 5-day high-fat diet in Caucasians and South Asians. Scientific Reports 7: 42393. [crossref]
  85. Yajnik CS, Lubree HG, Rege SS, et al. (2002) Adiposity and hyperinsulinemia in Indians are present at J Clin Endocrinol Metab 87: 5575-5580. [crossref]
  86. Karamali NS, Ariens GA, Kanhai HH, de Groot CJ, Tamsma JT, Middelkoop BJ (2015) Thin-fat insulin-resistant phenotype also present in South Asian neonates born in the J Dev Orig Health Dis 6: 47-52. [crossref]
  87. Houmard JA, Tanner CJ, Slentz CA, Duscha BD, McCartney JS, & Kraus (2004) Effect of the volume and intensity of exercise training on insulin sensitivity. Journal of applied physiology. 96(1): 101–106. [crossref]
  88. Iaccarino G, Franco D, Sorriento D, et al. (2021) Modulation of Insulin Sensitivity by Exercise Training: Implications for Cardiovascular Prevention. of Cardiovasc. Trans. Res. 14, 256–270. [crossref]
  89. Celis-Morales CA, Ghouri N, Bailey MES, Sattar N, Gill JMR (2013) Should Physical Activity Recommendations Be Ethnicity-Specific? Evidence from a Cross-Sectional Study of South Asian and European PLOS ONE 8: e82568. [crossref]
  90. Iliodromiti S, Ghouri N, Celis-Morales CA, Sattar N, Lumsden MA, Gill JMR (2016) Should Physical Activity Recommendations for South Asian Adults Be Ethnicity- Specific? Evidence from a Cross-Sectional Study of South Asian and White European Men and PloS one 11(8): e0160024-e0160024. [crossref]
  91. Mansell PI and Macdonald IA. (1990) The effect of starvation on insulin-induced glucose disposal and thermogenesis in humans. Metabolism. 39(5): 502-510. [crossref]
  92. Hearst A(2011) YOU DON’T LOOK DIABETIC: DIABETES IN NON-OBESE SOUTH ASIANS–IS THERE A MOLECULAR OR GENETIC BASIS FOR INCREASED INSULIN RESISTANCE? Clinical Correlations. [crossref]
  93. Watve MG, Yajnik CS (2007) Evolutionary origins of insulin resistance: a behavioral switch BMC Evol Biol 7: 61-61. [crossref]
  94. Wang P, Mariman E (2008) Insulin resistance in an energy-centered Physiology & behavior 94: 198-205. [crossref]
  95. Soeters MR, Soeters PB (2012) The evolutionary benefit of insulin resistance. Clin Nutr 31(6): 1002-1007. [crossref]
  96. Hudgins LC, Hugo JL, Enayat S, Parker TS, Artis AS, Levine DM (2017) Young, healthy South Asians have enhanced lipogenic sensitivity to dietary Clin Endocrinol (Oxf) 86: 361-366. [crossref]
  97. Wulan SN, Schrauwen-Hinderling VB, Westerterp KR, Plasqui G (2020) Substrate utilization and metabolic profile in response to overfeeding with a high-fat diet in South Asian and white men: a sedentary lifestyle Int J Obes (Lond) 44: 136-146. [crossref]
  98. Patel SA, et al, (2016) Is the “South Asian Phenotype” Unique to South Asians?: Comparing Cardiometabolic Risk Factors in the CARRS and NHANES Glob Heart. 11(1): p. 89-96.e3. [crossref]
  99. Caleyachetty R, et al. (2021) Ethnicity-specific BMI cutoffs for obesity based on type 2 diabetes risk in England: a population-based cohort Lancet Diabetes Endocrinol. 9(7): p. 419-426. [crossref]
  100. Sniderman AD, Bhopal R, Prabhakaran D, Sarrafzadegan N, Tchernof (2007) Why might South Asians be so susceptible to central obesity and its atherogenic consequences? The adipose tissue overflow hypothesis. Int J Epidemiol. 36(1):220-196. [crossref]
  101. Cerf M E. (2013). Beta cell dysfunction and insulin resistance. Frontiers in endocrinology. 4:37. [crossref]
  102. Wysham C & Shubrook (2020) Beta-cell failure in type 2 diabetes: mechanisms, markers, and clinical implications. Postgraduate medicine. 132(8): 676–686. [crossref]
  103. Boland BB, Rhodes CJ, & Grimsby JS. (2017) The dynamic plasticity of insulin production in β-cells. Molecular 6(9): 958–973. [crossref]
  104. Alkhayl FFA, Ismail AD, Celis-Morales C, et (2022) Muscle protein synthesis and muscle/metabolic responses to resistance exercise training in South Asian and White European men. Sci Rep 12: 2469. [crossref]
  105. Cubbon RM, Murgatroyd SR, Ferguson C, et al. (2010) Human exercise-induced circulating progenitor cell mobilization is nitric oxide-dependent and is blunted in South Asian Arterioscler Thromb Vasc Biol 30: 878-84. [crossref]
  106. Murphy C, Kanaganayagam GS, Jiang B, et al. (2007) Vascular Dysfunction and Reduced Circulating Endothelial Progenitor Cells in Young Healthy UK South Asian Men. Arteriosclerosis, Thrombosis, and Vascular Biology 27: 936-942. [crossref]
  107. Whitcombe E (1993) Famine Economic and Political Weekly 28: 1169-1179.
  108. Rath M, Pauling L (1990) Hypothesis: lipoprotein(a) is a surrogate for Proc Natl Acad Sci U S A 87: 6204-6207. [crossref]
  109. Ivanov V, et (2020) Vitamin C inhibits the calcification process in human vascular smooth muscle cells. Am J Cardiovasc Dis. 10(2): p. 108-116. [crossref]
  110. Cha J, Niedzwiecki A and Rath M. (2015) Hypoascorbemia induces atherosclerosis and vascular deposition of lipoprotein(a) in transgenic mice. American journal of cardiovascular disease. 5(1): 53-62. [crossref]
  111. Enas E, Kannan S (2005) How to Beat the Heart Disease Epidemic Among South Asians: A Prevention and Management Guide for Asian Indians and Their Doctors. Advanced Heart Lipid Clinic 351. [crossref]
  112. Enas EA, Varkey B, Dharmarajan TS, Pare G, Bahl VK (2019) Lipoprotein(a):   An independent, genetic, and causal factor for cardiovascular disease and acute myocardial Indian Heart J 71: 99-112. [crossref]
  113. Nunes MA, Kučerová K, Lukáč O, Kvapil M, Brož J (2018) Prevalence of Diabetes Mellitus among Roma Populations-A Systematic Review. Int J Environ Res Public Health Nov; 15(11): 2607. [crossref]
  114. Beljić Zivković T, Marjanović M, Prgomelja S, et al. (2010) Screening for diabetes among Roma people living in Croat Med J 51: 144-150. [crossref]
  115. Hubáček JA, Šedová L, Olišarová V, Adámková V, Tóthová V (2020) Different prevalence of T2DM risk alleles in Roma population in comparison with the majority Czech Molecular Genetics & Genomic Medicine 8: e1361. [crossref]
  116. Weiss E, Japie C, Balahura AM, Bartos D, Badila E (2018) Cardiovascular risk factors in a Roma sample population from Rom J Intern Med 56: 193-202. [crossref]
  117. Vozarova de Courten B, de Courten M, Hanson RL, et al. (2003) Higher prevalence of type 2 diabetes, metabolic syndrome and cardiovascular diseases in gypsies than in non-gypsies in Diabetes Res Clin Pract 62: 95-103. [crossref]
  118. Hajioff S, McKee M (2000) The health of the Roma people: a review of the published literature. Journal of Epidemiology and Community Health 54: 864-869. [crossref]
  119. Werissa NA, Piko P, Fiatal S, Kosa Z, Sandor J, Adany R (2019) SNP-Based Genetic Risk Score Modeling Suggests No Increased Genetic Susceptibility of the Roma Population to Type 2 Diabetes Genes (Basel) Nov 19; 10(11): 942. [crossref]
  120. Kim EJ, et (2018) Racial and Ethnic Disparities in Diagnosis of Chronic Medical Conditions in the USA. J Gen Intern Med. 33(7): p. 1116-1123. [crossref]
  121. Martin LR, Williams SL, Haskard KB, Dimatteo MR (2005) The challenge of patient adherence. Ther Clin Risk Manag 1: 189-199. [crossref]
  122. Jin J, Sklar GE, Min Sen Oh V, Chuen Li S (2008) Factors affecting therapeutic compliance: A review from the patient’s Ther Clin Risk Manag 4: 269-286. [crossref]

Screening for Human Trafficking: Best Practice Guidelines and Recommendations for Health Care Providers

DOI: 10.31038/IJNM.2022324

Abstract

Human trafficking (HT) is a federal and international crime and is regarded as one of the most pressing human rights issues. Adult and minor victims are trafficked by force (rape, beatings, confinement), fraud, and coercion resulting in profound physical and psychological injuries; Department of Homeland Security; Vera Institute of Justice. Most clinicians fail to recognize HT victims. This policy brief’s purpose is to provide health care providers with a validated HT screening tool and best practice guidelines and recommendations to aid in victim identification. The strategies outlined are those published by the Vera Institute of Justice’s HT Victim Identification Tool and are endorsed by the Emergency Nurses Association and the International Association of Forensic Nurses. These proposals will increase the likelihood that patients experiencing sexual and labor exploitation will be identified.

Keywords

Human trafficking, Sexual exploitation, Forced labor, Human trafficking screening protocol, Human trafficking policy, Homelessness, Migrants, Runaways, Adults, Children

Screening for Human Trafficking: Best Practice Guidelines and Recommendations for Health Care Providers

Research has shown that human trafficking victims are not recognized by health care providers during their captivity [1-7]. Early identification of human trafficking victims is critical because the average life expectancy of a patient who is either sexually exploited or forced into labor is seven years [6]. A validated screening tool and assessment guideline would reliably identify adult and minor victims of both sex and labor trafficking [1-5,7,8-11].

Background and Scope of the Problem

Human trafficking is a federal and international crime and is commonly regarded as one of the most pressing human rights issues of our time. Adult and minor victims are trafficked by force (rape, beatings, confinement), fraud, and coercion (Department of Homeland Security) [12]. Children are particularly vulnerable to predators on the Internet via websites and social media and by mobile devices (United States Department of Justice, 2020) [13-15]. According to the National Center for Missing and Exploited Children, the number of suspected child-trafficking reports from 2010 to 2015 increased by 846 percent [16].

Prevalence

Globally, sexual exploitation makes up 79 percent of all cases, and forced labor accounts for 18 percent (United Nations Office of Drugs and Crime, 2020) [17]. Human trafficking affects every United States community, regardless of age, gender, ethnicity, and socio-economic background (National Human Trafficking Hotline, 2020) [18-23]. The average American age at the time trafficking began for sex trafficking is 17 years old, for labor is 22 years old (Polaris Project, 2020) [24], 15,222 females, 3,003 males, 135 gender minorities, and 3,966 of unknown gender were victimized. In that same year, there were 1,388 United States citizens/lawful permanent residents, 4,601 foreign nationals, and 16,337 of unknown nationality were identified as victims (Polaris Project, 2020) [24]. In 2019, there were eight trafficking cases in this southwestern state, ranking it 23rd in the nation for active cases; nationwide, there were 606 cases (The Human Trafficking Institute, 2019) [25].

Health and Social Impacts of Trafficking

There is compelling evidence of the health and social impacts of trafficking [1,3,5,7,9,10,26]. Reduced life expectancy was listed (Patient Safety Monitor Journal, 2017) [6], as was severe violent behavior [9]. Urinary tract infections, pelvic or abdominal pain, suicide attempts, and psychogenic nonepileptic seizures were highlighted [1,2] named life-threatening injuries and neglected health conditions (p. 282). Stevens & Dinkle [7] referenced serious health conditions such as “anxiety, depression, aggression, major depression, sleep disorders, suicidal ideation, substance use disorders and addiction” (p. e1). Domestic servitude and violence are included [3,10] identified “chronic medical problems, significant mental health issues, substance abuse/ misuse, reproductive or sexual health problems, diminished quality of life, and trauma” (p. 175). Involvement in the justice and foster care systems, running away, and being kicked out of home were listed [5]. Victims also developed posttraumatic stress disorder [7,26].

Human Trafficking Laws

The United States federal law on child sex trafficking [15] makes it a federal crime to “knowingly recruit, entice, harbor, transport, provide, obtain, or maintain a minor and cause that child to engage in any kind of sexual activity in exchange for anything of value” (para. 1). Child Protection Services must be alerted as required by law [1]. There are child abuse laws [1]. The law specifies that there are no child prostitutes [8]. Child soldiering, debt bondage, and bonded labor are unlawful [1,2]. Child Protection Services must be alerted as required by law [1]. Federal law requests HT training for health care providers [2]. Low HT detection results from ineffective laws [2]. Child soldiering, debt bondage, and bonded labor are unlawful [2]. There are mandatory reporting laws and safe harbor laws [2,10,26]. Surprisingly, federal law does not require proof that a defendant used force, fraud, or coercion to determine the action of trafficking when the victim is a minor [3].

Problem Identification and Understanding

McDow and Dols [4] define human trafficking as the use of force, fraud, or coercion by a trafficker to exploit a vulnerable individual to perform commercial sex or labor (p. e1). Each year between 600,000 and 800,000 men, women, and children are trafficked across international borders worldwide, and between 14,500 and 17,500 are trafficked into the United States (United States Department of State [27].

There is strong evidence health care providers do not recognize victims during their captivity [1-7,28]. Providers are often unfamiliar with human trafficking signs and symptoms [1,2,10]. Estimates are that 87-80 percent of human trafficking victims are seen by a health care provider while under the control of their trafficker [1,2]. Fifty-seven percent of female victims were not identified [4]. Thirteen percent of adult and child victims were recognized. Only nineteen percent of children were screened and referred to authorities [5]. Youth experiencing human trafficking interact with the healthcare and social services systems where they can be but are often not identified [5].

Because of their obligation to promote the well-being of patients, health care providers have an ethical obligation to take appropriate action to avert the harms caused by human trafficking that includes mandatory reporting to remain compliant with state law (New Mexico Department of Health [29]. By following evidence-based practice, health care providers should be compliant with state and federal laws because each patient identified as a human trafficking victim will be reported to agency and city police departments.

At-Risk Populations

Evidence has identified risk factors that contribute to patients’ vulnerability for human trafficking.

Children and Teenagers

Risk factors for children and teenagers becoming victims include “being a runaway, possessing developmental delays, teens identifying as lesbian, gay, bisexual, transgender and queer or questioning (LGBTQ), those who commute to school alone, are hungry or malnourished, are poor, come from dysfunctional families, experience emotional distress, have mental illness, and abuse substances” [1,2,5,6,9,28,30]. Young girls are targeted [3,4,28]. Youth who are at risk for abuse or violence are often targeted [2,28,31]. Adolescents involved in foster care or juvenile justice systems, who were unstably housed or homeless, involved with child protective services or had a negative interaction with law enforcement were also more likely to become victims [1,4,5,28,30,32]. Finally, younger victims are often connected to gangs or are migrants [9,10,28,33].

Females

Most victims of human trafficking are young women and girls [1,3,4,9,28] found that “nearly 70 to 80 percent of trafficking victims are women and girls, and 97 percent of those are trafficked for sexual exploitation” (p. 830). Egyud et al. (2017) [1] ranked the percent of female trafficking victims at 90 percent (p. 527). Greenbaum and Bodrick [34,35] state that globally, between January 2008 and June 2010, human trafficking taskforces discovered that 94 percent of sex trafficking victims were female (p. 2). Young women are at the greatest risk for sexual exploitation and are treated for “unplanned pregnancies, sexually transmitted infections, and traumatic injuries” [4]. They seek out health care providers for reproductive health issues such as miscarriages and to perform abortions or to secure birth control [36]. As a result, “Health care providers who work in women’s health services have a unique opportunity to identify and intervene in the human trafficking operation due to their heightened level of contact with the victims” [36]. In 2018, the National Human Trafficking Hotline- 18] identified over 15,000 female victims [4].

Migrants

Migrant individuals are easy targets for domestic servitude because they are cheap labor, and their abusers face low risk of prosecution [3,5,8,10,33]. Mexican indigenous women are especially vulnerable due to “structural poverty, marginalization, social exclusion, and a traditional[ly] patriarchal culture” [28,33]. Elderly migrant family members are targeted for access to their benefits [3].

Consequences of Human Trafficking

Victims of human trafficking often have “multiple sexually transmitted infections and abortions, poor dental hygiene, and severe or recurring head and neck trauma from forced oral sex” [6,28,30,33]. They develop somatization, immunosuppression, inflammation, headaches, dizzy spells, exhaustion, back pain, memory problems, unintentional weight loss, nausea, indigestion, cancer, heart disease, high cholesterol, asthma, and gastrointestinal, muscular, and neurological symptoms [37]. Trafficked children and adults can develop complex posttraumatic stress disorder [26,31,38]. Victims, regardless of age, can have an increased risk for “anxiety disorders, Stockholm syndrome, major depressive disorder, substance abuse, self-harm, and suicide ideation” [30,31,33]. Traffickers often force drugs on victims as a means of control and exploitation [28,39].

Understanding Healthcare Workers and First Responders’ Roles

This policy brief follows a multidisciplinary approach and follows the Vera Institute of Justice-[40]’s Trafficking Victim Identification Tool (TVIT). The TVIT has been developed based on the latest research and best practices. It was designed for use by behavioral health, health care, social work, and public health professionals. The tool is a reliable, brief screen com1monly used in public health, health care, behavioral health, and social service settings. “The TVIT has been found to be valid and reliable in identifying victims of sex and labor” [8,40]. It is a statistically validated screening tool that encompasses both labor and sex trafficking, adult and child victims, and foreign nationals and United States citizens. It is available in long- and short-form. The tool is also available in Spanish” (National Human Trafficking Hotline, n.d., para. 1)-[18]. If the health care provider believes the patient is a human trafficking victim, they should follow agency policy and file a human trafficking report with the agency and city’s police departments (Vera Institute of Justice [40]. First, front desk staff will discreetly alert the provider if a patient screens positive for any red flags or indicators listed in the National Human Trafficking Resource Center’s (NHTRC) “What to Look for in a Healthcare Setting” (see Table 1, p. 34; Figure 1, p. 45). Examples of red flags or indicators are if a patient does not have a permanent address, if a patient does not appear to have a relation to the person accompanying them, or if a patient’s body language and communication style or those of the partner are combative or abusive [7,10,34,40].

Table 1: Human Trafficking Assessment Tool, Table of Steps for Front Desk Staff

1) Patient presents to clinic or emergency department. Go to step 2.
2) Front-desk staff check-in patient while discreetly screen for red flags and indicators listed in the Vera Institute of Justice’s Trafficking Victim Identification Tool by completing the following steps. Go to step 3.
3) Does the patient lack appropriate clothing for the weather, venue, or age? If yes or no, go to step 4.
4) Does the patient lack identification documents? If yes or no, go to step 5.
5) Does the patient appear to have a relation to the person accompanying them?If yes or no, go to step 6.
6) Is the patient’s companion overly involved (does not let the patient speak for themselves, refuses to let the patient have privacy, or interprets for them)? If yes, go to step 7. If no, go to step 8.
7) Discreetly alert the health care provider for further assessment.
8) Stop the assessment.

Note: Adapted from National Human Trafficking Resource Center. (n.d) Identifying victims of human trafficking: What to look for in a healthcare setting. http://surl.li/dshkj 

fig 1

Figure 1: Human trafficking assessment tool algorithm for front-desk staff

Second, the health care provider will assess the patient by using their own clinical judgment and by assessing for red flags and indicators listed on the NHTRC’s “What to Look for in a Healthcare Setting” (Figure 2 and Table 2) [40]. The NHTRC is referenced within the TVIT and provides a list of general indicators that clinicians may encounter during their assessments. The clinician’s verbiage should not expressly state “human trafficking” but should be generalized to avoid making the patient feel uncomfortable and alerting the patient’s companion (likely their trafficker). If the health care provider believes the patient may be a victim of human trafficking, the provider should discreetly refer the patient to a nurse or social worker for further assessment. Third, if criteria are met, a nurse or social worker should interview the patient in a private setting and out of sight of their companion [40]. The nurse or social worker should ask the victim a series of follow-up questions from the TVIT [8,10,40] (see Table 3, p. 35; Figure 3, p. 47). If the nurse or social worker believes the patient is a victim, and the patient is a minor, follow agency policy, make appropriate service referrals, alert the National Human Trafficking Hotline by calling 1-888-373-7888 or e-mailing NHTRC@PolarisProject.org, and file a report with the state’s Children, Youth, and Families Department as required by law [1] (see Table 3, p. 35; Figure 3, p. 47). If the nurse or social worker believes the patient is a victim, and the patient an adult, follow agency policy, make appropriate service referrals, and file a report with the National Human Trafficking Hotline [18] by calling 1-888-373-7888 or e-mailing NHTRC@PolarisProject.org (see Table 3, p. 35; Figure 3, p. 47).

fig 2

Figure 2: Human trafficking assessment tool algorithm for health care providers

Table 2: Human Trafficking Assessment Tool, Table of Steps for Health Care Providers

1) Front-staff have discreetly alerted the health care provider about a possible human trafficking victim. Go to step 2.
2) The health care provider will perform a thorough physical examination while assessing for psychological and physical abuse, traumatic experiences, chronic substance abuse, or violent physical and psychological assaults. The clinician will look for signs and symptoms of human trafficking abuse by utilizing the National Human Trafficking Resource Center’s Identifying Victims of Human Trafficking: What to Look for in a Healthcare Setting. Accurate document the patient’s treatment and services offered. Go to step 3.
3) Based on the health care provider’s clinical judgement, does the health care provider believe that the patient may be a victim of human trafficking? If yes, go to step 4. If no, go to step 5.
4) The health care provider should accurately document patient’s injuries and treatment, and discreetly refer patient to an RN or SW for further evaluation.
5) Stop the assessment.

Note: Adapted from National Human Trafficking Resource Center. (n.d) Identifying victims of human trafficking: What to look for in a healthcare setting. http://surl.li/dshkj

Table 3: Human Trafficking Assessment Tool, Table of Steps for Nurse or Social Worker

1) The health care provider has discreetly alerted the nurse or social worker about a possible human trafficking victim. Go to step 2.
2) The nurse or social worker will discreetly conduct the Vera Institute of Justice’s Trafficking Victim Identification Tool in private, away from the patient’s companion. Go to step 3.
3) Based on the nurse or social worker’s clinical judgement, does the nurse or social worker believe that the patient is a victim of human trafficking? If yes, go to step 4. If no, go to step 7.
4) Is the patient a minor? If yes, go to step 5. If no, go to step 6.
5) The nurse or social worker should follow agency policy, make appropriate service referrals, alert the National Human Trafficking Hotline by calling 1-888-373-7888 or e-mailing NHTRC@PolarisProject.org, and file report with the state’s Children, Youth, and Families Department.
6) The nurse or social worker should follow agency policy, make appropriate service referrals, and file a report with the National Human Trafficking Hotline by calling 1-888-373-7888 or e-mailing NHTRC@PolarisProject.org.
7) Stop the assessment. Accurately document patient findings and services rendered.

Note: Adapted from Vera Institute of Justice. (2014). Screening for human trafficking: Guidelines for administering the trafficking victim identification tool. Vera Institute of Justice. https://humantraffickinghotline.org/sites/default/files/human-trafficking-identification-tool-and-user-guidelines.pdf

fig 3

Figure 3: Human trafficking assessment tool algorithm for nurse or social worker

Impact and Significance

It is imperative that health care providers accurately document patients’ injuries and treatment and clearly distinguish between sexual exploitation or forced labor when reporting to law enforcement officers [41]. Studies have shown that police efforts mainly focus on sex trafficking cases instead of labor trafficking [42] Introduction section). In 2017, only 225 labor trafficking offenses were reported by police to the FBI’s Uniform Crime Reporting Program, representing only 18 percent of the total reported human trafficking offenses reported [42], Introduction section). Law enforcement often has difficulty distinguishing labor trafficking victims from legitimate workers because they work in intermingled conditions [42], Challenge 1 section). Without evidence that the forced labor victims suffered physical abuse, “law enforcement officers are skeptical that prosecutors will accept domestic servitude cases” [42], Challenge 3 section). The Trafficking Victims Protection Act of 2000 and the creation of the Civil Rights Division in the Department of Justice’s Human Trafficking Prosecution Unit within the Criminal Section in 2007 enables prosecutors to work with law enforcement agencies and attorneys to investigate human trafficking cases [30,36]. However, without the exchange of information between health care providers and law enforcement, efforts to identify and rescue human trafficking victims in the community is extremely limited [36]. Generally, victims who escape their traffickers seek assistance from and confide in health care providers instead of police [36]. There exists a gap in the connection between the two entities, which delays the early victim intervention and identification, often resulting in severe physical and mental injuries to victims [30,36]. Evidence suggests that health care providers should be trained by law enforcement officials assigned to a human trafficking task force [19] to ensure that clinicians recognize the warning signs that victims may present with, become familiar with intervention techniques, and understand how to deploy the task force’s protocols for rescue [36]. Collaborating efforts between law enforcement officers and health care providers can assist the human trafficking population. Because health care providers and victims have regular contact, if clinicians worked with law enforcement task forces, more victims could be identified and rescued [36]. Victims benefit from case management services from an interdisciplinary team. This joint approach provides comprehensive protection. Social workers can assist with connecting the patient with community resources for food, shelter, and clothing. Health care providers can render medical aid and provide hotline numbers for local anti-trafficking services such as the NHTRC [6,36]. Therapists can help the victim develop coping skills and reduce the symptoms of mental illness. Law enforcement officers who are trained in human trafficking can “identify the indicators of a human trafficking situation, secure evidence for subsequent prosecution, and refer victims to social service providers” [43].

Evidence Search Strategy, Results, and Evaluation

The search for current, 2016-2021, peer-reviewed articles which were published in academic journals was conducted via the University of St. Augustine for Health Sciences online library. These databases included Search University of St. Augustine (USA), PubMed, GALE, Cumulative Index to Nursing and Allied Health Literature (CINAHL), Medical Subject Headings (MeSH), and Science Direct. Google Scholar was also utilized to locate open access articles. The following search terms were used to locate articles specific to this study: Human trafficking, sex trafficking, forced labor, human trafficking assessment tool, human trafficking algorithm, human trafficking assessment, human trafficking screening protocol, human trafficking policy, human rights, sexual exploitation, labor exploitation, domestic servitude, sex industry, commercial sex, trauma, United States, America, child welfare, homelessness, migrants, runaways, primary care providers, emergency department, health care providers, clinicians, nurses, nurse practitioners, legal nurse consultant, physician assistants, emergency room, emergency department, human trafficking persons, missing persons, adults, female, prostitutes, pimps, young adults, children, youth, adolescents, juveniles, and pediatrics. Variations of these terms were used to ensure detailed search results. The exclusion criterium was years prior to 2015. The results of the search yielded 21 research articles. One article dealt solely with sanctions and was eliminated from the selection. Several research articles were not of or related to America or the United States and were excluded.

Themes from Evidence Review

The main themes found in the literature were compared with national protocols, regulations, position statements, and accreditation standards. The literature included themes that human trafficking victims often go unrecognized by health care providers, staff lack human trafficking education, there is the need for a validated, reliable, and standardized human trafficking assessment tool, a multidisciplinary team approach is vital, and the law is explicit about human trafficking.

Human Trafficking Victims are not Recognized by Health Care Providers

A trend that was supported by the literature is that the use of a human trafficking assessment tool in the health care setting is necessary to help health care providers recognize victims of human trafficking. Leslie [2-5] and Stevens [7] concluded that health care providers are often the only professionals to interact with trafficking victims who are still in captivity, but these patients go unrecognized because clinicians do not assess for human trafficking (see Appendix A, pp. 49, 51-52, 54; Appendix B, pp. 57-58, 62, 65). Eighty-seven percent of victims were not recognized by their health care providers [1].

Staff Lack Human Trafficking Education

There were several recommendations for providing specialized human trafficking education to bridge the gap in staff knowledge and skills. Health providers and law enforcement officers are often unfamiliar with human trafficking signs and symptoms [10,36,42]. Results of the study reflect the need for formal education, screening, and treatment protocols for health care personnel and forensic investigators to guide the identification and rescue of victims of human trafficking [1,35,41]. Interviews revealed that the experience, approach, and content varied widely [44]. Potential improvements in current training approaches included standardization of training, metrics to evaluate and develop the evidence base for training impact, funding opportunities, survivor integration, and incentives to encourage training [44]. Providing education and screening tools improved recognition of trafficking victims and improved recognition of patients in other types of abusive situations, such as domestic violence and sexual assault [1] (see Appendix A, pp. 54-55; Appendix B, pp. 57-59, 62-63).

Need for a Validated Human Trafficking Assessment Tool

The most frequently cited intervention for identifying human trafficking victims was the use of a validated and standardized human trafficking assessment tool. Of the 14 descriptive non-experimental research articles of good quality, six resources agreed on recommendations to provide health care providers with a reliable and standardized assessment tool to improve recognition of trafficking victims by systematically detecting red flags and indicators [1,2,4,5,7,8,10,34,40] (see Appendix A, pp. 48-49, 52-54; Appendix B, pp. 60, 62-65). Both Leslie [2] and Powell, Dickins, and Stoklosa, [44] found that a validated and standardized method of screening increases the degree at patients experiencing sexual and labor exploitation will be identified (see Appendix A, pp. 52, 54; Appendix B, pp. 60, 63). Utilizing the TVIT to identify human trafficking victims ensures that key information is correctly and consistently provided to all health care providers [8,13,40].

Interprofessional Collaboration

Six articles examined the need for a multidisciplinary team approach [3,4,7,10,36,41] identified emergency room nurses, risk managers, and clinical educators (pp. 30-32). McDow & Dols (2020) [4] named “nurse managers, health care providers, ultrasound technicians, nursing assistants, and volunteers” (p. e1). Health care professionals and law enforcement officials should unite to identify and rescue victims [36]. Multidisciplinary teams should be educated to assist victims [10]. Stevens & Dinkle [7] identified administrators, technology teams, primary care providers, and staff as members of the interdisciplinary team (p. e2) (see Appendix A, pp. 50, 52, 54, 56; Appendix B, pp. 58, 60, 61).

The Law Is Explicit about Human Trafficking

Health care providers are required by this southern state’s Administrative Code NMAC 7.1.14 to call the ANE Hotline, 1-800-445-6242, that an incident of abuse, neglect, exploitation, suspicious injury, environmental hazard, or death has occurred (New Mexico Department of Health-[29], n.d.). Child Protection Services must be alerted as required by law [1]. There are child abuse laws [1]. The law specifies that there are no child prostitutes [8]. Child soldiering, debt bondage, and bonded labor are unlawful [1,2]. Child Protection Services must be alerted as required by law [1]. Federal law requests human trafficking training for health care providers [2]. Low human trafficking detection results from ineffective laws [2]. Child soldiering, debt bondage, and bonded labor are unlawful [2]. There are mandatory reporting laws and safe harbor laws [2,10,21,26]. Federal law does not require proof that a defendant used force, fraud, or coercion to determine the action of trafficking when the victim is a minor [3] (see Appendix A, pp. 48-51, 54-55; Appendix B, pp. 57-60, 62-64).

Best Practice Recommendations

A thorough review of the literature guided these evidence-based guidelines and recommendations to improve human trafficking practice for health care providers. Evidence from the literature proved that human trafficking victims often go unrecognized by health care providers. Based on the conclusions drawn from the evidence, the following practice recommendations are encouraged. 1) Health care providers should seek assistance from multidisciplinary teams comprised of front desk staff, nurses, health care providers, social workers, therapists, ultrasound technicians, nursing assistants, volunteers, and law enforcement. 2) The teams should be trained in human trafficking to keenly identify victims, assess victim needs, efficiently employ a victim-service delivery model, accurately document patient injuries and treatment, and report incidents of violence and victimization according to institutional policy, thereby allowing law enforcement to investigate allegations and rescue victims [41]. 3) Research established the need for a validated, reliable, and standardized human trafficking assessment tool, which would be useful for increasing the number of identified victims by health care providers who are knowledgeable about human trafficking red flags and victim indicators [1,2,4,5,7,8,10,40]. 4) Health care providers in this southwestern American state, because of their obligation to promote the well-being of patients, have an ethical obligation to take appropriate action to avert the harms caused by human trafficking that includes mandatory reporting to remain compliant with state law (New Mexico Department of Health [29].

Endorsements

These human trafficking evidence-based guidelines and recommendations are endorsed by the Emergency Nurses Association (ENA)-[45] and the International Association of Forensic Nurses (IAFN). In their joint human trafficking position statement, the ENA and IAFN support health care providers “appropriate education and training” about human trafficking, working collaboratively with community partners and criminal and civil justice systems, and reporting suspicions or behaviors as required by law (Emergency Nurses Association, 2018) [45]. In addition, the American Academy of Pediatrics Policy Statement on Global Human Trafficking and Child Victimization recommends that health care providers serving children be trained about human trafficking and its relation to immigration [34,35].

Conclusion

Human trafficking is a federal and international crime and is commonly regarded as one of the most pressing human rights issues of our time. Adult and minor victims are trafficked by force (rape, beatings, confinement), fraud, and coercion (Department of Homeland Security, 2020) [12]. Early identification of human trafficking victims by their health care providers is critical because the average life expectancy of a human trafficking victim is seven years [6]. To increase efficacy, research recommends that health care providers should be adequately trained and use a validated, reliable, and standardized human trafficking assessment tool such as the Vera Institute of Justice-[40]’s Trafficking Victim Identification Tool [8,10,40]. Health care providers should seek assistance from multidisciplinary teams that include law enforcement [4,36,40]. This practice will help streamline victim identification, assess victim needs, employ a victim-service delivery model, and report incidents of violence and victimization with efficiency. The purpose of this policy is to increase clinician human trafficking efficacy by introducing best practice guidelines and recommendations for health care providers [46-50].

References

  1. Egyud A, Stephens K, Swanson-Bierman B, DiCuccio M, Whiteman K (2017) Implementation of human trafficking education and treatment algorithm in the emergency department. Journal of Emergency Nursing 43: 526-531. [crossref]
  2. Leslie J (2018) Human trafficking: Clinical assessment guideline. Journal of Trauma Nursing, 25: 282-289. [crossref]
  3. Mason S (2018) Human trafficking: A primer for LNCs. Journal of Legal Nurse Consulting 29: 28-33.
  4. McDow J, Dols JD (2020) Implementation of a human trafficking screening protocol. The Journal for Nurse Practitioners.
  5. Mostajabian S, Santa Maria D, Wiemann C, Newlin E, Bocchini C (2019) Identifying sexual and labor exploitation among sheltered youth experiencing homelessness: A comparison of screening methods. International Journal of Environmental Research and Public Health 16.
  6. Diagnosing human trafficking when a patient is a victim (2017) Patient Safety Monitor Journal.
  7. Stevens C, Dinkel S (2020) From awareness to action: Assessing for human trafficking in primary care. The Journal for Nurse Practitioners e1-e5.
  8. Chisolm-Straker M, Sze J, Einbond J, White J, Stoklosa H (2019) Screening for human trafficking among homeless young adults. Children and Youth Services Review 98: 72-79.
  9. Miccio-Fonseca LC (2017) Juvenile female sex traffickers. Aggression and Violent Behavi, 35: 26-32.
  10. Peck JL (2020) Human trafficking in the clinical setting: Critical competencies for family nurse practitioners. Advances in Family Practice Nursing 2: 169-186.
  11. Wilks L, Robichaux K, Russell M, Khawaja L, Siddiqui U (2021) Identification and screening of human trafficking victims. Psychiatric Annals 51: 364-368.
  12. Department of Homeland Security (2020) Human trafficking 101 information sheet.
  13. The United States Department of Justice. (n. d.) Department of Justice components.
  14. United States Department of Justice, 18 U.S.C § 1591 (2020) Sex trafficking of children or by force, fraud, or coercion.
  15. United States Department of Justice. (2020) Child sex trafficking.
  16. Prylinski KM (2020) Tech Trafficking: How the internet has transformed sex trafficking. The Journal of High Technology Law 20: 338-372.
  17. United Nations Office of Drugs and Crime (2020) Global report on trafficking in persons.
  18. National Human Trafficking Hotline. (2020) Sex trafficking.
  19. Cook County Human Trafficking Task Force (2020) Human Trafficking Model Policy for Healthcare.
  20. Department of Health & Human Services, Administration for Children & Families Office on Trafficking Persons, Fact Sheet: Human Trafficking. (2021) Fact sheet: Human trafficking.
  21. National Human Trafficking Hotline (2011) Human trafficking assessment tool for educators.
  22. National Human Trafficking Hotline. (n.d.) Recognizing the signs.
  23. National Human Trafficking Resource Center. (n.d.) Identifying victims of human trafficking: What to look for in a healthcare setting.
  24. Polaris Project (2020) 2019 data report: The U.S. national human trafficking hotline.
  25. The Human Trafficking Institute (2019) 2019 federal human trafficking report: New Mexico state summary.
  26. Scott JT, Ingram AM, Nemer SL, Crowley DM (2019) Evidence‐based human trafficking policy: Opportunities to invest in trauma‐informed strategies. American Journal of Community Psychology 64: 348-358. [crossref]
  27. United States Department of State. (2004) Trafficking in Persons Report.
  28. Moore JL, Houck C, Hirway P, Barron CE, Goldberg AP (2020) Trafficking experiences and psychosocial features of domestic minor sex trafficking victims. Journal of Interpersonal Violence 35: 3148-3163. [crossref]
  29. New Mexico Department of Health. (2021) Abuse, Neglect, and Exploitation Reporting Guide, State Fiscal Year 2021.
  30. Roney, L. N., & Villano, C. E. (2020) Recognizing victims of a hidden crime: Human trafficking victims in your pediatric trauma bay. Journal of Trauma Nursing 27: 37-41. [crossref]
  31. Banu S, Saunders J, Conner C, Blassingame J, Shah AA (2021) Mental health consequences of human trafficking. Psychiatric Annals 51: 368-371.
  32. Miller AJ, Arnold-Clark J, Brown KW, Ackerman-Brimberg M, Guymon M (2020) Featured counter trafficking program: The law enforcement first responder protocol. Child Abuse & Neglect 100. [crossref]
  33. Acharya AK (2019) Prevalence of violence against indigenous women victims of human trafficking and its implications on physical injuries and disabilities in Monterrey city, Mexico. Health Care for Women International 40: 829-846. [crossref]
  34. Greenbaum J, Bodrick, N. (2017) Global human trafficking and child victimization. Pediatrics 140: 1-12. [crossref]
  35. Greenbaum J, Stoklosa H (2019) The healthcare response to human trafficking: A need for globally harmonized ICD codes. PLoS Medicine 16. [crossref]
  36. Helton M (2016) Human trafficking: How a joint task force between health care providers and law enforcement can assist with identifying victims and prosecuting traffickers. Health Matrix 26: 433-473. [crossref]
  37. Clay-Warner J, Edgemon TG, Okech D, Anarfi JK (2021) Violence predicts physical health consequences of human trafficking: Findings from a longitudinal study of labor trafficking in Ghana. Social Science & Medicine (1982) 279. [crossref]
  38. Ottisova L, Smith P, Oram S (2018) Psychological consequences of human trafficking: Complex posttraumatic stress disorder in trafficked children. Behavioral Medicine 44: 234-241. [crossref]
  39. Marburger K, Pickover S (2020) A comprehensive perspective on treating victims of human trafficking. The Professional Counselor 10: 13-24.
  40. Vera Institute of Justice (2014) Screening for human trafficking: Guidelines for administering the trafficking victim identification tool. Vera Institute of Justice.
  41. Nogalska AM, Henderson HM, Cho SJ, Lyon TD (2021) Police interviewing behaviors and commercially sexually exploited adolescents’ reluctance. Psychology, Public Policy, and Law 27: 328-340.
  42. Farrell A, Bright K, de Vries I, Pfeffer R, Dank M (2020) Policing labor trafficking in the United States. Trends in Organized Crime, 23(1), 36. https://doi.org/10.1007/s12117-019-09367-6
  43. Clawson HJ, Dutch N, Cummings M (December 2016) Law enforcement response to human trafficking and the implications for victims: Current practices and lessons learned. U.S. Department of Justice.
  44. Powell C, Dickins K, Stoklosa H (2017) Training US health care professionals on human trafficking: Where do we go from here?. Medical Education Online 22. [crossref]
  45. Emergency Nurses Association (2018) Joint position statement: Human trafficking awareness in the emergency care setting.
  46. Centers for Disease Control and Prevention. (2016) CDC’s policy analytical framework.
  47. Department of Veterans Affairs (2017) Veterans Health Administration’s Directive 1199.
  48. First Nations Community Healthcare (2021) Sex trafficking services.
  49. Johns Hopkins Medicine (2021) Johns Hopkins nursing evidence-based practice appendix C: Evidence level and quality guide.
  50. Johns Hopkins Medicine (2021) Johns Hopkins evidence-based practice model.