Monthly Archives: November 2022

fig 1

Direct Air Capture and Removal of Gigatons of CO2 Offers Hope for Climate Recovery

DOI: 10.31038/GEMS.2022432

Abstract

The Summer of 2022 caused China’s heat wave to shatter records, bringing the country’s hydropower electricity into question, while in the U.S. it delivered five 1,000-year rain events in five weeks to several Midwest states.1 It is proposed that the linear, inextricably tight correlation between global CO2 values and global temperature, delineated and publicized by James Hansen and others, will finally create an urgency in the minds and hearts of all people, so that international direct air carbon capture by the gigaton can begin in earnest and in parallel with carbon-free fuels, zero carbon emissions, renewable energy, and even negative carbon emissions, implemented worldwide. This dual track proposal can immediately begin the reversal of global temperature in direct proportion to the decrease in the excess, heat-trapping atmospheric CO2. In that way, more time will be allocated for the world to convert to 100% renewable energy and thus begin to drastically reduce its carbon emissions, which add about 40 gigatons of CO2 to the air blanket above us every year. The second phase of the X-Prize Carbon Removal for the 2022 million dollar candidates, among other industrial processes already in motion, will demonstrate novel and inexpensive methods for capturing billions of tons of atmospheric carbon dioxide for permanent removal in 2025. This contest adds to other hopeful signs for global reversal of temperature and sea level rise.

Introduction

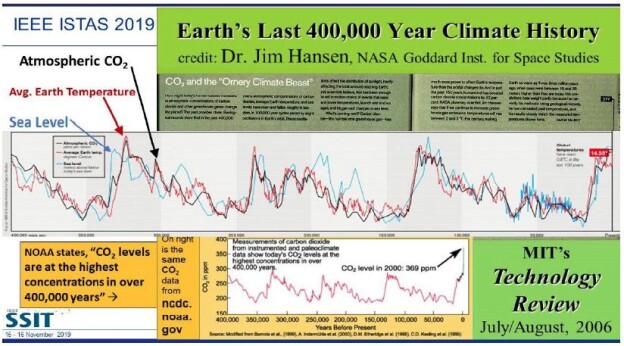
As global warming becomes more pronounced, obvious, and severe, the term “climate emergency” is re- emerging as a clarion call. Bill McGuire, author of Hothouse Earth: An Inhabitant’s Guide, says we need to be “hard-hitting enough to galvanize action and trigger behavioral change” with the aftermath of wildfires and floods [1,2]. Others, such as Professor Naomi Oreskes from Harvard University, have a more pessimistic view of “Wishful Thinking in Climate Science” since many programs around the world have small throughput, high cost per ton, or have simply been canceled after millions spent on the attempt [3]. Adam Vaughan agrees, noting that most major carbon capture and storage projects have not met their targets [4]. Meanwhile, the Amazon rainforest may have reached a crucial tipping point which will turn forest into a savannah according to a recent report from nine countries and territories that encompass the Amazon region [5]. Therefore, we need to have a “longtermism” attitude instead of a dystopian view, according to Professor William MacAskill, author of What We Owe the Future, as he insists that “improving the world for future generations is one of humanity’s most pressing tasks that urgently demand our attention [6]. My work in this area [7-9] has focused on the stellar work by James Hansen, who in 1988 was the first to predict a global “greenhouse effect” from a 3-D model developed at the NASA Goddard Institute for Space Studies but using the onerous phrase “climate forcing [10].” Since such a concept was not yet accepted by the public, the paper was shunned by academic critics and Hansen was declared to be “wrong” by most of the media at the time, threatened to lose his job, and generally criticized by everyone. In Figure 1, a slide from one of my presentations (ref. 7), offers a reproduction of Hansen’s now famous climate graph of the earth’s 400,000 year history, including the surprisingly overlapping plots of global temperature, CO2 and sea levels, along with a corroborating NOAA graph for the same period of time.

fig 1

Figure 1: Earth’s 400,000 year history of temperature, carbon dioxide and sea levels

In 1999, the Vostok ice core 420,000-year record of carbon dioxide was published by Petit et al. [11] Exhibiting great stability, the CO2 levels clearly have never exceeded 290 ppm worldwide even through four ice ages. However, in the isolated monitoring station cited above for our modern, with our wanton fossil fuel carnage, the latest global carbon dioxide levels have now exceeded 410 ppm, with apparent disregard for the consequences. Notice in Figure 1 the important clearly tight correlation of temperature (blue graph) and carbon dioxide (red graph) for the past 420,000 years, which leads us to the obvious problem of the red line at the far-right side (present time), which extends dramatically above the maximum seen in the graph for the past 400,000 years. We are forced to admit the historic red and blue data lines don’t lie, so the axis label of CO2 concentration on the left necessarily correlate to the axis label of global temperature on the right. This is the most important realization that arises from Hansen’s Table of vertical axis variables that are found in this 2006 MIT Technology Review article [12]. While climatologists know this relationship exists, the United Nations Environmental Program (UNEP) and the International Panel on Climate Change (IPCC) among others are slow to realize the consequences of the present CO2 excess, which now surpasses 40% of the maximum 290 ppm the earth has ever experienced in over 420,000 years. The Hansen Equation that emerges from his Table of data becomes the key with:

(+/-) 20 ppm of CO2 = 1°C = 20 m change in sea level. Eq. (1).

Thus, it is vital to understand from Hansen’s careful measurement and plotting of the Vostok data, into the Hansen Equation summarizing it in a condensed form that we are indebted for at least 8 degrees C increase in temperature, which will manifest approximately by 2100 with the business-as-usual scenario [13]. Even a 6°C increase worldwide by 2100 will be devastating and is considered a mass extinction event [14]. Mark Lynas, author of Our Final Warning: Six Degrees of Climate Emergency, predicts that a five-degree world is where the tropics and sub-tropical regions are subjected to year-round deadly heat with large areas of uninhabitable zones, due to the high temperatures. Global food production will be decimated with ground-based agriculture only possible in diminishing zones of habitability in the highest latitudes. He also suggests that a five-degree world will have surviving humans crammed into refugee areas in Greenland and the Antarctic Peninsula, similar to the Eocene Period 50 million years ago with similar temperatures and CO2 levels. “Six-degrees sees the greatest mass extinction ever on Earth, greater than the end-Permian cataclysm that destroyed 90% of species alive at the time.” He further notes that our present rate of carbon emissions is about ten times the rate that of the end-Permian period and actually unprecedented in all of geological history [15]. The uninhabitable earth scenario is presently upon us, with each decade becoming hotter by about one degree C, unless something drastic is done to the atmosphere globally, such as iron fertilization of the oceans to periodically create algae blooms, geoengineering the atmosphere with albedo reflectivity particles which have been proven to settle on the earth’s surface soon after, or the simplest and perhaps the safest: gigaton direct air capture to reduce the amount of carbon dioxide in the air [16].

Direct Air Carbon Capture

To be considered as mankind’s only real recourse to practically reverse the inexorable temperature rise in the same time frame it took to go up, while grabbing the same amount of carbon that went up, Direct Air Capture (DAC) is the latest and growing trend among large movers and shakers, such as the X-Prize Carbon Removal https://www.xprize.org/prizes/elonmusk and Project Vesta https://www.vesta.earth/. Using a special type of carbon-removing sand made of a natural mineral olivine, Project Vesta accelerates the earth’s own long-term process of rock weathering by grinding olivine minerals into sand and letting the ocean react with it to bind CO2 permanently in seawater over decades [17]. Vesta.earth has received endorsement from MIT Technology Review, The Guardian, and the National Academies of Sciences, Engineering, and Medicine, besides Bill Gates. Along the same lines, Professor David Beerling at the University of Sheffield, UK, has found that ground up basalt can also absorb carbon from the air. His plan is to sprinkle it on farm lands in the UK to absorb 6 to 30 million tonnes of carbon dioxide per year, which would meet about half of the UK’s net-zero target [18]. One of the 15 X-Prize Milestone winners, who go onto the three-year development stage is Captura from Pasedena CA, which is doing just the opposite process. Captura is developing CO2 capture and sequestration technology for extracting CO2 from oceanwater that is scalable to Mton/year – Gton/year to meet the rapidly growing demand in the carbon credit market. Captura’s approach leads capture of high-purity CO2 and restores pH balance in oceanwater. Another Milestone Award Winner is the Pennsylvania State University which proposes to use millions of African farms to sequester up to 1 gigaton per year of CO2 from the air https://plantvillage.psu.edu/. (Note: The “gigaton” and the metric version “gigatonne” are very close within a few percent in value so they are used interchangeably in this article). Credit must be given to Elon Musk for envisioning this standard process repeatedly used throughout the history of the technological age to rapidly develop a new process that does not presently exist: offer a huge cash prize for the winner. Here, the grand X-Prize winner in 2025 will receive $100 million from the Musk Foundation for the best gigaton carbon dioxide removal scheme. As the xprize.org website states, “The climate math is becoming clear that we will need gigaton-scale carbon removal in the coming decades to avoid the worst effects of climate change. The International Panel on Climate Change (IPCC) estimates the need at approximately 10 gigatonnes of net CO2 removal per year by the year 2050 in order to keep global temperature rise under 1.5 or 2C. As governments, companies, investors, and entrepreneurs make plans to meet this challenge, it is clear that we will need a range of carbon removal solutions to be proven through demonstration and deployment to complement work that is already underway. If humanity continues on a business-as-usual path, the global average temperature could increase 6°C by the year 2100.

“This four-year global competition invites innovators and teams from anywhere on the planet to create and demonstrate solutions that can pull carbon dioxide directly from the atmosphere or oceans, and sequester it durably and sustainably. To win the grand prize, teams must demonstrate a working solution at a scale of at least 1000 tonnes removed per year; model their costs at a scale of 1 million tonnes per year; and show a pathway to achieving a scale of gigatonnes per year in future. “Any carbon negative solution is eligible: nature-based, direct air capture, oceans, mineralization, or anything else that achieves net negative emissions, sequesters CO2 durably, and show a sustainable path to achieving low cost at gigatonne scale.” Mission Zero Technologies and Project Hajar became another $1M Milestone Award Winner while developing direct air capture (DAC) technology that will recover high-purity CO2 from the air while incurring only a fraction of the costs and energy it takes to do so today. It has received seed funding from a number of sources https://www.missionzero.tech/news to produce a 100+ ton/year DAC pilot plant in the UK and elsewhere, which stores atmospheric carbon in the peridotite rock of the upper mantle of the earth. However, very few of these competitors in the X-Prize seem to be capable of providing a “pathway” to even a “net 10 gigatons/year” of carbon removal from the air (which technically should be a gross amount of 50 gigatons/year to offset the 40 Gt/yr we send up there each year). One ray of hope, among many workable climate solutions, is the recent discovery of an alloy of gallium, indium, and tin that is liquid at room temperature and conducts electricity. By spiking the silvery mixture with a sprinkling of catalytically active cerium and placing it inside a glass tube, along with a splash of water, scientists have now proven a room temperature method to convert CO2 to carbon, instead of the usual high temperature procedure. Chemists Dorna Esrafilzadeh and Torben Daeneke at RMIT University in Melbourne, Australia, turned to a new class of catalysts made from metal alloys that are liquid at room temperature [19]. This is a process that can be scaled up, since it is catalytically driven, and may someday offer a novel and inexpensive method for capturing billions of tons of atmospheric carbon. Such inventions and ongoing projects are the main focus of this short update on carbon capture, removal and storage. A noteworthy comment summarizing large-scale gigaton carbon capture is Professor Chris Jones from Georgia Institute of Technology. “These approaches are low cost at under $100 per ton of captured CO2, ‘but there’s only so much land change you could make to capture a significant amount,’ he says. ‘We need to capture 10 gigatons per year for negative emissions by 2060. Land and biomass approaches only scale to a few gigatons.’ Of known carbon-removal techniques, two hold the most promise, he says, citing a recent National Academies report. One is DAC and the other is carbon mineralization. “Nothing prevents us from scaling these up to the 10 gigatons per year scale needed aside from a commitment, coordination and cooperation [20]. In the same article, Raghubir Gupta from Sustaera https://www.sustaera.com/ boasts the largest carbon capture record so far at the lowest cost (also a Milestone winner). “One big thing we have that not many others have is practical experience of scaling up the technology to 1,000 tonnes/day carbon dioxide capture,” he says. “With that background when we looked at CO2 removal from air, we thought the two things that are most important to really make a difference are cost and scale. It’s not the efficiency of the process [21].

Sustaera uses cheap sodium carbonate to adsorb CO2. It coats the material on a high-surface area ceramic scaffold used in catalytic converters. The high surface area increases access to the sorbent and increases CO2 adsorption rate significantly. The energy advantage comes from using electricity instead of heat to separate the CO2 and regenerate the sorbent, at a cost of under $100/ton. To finish this section, my favorite DAC company, working since 2015 on this technology, is Carbon Engineering from Canada (Figure 2) https://carbonengineering.com/our-story/ producing synthetic fuel from the captured CO2 with AIR TO FUELSTM plants in several markets around the world. Their latest facility in the Permian Basin, US, is expected to capture one million tons of CO2 from the air annually when complete, so it can be permanently and safely stored deep underground in geological formations, using a potassium hydroxide sorbent coupled with a calcium caustic recovery loop in the process. They have also partnered with Storegga in the UK https://www.storegga.earth/ to accomplish one million tonnes of DAC annually.

fig 2

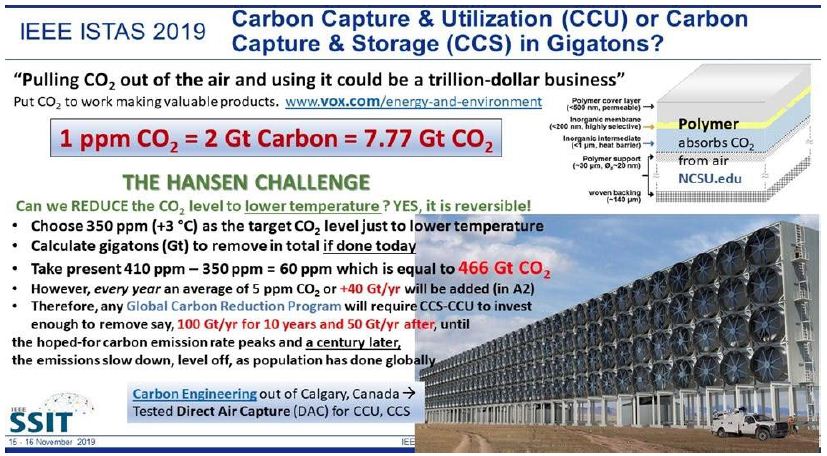
Figure 2: Hansen Challenge: All of the facts to convert any chosen number of excess CO2 in ppm to gigatons, where A2 is the business as usual scenario for carbon emissions worldwide.

The challenging calculation reflected in Figure 2 of the numbers results from an attempt to sequester 50 gigatons (with 40 Gt subtracted for many more decades to come) every year if the world is fortunate enough to discover a very inexpensive means to capture CO2 in that quantity reliably [22].

Conclusion

A proposed world recovery plan is directed the world’s government leaders and approximately one thousand billionaires to form a DAC Gigaton Consortium that takes multi-gigaton DAC seriously, beginning as soon as possible, in order to actually LOWER the earth’s 412 ppm of CO2 steadily each year for decades until 350 ppm and furthermore, the long-sought-after 290 ppm global level is reached. It is a guarantee, even as IPCC is now in 2022 beginning to realize, that without any more excess levels above 290 ppm (global maximum seen in 400,000 years of Figure 1), the world’s temperature will literally, inevitably, and steadily lower itself back down to a comfortably temperate zone. To the mathematicians and scientists who read this, Equation 1 is both positive and negative with all three variables proportionally and linearly dependent on the leading change which occurs first in time (CO2, temperature, or sea level), whether plus or minus. We as a species have been spoiled with about 10,000 years of an interglacial period, giving us moderate temperatures worldwide and now we have to pay dearly for the self-created disruption in the former stability in order to regain it once again. Each year that we wait to perform 50 GT/yr of DAC adds about 40 Gt to the total excess 466 Gt that needs to be removed to restore our planet to livable conditions.

References

  1. Cappucci, Matthew, Five 1,000-year rain events hit the U.S. in five weeks, Washington Post, Aug. 26, 2022.
  2. McGuire Bill (2022) Advertising Crisis, New Scientist.
  3. Oreskes, Naomi (2022) Wishful Thinking in Climate Science. Scientific American.
  4. Vaughan, Adam (2022) Most major carbon capture and storage projects haven’t met targets. New Scientist.
  5. Taylor Luke (2022) The Amazon rainforest has already reached a crucial tipping point. New Scientist.
  6. MacAskill William (2022) Planning Ahead. New Scientist.
  7. Valone Thomas (2019) Jacqueline Panting. Quantitative Carbon Dioxide, Temperature, and Sea Level Relation for the Future of Terrestrial Fossil-Fueled Technology, An Accurate Predictive Model Based on Vostok 420 kY Historical Record. IEEE International Symposium on Technology and Society (ISTAS) Proceedings, 15-16 November, School of Engineering, Tufts University, Medford MA. https://wwslideshare.net/ThomasValonePhD/valone-ieee-istas2019ppt-ver4-with-extra-slide-withlinks-at-end, sponsored by the IEEE Society for Social Implications of Technology.
  8. Valone, Thomas, Predictive Connection for 2100 between Atmospheric Carbon, Global Warming and Ocean Height Based on Climate History, International Journal of Environment and Climate Change, 9(10): 562-594, 2019; Article no.IJECC.2019.048, ISSN: 2581-8627, DOI: 10.9734/IJECC/2019/v9i1030140
  9. Valone Thomas (2020) Global Environmental Forecast and Roadmap Based on 420 kY of Paleoclimatology. Journal of Atmospheric Science Research 3.
  10. Hansen J, Fung I, Lacis A, Rind D, Lebedeff S, et al. (1988) Global climate changes as forecast by Goddard Institute for Space Studies three-dimensional model. Geophys. Res. 93: 9341-9364.
  11. Petit JR, Jouzel J, Raynaud D, Barkov NI, Barnola JM, et al. (1999) Climate and Atmospheric History of the Past 420,000 years from the Vostok Ice Core, Antarctica. Nature 399: 429-436.
  12. Hansen James (2006) CO2 and the Ornery Climate Beast. Technology Review.
  13. Brown Patrick, Ken Caldeira (2017) Greater future global warming inferred from Earth’s recent energy budget. Nature 552: 45-50.
  14. Six Degrees Could Change the World Geographic Society.
  15. Lynas, Mark (2020) Our Final Warning: Six Degrees of Climate Emergency, HarperCollins Publishers.
  16. Goodell Jeff (2010) How to Cool the Planet, Mariner Books, Houghton Mifflin Harcourt.
  17. Temple James (2020) How green sand could capture billions of tons of carbon dioxide. MIT Technology Review.
  18. Kantzas EP, Maria VM, Mark RL, Rafael ME, Phil R et al. (2022) Substantial carbon drawdown potential from enhanced rock weathering in the United Kingdom. Nature Geoscience 15: 382-389.
  19. Service, Robert F (2019) New way to turn carbon dioxide into coal could ‘rewind the emissions clock’, Science.
  20. Patel P (2022) XPrize Competitors Capture Carbon > $100 million at stake in CO2-removal face-off, IEEE
  21. Ibid, p. 6.
  22. Zeman F (2014) Reducing the cost of Ca-based direct air capture of CO2. Sci. Technol 48: 11730-11735.
fig 1

Foraminifera from a Middle Eocene Algal Reef Limestone at Burton Guyot (IODP Site U1376) in the Southwest Pacific

DOI: 10.31038/GEMS.2022431

Abstract

IODP site U1376 was drilled on Burton Guyot on the Louisville Seamount Trend in the South Pacific. Site U1376 encountered an algal reef limestone from 23.45-38.60 mbsf immediately overlying a 3 m thick basalt pebble conglomerate above the volcanic basement rocks in the area. This limestone section was reported as Cretaceous in age by the shipboard party based on possible late Cretaceous rudist fossils in the underlying conglomerate, but planktonic foraminifera suggest a Paleogene (possibly Eocene) age. Paleogene algal reefs are of interest as many have rhodophyte and macroforaminifera as the framework builders of the reef (foralgal reefs) and many represent an equilibrium reef stage during global warmth. Most known foralgal reefs such as the Salt Mountain Limestone of Alabama developed along continental shelves. Others such as Red Gal Ring in Jamaica and the Uitoé Limestone in New Caledonia developed within active tectonic zones. Site U1376 represents a unique opportunity to examine a foralgal reef which developed in isolation. The limestone section in site U1376 (referred to henceforth informally as the Burton Guyot limestone) consists of 15.15 m of rhodophyte coralline algal boundstones. Assemblages of both crustose and frondose forms of the rhodophytes occur in five distinct zonations within the Burton Guyot limestone. The zones of frondose rhodophytes represent a response to increasing accommodation (catch-up growth) produced by some combination of subsidence and rising eustatic sea level. The zones of crustose rhodophytes in the core represent the growth response during high stand (keep-up growth) and likely represent limited available accommodation space. Erosional surfaces at the tops of the crustose zones represent sea level change. In the initial shipboard description of the Burton Guyot limestone, only isolated foraminifera was reported. Examination of the thin-sections revealed numerous foraminifera. Planktonic foraminifera are more abundant than benthonic, and macroforaminifera are less abundant than in other foralgal reefs. In contrast to the foralgal reefs in the Gulf Coastal Plain, Jamaica, and New Caledonia, macroforaminifera play only a minor role in the framework of the reef structure. The planktonic foraminifera identified are Subbotina eocaena, Catapsydrax univcaus, Catapsydrax sp., Globorataloides quadrocarmeratus, Parasubbotina eocclova, Globigerina officinalis, Parasubbotina varianata, Turborotalia pomeroli, and Turborotalia frontosa. This assemblage indicates an age of middle Eocene (late Lutetian 41 Ma).

The middle Eocene foralgal reef that developed on Burton Guyot has a much simpler sedimentary architecture than the other foralgal reefs studied. This may be due to a dominant role of subsidence in the creation of accommodation on Burton Seamount. It may also be due to the direct interaction of oceanic process with the reef framework builders as opposed to interaction with continental margin processes. Further study of the Burton Guyot limestone may refine the paleoecologic controls on the development of isolated reefs during the Paleogene.

Introduction

The Integrated Ocean Drilling Program (IOPD) site U1376 was drilled on Burton Guyot as a part of Expedition 330 on the Louisville Sea Mount Trail in the Southwest Pacific (Figure 1). During drilling, an algal reef limestone (Subunit IIA of the expedition 330 Scientist, 2012) was encountered immediately overlying the volcanic basement units and a thin (3.3 m) basalt conglomerate. The algal reef limestone unit (here in referred to informally as the Burton Guyot limestone) is 15.15 meters in thickness and is overlain by shallow water volcanic sandstone and breccias. The unit is underlain by 3.3 m thick heterolithic basalt conglomerate lying directly on the volcanic basement. The Burton Guyot limestone is primarily a rhodophyte boundstone. The age of the Burton Guyot limestone is uncertain, having been reported as late Cretaceous by the Expedition 330 Scientist (2012) [1]. The age assessment was inferred by the presence of rudist fragments in the underlying conglomerate bed. The lack of rudists in the Burton Guyot limestone suggests a younger (Paleogene) in age. Koppers et al. (2012) suggested an age of ~65 Ma for the volcanic basement of the Burton Seamount. This is a Paleocene (Danian) age according to Gradstein et al.  2012 [2] and 2020 [3] and indicates that the Burton Guyot limestone is younger. Preliminary macroscopic examination of samples of the Burton Guyot limestone indicated the presence of both crustose and frondose rhodophytes. Additionally, some macroforaminifera were seen in the samples. The presence of these fossils and the inferred Paleogene age suggests the possibility that the Burton Guyot limestone may have originated as a foralagl reef. A foralgal reef is a bioherm where rhodophytes and macroforaminifea are the primary framework builders. They are the dominant type of reef found in the Paleocene and Eocene rocks worldwide. Foralgal reefs are of interest as they may represent a reef type which is in equilibrium with greenhouse climatic condition. Foralgal reefs may represent a model for future change in Neogene and Quaternary coral reefs. Some of the better known foralgal reefs include the Paleocene Salt Mountain Limestone of Alabama (Toulmin, 1941; Bryan et al. 1997) [4], the middle Eocene Red Gal Ring section in Jamaica (Robinson, 1974) and the middle Eocene Uitoe Limestone of New Caledonia (Harrison, 2013). While these three foralgal reefs are known to respond to change in relative sea level change, all three are in settings where the preserved eustatic signal is weak. The Salt Mountain foralgal reef developed at lowstand in a coastal plain setting influenced by salt tectonics. Both the Red Gal Ring and Uitoe foralgal reef s developed in active convergent tectonic settings. By contrast, the foralgal reef of the Burton Guyot limestone developed in isolation with accommodation produced by subsidence associated with Louisville Seamount Trail hotspot. Sequential change in the biofacies identified within the Burton Seamount limestone should record changes sea level associated with subsidence of the Louisville Seamount Trail and eustasy.

It is the purpose of this paper to examine thin sections of the Burton Guyot limestone for foraminifera with the goals of:

  1. Correlating this limestone to the geologic time scale of Gradstein et al. (2012) [2] via planktonic foraminiferal
  2. Describe the succession of the biofacies present in the Burton Guyot limestone to produce a relative sea level curve for the

fig 1

Figure 1: The general location of the study area [5]

Geologic Setting

The Louisville Seamount Trail is a Southeast-Northwest linear trend of seamounts located on the southwestern Pacific Plate from approximately 45° 32’ S, 157° 23’ W to the convergent boundary with the Australian Plate. OPD Expedition 330 the trend to better understand better the relationship between the geologic history of the Louisville Seamount Trail and the Hawaiian –Emperor Seamount Trail and whether a motion on two associated hotspots moved in concert (IOPD Expedition 330, 2012) [1]. IOPD site U1376 on Burton Guyot was the only site among the six drilled in Expedition 330 which encountered biohermal limestone. The Burton Guyot limestone is found from 23.45 meters below seafloor (mbsf) to 38.60 mbsf in site U1376 (Figure 2). The lithologic characteristics and core recovery of this unit did not permit an even sampling interval. A total of 22 samples were collected, and thin sections were prepared. These thin sections are housed in the biostratigraphy Laboratory at Ball State University. The sample location in the core and the lithologic description of each thin section are shown in Table 1. The Burton Guyot limestone was identified by Expedition 330 Scientists (2012) [1,5] as rhodophyte boundstone. While rhodophytes are abundant, detailed examination of the Burton Guyot limestone in thin sections reveals a diverse suite of carbonate lithologies. Wackestone, packstone, and grainstone are present in the thin section. All these lithologies contain abundant fossils fragments. Both crustose and frondose forms of the rhodophytes occur throughout the Burton Guyot limestone. In addition to the rhodophytes, abundant by fossil fragments of echinoderms, pelecypods, gastropods, ostracodes, and coral are present. Planktonic foraminifera, small benthic foraminifera, and macroforaminifera are rare throughout the core with the planktonic foraminifera being the most abundant. The detailed lithology of the studied interval is shown in Figure 1.

fig 2 (1)

fig 2(2)

Figure 2: The columnar section of the study area

Table 1: Description of the core samples

Location/Location IOPD

Expedition 330 -site U1376

Code Side

Sample NO

Depth

Dunham Classification

Lithology Description

3R 4W

31/33

1

0.69 cm

Mudstone Yellow to a creamy color, medium hard.
3R 4W

108/110

2

0.32 cm

Grainstone White color, hard, coral fragments, and fossils fragments.
3R 4W

133/135

3

1 m

Grainstone White to yellow color, hard, coral fragments.

Subbotina eocaena

3R 5W

40/42

4

0.28 cm

Grainstone White color, hard, Coral sp?, fossils fragments.

Alabamina sp.,

3R 5W

98/100

5

0.3 cm

Grainstone White color, hard, fossils fragments.
3R 5W

135/137

6

1 m.166 cm

Pack-Grainstone White color, hard, and fossils fragments.

Catapsydrax univcaus.

Catapsydrax sp.,

3R 6W

37/38

7

0.68 cm

Grainstone White color, hard, fossils fragments.

Heterostegina sp.,

3R 4W 4/6

8

2 m.204 cm

Pack-Grainstone Yellow to brown color, medium hard
4R 1W

25/27

9

0.69 cm

Pack-Grainstone White color, hard, fossils fragments.

Catapsydrax univcaus.

3R 6W

4/5

10

0.75 cm

Grainstone White color, medium hard, fossiliferous. Note: black grains might be resulted from leaching igneous rock
4R 2W

20/22

11

0.26 cm

Boundstone White to brown color, hard, a trace of fossil fragments.

Parasubbotina varianata

4R 2W

45/47

12

1 m.08 cm

Pack- Grainstone White to brown color, medium hard, traces of gastropod.
4R 3W

6/8

13

1 m

Grainstone White color, medium hard, fossiliferous.

Globorataloides quadrocarmertus Parasubbotina eocclova

Lagena sp.,

Discocyclina ( Discocyclina) marginata?

4R 3W

96/98

14

0.41 cm

Wack- Packstone White color, hard, fossils fragments.

Parasubbtina ecoclava.

4R 4W

5/6

15

0.50 cm

Grainstone White to brown color, medium hard Turborotalia pomeroli Cibicidoides micrus
4R 4W

27/29

16

0.78 cm

boundstone White color, medium hard, fossiliferous.

Globigerina officinaliss

4R 4W

90/92

17

0.35 cm

Grainstone White color with pink spots, medium hard, fossil fragments
4R 4W

75/77

18

0.5 cm

Grainstone Yellow to brown Color, medium hard, calcite grains appearance.

Paragloborotalia (Turborotalia)griffinoides

5R 1W

5

19

0.97 cm

Mud-Wackstone Gray to black color, very hard.
5R 1W

8/10

20

0.64 cm

Packstone White color, medium hard, abundant by gastropods and fossils fragments.
5R 1W

77/79

21

0.97 cm

Wack-Pacstone Brown to Black color, very hard.

Turborotalia frontosa

5R 1W

95/96

22

1m

Mudstone to Wackstone Gray to black color, medium hard

Results and Discussions

Abundance and Stratigraphic Distribution of Foraminifera, Site-U1376

Planktonic foraminifera were identified in thin-section throughout the Burton Guyot limestone. Ten species were identified in the studied interval. They include Catapsydrax unicavus, Catapsydrax sp., Globorotaloides quadrocameratus, Paragloborotalia griffiniodes, Parasubbbotina eoclava, Parasubbbotina varianta, Globigerina officinalis, Subbbotina eocaena, Turborotalia frontosa and Turborotalia pomeroli. Planktonic foraminifera are rare in the Burton Guyot limestone occurring in only 10 of the 22 studied thin-sections. Additionally, most of the species are represented by only a single specimen. The distribution of the planktonic foraminifera from the Burton Guyot limestone is shown in Table 2. Some benthic foraminifera were found in the thin-sections. These have been identified as Alabamina sp., Cibicidoides micrus, and Lagena sp., all long ranging taxa. Two specimens of macroforaminifera (Discocyclina marginata and Heterostegina sp,.) were also found in the thin-sections of the Burton Guyot limestone. The low number of macroforaminifera was surprising as other foralgal reefs around the world contain macroforaminifera as a conspicuous part of the fauna. The distribution of smaller benthic foraminifera and macroforaminifera in the Burton Guyot limestone are shown in Table 3. Assemblages of both crustose and frondose forms of the rhodophytes occur in five distinct zonations within the Burton Guyot limestone. The zones of frondose rhodophytes represent a response to increasing accommodation space (catch-up growth) produced by some combination of subsidence and rising eustatic sea level as shown in Figure 2.

Foraminiferal assemblages, it is only a minor component of those assemblages. Isotopic studies of C. unicavus indicate it occupied a deep planktonic habitat and its relative abundance at Burton Guyot are consistent with an environment characterized by subsidence. By comparison, the foraminifera from the other Paleogene foralgal reefs in the Salt Mountain Limestone of Alabama and the Uitoé Limestone of New Caledonia, are relatively more abundant in their respective sections as shown in Figure 3.

Table 2: Distribution of biostratigraphically important foraminifera in the Burton Guyot limestone

table 2


fig 3

Figure 3: The abundance and stratigraphic distribution of planktonic foraminifera at Site – U1376, in the form of a frequency diagram. The y-axis represents the species name, and the x-axis represents the percentage of species.

Across the LLTM (The Late Lutetian Thermal Maximum) Benthic foraminifera species were not extinct, but mild assemblage shifts indicate environmental disturbances, perhaps due to variations in the type of organic materials transported to the seafloor. Based on thin sections from this core, the representative benthic foraminifera assemblages are less prevalent in this section, with a distribution of less than 1% This provides insight into how the depth of the sea level has changed and been impacted by it as seen in Figure 4.

fig 4

Figure 4: The stratigraphic distribution and abundance of benthic foraminifera at Site U1376. Note that the x-axis displays the proportion of species.

Stratigraphic Range of Planktonic and Benthic Foraminifera (Eocene) Species

The two next figures show the age estimate of both planktonic and benthic foraminifera based on the biohrizonsLourens et al. 2004, which confirmed all the species are Eocene in age, as shown in Figures 5 and 6.

fig 5

Figure 5: Stratigraphic range of planktonic (Eocene) species

fig 6

Figure 6: Stratigraphic range of benthic foraminifera (Eocene) species

Biostratigraphy

The biozonation used in this study is that of Berggren [6] with modifications of Wade et al. (2011). he greatest number of samples containing planktonic foraminifera was obtained from the Burton Guyot Limestone Unit. At this locality, only nine biozones from the Paleocene and lower Eocene were recognized with certainty. The age of this unit based on the overlapping ranging of the rare planktonic foraminifera is Middle Eocene (late Lutetian- 47.8 Ma) in age as shown in Table 2.

Taxonomy of Foraminifera Planktonic Foraminifera

Order Foraminiferida (Eichwald, 1930)

Super Family Globigerinaceae (Carpenter, Parker and Jones, 1862)

Family Globigerinidae(Carpenter, Parker and Jones, 1862)


1- Subbotina eocaena (Guembel, 1968)

These species have a large size subbotiondes during the Eocene.

Stratigraphic range Zone E6?- to Zone O1. Early Eocene to Early Oligocene [6]

Geographic distribution at the middle latitude range.

Order Foraminiferida (Eichwald, 1930)

Super Family Globigerinaceae (Carpenter, Parker and Jones, 1862)

Family Globigerinidae(Carpenter, Parker and Jones, 1862)

2- Catapsydrax Univcaus (Bolli, Loblich, and Tappan, 1957) [7]

These species have a large size represent (only) in the Middle to Upper Eocene.

Stratigraphical range Zone E2 to Zone N6.

Geographical distribution at the Global range.

Order Foraminiferida (Eichwald, 1930)

Super Family Globigerinaceae (Carpenter, Parker and Jones, 1862)

Family Globigerinidae(Carpenter, Parker and Jones, 1862)


3- Globorataloides quadrocameratus [6]

Stratigraphic range Zone E2 to E16.

Geographic distribution these species have widely distributed in the tropical and high latitude.

The Age is Early Eocene to Early Oligocene.

Order Foraminiferida (Eichwald, 1930)

Super Family Globigerinaceae (Carpenter, Parker and Jones, 1862)

Family Globigerinidae(Carpenter, Parker and Jones, 1862)


4- Parasubbotina eocclova (Coxall et al. 2003)

Age Middle Eocene [6]

Stratigraphic Range Zone E7 to E9 (Coxall et al. 2003).

Geographic distribution; Theses species have widely distributed in the low to Middle latitudes.

Order Foraminiferida (Eichwald, 1930)

Super Family Globigerinaceae (Carpenter, Parker and Jones, 1862)

Family Globigerinidae(Carpenter, Parker and Jones, 1862)


5- Globigerina Officinaliss [8]

Age Middle Eocene to Oligocene [6]

Stratigraphical Range Zone E10 to Oligocene.

Geographical distribution; Theses species have widely distributed in the low to Middle Latitudes.

Order Foraminiferida (Eichwald, 1930)

Super Family Globigerinaceae (Carpenter, Parker and Jones, 1862)

Family Globigerinidae(Carpenter, Parker and Jones, 1862)


6- Parasubbotina varianata? (Olsson et al. )

Age is restricted from The Paleocene to lowermost Eocene

Stratigraphical Range Zone P1c to Zone E10.

Geographical distribution; Theses species have widely distributed in the high to low latitudes.

Order Foraminiferida (Eichwald, 1830)

Super Family Globigerinaceae (Carpenter, Parker and Jones, 1862)

Family Hedbergellidae (Loeblich and Tappan, 1961)


7- Turborotalia pomeroli [9]

Age Lower Eocene to Oligocene.

Stratigraphic Range Zone E10 to Oligocene.

Geographical distribution; Theses species have widely distributed in the Middle Latitudes.

Order Foraminiferida (Eichwald, 1830)

Super Family Globigerinaceae (Carpenter, Parker and Jones, 1862)

Family Hedbergellidae (Loeblich and Tappan, 1961)


8- Turborotalia frontosa [8]

Age Lower to Middle Eocene

Stratigraphical Range Zone E7 to Zone E11.

Geographical distribution; Theses species have world distributed.

Order Foraminiferida (Eichwald, 1930)

Super Family Globigerinaceae (Carpenter, Parker and Jones, 1862)

Family Globigerinidae(Carpenter, Parker and Jones, 1862)


9- Paragloborotalia (Turborotalia) griffinoides [6]

Age Eocene

Stratigraphical Range Zone E1 to Zone E16.

Geographical distribution; Theses species have widely distributed in the high latitudes.

B-Benthic Foraminifera

Class Foraminifera incertae sedis Order Lagenida

Superfamily Nodosarioidea Family Lagenidae


1- Lagena sp., (Walker and Boys, 1784) Age Eocene age

Geographical distribution; Theses species have world distributed.

Sub Order Rotaliina

Super Family Nummulitacea

Family Nummulitidae (de Blainville, 1827)

Subfamily Heterostegininae (Galloway, 1933)


2- Heterostegina sp., (Orbigny, 1826)

Age Eocene to Holocene

Geographical distribution; Theses species have world distributed.

Class Globothalamea

Order Rotaliida

Superfamily Planorbulinoidea

Family Cibicididae (Cushman, 1927)

Superfamily Planorbulinoidea Cushman, 1927


3-Cibicidoides micrus [10-29]

Age Early Eocene

Geographical distribution; Theses species have world distributed.

Class Globothalamea

Order Rotaliida

Family Alabaminidae Hofker, 1951

Genus Alabamina Toulmin, 1941


4- Al abamina sp.,

Age Eocene

Geographical distribution; Theses species have world distributed.

Class Globothalamea (Gumbel, 1870)

Order Rotaliida

Superfamily Nummulitoidea

Family Discocyclinidae

Genus Discocyclina

5- Discocyclina (Discocyclina) marginata?, (Cushman, 1919)

Age Middle Eocene.

Geographical distribution; Theses species have distributed in middle latitude.

Conclusion

The availability of food and oxygen were the two main elements affecting the foraminiferal distribution. The number of species of (benthic, planktonic) foraminifera was directly impacted by the low oxygen levels caused by sediment intake at the time. It is revealed by the temporal decline in the proportion of infaunal benthic foraminifera that there was a brief period of reduced bottom-water oxygenation and nutrient availability (associated with the tectonic activities in the study area). The Paleocene-Eocene biostratigraphy of the area was examined in the Burton Guyot limestone column. The biostratigraphy of planktonic foraminifera in Burton Guyot limestone is complete, and this section’s age is based on overlapping ranges from the E10 (Luteian) to Middle Eocene. Nine planktonic foraminiferal biozones have been identified there.

References

  1. Expedition 330 Scientists (2012) Site U1376. In Koppers AAP, Yamazaki T, Geldmacher J and the Expedition 330 Scientists, Proe. IODP, 330: Tokyo (Integrated Ocean Drilling Program Management International, Inc.
  2. Gradstein FM, Ogg JG, Schmitz M, Ogg, G (2012) The Geologic Time Scale2012. Elsevier 2.
  3. Gradstein FM (2020) Chapter 3 – Evolution and Biostratigraphy, Eds: Felix M. Gradstein, James G. Ogg, Mark D. Schmitz, Gabi M. Ogg, Geologic Time Scale 2020. Elsevier Pg: 35-137.
  4. Bryan JR, Carter BD, Fluegeman RH, Krumm DK, Stemann TA (1997) The Salt Mountain Limestone of Alabama. Tulane Studies in Geology and Paleontology. 30: 1-60.
  5. Stainforth RM, Lamb JL, Luterbacher HP, Beard JH, Jeffords RM (1975) Cenozoic planktonic foraminiferal zonation and characteristics of index forms. Paleontological Contributions Article 62. P. 425 Smith WHF, Sandwell DT, 1997. Global sea floor topography from satellite altimetry and ship depth soundings. Science, 277: 1956-1962.
  6. Pearson PN, Olsson RK, Hemleben C, Huber BT, BerggrenWA (2006) Atlas of Eocene Planktonic Foraminifera. P. 1-513.
  7. Bolli HM (1957) Planktonic Foraminifera from the Eocene Navet and San Fernando formations of Trinidad. W.I. Bull. U.S. natl. Mus. 215: 155-172.
  8. Subbotina NN (1953) Iskopaemye foraminifery SSSR (Globigerinidy, Khantkenininidy i Globorotaliidy). Trudy Vsesoyznogo Nauchno-Issledovatel’skogo Geologo-razvedochnogo Instituta (VNIGRI) 76. P: 296.
  9. Toumarkine M, Bolli HM (1970) Evolution de Globorotalia cerroazulensis (Cole) dans l’Eocene moyen et superieur de Possagno (Italie). Revue de Micropaleontologie 13: 131-145.
  10. Bermudez PJ (1961) Contribucion al estudio de las Globigerinidea de la region Caribe-Antillana (Paleocene-Reciente). In: Boletino Geologia (Venezuela), Special Publicacion Vol. P. 22.
  11. Blow WH (1979) The Cainozoic Globigerinida. 3 Vols. P. 12.
  12. Jenkins DG (1971) New Zealand Cenozoic Planktonic Foraminifera. New Zealand Geological Survey Paleontological Bulletin 42.
  13. Kell JP, Watkins DK (2014) Data report: Calcareous nannofossil biostratigraphy of Expedition 330, Louisville Seamount Trail, Sites U1372-1377. In Koppers AAP, Yamazaki T, Geldmacher J and the Expedition 330 Scientists, Proe.IODP, 330: Tokyo (Integrated Ocean Drilling Program Management International, Inc.
  14. Khameiss B, Fluegeman R, Grigsby J, Malone S, Bernot R, et al. (2017) Biofacies Analysis of the Tertiary algal reef (Pinnacle Reef – Middle Eocene), IIA (Limestone Unit) At Burton Guyot (IODP Site U1376). 2017 -AIPG National Annual Conference. P. 23.
  15. Khameiss B, Fluegeman R (2017) Eocene Foraminifera from an Algal Reef Limestone at Burton Guyot (IODP site U1376), in the Southwest Pacific Geologic Problem Solving with Microfossils Conference. Microfossils IV. pg: 83-84.
  16. Khameiss B, Richard F (2017) Benthic Foraminifeal Paleoecology of Depositional Sequence TE 3.2 (Eocene; Bartonian) of the Eastern Gulf Coastal Plain. Geologic Problem Solving with Microfossils Conference. Microfossils IV.P. 67-68.
  17. Krasheninnikov VA, Basov IA (1983) Cenozoic planktonic foraminifers of the Falkland Plateau and Argentine Basin, Deep Sea Drilling Projejt Leg 71. In: Initial Reports of the Deep Sea Drilling Project Vol. 71 Eds: Ludwig WJ, Krasheninninov VA, P. 821-845.
  18. Lourens L, Sluijs A, Kroon D, Zchos Jc, Thomas E et al. (2005) Astronomical pacing of late Paleocene to early Eocene global warming events. Nature 435: 1083-1087.
  19. Pearson PN, Shackleton NJ, Hall MA (1993) The Stable Isotope Paleoecology of Middle Eocene Planktonic Foraminifera and Multi-species integrated Isotope Stratigraphy. Journal of Foraminiferal Research 23: 123-140.
  20. Poag CW, Commeau,JA (1995) Paleocene to middle Miocene planktic foraminifera of the southwestern Salisbury Embayment, Virginia and Maryland: biostratigraphy, allostratigraphy, and sequence stratigraphy. Journal of Foraminiferal Research 25: 134-155.
  21. Poore RZ, Bybell L (1988) Eocene to Miocene biostratigraphy of New Jersey Core ACGS # 4: Implications for regional stratigraphy. S. Geological Survey Bulletin 1829. P. 1-22.
  22. Poore RZ, Brabb EE (1977) Eocene and Oligocene planktonic foraminifera from the Upper Butano Sandstone and type San Lorenzo Formation, Santa Cruz Mountains, California. Journal of Foraminiferal Research 7: 249-272.
  23. Samanta BK (1970) Middle Eocene Planktonic Foraminifera from Lakhpat, Cutch, Western India. Micropaleontology 16.
  24. Spezzaferri S, Silva IS (1990) Oligocene planktonic foraminiferal biostratigraphy and paleoclimatic interpretation from Hole 538A, DSDP Leg 77, Gulf of Mexico. Paleogeography, Palaeoclimatology, Palaeoecology 83: 217-263.
  25. Snyder SW, Waters VJ (1985) Cenozoic planktonic foraminiferal biostratigraphy of the Goban Spur region. In: Deep Sea Drilling Project Vol. 80. P.23.
  26. Toumarkine M (1975) Middle and Late Eocene planktonic foraminifera from the northwestern Pacific, Leg 32 of the Deep-Sea Drilling Project. In: Initial Reports of the Deep Sea Drilling Project Vol. 32. eds: Larson RL, Moberly R pg: 735-751.
  27. Toumarkine M (1978) Planktonic Foraminiferal Biostratigraphy of the Paleogene of Sites 360 to 364 and the Neogene of Sites 362A, 363, and 364 Leg 40. In: Initial Results of the Deep-Sea Drilling Project Vol. 40.
  28. Toumarkine M, Luterbacher HP (1985) Paleocene and Eocene Planktonic Foraminifera. In: Plankton Stratigraphy. Pg: 87-154.
  29. Van Eijden AJM, Smit J (1991) Eastern Indian Ocean Cretaceous and Paleogene quantitative biostratigraphy. In: Proceedings of the Ocean Drilling Program, Scientific Results Vol. 121 Eds: Weissel, J. Peirce, J. Taylor, E. Alt, J. Pg: 77-123.

Extend Calibration Cycle of Homocysteine Measurement System in Clinical Laboratory

DOI: 10.31038/JCRM.2022562

Abstract

Calibration is the basis of traceability of clinical biochemistry results. Different calibration cycle will bring different difficulties and economic costs to clinical laboratory. By extending the Homocysteine calibration cycle, the 72 hours given by the manufacturer were extended to 7 days. The new calibration cycle can significantly reduce the cost of the laboratory and improve the work efficiency.

Keywords

Homocysteine, Calibration cycle, Measurement system

Calibration is the basis of traceability of clinical biochemistry results. In some cases, the measurement system need to be recalibrated, such as changing the reagent lot number, replace the important parts of the instrument, the instrument has been maintained greatly, and internal quality control is abnormal. Even if the above situation does not occur, it should be noted that is necessary to recalibrate the item before the end of the reagent calibration cycle, so as to ensure the accuracy of patient detection results. Each commercial kit will establish its calibration cycle before leaving the factory. The calibration cycle of kits for different biochemical items may be different. The shorter calibration cycle may be several hours, and the longer one may be several months. Therefore, different calibration cycle will bring different difficulties and economic costs to clinical laboratory.

Homocysteine (Hcy) is a non-protein, neurotoxic, sulfur containing amino acid that originates from methionine metabolism [1]. Hcy is associated with increased risk of numerous pathological conditions, including cardiovascular Disease (CVD), stroke, Alzheimer’s disease (AD), eye diseases, pregnancy complications, and neural tube defects (NTDs) [2]. Therefore, it is very significant to detect Hcy in laboratory. The calibration cycle of Hcy kits from different manufacturers is different. In our laboratory, the calibration cycle of Hcy test kit is short, 72 hours. And the calibration material of the project has five levels, which will increase the cost of the laboratory and reduce the efficiency of the work. From above analysis, we decide to extend the calibration cycle of Hcy measurement system in our clinical laboratory.

The biochemical analyzer is Beckman Coulter AU5800, the Hcy reagent is Beijing Jiuqiang (lot: 19-0226), and the calibrator is Beijing Jiuqiang (lot: 18-1115). After calibration, two quality control samples (QC-1 and QC-2) and one clinical serum sample (CS-1) were tested 4 times respectively (2 times in the morning and 2 times in the afternoon). The determination lasted for seven days. The difference between the maximum and minimum values of the same sample should be less than the bias required by external quality assessment (EQA) of National Center for Clinical Laboratories (NCCL). The result is listed in Table 1. We can find that the difference between the maximum value and the minimum value in these seven days is less than 10%.

Table 1: Analysis of Hcy test data

Sample

Mean

SD

CV(%)

Max

Min

Bias (%)

Standard (%)

QC-1

11.3

0.22

1.91

11.0

11.7

6.36

10

QC-2

30.2

0.42

1.40

29.1

31.1

6.87

10

CS-1

7.2

0.22

3.12

6.9

7.5

8.69

10

By extending the Hcy calibration cycle, the 72 hours given by the manufacturer were extended to 7 days. The new calibration cycle can significantly reduce the cost of the laboratory and improve the work efficiency. Therefore, other biochemistry essays in the laboratory can also use this method to extend the calibration cycle.

Research funding: This work was supported by the National Natural Science Foundation of China (81870683, 82121003), the Department of Science and Technology of Sichuan Province (2020JDTD0028), the CAMS Innovation Fund for Medical Sciences (2019-12M-5-032).

References

  1. Setien-Suero E, Suarez-Pinilla M, Suarez-Pinilla P, Crespo-Facorro B, Ayesa-Arriola R (2016) Homocysteine and cognition: A systematic review of 111 studies. Neurosci Biobehav Rev 69: 280-298. [crossref]
  2. Jakubowski H (2019) Homocysteine Modification in Protein Structure/Function and Human Disease. Physiol Rev 99: 555-604. [crossref]

Evaluation of the Validity of the Richmond Agitation Sedation Scale in Critically Illness Infants and Children: A Retrospective Cohort Study

DOI: 10.31038/IJNM.2022323

Abstract

Purpose: Sedation is one of the essential interventions in ICU. The Richmond Agitation- Sedation Scale (RASS) has commonly been used in adult patients; however, no specific scale for pediatric patients is available. Thus, it is necessary to develop a simple sedation scale according to children’s developmental stages. The purpose of this study is to evaluate the efficacy of the RASS for sedation evaluation in pediatric patients.

Methods: The study included 1715 children admitted to a pediatric intensive care unit (PICU) between 2012 and 2016, where they received artificial respiration management under sedation. To assess the efficacy of the RASS, univariate and multivariate analyses were performed for determining the mean duration of stay in the PICU pre- and post-introduction of RASS, the number of days of artificial respiration management, and the number of adverse events. P-values <0.05 were considered statistically significant. All tests were performed using SPSS ver. 27.0J (IBM Corp., Armonk, NY).

Results: Analyses showed statistically significant differences in the number of ventilator-associated pneumonia (VAP) cases pre- and post-introduction of RASS (p=0.007 for univariate analysis; multivariate odds ratio=0.518, 95% confidence interval: 0.296–0.905, p=0.021). These results indicated that RASS introduction reduced the risk of VAP by one-half.

Conclusions: Appropriate use of sedatives contributes to improved patient outcomes, such as the prevention of VAP and reductions in the duration of artificial respiration management. Study results suggest that use of the RASS, an important measure in the VAP prevention bundle, can be effective in reducing the risk of VAP in pediatric patients.

Keywords

Richmond agitation sedation scale, Pediatric intensive care unit, Ventilator-associated pneumori, A retrospective cohort study

Introduction

Sedation is one of the essential interventions in ICU. To increase the patient’s comfort and reduce complications associated with sedation, it is essential to precisely set the target of sedation depth for each patient and appropriately maintain the particular depth [1-3]. For instance, excessively deep sedation would cause difficulty in ventilator weaning due to the atrophy and weakness of respiratory muscles, which may result in prolonging a ventilator fitting period or developing ventilator-related pneumonia (VAP) [4]. On the contrary, under a shallow sedation depth, a report shows that the case of accidental extubation in ventilators increases, followed by restlessness or agitation [5]. Therefore, establishing an objective “sedation scale,” a common standard among medical professionals in evaluating the sedation depth, should be mandatory. The use of the sedation scale is currently recommended in practice on patients under intensive care management, particularly during mechanical ventilation management [6]. Given this situation, the use of the Richmond Agitation Sedation Scale (hereinafter referred to as “RASS”) has been recently recommended, mainly for adult patients, as an appropriate sedation scale [7-9]. However, on the other hand, no recommendation has been made to use a specific sedation scale in the field of Pediatrics [10]. The cognitive and language abilities of pediatric patients are underdeveloped, in which the process of informed consent is often problematic. To make matters worse, those infants may suffer significant stress, not only from medical treatment or surroundings of a unique ICU environment but also from being separated from their family. Therefore, the management of pediatric patients in ICU is often challenging, which requires deeper sedation depth and a higher level of pain relief than those of adult patients [10]. However, the number of sedation scales assessed for their reliability and validity in pediatric patient management in mechanical ventilation is quite limited [11]; although the state behavioral scale (SBS) has been reported as a candidate for sedation scale of pediatric patients, no recommended sedation scale has been established in the treatment of pediatric patients as in its adult counterpart. Consequently, a simple and reliable scale in determining appropriate sedation depth according to each patient’s growth development stages is required. A pediatric hospital adopted the use of the Richmond Agitation-Sedation Scale (RASS) in 2014, and physicians and nurses have since determined optimal levels of sedation based on their patients’ scores. This study was based on children who underwent artificial respiration management in the pediatric intensive care unit (PICU), and evaluated the impact on clinical outcomes of using RASS to evaluate their sedation levels.

Design and Methods

Patients

This study included children admitted to the hospital’s PICU between 2012 and 2016. All children had received artificial respiration management under sedation during their PICU stay. We excluded patients who received muscle relaxants or who underwent artificial respiration management using high-frequency oscillatory ventilation or airway pressure release ventilation. The RASS was used to measure the level of sedation because its reliability and validity have been established in adults.

Data Analysis

Univariate analysis was performed for the mean duration of stay in the PICU before and after the introduction of RASS, the number of days of artificial respiration management, the number of pneumonia cases associated with artificial respiration machines, and the number of unplanned extubations. Subsequently, multivariate analysis was conducted to confirm the efficacy of the RASS for each outcome measure, with the potential confounders found to be statistically significant in the univariate models included as covariates. P-values less than 0.05 were considered statistically significant. All tests were performed using SPSS ver. 27.0J (IBM Corp., Armonk, NY). 

Ethical Considerations

This study was carried out in accordance with the Ethical Guidelines for Medical and Health Research Involving Human Subjects established by the Ministry of Health, Labor, and Welfare and was approved by the hospital’s Institutional Ethics Committee (Approval Number: 998). This hospital has been designated as the national research center for advanced and specialized medical care, and promotes the treatment and research of diseases during the reproductive cycle.

Findings

Patient Characteristics and Clinical Outcomes

A total of 1715 patients were included in the study; their median age was 18 months (6–60 months). The median Proviral Integrations of Moloney virus 2 (PIM2) was 2.3 (1.0–5.4), the median Pediatric Cerebral Performance Category (PCPC) before admission to the PICU was 1.0 (1.0–3.0), the median number of days of artificial respiration management was 4.0 (2.0– 8.0), and the median PICU stay was 7.0 days (4.0–12.0) (Table 1).

Table 1: Patient characteristics and clinical outcomes(N=1715)

table 1

Midazolam and opioids were mainly used as analgesics and sedatives. Dexmedetomidine, ketamine, and phenobarbital were used as second-line drugs or adjuvants. The dose was adjusted as necessary according to the instructions of the on-site intensivist.

Verification of Effectiveness of Each Variable Pre-and Post-introduction of RASS

Study outcomes were compared for the periods pre- and post-introduction of the RASS in 2014. Changes in the number of days of artificial respiration management and in the duration of PICU stay were assessed using the Mann–Whitney U test for non-parametric variables. In addition, the chi-square test was used to compare changes in the number of cases of ventilator-associated pneumonia (VAP) and of unplanned extubations. There were no significant differences in the number of PICU days (p=0.296), artificial respiration management days (p=0.499), or number of unplanned extubations (p=0.456) pre- and post- introduction of RASS. In contrast, a statistically significant difference was observed in the number of VAPs (p=0.007) (Table 2).

Table 2: Verification of effectiveness of each variable pre-and post-introduction of RASS

table 2

a Mann–Whitney U test
b the chi-square test
p < 0.05* p < 0.01**

Verification of Effectiveness for VAP Post-introduction of RASS

Multivariate analysis using logistic regression was performed for the number of VAPs, controlling for patient sex and age (months), PIM2, PCPC before admission to the PICU, the number of days of artificial respiration management and of ICU stay, and whether RASS was used as an assessment tool. A variable reduction technique, based on the likelihood ratio test, was used to select the covariates tested in the models. The results indicated that patient age, PIM2, PCPC, the number of days of artificial respiration management, and RASS introduction affected the number of VAPs. Specifically, the number of VAPs was significantly associated with patient age (odds ratio [OR]=1.010, 95confidence interval [CI]: 1.000- 1.010, p=0.002), number of days of artificial respiration management (OR=1.05, 95% CI:– 1.040-1.060, p<0.001), PIM2 (OR=1.010, 95 CI 1.010-1.020, p<0.001), PCPC (OR=0.847, 95% CI: 0.717-1.000, p=0.04), and RASS introduction (OR=0.518, 95 CI: 0.296-0.905, p=0.021). The Hosmer–Lemeshow test showed a goodness of fit for the logistic regression model (p=0.753). The discrimination rate between the predicted and actual values was 91.3% (Table 3).

Table 3: Verification of effectiveness for VAP post-introduction of RASS (N=1715)

table 3

The Hosmer–Lemeshow test showed a goodness of fit for the logistic regression model (p=0.753) The discrimination rate between the predicted and actual values was 91.3%
p < 0.05* p < 0.01**

Discussion

Clinical sequelae of artificial respiratory management were compared for the periods before and after the RASS was introduced as an assessment tool in the PICU. After controlling for demographic and clinical factors, use of the RASS did not make a significant difference in the number of days patients spent in the PICU, the number of days of artificial respiration management, or the number of unplanned extubations. However, a statistically significant difference was observed in the number of VAPs, representing a 50% reduction in the risk of their occurrence. Analysis was performed to clarify the association between the number of VAPs and sex, age (months), PIM2, PCPC before admission to the PICU, the number of days of artificial respiration management and ICU stay, and the presence or absence of RASS. An appropriate use of sedatives contributes to improving outcomes in adults, such as prevention of VAP, reduction in the period of artificial respiration management, and improvement in survival [12-14]. The results of the present study demonstrated that using RASS to optimize sedation management significantly reduced the risk of VAP. Muscle weakness and functional impairments, such as cognitive/mental function disorder, are known complications after artificial respiratory management and have been labeled as ICU-acquired weaknesses [15]. To prevent these conditions, it is necessary to appropriately manage the risk factors in the acute phase, with particular attention to the appropriate management of sedatives. RASS assessments are thus an important component of the PICU VAP prevention bundle. The reliability and validity of the COMFORT scale, a sedative scale for children, has been established [16]. However, this scale cannot discriminate between analgesic and sedative effects as it assesses patients’ distress as well as pain. Furthermore, the results are represented as the total score of each item (range: 8–40 points), making it difficult to set target values in advance. The reliability and validity of the State Behavioral Scale have been established, a Japanese version is also being developed [17]; however, its application in the PICU is complicated by the number of evaluation items. Based on the above facts, we used the RASS to evaluate the patients’ level of sedation in the PICU. Previous studies have shown that the RASS is quick, intuitive, and an excellent tool for use in the PICU [18,19]. In adult patients, the RASS is used as part of the Confusion Assessment Method (CAM- ICU) for delirium evaluation of ICU patients. There is also a modified version, the pCAM-ICU, for children [9,20]. pCAM-ICU is to be evaluated using RASS. However, assessing the consciousness level by eye contact and gaze, as used in the RASS scoring system, can be difficult in infants. Evaluating sedation and excitement using RASS may improve delirium evaluation in the future.

Limitations and Future Tasks

This study has several limitations. First, this was a single-center study. Second, we did not have information to evaluate the effects of nurses’ and physicians’ clinical experience or skills in RASS assessments. In fact, it has been suggested that RASS can be an evaluation tool for pediatric patients through educational intervention [21]. Further, the validity of the RASS for children has not been adequately evaluated. The RASS is adapted for children by developing evaluation criteria according to their age and conscious levels, and the validity of this scale needs to be assessed with more patients.

Conclusions

The RASS is an important measure in the adult VAP prevention bundle. Results of the present study suggest that its use may also be effective in the PICU. Further studies are needed to verify our results.

Conflicts of Interest

This study received research funding from the policy-based Medical Services Foundation in 2017. The authors declare no conflict of interest.

References

  1. Brook AD, Ahrens TS, Schaiff R, Prentice D, Sherman D, et al. (1999) Effect of a nursing implemented sedation protocol on the duration of mechanical ventilation. Critical Care Medicine 27: 2609-2615. [crossref]
  2. Deeter KH, King MA, Ridling D, Irby GL, Lynn AM, et al. (2011) Successful implementation of a pediatric sedation protocol for mechanically ventilated patients. Critical Care Medicine 39: 683-688. [crossref]
  3. Smith HAB, Gangopadhyay M, Goben CM, Jacobowski NL, Chestnut MH, et al. (2017) Delirium and benzodiazepines associated with prolonged ICU stay in critically ill infants and young children. Critical Care Medicine 45: 1427-1435. [crossref]
  4. Rello J, Diaz E, Roque M, Vallés J (1999) Risk factors for developing pneumonia within 48 hours of intubation. American Journal of Respiratory and Critical Care Medicine 159: 1742-1746. [crossref]
  5. da Silva PS, Fonseca MCM (2012) Unplanned endotracheal extubations in the intensive care unit: systematic review, critical appraisal, and evidence-based recommendations. Anesthesia & Analgesia 114: 1003-1014. [crossref]
  6. Barr J, Fraser GL, Puntillo K, Ely EW, Gélinas C, et al. (2013) Clinical practice guidelines for the management of pain, agitation, and delirium in adult patients in the intensive care unit. Critical Care Medicine, 41, 263-306. [crossref]
  7. Ely EW, Truman B, Shintani A, Thomason JW, Wheeler AP, et al. (2003) Monitoring sedation status over time in ICU patients: reliability and validity of the Richmond Agitation-Sedation Scale (RASS) The Journal of the American Medical Association 289: 2983-2991. [crossref]
  8. Sesseler CN, Gosnell MS, Grap MJ, Brophy GM, O’Neal PM, et al. (2002) The Richmond Agitation-Sedation Scale: validity and reliability in adult intensive care unit patients. American Journal of Respiratory and Critical Care Medicine 166: 1338-1344. [crossref]
  9. Smith HAB, Brink E, Fuchs DC, Ely EW, Pandharipande PP (2013) Pediatric delirium: monitoring and management in the pediatric intensive care unit. Pediatric Clinics of North American 60: 741–760. [crossref]
  10. Vet NJ, Ista E, de Wildt SN, van Dijk M, Tibboel D, et al. (2013) Optimal sedation in pediatric intensive care patients: a systematic Intensive Care Medicine 39: 1524-1534. [crossref]
  11. Playfor S, Jenkins I, Boyles C, Choonara I, Davies G (2006) United Kingdom Paediatric Intensive Care Society Sedation, Analgesia and Neuromuscular Blockade Working Group. (2006) Consensus guidelines on sedation and analgesia in critically ill children. Intensive Care Medicine 32: 1125-1136.
  12. Girard TD, Kress JP, Fuchs BD, Thomason JWW, Schweickert WD, et al. (2008) Efficacy and safety of a paired sedation and ventilator weaning protocol for mechanically ventilated patients in intensive care (Awakening and Breathing Controlled trial): a randomized controlled trial. Lancet 371: 126-134. [crossref]
  13. Robinson BR, Mueller EW, Henson K, Branson RD, Barsoum S, et al. (2008) An analgesia-delirium-sedation protocol for critically ill trauma patients reduces ventilator days and hospital length of stay. The Journal Trauma 65: 517-526. [crossref]
  14. Nakatani A, Tazaki O, Yoshiya K, Asai T, Nishio S, et al. (2017) Examination on reduction of incident rate after introduction of RASS. Journal of the Japanese Society of Intensive Care Medicine 24: 47-48. (In Japanese).
  15. Needham DM (2008) Mobilizing patients in the intensive care unit: improving neuromuscular weakness and physical function. The Journal of the American Medical Association 300: 1685-1690. [crossref]
  16. Ambuel B, Hamlett K. W, Marx C. M, and Blumer J. L. (1992) Assessing distress in pediatric intensive care environments: the COMFORT scale. Journal of Pediatric Psychology 17: 95-109.[crossref]
  17. Hoshino H, Sakuramoto H, Matsuishi Y, Shimojo N, Enomoto Y, et al. (2019) Development of the Japanese version of the State Behavioral Scale for critically ill children. Acute Medicine & Surgery 6: 101-108. [crossref]
  18. Kerson AG, DeMaria R, Mauer E, Joyce C, Gerber LM, et al. (2016) Validity of the Richmond Agitation Sedation Scale (RASS) in critically ill children. Journal Intensive Care 4. [crossref]
  19. Haraguchi M, Ide K, Miura M, Hayashi Y, Oho K, et al. (2017) Nurse- physician inter-rater agreement on the Richmond Agitation Sedation Scale in critically ill infants and children. Journal of the Japanese Society of Intensive Care Medicine, 24(Suppl), 172. (In Japan)
  20. Traube C, Silver G, Kearney J, Patel A, Atkinson TM, et al. (2014) Cornell Assessment of Pediatric Delirium: a valid, rapid, observational tool for screening delirium in the PICU. Critical Care Medicine 42: 656-663. [crossref]
  21. Kihlstrom M, J, Ashley P, Edge A, P, Cherry K, M, Paul J, et al. (2018) Multi-modal Educational Curriculum to Improve Richmond Agitation- sedation Scale Inter-rater Reliability in Pediatric Patients. Pediatric Quality & Safety 3. [crossref]

Professionalism in the Digital Era

DOI: 10.31038/IJNM.2022322

Abstract

Background: Advancing technologies facilitate the transfer of medical services from the office practice to the patient home in a virtual format, offering comfort in e-communication.

Aim: To highlight the patient’s preference fulfilled in the digital era when necessary.

Method: A qualitative study was performed by the author in the community in 2022, relating to the healthcare model improvement by using IT devices.

Findings: In April 2022, the patient, 73, experienced a worsening heart function.

Patient health history: Hypertension from 2006; heart failure, NYHA class II, 2022.

Patient’s family health history: Parents: hypertension.

Actions were taken: The patient called the family doctor. The physician used mainly his voice in analysis and decisions. She recommended the treatment in the hospital, but the patient disagreed. The family doctor used drugs, behaviour change information, and communication skills to manage the situation. The follow-up call visits were scheduled twice a day in the first week, daily the following week, and then twice a week. In May 2022, the physician visited the patient at home; the face light of the patient expressed delight in his health improvement and the luxury of meeting his doctor who lives in another region after fourteen years.

Results: Clinical outcomes were improved in a few weeks. No relapse was reported.

Conclusion: IT devices are convenient options for treatment.

Discussions/Implications: Patient’s experience influences his decision in selecting the healthcare provider; this physician offered expertise to his family for three generations, from 1987-2008. Patient preference may be a tool to validate professionalism in healthcare.

Influence of Phosphorus Fertilizer Rates on Grain Yield and Economic Benefits of Sorghum (Sorghum bicolor L.) in Case of Kersa District, South Western Ethiopia

DOI: 10.31038/AFS.2022451

Abstract

Depletion of soil fertility coupled with unbalanced fertilization of crops is one of the major constraints limiting crop yield in Ethiopia. Here therefore, afield experiment was undertaken at two sites (site-1 and site-2) on Nitisols of Kersa District, Southwestern Ethiopia to determine the effect of phosphorus fertilizer rate on grain yield and economic production of sorghum. The experiment consists of seven levels of P (0, 11.5, 23, 34.5, 46, 57.5 and 69 kg P ha-1) including one treatment 46-40 kg ha-1 PK along with uniform level of N (46 kgha-1). The experiment was arranged in randomized complete block design (RCBD) having three replications. The collected data was subjected to ANOVA using SAS 9.3 version software. The results revealed that P fertilization brought significant effect on grain yield, biomass yield and harvest index at both sites. At site-1, the maximum grain yield (4517.0 kg ha-1) and biomass yield (7134.3 kgha-1) were obtained from combined fertilization of PK (46-40 kgha-1), while the lowest grain yield (2212.6 kgha-1) and biomass yield (5366.4 kgha-1) were recorded from control plots. At site-2, the maximum grain yield (3716.1 kg ha-1) and biomass yield (7760.7 kgha-1) were also obtained from similar treatments (46-40 kgha-1) PK, while the lowest grain yields (2399.5 kgha-1) and biomass yield (5751.6 kgha-1) were recorded from control plots. Application of (46-40 kgha-1) PK produced the maximum net benefits with acceptable marginal rate of return at both sites. Therefore, we can recommend that integrated application of P and K at a rate of 46 -40 kg ha-1 is better to improved yield and economical production of sorghum.

Keywords

Economic return, Sorghum, Phosphorus level, Yield

Introduction

Sorghum (Sorghum bicolor L.) belongs to the family Poaceae which is the fifth most important world cereal crops in production after wheat, rice, maize and barley. Because of its drought resistance and wide range of ecological adaptation, it is the crop of choice for dry regions and areas with low rainfall amount [1]. In most East African countries, sorghum is grown in between an altitude of 900 to 1,500 masl and in Ethiopia the crop grows all over the country across various agro ecologies from high altitude with sufficient amount of rainfall to low lands receiving low rainfall [1,2]. According to the report of [3], annually 1.8 million ha of land is allotted for sorghum production and 4.3 million ton of grain is produced in Ethiopia. Currently, the crop is used as raw material for industries beyond animal feed and human consumption. It is gaining commercial value in malting and brewing industries which indicates, the crop has multi-purposes in lower and mid altitude regions of Ethiopia and it is not only a staple food crop in the rural areas but also it is used primarily to prepare local foods including (injera, bread, thick porridge). In Ethiopia, this crop accounts for one-third of the total cereal crops production area and covers 16.36% of the total cultivated area [4]. However, currently the production is constrained by various factors majorly due to low soil fertility and improper utilization of fertilizer.

Fertilizers are naturally obtained or artificially produced nutrient sources that, when applied on the plant or to soil can supplement natural soil nutrients and augment crop growth and soil fertility for growth and development. Thus, application of fertilizer at proper time through proper method in balanced proportion shows better impact on crop productivity [5]. Among major macronutrients, phosphorus is one of the most important yields limiting plant nutrient next to nitrogen and is the second most deficient plant nutrient in the study area [6]. It plays an important role in many physiological processes such as photosynthesis, storage of energy and its transfer, respiration and cell enlargement, cell division etc. Minimum usage of P in relation to N has been identified as one of the major factors limiting higher crop yields. Therefore, phosphorus deficiency is a yield reducing factor if it not applied in adequate quantity. For instance, in wheat phosphorus deficiency reduces number tillers and plant leaf area by producing smaller and less number of leaves and at the end overall economy of the crop [7]. Among various factors, deficiency of nutrients is the most important bottleneck problem which directly contributes to reduce yield of cereal crops including sorghum. When phosphorus fertilizer is in optimum amount, gradually it increases the overall economy of sorghum crop [8]. Thus, to obtain maximum yield of crops it is mandatory to provide plant nutrients in optimum level of their nutrients requirement. Therefore, the present experiment was conducted (i) to evaluate the effect of phosphorus fertilizer rate on grain yield and (ii) to determine economics return of sorghum at Nitisols of Kersa district.

Materials and Methods

Description of Study Area

A field experiment was conducted in two sites during 2017/18 main cropping season on farmers’ fields in Nitisols of Kersa District South-western Ethiopia. The experimental sites was geographically located at latitude of 7° 42′ N, longitude 36° 59′ E and an altitude of 1753 masl. The average minimum and maximum temperature was 11.6°C and 27.5°C, respectively. The area received an average annual rainfall of 1750 mm. The predominant soil type of the study area, in particular, is Nitisols which have a reddish brown in colour with moderately acidic in reaction. On average, the soil is deep and highly weathered well-drained, sandy clay in texture and strong to moderately acidic in a reaction as reported by [9]. The farming system of the area is cereal dominated such as maize, tef and sorghum. Soybean is also among the legume crops cultivated in the area.

Treatments and Experimental Design

The experiment encompasses seven level of phosphorus fertilizer (0, 11.5, 23.0, 34.5, 46.0, 57.5, and 69 kg ha-1 P) including one treatment 46-40 kg ha-1 PK. The treatments were applied with respect to the treatment allocation. In all plots 46 kgha-1 N was applied uniformly. Even though farmers are not growing sorghum without fertilizer, control treatment was included for comparison among the rest of the treatments. The treatments were arranged in a randomized complete block design (RCBD) replicated three times each. The experimental plot was gross plot area of 14.625 m2 (3.75 m x 3.9 m), which accommodated 5 rows while the net plot area was 11.7 m2 (3 m x 3.9 m). The spacing of 0.15 m and 0.75 m was used between plants and rows, respectively. High yielding Aba Melko sorghum variety which is the most promising hybrid released by Jimma Agricultural Research Centre and adapted to the agro-ecology of the area was used as a test crop. The seed was drilled in prepared row manually with spacing of 0.75 m between rows and 0.15 m between plants [10].

Planting was done based on local farmers planting calendar. Phosphorus was applied based on the treatments assigned once at planting and full doses of recommended nitrogen fertilizer (46 kgha-1) were applied in splits half rate during planting and the remaining half dose at knee stages uniformly for all plots. Urea, Triple Super Phosphate (TSP) and Murate of Potash (KCl) were used as sources of fertilizer for supplying N, P and K nutrients respectively. All agronomic practices including weeding and hoeing were done uniformly for all plots according to agronomist’s recommendation (Table 1).

Table 1: Treatments used in the present study

Treatments Fertilizer rate (kg ha-1)
N P K
T1 46 0.0 0
T2 46 11.5 0
T3 46 23.0 0
T4 46 34.5 0
T5 46 46.0 0
T6 46 57.5 0
T7 46 69.0 0
T8 46 46.0 46

Data Collection

Grain yield of sorghum from each net plot were harvested when the crop fully matured. The weighted grain was finally adjusted to (12.5%) which is the standard moisture contents of cereal crops. Biomass yield of sorghum from each harvestable plot was harvested at the ground level from each plot were measured and reported on a hectare basis.

Harvest Index (%) was determined as a ratio of grain yield to above ground biological yield on dry weight basis in percentage [11] as described in the following formula.

formula 1

Data Analysis

The collected data was analyzed using analysis of variance (ANOVA) appropriate to randomized complete block design using statistical analysis system [12] 9.3 Version software. The interpretations were made following the procedure described by [13]. Least Significant Difference (LSD) test at 5% probability level was used for treatment mean comparison when the ANOVA showed significant differences among treatments.

Economic Analysis

The open market price for sorghum (6.42 birr kg-1) and the cost incurred for P and K fertilizers (TSP=18.5 birr kg-1) and potassium chloride (KCl=12.2 birr kg-1). Grain yield was adjusted to 10% downward due to management difference to reflect the difference between the experimental yield and the yield that farmers could expect from the same treatment [14]. The dominance analysis procedure was done as described by [14] to select potentially profitable treatments. Dominance analysis was also done to the selection of treatments ranked in increasing order of total variable costs. The marginal rate of return (MRR (%)) was calculated by dividing the change in net benefit to the change in variable costs. 100% MRR means for every 1 birr invested in different cost of fertilizer and maize seed, farmers can expect to recover 1 birr and obtain an additional1 birr [14].

Results and Discussion

Grain Yield

The ANOVA result showed that grain yield of sorghum was significantly influenced due to various phosphorus levels at both sites. The highest grain yield at site-1 (4517.0 kgha-1) and at site-2 (3716.1 kgha-1) was obtained from plots treated with (46-40 kg ha-1) PK while the lowest grain yield at site-1 (2212.6 kgha-1) and at site-2 (2399.5 kg ha-1) was obtained from zero level of phosphorus. The result revealed that yield increase as increasing levels of phosphorus fertilizer which might be due to higher rate of photosynthesis and better crop health which ultimately increased the final grain yield. The maximum yield recorded with P and K fertilization in the current study is most likely an indicator due to their deficiency in the field soil especially that of P. Plants showed normal growth with the application of phosphorus and resulted in improved agronomic traits which lead toward improved grain yield as reported [15]. The current result is in line with the finding of [16]. The maximum yield obtained from PK treated plots might be also due to their synergistic effect, the efficiency of these elements is enhanced resulting in increased crop productivity. So, maximum accumulation of PK nutrients gave highest yield. The current result is in conformity with the finding of [17] who reported that grain yield at maximum accumulation of nutrient occurs when nutrient rate is increased.

Biomass Yield

The ANOVA result revealed that biomass yield increased consistently with increasing phosphorus rates from 0 to 46 kg ha-1. Accordingly, plots treated with (46-40 kgha-1) PK produced maximum biological yield (7134.3 kg ha-1) which obtained 24.78% yield advantages compared with zero level of phosphorus. The maximum biomass yield recorded from the highest and balanced fertilization might be due to the involvement of each nutrient in supporting the physiological functions of plants through promoting leaf expansion, photosynthesis, and dry matter accumulation. While in control plots (absence of phosphorus fertilization) minimum biological yield (5366.4 kg ha-1) was recorded. The lower biomass yields recorded from the control plot revealed that neither sole application nor lower rates of P is sufficient to boost sorghum production significantly and to maintain soil fertility status at optimum level. This finding is in line with the finding of [18] who ascertained that increasing application of fertilizer nutrients (N and P) increases grain yield and biomass weight of sorghum significantly. Similarly [19] also confirmed that fertilizer N and P has contributed more than any other fertilizer towards increasing yield of grain crops and biomass yield.

In general, as increasing rates of P up to certain value increased grain and biomass yield. Optimum nutrition of P is critical for root development, increased stalk and stem strength, increased flowering and seed production, uniform and early crop maturity, improved crop quality, and increased resistance to plant diseases thereby all over grain yield and biomass weight of sorghum. The current result is in conformity with the finding of [20]. Moreover, [21] also reported that combined use of N and K significantly increased most growth parameters of sorghum which enhances high biomass production.

Harvest Index (HI (%))

The physiological efficiency or translocation of assimilates from source into economic sinks is known as Harvest Index (HI). The value of harvest index showed significant effect due to different levels of phosphorus fertilizer. In the present experiment, with increasing the rate of phosphorus fertilizer up to 46 kgha-1 harvest index increased significantly. At site-1 the maximum harvest index value (48.0%) was observed from plots treated with 57.5 kg ha-1 P, while at site 2 the maximum harvest index (47.8%) was observed from combined fertilization of PK at rate of (46-40) kgha-1. This indicates that significantly lower biomass partitioning to grain production when P was increased beyond certain level. The lower mean HI values in this experiment with the higher P application might indicate the need for the enhancement of biomass partitioning through genetic improvement (Table 2).

Table 2: Effect of Phosphorus fertilizer level on grain yield, biomass yield and HI of sorghum

Treatments (P rate (kgha-1)) Grain yield (kgha-1) Biomass yield (kgha-1) Harvest Index (%)
Site-1 Site-2 Site-1 Site-2 Site-1 Site-2
T1=Control 2212.6f 2399.5d 5366.4c 5751.6d 43.3bcd 41.77bcd
T2=11.5 2663.2e 2574.1cd 6465.7ab 6690.6c 40.0d 36.98d
T3=23.0 3148.6d 2820.1bcd 6425.2ab 7258.1b 41.8cd 38.99cd
T4=34.5 3334.5d 3146.0abc 6238.0b 7516.8ab 45.4abc 41.75bcd
T5=46.0 3575.5cd 3150.9abc 6334.8b 7601.1ab 46.5ab 41.50bcd
T6=57.5 3965.2bc 3209.1abc 6475.1ab 7373.2ab 48.0a 43.01abc
T7=69.0 4091.8ab 3537.6ab 6527.9ab 7649.0ab 47.2ab 46.17ab
T8=46-40 (P-K) 4517.0a 3716.1a 7134.3a 7760.7a 46.21abc 47.80a
Mean 3438.54 3056.68 6370.93 7200.14 44.79 42.25
LSD (0.05) 434.29 737.05   426.55 4.50 5.45
CV (%) 7.21 13.77 6.87 3.38 5.73 7.36

Economics of Fertilizer Use

From the treatments used, PK nutrients increased the financial returns relative to that achieved without them which gained net benefit of 23, 273.23 ETBha-1 with MRR 520.18% at site1 and at site-2 net benefit of 18,645.63 ETBha-1 with MRR 211.97% as shown (Tables 3 and 4). This recommendation was in conformity with the manual of [14], which reported that farmers should be willing to change from one treatment to another if the marginal rate of return of that change is greater than the minimum acceptable rate of return. The current result is also parallel with the finding of [22] who shares the same opinion after analyzing the financial data of fertilizer use in cotton. Therefore, the present study revealed that combined use of PK under constant value of N fertilizer is better in economic terms for maximum sorghum production.

Table 3: Partial budget analysis for fertilizer use in sorghum production at site-1

Treatments

(P rate (kg ha-1))

GY

(Kg ha-1)

Adj.GY

 (Kg ha-1)

 GFB

(ETB ha-1)

TVC

(ETB ha-1)

NB

(Birr ha-1)

MRR

 (%)

T1=0 2212.6 1991.34 12784.40  0 12784.4
T2=11.5 2663.2 2396.88 15387.97 462.5 14925.47 462.93
T3=23.0 3148.6 2833.74 18192.61 925.0 17267.61 506.41
T4=34.5 3334.5 3001.05 19266.74 1387.5 17879.24 132.24
T5=46.0 3575.5 3217.95 20659.24 1850.0 18809.24 201.08
T6=57.5 3965.2 3568.68 22910.93 2312.5 20598.43 386.85
T7=69.0 4091.8 3682.62 23642.42 2775.0 20867.42 58.16
T8=46-40 P-K 4517.0 4065.3 26099.23 2826.0 23273.23 520.18

Where; Adj.GY: Adjusted Grain Yield down to 10%, GY: Grain Yield, GFB: Gross Field Benefit, TVC: Total Cost that Varies, NB: Net Benefit, MRR: Marginal Rate of Return and ETB: Ethiopian Birr.

Table 4: Partial budget analysis for fertilizer use in sorghum production at site-2

Treatments

(P rate (kg ha-1))

GY

(Kg ha-1)

Adj.GY

 (Kg ha-1)

GFB

(ETB ha-1)

TVC

(ETB ha-1)

NB

(ETB ha-1)

MRR

 (%)

T1=0 2399.5 2159.55 13864.31 0 13864.31
T2=11.5 2574.1 2316.69 14873.15 462.5 14410.65 118.13
T3=23.0 2820.1 2538.09 16294.54 925.0 15369.54 207.33
T4=34.5 3146.0 2831.40 18177.59 1387.5 16790.09 307.15
T5=46.0 3150.9 2835.81 18205.90 1850.0 16355.90
T6=57.5 3209.1 2888.19 18542.18 2312.5 16229.68
T7=69.0 3537.6 3183.84 20440.25 2775.0 17665.25 310.39
T8=46-40 (P-K) 3716.1 3344.49 21471.63 2826.0 18645.63 211.97

Where; Adj.GY: Adjusted Grain Yield down to 10%, GY: Grain Yield, GFB: Gross Field Benefit, TVC: Total Cost that Varies, NB: Net Benefit, MRR: Marginal Rate of Return and ETB: Ethiopian Birr.

Conclusion

Based on the results obtained, we can conclude that as increasing rate of phosphorus fertilization increased the productivity of sorghum in constantly. Application of phosphorus and potassium fertilizer at a rate of 46-40 kg ha-1 has been found agronomical optimum for increasing the yield and yield components of sorghum. The result further revealed that the existing blanket recommendation of 46 kg N ha-1 and 40 kg K ha-1 has been found sub-optimal in response to the ever-increasing soil fertility depletion of the study area.

Nutrients with high harvest index values remove more of that nutrient from the field than nutrients with low harvest index values and suggest a looming soil fertility crisis if adequate adjustments are not made in usage of balanced nutrients increases productivity.

Economic analysis was done by assuming total variable cost, net benefit, dominant treatments and marginal rate of return. Hence, the result indicated that application of phosphorus in combination with K at a rate of 46-40 kg ha-1 produce maximum net benefit at both sites. Therefore, the present study revealed that the combined use of P and K fertilizer is better in economic terms for growing sorghum production under rain fed condition.

Acknowledgements

The authors acknowledge the Ethiopian Institute of Agricultural Research for funding of this study. Staffs of Natural Resource Management of Jimma Agricultural Research Center (JARC) are highly acknowledged for their support during the study. Soil and Plant Tissue Analysis Laboratory of Jimma Agricultural Research Centers is also duly acknowledged for the analysis of experimental samples.

References

  1. Taye T (2013) Sorghum production technologies training manual. Ethiopian Agricultural Research Organization (EARO), Melkassa Research Center Nazret, Ethiopia 5-45.
  2. Geremew G, Asfaw A, Taye T, Tesfaye T, Ketema B, et al. (2004) Development of sorghum varieties and hybrids for dry land areas of Ethiopia. Uganda Journal of Agricultural Science 9: 594-605.
  3. CSA (Central Statistical Authority, Agricultural Sample Survey) (2015) Central Statistical Agency, Report on area and production of crops. Statistical Bulletin 578. Addis Ababa.
  4. CSA (Central Statistical Authority, Agricultural Sample Survey) (2017) Report on the area and major production for major crops of Private peasant holdings. Addis Ababa, Ethiopia.
  5. Alam SM, Shah SA (2002) Phosphorus uptake and yield of wheat as influenced by integrated use of phosphatic fertilizers. Pakistan Journal of Agricultural science 39: 4.
  6. Tesfaye B, Rurinda J, Kebede M, Mutegi J, Hailu G, et al. (2019) Yield response and nutrient use efficiencies under different fertilizer applications in maize (Zea mays) in contrasting agro ecosystems. International Journal of Plant and Soil Science 29: 1-9. [crossref]\
  7. Sato A, A Oyanagi M Wad (1996) Effect of phosphorus content on the emergence of tillers in wheat cultivars. Jap Agric Res Quart 1: 27-30.
  8. Khalid M, Ijaz A, Muhammad A (2003) Effect of nitrogen and phosphorus on the fodder yield and quality of two Sorghum cultivars (Sorghum bicolor). International Journal of Agricultural Biology 5: 61-63.
  9. Wispelaere L, Marcelino V, Alemayehu R, De Grave E, Dumon M, et al. (2015) Revisiting nitic horizon properties of Nitisols of Southwestern Ethiopia. Geoderma 243-244: 69-79.
  10. Adugna A, Tefera T, Deresa A (2005) Sorghum production guideline: Production and research experience. EARO 1-31.
  11. Donald CM (1962) In search of yield. Journal of Australian Institute of Agriculture Science 28: 171-178.
  12. SAS (Statistical Analysis System) Institute. (2012).SAS/AF® 9.3: Procedure guide, 2nd edition: Cary, NC: USA.
  13. Gomez KA, Gomez AA (1984) Statistical procedures for agricultural research.
  14. CIMMYT (International Maize and Wheat Improvement Center) (1988) from agronomic data to farmer recommendations: an economics training manual (No. 27).
  15. Iqbal Z, ALatif S, Ali MM, Iqbal (2003) Effect of fertigated phosphorus on P use efficiency and yield of wheat and maize. Songklanakarin Journal of Scientific Technology 25: 697-702.
  16. Mesfin K, Zemach S (2015) Effect of Nitrogen and Phosphorus Fertilizer Rates on Yield and Yield Components of Barley (Hordeum Vugarae) Varieties at Damot Gale District, Wolaita Zone, Ethiopia. American Journal of Agriculture and Forestry 3: 271-275.
  17. Assefa A (2008) Indigenous soil nutrient supply and effects of fertilizer application on yield, N, P and K uptake, recovery and use efficiency of barley in three soils of Teghane, the Northern Highlands of Ethiopia. African Journal of Agricultural Research 3: 688-699.
  18. Azrag AAD, Dagash YMI (2015) Effect of sowing date and Nitrogen rate on growth, yield components of Sorghum (Sorghum Bicolor) and Nitrogen Use Efficiency. Journal of Progressive Research in Biology.
  19. Masebo N, Menamo M (2016) The effect of application of different rate of NP Fertilizers rate on yield and yield components of sorghum (Sorghum Bicolor): In Case of Derashe Woreda, Southern Nations Nationality People Region, Ethiopia. Journal of Natural Sciences Research 6: 88-94.
  20. Bayu W, Rethman NFG, Hammes PS, Alemu G (2006) Effect of farmyard manure and inorganic fertilizers on sorghum growth, yield and nitrogen use in a semi-arid area of Ethiopia. Journal of plant nutrition 29: 391-407.
  21. Pholsen S, Sormsungnoen N (2005) Effects of Nitrogen and Potassium Rates and Planting Distances on Growth, Yield and Fodder Quality of a Forage Sorghum (Sorghum bicolor Moench). Pakistan Journal of Biological Sciences 7: 1793-1800.
  22. Khaliq A, Abbasi MK, Hussain T (2006) Effects of integrated use of organic and inorganic nutrient sources with effective microorganisms on seed cotton yield in Pakistan. Biological resource Technology 97: 967-972. [crossref]

Immune Cells in COVID-19

Introduction

COVID-19 pandemic spread in almost all, all over the globe countries .Millions have been affected and millions died. The situation necessitate international efforts of medical internists epidemiologists, immunologist, and vaccine technologist .Four main preventive vaccine versions were becoming in hand for human mass vaccination within one year after the pandemic spread. So far concerning immunology of the disease. Scientists early in the pandemic starts to assess humoral immunity suitable for sero-diagnosis and sero-therapy of the disease as well as tempting and still tempting to developing the COVID-19 valid preventive vaccines. Currently, cell and lymphocyte immunologists take the forefront position in COVID-19 research. They articulate cellular immunology, flow cytometery, single cell RNA sequencing, mass transcriptomics, proteomics and cell-cell inter- actomics for tracing lymphocyte immunotypes and the allied cell type interactions .As well as their roles in; the pathogenesis, immune- pathogenesis, and disease outcome prediction.

Aiming

The objective of the present special issue “IMMUNE CELLS  IN COVID-19” published in IJPC was focusing onto the; ontogeny, biology, molecular biology, immuno-typing of immune cells and their roles in covuid-19.In which the latest information were collected, analyzed and formatted as series of opinion papers.

Scope

Lymphoid, lympho-myeloid and myeloid cell lineages for lymphocytes, monocytes and granulocytes as well as their mature forms are forming the backbone of human and mammalian immune system. The function of the immune system is mainly to recognize and destroy foreign invaders via a tripartite responses as; innate, immune cross-roads and adaptive immune responses. Immune cells the subject of the present special issue were assigned to these three immune system arms.

List of Contents

Section One: Innate Immunity

  1. Immunology of mononuclear phagocytes system in pulmonary patho-type of COVID-19.*
  2. Section Two: Immune Cross-roads

    1. The interplay of NKT cells in severe sars-cov-2 human infections*
    2. TH17 cells and the intercellular functions in severe, critical, deceased and vaccine of COVID-19*
    3. Section Three: Adaptive Immunity

      1. B Cell immunology of COVID-19*.
      2. Regulatory Lymphocytes in COVID-19*.
      3. 6-MAIT functions in homeostasis,covid-19 infected an covid-19
      4. *The authorship;

        IBRAHIM MS SHNAWA, College of Biotechnology, University of Qasim and Hilla University, College Babylon, Iraq.

Opinion: Immunology of Mononuclear Phagocyte System in Pulmonary Pathotype of COVID-19

Abstract

Mononuclear Phagocyte System MPS has an essential role in all stages of human SARS-COV-2 pulmonary infections. The objective of the present opinion paper was to through a light on the forefront achievements on the immunology of MPS in COVID-19. Single cell mRNA sequencing, single nucleus RNA sequencing, PCR, transcriptomics, flow cytometery, histo and gross pathology were the main assays tempted for assessments through an in-vitro, ex-vivo and in-vivo experimental settings. Monocyte, macrophage, alveolar macrophage, dendritic cells via an increment or decrement shift in number or function could probe the disease severity. MPS cells are either primer infected and lead to serial cellular events ended with severity. Or the epithelial cells found in the micro-environmental continuum with the APS were infected leading to MPS cell infection followed by cell-cell cross-talks, positive loop feedback mechanisms with T lymphocyte and/or MPS cells interferon axis functions. The overall immune response patterns of the lung in severe COVID-19 were; hyper-inflammation, immune impairment, hypoxia and severity terminated with death if not managed at earliest. An immune six point severity index was proposed as a diagnostic battery to be of use in an advance immunology laboratory was suggested. Molecular immune concept of circuit was briefed. MPS immune functions in pulmonary COVID-19 hold the position of double sward beneficial in some functional aspects and deleterious in others.

Keywords

Alveolar, Asymptomatic, Cytometery, Dendritic cell, Flow, Infection, Macrophages, Monocyte

Introduction

Mononuclear phagocyte system MPS take part in the functions of the human immune system both in health and disease. As a system is composed of circulating monocyte and tissue resident forms, the tissue resident forms got different names in different tissue microenvironment as; Glial in brain, alveolar in lungs, Kupffer in liver, osteoclast in bone, dendritic in spleen and other lymph glands and blood stream and Langerhans in skin. Some of which undergoes phase transition as that of glial cells in central nervous system. MPS performed immune functions both in the natural (innate) and adaptive immune responses. In other word they take part in immune cross-roads functions. In general MPS interplay immune functions in viral diseases and have special immune potentials in COVID-19. In health, MPS performed; phagocytosis, antigen presentation, shaping the adaptive immune responses, production of cytokines  and chemokines. While in disease state MPS played a role in the infectious inflammatory processes and in immune tissue  injuries due to an excessive cytokine production insitue in the affected tissue microenvironment [1-3]. In the present opinion tempts were made  to review the immunology of mononuclear phagocyte cell system in pulmonary COVID-19.

Cellular Immunology of MPS

MPS cells originated from the pluripotent stem cells in bone marrow in human adults. From the stem cells, lympho-myeloid progenitor cell line was developed which then differentiated to pro- monoblast, mono-blast, pro-monocyte then to monocyte in blood stream. From blood stream migrate to tissue compartments. During such migration they undergo morphologic and functional changes that fits to the target tissue compartment or organ while migration within blood vessels would not accompanied by morphologic, functional and/or mitogenic changes.

MPS cells are of large sizes and have multiple secondary lysozymes. They are characterized  by  active  endoplasmic reticulum and active Golgi apparatus which means  have  both  active biosynthetic pathways and active secretions with an evident acclimatization to their microenvironment. In lungs MPS express oxidative metabolism, their half-life were ranged between 60 to90 days in various organ/systems. During the inflammatory stimuli, therein  there  are  increments  in  the  in  their  development   in bone marrow and disseminated to various tissues through blood stream. On surface of MPCS cells there are numbers of markers   like:  MHCI,  MHCII,  C1,  C2,  FC,  CD11,  CD18,  CD13,   CD16,

CD17, CD31, and IA. The biophysical characteristics of MPS are; stimulated by bacterial lipo-polysachaaride LPS and mitogenic lectins, adhere to glass, recognize the antigens by TLR receptor. They secrete; hydrolytic enzymes, enzyme  inhibitors,  cytokines,  fat derived factors, complement components, and mirobicidal materials. When activated lymphocyte produce both of; macrophage inhibitory factor MIF it affects inhibition in spread of macrophages and   macrophage   stimulating   factors   which   stimulate   them for pinocytosis, phagocytosis, and induce the appearance of immune associated antigen Ia and assist in antigen presentation. MPS own specialized mechanisms for recognition of different inflammatory stimuli. If the stimulus is microbe, they will evolve number of killing mechanisms. They evolve three highly efficient recognition and clearing mechanisms of immune complexes through phagocytosis. The presence of MPS in continuum of  inflammatory  responses  they indicated either sub-acute or chronic inflammatory state. MPS cells act as; second line defender of human and mammalian body, antigen processing, antigen presentation, cytokine production and recognition of inflammatory responses [1-3].

Cell Molecular Immunology

There are varieties of natural immune protein that have the ability to recognize and detect human infection. These proteins are either soluble or structural entities like; soluble lysosome, complement components or complement receptors. The recognition process is through pattern recognition on the surface of the microbes. Among these receptors are the Toll-like receptor, the TLRs which are proteins of collectin nature that have the ability to recognize certain molecular patterns on the microbial surface. Such recognition molecules are forming strong features of natural (innate) immunity. TLRs are considered as a part of normal immune physiology. In the structural sense TLRs are forming a family of trans-membrane proteins that belongs to a class of animal lectins known as collectin proteins. TLR family is composed of more than ten different receptors. Most of the human and mammalian body tissues express at least one type of TLR. Though all TLRs are expressed onto; macrophages, dendritic cells, mast cells and B cells. TLRs interplayed an array of immune functions like; microbial sensors, cell signaling activators, enhancers for the expression of both; inflammatory and immune response genes, cross- linking of pattern-recognition molecules on the surface of microbe with TLRs act as danger signal to increase the microbicidal activity of phagocytic macrophages and allow them to activate T cells. TLRs made an important link between innate and adaptive immune responses. On TLRs activation, macrophage co-stimulatory molecules will converts macrophage phagocytes into antigen presenting macrophages which able to activate T cells [4-7].

Immunology of MPS in Human Virus Infections

The invading mammalian and human viruses when gain foot- hold in their respective hosts. They are recognized via their surface pattern recognition molecules PRM by the surface TLRs of MPS in blood stream and tissue resident. PRM cross-linked TLRs then virus pinocytosed, or through macro-pinocytosis and/or receptor mediated endocytosis in to the cell interior, Nikitina et al. [2018] the cross-link lead to transform of pinocytosed cell into antigen presenting cells. The processed virus peptides conjugated with MHC molecule and migrate out on the surface of MPS. The antigen presenting MPS will either activate naïve T cell to be Th2 triggering naïve b lymphocytes to grow, proliferate and expand as an effector antibody producing and memory B cells. Or activate naïve T cells to Th1 cells triggering T cells to be effector CD8+ cytotoxic T cells, CD4 T cells and memory T cells. The burden of virus load can be eradicated by the action of cytotoxic T cells or neutralized by the antiviral antibody and/or cleared by the direct action of interferons. The presence of molecular mimicking viral epitope with host tissue cells may initiate through the action of autoantibodies or auto-reactive cells immune tissue injuries terminated by autoimmune diseases. Excessive cytokine production by T cells or MPS also lead to inflammatory and immune responses with consequences of immune tissue injuries. The possible occurrence of viral immunosuppressive epitopes will trigger a state of infectious immunosuppressive conditions [6-9].

Immunology of MPS in SARS-COV-2 Infections

The circulating and tissue resident MPS cells, the monocyte and tissue macrophages participate in all stages of SARS-COV-2 human infection. They contribute to: (i) innate immune reactions (ii) shaping adaptive immune reactions, (iii) comorbidity predisposing to clinical infections, (iv) virus resistance, (v) virus dissemination, (vi) the host factors that determine disease severity, (vii) induction of immune tissue injury, (viii) recovery and (ix) sequalae (Table 1) [10-13].

Table 1: Immune cell deviations in human COVID-19 lungs

Features

Immune Events

References


Molecular

(i) Macrophage infection via antibody dependent receptor mediated endocytosis or pinocytosis

(ii) Amplification of cytokine synthesis and secretion

(iii) pyroptosis

(i) [14]

(ii) [15]

(iii) [14]

Surface markers (i) DCs lack of surface markers

(ii) appearance of an inhibitor surface markers DCs

[16]


Whole cell Immune Deviation

(i) appearance of intermediate phenotypes

(ii) appearance of suppressor phenotypes

(iii) DC-interferon axis

(iv) impaired phase transition in alveolar epithelial cells

(v) Bilateral alveolar macrophage positive feedback loop with T cells

(vi) immune mediated pulmonary fibrosis

(i) [17]

(ii) [17]

(iii) [18]

(iv) [19] (v) [20]

(vi) [21][19]


Molecular inflammatory Events

(i) Infammosome formation

(ii) Hyper-inflammatory responses

(iii) Hypercytokinemia

(iv) Pyroptosis

[22]

[23]

[15]

[11]

[14]

Gross Inflammatory Response outcomes Plogs in all respiratory tracts, transudates and edema [21]

Immuno-Inflammatory Responses

Severe SARS-COV-2 infection induce haemo-phagocytic syndrome due to the infiltration of pro-inflammatory monocytes, a rare condition expressed as an over excerbant inflammatory response due to development of hyper-cytokinemia together with depletion of the adaptive immune compartment which may explain the appearance of sepsis in many severe COVID-19 cases Gomez-Rail [23]. Macrophage activation syndrome MAS is a condition of systemic hyper- inflammation and often be noted in infection and malfunctioning. It is typified by marked up-regulated expression of pro-inflammatory cytokines. This sort of strong inflammation results in severe tissue injury. Macrophage within MAS state produce high amount of pro- inflammatory cytokine upon stimulation.  Inflammation  is  known to destruct the balance between coagulation and fibrionolysis [14]. The inflammatory cytokines TNFalpha and IL1 instruct macrophage and monocytes to produce tissue factor TF. TF activate coagulation while IL1 anIL6 increase the production of plasmalogin activation inhibitor. Hence, overproduction of inflammatory cytokines along with MAS also promotes intravascular coagulation Otsuka and Senio [15]. Dys-regulated inflammatory syndrome DIS. DIS is generated by mononuclear phagocytes (a rich source of pro-inflammatory cytokines) upon encounter of the virus within the tissue continuum via two stage activation mechanisms which is not specific to the initiating virus. This is relevant to the case of SARS-COV-2 virus infection were age and predisposing comorbidities enhances the risk of severe outcome due to DIS [11].

Human severe SARS-COV-2 pulmonary infection leads to inflammation and tissue destruction with a consequence of an immune mediated fibrosis which remains even in to convalescent phase. In a group of severe pulmonary infected patients with COVID-19. IA aided CT scan were used to score fibrosis via fibrosis index IF. Twelve patients with severe COVID-19 were investigated for IF, they were sub-grouped into IFlo and IF hi. Mononuclear cell were collected from those patients and investigated by single cell RNA sequencing, IF hi group have shown low mononuclear phagocytic cell, low IFN gene profiling as compared to that of IFlo subgroup   of patients. Mononuclear phagocyte could probe the prognosis of immune mediated ling fibrosis [16-21].

Monocyte Responses

In an in-vivo study setting SARS-COV-2 infection sensed by monocyte and macrophages, such sensation forms the inflammosomes that activate caspase I and gasdermin D leading to inflammatory cell death, the pyroptosis and release of potent inflammatory mediators. About 6% of blood monocyte of COVID-19 patients are infected with SARS-COV-2 virus. This virus infection of monocyte depends on the uptake of antibody-opsoinzed virus by FC gamma receptors. The internalized virus begins to replicate within the infected monocyte but infection is aborted and the infectious virus was not detected in the culture supernatant of the infected monocyte. Instead the infected monocyte undergoes pyroptosis mediated by activation of NLRP3 and AIM2 inflammosomes, caspase I and gasdermin D. In same culture settings, the addition of the COVID-19 vaccinee plasma does not promote AB dependent monocyte infection. Moreover tissue resident macrophages but not the infected epithelium and endothelium from lung autopsies from the deceased patients with COVID-19 have activated inflammosomes. The overall of findings suggest that ab-dependent SARS-COV-2 uptake by monocytes and macrophages triggers inflammatory cell death that abort the products of the infectious virus but cause systemic inflammation [14]. Though there was a report discounts the possibility of infection of both lymphocyte and monocytes [22,23].

Among the manifestation of SARS-COV-2 infection in man is the high systemic inflammation and immune dys-regulation. To obtains a mechanistic insight. An ex-vivo cell culture setting in which epithelial cells were co-cultured with monocytes and B cells. Epithelial cells were infected with SARS-COV-2 virus during the incubation period infected epithelial cells interacted with monocyte and B lymphocyte. Strong responses were induced both in monocyte and B cells with SARS-COV-2 inflammatory gene clusters which reproduce immune cell deviation. Similar to that deviation noted in the blood and lung myeloid cells from COVID-19 patients. Earliest infection of epithelial cells with SARS-COV-2 virus triggers inflammatory malformation of COVID-19 patients leading to raise of virus specific monocyte inflammatory phenotypes Leon et al. [24].

In a series of moderate COVID-19 patients, peripheral blood monocyte were investigated, the infection triggers inflammatory responses that stimulate an interferon stimulated gene driven phenotypes, cellular dysfunction epitomized by loss of HLADR receptor expression and induction of alarmin expression is documented in their features in severe cases. Pulmonary macrophages in COVID-19 were derived from infiltrating inflammatory monocytes are in a hyperactivated state resulting in determintal loop of pro- inflammatory cytokine release and recruitment of cytotoxic effector cells, thereby, exacerbating tissue damage in the site of infection [25].

Alveolar Macrophage Responses

In an experimental setting, two deceased severe COVID-19 patients were subjected within few hours to an anatomical and pathological study. Mucous plugs were found in all respiratory tracts, terminal bronchioles and pulmonary alveoli. Autopsy samples were processed and tissue samples were collected, sectioned and stained then examined. Real time PCR was performed to detect SARS- COV-2 Viral RNA. Flow cytometeric analysis was done to detect the direct binding of S protein and expression ofACE2 receptors on the macrophage surface. It was evident an extensive impairment of type I alveolar epithelial cells and atypical hyperplasia in type II alveolar epithelium with formation of halyn membrane, focal hemorrhage, exudation, pulmonary edema and consolidation. The mucous plug with fibrous exudates in alveoli together with alveolar macrophage dysfunction was the characteristic abnormalities. The SARS-COV-2 infection was detected in; alveolar epithelium, alveolar macrophages and hilum associated lymphoid tissue. SARS-COV-2 spike proteins interact with and bind ACE2 receptors. Infection of alveolar macrophages might derives cytokine storm [21].

SARS-COV-2 alveolitis were mapped in a human clinical setting in which broncho-alveolar lavage fluid samples were collected from within 48 of intubation from 86 severe COVID patients needing ventilation. In the  majority  of  these  patients  the  alveolar  space  is persistently enriched with alveolar macrophages and T cells without neutrophils. Single cell RNA sequencing was done to five  of the broncho-alveolar lavage fluids. Besides bulk and single cell transcriptomic profiling were suggesting that SARS-COV-2 infect alveolar macrophages, the infected alveolar macrophages in turn respond by recruiting T cells. These T cells release interferon gamma that triggers alveolar macrophages to secrete inflammatory cytokines and further promte T cell recruitments. Findings suggested that SARS- COV-2 causes slowly infecting, specifically-limited alveolitis in which aveolar macrophages incubating virus transcripts and T cells form positive feedback loop that derives progressive alveolar inflammation. Thus, SARS-COV-2 infected alveolar macrophages forms positive feedback loop with T cells in severe COVID-19 disease [20].

Tempts were made to investigate host responses at the level of lung tissue using single nucleus sequencing of 116000 nuclei from lungs of COVID-19 deceased in individuals and underwent rapid autopsies along with seven control individuals. Integrated analysis identified alterations in cellular compositions, transcriptional cell state and cell-cell interactions. The lungs from COVID patients were highly inflamed with dense infiltrates of aberrantly activated monocytes- derived macrophages and alveolar macrophages but had impaired T cell responses. Monocyte/macrophage derives interleukine 1B and epithelial cell derived IL6 were the unique features of COVID lung infection as compared to other viral pneumonias. Alveolar type II cells adopted an inflammation-associated transient progenitor cell state and failed to undergo full transition to into alveolar type I cells resulting in imparted lung regeneration with expansion of pathologic fibroblasts accounting for the rapidly ensuing pulmonary fibrosis in COVID-19 [19,26].

Dendritic Cells Responses

In a study on a series of convalescent COVID-19 patients peripheral blood mononuclear phagocyte cell were investigated in an in-vitro settings. Early infectious events of SARS-COV-2 with MPS has shown; impaired type I interferon responses, elevated inflammatory cytokine and chemokine levels. The virus even in absence of productive replication in the plasmocytoid DC mediate vigrous TLR7/TLR8 dependent production of both interferon type I and III and inflammatory cytokine as well as chemokine known to contribute to a state of hyper-cytokinemia’ Cytokine Storm”. Which were released from these DC in an ACE2 independent but Neuropilin-1 dependent mechanism. Viral sensing regulates pDC phenotype by inducing cell surface expression of PDL-1 marker, a feature of type I IFN producing cells. In comparison hospitalized COVID-19 patients displayed low frequency of circulating pDC with inflammatory phenotype. Early interaction of SARS-COV-2 and immune cells  occurring  invitro and proved ex-vivo indicate the role of pDC-interferon axis regulate antiviral state in asymptomatic and severe COVID-19 patients. Such findings may indicate crucial and protective role of pDC/IFN I axis in COVID-19 patients [18].

In an in-vivo experimental settings tackling moderate to severe COVID-19 patients. These patients were subjected to high dimensional flow cytometery focusing on MPS cells. It was evident that there were redistribution of monocyte subsets towards intermediate monocyte and general decrease in circulating DCs was observed in response to infection. Severe disease coincided with the appearance of monocyte-myeloid-derived cell suppressor-like cells and high frequency of pre- DC2. Such MPS cell phenotypic alteration and their precursors were cell lineage specific and associated with either the general response to infection of COVID-19 severity. This included an interferon- imprint DCs observed in all patients and a decreased expression of co-inhibitory molecules CD200R in pDcs, DC2 and DC3 subsets in the severely sick patients. Such findings stands as a prove for the MPS dys-regulation associated with severe COVID-19 patients [17].

DCs recognize viral infections and trigger innate as well as adaptive immune responses. COVID-19 severity is highly influenced by the host immune responses and modulation of DCs generation and functions. After the establishment of SARS-COV-2 infection, DCs could play an important role in the immunopathology of the disease. In a series of 65 COVID-19 patients covering mild, moderate to severe infection forms were subjected to analysis of DC circulating populations. Results of such analysis has shown long lasting reduction in DC subpopulation with an expression of functionally impaired – HLADR+ cells lacking DC markers. A higher CD163+ CD14+ cells among DCs subpopulations correlate with systemic inflammation. Depletion and functional impairment of DCs beyond the acute phase play a role in inflammatory responses of COVID-19 patients [16].

Circuit

In the molecular immune sense circuit means a communication form between two immune cells living with in one tissue continuum. In which one cell activated by an inducer, infection will produce mediator, cytokine that activate the other immune cell to produce other mediator, cytokine which in turn affect the first immune cell to produce other mediator. In severe COVID-19 pneumonia infection of alveolar macrophage lead them to produce T cell chemo-attractants. These T cells produce interferon gamma to induce inflammatory cytokine release from the alveolar macrophages and further promote T cell activation. Thus Alveolar macrophages containing the virus and T cells form a positive feedback loop that derives persistent alveolar inflammation [20,25]

Six Points Severity Index

Since studies performed on severe COVID-19 patients were from different nations and different geographical regions across the globe. As well as the sampling and techniques tempted were somewhat different. Thus to hypothetical suggestions for a COVID-19 severity index, one should hold four assumptions as; (i) The sense of severity is of relative homogeneity (ii) Different MPS cells have equal opportunity to face local or systemic viral loads (iii) The function of the MPS cell functions are of similar state and (iv) The invented index components are of equal weights in the evaluation consideration;

  1. Low counts of DCs subpopulations in the peripheral blood stream, impaired function and loss of surface.
  2. DCs-interferon axis function stand as an index of severity and viral persistence.
  3. Low count of broncho-alveolar macrophages and poor transition of type II to type I epithelial cells parallels with severity.
  4. Alveolar Macrophage-alveolar T cell are set on parallel with severity.
  5. Epithelial prior infection pave the way for alveolar macrophage and B cell infectious activation.
  6. Deceased COVID-19 patients associated with alveolar macrophage infection consequences, the pyroptosis and sepsis.

Conclusions

During clinical human SARS-COV-2 pulmonary infection forms, mononuclear phagocyte system cells and epithelial cells are prone to this virus infection. The infection of APS cells is of antibody dependent type. On APS cell infection virus replication cause molecular alterations in; cellular composition, cellular transcription state, and cell-cell interactions. Secretory protein exports in these infected cells are amplified leading to the production of pro-inflammatory and inflammatory cytokine. At the whole cellular levels infected APS cells undergoes immune deviations like; lack of cell surface markers, appearance of intermediate phenotypes, suppressor phenotypes, inhibitory marker bearing phenotypes as well as reduction in numbers in the peripheral blood stream. Reduction in numbers of APS cells  as well as alveolar epithelial cell phase transition impairments were implicated with immune mediated pathological pulmonary fibrosis. Alveolar epithelial cell infection may triggers alveolar macrophage infection and B lymphocytes. Alveolar macrophage infection initiates bilateral positive feedback mechanisms with T lymphocytes. DC cells undergo long lasting reduction in numbers, functional impairments and lack of surface markers. DC functions together with interferons in an axis form leading to regulation of antiviral state in asymptomatic and severe cases. APS cell infections initiate haemo-macrophage syndrome, macrophage activation syndrome, and intravascular coagulation, implicated in immune mediated pulmonary fibrosis, pyroptosis, and terminated by sepsis.

References

  1. Lee A (2008) Biology of Macrophage in Human Front Bioscie Landmarks 13.
  2. Bowdish DEM, Gordon S (2013) Macrophage In: Demcers E and Gazzmelli R eds. Protozoa In Macrophages. Landes Bioscience.
  3. Kumar V (2020) Macrophages: The potential immunoregulatory innate immune cells. Bhat K eds.Macrophage activation. Biology and Disease 79065.
  4. Abram CL, O Neill (2008) Tol-like receptors in Front Biosci Landmarks 13: 62-67.
  5. Santis MD, Locati M, Selmi C (2018) The elegance of Cell Mol Immunol 15: 196-198. [crossref]
  6. Roice LDR (2022) Cell division in tissue enables macrophages Mol Biol Cell 33: P22-040.
  7. Suner C, Silbilio A, Martin J, Castellazzi CL, Reina O, et al. (2022) Macrophage inflammation resolution requires CPEB4 directed offsetting of mRNA degradation. eLife 11: 75873. [crossref]
  8. Murray PJ, Ehrt S, Chawala A (2010) Intersection of pathogenic and protective inflammation. Kingston
  9. Nkitina E, Larionova I, Choinzonova E, Kzhyshowska J (2018) Monocyte and macrophage as viral targets and Int Mol Sci 19: 2821-2845. [crossref]
  10. Puddmann A, Aranson JK (2020) What is T cells in covid-19 infection? why immunity is about more than antibodies. Oxford covid-19 evidence based service University of Oxford.
  11. Marttinez FO, Combs TW, Orsingo F, Gordon S (2020) Monocyte activation in systemic covid-19 infection; Assay and EBioMedicine 59: 102964. [crossref]
  12. Park SH (2021) An impaired inflammatory and innate immune responses in covid-19. Molecules and Cells 44: 384-391. [crossref]
  13. Remy KE, Mazer M, Stricker DA, Ellebedy H, Walton AH, et al. (2020) Severe immunosuppression and cytokine storm characterize covid-19 JCI Insight 5: e140329. [crossref]
  14. Junqueria C, Crespo A, Ranjbar S, Lacerda LBD, Lewandrowski M, et (2022) Fc gamma R mediated sars-cov-2 infection of monocyte activate inflammation. Nature 606: 576-584. [crossref]
  15. Otsuka R, Seino KI (2020) Macrophage activation syndrome and covid-19. Inflam Regen 40:
  16. Winheim E, Rinke L, Lutz K, Reische A, Leutbecher A, et al. (2022) Impaired function and delayed regeneration of dendritic cells in covid-19. Plos Pathogen 17: e1009742. [crossref]
  17. Kvedarate E, Herwig L, Sinha I, Ponzetta A, Myrberg IH, et al. (2021) Major alterations in mononuclear phagocyte landscape associated covid-19 severity. PNAS 118: e2018587118. [crossref]
  18. Servera M, Diotta RA, Etna MP, Rizzo F, Fiore S, et (2021) Differential plasmacytoid dendritic cell phenotypes and type I interferon response in asymptomatic and severe covid-19 infection. Plos Pathogen 17: e1009687. [crossref]
  19. Melme JC, Biermann J, Haung H, Wang Y, Nair A, et (2021) A molecular single cell atlas of lethal covid-19. Nature 595: 114-119. [crossref]
  20. Grant R, Morales-Nebreda L, Markov NS, Swaminathan S, Querrey M, et (2021) Circuits between infected macrophages and T cells in sars-cov-2 pneumonia. Nature 590: 635-641. [crossref]
  21. Wang Z, Zhang Y, Yang R, Wang Y, Guo J, et (2022) Landscape of peripheral blood mononuclear and soluble factors in severe covid-19 patients with pulmonary fibrosis development. Front Immunol 13: 831194. [crossref]
  22. Moustafa A, Khalel R, Aziz RK (2021) Traces of sars-cov-2 RNA in peripheral blood cells of patients with covid-19. OMICS A Journal of Integrative Biology 25: 475-483. [crossref]
  23. Gome-Rial J, Reviro-Calle I, Salas A, Martinon-Torres F (2020) Role of monocytes/ macrophages in covid-19 pathogenesis: Implication for Infection And Drug Resistance 13: 2485-2493. [crossref]
  24. Leon J, Michelson DA, Olejnik J et (2022) A virus specific monocyte inflammatory phenotype is induced by sars-cov-2 at the immune-epithelial interface. PNAS 119: 1-11.
  25. Scultze KR, Schulto-Schrepping J (2021) Monocyte and macrophages in covid-19. Front Immunol 1: 196-198.
  26. Wang C, Xie J, Zhao L, Fei X, Zhang H, et (2020) Alveolar macrophage dysfuntion and cytokine storm in the pathogenesis of two cases of severe covid-19 patients. EBio Medicine 57: 102833. [crossref]

Opinion: The Interplay Of Nkt Cells In Severe Sars-Cov-2 Human Infections

Abstract

Natural Killer T lymphocytes [NKT cells] share the characteristics of innate and adaptive immune cells. Though their immune cell identity is still a matter of debate among lymphocyte immunologists. Currently, NKT cells are of three subsets as; NKT type I, NKT type II and NKT like cells. NKT type I is quite filling this cell definition. Three immune phenomena are evident concerning NKT interplay with viral infected human host as; immune evasion, immuno-pathogenesis, and immune protection. Immuno-pathogenesis and immune protection appeared to be operable in COVID-19 disease. The present opinion paper was aimed at briefing the role interplayed by NKT cells in severe SARS-COV-2 human infections. Host response showed reduced circulating total NKT cells, but some NKT immune subtypes may express an increment shifts in this severe infection form. The biology of NKT cells in severe SARS-COV-2 infections own an array of immune features as; immune-metabolic dysfunction, mitochondrial dysfunction, marked expression of apoptotic and inhibitory receptor genes and ramified in to six immune subtypes.

Keywords

Evasion, Immune, Inhibitory, Metabolism, Pathogenesis, Protection, Receptors and SARS-COV-2

Introduction

Human lymphocytes are of several immune-types as; B, T, NK and NKT. The efforts of scientists concerning the immunology of NKT cells appeared to be little as compared to other lymphocyte immune-types. NKT as an immune-type and definition is a matter  of debates among lymphocyte immunologists. Recently, evident published efforts concerning NKT cells. They share characteristics of both innate and adaptive immune functions. NKT can be immune- pathogenic and/or immune-protective depending  on  the  intensity of the tissue micro-environmental stimuli during human microbial infections. Some human pathogenic viruses displayed an immune mediated evasion mechanism against NKT cells both in function  and in count limiting. The present opinion was aimed at briefing the interplay of NKT in human severe SARS-COV-2 infection [1-5].

NKT Cell Biology

Ontogeny

Lymphoid cell progenitor migrates from bone marrow to thymus. Arrival of these progenitors to the thymic micro-environment insults these cells to undergo positive and negative selection procedures. These selection procedures mediated by variety of cytokines cell surface molecule, signal transducers, transcription factors and other regulatory factors. A key step in NKT maturation is their acquisition of innate effector function mediated by pro-myelocytic leukemia zinc finger PLZF. Another key step is the acquisition of cytokine secretion ability in which an adoption of constitutional expression of cytokine gene transcripts. Such cytokine gene transcripts need intra-thymic signaling through GM-CSF in order to become competent cytokine secretors. VDJ recombination via stochastic events leads to generation of invariant TCR. Acquisition of NKT phenotype appear to be driven by invariant TCR CD1d. Positive selection of NKT needs interaction of invariant TCR on immature NKT expressing both CD4 and CD8 with CD1d expressed on cortical thymocyte themselves. Both alpha galactosyl Cer NKT agnosts and DCs overexpressing CD1d played critical role in NKT thymic negative selection [4].

Identity

NKT cells are defined as lymphocyte expressing CD3+CD56+ surface receptors [6,7]. Lipid antigen reactive CD1d restricted  T cells most of which do not express CD56 [8]. Koay et al. [9] were formulating important NKT defining criteria as; (i) CD56+ T cells do not equate NKT cells, (ii) CD56+ T cells are heterogeneous T cells but not NKT cells and (iii) The use of CD56 T cells in predicating COVID-19 outcomes needs more validation. Khan and Khan [3] mentioned three subsets of NKT of which only NKTtype I with Koay et al. [9] defining criteria as in Table 1 as well as six subtypes, Table 2.

Table 1: NKT CELL subsets*

Subsets Cell molecular Characteristics
NKT type I Alfa Galcer reactivity ,TCR V alfa 24 J alfa18 TCRVB2 VB7 & VB11
NKT type II CD14-dependent secret TH1 anTH2 cytokines, sulfated and lyo-sulfated reactivity
NKT like Cells CD 1 d independent,produce Th1 cytokines No Galcer reactivity,Diverse TCR alfa chain and diverse TCR B chains

Table 2: NKT subtypes*

NKT subtypes Cell molecular Characteristics
1 NKT CD4 Tim3 CD62L
2 NKT CD8
3 NKT CD8 CD40LG
4 NKT CD8Tim3
5 NKTDN ITGAX
6 NKT CD147 CD26 Tim3

NKT Cell Molecular Biology

NKT cells  recognize  lipid  stimulating  antigens  through  CDR3 alpha and CDR3 loops. These complementary determining regions are the hyper-variable regions of TCR that complement an antigen shape. Crystallographic and biophysical analysis of alpha galactosylceramide (alpha GalCer) recognition by human CD-1d resistant TCR that utilize a V alpha 3-1-J alpha 18 re-arranged and displays more restored specificity of alpha linked glycolipid than iNKT TCRs. TCR alpha and CDR2 alpha loops have frequent divergence. This TCR employs convergence recognition strategy to engage CD-1d (Alpha Galcer) with binding affinity approximate 2um almost identical to that of an iNKT [10,11]. The hydrophilic groups of the lipoidal antigen contribute relatively little to CD-1d groove and the top of the alpha helcies are involved in lipid antigen presentation which suggest a conventional mode of presentation and recognition. NKT differentiation has unique management for their differentiation which is highly lympha-toxin dependent [12].

NKT Cellular Evasion

Pathogenic human viruses adopt number of strategies for evasion of both innate and adaptive arms of immune responses in human host. HIV weakens the immune system functions by depleting the numbers of CD4 T cells [13]. HIV-1 reduces the expression ofCD-1d molecules by increasing internalization and retains them in the trans- Golgi network. The down regulation in cell surface CD-1d is caused by interaction with in the continuum of intra-cytoplasmic tyrosine with HIV-1 NEF protein, leading to an early NKT depletion in HIV-1 infected individuals. West-Nile virus interferes with the interaction of DCs with NKT cells with net result of pro-inflammatory cytokine secretion [3].

NKT Cellular Immunobiology

T lymphocytes are of many subsets among which the NKT cells that have common surface markers and functional characteristics with both conventional T lymphocyte and natural killer cells. Major NKT cells express semi-invariant T cell receptor TCR that reacts with glycolipid antigens presented by major histocompatibility complex class I related protein CD-1d on the surface of antigen presenting cells APC. Both infectious and inflammatory conditions do activate NKT to be rapidly producing immune-modulatory cytokines. NKT may influence the function and the activation state of other immune cells [4]. The NKT semi-invariant alpha Beta TCRs recognize mammalian glycol-sphigo-lipid and microbial alpha glycuranylceramides found on the cell wall LPS of gram negative bacteria. This dipartite recognition of the auto and microbial ligands underlies innate-like antimicrobial functions mediated by CD40L induction, massive helper TH1, TH2 cytokines and release of chemokines. NKT and DCs performed a sort of reciprocal activation NKT can regulate a range of immunopathologic condition through unknown mechanisms. NKT legends holds a position between innate and adaptive immunity serving as a model system for structural biology of glycolipid trafficking and recognition [14]. NKT lymphocyte tissue distribution is unusual, they are found in large numbers in liver and lymph nodes but to a lesser extent La Jolla Institute of Immunology [15]. NKT served as an important regulator of the immune responses [16].

NKT Immune Functions

NKT cells are able to substantial cross-talk with other innate and adaptive immune cells. NKT when activated with alpha-GalCer, the activation will lead to rapid cytokine production of both Th1 and TH2 cytokines and chemokines though other NKT subsets when activated produce IL17 cytokine. The mode of cytokine activation of NKT cell starts rapid early in activation events, then late in the activation process the production ceased. NKT can mediate immune protection against a wide range of pathogens including bacteria viruses, fungi and parasites. In an experimental laboratory animal settings NKT mediate immune protection against low dose pathogenic challenge. Though in high dose challenge can induce hyper-cytokinemia terminated by sepsis [4].

NKT in Virus Disease

NKT Cells have anti-viral potentials against hepatitis B virus [17], herpes simplex virus-1, lymphocytic chorio-meningitis virus and influenza A virus [18]. They constitute an important arm of the innate immune responses against pathogenic viruses and can regulate adaptive immune responses through modulation of the antigen presenting cells. NKT exerts direct cytolytic effects and retards viral replication [3].

NKT in SARS-COV-2 Infections

A show case analysis of four series of severe SARS-COV-2 infection in different parts of the world is performed by four different research teams. The analysis covered number of patients, age/sex, clinical samples, and nature of the cellular investigations. At most single cell RNA sequencing, transcriptomic analysis and flow cytometery. The tracked immune cell types were NKT, NK, and T cells. As the SARS- COV-2 infection progressed NKT cells reduced with an apparent immune-metabolic dys-regulation, cellular dysfunction as well as mitochondrial dys-regulation (Table 3) [7,10,19,20]. Among these four studies Yang et al. [10] presented a novel detailed investigation on the role of NKT in SARS-COV-2 severe infection and be briefed in the following paragraph.

Table 3: NKT interplay in severe and mild sars-cov-2 human infections

Features Zingaropoil et al 2020[7] Zingaropoil et al.2020[7] Gurshaney etal 2021[20] Yang et al 2022[10] Odak et al 2020[19] Odak et al 2020[19]
Demography 15 patients, severe form, age 56-69 males 15 patients ,mild form Age 56-69 males 20 patients Both sexs 205 patients in various disease forms 15 severe form,19-61 age range 15 mild form,19-61 age ranges
Samples Peripheral blood Peripheral blood Peripheral blood Peripheral blood Peripheral blood Peripheral blood
Investigation Flow cytometery Flow cytometery Single cell sequencing,BALF transcriptomic analysis Single cell transcriptional profiling Flow cytometery Flow cytometery
 

NKT


Low count levels


Normal count levels

Mitochondrial and cellular dysfunction of NKT count reduced with severity Total NKT reduced as the disease progressed  

Low NKT count levels


Normal count levels

NK Low count levels Normal count levels Low count levels Normal count levels
T cell Low effector T cell ,high naive CD8+ Normal T cell profiles CD8 T cell dysfunction, and impaired CD8 differentiation Gamma delta T cell reduced counts Normal cell count levels
 

Conclusions

Low NKT cell count in severe form Normal NKT ,high T reg. count Total circulating NKT reduced with severity, NKT cellular and mitochondrial dys-regultion Total NKT count decreased as the disease progressed All lymphocyte subsets reduced on disease progression Lymphocyte activation in mild form but not in severe form

In a clinical setting in to which COVID-19 series of patients and controls were subjected to single cell RNA sequencing in order to determine lymphocyte and mononuclear cell profiles. The number  of patients and subjects were; mild 24, moderate, severe 36, critical, died 13, mild recovered 79, severe recovered 50.  Fifty  patients were tested by single cell RNA sequencing. There was evident that decrease in percentages of lymphocyte in patients is associated with severity. The lymphocyte profiles in PBMC were found that CD8+ T, MAITs, gamma delta T cell, Mono DCs and pDCs decrease significantly as disease progress. While the percentages of plasma   B CD94+, monocytes and platelets increased significantly. The NKT cell percentages in severe COVID-19 decreased significantly as the disease progressed and in convalescent. TM3 expression in NKT cells of 202 COVID patients and controls were grouped into six cell subtypes. Increased Tm3 expression in NKT associated with NKT depletion in severe SARS-COV-2 infections [10]. In the followings  a deduction of features of NKT in COVID-19 from Yang et al. [10] study;

  • High levels of expression of CD147CD26
  • High expression of Tim3 promotes NKT depletion and dysfunction.
  • Decrease in circulating NKT counts as the disease
  • High expression of apoptotic and mitochondrial
  • Tim3NKT has capacity to secret IFNgamma, IL4 and
  • Expression of co-stimulatory inhibitory receptors PD-L, CTL4 and

Conclusions

Lymphocyte profile studies of SARS-COV-2 infection forms have shown variable picture of increase in one immune-type and decrease in others. Generally speaking, lymphogenesis increased as the disease progressed. T, NK, and NKT were affected to a variable degree. Total NKT count in circulation decreased as the disease progressed. Though there are some subtypes of NKT cells increased as the disease progressed.

References

  1. Kumar A, Suryadevara N, Hill TM, Bezbradica JS, Kaer LV, et al. (2017) Natural killer T cells: An ecological evolultionary developmental biology Front Immunol 8: 1858. [crossref]
  2. Liu J , Yang X , Wang H, Ziwei L, Deng H, et (2021) Analysis of long term impact on cellular immunity covid-19 recovered individuals reveals a profound NKT cell impairment. mBio 12: 1-14. [crossref]
  3. Khan MA, Khan A (2021) Role of NKT cells during viral infection and the development of Vaccines 9: 949. [crossref]
  4. Wu L, Van Kaer L (2013) Natural killer cells in health and disease Front. Biosci. (Schol.Ed.) 3: 236-251.
  5. Tessmer MS , Fatima A , Paget C, Trottein F, Brossay L (2009) NKT cell immune responses to viral Expert.Opin.Ther.Target 13: 153-162. [crossref]
  6. Kreutmair S, Becher B (2022) Response to are NKT cells a useful predictor of covid-19 severity. Immunity 55: 188-189.
  7. Zingaropoli MA, Perri V, Pasculla P, Dezza FC, Nijhawan P, et al. (2021) Major reduction of NKT cells in patients with severe Clin.Innunol 222: 108630. [crossref]
  8. Le Dieu R, Taussig Q, MacDougal F, Lister A, Gribben JG (2007) CD3+CD56+ cells but not natural killer T cells are increased in peripheral blood of untreared patients with leukemia. Blood 110: 1815-1815.
  9. Koay H-F , Gherardin NA ,Nguyen THD, Zhang W, Habel JR, et (2022) Are NKT cells a useful predictor of covid-19 severity. Immunity 55: 185-187. [crossref]
  10. Yang J, Chang T, Tang L, Dang H, Chen D, et (2022) Increased expression of Tim- 3 is associated with depletion of NKT cells in sars-cov-2 infection. Frot Immunol 13: 796682. [crossref]
  11. Lopez-Sagaseta J, Kung JE, Savage PB, Gumperz J, Adams EJ (2012) The molecular basis for recognition of CD-1d[alpha Galactosylceramide by human non-V alpha24 T cell Plos.Biol 10: e1001412. [crossref]
  12. Elewaut D, Kornenberg M (2000) Molecular biology of NKT cell specificity and development. Seminars Immunol 12: 561-568. [crossref]
  13. Pegu A , Asokan M , Wu L, Wang K, Hataya J, al. (2015) Activation and lysis of human CD4 cells latently infected with HIV-1. Nat.Commun 6: 8447.
  14. Bendlelac A, Savage PB, Teyton L (2007) The biology of NKT cells. 25: 297-336. [crossref]
  15. Lajolla Institute of Immunology (2022) NKT cell immuniology.
  16. Godfrey DI, McDonald R, Kornenberg M, Smyth MJ, Kaer LC (2004) NKT cells: What is in a name. Rev. Immunol 4: 231-237.
  17. Kakimi K, Guidotti LG, Koezuka Y (2000) Natural Killer cell activation inhibit hepatitis B virus replication in-vivo. J Med 192: 921-930. [crossref]
  18. Liu J, Glosson NI, Du W, Hague JG, Brutkiewicz RR (2013) Thr/Ser. Dual motif in the cytoplasmic tail of human CD-1d is important for down regulation of antigen presentation following a herps simplex viral infection. Immunol 140: 191-201. [crossref]
  19. Odak I, Parros-Martins J, Bosnjak B, Stahl K, David S, et (2020) Reapopearance of effector T cells is associated with recovery from covid-19. EBioMedicine 57: 102885. [crossref]
  20. Gurshaney S, Alvarez AM, Ezhakunnel K, et al. (2021) Metabolic dysregulaion induces impaired lymphocyte memory formation during sever sars-cov-2 infection. bioRxiv Preprint.

TH17 Cells And The Intercellular Functions In; Severe,Critical,Deceased And Vaccinee From Sars-Cov-2 Human Pneumonia

Abstract

TH17 cells displayed multiple immune functions in viral human infections including SARS-COV-2. The objective of the present opinion paper was to deduce the actual contribution of these cells in various infection phases of SARS-COV-2 in man. The deduction tempts to: (i) map the immune-typing of TH17 cells in: severe, critical, deceased and Vaccinee via show case analysis and (ii) suggest the pathogenic mechanism of TH17 cells in this disease. The show case analysis of five research papers  published  between  2020  and  2022  indicated  that:  TH17  cells  are  of  two  main  subsets,  the  nonpathogenic and the pathogenic was with, marked plasticity, pleomorphism and instability. On the onset of the clinical infection through hospital admission the patient peripheral blood has shown twice TH17 counts than in normal controls. In uncontrolled progressed COVID-19, the TH17 cell count drop in peripheral blood and enriched in lungs with marked elevation in counts and clonal expansion therein in severe critical and deceased cases. Critical cases on recovery showed TH17 cell counts restoration to normal. Peripheral blood Th17 cells inhibit Teg while in lung both of TH17 and T reg counts were elevated. TH17 cell recruit neutrophils during the infection progress and interacts with various subsets of macrophages and DCs with an outcome of hypercytokinemia and tissue pathology. Based on these facts, the opinion suggested: (i) TH17 as predictor of severity, critical and deceased as well as (ii) the possibleTH17 cells pathogenic mechanisms operable in cases of SARS-COV-2 human disease.

Keywords

Cell, Clonal, COVID-19, Expansion, Pathogenic, TH17

Introduction

TH17 cells are heterogeneous distinct lineage of CD4+ T cells. They are differentiated from naïve T cells through the action of cytokine micro-environmental stimuli. TH17 are basically of two subsets the nonpathogenic and the pathogenic [1]. These helper cells take part in extra-cellular bacterial infections, yeast infections, viral infections including SARS-COV-2 and auto-immune diseases. TH17 performed dual immune functions: the immune-pathogenic and to lesser extent the immune-protective [1-6]. The objective of the present opinion paper was to: (i) map the role of TH17 through the show case analysis of five immune-typing studies of TH17 cells and (ii) suggest the pathogenic mechanisms of these cells in COVID-19, during the period of 2020 till 2022.

Show Case Analysis Approaches

To assess the current holdings of the scientific workers in immunology of SARS-COV-2 infections in man, a sum of 150 current published works through the period of 2020 till 2022 were allocated. These efforts were analyzed so far concerning the CD4+ T cell subsets in COVID-19. Among which ten were concern the role of TH17 in this disease. Of the ten, one was proving TH17 role indirectly from cytokine profiles, five adopted flow cytometery, single cell mRNA sequencing and immunoinformatic approaches to the immune cells recovered from peripheral blood and broncho-alveolar leavage. The rest four review articles were already depending on flow cytometery proving that TH17 cells in association with severe COVID-19 disease and considered as supplementary to this work. The adopted five research works (Table 1) were the raw materials for the show case analysis to deduce the role of TH17 in various phases of human COVID-19 disease [1-12].

Table 1: The show case analysis test research articles

tab 4-1

TH17 Cells

Basic TH17 Cell Biology

TH17 cells are distinct lineage of CD4+ T cells that differentiated from naïve T cells, secret the cytokines IL17 A and IL17f and express the lineage specific transcription factor RORC. Both of TH17 and TH17/Th1 clones showed selective expression of IL23R and CCR6 in addition to RORC. Th17 help B cells, express low cytotoxicity and low susceptibility to action of autologous T reg. and critical in clearance of extracellular microbial pathogens [14]. They are of two subsets pathogenic and nonpathogenic [1] (Table 2). These helper cells are pleomorphic, instable and exhibit a sort of plasticity. The TH17/TH1 subset can revert to Th1 cells. Hence some workers denote them as heterogenic helper cells [1,14].

Table 2: Th17 cell subset characteristics

tab 4-2

TH17 Cell Differentiation

T helper lymphocytes featured by the expression of CD4+ T cells surface markers are the central cell subset of adaptive immunity. CD4 T cells can recognize proteins of microbial pathogens by their unique surface TCR. TCR can shape antigens and organize against them. Both of the TCR-antigen recognition and the signal of TCR engagement integrated stimuli initiate sort of transcriptional changes that guide naïve T cells towards a specialized function. These stimuli include cytokine, soluble mediators or bacterial products in the microenvironment. This differentiation process needs the regulatory interplay of specific intracellular signal transducer and activator STAT protein in the process. STAT eventually induces the dominant transcription factor TF. TF represent the master lineage specific factor. TF controls the transcriptional program of the cell covering: cytokine production and chemokine receptor expression that mediate trafficking to various organs: this network helps each T cell subsets to exert their specific functions in response to antigens available in the assigned tissue. The T cell TF is a T-Box protein in TH1, GATA b binding protein in TH2, and retinoic acid related orphan receptor gamma-t RORCg-t in TH17 and fork head box3 in T regs [16-19]. Any insult of what so ever nature to this differentiation mechanisms lead to dys-regulation mechanism in various steps of the T cell growth, maturation and response to challenge. Such dysregulation can contribute to pathological responses just as in case of immune mediated diseases. For TH1 and TH17 cells and allergenic responses for TH2. The fate decision of the naïve T cells is largely affected by the cytokine surrounding environment. The Th17 differentiation process encoded by the expression of two effector genes: IL17a and IL17f together with multiple player processes are involved in the different stages of differentiation. The STAT, RORC-g-t axis, RORA, Ahr IPF4 and BATF markers set the initial chromatin accessibility that allows the transcriptional programs. Among which the RO RCg-t is determinative for the expression of IL17a and IL17f genes.

Two different cytokine cocktails lead to two different TH17 subsets. TGFB and IL6 induce nonpathogenic TH17 cells characterized by the co-expression of IL10. While IL6 and IL23 but not TGFB lead  to differentiation of the pathogenic TH17 cells. Both of the subsets would express RORCg-t but the pathogenic subset of TH17 cells are more plastic, polymorphic and have tendency for transition towards TH1 cells. For any naïve T cell differentiation, the concentration and the gradient of TGFB is crucial, high concentration induces T regs associated genes. While restraining T bet and TH1 genes possibly inhibit TH17 pathogenic responses. There is a developmental overlap between TH17, Th1 and T regs. Such overlap might be caused by the complex cytokine dynamics [1,2,20-22].

TH17 Cell and Cellular Interactions

TH17 cells are known to inhibit T reg. responses in peripheral blood of COVID-19 patients [7]. They can induce the neutrophil  and epithelial responses provided by the presence of environmental microbial insults [2]. Within the continuum of COVID-19 pneumonic lungs, TH17 cells interact with pro-inflammatory, pro-fibrotic macrophages, DCs and pDCs [9].

TH17 Cell Immune Functions

TH17 cells performed dual immune function in immune- pathogenesis of viral infections and/or immune protection [6]. They are involved in neutrophil and epithelial cell immune response to extracellular microbes and the initiation of autoimmune diseases [2]. Th17 cell may interplay with the pathogenicity of allergy, asthma and human inflammatory diseases [14].

TH17 Cells in Viral Infections

TH17/IL17 hinders and limits viral infections via several mechanisms as: Enhancing  TH1  responses,  promoting  cytotoxic  T cell activity, modulating antiviral B cell responses and inducing protective inflammatory responses. They may limit the viral induced organ pathology, inhibiting inflammation and mediating protective immune responses. Th17 cells/IL17 cytokine may promote viral infection through different mechanisms as: Antagonizing antiviral TH1, T regs and CTL responses, enhancing survival of infected cells, promoting viral intracellular replication, take part in evolution of tissue pathology and fibrosis [6].

TH17 Cells in Various Phases of SARS-COV-2 Human Infection

The TH17 cells were confirmed both in peripheral blood and lung compartments of various phases of COVID-19, Tables 3-6. Early acute infection and on admission to hospital, TH17 cells were of twice count than that of asymptomatic and controls. T regs were reduced in count and function [1]. On progress under un-controlled conditions, severe state, TH17 counts were reduced in circulation. Both TH17 cells and T regs were increased with clonal expansion in lung compartment in severe COVID-19. In critical or deceased cases both TH17 and T regs were amplified in counts and expansion. But on recovery from severe or critical states TH17 and T reg counts were restored to normal. In line with Th17 count elevation these cases there were reduction in CD4+ T cells, Cd8+ T cells both in circulation and lung compartment. TH17 suppress the T regs and triggers neutrophils causing recruitment to the affected tissue compartment and interacts with each of pro-inflammatory, and pro-fibrotic macrophages, DCs, pDCs, and monocytes. Such intercellular interactions may terminated by an overt inflammatory cytokine production leading to a state of hyper-cytolinemia, the cytokine storm [9]. Th17 cell clone expansions in lung compartment were higher than that in circulation. Lung resident TH17 cell clones can be either merely resident or of mixed resident and migratory forms from circulation. Other T cell subsets were showing various degrees of clonal expansion [9].

Table 3: Circulatory TH17 cells in severe and vaccine of COVID-19 as evident in the three show case analyzed groups

tab 4-3

Table 4: Circulatory and pulmonary Th17 cells severe, critical, deceased and vaccine of COVID-19 as evident in the two show case analyzed groups

tab 4-4

Table 5: Circulatory Th17 cells severe, critical, critical deceased and vaccine COVID-19 as evident in the five show case analyzed groups

tab 4-5

Table 6: Pulmonary existed TH17 cells in various forms of COVID-19 as evident in two show case analyzed groups in comparison to gut Th17 in Chron’s disease

tab 4-6

TH17 Cell Suggested Pathogenic Mechanisms

Since TH17 cells expressed low cytotoxicity, though to be a pathogenic helper cell it should express other supportive means to make it able to perform its pathogenic influences. Hence, this opinion paper tempted to hypothesize theoretical suggested mechanisms operable in induction of immune tissue injuries in the lung compartments. They can be coined as follows:

  • TH17 cells when interacts with pro-inflammatory macrophages and inflammatory macrophages, they will induce excessive inflammatory cytokines forming cytokine storm mediating tissue pathology consequences of COVID-19 [9].
  • Th17 cells recruits neutrophils to lung compartment whereby the affected tissue niche, therein neutrophils produce excessive inflammatory cytokines and reactive O2 intermediates mediating immune tissue injury [9].
  • On inhibition of T reg by TH17 cells, they lend the cellular microenvironment allowance of up regulation of auto-reactive T cells to initiate autoimmune pathologic tissue injury [7,10].
  • The TH17 cell interaction with pro-fibrotic macrophages may initiate lung tissue fibrotic lesions, the known consequences of COVID-19 pneumonia [9].
  • TH17/Th1 cells are known to be: plastic, pleomorphic and instable they my undergoes transition to TH1 cells producing IFNG cytokines and other inflammatory cytokines leading to hyper inflammation in lung paranechyma the sign of COVID-19 pneumonic lungs [15].

Conclusions

TH17 cells associated with the pathogenesis of COVID-19. Circulatory TH17 subset is distinct from lung tissue resident TH17 cell subset. The tissue resident TH17 cells are expanded as tissue specific subset, as mixed clones of migratory and tissue resident TH17 cell clones. On clinical onset of the disease they were of twice count level than controls and inhibit T regs. But in progression during uncontrolled affection, Th17 cell and T reg cells gaining higher counts and marked clonal expansion therein lung compartments as compared to peripheral blood both in severe and critical cases. Though they both reduced to variable degrees in circulation, on recovery of severe and critical cases TH17/T reg ratios restored to normal.

References

  1. Simone D, Stingo A, Ciccia F (2021) Genetic and environmental determinants of T helper 17 pathogenicity in Front Genetics 12: 703242. [crossref]
  2. kurebayashi Y, Nagai S, Ikejiri A, Koyasa S (2013) Recent advances in understanding the molecular mechanisms of development and function of TH17 Gene to Cell 18: 247-265. [crossref]
  3. Velikova TV, Rotsev SV, Georgiev DS, Batselova HM (2021) The role of TH17 cells in sars-cov-2 infection: implementation for the therapy of severe coid-19 Cell 4: e3058.
  4. Martonik D, Parfieniuk-Kowerda A, Rogalska M, Filisiak R (2021) The role of TH17 responses in covid-19. Cells 10: [crossref]
  5. Samiento-Monroy JC, Parra-Medina R, Garavito E, Rojas-Villarraga A (2021) TH17 response to severe acute respiratory syndrome coronavirus 2: A type of immune response with possible therapeutic Viral Immunol 34: 190-200. [crossref]
  6. Ma WT, Yao XT, Peng Q, Chen DK (2019) The protective and pathogenic roles of IL17 in viral infections; friend or Open Biol 9: 190109. [crossref]
  7. Sadeghi A , Tahaschi S ,Mahmood A, Kuznetsova M, Valizadeh H, et (2020) Th17 and T reg cell function in sars-cov-2 in patients compared to healthy controls. J Cell Physiol 236: 2829-2839. [crossref]
  8. Ronit A, Berg RMG, Bay JT, Haugaard AK, Ahlstorm MG, et al. (2020) Compartmental immunotyping in covid-19; A case series. J Allergy Clin Immunol 147: 81-91. [crossref]
  9. Zhao Y, Killan C, Turner JE, Bosurgi L, Roedl K, et (2021) Clonal expansion and activation of tissue resident memory-like TH17 cell expressing GM-CSF in the lung of patients with severe covid-19. Sci Immunol 6: 6692. [crossref]
  10. Samson M, Nicholas B, Ciudad M, Greigert H, Guilhem H, et al. (2022) T cell immune response predicts the risk of critical sars-cov-2 infection in hospitalized patients. Eur J Inetrnal Med 102:104-109. [crossref]
  11. Gandolfo C , Anichini G , Mugaini M, Bocchia M, Terrosi C, et (2022) Overview of anti-Sars-cov-2 immune responses six months after BNT162b2 mRNA vaccine. Vaccines 10: 171. [crossref]
  12. Biasi SD, Meschiari M, Gibellini L, Bellinazzi C, Borella R, et al. (2020) Marked T cell activation ,senescence ,exhaustion and skewing towards TH17 in patients with covid-19 pneumonia. Nat Comm 11: 3434. [crossref]
  13. Muyayalo KP, Huang DH, Zhao SJ, Xie T, Mor G, et (2020) Covid-19 and T reg./ TH17 imbalance:Potential relationship to pregnancy outcomes. AM J Rep Immunol 64: e13304. [crossref]
  14. Maddur MS, Miossec P, Karveri SV, Buyry J (2012) Biology, pathogenesis of auto- immune and inflammatory disease and Am J Pathol 181: 8-18. [crossref]
  15. Annunziato F, Cosmi L, Santarlasci V, Maggi L, Liotta F, et (2007) Phenotypes and functional features of human TH17. J Exp Med 204: 1849-1861. [crossref]
  16. Szabo S, Kim ST, Costa GL, Zhang X, Fathman CG, et (2000) A novel transcription factor, T bet, directs TH1 lineage commitment. Cell 100: 655-669. [crossref]
  17. Fontlnot JD, Gavin MA, Rudensky AY (2003) Foxp3 programs, the development and function of CD4+Cd25+ regulatory T Nat Immunol 4: 330-336. [crossref]
  18. Harrington LE, Hatton RD, Mangan PR, Turner H, Murphy TL, et al. (2005) Interleukine 17 producing CD4+ effector T cells develop via a lineage distinct from T helper type 1 and 2 Nat Immunol 6: 1123-1132. [crossref]
  19. Ciofani M, Madar A, Sellars M, Mace K, Pauli F, et (2012) A validated regulatory network for TH17 cell specification. Cell 151: 289-303. [crossref]
  20. Ghoreschi K, Laurence A, Yang XP, Tato CM, McGeachy MJ, et (2010) Generation of pathogenic TH17 cells in the absence of TGFB signaling. Nature 467: 967-971. [crossref]
  21. Kebir H, Kreymborh K, Ifergan I, Dodelet-Devillers A, Cayrol R, et (2007) Human Th17 lymphocytes promote blood-brain barrier distrubtion and central nervous system inflammation. Nat Med 13: 1173-1175. [crossref]
  22. Zheng W, Flavell RA (1997) The transcription factor is necessary and sufficient for TH2 cytokine gene expression in CD4 T cells. Cell 89: 587-586. [crossref]