Monthly Archives: June 2021

Review on Divalent Atom and Group in Bioisosterism

DOI: 10.31038/JPPR.2021421

Abstract

Bioisosterism in rational drug design approach specifically the divalent atom and group in their modification and optimization to improve the pharmacokinetic and pharmacodynamics properties of compound have been studied.

Keywords

Bioisosterism, Divalent

Introduction

Bioisosterism is a strategy of Medicinal Chemistry for the rational design of new drugs, applied with a lead compound (LC) as a special process of molecular modification [1]. The LC should be of a completely well-known chemical structure and possess an equally well-known mechanism of action, if possible at the level of topographic interaction with the receptor, including knowledge of all of its pharmacophoric group. Furthermore, the pathways of metabolic inactivation [2], as well as the main determining structural factors of the physicochemical properties which regulate the bioavailability, and its side effects, whether directly or not, should be known so as to allow for a broad prediction.

There are two kinds of divalent isosteres. They are:

One that involves the swapping of an atom that is involved in the double bond such as C=C, C=N, C=O, and C=S.

The other types are those when substituting atoms of different kinds result in the alteration of a single bond. such as seen here:

C-C-C, C-NH-C, C-O-C and C-S-C.

In the structural activity relationship study of many different active pharmacological agents, both types of isosteres substitution have been used widely.

Divalent Replacement Involving Double Bonds

As mention above this group involves such replacements as C=C, C=N, C=O, and C=S. tautomerization of these groups is facilitated by the presence of a heterocyclic system in the lead compounds while studying therapeutic agents and the absence of moving proton migrating in the ring system. Replacing C=S with C=O in the aldose reductase inhibitor Tolerstat, which is being studied for its activity in diabetic neuropathy had produced oxo-Tolerstat which have both in- Vivo and in-vitro [3].

{[6-methoxy

{[6-methoxy 5(trifluoromethyl) naphthalene-1-carbothioyl] (methyl) amino} acetic acid.

Aldose reductase inhibitory activity of Tolrestat and Oxo- Tolrestat.

inhibition table

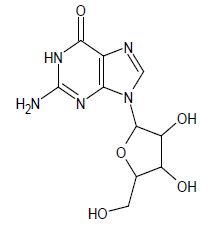
Inhibition of enzyme activity in partially purified bovine lens preparation. 2, Inhibition of galactitol accumulation in the sciatic nerves of rats fed 20% galactose for 4 days. This class of divalent isosteres can also be used with purine nucleoside analogs that are tested for in- Vivo antiviral activity against the Semliki Forest virus [4]. The percentage of mice surviving for 3 weeks for different bioisosteric analogs compared to the absence of control group mice survivors. A weakly active compound has resulted when a sulfur replacement at C-8 is done with oxygen or selenium.
3rd

2-amino-9-[3,4-dihydroxy-5-(hydroxymethyl) oxolan-2-yl]-1,9-dihydro-6H-purin-6-one (Table 1).

Table 1: Guanosine bioisosteric analogues activity against semliki Forest Virus.

S.no

C-8 %Total survivor
1 C=S

83 (10/12)

2

C=O 67 (8/12)
3 C=Se

58 (7/12)

Divalent Replacement Involving Single Bonds

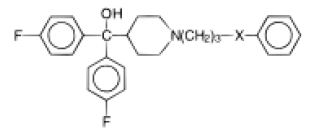
These Bioisosterism are a group of an atom which are attached to different substituent attachment of two different substituents to the Bioisosterism the polar and chemical difference is less noticeable. The biological activity of these divalent bioisosteres hold could be linked to the bond angle. In the example below the relationship between the anti-allergic activity and bond angle of different divalent bioisosteres is shown [5].
Aminophylline

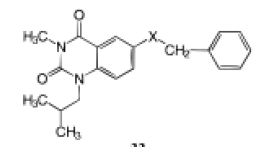
Aminophylline orally at 100 mg/kg was used as a positive control and assigned a biological response of (++); (-) not significantly different from negative control group at p<0.05 as determined by the Dunnett’s t test; (+) activity between positive and negative groups; (++) activity equivalent to positive control group; (+++) activity greater than positive control group. Passive foot anaphylaxis is an IgE mediated model used to detect compounds that have anti-allergic action. . Using oxygen as a bioisosteric linker shows a smaller bond angle and greater electronegativity proving an improved potency. Another good study on inhibitors of nuclear factors of activated T-cell (NFAT) – mediated transcription of β- galactosidase. T-cells are the main component of the immune system that gets activated on the contact with foreign matter induction interleukin-2 (IL-2) gene which are necessary autocrine growth factor for T-cells. Activated T-cell release many different bioactive molecules to initiate a series of events that leads to immune /inflammatory response [6]. The region 257- 286 base pairs upstream of the IL-2 structural gene binds to a protein, the nuclear factor of activated T cells-1 (NFAT-1), preceding to IL-2 gene transcription. NFAT-1 is conveyed in relatively few cells besides T cells and is markedly upregulated upon stimulation of the T cell receptor. This makes it an extremely specific target within activated T cells. When the cell is activated, the NFAT-1 protein binds to the DNA at its recognition site and induces the transcription of â-galactosidase. This study evaluated some of the bioisosteric analogs of quinazolinediones as an immunosuppressant agent since they can inhibit β- galactosidase (Tables 2 and 3).
last

Table 2: Oral anti-allergic activity in the passive foot anaphylaxis’s Assay of analogous containing varied heteroatom.

S.no

x Electronegativity Bond angle Passive foot anaphylaxis’s (10 mg/kg)
1 -O- 3.15 108.0

+++

2

-S- 2.32 112.0 +
3 -CH2- 2.27 111.5

+

4

-NH- 2.61 111.0

+

Table 3: Regulation of NFAT-1- regulated β-galactosidase activity by Quinazolinediones is shown below.

S.no

X IC50 (µM)
1 -NH-

4.47

2

-CH2 4.03
3 -O-

2.5

Conclusion

Bioisosteres control biological activity by virtue of restrained differences in their physicochemical properties. Systematic correlation of physicochemical parameters with observed biological activity has been very effective in highlighting subtle differences within bioisosteric groups which frequently increase activity. Of significance is the ability of these bioisosteric groups to describe some of the essential requirements of the pharmacophore. This is especially important when the synthesis of a large number of drug nominees for assessment is not economically achievable. A number of less known replacements have not been reviewed because of their inability to demonstrate bioisosterism in more than a single class of agents. In this review, an attempt has been made to explain the rationale behind the use of bioisosteric replacements using examples in divalent atom and group from current literature. It is hoped that this systematic approach will facilitate the use of bioisosteric replacements in future structure activity studies.

Author Contribution

The manuscript was written through contributions by the author Hawi Matewos Daka.

Acknowledgment

Finally, I would like to thank my parents Matewos Daka and Bayush Temesgen for the emotional and financial support they have given me to write the article.

References

  1. Burger AA (1983) Guide to the Chemical Basis of Drug Design. NY, EUA Wiley.
  2. Stenlake JB (1979) Fondations of Molecular Pharmacology, Vol 2. The Chemical Basis of Drug Action, Londres, Inglaterra, Athlone Press pp: 213-290.
  3. Wrobel J, Millen J, Sredy J, Dietrich A, Kelly JM, et al. (1989) Orally Active Aldolase Reductase Inhibitors Derived from Bioisosteric Substitutions on Tolrestat. J Med Chem 32: 2493-2500. [crossref]
  4. Bonnet PA, Robins RK (1993) Modulation of Leukocyte Genetic Expression by Novel Purine Nucleoside Analogues. A New Approach to Antitumor and Antiviral Agents. J Med Chem 36: 635-653. [crossref]
  5. Walsh DA, Franzyshen SK, Yanni JM (1989) Synthesis and Antiallergy Activity of 4-(Diarylhydroxymethyl)-1-[3-(aryloxy)propyl] piperidines and Structurally Related Compounds. J Med Chem 32: 105-118. [crossref]
  6. Michne WF, Schroeder, JD, Guiles JW, Treasurywala AM, Weigelt CA, et al. (1995) Novel Inhibitors of the Nuclear Factor of Activated T Cells (NFAT)-Mediated Transcription of â-Galactosidase: Potential Immunosuppressive and Antiinflammatory Agents. J Med Chem 38: 2557-2569. [crossref]

Field Study on Abortion Storm in Dromedary Camel Farm in Saudi Arabia with Emphasis to Chlamydiosis

DOI: 10.31038/IJVB.2021531

Abstract

In a semi – intensive farm system for Camelus Dromedarius, native Saudi camel breeds were kept for milk purpose in north area of KSA. Mijaheem subspecies was dominant in number due to the believe that they are the highest in milk production. In December 2018 sudden continuous abortions were encountered without any apparent causes. Abortions were in the last trimester and were very high compared to previous years’ records. Samples were collected and sent to laboratories locally and aboard, ELISA and PCR real – time were conducted accordingly and farm field measures were implemented intensively. The study summarizes the whole investigation been conducted and the results been stated with clear evidence of Chlamydia abortus as a cause of the abortion storm.

Keywords

Chlamydia, PCR real time, north of Saudi Arabia, Camelus dromedarius, Abortion

Introduction

Abortion refers to pregnancies that terminate with the expulsion of fetus with recognizable size prior to the period of viability, which is arbitrarily defined as 260 days for cow and 290 days for mare. Also fetal death is not an essential prelude to abortion. Abortion may be spontaneous or induced, infectious or noninfectious [1]. As for Camelus dromedaries Saeed Basmael found that 389 days are the maximum number of days that camel fetus can stay viable inside the uterus of his dam [2]. The authors have applied this information to declare abortion in camelus dromedarius is the expulsion of fetus of recognizable size prior to 389 days of gestation.

Chlamydia has a worldwide distribution causing a wide range of disease in human hosts, livestock, companion animals and even wild and exotic species. Chlamydiosis in animals can range from asymptotic infection to severe disease with life-threatening illness [3] Chlamydial taxonomy lately settled to describe order Chlamydiales consisting of nine families, first famous family is Chamydiaceae. This family Chlamydiaceae consist of one single genus Chlamydia which include 11 (Eleven) species: these species are C. abortus; C. caviae; C. felis; C. muridarum; C. suis; C. pecorum; C. avium; C. psittaci; C. pneumonia; C. trachomatis; C. gallinacea [4]. Virtually chlamydial species might easily cross all body host barriers. Members of chlamydiales order are obligate intracellar Gram negative bacteria which are transmitted as metabolically inactive and must differentiate, replicate and re-differentiate within the host cell to carry out their life cycle. It is obvious that due to science development Chamydiales order life cycle is being greatly understood [5].

In Saudi Arabia the first record of serological evidence of camel chlamydiosis was reported by Mansour F. Hussein, ELISA test was performed by Chlamydophila abortus enzyme immunoassay kits (IDEXX LAB. USA). 19.4% of the tested camel were positive for anti-chlamydial antibodies which was more prevalent in females than males and also higher in adult than young camels [6]. Abdelmalik Kalafalla was the first to use PCR real-time technique for detection of chlamydiosis in indigenous camels of Saudi Arabia using uterine swabs and reported 10.3% positive for chlamydiosis [7]. Also I Al Khalifa reported chlamydiosis in 10.05% samples from 378 Mijaheem camels been tested using indirect enzyme-linked immunosorbent assays [8]. These above 03 chlamydiosis prevalence reports in Saudi Arabia camels are great evidence for scientists to continue research in this field especially with the high rate of abortions encountered in Saudi Arabia now. There are also reports of camel chlamydiosis in nearby countries such as in UAE [9]; Egypt [10]; Tunisia [11]; Libya by [12] and in Algeria by [13]. Moreover, scientists declared that ticks can carry viable chlamydophila and can transmit it to other animals [14,15]. Zoonotic infections due to chlamydia abortus and chlamydia psittaci are reported and well known and more prevalent than other Chlamydia species [3]. Vertical transmission, which promotes the persistence of infection in ruminant herds, also occurs in birds, venereal transmission of C. abortus is possible since the bacteria are found in the semen of bulls, rams and goats [16].

Materials and Methods

Farm Management System

The location case farm is highly organized and have a very large space area which reach 30000 Hecter, in far north of Saudi Arabia. There is a well-built management system with ear tags electronic identification (SHEARWELL Co.) and the camel have been kept in an isolated area of more than 6000 Hecter which give them good area to practice natural grazing and also as natural barrier against contacts with other camel herds around, so eliminating different diseases contacts possibilities. The farm has a simple model of camel milking parlor and also a milk processing plant is located 15 KGM from camel zone serving camel and goat milk. The rearing management system is mainly divided into two major units:

a. Unit one: Mating, grazing and calving

b. Unit two: Milking

Unit One: Mating, Grazing and Calving

After mating, primitive tail rising method of pregnancy diagnosis is practiced and positive ones ate separated into specific and been fed an according to the farm policy waiting for a second pregnancy check. Mating and tail checking is going on during the winter season which is between October up to April of next year and also the separation process of positive pregnant and rechecking are continuing on. In the end of the winter season all the group of she camels are drove out to the grazing unit (mainly to decrease the feed cost). Negatives are kept alone for more investigations. In the camel area of the project also there are many central water pivots which belong to the company agricultural dept. and are always grown barley, Alfa-Alfa, corn or industrial tomato so a good chance of grazing in these pivots after harvesting are well utilized and of high benefit. A daily check of animal health and feeding are done perfectly and all necessary programmed and interventions are practiced. The well clear pregnant ones are drove back to calving pens on approaching the coming season and calving and calf management is done, then they transferred to milking unit and the cycle is repeated.

Unit 2: Milking

On receive of dams with their calves after spending 15 days in calving pens and been naturally direct udder feeding been practiced, all dams with their calves will start a training programmed of machine milking procedures. After some time, the dam will be trained and will come alone to the parlor without her calf. Usually dams are milked twice a day and kept for one milking season, but sometimes it will continue milking for up to 18 months. Animal health and feeding depts. are available according to the procedures.

Case Report

In 2018 and while the calving season was going smoothly as previous seasons (season usually between Oct. and April of next year), calving attendants report a series of abortions in the last trimester stage of pregnancy without any reason or prior symptoms, they only had found aborted foeti and may found some links to a certain dam due to drooled placenta or some fluids and blood on the outer dam gentilia. More procedures were implemented and night supervisors appointed with instruction to call veterinarian to attend all deliveries or abortions any time night or noon. Three management approaches were implemented which are:

a. Effective quarantine of the calving area was done, closing of the camel area also implemented and separate labors for the calving area was strictly observed and controlled. We build a new calving area for new comers from grazing area to deliver calves.

b. Disinfections were applied to pens, feeders, drinkers and the camels in daily basis. Vitamins and minerals mixers were applied to camels feed and water as recommended by manufacturers. Mass antibiotic water soluble treatment was practiced for all adult females whether aborted or not with Doxycycline-200 W.S. powder at a dose of 05 Grams per 200KG body weight for 05 consecutive days in drinking water. The treatment programmed continued monthly for 03 days with the same drug and dose till end of parturition season.

c. Importantly samples from recent aborted attended cases were collected, preserved and been sent to local and aboard laboratory. We had taken from 20 aborted she camels blood for serum for ELISA testing in ARASCO Co. in KSA (Table 1). From other 08 aborted she camels, we had collected amniotic fluids, blood for serum, part of placenta tissue and a preputial wash from one male camel and been sent to aboard laboratory (Table 1).

Table 1: Samples details

Samples and specimen

Quantity

Laboratory and intended test
1. Blood for serum

20

KSA ARSCO Co. for ELISA test
2. Amniotic fluid, blood for serum, placenta tissue and preputial wash

08

Aboard laboratory for PCR

Results

Closely we trace the abortion rate of the concerned location from the records of year 2014 up to year 2018 season in which sudden sharp rising abortion incidents were noted and recorded. Also we have the data of 2019-year season which the abortion rate come back to normal like rates of previous years before the abortion storm of year 2018. In Table 2 below we can check easily the rates of the abortion in the location from year2014 up to end of year 2019 calving season.

From Table 2 it clearly indicated how it was serious and difficult situation to encountered suddenly a continuous silent abortion in year 2018 which finally reached 33.80% of the total pregnant she camels. But lucky enough in year 2019 the abortions came back normal after a tremendous effort were excreted to deal with the storm outbreak of abortions.

Table 2: Abortions % from year 2014 to year 2019

Year

Total pregnant she

Total calves alive Total aborted calves

Abortion rate

2014

204

199 05

02.45%

2015

246

244 02

00.81%

2016

132

132 00

00.00%

2017

142

142 00

00.00%

2018

210

139 71

33.80%

2019

152

146 06

03.95%

ELISA Results

20 frozen serum samples were prepared and been sent to ARASCO Co. which usually do testing (customer services) in King Saud University at faculty of animal and food science (Table 3).

Table 3: ELISA results

Disease Antibodies tested

Total samples

Positive samples

Toxoplasma

20

20

Q – Fever

20

16

Chlamydia

20

04

Brucella spp

20

08

Johne’s disease

20

14

The ELISA technique was performed according to manufacturer’s procedure using CHEKIT enzyme immunoassay kits from IDEXX Laboratories Inc., USA.

PCR – Real Time Results

The following samples have been collected from 07 attended aborted she camels, which were blood sera, amniotic fluids and placenta tissue. One male preputial wash also was collected and all samples been frozen and sent aboard to a known laboratory and the following results were being received from them (Table 4).

Table 4: PCR – real time results

Disease tested

Total samples

Positive samples

Toxoplasma gondii

08

00

Coxiella burnetti

08

00

Chlamydia abortus

08

06 (05 female+01 male*)

Brucella spp

08

00

Mycobacterium ovium

08

00

*The male revealed positive in PCR and was removed from the herd permanently.

The samples for PCR real-time were prepared in cooled ice box and immediately been sent via road to Jordan University of Science and Technology, veterinary laboratory in faculty of veterinary science, (Jordan is only about 170 KMs from the farm). Results were posted via Email to the farm management in Dec 19,2018. As in Table 4, 6 samples were positive for C. abortus and all samples were negative to T. gondi, Cox burnetti, Br. Abortus and M. ovium.

Discussion

Low reproduction performance in camels is mainly ascribed to old age at first calf. Long calving intervals and limited breeding season [17]. Camels birthing rates rarely exceed 40% in nomadic herds and 70% in semi or intensive herds and neonatal mortality is huge and may reach epizootic proportions [18]. Tibary also stated that abortions in Camelus dromedarius due to infectious diseases vary from 10% to 70% and Brucellosis and Trypanosomiasis represent the major causes of infectious abortions in the Middle East and Africa (Tibary 2016). In Saudi Arabia the first record of serological evidence of camel chlamydiosis was reported by Mansour F. Hussein [6].

In this study an unexpected storm of abortions in pregnant female camels in the third trimester period of gestation occurred without any previous signs of illness neither before abortion, nor after it. As it is clear from the Table 2 it was the first time to report an outbreak of abortions (33.80%) of the total pregnant females that year aborted. The location is an intensive farming system of dromedary camels designed for milk production and have a commercial automatic milking parlor and a dairy plant. From farm records abortion rates were never exceeded 02.45% for the last five years (2014-2018). PCR – real time have detected positive cases of females and one male infected with Chlamydia abortus. ELISA results of the incident indicate presence of antibodies for five infectious diseases namely Toxoplasma, Q. Fever, Brucella spp., Johne’s disease and Chlamydia which agree with Abdelmalik study who was the first to use PCR real-time assays for detection of uterine infections indigenous camels of Saudi Arabia. Chlamydiosis, toxoplasmosis and Brucellosis were detected in this study and Abdelmalik [7].

More investigations are needed especially when there is a clear abnormal rate of abortions or reproductive failures. This study should direct the attention of owners, farm veterinarians and research centers to the importance of Chlamydia as one of serious emerging causes of abortions in Camelus dromedarius. The Elisa results indicate the presence of antibodies against Toxoplasma, Q-fever, Brucella and Johne’s disease so more care should be alert for more investigations and further studies. The intensive management care and treatments been practiced in the farm had led to stop abortions at a rate of 33.80%. In second reproduction season (2019-2020) the abortion rate was only 3.95%. From the field attendance, abortion nature, data collected and laboratory results the authors have great confidence it is a Chlamydiosis outbreak incidence and should be a corner stone in any future investigations of Camelus dromedarius abortion cases.

Conclusion

Chlamydiosis should be considered as a major emerging cause of abortions in Camelus dromedarius in Saudi Arabia, Middle East and Africa due to increased studies done recently and have proved its importance as a cause of abortions and reproductive failures in camel production. Prevention of infectious causes of reproductive losses and abortions in camelids should be based on sound biosecurity measures designed to prevent the introduction and spread of disease in population, herd or group of camelid in specific area. These measures can simplify in vaccination programs of specific diseases, pre-breeding reproductive examinations like uterine culture and cytology, males also must be tested physically and microbiologically, quarantine of recently introduced camels, breeding hygiene should be strictly observed, pre-parturient monitoring and personnel attending parturient females should be practiced to recognize any abnormalities.

References

  1. HAFEZ ESE (1980) Reproduction in Farm Animal. Fourth Edition.
  2. Saeed Basmael (1996) Modern Breeding of camel Dairy population (In Arabic) Publication of agriculture extension centre Riyadh/Saudi Arabia.
  3. Nicole Borel, Adam Polkinghorne, AndreasnPospischil (2018) A review on Chlamydial Disease in Animals: Still a challenge for pathologists. Veterinary Pathology 55: 374-390. [crossref]
  4. Sachse K, Bavoil PM, Kaltenbocck B, Stephens RS, Kuo CC, et al. (2015) Emendation of the family Chlamyiaceae: proposal of a single genus, Clamydiato include all currently recognized species. Syst Appl Microbiol 38: 99-103. [crossref]
  5. Yasser M, Abdel Rahman, Robert J Belland (2005) The chlamydial development cycle. FEMS Microbiology Reviews 29: 949-959.
  6. Mansour F, Hussein M. ALShaikh MO, Gad El EL-Rab, ALjumaah RS, et al. (2008) Journal of Aninaml and Veterinary Advances 7: 685-688.
  7. Abdelmalik I Kalafalla, Marzook M Al Eknah, Mahmoud Abdelaziz, Ibrahim M Ghoneim (2017) A study on some reproductive disorders in dromedary camel herds in Saudi Arabia with special references to uterine infections and abortion. Trop Anim Health Prod 49: 967-974. [crossref]
  8. Khalifa IAL, ALshaikh MA, ALjumaah RS, Jarelnabi A, Mansour F Hussein (2018) Journal of Animal Research 8: 335-343.
  9. Wernery U, Wernery R (1990) Seroepidemiology studies of the detection of antibodies to Brucella, Chlamydia, Leptospira, BVD/ MD virus, IBR LIBV virus and enzootic bovine leucosis virus (EBL) in dromedary mares (camelus dromdarius). Deutsche Tierarztliche Wochenschrift 97: 134-135. [crossref]
  10. Schmatz HD, Kraus H, Viertel P, Ismail, Hussein A (1978) Acta Tropica 35:101-111.
  11. Burgmeister R, Leyk W, Gossler R (1975) Cited by Hussein et al., 2008.
  12. Elzlitne R, Elhafi G (2016) Seroprevalence of Chlamydia abortus in camel in the western region of Libya. J Adv Vet Animal Res 3: 178-183.
  13. Mohamed Hocine Benaissa, Nora Mimoune, Curtis R Youngs, Rachid Kaidi, Bernard Faye (2020) First report of Chlamydophila abortus infection in dromedary camel (Camelus dromedaries) population in eastern Algeria. Comparative Immunology, Microbiology and Infectious Diseases 73:101557.
  14. Croxatto A, Rieille N, Kernif T, Bitam I, Abeby S, et al. (2014) Presence of Chlamydiales DNA in ticks and fleas suggests that ticks are carrier of Chlamydiae. Ticks Ticks Dis 5: 359-365. [crossref]
  15. Burnard D, Weaver H, Gillett A, Loader J, Flanagan C, et al. (2017) Novel Chlamydiales genotypes identified in ticks from Australian wildlife. Parasit Vectors 10: 46.
  16. Rodolakis A, Mohamad KY (2010) Zoonotic potential of Chlamydophila. Vet Microbiol 140: 382-391.
  17. Eiwishy AB (1987) Reproduction in the female dromedary (Camelus dromedaries): A review. Animal Reproduction Science 15: 273-297.
  18. Tibary A, Fite C, Anouassi A, Sghiri A (2006) Infectious causes of reproductive loss in camelids. Theriogenology 66: 633-647. [crossref]

Social and Business Problems through the Lens of Projective Iconics: Introducing a New Systematics to Understand and Quantify Perceptions of Social Issues

DOI: 10.31038/PSYJ.2021323

Abstract

We introduce a new approach to understanding the mind of people regarding the solution of social issues, an approach we title Projective Iconics. The objective is to understand the ‘mind’ of the respondent regarding the solution of a problem, using a projective technique incorporating Mind Genomics. Respondents were presented with a social problem: securing affordable access to medical help. The objective was to understand how they responded to the problem, based upon their reactions to test vignettes, combinations of names of 16 individuals. The names represented different positions of authority, personality, and behaviors. The vignettes were constructed by combining names to create a group of individuals tasked with the job of solving the issue. Each respondent rated 24 unique vignettes. Experiment 1 instructed the respondent to evaluate the likelihood that the group of individuals in a test combination could cooperate to discover a solution. The experimental design enabled the discovery between success and each of the 16 individuals, suggesting three clear mind-sets of respondents, respectively; those who believed that everyday individuals would solve the problem, those who believed that people in power would solve the problem, and those who believed that celebrity personages would solve the problem. When the dependent variable in Experiment 1 was ‘cooperate’, the segmentation into mind-sets was not as clear. Respondents in Experiment 2 estimated the likely total taxes needed to solve the problem, again select the expected taxes that the group in the vignette would levy. Three clusters emerged for responses using taxes as the dependent variables, but the clusters or mind-sets again were not as clear.

Introduction

The study of social problems is often done by what might be called ‘outside in.’ That is, the researcher wants to understand how the person undergoing the problem or situation feels, and constructs a questionnaire, or some other tool to observe behavior. The questionnaire poses a blockade between the researcher and the respondent. The researcher attempts to communicate the nature of the problem, whereas the respondent attempts both to understand the question, and to answer in the appropriate manner. The appropriate answer may be either a truly honest answer in the opinion of the respondent, or perhaps all too often an answer that is that which the researcher might wish to hear. These are so-called respondent or interview biases, better known colloquially as being ‘pc’, viz., politically correct [1-4].

The biases in such interviews are well known, causing the glibly offered remark that ‘one cannot believe what respondent say for many topics where emotion enters.’ In our increasingly polarized political and social environment biases have emerged in polling, so much so that there are difficulties in accurately stating issues without perhaps irritating some respondents. A world of emerging biases and problems might well imperil the development of social science and knowledge about the everyday, simply because people are becoming increasingly sensitized, due to the Internet in general, and social media in particular. A further factor is the ubiquitous survey, whether that be a long market research survey taking 20 minutes, or the irritating pop-up service for customer satisfaction about the transaction just completed. It seems that virtually every transaction seems to be followed by a request for information, and a subtle desire to be uprated.

With the advent of computer technology it is becoming increasingly easier to track a person’s behavior, especially on the Internet, but also where the person happens to be in terms of geography. Our cell phone has ‘location’ transponder, allowing both the offeror of services to know where we are for transactions, but also to know and to record where we are for further study, such geographical mapping of people who frequent certain stores. Such improvement in the science of measuring ‘behavior’ has also led to a different thinking. Rather than asking the respondent to give us opinions, measuring and summarizing the respondent’s behavior. It is no wonder that once we purchase something, we receive an unending set of advertisements on our cell phone to buy the same product, at specific store, located very close to where the person happens to be.

One major problem with both questionnaires and with behavioral tracking can be traced to the reality that the information is obtained by an outsider, who can be perceived to be invading a person’s private domain. When the issue is questionnaire or personal interaction, the respondent, may put up conscious or unconscious defenses, perhaps providing incorrect information. When the issue is behavior tracking, what a person does gives little information to what the person thinks in general about the topic, and certainly gives even less information about nuances of thought and feeling.

The Emerging Science of Mind Genomics May Address the Bias Problem

Mind Genomics refers to an emerging psychological science, founded on previous contributions in experimental psychology [5], mathematical psychology [6], personality psychology, specifically projective techniques such as the Rorschach Test [7], and finally using the metaphor of the MRI used in medicine [8].

The goal of Mind Genomics is to measure the values of internal ideas, internal thoughts, in a rigorous way, appropriate to the topic. The foundation of Mind Genomics comes from psychophysics the study of the relation between physical stimuli and subjective percepts. S.S. Stevens, the founding father of modern-day psychophysics suggested having the respondent act as a measuring instrument, to scale the perceived or subjective magnitude of a stimulus. These scaling methods reveal repeatable patterns describing the relation between the stimulus magnitude measured by instruments, and the subjective intensity measured by the person. Such information, generating what is called ‘Outer Psychophysics.’ In the same spirit, albeit with slightly different tools, Mind Genomics attempts to establish the parallel information, the relation between the inner idea and a subjective magnitude. This goal, called ‘Inner Psychophysics’, can be considered to the be the ‘UR story’, the foundation story for Mind Genomics. Psychophysics forms the foundation of measurement, but the story does not stop there.

The typical approach in science, psychophysics included, focus on isolating one factor or variable, occasionally two or three, and even sometimes four variables, changing the variable in a systematic way, measuring the response, and then describing the pattern. The pattern may be a change in the nature of the type of response (qualitative), or the magnitude of the response (quantitative) or both. In psychology, especially in the study of thinking and how we process the information of the everyday, the isolation of a single variable and measuring the response to systematically changed levels of that single variable is popular, but becomes problematic in the study of everyday life, i.e., in the study of the typical situations in which people find themselves. The everyday decisions, those of the ordinary life, involve the interaction of several variables. Studying one variable at time may be fine for artificial laboratory situations but is not fine for the study of common decision-making, for example voting for a political candidate, or buying a product, respectively. The research to study everyday must involve the study of combinations of variables, such combinations created according to an underlying set of procedures called an ‘experimental design’ [9]. In mathematical psychology and in subsequent applications by marketers the focus on one variable at a time has evolved to the focus on several variables simultaneously interacting [6,10]. The approach is called conjoint measurement. It is conjoint measurement which constitutes the second leg of the emerging science of Mind Genomics.

The third ‘leg’ of the Mind Genomics science can be found in the world of projective techniques [11]. The experimental design used by Mind Genomics allows the researcher to present many combinations of independent variables to the respondent, who is instructed to treat the combination as a single idea, a single proposition, and rate that entire proposition on a scale. For the study reported here, one group of respondents evaluated combinations of messages, specifically names of individuals or groups, on the likelihood that the whole group described in the test stimulus could solve a particular social problem, defined as ‘access to medical care.’ The other group were shown the same combinations of messages but instructed to rate the incremental or decremental amount of TAXES that the group would impose on the population to solve the problem.

The final, fourth leg of the research was the creation of a general picture of the mind of the consumer, done by putting together all the combinations, and creating a single equation or model showing how each of the elements drives either the likelihood of solving the problem ((Experiment #1) or how much of an increase in taxes each element would incur to solve the problem (Experiment #2I). The metaphor for this fourth leg is the MRI, magnetic resonance imaging, which takes many pictures of the underlying stimulus, pictures from different angles, and then recombines them afterwards, using a computer program to assemble them into one three-dimensional image [8].

The Two Mind Genomics Studies – Problem/Solution and Taxes

The studies reported here were occasioned by the discussions among the authors on different occasions about the need to systematize social science research, and if possible, bring to it the rigors of experimentation such as those found in experimental psychology, and especially in psychophysics. The notion was to create an integrated database, with the researcher empowered to investigate a range of ‘topics’, here ‘social issues,’ with the same tools, in a manner that might be called ‘industrial-scale research.’ Most of the research to which the authors had been introduced to, and had practiced, required meticulous attention to detail, and were studies which were complete in and of themselves, with very tenuous connections to other data collected by researchers on the same topic. The authors were aware of review papers, which attempted to pull together the diverse and divergent research efforts over many years, and by so doing create a structure by which to better understand the area. These are called review papers or the meta-analyses.

Mind Genomics provides an entirely different approach to the problem, an approach which lends itself to scalability in terms of application to many different problems, generating common data, and inspiring the research to create a ‘data warehouse.’ The governing vision in this study was to apply the Mind Genomics paradigm, explained below, to understand aspects of access to medical care, from the mind of the citizen consumer. As will be explained below, the same approach could be, and indeed was, applied to investigated 26 other social and economic problems. The current paper is just the first of a set of 27 integrated pairs of studies. of the same type.

The Mind Genomics Paradigm Explicated Using the Data Front the Two Studies

Mind Genomics studies follow a simple paradigm, making the research almost programmatic, so-called ‘cookie-cutter’ by those who feel that the acquisition of knowledge in research cannot or should be done in an industrial fashion, viz., scaled-up, rapid, efficient, and inexpensive. Although there are many researchers who frown upon ‘cookie-cutter’ research, feeling that each study must be unique as well as elegant, the value of a standardized, templated, quickly executed method should not be underestimated. The steps below, applied and executed less than 24 hours, from start to finish, provides the researcher with a rare opportunity to create a useful database which addresses many existing questions, opening new vistas by revealing hitherto unexpected patterns in the way people can be shown to ‘think’ about a topic.

Step 1 – Identify the Topic

This step identifies the problem. The actual task is harder than it may sound. We are not accustomed to thinking in terms of tight, limited scopes. The topic here is improving access to medical care at an affordable price.

The study reported here comes from a set of 27 studies on problems, all run in the same way. Table 1 shows the list of the problems, and the language used for each. The structure of analysis for this study shows what can be learned from virtually a superficial plunge into the data analysis, viz., the results which lie at the surface.

Table 1: The topics or problems originally comprising the set of issues to be investigated using this one study.

table 1

Step 2: Create Four Questions Which Tell a Story, and Four Answers to Each Question

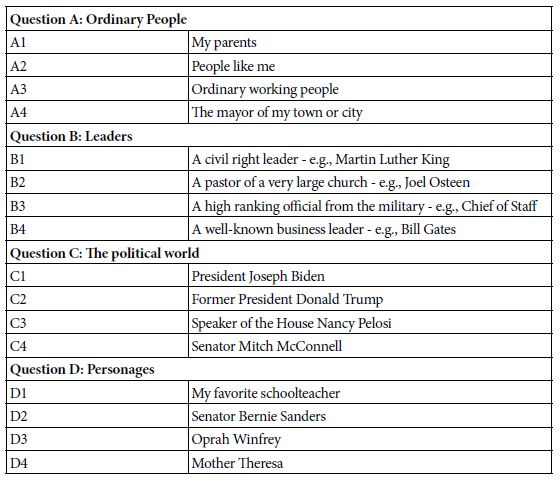
The study here on access to medical care does not lend itself easily to the question-and-answer format. Rather, the strategy is to identify four groups of authorities, these authorities being of different kinds. Each authority takes the place of a question. Each of the four specific individuals or groups takes the place of an answer. Table 2 shows the four general groups of authorities, and the four specifics for each authority.

Table 2: The raw material, comprising the four types of authorities, and the four specifics within each type.

table 2

The use of common symbols, viz., people, was done to explore the potential of moving beyond the typical research approach which often use factual descriptive phrases as elements or answers to the questions. Instead, the objective here was to use ‘cognitively-rich’ stimuli, without explanation, allowing the respondent to link these stimuli with the question. The approach here took as its origin the work relating color to feeling, and to the psychophysical method of ‘cross-modality matching,’ where the respondents adjust the perceived intensity of one continuum (e.g., the loudness of sounds) to match the perceived intensity of another continuum (e.g., the brightness of lights). That breakthrough in psychophysics, first reported in the early 1950’s, almost 70 years ago, stimulated the conjecture that perhaps one could match problems to people in a similar way [5].

Step 3: Create a Set of Combinations Using the Principles of Experimental Design

Step 3 creates combinations of the four types of elements (A1-A4, B1-B4, C1-C4, D1-D4). Experimental design was used to create 200 different sets of test vignettes. Each set of test vignettes conformed to the same experimental design, but the elements in the design were permuted, keeping the basic structure of the design, albeit with different combinations [9,12].

Each vignette comprised a specific combination of 2-4 answers or elements, with at most one answer element from a question, but often with no answers. The vignettes were thus not all complete, although the 24 systematically varied combinations comprised a complete experimental design. Each element of the 16 appeared exactly five times in the 24 combinations and was absent 19 times in the 24 combinations. The combinations were set up so that the 16 elements were statistically independent of each other.

These set-up efforts permit the researcher to analyze the data from one respondent as easily as analyze the data from 100 respondents, since at the most granular level each respondent’s data matrix can be analyzed by itself, using standard methods, such as OLS (ordinary least-squares) regression. It will be that property of each respondent’s data following its own complete experimental design which will allow the researcher to create individual-level models, and cluster or group the respondents based upon the pattern of their coefficients. The computer requires the format shown in Table 3 to apply the method of OLS (ordinary least squares) to deconstruct the ratings (or the transformed ratings, see below) into the contributions of each element.

Table 3: Example of three vignettes, combinations of elements, and their recoding into 16 independent variables. For the recoding 1=present, 0 = absent.

Combination A1 A2 A3 A4 B1 B2 B3 B4 C1 C2 C3 C4 D1 D2 D3 D3 D4
1 A1  B4 C4 D4 1 0 0 0 0 0 0 1 1 0 0 0 0 0 0 0 1
2 A1 B3 D1 1 0 0 0 0 0 1 0 0 0 0 0 1 0 0 0 0
3 A4 B4 C1 D4 0 0 0 1 0 0 0 1 1 0 0 0 0 0 0 0 1

Table 3 shows an example of three of the 24 combinations that a respondent will evaluate. The respondent sees actual combinations rather than the combinations. It is at this point that the Mind Genomics paradigm diverges from the more conventional approaches, by assigning each respondent to a different design. This approach differs dramatically from the typical methods in science, which focus on averaging out variability by evaluating the same limited set of stimuli with many respondents, until the mean becomes stable. The Mind Genomics worldview is more like that of the MRI, magnetic resonance imagery. Each experimental design becomes a snapshot. At the end of the study, the modeling combines these snapshots to produce a coherent whole incorporating all the different ‘views’ of the same underlying object being investigated. In our study that ‘object’ is the way people react.

Step 4: Create a Short Introduction to the Topic and Provide a Rating Scale

The introduction should present as little information as possible. Instead of formulating the entire situation in the introduction, the researcher should let the elements themselves, the different groups and individuals to provide the necessary information on which the respondent will assign a judgment. Table 4 shows the orientations for the two experiments, the first study dealing with the ability to cooperate and solve the problem, the second with the expected taxes. Table 4 also shows the rating scale for each study. The rating scale is how the respondent communicates her or his feelings about what has been read. The first experiment allows for five possible responses. These will be subsequent deconstructed to yield four scales, only one of which will be of interest here, the ability to solve the problem. The second experiment, focusing on taxes, uses a more traditional scale, dealing with the expected increase in taxes. There are five options here as well. The options are not in simple order, but rather presented in irregular order, forcing the respondents to give some thought to the issue. Respondents are prevented from simply using the scale as one of magnitude, where the five points are equally spaced, and in order.

Table 4: The two questions and the rating scales.

What will happen when these people work together to solve this problem: Improving access of everyone to good medical care without paying an unaffordable price
1=Cannot cooperate … and … No real solution will emerge
2=Cannot cooperate … but … Real solution will emerge
3=Honestly cannot tell
4=Can cooperate … but … No real solution will emerge
5=Can cooperate … and … Real solution will emerge
What will happen to our FEDERAL TAXES when these people work together to solve this problem: Improving access of everyone to good medical care without paying an unaffordable price
1= 19% increase in Federal Tax
2= 0% increase in Federal Tax
3= 27% increase in Federal Tax
4= 7% increase in Federal Tax
5=11% increase in Federal Tax

Step 5: Follow the Templated Process

Create combinations of vignettes according to an underlying experimental design, present these combinations to the respondents, and obtain both a rating on the appropriate scale, and record response time. Response time is the time between the appearance of the vignette and the assignment of the response by the respondent on the 1-5 scale. The template makes it possible for the researcher to set up a study with 20-30 minutes, launch the study, and have the data back with 30-60 minutes, with the results analyzed.

The important things to keep in mind while doing the experiment revolve around the shift in thinking from confirming one’s hypotheses (the hypothetico-deductive approach) to creating what might be best called a ‘cartography of the mind.’ There need not be any formal hypothesis One is simply measuring responses to variations of stimuli, to identify which variations, which features, drive the responses.

Step 6: Transform the Data

The two rating scales provide information, but the ratings must first be transformed to allow for subsequent analysis by modeling and clustering.

Scale #1, for attitude (cooperate and solve the problem) can be transformed in at least two ways. One way is to create a binary scale for solving the problem. In that case, ratings 1, 2 and 3 are converted to 0 to denote that the problem cannot be solved, whereas ratings 4 and 5 are converted to 0 to denote that the problem can be solved. A second way is to create a binary scale for cooperation. In that case the ratings are converted in a different fashion. Ratings 2 and 5 are converted to 100 to denote that the groups in the vignette can cooperate, whereas ratings 1, 3 and 4 are converted to 0 to denote that the groups in the vignette cannot cooperate to solve the problem.

Our focus in this analysis is on the ability to solve the problem, so that the first transformation is followed, with ratings 1, 2 and 3 transformed to 0, and ratings 4 and 5, in turn, transformed to 100. A small random number, < 10-4, is added to each rating, after transformation. The small random number does not affect the analysis but ensures necessary variation in the dependent variable in the situation where a respondent assigns all vignettes ratings which all end up either 0 or 100, respectively.

Rating scale #2, for tax, is transformed to the relative tax values, in percent. Thus no increase in tax would be transformed to 100, to denote 100% of current taxes. A 27% increase in tax would be transformed to 127, to denote 127% of current taxes.

The transformations provide two types of information. The first is a no (0) or a yes (100), appropriate for the ratings of the first of the two experiments. There is no sense of magnitude, just of no/yes. The second is a magnitude of the effect.

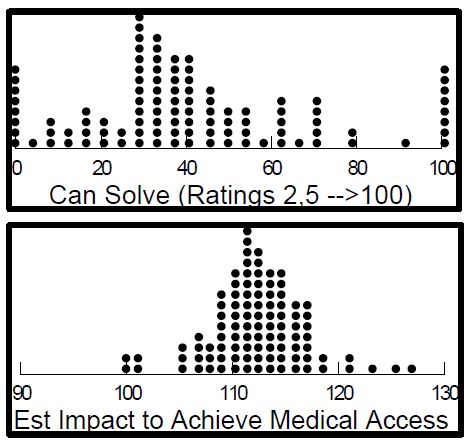
We can get a sense of the basic interest in the data by comparing averages across respondents. Figure 1 (top) shows the distribution of beliefs across the different vignettes that the access problem can be solved. Each filled circle corresponds to one of the 102 respondents. The figure is not particularly interesting. What will be more interesting will be the linkage of the solution to the individuals. In contrast, Figure 1 (bottom), far more interesting, gives a sense of the average impact on the tax expected across a variety of different individuals who would get involved in the effort to provide access. Figures of the type shown here are of basic interest because they deal with a simple quantity, taxes.

fig 1

Figure 1: Distributions of average transformed ratings. The top panel shows the averages across 102 respondents for the belief that the group can solve the problem of affordable access to medical care. The bottom panel shows the average taxes (vs current) to achieve the goal of affordable access to medical care.

Step 7: Build Equations Using OLS (Ordinary Least Squares Regression), without an Additive Constant

At both a group level, and at a respondent level, relate the presence/absence of the 16 elements to the transformed rating of able to solve the problem (study #1), or expected increase in taxes (study #2). For these studies, a single form of the OLS regression was used, one without an additive constant. The rationale for using the equation in without the additive constant is from the desire to compare coefficients across studies (solve the problem vs taxes), and to compare coefficients across transformations (solve the problem versus cooperate).

It is important to note that the pattern of coefficients is similar (high correlation) when one estimates the coefficients using an equation which has the additive constant, versus an equation which is absent the additive constant. The same patterns emerge but the magnitudes of the coefficients differ, being large for the equations lacking the additive constant.

Experiment #1 – Cooperate/Solve (ratings 4 & 5 transformed to 100): Binary Rating = k1A1 + k2A2 + k3A3…K16D4

Each coefficient shows the incremental (or decremental) proportion of responses driving the binary rating. Thus, a coefficient of +15 means that when the element is included in the vignette, 15% more of the responses are 4 or 5. High coefficients suggest strong drivers of the solution; low coefficients suggest weak drivers of the solution.

Experiment #2 – Taxes: Percent of Current Taxes = k1A1 + k2A2 + k3A3 …. K16D4

Each coefficient shows the incremental (or decremental) percent of taxes to be expected when the specific element (individual) is included in the group.

When the analysis is done at the group level, all respondents incorporated into the model, the coefficients are relatively low. For models or equations computed without the additive constant, coefficients around 16 or higher are considered ‘statistically significant’. Comparable elements in models estimated with an additive constant require a value of +8, or higher, just about half.

Table 5 suggests ranges coefficients, but few reaching statistical significance. More important, there are no clear patterns. The patterns will emerge from segmenting the respondents. For response time, only one element generates a long inspection time, A4, the mayor of my city. It is also clear that, at least for the total panel, response time does not covary with the coefficients of the elements.

Table 5: Coefficients from the experiments. The columns correspond to the dependent variables.

table 5

Table 5 also shows response times, based upon using the above models to relate the presence/absence of the 16 elements to the response time. The response time was measured along with the respondent’s rating, allowing OLS regression (without the additive constant) to relate the presence/absence of the elements to the response time. Table 5 no clear relation between coefficients for either cooperate or solve, and coefficients for response time in seconds, although the response time for older respondents was longer than the response time for younger respondents, confirming previous findings for response time versus age [13,14].

Step 8: Cluster the Respondents into a Limited Set of Groups Whose Patterns of Coefficients within a Group are Like Each Other

Clustering is a well-accepted procedure in statistics. Our 16 coefficients for each respondent give us a sense of how the respondent feels about either the ability of the individual/group to solve the problem (experiment #1), or the expected change versus current in the taxes one will incur to solve the problem (experiment #2).

The clustering method used here is called k-means clustering [15]. Clustering puts objects into a limited set of groups based upon the statistical criteria set up at the start of the study. The criteria here was to minimize the ‘distances’ within a cluster, and to maximize the distances between the centroids of the clusters, these being the centroids or average coefficient values of the 16 elements. The measure of distance, D, is defined as the quantity (1-Pearson Correlation Coefficient). The quantity D has the lowest value of 0 when the correlation coefficient is 1 (1-1 = 0), and the highest value of 2 when the correlation coefficient is -1, viz. the two patterns are exactly opposite (1- – 1 = 0).

The clustering was done three times:

a. Cluster the respondents on the basis of pattern of the 16 coefficients estimated for “solve the problem” (Experiment #1).

b. Cluster the respondents using the pattern of the 16 coefficients estimated for “cooperate together” (Experiment #1).

c. Cluster the respondents using the pattern of expected taxes for the 16 individuals (Experiment #2).

Step 9: For each Clustering, Extract Three Mind-sets Based on the Pattern of Coefficients

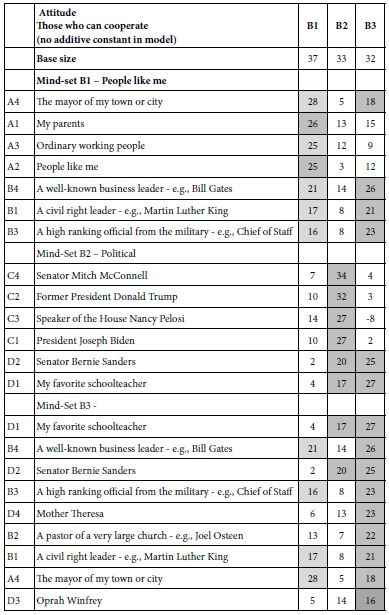
Tables 6 and 7 show the sorted coefficients from Experiment 1, attitudes. Only positive coefficients are shown, with strong performers shown in green. The cut-point for a strong performing element is a coefficient of 16 or higher, corresponding to the coefficient of +8 or higher for those models or equations estimated with an additive coefficient.

Table 6: Coefficients of the 16 elements, based upon clustering ‘who will solve the problem’ (ratings 2 and 5 transformed to 100).

table 6

Table 7: Coefficients of the 16 elements, based upon clustering ‘who will be able to collaborate to solve the problem’ (ratings 4 and 5 transformed to 100).

table 7

The clustering reveals three clearly different mind-sets emerging from clustering based on the perceived ability to solve a problem. In contrast, the three mind-sets created from the estimated ability to cooperate. The clarity of mind-sets for solving problems contrasts with the rather noisy mind-sets emerging from cooperation.

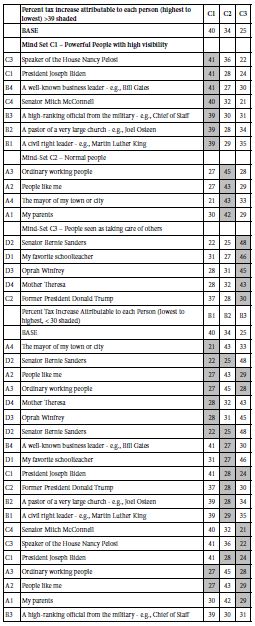
Table 8 (top) shows the expected percent of taxes attributed to each of the elements, sorted by the highest to the lowest increases. Table 8 (bottom) shows the same data, the same data, this time sorted from bottom up. The mind-sets moderately clear, but not as well defined as the mind-sets emerging from clustering ability to solve problems, but far clearer than the mind-sets emerging from clustering cooperation.

Table 8: Expected percent of taxes to be levied by each of the individuals, responding to the need to provide affordable medical care to the population

table 8

The preparation of the tables was done with the taxes themselves, assigned to each vignette, with the tax replacing the rating number. This means that one can add up the coefficients for the taxes to estimate the relative tax to be levied to solve the problem. As an example, consider mind-set C1. These respondents feel that three groups involved, C3 (Nancy Pelosi), B3 (Working with a high-ranking official from the military – e.g., Chief of Staff), and with A pastor of a very large church – e.g., Joel Osteen, would incur a relative tax of 41% +41% + 39% or 121% of current taxes.

Consider now the response of mind-set C2 to these same three individuals. The relative taxes would be 36 + 30 + 28 or 94%, viz., 94% of current taxes, a 6% tax reduction!

Finally, consider now the respondent of mind-set C3 to these same three individuals. The relative taxes would be 22% + 30% + 34% viz, 86% of current taxes, a 14% tax reduction!

Discussion

The typical approach to social problems involves questionnaires, which allow the respondent to think about the issue in a rational way. To a great degree these suffer from biases of expectation, and political correctness, where the respondent provides an answer consistent with a predetermined from of reference, or an answer that feels intuitively ‘acceptable’. People are sensitive to interviewers, and often want to know the ‘right answer’ even when the interview or survey is conducted on the web, in total privacy. The desire to get the right answer, to outguess and perhaps outfox the researcher, muddies the waters. The respondent may not be able to state at a conscious level that she or he was trying to ‘outguess’ the interwar, but such behavior is far more common than one thinks. In such cases strict controls in design and execution must be taken.

To address the issue of expectations, the development of Mind Genomics began with the presentation to the respondent what the words of Harvard’s noted psychologist, Wm James, might call a ‘blooming, buzzing confusion.’ The combinations seem to be haphazard, but they are not. Furthermore, in study after study the data appears to be meaningful and consistent, making a great deal of sense, and in the words of the research community, ‘telling a coherent story.’ The approach of using these combinations of messages.

This paper moves one step beyond the traditional Mind Genomics studies. Rather than providing simple statements of fact, the study uses names of people. The names themselves carry rich meanings to the individuals. The respondents are not asked to decide based upon intellectual factors. Rather, the respondents are asked to give their ‘gut feel’ based upon the feeling of a set of names with complex meaning. The consequence of the approach is a new way of looking at people and thinking. The objective is to move beyond conscious, purpose-driven evaluations of single ideas, and instead move towards the complexities of everyday life, where decisions are made. Only time will tell whether this incorporation of psychophysics, experimental design, personality psychology, and consumer research methods can live up to the potential of becoming a new way to measure the minds of people for topics that can be considered important parts of ordinary life.

References

  1. Alvesson M (2010) Interpreting Interviews. Sage.
  2. Berinsky AJ (2018) Telling the truth about believing the lies? Evidence for the limited prevalence of expressive survey responding. The Journal of Politics 80: 211-224.
  3. Eckman S, Koch A (2019) Interviewer involvement in sample selection shapes the relationship between response rates and d&and Lucchina, L.A., 2016. The color of emotion: A metric for implicit color associations. Food Quality and Preference 52: 203-210. [crossref]
  4. Western S (2016) Political correctness and political incorrectness: A psychoanalytic study of new authoritarians. Organisational and Social Dynamics 16: 68-84.
  5. Stevens SS (1975) Psychophysics: Introduction to its Perceptual, Neural and Social prospects. John Wiley & Sons.
  6. Luce RD, Tukey JW (1964) Simultaneous conjoint measurement: A new type of fundamental measurement. Journal of Mathematical Psychology 1: 1-27.
  7. De Vos GA, Boyer LB, Borders O (1989) Symbolic Analysis Cross-Culturally: The Rorschach Test. Univ of California Press.
  8. Chalah MA, Kauv P, Lefaucheur JP, Hodel J, Créange A, et al. (2017) Theory of mind in multiple sclerosis: a neuropsychological and MRI study. Neuroscience Letters 658: 108-113. [crossref]
  9. Box GE, Hunter WH, Hunter S (1978) Statistics for Experimenters, New York: John Wiley and Sons 664.
  10. Green PE, Krieger AM, Wind Y (2001) Thirty years of conjoint analysis: Reflections and prospects. Interfaces 31: S56-S73.
  11. Goertz G, Mahoney J (2013) Methodological Rorschach tests: Contrasting interpretations in qualitative and quantitative research. Comparative Political Studies 46: 236-251.
  12. Gofman A, Moskowitz H (2010) Isomorphic permuted experimental designs and their application in conjoint analysis. Journal of Sensory Studies 25: 127-145.
  13. Hultsch DF, MacDonald SW, Dixon RA (2002) Variability in reaction time performance of younger and older adults. The Journals of Gerontology Series B: Psychological Sciences and Social Sciences 57: 101-115. [crossref]
  14. Wason PC (1959) The processing of positive and negative information. Quarterly Journal of Experimental Psychology 11: 92-107.
  15. Dubes R, Jain AK (1979) Validity studies in clustering methodologies. Pattern Recognition 11: 235-254.

COVID-19 and its Impact for Pregnant Women: A Review

DOI: 10.31038/IGOJ.2021422

Abstract

Considering the medical, economic and social importance of the COVID-19 disease in the world, where it is present as indigenous or imported, we have as objectives in this manuscript to contribute to the knowledge of the impact on this viral disease on pregnant women.

Keywords

Coronavirus, COVID-19, SARS Coronavirus 2, SARS-Co2, Pregnancy, Obstetrics, Gynecology

Introduction

COVID-19 is a viral disease whose causative agent was identified in Wuhan-China, as a novel coronavirus, Severe Acute Respiratory Syndrome Coronavirus2 (SARS-CoV-2) [1]. After, 15 April 2020, COVID-19 has caused more than two million confirmed cases and more than 128,000 deaths globally, including 82,295 confirmed cases and 3,342 deaths in China [2]. The Chinese government has locked Wuhan city, since 23 January 2020, and implemented a series of social distancing measures such as: strict traffic restrictions, prohibition of social gatherings; and closure of residential communities [3]. In [4] the authors have referred to “the epidemiological data in China that have shown that most cases had mild symptoms, with an overall case fatality rate of 2,3%. Although, SARS-CoV-2 appears to be less virulent than 2 previous zoonotic coronavirus, SARS-CoV and Middle East Respiratory Syndrome Coronavirus (MERS-CoV), it is far more efficient in transmitting between people in close contact”.

In pregnant women, this novel coronavirus has caused severe complications and both SARS-CoV and MERS-CoV have been found in pregnant women [5,6].

Vertical transmission of this virus has been suspected by several scientists [7], referred to three documented cases of vertical SARS-Co-V2 infection, that were accompanied by a strong inflammatory response. Together, this data supports the hypothesis that in utero SARS-Co-V2 vertical transmission while low is possible.

In [8], we have, in our opinion, a good description of the principal symptoms of Coronavirus-19 in humans, and very accessible for scientist and public in general. In that publication, we found the following information: People with COVID-19 have had a wide range of symptoms reported, ranging from mild symptoms to severe illness. Symptoms may appear 2-14 days after exposure to the virus. People with the following symptoms may have COVID-19:

Fever or chills; Cough; Shortness of breath or difficult breathing; Fatigue; Muscle or body aches; Headache; New loss of taste or small; Sore throat; Congestion or runny nose; Nausea or vomiting and Diarrhoea.

In this publication is observed that “the list does not include all possible symptoms. CDC will continue to update this list as we learn more about COVID-19.”

Concerning risk for COVID-19 disease, are mentioned: old persons; with chronic diseases: heart diseases, pulmonary, neoplasia or arterial hypertension, Other people cited are with the immunological system compromised undergoing chemotherapy, for auto-immunes diseases (rheumatoid arthritis, lupus, multiple sclerosis, or some inflammatory intestinal diseases), human immunodeficiency virus syndrome, or patients with transplants.

Concerning transmission, the authors in [8], have informed that: the data sources were “eligible studies published until May 28, 2020, were retrieved from PubMed, EMBASE, medRxiv, and bioRxiv”. These authors have concluded: “vertical transmission of severe acute respiratory syndrome corona virus 2 is possible and seems to occur in a minority of cases of maternal corona virus disease 2019 infection in the third trimester. The rates of infection are similar to those of other pathogens that cause congenital infections. However, given the paucity of early trimester data, the assessment has yet been made regarding the rates of vertical transmission in early pregnancy and potential risk for consequent fetal morbidity and mortality”.

In [9] the authors have presented “An Analysis of 38 Pregnant Women with COVID-19. Their Newborn Infants, and Maternal- Fetal Transmission of SARS-CoV-2: Maternal Coronavirus Infections and Pregnancy Outcomes 4”. In their manuscript, they have reviewed the effects of two previous coronavirus infections – Severe Acute Respiratory Syndrome (SARS) caused by SARS-CoV and Middle East Respiratory Syndrome (MERS) caused by MERS-CoV – on pregnancy outcomes. On the other hand “analyses were made of the literature describing 38 pregnant women with COVID-19 and their newborns in China to assess the effects of SARS-CoV-2 on the mothers and infants including clinical, laboratory and virological data, and the transmissibility of the virus from mother to fetus. This analysis reveals that unlike coronavirus infections of pregnant women caused by SARS and MERS, in these 38 pregnant women COVID-19 did not lead to maternal deaths. Importantly, and similar to pregnancies with SARS and MERS, there were no confirmed cases of intrauterine transmission of SARS-CoV-2 from mothers with COVID-19 to their fetuses. All neonatal specimens tested, including in some cases placentas, were negative by rt-PCR for SARS-CoV-2. At this point in the global pandemic of COVID-19 infection there is no evidence that SARS [1] CoV-2 undergoes intrauterine or transplacental transmission from infected pregnant women to their fetuses. Analysis of additional cases is necessary to determine if this remains true.”

In [10] The authors have referred: (i) that the disease caused by SARS-CoV-2 was named COVID-19 by WHO and has so far killed more people than SARS and MERS; (ii) in January 2020, the World Health Organization declared COVID-19 a pandemic disease, considering, the widespread global outbreak of COVID-19, with more than 132,758 confirmed cases and 4,955 deaths worldwide; (iii) “Research on both SARS-CoV and MERS-CoV, which are pathologically similar to SARS-CoV-2, has shown that being infected with these viruses during pregnancy increases the risk of maternal death, stillbirth, intrauterine growth retardation and, preterm delivery”; (iv) ”With the exponential increase in cases of COVID-19 throughout the world, there is a need to understand the effects of SARS-CoV-2 on the health of pregnant women, through extrapolation of earlier studies that have been conducted on pregnant women infected with SARS-CoV, and MERS-CoV. There is an urgent need to understand the chance of vertical transmission of SARS-CoV-2 from mother to fetus and the possibility of the virus crossing the placental barrier.”

In [11] the authors have referred to the fact that it was their intention “to review published studies related to the association of severe acute respiratory syndrome coronavirus 2 (SARS-Co.2) infections with pregnancy, fetal, and neonatal outcomes during coronavirus disease 2019 (COVID-19) pandemic in a systematic manner.” In the methods the authors have indicated that “A comprehensive electronic search was done through PubMed, Scopus, Medline, Cochrane database, and Google Scholar from December 01, 2019, to May 22, 2020, along with the reference list of all included studies. All cohort studies that reported on outcomes of COVID-19 during pregnancy were included. Qualitative assessment of included studies was performed using the Newcastle-Ottawa scale” [12].

The authors have screened 513 titles, and included 22 studies, which identified 156 pregnant women with COVID-19 and 108 neonatal outcomes, and they have concluded that “COVID-19 infection in pregnancy leads to increased risk in pregnancy complications such as preterm birth, PPROM, and may possibly lead to maternal death in rare cases.”

Conclusion

  1. We think that it was here demonstrated that COVID-19, has an impact on the health of pregnant women.
  2. We hope that with the attention that is being given to this viral disease is possible, in a short/medium time, to obtain more knowledge, concerning the virus, the treatment and the vaccines, so that with this knowledge is possible a control of all viral variants circulating in the world.
  3. To combat COVID-19, it is necessary:
  • to have persons specialized for the different types of combat;
  • the collaboration between countries at world level;
  • the collaboration of the person, in general, for the execution of the rules stablished by health services of their countries;
  • the collaboration between different governmental services;
  • the collaboration between different community services such as town halls and, hospitals.

References

  1. Archived: WHO Timeline – COVID-19, 27 April 2020 – who.int
  2. World Health Organization. Novel coronavirus – China. Geneva, Switzerland: Word Health Organization httpps.//www.who.int/csr/don/12-january-2020-novel-coronavirus-china/en/. [2020-01-12]
  3. COVID-19 – Global Health, COVID-19: What you need to know about the coronavirus pandemic in 15 April. weform.org
  4. Wuham lockdown: a year of Chinas fight against the COVID pandemic – 22 January, Corona virus pandemic bbc.com
  5. World Health Organization. The epidemiological characteristics of an outbreak of 2019 novel coronavirus disease (COVID-19)- China 2020.
  6. Y Liu, H Chen, K Tang, Y Guo (2020) Clinical manifestations and outcome of SARS-CoV-2 infection during pregnancy. The journal of Infection. [crossref]
  7. Tseng J-Y (2020) Potential implications of SARS-CoV-2 on pregnancy. Taiwan J Obstet Gynecol 59: 464-465. [crossref]
  8. Feuzina C, Biasin M, Catin I, Vergani P, Milet D, Spinilio A, Gismondo M, et al. Analysis of SARS-CoV-2 vertical transmission during pregnancy. Nature Communications 11: 5128. [crossref]
  9. Kotlyar A, Grechukona O, Chen A, Shota P, Grimshaw A, et al. (2021) Vertical transmission of corona virus disease 2019: a systematic review and meta-analysis. Am J Obstet Gynecol 224: 35-53.e3. [crossref]
  10. Schwartz DA (2020) An Analysis of 38 Pregnant Women with COVID-19, Their Newborn Infants, and Maternal-Fetal Transmission of SARS-CoV-2: Maternal Coronavirus Infections and Pregnancy Outcomes. Arch Pathol Lab Med 144: 799-805. [crossref]
  11. Fathi M, Vakili K, Deravi N, Yaghoobpoor S, Ahsan E, et al. (2020) Coronavirus diseases and pregnancy: COVID-19, SARS, and MERS. Przegl Epidemiol 74: 276-289. [crossref]
  12. Hubba Akhtar, Chandni Patel, Eyad Abuelgasim, Amer Harky (2020) COVID-19 (SARS-CoV-2) Infection in Pregnancy: A Systematic Review. Gynecol Obstet Invest 85: 295-306. [crossref]

Experiences of Self-Reported Bullying in Minority Nurses within Acute Care Hospital Workplace Settings – A Grounded Theory Approach

DOI: 10.31038/IJNM.2021214

Abstract

Background: Thirty-five percent of all the known workforce in the United States, across all genders, races, and ethnicities are bullied at work. According to the Workplace Bullying Institute (2017) racial/ethnic minorities in the general population are bullied at a higher rate. By estimating that these trends would continue and remain applicable, racial/Ethnic minority female nurses, as a significant subset of nurses, maybe bullied at a higher rate than Caucasian counterparts. While nurses in the United States (US) who are studied in the health workplace are largely women, female minority wellbeing in the workforce is especially understudied primarily because minority nurses are subsumed in aggregate data that represents predominantly white women. There has been a longstanding goal to increase numbers of minority nurses in all areas of nursing practice but in particular in acute care to advance trust and confidence in quality of care with diverse communities served. The need for minority nurses and wanting to understand the experiences that would draw and keep them in the nurse workforce is a significant area in need of study.

Objective: The objective of this study was to give “voice” to the experience of minority nurses who self-identified as being bullied at work in acute care settings by understanding their experience. Two key areas of exploration were 1) understanding what is experienced and 2) using these data to create an explanatory model that could guide nursing organizations to create a welcoming environment for employment and success of minority nurses.

Design: Face-to-Face semi-structured recorded interviews and survey data including participant demographics and characteristics of professional life and range of support systems in each participant’s personal and professional life.

Setting area hospital(s): The study of nurses currently or formerly employed at Boston, Massachusetts area hospital was conducted at neutral locations outside of the workplace.

Participants: Purposive, typical sampling. Eighteen female minority nurses who work in acute care facilities in the Boston, MA area.

Methods: This study used a constructivist grounded theory method to examine the experiences of self-reported bullying of female racial/ethnic minority nurses in the acute care/hospital workplace.

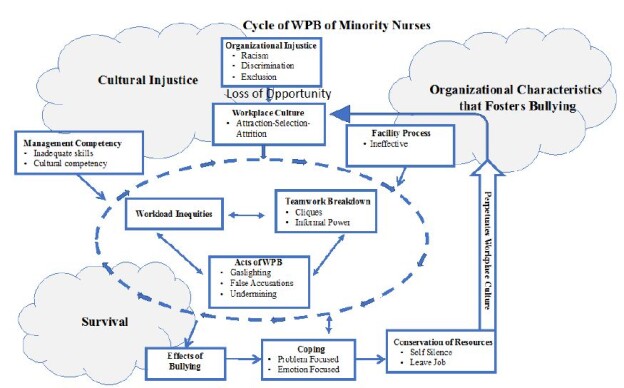
Results: It was found that organizational racism and discrimination foster an environment where WPB against minorities can flourish. The workplace culture and facility processes appear not to mitigate these circumstances. These mechanisms serve to maintain the status quo and allows those with both formal and informal power to maintain control.

Conclusion: Minority female nurses who are subjected to bullying are forced to conserve their personal resources. They respond by becoming silent about their work conditions or by leaving the job. The consequences of this disengagement by a vital portion of the workforce negatively affects the individuals, the organization, and society.

Keywords

Minority nurses, Workplace bullying acute care workplace culture, Constructivist Grounded

Theory

What is Known About This Topic

. Workplace bullying is a burden on the individual, workplace, healthcare system, and economy

. Minorities are bullied at higher rates than others

What This Paper Adds

. Detailed account of the bullied experience of minority female nurses in the workplace

. A theory of the organizational mechanisms that support and perpetuate workplace bullying of minority female nurses.

The full account of this study resides in the University of Massachusetts Boston Doctoral Dissertation Library.

Introduction

Workplace Bullying (WPB) is intentional abusive behavior that is systematic and repeated to intimidate or control a person, therefore, making them a target [1]. This abusive behavior negatively impacts the individual and the workplace [2]. Bullying involves an imbalance of power, which can be actual or perceived between the target and the perpetrator [3]. Bullying behaviors can manifest as either overt acts such as demeaning in public or covert acts such as undermining. Grimes [4] notes that aggressive, abusive behavior leads to negative impacts on physical health and psychological safety, adversely contributing to poor patient care and medication errors.

The Workplace Bullying Institute conducted a study in 2010 and found that 35% of the workforce across all genders, races, and ethnicities reported experiencing bullying while at work. Within nursing, studies report a wide range of prevalence of 31% to 85%. While bullying can occur anywhere in the nursing field, a study conducted by Vessey and colleagues [5] found that it occurred more often in Acute Care Medical-Surgical areas (23%). The Workplace Bullying Institute found that minority groups are affected by bullying more than other groups and further reported that 39% of Hispanics, 43% of African Americans, 51% of Asians, and 36% of Caucasians are bullied (WBI, 2017). The same study reported that females (66%) were affected by bullying more than males (34%). The sample included 1008 individuals African Americans: 120; Hispanics: 130; Asian: 30; White: 681. Women made up 58% of the WPB targets and; Males 42%. Minorities currently make up 19.2% of the nursing population (American Association of Colleges of Nursing, 2020) [6]. The impact of WPB reaches all levels of society. At an individual level, the target experiences escalating stress levels manifesting into physiological and psychological disorders [7,8]. The effect of individual bullying also reaches the workgroup because the target’s ability to optimize the work unit’s contributions is impaired. For the organization, if bullying becomes embedded into the organization’s culture and multiple departments within an organization are affected, the lack of psychological safety caused by WPB prevents the organization from providing optimal care to all patients under their care. The impact of WBP affects healthcare costs. For example, the exact cost of WPB in the United States is unknown; however, in England, the estimated cost of workplace bullying is estimated to be around $3 billion/year [9]. In 2017 the United States spent 17.9% of the total Gross Domestic Product ($3.5 trillion or $10,739 per person) on healthcare. Being mistreated at work lead to a 42% increase in missed workdays in a sample size of 13,807 employees [10] calculated this to be around $4.1 billion. A prominent factor in healthcare costs is health disparities [11]. Since it is conjectured that WPB disproportionally affects minorities and nurses, the phenomenon of WPB becomes a barrier to recruitment and retention to address the factors that lead to health disparities. Retention and recruitment suffer, which may contribute to Hospital turnover, which is on the rise, currently standing at 19.1% [12]. Themes emerge from a review of the literature specific to bullying of minority nurses. First, minorities get bullied in the workplace at higher rates than others. Second, race/ethnicity is a stressor and agonist for WPB [13-15], and third institutional racism permeated the workplace. Workplace characteristics and ethnicity were predictive factors for bullying because it signaled to the workers that the prevailing culture is the dominant culture [14,16]. As a result, minority groups lived in fear of ongoing attacks and or anticipating attacks [17]. There was fear of retaliation. The theory of social identity suggests that minority groups are likely to be targets of bullying due to differences in appearance, communication style, and assimilation into the popular culture [18,19].

Nurses belonging to multiple minority groups experience bullying more than those nurses who only fall into one category of the racial-ethnic minority. Female minorities face challenges not necessarily faced to the same degree as male minorities.

Two questions emerged from gaps in knowledge from the literature:

1) What are the experiences of racial/ethnic minority nurses with workplace bullying? 2) What are the antecedents and consequences of WPB on racial/ethnic minority nurses? A constructivist grounded theory methodology aided in answering these questions.

Method

Constructivist Grounded theory is a qualitative research methodology that seeks to understand a social process where no adequate prior theory exists. It uses an inductive approach to generate a new theory. The theory culminates ideas and constructs operationalized by social structures and processes [20]. Constructivist grounded theory is a useful method to examine individual experiences with workplace bullying to uncover themes to explain and delineate the participants’ experiences.

Participants

The Purposive (typical) sampling technique enabled the recruitment of racial/ethnic female minority nurses who worked in acute care hospitals in a metropolitan city on the east coast of the U.S. (within the last year). Recruitment occurred through word of mouth and posting of recruitment flyers on sites like LinkedIn and Facebook. Nurses were eligible if they met the above criteria and which included: spoke and read English at a 10th-grade level; phone access; employed in an acute care hospital in the Metro Boston area either full or part-time; were aged 21 years or greater; identified as a racial/ethnic minority by definition; had access to a primary care provider. Excluded were those who presented with cognitive impairment, any bullying experience over two years ago, vulnerable populations, males (including minority male), and Caucasian females (see Table 1 Sample and Demographics).

Ethical Review

The study procedure included obtaining Investigation Review Board approval at the University of Massachusetts Boston.

Procedure

Communication with participants first involved the establishment of eligibility and willingness to participate. Next was a review of WPB’s definition and the determination of self-reported racial/ethnic minorities. If eligible, they filled out a written consent, demographics, and other participant information utilizing Qualtrics. A 60–90-minute interview was then scheduled and accomplished by the primary researcher in a suitable location. The interview was audio-recorded and transcribed into a sanitized written transcript. At the completion, they received a $25 gift card funded through the primary researcher’s resources. No outside funding sources contributed to this research. The final communication with participants involved a written brief of the study findings with an offer to discuss the study findings via a phone call. Throughout the study, a reflexivity journal was essential, considering the nature of the content discussed. With the negative emotion often generated, it was necessary to reflect on the researcher’s objectivity. Analysis of the memo log and entries were consistent with the process applied during coding. Memos allowed an overall perspective and guided the putting together concepts and linkages from the data. Memos were crucial to developing the subthemes, hypothesis, themes, and the theory that resulted.

Data Analysis

The data analysis process consisted of coding, comparing, memo writing, sampling, and theory production [21]. The process of coding involved an iterative process of initial coding and focused coding. During the initial open coding stage, the primary researcher reviewed data word by word and line by line. Probing questions guided the understanding of what was emerging from the data. These questions guided modifications to future interviews and coding. Two such examples center on the extreme negativity of the WPB experiences of the participants. One was the need to establish neutral, open coded terms where possible. Another example was to ask the participants if anything good came out of their experience. Research team members reviewed and discussed the coding throughout the coding and analysis process. For this study, a priori sample size initially was set at twenty interviews. Theoretical saturation was determined when three consecutive interviews gave no new concepts. Sampling continued to the point of terminal saturation. The sample size was adjusted [22] to eighteen after no new concepts emerged after the tenth interview. Data saturation was proved with no new concepts emerging after ten interviews however since eighteen interviews were completed at this time all data was included for analysis. An increase from 245 open codes after ten interviews yielded 13 initial axial coded groups or categories. There were no new axial coded groups or categories when increased to 395 open codes after 18 interviews. The categories were adjusted a couple of times, but there were no new meanings encountered. The constant comparison method [19] compared data with data, data with codes, and codes with data. The initial codes were open for modifications, but at the end of this stage, codes that are most frequent and or significant are identified, leading to focused coding where a review of the larger data segments took place. The data formulated into temporary conceptual positions with the application of the framework of axial associations. Data analysis software (NVivo 12) served as the base reservoir of the transcribed data, and Microsoft Excel was the vehicle for the data sorts. Theoretical coding involved analyzing the memos [23] to connect different categories and codes. The constant comparison method aided by the memos’ resulted in a final re-sorting and realignment of the concepts. Eleven final categories emerged, making up three major themes and three transitional or linking categories. Hypothesis aided in understanding the relationship between categories. From this process, the themes and theories were developed and solidified.

Findings

This study consisted of eighteen participants. Table 1. Presents the Demographic data. Participants included seven African/American; five Hispanic American; three Asian American; one Native American, and two identified as “other.” The participants represented a span of work experience. More than half of the participants were married or in committed relationships.

Table 1: Demographics

Gender

Number

Percent Range

Mean

Female

18

100

Race
African American

7

39

Asian/Asian American

3

17

Hispanic/Hispanic American

5

28

Native American

1

6

Other (English as a Second Language)

2

11

Marital Status
Married

13

72

Widowed

3

17

Single

2

11

Age
20-29

0

0

30-39

3

17

40-49

8

44 25-65

47.3

50-59

4

22

60-69

3

17

Educational Level
Doctoral

2

11

Masters

5

28

Bachelor

10

56

Associate

1

6

Diploma

0

0

Employment Status
Full Time

18

100

Part Time

0

0

Practice Area
Med/Surg

5

28

ICU

1

6

Prenatal

1

6

Other

11

61

Position Held
Staff

10

56

NP

1

6

Supervisor

0

0

Administer

6

33

Other

1

6

Employment Years
1-3 Years

3

17

4-6 Years

1

6

7-9 Years

1

6

10-12 Years

2

11

>12 Years

11

61

Static/Float Role
Static

16

89

Float

2

11

Characteristics of the participants related to their professional life and the range of support systems in each participant’s personal and professional life are in Table 2. The personal support system includes four types of supportive behaviors: emotional (expressions of empathy, love, trust, caring), instrumental (tangible aide), informational (advice, suggestions, and information), and appraisal (assists with self-appraisal) [24]. Seventeen participants reported receiving personal emotional support, with 13 (72.2%) listed as very supportive, while only 3 of 18 (16.7%) received very supportive professional help. None reported personal nonsupport. Six out of 18 (33.3%) did list professional support as unsupportive.

Table 2: Support Systems

Support Type

Number

Percent

Emotional

17

94

Instrumental

9

50

Informational

14

78

Appraisal

10

56

Personal Support Rating
Very Supportive

13

72

Somewhat Supportive

5

28

Neither Supportive now Unsupportive

0

0

Somewhat Unsupportive

0

0

Very Unsupportive

0

0

Professional Support Rating
Very Supportive

3

17

Somewhat Supportive

7

39

Neither Supportive nor Unsupportive

2

11

Somewhat Unsupportive

3

17

Very Unsupportive

3

17

A rich database from the interviews yielded the following results. Table 3 revealing participant’s reflection of what the experience meant to them and how they dealt with the effects of WPB. The selected samples of direct quotes from participants have been organized around three themes with the categories as links, merging to form a theory.

Table 3: Data Analysis

Themes GROUPS Axial Association
Organizational Injustice Racism A, B
Discrimination
Exclusion
Transition Opportunity C
Organizational Stability that Fosters WPB Facility Process C, D
Workplace Culture
Management Competency
Transition WPB Acts A
Survival Effects of WPB E, F
Coping
Transition Back to Organizational Stability Silence F
Phenomena that relates to the actions and interactions of WPB A
Causal conditions that resulted in the occurrence of WPB B
Attributes of the context of the WPB C
Intervening conditions that influence WPB D
Actions and interactional strategies participants used to cope with WPB E
Consequences of actions and interactions F

Organizational Injustice

First is the theme of organizational injustice, defined as instances of employees perceiving organizational actions, policies, decisions, or messaging to be unjust or unfair [25]. These are instances where employees perceived that they were mistreated compared to other employees, including actions that stemmed from feelings of superiority, inequality, or racism. The theme of organizational injustice includes three subthemes of racism, discrimination, and exclusion. Examples from the data representing these three subthemes follow.

Racism: A participant described a coworker whose actions conveyed aggression and hostility based on the participant’s race. The coworker’s actions conveyed racism. A participant noted:

“Comments would be made about anybody that’s of African American race; that they were dumdums and slow. Whenever there is African American or black nurses or nursing assistants in the classroom, she would say they will never get it; they are not going to get it. Those people are always slow. She said black people are known to be slow. She said those very words.”

Discrimination: A participant observed selection for positions based on race:

Right. So, the group of people that are getting these positions, and that can exercise this power. They are all white, But if it is a white person, then things get a little bit smoother, so you know what is going to happen based on the color of the nurse.”

Exclusion: The race or ethnicity-based discrimination and exclusion experienced by these participants is ubiquitous and ongoing. When individuals work for organizations that exhibit organizational racism, they can feel isolated or excluded from cooperation, social, training, or advancement opportunities.

Another participant started with a classic example of suppression of opportunity when directed not to present a project she had completed for her work unit:

“My assistant manager even did not want to allow me to present it. Wow, who is now still there? So, after the meeting, she said, ‘Oh, who wants to hear what N4 has to say.’ She was reluctant to allow me to present.”

The three subthemes are deeply interconnected, as organizational racism can be the root cause of both discrimination and exclusion. These data revealed the possibility that discrimination may occur throughout the organization during employee hiring, salary negotiations, training opportunities, and consideration for advancement. Discriminating against individuals in a minority group results in their exclusion from opportunities. The exclusion occurs via a deliberate “control of opportunity,” leading to the second theme maintaining the status quo.

Organizational Characteristics that Foster Bullying

The second theme relates to organizational characteristics and processes that foster bullying of female minority employees. There are three subsections of the facility process, workplace culture, and management competency. Many participants discussed the lack of resources to help with the experience of WPB. These resources include collective bargaining (union activities) and other employee assistance entities and the lack of management ability to understand and mitigate the situation. The notable facility factors highlighted to be inadequate included ineffective advice or assistance by employee assistance entities.

Regarding the effectiveness of the Union and other facility entities, a participant said:

“They implemented a couple of years ago, maybe last year,… a website… an anonymous website that you could go in. You do not have to go to your manager because we figured that the manager does not help, and H.R. does not help, and the Union does not help”.

When facility processes fail to result in productive actions, participants report it being a barrier to reporting problems. A participant illustrated how limitations in time constraints are a barrier to reporting issues:

Because EEO, at this hospital, you have to file a case within 21 days. It seems to me everywhere it is more than a few months. My lawyer had to write them, and they should excuse the time limit. Anyway, the system they have in place is rigged.”

Next is the workplace culture, which exists within the context of racism, discrimination, and exclusion. Workplace culture includes the subcomponents of teamwork, workload inequities, cliques, and informal power.

A participant stated that some managers found bullying to be humorous and were unable to take behavior issues seriously:

“There was another scrub he did not like because he had an accent. They had a physical fight. This is the culture I was in. When the manager came in, she was smiling, not taking it too seriously. It was fun for them.”

A participant demonstrated the normalization of bullying in the workplace:

“She got away with it because nobody was reporting it. I guess that was a cultural norm from what I heard, and that is how they always are. So, it was like cultural acceptance, a cultural norm”.

In the workplace, the objective of teamwork is to support the outcome of the work product. Cliques in a workplace, however, are formed to meet the individual needs of the workers. Participants in this study frequently spoke of race/ethnic-based cliques, which develop out of the need to improve a sense of control or power over their environment.

A participant described a clique at a granular level and how it impacts teamwork and team reliance.

“So you just get those other black nurses to help you. I remember days like; you come in ‘oh my God, I hope there’s somebody that looks like me. I hope there’s another black person here.’ And that’s what we are always saying under our breath.”

Workplace culture comprised accepted and repeated behaviors because they served some function that maintains the existing structure, even if those behaviors are detrimental to some people. Considering the workplace culture, its influence in perpetuating WPB is evident. Inasmuch, it is essential to look at the processes within the healthcare institution’s culture and structure, including management, leadership, and limitations of opportunities for participants. Informal power emerged as a critical component of workplace culture. Informal power is that which results from relationships that develop in the workplace. Informal power is obtained from relationships that employees build with each other and may come from additional influences such as intimidation, fear, and self-entitlement [26]. When a group of lower power individuals is combined with one of higher power the outcome of work teams suffers. The group begins to feel vulnerable and becomes aware of the power inequity raising intra-team power sensitivity. Resource threats in the group such as assignments, workload, unequal application of tardiness rules, and external resource threats such as budget cuts and layoffs bring forward intra-team struggles. This dysfunction results in adverse outcomes for team performance, organizational efficiency, and patient care [26].

Employees with no formal authority were able to wield influence over other employees supported informally by the workplace. Participant said:

I did have a coworker like that. It was kind of interesting because she was a friend with a couple of managers. And she would talk about how, ‘Oh, I’ll just see her tonight. I’ll talk to her later, regarding….’ She would always give you the impression that they were going out for drinks after work.”

The third of the three subthemes is management competency. Many participants do not directly challenge management’s competency; however, analysis of remarks points to this as a factor in their WPB experiences. Managers are responsible for the work environment that optimizes the quantity and quality of work accomplished [27]. The failure to create this environment can negatively impact the employees’ well-being and health and the work output. The loss of credibility of the manager based on their actions is an example of this. One participant stated:

“Earlier on, there had been a case where people had been stealing time, and it came to fruition with the awareness of Central Office. And they did an investigation that they charged that manager and her assistant with manipulation and stealing of time.”

Evidence that management is unwilling or incapable of acting appropriately or doing the right thing is the source of participants feeling disheartened and discouraged. A participant said:

“I tried to inform the Chief Nurse. That is when I realized that she might be part of it. Because nothing was ever done. I went to her when it happened. And then it was like what I told her, somehow was worked into my [doing the] bullying”.

Specific to race, ethnicity, and management cultural competency, Participant illustrated a management deficit: “So, I think it was a lack of understanding of me as an individual and a lack of respect of me as an individual.”

Some participants reported experiencing instances of their managers “gaslighting” them. The term “gaslighting” refers to one individual’s ability to erode the sense of another’s reality (Arabi, 2019). One participant spoke of staff that got together to come up with a typical story regarding a conflict at work:

“The manager says, ‘I need to hear from his side.’ And then the surgeon and other nurses got together and wrote me up. So, that is not the first time the surgeon demanded, and they all agreed. So, they said they all kind of coordinated. And the manager was very happy to get them on her side.”

An essential part of “gaslighting” and worthy of separate mention is false accusations. These set the stage for building a manufactured narrative about a target of WPB. A participant addressed this when accused by a supervisor of keeping a personal logbook about people’s activities in her office:

You can call the police right now and have them search like there’s nothing there. It’s not true. Then I found out from another colleague that everybody had been asked about their interactions with me. So, I was asked to leave, and I was told there’s a GYN position, right, you can take. And the irony of it was at the beginning of that same meeting; I was accused of refusing to see female patients.”

Survival

Last is the theme of Survival, which includes two subthemes: Effects of Workplace Bullying and Survival. Effects of workplace bullying describe the lived experience of female minority nurses regarding the reported WPB effects and serve as a validation that participants‘ descriptions of their experience correlate well with existing literature regarding the effects of WPB. Fifteen of eighteen participants interviewed for this study reported suffering from anxiety and stress. A participant said,

“I think… at first it was just…it started as nervousness and a little bit of anxiety of like, ‘Oh, I have to be perfect and like do everything right.” Another participant explained:

I kept records, and when I went to report it initially to the Director with the first incident, and he asked me if I wanted to go back to my department. And I said ‘no,’ because I couldn’t even walk down that hallway without getting a dry mouth and having my heart race.”

Another consequence of WPB is the effect of dehumanizing the victim. This aspect is often associated directly with the person’s ethnic or racial minority status. A participant experienced the following where a coworker deliberately referred to her by the wrong name:

“I will tell you what happened one day, the same surgeon that I told you who physically grabbed me…called me Natasha. He would call me Mila one day and Natasha, making fun of me and making jokes about my accent. And one day, I will never forget, he went around and said, ‘Look Mila’ and I said, ‘I am Natasha.’ So, I tried to make some jokes to get through this, but you get fed up with this.”

A Native American participant revealed that the impact of workplace bullying was demoralizing and dehumanizing:

“I remember going to the ‘bed meetings,’ and my counterparts would make the whooping noise to make jokes about Native Americans, and I just ignored them. And I didn’t realize that they were in the process of demoralizing and dehumanizing me.”

The effects discussed above demonstrate that these participants went through matches the effects and consequences of WPB, as reported in the literature. What is more, these events show context for their overall experience and why they had to attempt to cope with their lives and livelihoods.

Survival includes examples of coping. A significant finding of the study was that when minority female nurses are in workplaces where bullying routinely occurs, they can reach a point where they acknowledge that the bullying is unlikely to stop or change, regardless of their actions. Every participant had statements coded that related to coping. The interview results related to coping included emotion-focused coping, referring to the regulation of emotions generated by bullying events like anger or frustration, and problem-focused coping, referring to an effort to solve or mitigate the problem or avoid the problem in the future. It was clear from the following results that problem-focused coping far outweighed emotion-focused coping.

For one participant, the emotion-focused response was to cry, which represents a release of sad, frustrated, or otherwise negative emotions,

“And then after that, I start to cry because it’s, you know, bullying and bullying, bullying, I think that crying is the best thing. But I cry so heavily, you know, I felt like, how am I going to work tonight?”.

Prayer and other spiritual guidance aspects are the most frequently cited example in the emotion-focused coping category. Prayer is well established in human history as a mitigation strategy for stressful situations, and this continues into these examples from bullied minority female nurses in the workplace. A participant described using prayer and faith to get through the day: “Praying works for me all the time. So, it’s the prayer that’s kept me at work up to today. It works for me. I tell you 100% yes to that. And that’s what gets me through.

The consistent exposure to the WPB experience and lack of assistance from any external source left the participants working out how to survive their receiving treatment. Having no control over external factors, they turned to an internal factor they could control: to go silent about the treatment and or leave their position.

Problem-focused coping was concentrated on the strategy of silencing-the-self or leave the job. All participants made remarks about leaving the job where bullied, going silent about the bullying, or both. There is no ambiguity with many of the WPB participants driving their intention to leave that job. A participant stated: “Oh yes, right, this is why a nurse left the ward. I become the next target. And I decided to leave. This is why I left because you don’t attack me professionally.”

A response from another participant showed the desire to get away from the bully, “So, I knew the only way to get out was to apply for a different department where she would have no control.” When the interviewer asked, “What do you think would have happened if you had to stay in the same position?” her response was, “I knew I was going to quit.”

Repeated WPB experiences were behind a participant leaving other jobs as well:

I’ve left jobs because of bullying. I left the ICU position because I didn’t have ICU experience. I wanted to learn the ICU, and I had a nurse there, she was my preceptor, and she was just so, so mean and nasty.”

In the absence of mitigating circumstances, the WPB experience’s effects led directly to all eighteen participants’ decision to go silent and or leave the position where bullied.

Discussion

The purpose of this constructivist grounded theory study was to examine the overall experiences of self-reported bullying of female racial/ethnic minority nurses in the acute care/hospital workplace in their own voice through dialogue. Three significant themes describe the antecedents (cultural injustice), contributing factors (organizational stability), and the consequences of bullying (Survival) for the participants. Components of workplace bullying reveal a workplace environment and facility processes that synergistically form the context for experiencing bullying. Workplace culture, the overall work environment, the lack of teamwork, and the formation of workplace cliques represent the structure that makes workplace bullying possible. The participants described the processes that allow WPB to occur, including leadership passivity, lack of facility resources to support those experiencing WPB, deployment of informal power through favored persons as perpetrators of bullying, the vanishing of professional opportunities for those targeted, and sabotaging the quality of work of minority nurses. Ineffective organizational oversight was described that allowed workplace bullying to occur repeatedly while bullying and various coping strategies used against it resulted in self-silencing or leaving the job. The current literature on workplace bullying indicates that racial or ethnic minorities experience bullying more than non-minorities (WBI, 2017). However, contemporary literature lacks sufficient rigor on the racial/ethnic minorities’ perspectives and the circumstances surrounding their experiences. The purpose of this study was to bridge the gap in the literature by examining the experiences of female nurses who self-identify as racial/ethnic minorities that have faced bullying in an acute care hospital setting. This study aimed to understand how these experiences are unique to racial or ethnic minorities and describe specific factors that give rise to these unique experiences using a rigorous type of research inquiry. Understanding these unique bullying experiences and addressing the factors leading to bullying of racial/ ethnic minorities in acute care settings will have numerous benefits to society. The literature illustrates that health outcomes improve when nurses’ racial and ethnic makeup represent the communities they serve. However, if these same nurses are being bullied at higher rates, stripped of their voice, the attrition rate will outpace the replacement rate. The quality of care received by the corresponding patient population cannot improve. Understanding this group of nurses’ workplace bullying experience is essential for creating a supportive place to work. Three themes emerged from the data. These three themes and their subcategories describe the workplace bullying experiences of female minority nurses. They also describe the organizational factors that propagate and perpetuate bullying of these nurses. Figure 1 illustrates these mechanisms. This figure illustrates the mechanism of the perpetuation of workplace bullying in the nursing workgroup. From this view, we can focus on the role of organizational culture and the finding that within an environment fostered by the workplace culture, management competency, and facility process are the breakdown of real teamwork, the rise of cliques, and the inevitable workload inequities that result leading to the acts of WPB. There is a breakdown of collegiality and a lack of a common goal impacting the organization’s output. Coping with silence or leaving the position was the universal result.
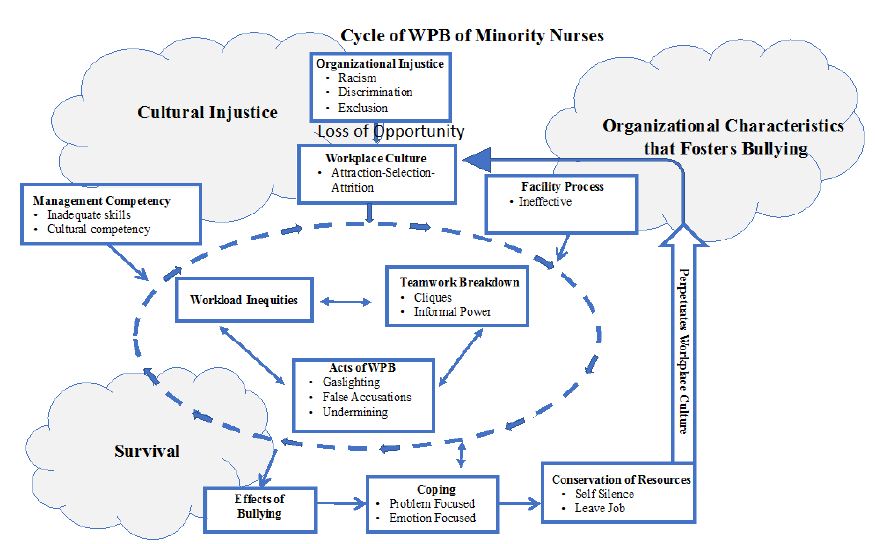
fig 1

Figure 1: Cycle of Workplace Bullying of Minority Nurses

The three themes and their relationship with each other revealed the core social process of bullying, maintaining the status quo through the deliberate attraction-selection-attrition of employees. Bullying maintained the status quo by perpetuating a culture where anyone who did not fit in with the dominant group of the organization was left with a choice to leave the job or become silent. Racism, discrimination, and exclusion make up the theme of organizational injustice, which results in the unfair allocation of opportunity for minority nurses. Racism and discrimination are foundational in all workplace settings, but the degree and how it is manifested may differ. Organizational injustice forms the backdrop and is a precursor for elements within the workplace culture to include facility process and management competency that did not function in a way that could stop or even significantly mitigate these actions. Facility processes were not effective mechanisms for surveillance, to assess the overall workplace culture, or to manage reports of WPB occurrences. One explanation for this could be the attraction and selection of employees that match the status quo in concert with the attrition of the minorities viewed as outliers. The victims of WPB had two options: to leave or be silent if they stayed. In this study, silence or to leave was functionally the same action as either helps maintain the status quo. Those who did not fit in could and did push back but only to the extent that they had personal and professional resources available. These mechanisms describe the theory of structural-functional bullying in nursing Figure 2.
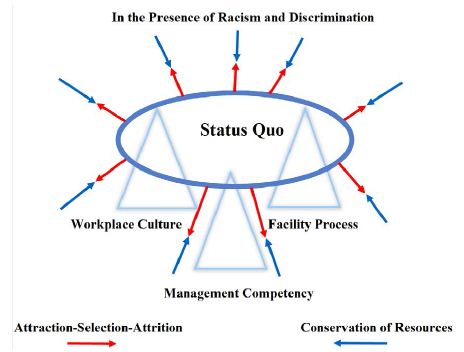
fig 2

Figure 2: Maintaining the Status Quo

Academic literature supports organizational injustice findings [28,29] stated that racism is the initial framework from which discrimination and exclusion can build. In a racist workplace, individuals are far more likely to be excluded and discriminated against [28,29] found that racism by individuals with hiring authority reflected the type of employees they select and to whom they provide promotional opportunities to. At an institutional level, racism becomes depersonalized. The lines between racism, bullying, and discrimination became blurry, and the inability to hold any person or entity directly accountable makes it challenging to address [30]. Workplace Characteristics that Promote Bullying, the data analysis shows that participants experienced flaws in facility processes such as confidential reports being shared with subjects and unions or human resources representatives failing to follow up on bullying reports. Additionally, workplace culture elements fostered bullying and occurred in a spectrum of minimizing complaints to enabling an outright hostile work environment. Participants reported a culture of employees protecting themselves and securing an environment that unfairly blames some employees. Finally, participants reported experiencing issues with managers who lacked credibility or managers who relied on bullying to force employees’ compliance. The attraction and selection of like-minded people that fit the dominant culture and the attrition of those that do not fit in explain the mechanism for workplace culture formation. The Attraction-Selection-Attrition model explains that organizational culture, and the social structure that emerges from it, is built and formed over time by the individuals within that organization. Facility processes such as the Union or other employees’ resources were inadequate to address reports of bullying. In theory, facility processes were in place to improve employee fairness, satisfaction [31,32]. Two typical facility processes in play here were union support for the nurse and the facility process for reporting issues detrimental to the organization and its people. The findings, however, showed little to no positive outcomes of these processes.

Managers in charge of workgroups were unable to mitigate bullying. Managers were recruiting bullies to collect information and bully others. They thrived in a culture of chaos where the employees were fighting with each other. Lack of cultural awareness and management competency may be an agonist for the prevalence of WPB against minorities.

Factors working together made up the workplace structure and culture, including the global environment, management competency, and cliques considered teamwork. These factors, when combined with facility process factors, set the stage for acts of WPB. Organizational complicity allowed the cliques to flourish, permitting discrimination and informal power by individual staff-level employees. Bullying action was allowed within this context, including tactics of gaslighting, false accusations, favoritism, exclusion, and undermining. These structures and techniques tended toward organizational stability though favoring the status quo. WPB was not inhibited, which in turn perpetuated a climate of bullying. The workplace culture that came forward in this study demonstrated how the current environment empowered bullies. Also, the same processes channeled bullying acts because bullies were protected. The result squelched opportunities and destruction of professional dreams that remained out of sight until the individual stories brought it out. The workplace culture demonstrated a contradiction between a caring environment’s expected nature and surface civility, with the participants’ aggressive, non-caring behaviors. As a result of the workplace characteristics, bullying acts were allowed to go on, causing participants to go into a survival mode as they tried to cope with the effects. Consistent with appraisal theory, Survival involved both emotion-focused coping and problem-focused coping. Resulting actions included deliberate attempts at resolution from which silence and leaving became the most common form. The nurse’s choice to consciously become silent seems to result from the desire to control the situation by conserving resources. The concept of resilience can be a factor for participants going through these traumatic events. On the surface, resilience is a term used to denote someone exposed to challenges but can adapt and move on. In biological theory, it involves the concept of natural selection and the phrase “survival of the fittest” [33]. The implication is those who should survive do end up surviving. Resilience [34] can have a positive connotation. Our society values this trait in people [35], but this view does not adequately explain these participants’ experiences with bullying and its aftermath. The self-silencing is not a form of resiliency and does not demonstrate acceptance. The silence is a deliberate effort to conserve resources. Self-silencing represents a functional mechanism to carry on. This study has shown that nurses may be erroneously viewed as “resilient” when, in reality, they may just be avoiding the “stigma” associated with getting bullied. This form of silencing occurs due to the limited energy available to minorities to counter the repulsive force and change the status quo. The minority nurse’s operational decision was to conserve resources and rely on personal support mechanisms to carry on. The self-silencing manifested in ways that were not mutually exclusive, including silence about how one was treated at work in their current position and being silent while leaving the job to take action against bullying. The nurse’s choice to consciously become silent seemed to result from the desire to control the situation by conserving resources. It emerged that self-silencing was mutually beneficial in the short term for both the participant and the organization. In contrast to the individual level experience of self-silencing, maintaining the status quo perpetuates the workplace culture. The status quo is supported by those who bully and self-silence or leave the job. In discussing the themes, another relevant concept is the concept of intersectionality. Kimberlie Crenshaw defines intersectionality as how race, class, gender, and other individual characteristics “intersect” with one another and overlap to influence societal and interpersonal interactions [36]. Intersectionality requires that consideration of the uniqueness of each individual and their personal experiences. As intersectionality became more complex for the participants (i.e., female, black, religious minority), the likelihood of being mistreated from all sources grew. This study’s revelation, needing further exploration in quantitative studies focusing on isolating related variables, separates the perceived impacts of race, gender, and unrelated personal quality on workplace bullying. Many individuals in the study perceived bullying instances to have a racial component, but others may have included a gender component. Women face bullying in the workplace, and individuals belonging to minority groups experience bullying in the workplace, so that those female minority nurses may experience bullying differently [37].

Implications for Policy

Health inequities and health disparities are a significant economic burden on government. For example, while the healthcare costs account for 17% of the gross domestic products, the health care quality in the United States is the lowest among all other industrialized nations [38]. With the increase of minorities in the U.S. population, examining minority nurses and the workplace’s specific challenges is essential in our society’s evolution. Minorities will soon become the majority of the U.S. population. Reducing WPB against minority nurses has ramifications well beyond the proper treatment of individuals. Evidence in the literature shows that improving the influx of minority healthcare workers may remedy the growing health disparities. To retain minorities in the healthcare space, federal governments, and organizations could consider instituting an anti-bullying framework. It is important to frame these findings with the quadruple aim of the Institute of Healthcare Improvement (IHI) for the future success of health care systems worldwide (IHI 2017) [39,40]. In keeping with IHI’s triple aims of excellent quality of care at an optimized cost while improving the health of the population served, one would argue that bullying’s organizational support provides a fertile ground for bullying to occur. Care suffers for both the nurse and the patient, increasing medical errors and decreasing the nurse’s sense of self. Increased turnover and other errors drive up the cost of care. This environment undermines the trust between the frontline nurse, the administration, and the public they serve. IHI’s fourth aim involves improving the work experience of healthcare workers. It links patients’ healthcare experience to the nurses’ overall work experience [41], underscoring the urgency of developing WPB mitigation strategies. Strategies could start with resources to improve cultural competency, focusing on implicit bias, multiple reporting avenues, awareness and training, building a functional support system, and assessing practical teamwork barriers in nursing. It is reported in the literature that many employees are afraid of reporting bullying incidents for fear of reprisal [42,43]. Multiple reporting avenues provide options for employees to select the reporting mechanism with which they feel most comfortable. Anonymous reporting mechanisms should be made available. Many employees perceive that their workplace structure supports a bullying culture [3,44]. It is essential to start, however, to build a culture of trust for employees. Awareness and training are a start to this. As organizations initiate intervention strategies, it is essential to note that reported bullying’s initial frequency and intensity may increase due to heightened awareness of bullying [45].

Study Limitations

This study has several limitations. One limitation is inherent to qualitative studies, in that it is not able to establish correlation or causation between specific variables. The participant sample for this study was appropriate for a qualitative study but too limited to be representative. The findings in this study are not applicable to all nurses, all female nurses, or even all minority female nurses. To establish causation, further studies would need to conduct randomized control trials which are representative of the population they include. However, the workplace factors such as cliques masquerading as teamwork can form the basis for intervention research utilizing model for improvement framework. Similarly, another limitation is the focus on female-only population. While the importance to understand the experiences of all groups of employees to isolate all factors that make up the multidimensional nature of WPB was perceived, this study focused just on female minority nurses due to their exposure to the microcosm of societal and organizational factors that are unique to female experience in a male-dominated society. These dominations operate to silence their voices. Furthermore, even within female participants, there are cultural variations within minority groups that could not be fully explored in a pilot study of this size. In order to fully understand the experience of minority nurses with workplace bullying, it would be important to compare male perspectives and identify areas of similarity and differences. Another limitation of this study was a lack of focus on individual attributes and how they interact with their coworkers. There are many factors which contribute to workplace bullying, including cooperation style, communication style, individual preferences, and inherent characteristics like race or gender. Without understanding the characteristics of the individual nursing being bullied and the individual doing the bullying, it is challenging to understand why bullying occurred and how it could be prevented in the future (Pallesen et al., 2017). Further studies could consider isolating variables which contributed to bullying, which may include the intersectionality of race, gender, and ethnicity and the WPB of nurses.

Conclusion

The constructivist grounded theory method provided a framework to guide participants in examining their bullying experiences in the acute care workplace. A significant finding was the extent to which racism and its companion concepts of discrimination and exclusion are connected. The summation of organizational processes and the participants’ use or non-use of resources revealed a workplace culture focused on maintaining the status quo. Three factors that supported this were workplace culture, management competency, and facility processes. Resistance from those that did not fit-in occurred only to the extent that they had personal and professional resources available. Many participants discussed the lack of resources to assist them in dealing with the environment. All participants made remarks that consisted of either leaving the job or going silent about the bullying. The consistency of such comments across participants clarifies that these coping-related responses, leaving the job or silencing, were crucial aspects of their WPB experience and how to carry on in its aftermath.

This study’s results support the Institute for Healthcare Improvement’s Quadruple Aim Initiative to improve the health of populations, enhance the experience of care for individuals, reduce the per capita cost of health care, and in particular increase the quality of the work experience for healthcare providers by allowing them to attain joy in work (IHI, 2017). Workplace psychological safety and the essential component of cultural competency are integral to improving, rebuilding, and reshaping workplace culture. By promoting cultural competency within its structure and processes, an organization could create a psychologically safe environment for all employees. Also, focusing on attaining joy in the workplace through psychological safety would create an environment where minority and all nurses would want to work, succeed, and flourish.

Funding

No external funding was used for this research.

Conflict of Interest

There are no conflicts of interest with the authors of this research.

Interview Guide

1. Tell me about your experience with workplace bullying?

2. The Bullying that you experienced: Was it an attack on you, personally, against your professionalism/competence, or against you by affecting your work tasks?

a. Personally

Did you have a personal relationship with the bully?

Did you or the bully try to have a personal relationship with each other?

Did the bully ever directly threaten you?

What do You Feel Now?

Are You Able to Move On?

b. Against your professionalism/competence:

Were there attempts to discredit you? Give examples

Do you feel that this has impacted your professional career?

Do you feel that this has impacted your personal life?

Do you feel that this has impacted your health?

c. Against you by affecting your work tasks:

3. Were there attempts to limit or otherwise interfere with your work? Give examples

4. Did this make you change anything you did? How?

5. Upstream Factors

a. Did your workplace tolerate behaviors consistently?

What were some examples of differences?

How did that make you feel?

What if anything, did you do because of this?

6. Did your workplace reward staff consistently?

a. What were some examples of differences?

How did that make you feel?

What if anything, did you do because of this?

7. Did you observe cliques in your workplace?

Did cliques have influence over decisions that affected your work there?

Did you feel pressure to join a clique?

Did this change anything you did or didn’t do at work?

Did this change how you felt at work?

8. Did you observe people attempting to exercise more authority than you thought they had?

a. Was this known to higher authority?

Did higher authority tolerate this?

Did this directly affect you at work?

Did this indirectly affect you at work?

9. Did you observe people at work ever deliberately violate known policy or procedure?

a. Did it affect your work?

Did it affect you?

Did it make you change anything you did at work?

What do you feel now?

Are you able to move on?

10. The bullying you experienced at work, do you feel it affected or changed anything in your life outside of work? Please tell me about that.

11. Has this impacted your personal life (can you explain)?

12. Downstream Factors

a. How do you cope with getting bullied?

b. Do you think getting bullied affects your ability to provide safe patient care?

c. Can you explain?

d. Has getting bullying affected your health?

Examples include: (anxiety, depression, psychological and physiological changes)

Have you had to seek medical or psychological treatment?

13. Reporting

a. Did you report the bullying to anybody?

Do you feel comfortable reporting bullying incidence at work?

Did you notice any consequence to you reporting bullying?

References

  1. Workplace Bullying Institute (2010) Workplace bullying: Recognize and prevent it.
  2. Askew DA, Schluter PJ, Dick ML (2013) Workplace bullying—What’s it got to do with general practice? Aust Fam Physician. 42: 186-188. [crossref]
  3. Hutchinson M, Vickers M, Jackson D, Wilkes L (2006) Workplace bullying in nursing: towards a more critical organizational perspective. Nursing Inquiry 13: 118-126. [crossref]
  4. Grimes-Holsinger V (2018) Reduction of workplace discord through self-awareness and personal de-escalation skills [unpublished doctoral dissertation]. Quinnipiac University.
  5. Vessey JA, DeMarco RF, Gaffney DA, Budin WC (2009) Bullying of staff registered nurses in the workplace: a preliminary study for developing personal and organizational strategies for the transformation of hostile to healthy workplace environments. Journal of Professional Nursing 25: 299-306. [crossref]
  6. American Association of Colleges of Nursing. (2011). Nursing Fact Sheet.
  7. Hurley J, Hutchinson M, Bradbury J, Browne G (2016). Nexus between preventive policy inadequacies, workplace bullying, and mental health: Qualitative findings from the experiences of Australian public sector employees. International Journal of Mental Health Nursing 25: 12-18. [crossref]
  8. Kivimaki M, Virtanen M, Vartia M, Elovainio M, Vahtera J, et al. (2003) Workplace bullying and the risk of cardiovascular disease and depression. Occupational and Environmental Medicine 60: 779-783.
  9. Kline R, Lewis D (2018) The price of fear: Estimating the financial cost of bullying and harassment to the NHS in England. Public Money & Management 39: 166-174.
  10. Asfaw AG, Chang CC, Ray TK (2014) Workplace mistreatment and sickness absenteeism from work: results from the 2010 National Health Interview survey. American Journal of Industrial Medicine 57: 202-213.
  11. LaVeist TA, Gaskin DJ, Richard P (2009) The economic burden of health inequalities in the United States. Washington, D.C.: Joint Center for Political and Economic Studies.
  12. Colosi B (2019) National health care retention and R.N. staffing Report.
  13. Allan HT, Cowie H, Smith P (2009) Overseas nurses’ experiences of discrimination: a case of racist bullying? Journal of Nursing Management 17: 898-906. [crossref]
  14. Chipps E, Stelmaschuk S, Albert NM, Bernhard L, Holloman C (2013) Workplace bullying in the OR: Results of a descriptive study. Association of Perioperative Nurses Journal 98: 479-493. [crossref]
  15. Shannon CA, Rospenda KM, Richman JA, Minich LM (2009) Race, racial discrimination, and the risk of work-related illness, injury, or assault: findings from a national study. Journal of Occupational and Environmental Medicine 51: 441-448. [crossref]
  16. Lindsey AP, Avery DR, Dawson JF, King EB (2017) Investigating why and for whom management ethnic representativeness influences interpersonal mistreatment in the workplace. Journal of Applied Psychology, 102: 1545-1563.
  17. Wang ML, Hsieh YH (2015) Do gender differences matter to workplace bullying? Work 53: 631-638. [crossref]
  18. Tajfel H, Turner JC (1986) The Social Identity Theory of Intergroup Behavior. In: S. Worchel and W. G. Austin, (Eds.), Psychology of Intergroup Relations, Hall Publishers, Chicago, pg: 7-24.
  19. Tajfel H, Turner JC (2004) The Social Identity Theory of Intergroup Behavior. Key readings in social psychology. In: Jost JT, Sidanius J (Eds,), Political psychology: Key readings, Key readings in social psychology, pg: 276-293. Psychology Press.
  20. Guba E, Lincoln Y (1994) Competing paradigms in qualitative research, In: Denzin N , Lincoln Y (Eds), Handbook of qualitative research. Pg: 105-117. Sage.
  21. Charmaz K, Thornberg R, Keane E (2018) Evolving grounded theory and social justice inquiry. In: NK Denzin, YS Lincoln (Eds.), The SAGE Handbook of Qualitative Research pg: 411-443 Sage.
  22. Breckenridge J, Jones D (2009) The grounded theory reviews. An International Journal 8: 1-71. http://www.groundedtheoryreview.com/wp-content/uploads/2012/06/ GT-Review-Vol8-no2.pdf#page=64.
  23. Strandmark KM, Rahm G, Wilde LB, Nordstrom G, Rystedt I (2017) Preventive Strategies and Processes to Counteract Bullying in Health Care Settings: Focus Group Discussions. Issues Mental Health Nursing 38: 113-121. [crossref]
  24. Malecki C, Demaray M (2003) What type of support do they need? Investigating Student Adjustment as related to emotional, Informational, Appraisal, and Instrumental Support. School Psychology Quarterly, 18: 231-252.
  25. Khattak MN, Khan MB, Fatima T, & Shah SZA (2019) The underlying mechanism between perceived organizational injustice and deviant workplace behaviors: Moderating role of personality traits. Asia Pacific Management Review 24: 201-211.
  26. Greer LL, Van Bunderen L, Yu S (2017) The dysfunctions of power in teams: A review and emergent conflict perspective. Research in Organizational Behavior 37: 103-124.
  27. Spence Laschinger HK, Fida R (2014) New nurses burnout and workplace well-being: The influence of authentic leadership and psychological capital. Elsevier 1: 19-28.
  28. Brewer LC, Cooper LA (2014) Race, Discrimination, and Cardiovascular Disease. Virtual Mentor 16: 455-460.
  29. Schilgen B, Nienhaus A, Handtke O, Schulz H, Mösko M (2017) Health situation of migrant and minority nurses: A systematic review. PloS one [crossref]
  30. Came H (2012) Institutional racism and the dynamics of privilege in public health, Thesis, Doctor of Philosophy (Ph.D.). University of Waikato, Hamilton, New Zealand.
  31. Mohammadpour A, Anumba C, Bulbul T, Messner J (2012) Facility management, industrial facilities, occupational safety, health care facilities, safety, decision making, information management. American Society of Civil Engineers Construction Research Congress 2012, Conference Information, May 21-23, 2012 | West Lafayette, Indiana, United States.
  32. Pallesen S, Nielsen MB, Magerøy N, Andreassen CS, et al. (2017) An Experimental Study on the Attribution of Personality Traits to Bullies and Targets in a Workplace Setting. Frontiers in psychology 8. [crossref]
  33. Mistry M, Latoo J (2009) Bullying: A growing workplace menace. British Journal of Medical Practitioners 3: 23-26.
  34. Rosa MW (2000) Some thoughts about resilience versus positive development, main effects versus interactions, and the value of resilience. Child Development 71: 567-569. [crossref]
  35. Oshio A, Taku K, Hirano M, Saeed G (2018) Resilience and big five personality traits: A meta-analysis. Personality, and Individual Differences 127: 54-60.
  36. Crenshaw K (1989) “Demarginalizing the Intersection of Race and Sex: A Black Feminist Critique of Antidiscrimination Doctrine, Feminist Theory and Antiracist Politics,” University of Chicago Legal Forum: Vol. 1989, Article 8.
  37. Woodrow C, Guest DE (2017) Leadership and approaches to the management of workplace bullying. European Journal of Work and Organizational Psychology 26: 221-233.
  38. Squires D, Anderson C (2015) U.S. health care from a global perspective: spending, use of services, prices, and health in 13 countries. Issue Brief (Common Fund). 15: 1-15. [crossref]
  39. Institute for Healthcare Improvement (2017) The triple aim or the quadruple aim? Four points to help set your strategy.
  40. Lewis N (2014) A primer on defining the triple aim. Institute for Healthcare Improvement.
  41. Bodenheimer T, Sinsky C (2014) From triple to quadruple aim: Care of the patient requires care of the provider. The Annals of Family Medicine 12: 573-576. [crossref]
  42. Johnson SL (2015) Workplace bullying prevention: a critical discourse analysis. Journal of Advanced Nursing 71: 2384-2392. [crossref]
  43. Rodwell J, Demir D, Steane P (2013) Psychological and organizational impact of bullying over and above negative affectivity: A survey of two nursing contexts. International Journal of Nursing Practice 19: 241-248. [crossref]
  44. Wilson BL, Diedrich A (2011) Bullies at work: The impact of horizontal hostility in the hospital setting and intent to leave. Journal of Nursing Administration 41: 453-458. [crossref]
  45. Chipps EM, McRury M (2012) The development of an educational intervention to address workplace bullying: a pilot study. Journal Nurses Staff Development 28: 94-8 [crossref]
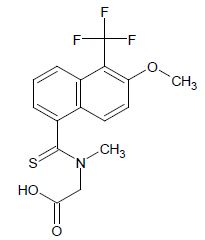
The Controversies Concerning the Prevalence of the Neurodevelopmental Conditions ADHD and Autism

DOI: 10.31038/JNNC.2021421


The neurodevelopmental disorders ADHD and autism are among the most important diagnoses in Child and Adolescent Psychiatry and are also important diagnoses in adult psychiatry [1]. The prevalence of diagnosed ADHD varies considerably between countries and regions and one region can report more than twice the prevalence in another region [2,3]. ADHD and autism have been found to have very high heritabilities which implies that environmental factors, although of importance, are not completely decisive for the prevalence of these conditions [4,5]. Studies of ADHD in different countries have shown approximately the same prevalence when using the same strict criteria [6]. The prevalence of ADHD in childhood has been estimated to be in the order of 5 to 6% [7].

Concerning autism, the prevalence has shown a very dramatic increase from less than 1‰ 50 years ago to more than 1% in recent reports. In Korea and some parts of Sweden prevalence estimates of 3-4 % have been reported [8-10]. One reason for this increase can be that more individuals with high functioning autism are diagnosed nowadays, who previously were not regarded as having autism. Going back 30 years in time, 80% of the patients with a diagnosis of autism also had an intellectual disability. In recent reports only about 20% of patients with autism have an intellectual disability [11].

Studies of ADHD and autism have shown that the increase in prevalence is explained by a higher number of patients with low severity of symptoms being diagnosed, while the prevalence of patients with severe symptom load has not increased in the last decade [12,13]. This implies that the increased prevalence is not explained by a true increase in these conditions, but rather a change in diagnostic practices. This has led to a debate among professionals and in the general society. Karlstad et al. have shown that the month of birth has an influence on the likelihood of being medicated for ADHD [14]. The principle of equal rights for all patients to get adequate treatment is obviously not fulfilled. Also concerning autism there has been reported large geographic variation [15]. There has been concerns of an “inflation” risk of being diagnosed with ADHD or autism, as many patients diagnosed have very mild symptoms that might be regarded as part of the normal variation.

This gives rise to several questions: Is there an over-diagnosing of these conditions? Is there a diagnostic substitution so that patients who formerly got another diagnosis now get a diagnosis of ADHD or autism? Are different attitudes and ideology among professionals of importance? There has been a debate between “biologists” and “anti-biologists” concerning these diagnoses as biological factors are regarded as etiologically important for both ADHD and autism. In southern Europe, where often psychodynamic theories are used for the diagnosis and treatment of psychiatric patients, especially concerning children and adolescents, few patients have been diagnosed with ADHD or autism [16,17]. In contrast, the northern European countries, Germany, the Netherlands, United Kingdom, USA, Canada, Australia, and New Zeeland are countries with a high diagnostic frequency of ADHD and autism. Attitudes and expectations from patients, parents, teachers, and the general society, as well as different resources, might influence the likelihood of getting a diagnosis of ADHD or autism. Diagnoses of ADHD or autism might also, in different degree in different geographic areas, be of importance for the patients in order to acquire support from the schools, and for the patients and families to get financial support.

A problem, when discussing the differences in prevalence, is that we do not know the “true” prevalence with absolute certainty, although population based studies point to a prevalence around 5-6 % for ADHD [1] and 1-2% for autism [8,15,18]. All over the world, there has been fast changes in the societies related to the introduction of modern information technology. There have been big changes in the educational system and the labor market, which might lead to increased anxiety among the youth and their parents. A diagnosis of ADHD or autism can lead to better support and protection from difficult demands from school and society. For many individuals a diagnosis of ADHD or autism can lead to a better self-understanding. The diagnoses ADHD and autism both have diffuse limits towards normality and other psychiatric conditions, which may lead to a risk for a displacement of the diagnostic borders. It is thus important to ascertain that there is a clinically significant functional impairment before a diagnosis can be considered. Functional impairment and quality of life are important factors to consider in all psychiatric conditions. The assessment of function and quality of life can be difficult and the ICF (International Classification of Functioning, disability, and health), which still is under development, should be used more extensively in the future [19]. A main problem is that the functioning of a person depends heavily on the environment (demands, expectations, support), i.e. not only the individual should be examined, but also the psycho-social environment. If the society has changed so that more and more individuals are exposed to stress, efforts should be made to reduce important societal stress factors instead of only treating individuals.

Is it possible to prevent over-diagnosing and at the same time give adequate support for patients with ADHD and autism and also to those with sub-clinical problems? These diagnoses share common genetic and environmental risk factors. They are also difficult to separate from other psychiatric diagnoses and from the normal variation. The diagnoses of ADHD and autism seem to constitute the tails of the normal distribution of human traits. Efforts should be made to ascertain that individuals have the same opportunities to get assessment and adequate treatment for their neurodevelopmental disorders, which means that the prevalence of these diagnoses across different geographic locations should not vary too much. What seems most important is that common principles are followed for the diagnostic assessments, including assessments of functional impairment, in diagnosing ADHD and autism. There should be a consensus regarding the cut-off levels for the required severity to get a diagnosis. Efforts to increase the knowledge of ADHD an autism in the society are also of importance. An increased tolerance for human diversity is important so that all individuals, with or without a diagnosis, can get adequate support and can feel that they have their righteous place in the society.

References

  1. Polanczyk GV, Salum GA, Sugaya LS, Caye A, Rohde LA (2015) Annual research review: a meta-analysis of the worldwide prevalence of mental disorders in children and adolescents. J Child Psychol Psychiatry 56:345–65. [crossref]
  2. Faraone SV, Sergeant J, Gillberg C, Biederman J (2003) The worldwide prevalence of ADHD: is it an American condition? World Psychiatry 2: 104-13.
  3. Atladottir HO, Gyllenberg D, Langridge A, Sandin S, Hansen SN, et al. (2015) The increasing prevalence of reported diagnoses of childhood psychiatric disorders: a descriptive multinational comparison. Eur Child Adolesc Psychiatry 24: 173-83. [crossref]
  4. Faraone SV, Perlis RH, Doyle AE, Smoller JW, Goralnick JJ, et al. (2005) Molecular genetics of attention-deficit/hyperactivity disorder. Biol Psychiatry. 57: 1313-23. [croosref]
  5. Tick B, Bolton P, Happé F, Rutter M, Rijsdijk F (2016) Heritability of autism spectrum disorders: a meta-analysis of twin studies. J Child Psychol Psychiatry 57: 585-95. [crossref]
  6. Banaschewski T, Becker K, Döpfner M, Holtmann M, Rösler M, et al. (2017) Attention-Deficit/Hyperactivity Disorder. Dtsch Arztebl Int 114:149-159. [crossref]
  7. Thomas R, Sanders S, Doust J, Beller E, Glasziou P (2015) Prevalence of attention-deficit/hyperactivity disorder: a systematic review and meta-analysis. Pediatrics 135: 994–1001. [crossref]
  8. Sasayama D, Kuge R, Toibana Y, Honda H (2021) Trends in Autism Spectrum Disorder Diagnoses in Japan, 2009 to 2019. JAMA Netw Open 4: e219234. [crossref]
  9. Schendel DE, Thorsteinsson E (2018) Cumulative incidence of autism into adulthood for birth cohorts in Denmark, 1980-2012. JAMA 320: 1811- 1813. [crossref]
  10. Rah SS, Hong SB, Yoon JY (2020) Prevalence and Incidence of Developmental Disorders in Korea: A Nationwide Population-Based Study. J Autism Dev Disord 50: 4504-4511. [crossref]
  11. Rydzewska E, Hughes-McCormack LA, Gillberg C, Henderson A, MacIntyre C, et al. (2019) Prevalence of sensory impairments, physical and intellectual disabilities, and mental health in children and young people with self/proxy-reported autism: Observational study of a whole country population. Autism 23: 1201-1209. [crossref]
  12. Rydell M, Lundström S, Gillberg C, Lichtenstein P, Larsson H (2018) Has the attention deficit hyperactivity disorder phenotype become more common in children between 2004 and 2014? Trends over 10 years from a Swedish general population sample. J Child Psychol Psychiatry 59: 863-871. [crossref]
  13. Arvidsson O, Gillberg C, Lichtenstein P, Lundström S (2018) Secular changes in the symptom level of clinically diagnosed autism. J Child Psychol Psychiatry 59: 744-751. [crossref]
  14. Karlstad Ø, Furu K, Stoltenberg C, Håberg SE, Bakken IJ (2017) ADHD treatment and diagnosis in relation to children’s birth month: Nationwide cohort study from Norway. Scand J Public Health 45: 343-349. [crossref]
  15. Sheldrick RC, Carter AS (2018) State-Level Trends in the Prevalence of Autism Spectrum Disorder (ASD) from 2000 to 2012: A Reanalysis of Findings from the Autism and Developmental Disabilities Network. J Autism Dev Disord 48: 3086-3092. [crossref]
  16. Ponnou S, Haliday H (2020) ADHD Diagnosis and Drug Use Estimates in France: A Case for Using Health Care Insurance Data. J Atten Disord. [crossref]
  17. Reale L, Bonati M (2018) ADHD prevalence estimates in Italian children and adolescents: a methodological issue. Ital J Pediatr 44:108. [crossref]
  18. Kim YS, Leventhal BL, Koh YJ, Fombonne E, Laska E, et al. (2011) Prevalence of autism spectrum disorders in a total population sample. American Journal of Psychiatry 168: 904–912. [crossref]
  19. Madden RH, Bundy A (2019) The ICF has made a difference to functioning and disability measurement and statistics. Disabil Rehabil 41: 1450-1462. [crossref]

Study of the Recurrence Rate in the Treatment in Use Group of Acupuncture and Moxibustion and Non-in Use Group of a Breast Cancer Post-operatively

DOI: 10.31038/JCRM.2021431

Abstract

There is a lot of recurrence of breast cancer post-operatively and prescription of an anticancer drug is necessary. But it’s learned that treatment of acupuncture and moxibustion participates in autonomic nerve immunity. So the recurrence rate of 10 years later was considered while investigating a white-blood cell, the number of lymphocyte and monocytes, and TH1/TH2 and CA153, Treg cell every year and 10 years later to 51 cases which shared breast cancer patients of post-operatively with 2 groups. The first group is 30 cases used treatment of acupuncture and moxibustion and the second group is 21 cases of non-in use group, Treatment of acupuncture and moxibustion chose meridian treatment, Traditional Chinese Medicine treatment, Ono system treatment and Nagano system treatment from a pluses diagnosis according to each constitution. A result increased in a lymphocyte and TH1/TH2 ratio significantly 10 years later from the treatment front to non-in use group by a treatment group of acupuncture and moxibustion and T reg cell decreased 10 years later. The recurrence rate didn’t recognize a significant difference stage 1 and Ruminull A and B by low value, but a treatment in use group of acupuncture and moxibustion made recurrence decrease predominantly to non-in use group by stage 2, 3, 4 and HER2 extrovert group.

Keywords

Breast cancer post-operatively, TH1/TH2 ratio recurrence rate, Acupuncture and moxibution treatment Treg cell

Introduction

In Japan a survival rate is 90.6% for breast cancer postoperative ten years on stage 1. But stage 2 is 78.5% stage 3 is 33.0% stage 4 become 10.9%. Of course, a new anticancer agent and an antihormone drugs are developed. But I did not know drugs for effective cancer immunity. Acupuncture and moxibution treatment have participates in autonomic nerve immunity. We provide post-operative breast cancer patients, the first group was operated standard chemotherapy with non-use treatment of acupuncture which are 21 cases, and the second group was operated with treatment of acupuncture and moxibution which are 30 cases and we investigate cancer immunity for WBC TH1/TH2 CA153 Treg cell every year and 10 yaers later. And two groups comparative investigate the rate of recurrence.

Patient Target

Informed consent was got 51 patients of post-operative of breast cancer. One group 21 cases were admitted standard chemotherapy and second group 30 cases was admitted standard chemotherapy with acupuncture and moxibution treatment.

Approach

51 cases we investigate WBC count and Lymphocyte Monocyte percentage, TH1/TH2 ratio, Treg cell count (normal value 8.0 ~34.0%) and the presence of recurrence every year for 10 years later.

Acupuncture Method

Acupuncture and moxibution treatment have two effectiveness for human body [1,2]. One is sedative pain for sympathetic nerve and second is immunity effectiveness for parasympathetic nerve. We stimulate immunity effective that we stimulate disposal acupuncture needle (φ 0.02 mm) in depth 3-4 mm from the skin. And acupuncture point we select according pulse diagnosis traditional Chinese theory and Japanese nagano system, Ono system and meridian diagnosis system. For example, the nagano system suggest blood stasis stimulate tyuuhou (LV4) and syakutaku (L6), liver meridian emptiness stimulate eyou (B35) daityouyu (B25). Ono system suggest neck tenderness diagnosis tenntyuu (B10) is kidney meridian emptiness stimulate taikei (K3) and huyou (B59). Chinese traditional medicine suggest kidney meridian emptiness stimulate hukuryuu (K7) and keikyo (L6) [3-5]

Examination

For every year we examinate white blood cell count and lymph/monocyte percent, TH1/TH2 ratio, Treg cell count.

And breast cancer marker CA153 and the last existence of recurrence of local and distance for MRI and CT 10 years later.

Statistics

Significant difference between two groups for mann-whitney’s method.

Result

Group 1 (30 cases) enforced chemotherapy with acupuncture and moxibution treatment

First diagnosis WBC: 3080 ± 882 μ/mL, lymphocyte/monocyte:20.2 ± 4.6 /6.8 ± 2.4% TH1/TH2: 20.4 ± 12.8/4.9 ± 3.8 (ratio4.1) CA15-3:15.8 ± 6.8 μ/mL, Treg: 58.0 ± 14.8%. 1 year later WBC: 3409 ± 1084 μ/mL Ly/Mono:28.6 ± 35.5/4.5 ± 43.8%, TH1/TH2:24.8 ± 3.8/3.0 ± 0.8 (ratio8.2), CA15-3: 12.4 ± 3.8 u/mL Treg: 49.2 ± 20.1%. 5 years later WBC: 3808 ± 1209 μ/mL, Ly/Mono:30.4 ± 6.1/3.8 ± 2.0*, TH1/TH2:30.2 ± 3.8/3.0 ± 0.8 (ratio7.9) **CA15-3:10.8 ± 2.9 u/mL, Treg: 20.2 ± 13.4%***. 10 years later WBC: 3804 ± 2004 μ/mL Ly/Mono:31.2 ± 4.2/3.2 ± 1.6※, TH1/TH2:31.4 ± 6.8/3.0 ± 0.5 (ratio10.4) ※※ CA15-3:10.8 ± 2.9 u/mL, Treg:8.6 ± 5.5%※※※.

We saw significant difference 5 years later and 10 years later for the first diagnosis examination about lymphocyte/monocyte TH1/TH2 ratio and Treg cell. And recurrence rate stageⅠ cases (16 cases average age 63.0 y.o.) was 0% and stage II~IV cases (14 cases average age 60.8 y.o.) saw 3 cases recurrence and its ratio was 21.4%.

Second group was 21 cases enforced chemotherapy with non-acupuncture treatment.

First diagnosis: WBC: 2897 ± 998 μ/mL, Ly/Mono1 8.9 ± 3.9%, TH1/TH2:20.6 ± 8.8/5.2 ± 3.0 (ratio 6.8) CA15-3:28.9 ± 4.7 u/mL Treg: 55.2 ± 10.8%. 5 years later:WBC:3208 ± 1090 μ/mL Ly/Mono:20.8 ± 6.0/6.1 ± 3.6%, TH1/TH2:20.6 ± 8.8/5.2 ± 3.8 (ratio3.9) CA15-3:28.9 ± 5.0 u/mL, Treg: 52.4 ± 21.4%. 10 years later:WBC:3200 ± 826 μ/mL, Ly/Mono:18.4 ± 4.4/5.8 ± 4.0% TH1/TH2:18.4 ± 4.0/5.0 ± 3.8 (ratio4.8) CA15-3:20.4 ± 3.8 u/mL Treg: 50.2 ± 26.8%

We saw TH1/TH2 Treg cell no difference between every examination and recurrence ratio was stageⅠgroup (9 cases ave. age 66.3 y.o.) 11.1%. 1 case was seen bone metastasis. And stage II~IV 12 cases (ave. age59.8 y.o.) was seen 8 cases recurrence (66.6%) 10 years later (Figure 1).

fig 1

We saw significant difference to a relapse rate in an acupuncture treatment group and non-acupuncture group for stage II~IV ten years later. (Relative risk p<0.320).

The rise in ratio of TH1/TH2 and the drop of the Treg cell were in particular remarkable. (Relative risk p<0.021) and we saw Ruminal type A・B (HER2 negative) acupuncture treatment group are 18 cases seen recurrence 0 case (0%) but non-acupuncture group (11 cases) was seen recurrence 2 cases (18.1%) and HER2 positive group acupuncture treatment (12 cases) was seen recurrence 3 cases (25%) but non-acupuncture treatment (10 cases) was seen recurrence 7 cases (70%) for 10 years later (relative risk p<0.435) (Figure 2).

fig 2

Consideration

Standard chemotherapy is done after operation of the breast cancer, but the relapse rate is not low at all. It is thought that it has a drop of the cancer immunity and participation of the Treg cell. TH1 cell conduct killer T cell with the help of cytokine INFγ, IL-6 and TH2 cell disturb a function of cytokine [6-8]. In other words, we can induce cancer immunity will if the TH1/TH2 ratio is high. In addition, it is thought the Treg cell controls an effect of the chemotherapy [9-11]. We pay attention of the parasympathetic nerve of the acupuncture and moxibution treatment, I added acupuncture and moxibution treatment to the breast cancer postoperative cases. We thought the result acupuncture and moxibution treatment group watched the rise in TH1/TH2 ratio and drop of the Treg and reduced a relapse rate in predominance.

Conclusion

It can let cancer immunity have the top by a rise of TH1/TH2 and the drop of the Treg cell to use acupuncture and moxibustion treatment together during breast cancer postoperative chemotherapy and can reduce a recurrence in its turn. You should use acupuncture and moxibustion treatment together during chemotherapy.

References

  1. 水嶋丈雄著.鍼灸治療への科学的アプローチ.三和書籍.2012: 19-21. (Mizushima T.: Scientific approach of acupuncture and moxibution).
  2. 首藤伝明著.経絡治療のすすめ.医道の日本社.2015: 97-120. (Syudou D.: The advice for meridian treatment of acupuncture).
  3. 陸寿康著.鍼灸手技学.東洋学術出版社.1992: 100-120. (Riku K.: Maneuver study of acupuncture).
  4. 衷中会編.臓腑経絡・三焦の弁証と処方.医歯薬出版.2000: 263-273. (Demonstration of Entrail and meridian of traditional chinese medicine).
  5. 小野文恵著.鍼灸臨床入門.医道の日本社.1988: 10-28. (Oon.B.: Medical practice of acupuncture and moxibution).
  6. Sakaguchi S (2005) Nature Immunology 6(4): 345-352. [crossref]
  7. De Oliveira, CE et al, (2017) Molecular Cancer Therapeutics, September.
  8. Zwang NA, Leventhal JR (2017) Journal of the American Society of Nephrology 28(7). [crossref]
  9. Ohmi Y (1996) Tumor-specific targeting of T helper type I (TH1) cells by anti-CD3 ☓anti-c ErbB-2 bispecific antibody Cancer Immunol Immunother 48: 456-452. [crossref]
  10. Nishimara T (1999) Distinct roll on antihen-specific T helper type I (Th1) and Th2 cells in tumor eradication in vivo. Exp Med617-628. [crossref]
  11. Kitamura H (1999) The natural killer Tcell ligand α‐galactosylceramide demonstrates its immnnopotentiating effect by inducing IL-12 production by dendritic cells and IL-12 receptor expression on NKT cell J Med 1121-1127. [crossref]

Good Practices on Labour and Birth Care

DOI: 10.31038/IJNM.2021213


The implementation of good care practices for normal childbirth and the reduction of unnecessary interventions, recommended by the World Health Organization since 1996, has been reinforced by the Brazilian Ministry of Health through successive public policies [1]. The literature, however, suggests that there are gaps in the understanding of the work process of professionals who work in childbirth care, and there is low adherence to practices based on scientific evidence by the group [2]. A few decades ago, when a woman would begin labour, she would start the so-called pilgrimage in search of a bed in maternity wards. When she would get a place, she would be admitted without the right of a companion. Conducting labour included fasting, enteroclysis, trichotomy, routine venous hydration, routine oxytocin, collective pre-delivery, lithotomy delivery, routine episiotomy, kristeller maneuver, among other practices without scientific evidence. The parturients did not question the medical or nursing conduct. They remained passive throughout labour and delivery, entrusting their bodies to the “protagonists of birth”.

As it is an event that involves cultural processes, individual and social interactions, with different powers and legitimacy, the implementation of the new model develops with excessive delay. However, a lot has already been done, since this process is in full development and there is no turning back. Scientific evidence reveals that during labour and delivery it is extremely positive for the mother and the child the presence of a companion, the assessment of foetal well-being, the offer of liquids and a light diet, non-pharmacological pain relief, walking encouraged, freedom of position and movement, empathic support by service providers, the provision of information on the progress of labour or any guidance the parturient may require during this period [3,4]. Literature also suggests that good practices need to be disseminated and incorporated into the daily lives of all middle and senior professionals who permeate the birth scenario. However, if the proposal is to change the model with a theoretical and practical grounding of humanized obstetric care, orientation needs to take place since the training of these professionals, in order to compose the curriculum of the political-pedagogical project of the courses [5].

The existence of nursing residency programs has shown to be a particularly strong influence for changing the model, especially when the course is guided by the ideology of care centred on women, encouraging the use of good obstetric practices, reducing unnecessary interventions, the de-medicalization of health, the promotion of autonomy and women empowerment [5]. Bearing in mind that part of today’s preceptors come from the old training model that they have received as student-residents and reproduce the biomedical and hospital-focused models, there is a clear need for greater investment in obstetric residency programs, as well as in the processes of care providers’ work to promote a more innovative and less conservative approach to care [3]. Pedagogical practice is a process that is intrinsically linked to the articulation of theory and teaching practice, which is built and rebuilt in daily life and so it must be transformative and involve the multiple dimensions of the teaching-learning process, from teacher training, student profile, teaching methodology, learning objectives and curriculum, teaching strategies, educational assessment to the relationship between teacher and student [6]. In this context, it is suggested to strengthen actions that promote greater adherence to the best care practices, both in relation to the organization of labour and birth care, as well as the attitudes and values of health professionals, granting more in-depth training and qualification to care providers in order to improve care management using a holistic and evidence-based approach, centered on self-care, humanization, security, and human rights [3]. There are many challenges facing the proposal to change the model and include the training of new professionals, the qualification of the agents involved in training, and the organization of childbirth care services, in order to standardize and make use of good protocols and good clinical guidelines already published by the World Health Organization corroborating to the standardization of protocols, building trust among the team and assuring that everyone is guided by the same clinical precepts, regardless of where they were trained. The ongoing change in the labour and birth scenario is the result of countless collective processes that seek the implementation of well-conducted public policies, efforts by local administrators, change in the attitude of former workers in the face of new evidence, women’s organized movements and, without a doubt, the qualification of the training of new professionals forged in the expertise of Good Obstetric Practices.

References

  1. Gottems LBD, Carvalho EMP de, Guilhem D, Pires MRGM (2018) Boas práticas no parto normal: análise da confiabilidade de um instrumento pelo Alfa de Cronbach. Revista Latino-Americana de Enfermagem
  2. Carvalho EMP de, Göttems LBD, Pires MRGM (2015) Adherence to best care practices in normal birth: construction and validation of an instrument. Revista da Escola de Enfermagem da USP 49: 889-897.
  3. Carvalho EMP de, Amorim FF, Santana, LA, Göttems LBD (2019) Avaliação das boas práticas de atenção ao parto por profissionais dos hospitais públicos do Distrito Federal, Brasil. Ciência & Saúde Coletiva 24: 2135-2145.
  4. Leal MC, Bittencourt SA, Esteves-Pereira AP, Ayres BVS, Silva LBRAA, et al. (2019). Avanços na assistência ao parto no Brasil: resultados preliminares de dois estudos avaliativos. Cad Saúde Pública
  5. Carvalho EMP de, Göttems LB, Amorim FF, Guilhem DB (2020) The training of obstetric physicians and nurses to change the obstetric model in Brazil: A view of the preceptors in the training process. Journal of Nursing Education and Practice, 10.
  6. Fonseca NV, Carvalho EMP de, Göttems LBD (2020) A formação de técnicos de enfermagem para a promoção do cuidado à saúde da mulher. Comunicação em Ciências da Saúde.

River Ganga: Policy Interventions

DOI: 10.31038/GEMS.2021324

Abstract

Failure of various Ganga cleaning programmes in past 3 decades forced the Indian Government to launch yet another ambitious plan in 2015, named as “Namami Gange”. Apart from inclusion of few new initiatives, this plan is the repetition of previous plans in terms of approach, management, and overall agenda. Ganga, the national river of India, which has been globally recognized for decomposing organic wastes at the rate 15-25 times faster than any other river [1], is now one of the most polluted rivers of the world [2]. It indicates that there have been some untouched and/or neglected aspects in policy formulation, and most important, in understanding the peculiarity of this river.

Keywords

Namami Gange; policy; pollution; River Ganga

Issues of concern and political apathy

More than 2,900 million liters of sewage [3] and 700 million liters of industrial effluents [4] join the river on daily basis. 194 major drains along the river stretch also discharge approximately 9,300 million liters of waste per day [5]. In addition, there are thousands of villages along the 2,525 km of the river course, most of which are characterized by lack of hygiene and sanitation facilities, resulting in discharge of untreated waste. Solid waste, including plastics, also makes its way into the river [6]. Floating dead bodies, animal carcasses, mass bathing, and other ritualistic practices also contribute their significant share. To assimilate such a huge amount of waste, river does not have sufficient ecological flow owing to various hydropower stations, irrigation canals, and water abstraction for drinking / industrial / commercial purposes. Reduction in southwest monsoonal rainfall over the Ganga basin is also a reality [7]. All this has led to the situation where Ganga can no longer be able to provide its ecosystem services to the full extent. In past 30 years, numerous efforts took place at the government and institutional levels to purify the Ganga; but the complex web of centre-state relations, bureaucratic hurdles, and corruption have resulted only in the wastage of huge amount of public money with minimal results. Notably, in the starting phase of action plans, 100% funds were given by the central government. From 1993, 50:50 sharing of funds was adopted by states and centre, which later changed to 30:70 i.e. (involved) states were required to contribute 30% of capital, and operation and maintenance cost; while the central government contributed the rest 70%. This financial arrangement also proved to be unsustainable for the states in the long term and eventually, central government contributed 100% towards the funds as well as planning. In all these scenarios, local municipalities, which are the foundation stone for the implementation and success of any project, were left out of the decision making. These institutions have never been authorized to fund the operation and maintenance of the facilities through local resources, which ultimately resulted in the collapse of expensive infrastructure. Lack of political will, lacunae in enforcement of environmental laws, and unplanned developmental activities have further acted as catalysts in the malfunctioning of the entire system. Technological challenges have also played a significant role in the overall mis-management. Previous policies have mainly focused on the establishment of sewage treatment plants in order to arrest pollution in the river. Huge investments were made for the advanced energy intensive technologies; however, the issue which was forgotten was the local conditions to operate the facilities. Analysis reveals that at the planning stage, there was always existed massive gap between the vision and the on-ground implementation. Approach has always been to use the world class technologies, but constant inflow of funds to meet operation and maintenance cost, continuous power supply to run the facilities, skilled labor, and effective and responsible operation could not be ensured. It led to the under-performance and in some cases, shut-down of the wastewater treatment facilities. Nevertheless, in many of the cities where STPs were established, there is still no sewerage system for conveying city sewage up to the STPs, thus turning the whole purpose futile. On the other hand, open defecation practice is still prevalent in many rural and urban areas. Although government has created millions of toilets under its ‘Clean India Mission’, but their regular usage is doubtful because, in a country like India where 97 million people are surviving without any access to improved sources of drinking water [8], using water for sanitation is deemed as wastage. In such a situation it is not surprising that diarrhea alone is the third leading cause of childhood mortality in India [9]. What was wrong here was the lack of understanding to maintain co-relation between the sanitation and water availability. Development of water-less toilets would have been an attractive option to motivate people for their use.

Policy Recommendations

Till date, Ganga clean-up programmes in India have been designed on the lines of remediation plans of foreign rivers (e.g. Thames River, Rhine River etc.) forgetting the fact that Ganga is much different from those rivers. Ganga is a South Asian river which holds attributes of geographical, geological, social, and cultural uniqueness and therefore, management efforts are also needed to be exclusive.

Figuring out the full picture

It is known that ~70-80% pollution load in this river comes from the municipal sewage. However, rest of the pollution can be attributed to various industrial effluents and other important sources [10]. Incomplete estimation of the pollution sources and focus on only single issue has been one of the major reasons for the failure of previous policies. Solid waste dumping into the river has not been given much attention. Huge gap lies between the solid waste generation and available treatment capacity (Figure 1). Non-point source pollution is also very significant but it has been altogether neglected in earlier approaches. Agricultural pollution is the most significant non-point source, considering the fact that India is an agrarian country. Cultivation area is decreasing every year and therefore in order to enhance production, huge quantities of chemical fertilizers and pesticides are often applied blindly (Figure 2). Runoff from more than 6 million tons of fertilizers and 9000 tons of pesticides (including DDT) are added annually into the Ganga11. These agro-chemicals slowly accumulate in the river-bed sediments which often act as sink for various chemical species and heavy metals [12]. Hence, there is need to focus on such farming systems that will reduce agricultural pollution while maintaining farm income. More emphasis needs to be given for adoption of organic farming practices. Rural landscape management is also an impressive programme which ensures the conservation and management of ecosystems by handling non-point source pollution [13-14]. Government also needs to play an effective role for the formulation and implementation of laws and regulations in order to control pesticide/fertilizer pollution (Insert Fig 1-2).

FIG 1

Figure 1: Solid waste generation and available treatment capacity in the Ganga states Data source: Lok Sabha, India)

fig 2a

fig 2b

Figure 2: Increasing usage of chemical fertilizers (a) and decreasing land area under cultivation in India (b) depicts that significant amount of un-utilized chemicals might be contributing to non-point source pollution Data source: Agricultural statistics at a glance, India)

Previous policies also lacked initiatives for the estimation of river sediments. Sediments analysis in river bed is highly desirable as Ganga is supposed to carry approximately 403 – 660 × 10 [6] tonnes of sediments annually [15], of which 88% of the annual sediment load is restricted only during monsoons [16]. Further, high density of dams and barrages in upper reaches of Ganga trap the sediments and thus hinder their smooth flow resulting in the impact on overall ecological characteristics and water quality of the river. It is therefore advised that sediment load analysis and management should be made an inclusive part of the Ganga rejuvenation policies.

Coordinated efforts

In India, there are many governing bodies which work in an un-coordinated manner. There is Ministry of Jal Shakti, which is an apex body for formulation and administration of rules and regulations for development and regulation of water resources in India. Ministry of Environment, Forest, and Climate Change deals with conserving natural resources including rivers, along with the prevention and abatement of pollution. And, Ministry of Rural Development aims to provide urban amenities in rural areas. Apart from these, there are numerous other agencies, authorities, and pollution control boards at both the centre and state levels. Un-coordinated efforts among these bodies often lead to delays / non-implementation of the projects, mis-management of funds, corruption, duplicacies, conflicts, and finally, the failure of initiatives. To minimize such things, a tremendous upheaval is required in the existing system through a well-planned set-up with overall aim to curb pollution. Various non-governmental organizations, private enterprises, and public should also be involved. Proper documentation and information dissemination also needs to be maintained in order to keep the system transparent and accountable.

Embracing the change

Change in mindset and attitude plays a big role. As of now, there are numerous rules and regulations in the country, but those are hardly practiced. Upon violation, the common tendency among the citizens / industries is to bribe the officials and get away from the cumbersome process of litigation. Therefore, changes in the law-making and enforcement are highly desirable. Further, it is also necessary to carry out extensive ground level studies to estimate the performance of any advanced water treatment technology in Indian scenario before its implementation. Unsustainable development of numerous projects in the Ganga basin shall only paralyse the already suffering river [17] and therefore, impact/risk assessment methods should not be made lenient in order to promote development. Also, industries can be leveraged with the additional responsibility of treating and re-using their effluents to the maximum extent possible. Ganga rejuvenation is the responsibility of each and every citizen and hence, at the individual level there is immense need to bring changes in values, attitude, and behavior towards water. Education and awareness are extremely important for this. Importance of clean and uncontaminated water resources needs to be understood by everyone. Minimization of waste generation and attitude to re-use the things is highly recommended in this regard. Reducing the pressure on the ecosystem services which a river can provide might further help in the overall improvement in the health of the river.

Conclusion

There is necessity to understand the loopholes in the existing system and willingness to overcome. Comprehensive assessment of the policies is required before and after implementation and authorities need to be made accountable for their actions. Although, some initiatives are being taken by the Indian government but those are not enough. Effective policy framework along with the mass awareness is highly solicited in Indian context.

Declaration of Interest Statement

Authors declare that there are no conflicts of interest.

Funding

This research did not receive any specific grant from funding agencies in the public, commercial, or not-for-profit sectors.

References

  1. Bhargava DS (1981) Ganga, the most self purifying river. In: Proceedings of International Symposium on Water Resources Conservation, Pollution and Abatement, Roorkee, India.
  2. Rai B (2013) Pollution and conservation of Ganga River in modern India. J. Sci. Res. Pub 3 : 1-4.
  3. http://www.hindustantimes.com/delhi-news/ganga-receives-2-900-million-ltrs-of-sewage-daily/story-SApumDD2zFUTUtb3AtpC9K.html (accessed 12 October, 2017).
  4. http://www.dnaindia.com/india/report-700-mn-litres-of-waste-dumped-each-day-cpcb-2384790 (accessed 12 October, 2017).
  5. Central Pollution Control Board (CPCB) Report, Identified and priority drains in phase / segment wise, Personal Communication, 2017.
  6. Lebreton LCM, Zwet JV, Damsteeg JW, Slat B, Andrady A, et al. (2017) River plastic emissions to the world’s oceans. Nat Commun 8 : 1-10.
  7. Paul S, Ghosh S, Oglesby R, Pathak A, Chandrasekharan A, et al. (2016) Weakening of Indian summer monsoon rainfall due to changes in land use land cover. Sci Rep 6 : 1-10.
  8. http://www.who.int/water_sanitation_health/monitoring/jmp2012/fast_facts/en/ (accessed 20 August, 2017).
  9. Lakshminarayanan S, Jayalakshmy R (2015) Diarrheal diseases among children in India: Current scenario and future perspectives. J Nat Sci Biol Med 6 : 24-28. [crossref]
  10. Dwivedi S, Mishra S, Tripathi RD (2018) Ganga water pollution: A potential health threat to inhabitants of Ganga basin. Environ Int 117 : 327-338. [crossref]
  11. UNDP Human Development Report (1998) Oxford University Press, NewYork, , pg : 69.
  12. Pandey J, Singh R (2017) Heavy metals in sediments of Ganga River: up- and downstream urban influences. Appl Water Sci 7 : 1669-1678.
  13. Idda L, Madau FA, Orru E, Pulina P, Sini MP (2005) Efficacy of European policies on rural landscape: the case study of Sardinia (Italy), XIth Congress of the European Association of Agricultural Economists, , Copenhagen, Denmark.
  14. Estrada-Carmona N, Hart AK, DeClerck FAJ, Harvey CA, Milder JC (2014) Integrated landscape management for agriculture, rural livelihoods, and ecosystem conservation: An assessment of experience from Latin America and the Carribean. Landscape Urban Plan 129 : 1-11.
  15. Subramanian V, Ramanathan AL (1996) “Nature of sediment load in the Ganges-Brahmaputra River systems in India” in Sea-level rise and coastal subsidence, Coastal Systems and Continental Margins. Springer, Netherland 2 : pg : 151-168.
  16. Subramanian V (1996) The sediment load of Indian rivers – an update, Erosion and sediment yield: Global and regional perspectives, Proceedings of the Exeter Symposium. IAHS Publication no. 236.
  17. Pandit MK, Grumbine RE (2012) Potential effects of ongoing and proposed hydropower development on terrestrial biological diversity in the Indian Himalaya. Conser Bio 26 : 1061-1071. [crossref]

Bionomic Parameters Significance in Covid-19 Contagion Dynamics, Monza-Brianza Province (Italy)

DOI: 10.31038/PEP.2021231

Abstract

Background: In etiopathology, a reductionistic asymmetry favors biology and marginalizes ecology. This misunderstanding is a challenge to overcome because health and disease depend on the entire life organization’s state. This research underlines how the Bionomics discipline is capable of completing the study on Covid-19 contagion dynamics in Monza-Brianza province.

Methodology: After a recall of the principles of Bionomics, the bionomic state of the Monza-Brianza (M-B) province is exposed. The bionomic functionality (BF) of each municipality, evaluated as landscape unit (LU), is compared with the mortality rate (MR) and the Covid-19 infections (%).

Results: Bionomic functionality (BF) emerges as the strongest correlation in opposition to the ecological density of the population, which becomes dominant after 2.5% of infected people. Other parameters, as PA (population age), seem to be less critical.

Interpretation: Environmental exposure and exchanges, and their interaction with the body’s biological systems and apparatuses, play an essential role in disease development. The main processes will be underlined. Significantly Prevention must change perspective, leading Medicine more systemic, from sick care to health care.

Keywords

Covid-19, Landscape Bionomics, contagion dynamics, macro-scale biologic processes.

Introduction

In many seminars and publications, Ingegnoli affirmed that traditional Biology focused on small scales (from biomolecule to the organism) is still mainly reductionist, so marginalizing broad scales (from community to landscape and biosphere). For instance, Medicine seems to be interested only in traditional Biology. Nevertheless, the ‘rock in the pond’ [1] of the Systemic Turn in scientific paradigms imposes to change our vision: biology does not concern only micro-scales.

We can see that the biological studies on bio-chemical molecules, genetics, viruses, metabolism brought to great successes, but also made insidious errors as, for instance, the statement of DNA as the “central dogma of molecular biology” [2], wrong because the DNA is not a set of formed characters but a set of potentialities [3]. Another tricking error is just the marginalization of macro-scales, which brought to refuse a proper scientific role to the researches in this field. In Medicine, we can see two reactions: (a) many researchers think even today to the fallacy of ecological aspects in etiology, and (b) some doctors app It is deepening the Systemic Theory,  the difference between what reciate the problems that come with environmental degradation but, generally, see them as someone else’s problem to solve, while they focus on repairing the damage. So, it is not entirely clear what the medical profession/students are meant to ‘do’ with the ecological problems and how they can use them to help patients. However, recently, some Medical communities recognize that human alteration of Earth’s ecological systems threatens humanity’s health. This fact has given rise to Global Health and Planetary Health, which are interdisciplinary while, first of all, they must be systemic and pursue a preferential relationship between advanced Ecology and Medicine [4].

This misunderstanding between Medicine and Ecology is a challenge: we must overcome this impasse! Thus, we cannot discuss the unity of Life, but we have to understand better how its scalar interrelations may influence our health. The alterations of Life at macro-scales can damage human health, not unlike at small ones. Note that the underestimation of the environment is rooted in Neo-Darwinian’s thinking: concepts such as the struggle for existence and natural selection are metaphors [5], not theories, so Darwin’s hypothesis becomes “the best-adapted individuals are more likely to have descendants.” Thus, other limits of Darwinism appear:

  • In biology, it is possible to demonstrate that the struggle for existence is less significant than cooperation and symbiosis [6, 7];
  • Mathematics has shown that in a complex system, a random variation always produces damage: e.g., Arnold, Moser, and Kolmogorov’s theory, [8];
  • Bio-semeiotics has shown that, in addition to genetic codes, there are other organic and mental codes [9] involved in evolution;
  • The epigenetic control of gene expression due to DNA methylation demonstrates that the phenotype is not directly expressed by the genotype [10], and part of the genome’s methylation pattern can be inherited in the Lamarckian sense.

The dependence of gene expression on the environment is now clear, as confirmed by Psycho-Neuro-Endocrine-Immunology [11]. We move from a mechanistic vision to a complex and systemic one: not only what is written in the sequence of the DNA bases matters, but also their modulation due to the information that the environment and behavior express.

After this introduction, we can see that overcoming the mentioned misunderstanding between Medicine and Ecology needs a theoretical premise on Landscape Bionomics [12] and an example of application that correlates bionomics, landscape health, and a disease’s incidence.  Starting from a recently published study on Covid-19 incidence in the province of Monza-Brianza at the beginning of this pandemic (March-November 2020) [13], it could be stimulating to complete the study on this contagion dynamics in the second substantial increase (November 20-May 21). Therefore, an innovative discussion will follow.

Theoretical References

From Traditional Ecology to Bionomics

Traditional Ecology asserts that Life organization consists of hierarchic levels: cell, organism, population, communities (i.e., the “biological spectrum” sensu EP Odum [14]) and their life support systems. However, we may observe that the world around Life (an organism, a community) concerns other life systems; so, the concept of ‘support’ must be changed into that of ‘integration’. That is why the concept of Life cannot be limited to a single organism or a group of species, but it also includes ecocoenotopes, landscapes, ecoregions, and the entire ecosphere (eco-bio-geo-noosphere): as all remember, the Gaia Theory [15] has claimed that the Earth can be considered a near-living entity.

Inquiring into what stated by Bionomics (i.e., the Theory of Life Organization on Earth) [12,16,17], Life on Earth is a complex open process, operating as a hyper-complex system with a continuous exchange of matter, energy, and information with its environment: information is the exchange (interrelation) that allows the emergence of cognitive distinction (order) between players (the components of the system). Thus, Life on Earth is organized in a hierarchy of six interrelated space-time-information levels (Tab.1)and each level cannot exist without its proper environment because of these integrations and exchanges.

Understanding the Systemic Theory, it is evident the difference between what exists (Real Systems: Life on Earth organized in Living Entities) and the different approaches to studying the environment (viewpoints). As exposed in Tab.1: it is a complete transformation of the main principles of traditional ecology by being aware that hierarchical levels are types of living complex systems; so, it is possible to define a state of health for each level.

Table 1: Hierarchic levels of Biological Organisation on the Earth

Scale of Real Systems

Viewpoints BIONOMICS
SPACE1 CONFIGURATION  

BIOTIC2


FUNCTIONAL3

CULTURAL-ECONOMIC4

Global (Earth)

Geosphere

Biosphere Ecosphere Noosphere

Geo-eco-bio-noosphere

Continental (Region)

Macro-chore

Biome Biogeographic system Regional Human systems

Ecoregion

Territorial (Province)

Chore

Set of communities Set of Ecosystems District Human systems

Landscape

Local (District)

Micro-chore

Community Ecosystems* Local Human systems

Ecocoenotope

Stationary

Habitat

Population Population niche Cultural/Economic

Meta-population

Singular

Living space

Organism Organism niche Cultural agent

Meta-organism

1= not only a topographic criterion, but also a systemic one; 2= Biological and general-ecological criterion;

3= Traditional ecological criterion; 4= Cultural intended as a synthesis of anthropic signs and elements;

Bionomics = Types of living entities really existing on the Earth as spatio-temporal-information proper levels

*The term Ecosystem may be available following the functional viewpoint but, if we refer to the whole system, it must be identified as Ecocoenotope.

Some Basic Concepts of Environmental Functionality

As one can read within the book “Frontiers of Life,” edited by Baltimore, Dulbecco, Jacob, and Levi-Montalcini and published by Treccani (Rome) and Academic Press (Boston) 1999-2001, the section on Landscape Ecology [18] already stated that…

(a) Processes allowing life definitions are ontological, but each specific biological level emerges, expressing these processes adequately.

(b) The relation between pathology and ecology of the systems will allow a diagnosis of each of them in a clinical sense.

(c) Territorial and regional space-time-information scale and the related living systems (landscape and ecoregions) are the most directly involved in human pathology insurgence.

(d) Both the landscape and the system of landscapes (=region[1]) are complex systems, existing as a biological entity within an entire Life’s Hierarchy, whose character and behavior are morethan the result of the action and interaction of natural and human components [18]. Thus,

(e) The landscape structure is not an ecological mosaic, as stated by conventional ecology, but an ecotissue: a multidimensional structure, as a histologic tissue, which represents the hierarchical intertwining of the ecological upper and lowers biological levels and of all their relationships within the landscape (Fig.1, a).

(f) As living systems, landscapes are self-organizing, adaptive, dynamic, self-regulating, dissipative, metastable.

(g) The crucial role in ensuring Life and structuring landscapes pertains to vegetation communities, the physiology of which leads to the concept of the ‘latent capacity of homeostasis’ of a phytocoenosis: it needs to dissipate their energy’s excess to maintain their organizational and metastability level, through a flux (Mcal/m2/year) evaluable by a systemic function, the Biological Territorial Capacity of Vegetation (BTC) [18,19].

The natural landscape units and sub-units, with the dominance of natural components and biological processes, capable of healthy self-regulation, represent the Natural Habitat (NH). By contrast, the transformed sub-units of human landscape (e.g., urban, industrial, and rural areas) but also the semi-human ones (e.g., semi-agricultural, plantations, ponds, managed woods), each with its proper weighted average value of human apport of subsidiary energy and technology, represent the systemic state function named Human Habitat (HH) able to evaluate how much men can affect and limit the natural systems’ self-regulation capability. Following Bionomics, the HH cannot be the entire territorial (geographical) surface (% of Landscape Unit, LU).

Processes, functions, and roles within landscapes, relating abiotic components, vegetation, fauna, and humans, are performed through formal elements organized as Landscape Apparatuses. The main Landscape Apparatuses can be defined as follows (Fig.1, b):

  1.  HGL = Hydro-geologic (emerging geotopes or elements dominated by geomorphic processes)
  2.  RNT = Resistant (elements with high metastability, e.g., forests)
  3.  RSL = Resilient (elements with high recovery Capacity, e.g., prairies or shrublands)
  4.  PRT = Protective (elements that protect other components or parts of the mosaic)
  5.  PRD = Productive (elements with high production of biomass: agricultural fields, meadows)
  6.  SBS = Subsidiary (systems of human energetic and work resources) as industrial and trade
  7. RSD = Residential (systems of human residence and dependent functions)

Note that both the natural and the anthropic Landscape Apparatuses present natural and human aspects (Fig.1b).

fig 1

Figure 1: (a) The concept of ecotissue is represented to the left (from Ingegnoli, 2002) [19]. (b) The main landscape apparatuses are expressed related to the concept of HH and NH. Both the pictures are referred to the Lombardy region, North of Italy.

The set of portions of the landscape apparatuses (within the examined LU) indispensable for an organism to survive is better known as Standard Habitat per capita (SH). It represents the state function strictly related to the previous concepts (m2/inhabitant) [12]. It is available for an organism (man or animal), divisible in all its components, biological and relational. In the case of human populations, we will have SHHH, that is an SH referred to the human habitat (HH):

SHHH = (HGL+PRD+RES+SBS+PRT) areas / N° of people [m2/inhabitant]

The connected Minimum Theoretical Standard Habitat per capita (SH*) is the state function estimated as dependent on (a) the minimum edible Kcal/day per capita [1/2 (male + female ) diet]; (b) the productive capacity (PRD) of the minimum field available to satisfy this energy for one year, taking into account the production of primary crops of organic farming; (c) an appropriate safety factor for current disturbances; (d) the need for natural or semi-natural protective vegetation for the cultivated patches[12]. It is estimable for each type of animal population too. Finally, the ratio SH/SH*, named Carrying Capacity (s) of a LU, is the state function able to evaluate the self-sufficiency of the human habitat (HH), a basilar question for sustainability and ecologicalterritorial planning.

Biological Territorial Capacity of Vegetation (BTC)

This function represents the fundamental state function of a territorial system, proved the fundamental role of vegetation communities (both natural and anthropized, even if with different significance) in managing the whole system’s energy to reach, rebalance and maintain its proper metastable equilibrium.

It can be studied on the basis of: (a) the concept of resistance stability; (b) the type of vegetation community; (c) its metabolic data (biomass, net or gross primary production, respiration, B, NP, GP R); (d) their metabolic relations R/GP (respiration/gross production) and (e) their order relations R/B (respiration/biomass) = dS/S (antithermic maintenance). Two coefficients can be elaborated:

ai = (R/GP)i / (R/GP)max      bi = (dS/S)min/(dS/S)i

ai measures the degree of the relative metabolic capacity of principal vegetation communities;

bi measures the degree of the relative anti-thermic (i.e., order) maintenance of the same central vegetation communities.

The degree of the homeostatic capacity of a phytocoenosis is proportional to its respiration. It can be expressed as the flux of energy that the phytocoenosis must dissipate to maintain its condition of order and metastability [Mcal/m2/year].

BTCi = (ai + bi ) Ri  w   (Mcal/m2/year)

where w = 1.4-1.6 (root biomass coefficient)

Therefore, the BTC function is essential because it is systemic and can evaluate the flux of energy available to maintain the order reached by a complex system.

The comparison between two very different agrarian landscapes near Milan in Fig.2 shows HH’s useful applications and BTC’s exposed concepts. Note that the BTC level difference is very sharp: Oltre-Po BTC = 1.75 Mcal/m2/year Vs. Chiaravalle BTC = 0.73 Mcal/m2/year, while the HH are closer. This example may also demonstrate bionomic principles’ capability to evaluate a complex ecological system’s health in a very synthetic view.

fig 2

Figure 2: The comparison between two very different agrarian landscapes near Milan. The difference in BTC level is very sharp and the two measures of HH, and BTC can demonstrate the capability of bionomic principles to evaluate the health of a complex ecological system in a very synthetic view. Bionomic Functionality and Landscape Information level are related to the ethological unconscious alarm recording process, as we will see later.

Bionomics Functionality (BF)

Focusing on the possibility to reach a simple way to frame the general health state of a territorial unit, after the study of 45 landscape units (in North Italy), an excellent correlation between the Biological Territorial Capacity of Vegetation (BTC) and the Human Habitat (HH) was found with an R2 = 0.95 and a Pearson’s correlation coefficient of 0.91 (significance = 2.93).

As we can see in Fig.3, it was possible to build the simplest mathematical model of bionomic normality, available for the first framing of landscape units’ dysfunctions.

fig 3

Figure 3: The HH/BTC model, able to measure the bionomics state of a LU. Dotted lines express the BF level, that is the bionomics functionality of the surveyed LU. From Ingegnoli [12].

Below normal values of bionomic functionality (BF= 1.15- 0.85), with a tolerance interval (0.10-0.15 from the curve of normality) we can register three levels of distorted BF: altered (BF = 0.85-0.65), dysfunctional (BF = 0.65-0.45) and highly degraded (BF < 0.45). The vertical bars divide the main types of landscapes, from Natural-Forest (high BTC natural) to Dense-Urban: each of them may present a syndrome.

Again, this model is indispensable to reach a first eco-bionomics diagnosis on the health of an examined landscape unit (LU), thus to give a simple suggestion of the eco-bionomic quality of the place where patients live, to control the effects of a territorial planning design, to study the landscape transformations, etc. It is a complex model because both HH and BTC are not two simple attributes, and their behavior is not linear.

Methodology

The Bionomic State of the Monza-Brianza (M-B) province (Lombardy)

The study on the environment-health alterations in M-B (2011-2017) had many reasons: this province presents the higher ecological density of population (25.1 people/ha) with a high human habitat (HH = 82 %), is the nearest to Milan, and it is characterized by a wide landscape gradient, from dense-urban to agricultural-protective.

The research started on the correlation between bionomic functionality (BF) and the mortality rate (MR), adding to M-B the area of Milan City (Ingegnoli & Giglio) [12, 20]. This basilar study allows the deep knowledge of the state of the environment following bionomics principles.

Pollution could be considered as homogeneous in our sample land area (Fig.4, left). The biological territorial capacity of vegetation (BTC) was estimated using field surveys (LaBiSV method, sensu Ingegnoli) [21,22,23], primarily referred to as forest patches. Fig.4, right, exposes the most significant set of forest assessments surveyed on the field. The fair value of the mean BTC = 5·84 Mcal/m2/year (a low value) is confirmed by the presence of 57·14 % of altered and weak forests, Vs. only 19·05 % of good ones (BTC > 7.0).

fig 4

Figure 4: In the Po plain, the distribution of air pollution is relatively homogeneous and one of the highest in the EU, ESA [24]. Not only Milan but also Monza-Brianza are inserted in this wide polluted area. (right) The bionomic state of the forest formations on the Province of Monza-Brianza shows only 19·05 % of the right conditions, and no one is truly optimal.

As shown in Fig.5, the blue line indicates a territory covered by the 55 + 17 = 72 municipalities (landscape units, LU) of the province of Monza-Brianza and Milan city (left). This land is compared with the bionomic metropolitan area of Milan (red), the N-E part of which is comprised in Monza-Brianza. Tab.2 shows the ecological and bionomic parameters per landscape type.

Bionomic principles and methods can find the landscape gradient, composed of six types (from agricultural to dense urban) and its relations with the mortality rate (MR), the bionomic functionality (BF), and the population Age (PA).  In Fig.5., the decrease of BF (blue) is related to MR’s increase (red). Elaborating the bionomic parameters (Tab.2) we note an average of BF = 0.78 (low value), indicating an altered environment.

fig 5

Figure 5: The blue line indicates the land area of experimentation: Monza-Brianza [Milan City is just South of Monza]. This territory covers 656 Km2 with a population of 2.3 x 10⁶ inhabitants and with a gradient of 6 landscape types. (base map from DUSAF-Ersaf). Note, in the plot, the inverse proportionality between MR (red) and BF (blue), while PA remains near constant. From [20].

Table 2: Gradient of landscape types emerged analysing 72 municipalities from Milan to the Brainza hills.

table 2

Covid-19 Contagion Dynamics in Monza Brianza (M-B)

Another figure (Fig.6) was developed for each municipality of M-B province, showing: Population (2018), FOR % (forest cover), URB% (urbanized), AGR % (cultivated land), HH% (Human Habitat), BTC (Mcal/m2/year), HS/HS* (Carrying Capacity), BF (Bionomic Functionality).  In October 2020 and May 2021, we added these data, the Covid-19 (infected people) and Covid-19 (%). The colors distinguishing the data are related to the landscape types of urban (violet), suburban (grey), and agrarian (yellow). The landscape gradient is very mixed, so a trend of instability emerges per each landscape type (here seven), even if the ecological density (ED) increases with urbanization.

Another figure (Fig.6) was developed for each municipality of M-B province, showing: Population (2018), FOR % (forest cover), URB% (urbanized), AGR % (cultivated land), HH% (Human Habitat), BTC (Mcal/m2/year), HS/HS* (Carrying Capacity), BF (Bionomic Functionality).  In October 2020  and May 2021, we added to these data, the Covid-19 (infected people) and Covid-19 (%). The colors distinguishing the data are related to the landscape types of urban (violet), suburban (grey) and agrarian (yellow). The landscape gradient is very mixed, so a trend of instability emerges per each landscape type (here seven), even if the ecological density (ED) increases with the urbanization.

fig 6

Figure 6: Note that the colors marking the data are related to the landscape types of urban (violet), suburban (grey) and agrarian (yellow). The landscape gradient is mixed, so a trend of instability emerges per each landscape type (2 agricultural, 2 rural, 2 suburban, 2 urban), even if the ecological density increases with the urbanization. Comparison between Covid-19 influence, Oct 20th Vs. May, 1st.

It is possible to demonstrate that bionomic parameters played a crucial role in infective development, not considered among the mentioned conventional factors. In Tab.4, the yellow, grey, and violet colours underline the data related to the rural, suburban, and urban-type landscapes. The bionomic data (HH, BTC, HS/HS*, and BF) are complex indicators obtained applying Landscape Bionomics’ principles and methods, as exposed in the cited volume Biological-Integrated Landscape Ecology [12].

The Covid-19 incidence in this Province [26], presents three phases: (a) March-May 2020, reaching about 5,000 infected, (b) September-October passed from 6,000 to 30,000 and (c) November 2020 – May 2021 from 30,000 to 75,000. The surveys to verify possible correlations with bionomic and ecological parameters were six: (i) April 19 (4,100 infected), (ii) July 31 (5,880 infected), (iii) October 20 (9,360 infected), (iv) November 16 (33,900), (v) March 30 (68,800), (vi) May, 01 (75,000) [24].

Results

The Mortality Rate as a function of BF

Previous research [20] demonstrated that the mortality rate (MR) is correlated with the BF (Fig.7). Note that even the population age (PA) is growing with the degradation of the LU, but the increase of MR is more than four times the increase of PA (0.76 Vs. 0.24); so, the rise of MR with Landscape degradation is mainly due to other physiologic and bionomic processes, first of all, the landscape diseases [12, 20].

fig 7

Figure 7: An evident increase of mortality rate MR [x 1000] is correlated with the increase of landscape dysfunction: we pass from MR = 7.64 in not altered landscapes (BF = 1.0) to MR = 9.5 in the landscape with deprivation of 50% (BF = 0.50) of the normal state. The correlation significance (Pearson) is 1.85.

To evaluate a preliminary Risk Factor from the MI-MB Model [BF = 0.78]:

ΔMRBF = (MRBF – MRBF=1) x 76% = (8.34 – 7.64) x 0.76 = 0.532 x10⁻³

The correlations Covid-19 Vs. bionomic parameters

The first correlation is presented in Fig.8, left (Oct-20). The trend line has a modest R2 value (0.1513) but its Pearson Coefficient [26] is sufficiently high (0.38). So, at proper bionomic functionality conditions (BF=1.0) the incidence of Covid-19 is pair to 0.90 %, while at weak BF=0.45, Covid-19=1.2 % (+133%).

The statistical population of 55 LU of Monza-Brianza province registers a minimum Pearson Coefficient value pair to 0.266. So, the correlation Covid-19 Vs. BF results 0.38/0.266 = 1,45: an available significance of correlation. A still more important correlation is expressed in Fig.8, dx, where the ecological density (ED), which represents the inverse of SH, presents in March 2021 a value of significance equal to 1.77.

fig 8

Figure 8: The most meaningful correlations between Covid-19 (%) and Bionomic parameters: (sx) bionomic functionality (BF) in the third survey (OCT, 20), and (dx) ecological density (ED) in the last survey (MAR, 21). Note that values on the y axis changes due to the increase of the disease incidence.

The tested parameters (Tab.3) where: (1) Ecological Density (ED) [people/ha], (2) Bionomic Function (BF) [BTC/BTCNORM], (3) Population Age (PA) [mean years], (4) Forest Cover (For) [% of LU], (5) Agricultural Land (Agr) [% of LU], (6) Urbanized Cover (Urb) [% of LU], (7) Human Habitat (HH) [% of LU]. The period: 423 days.

Table 3: Pearson Significances of the main Ecological-Bionomic Parameters Vs. Covid-19 contagion in Monza-Brianza Province: Note that Agr. and Urb. are comprised in ED, while For. And HH in BF (see Fig.10).

table 3

Remember that the essential bionomic parameters are: ED, relating Agrarian fields, Urban and Human Habitat; BF, relating Forest, Agriculture, Human Habitat; and Population Age. Note that ED presents an excellent average significance (ED = 1.18 ± 0.84); so, the standard deviation is very high. BF presents a bit less average but a better standard deviation: BF = 0.96 ± 0.40. The correlation significance of PA presents an average still more homogeneous but at a decidedly lower value: PA = 0.53 ± 0,17. Moreover, the averages of ED and BF are not significantly different (1.18 Vs. 0.96) but they seem to be in opposition: for the first 238 days ED (mean = 0.47) is low and BF high (mean BF = 1.27), while for the other period (185 days) is the contrary (ED = 1.81 Vs. BF = 0.65). Unlike the other parameters, PA remains lower and almost constant.

The Pearson’s correlation significances of the seven parameters are shown in Fig.9. Forest, Human Habitat, and their synthesis (BF) are shown in green and blue lines, while their opposites Agrarian, Urbanized, and their synthesis (ED), are shown in brown and red lines. PA (violet) remains near-constant, even if older people’s presence leads to high mortality.

fig 9

Figure 9: The dynamics of Pearson’s Correlation significances of the seven parameters. We can see two opposite trends, guided by BF (green) and ED (brown). PA (dotted blue) remains of lower significance and near constant.

To study the Covid-19 contagion dynamics we need to consider only the three main parameters significances (BF, ED) related to time (days) and the increase of infection percentages in the period (1.16 year) (Fig.10).

fig 10

Figure 10: Dynamics of the essential correlations significances between BF and ED in the first year of Covid-19 pandemic in the province of Monza-Brianza. Only when the contagion reached 2.5 % of the population, after 238 days, the ED became the leader environmental correlation in this territory.

This result is notable because the infection has grown where the environment was altered (BF average significance = 1.27) in the first 238 days (65.2 % of the year), leaving the ED contributions as marginal (average significance = 0.47). When the threshold of 2.5 % of infected people was exceeded, ED became the dominant correlation reducing the BF average significance to 0.64 (but not eliminating the correlation). So, a good BF can be considered a defense against infections, slowing down the contagion for 2/3 of a year.

Note that the ecological density ED (inhabitant/ha) is a bionomic parameter related to the concept of the human habitat (HH); so, it has nothing to do with the traditional geographic population density (GD, inhabitant/km2): being the average human habitat HH = 82 %, the ecological density ED = 26.3, while the geographic density GD = 21.5 (inhabitant/ha), with a difference of about + 22 %.

Discussion

Main Processes in Macro-Scale Biology: The Influence of Stress

We affirmed that health and disease depend on the state of the entire organization of life. Consequently, biology’s study should be extended to macro-scales, trying to understand their “anatomical” components, physiological processes and state functions, transformation processes, clinical-diagnostic evaluation, pathologies, and rehabilitation therapies. Here some examples:

box

All these sets of processes, and more, need a more advanced ecological discipline because the traditional General Ecology does not elaborate landscape principles and methods, and Landscape Ecology only partially. That is why Ingegnoli founded Landscape Bionomics’ new ecological discipline, the main criteria of which we presented in the second paragraph. It can, therefore, be shown that alteration of life at the macro-scales can damage human health no less than at the micro-scales, for instance, recalling point (3) ethological alarm signals and their stress influence (Fig.11).

fig 11

Figure 11: An example of how Biological macro-scale alterations and derived physiological processes are damaging human health. Environmental stress can be registered by the ethological concept of “value judgment”. The sympathetic nervous system and the hypothalamus-pituitary-adrenal axis mediate the integrated responses of the human organism to stress. Note the crucial importance of cortisol.

Many of the stressors are due to landscape structural dysfunctions, even in the absence of pollution. An Ethological Alarm Signal leads to environmental stress, which can be chronic. Stressors simultaneously activate:

(a) neurons in the hypothalamus, which secrete CRH (Corticotropin-releasing hormone), and

(b) adrenergic neurons

These responses potentiate each other. The final effect of the activation of neurons that secrete CRH is the increase in cortisol levels, while the net effect of adrenergic stimulation is to increase plasma levels of catecholamine (Dopamine, norepinephrine, and epinephrine).

The negative feedback exerted by cortisol can limit an excessive reaction, which is dangerous for the organism. However, when the stress became chronic, the circadian rhythm of melatonin/cortisol is altered. Plasma cortisol levels bring to a dominance of the Th2 immune circuit, with production of typical catecholamine (e.g., IL-4, IL- 5, IL-13) and the circuit Th17 [27].

Note that the Th2 immune response is not available to counteract viral infections, neo-plastic cells, auto-immune syndromes, which need a Th1 response. So, the premature death risk increases.

Widening the Categories of Environmental Alterations Influencing Human Health

Genome-Wide Association Studies (GWAS) revealed a limited causal effect (estimated less than 20%) of genetic susceptibility on phenotypic variance. Consequently, environmental exposure plays a crucial role in disease development, both in infectious (IDs) and non-communicable diseases (NCDs), such as viruses and bacterial infections (IDs), cancer, asthma, cardiovascular and endocrine diseases (NCDs). In reality, we have to underline that environmental exposure and exchanges, and their interaction with the body’s biological systems and apparatuses, play an essential role in disease development.

Note that the concept of exposure (e.g., the exposome, sensu Wild [33]) may be necessary but not sufficient because of the complex structures and interrelations of life. Even if, generally, only three categories are mentioned, we have to distinguish at least four categories of environmental alterations capable of influencing human health through exposure and interactions:

(a) internal processes, e.g., metabolism, hormonal balance, gut microbiota, aging, etc.,

(b) specific external factors, e.g., infections, pollutants, smoking, drugs, etc.,

(c) general external factors, e.g., socioeconomic status, technological behaviors, climate change, etc., and

(d) landscape structure/function alterations, e.g., concerning hierarchical relations, the biological territorial capacity of vegetation, vital space per capita, ratio human/natural habitats, etc. (see box).

Widening the concept of Anamnesis and Therapy Integration

We will see that Landscape Bionomics, while sustaining the listed physiological processes (green Box), opens new perspectives to etiopathology, health prevention and therapy integrations, and anamnesis. So, new linkages between the two disciplines, Landscape Bionomics and Medicine, emerge following the new systemic paradigm, both in diagnostic and therapeutic fields in etiology and anamnesis. We can indicate an answer to what is not entirely clear to the medical profession/students (see Introduction): what they are meant to ‘do’ with the ecological problems and how they can use them to help patients (Fig.12).

Fig.12 shows that the primary set of landscape syndromes can be grouped in six categories: (1) structural and hierarchical alterations, (2) excess processes alterations, (3) lack of protective agents, (4) cybernetic and information alterations, (5) agrarian landscape food and diet alterations, (6) chemical and physical pollutions. These processes, frequently cumulative (at least partly), lead to health damage with an interchange between the body’s external and internal life systems. MD’s responsibility is to repair the damage, but in doing this, MD should contact internal specialists and external ecojatra: at least to avoid reintroducing the patient into the same environment that contributed to the insurgence of the disease. Moreover, to add, first, a wider anamnesis and then an integrated therapy.

fig 12

Figure 12: This flow diagram tries to explain that MD have to repair the damages to human health but, being the majority of these damages due to environmental alterations and being the organism linked with body internal and external life systems, MD have to collaborate with internal and external specialists, arriving TO an integrated therapy.

Conclusion

In conclusion, we have to underline that environmental exposure and exchanges, and their interaction with the body’s biological systems and apparatuses, play an essential role in disease development. Studying the M-B province, we started showing the importance of broad-scale biology:

1.1) The mortality rate (MR) correlated with Bionomic Functionality (Pearson significance 1.85) 2015;

1.2) Bionomic Functionality correlated with Covid-19 % (Pearson significance 1.45) 2020, October;

1.3) Ecological Density correlated with Covid-19 % (Pearson significance 1.66), 2021, May;

1.4) Emergence of a Contagion dynamics: BF and ED inverted their dominance of correlation after the threshold of infected people = 2.5 %;

Therefore, we had to pass from qualitative to quantitative considerations related to macro-scale biology’s influence on human health scientifically, as suggested by landscape bionomics principles and methods. This fact underlines a more efficient control of environmental rehabilitation to enhance prevention against infectious (IDs) and non-communicable diseases (NCDs) [40] and indicates therapeutic integration between chemical and natural care.

On the other side, the possibility to evaluate the bionomic state of the landscape units and consequently to correlate its bionomic functionality (BF) with the mortality rate [21] reinforces the possibility to control the environmental syndromes and reduce the impacts of transformation, and advise the local Authorities for the necessity to ecological rehabilitation.

References

  1. Urbani-Ulivi L ed. (2019) The Systemic Turn in Human and Natural Sciences. A Rock in the Pond. Springer-Nature, Switzerland.
  2. Crick, FH (1958). On Protein Synthesis. In F. K. Sanders (ed.).Symposia of the Society for Experimental Biology, Number XII: The Biological Replication of Macromolecules. Cambridge University Press  138–163.
  3. Waddington CH (1961) The nature of life. Atheneum, New York.
  4. Frumkin H, Myers S (2020) Planetary Health, Protecting Nature to Protect Ourselves. Island Press, USA.
  5. Popper K, Lorenz K (1985) Il Futuro è Aperto. Bompiani.
  6. Margulis L (1975) Symbiotic theory of the origin of eukaryotic organelles; criteria for proof.In: Symposia of the Society for Experimental Biology 21-38. PMID. [crossref]
  7. Simard S, Roach WJ, Defrenne C et al. (2020) Harvest Intensity on Carbon Stocks and Biodiversity Are Dependent on Regional Climate in Dougles.Fir Forests of British Columbia. In: Frontiers I Forests and Global Change
  8. Scott-Dumas H (2014) The KAM story: a friendly introduction to the content history and significance of classical Kolmogorova Arnolda Moser Theory. In: World Sc. Publ.
  9. Barbieri M (2008) A new understanding of life. Naturwiessenshaften Pub.
  10. Holliday R (2006) Epigenetics : A Historical Overview. In : of Epigebetics Pp. 76-80.
  11. Bottaccioli F (2014) Epigenetica e Psiconeuroendocrinoimmunologia, le due facce della rivoluzione in corso nelle scienze della vita. Edra spa, Milano.
  12. Ingegnoli V (2015) Landscape Bionomics. Biological-Integrated Landscape Ecology. Springer, Heidelberg, Milan, New York Pp. XXIV + 431.
  13. Ingegnoli V, Giglio E (2020) Covid-19 Incidence and its Main Bionomics Correlations in the Landscape Units of Monza-Brianza Province, Lombardy. J Environ Sci Public Health 4 (4):349-366, USA.
  14. Odum EP (1971) Fundamentals of Ecology. Saunders, Philadelphia, USA.
  15. Lovelock J, Margulis L (1974) Atmospheric Homeostatsis by and for the Biosphere: the Gaia Hypothesis. Tellus
  16. Ingegnoli, V. (2011). Bionomia del paesaggio. L’ecologia del paesaggio biologico-integrata per la formazione di un “medico” dei sistemi ecologici. Springer-Verlag, Milano pp. XX+340.
  17. Ingegnoli V, Bocchi S, Giglio E (2017) Landscape Bionomics: a Systemic Approach to Understand and Govern Territorial Development. WSEAS Transactions on Environment and Development 13, pp. 189-195.
  18. Ingegnoli V (2001) Landscape Ecology. In: Baltimore D., Dulbecco R., Jacob F., Levi- Montalcini R. (Eds.) Frontiers of Life. New York, Academic Press Vol IV, pp 489-508.
  19. Ingegnoli, V (2002) Landscape Ecology: A Widening Foundation. Berlin, New York. Springer XXIII+357.
  20. Ingegnoli V, Giglio E (2017) Complex environmental alterations damages human body defence system: a new bio-systemic way of investigation. WSEAS Transactions on Environment and Development 170-180.
  21. Ingegnoli V, Giglio E (2005) Ecologia del Paesaggio: manuale per conservare, gestire e pianificare l’ambiente. Sistemi editoriali SE, Napoli pp. 685+XVI.
  22. Ingegnoli V. (2005) An innovative contribution of landscape ecology to vegetation science. Israel Journal of Plant Sciences 53: 155-166.
  23. Ingegnoli V, Pignatti S (2007) The impact of the widened Landscape Ecology on Vegetation Science: towards the new paradigm. Springer Link: Rendiconti Lincei Scienze Fisiche e Naturali, s.IX, vol.XVIII, pp. 89-122.
  24. ESA (2015) Air quality pollution. IUP, Heidelberg.
  25. Regione Lombardia (2021) Covid-19 Dashboard in Lombardy.
  26. Garson GD (2013) Correlation. Statistical Associates “Blue Book” Series Book 3.
  27. Bottaccioli F, Bottaccioli AG (2020) Psychoneuroendocrineimmunology and the science of integrated care, Edra, Milan.
  28. Ceccarelli S (2013) Produrre i propri semi. Manuale per accrescere la biodiversità e l’autonomia nella coltivazione delle piante alimentari. Libreria Editrice Fiorentina, Firenze.
  29. Ingegnoli V (2021) Enlighten the Intrinsic Relation Between Agricultural Landscape Health and Global Health. In: Raviglione M (coord.), Master on Global Health, Lesson on Disruption of Agrarian landscapes, slide 12 Unimi, Centre for Multidisciplinary Research in Health Science (Mach).
  30. Gogtay N, Giedd JN, Lusk L et al. (2009) Dynamic mapping of human cortical development during childhood through early adulthood. Proceedings of the National Academy of Sciences of the United States of America 101 (21), pp. 8174- 8179. [crossref]
  31. Li Q (2009) Effect of forest bathing trips on human immune function. Environ Health Prev Med 2010 Jan: 15(1):9-17. [crossref]
  32. Slavich GM, Thornton T, Torres LD, Monroe SM, Gotlib IH et al. (2009) Targeted rejection predicts hastened onset of major depression.Journal of Social and Clinical Psychology 28(2): 223–243. [crossref]
  33. Wild CP (2012) The exposome: from concept to utility. In: Int J Epidemiol 41:24-32. https://doi.org/10.1093/ije/dyr236. [crossref]