Abstract
We introduce a new approach to understanding the mind of people regarding the solution of social issues, an approach we title Projective Iconics. The objective is to understand the ‘mind’ of the respondent regarding the solution of a problem, using a projective technique incorporating Mind Genomics. Respondents were presented with a social problem: securing affordable access to medical help. The objective was to understand how they responded to the problem, based upon their reactions to test vignettes, combinations of names of 16 individuals. The names represented different positions of authority, personality, and behaviors. The vignettes were constructed by combining names to create a group of individuals tasked with the job of solving the issue. Each respondent rated 24 unique vignettes. Experiment 1 instructed the respondent to evaluate the likelihood that the group of individuals in a test combination could cooperate to discover a solution. The experimental design enabled the discovery between success and each of the 16 individuals, suggesting three clear mind-sets of respondents, respectively; those who believed that everyday individuals would solve the problem, those who believed that people in power would solve the problem, and those who believed that celebrity personages would solve the problem. When the dependent variable in Experiment 1 was ‘cooperate’, the segmentation into mind-sets was not as clear. Respondents in Experiment 2 estimated the likely total taxes needed to solve the problem, again select the expected taxes that the group in the vignette would levy. Three clusters emerged for responses using taxes as the dependent variables, but the clusters or mind-sets again were not as clear.
Introduction
The study of social problems is often done by what might be called ‘outside in.’ That is, the researcher wants to understand how the person undergoing the problem or situation feels, and constructs a questionnaire, or some other tool to observe behavior. The questionnaire poses a blockade between the researcher and the respondent. The researcher attempts to communicate the nature of the problem, whereas the respondent attempts both to understand the question, and to answer in the appropriate manner. The appropriate answer may be either a truly honest answer in the opinion of the respondent, or perhaps all too often an answer that is that which the researcher might wish to hear. These are so-called respondent or interview biases, better known colloquially as being ‘pc’, viz., politically correct [1-4].
The biases in such interviews are well known, causing the glibly offered remark that ‘one cannot believe what respondent say for many topics where emotion enters.’ In our increasingly polarized political and social environment biases have emerged in polling, so much so that there are difficulties in accurately stating issues without perhaps irritating some respondents. A world of emerging biases and problems might well imperil the development of social science and knowledge about the everyday, simply because people are becoming increasingly sensitized, due to the Internet in general, and social media in particular. A further factor is the ubiquitous survey, whether that be a long market research survey taking 20 minutes, or the irritating pop-up service for customer satisfaction about the transaction just completed. It seems that virtually every transaction seems to be followed by a request for information, and a subtle desire to be uprated.
With the advent of computer technology it is becoming increasingly easier to track a person’s behavior, especially on the Internet, but also where the person happens to be in terms of geography. Our cell phone has ‘location’ transponder, allowing both the offeror of services to know where we are for transactions, but also to know and to record where we are for further study, such geographical mapping of people who frequent certain stores. Such improvement in the science of measuring ‘behavior’ has also led to a different thinking. Rather than asking the respondent to give us opinions, measuring and summarizing the respondent’s behavior. It is no wonder that once we purchase something, we receive an unending set of advertisements on our cell phone to buy the same product, at specific store, located very close to where the person happens to be.
One major problem with both questionnaires and with behavioral tracking can be traced to the reality that the information is obtained by an outsider, who can be perceived to be invading a person’s private domain. When the issue is questionnaire or personal interaction, the respondent, may put up conscious or unconscious defenses, perhaps providing incorrect information. When the issue is behavior tracking, what a person does gives little information to what the person thinks in general about the topic, and certainly gives even less information about nuances of thought and feeling.
The Emerging Science of Mind Genomics May Address the Bias Problem
Mind Genomics refers to an emerging psychological science, founded on previous contributions in experimental psychology [5], mathematical psychology [6], personality psychology, specifically projective techniques such as the Rorschach Test [7], and finally using the metaphor of the MRI used in medicine [8].
The goal of Mind Genomics is to measure the values of internal ideas, internal thoughts, in a rigorous way, appropriate to the topic. The foundation of Mind Genomics comes from psychophysics the study of the relation between physical stimuli and subjective percepts. S.S. Stevens, the founding father of modern-day psychophysics suggested having the respondent act as a measuring instrument, to scale the perceived or subjective magnitude of a stimulus. These scaling methods reveal repeatable patterns describing the relation between the stimulus magnitude measured by instruments, and the subjective intensity measured by the person. Such information, generating what is called ‘Outer Psychophysics.’ In the same spirit, albeit with slightly different tools, Mind Genomics attempts to establish the parallel information, the relation between the inner idea and a subjective magnitude. This goal, called ‘Inner Psychophysics’, can be considered to the be the ‘UR story’, the foundation story for Mind Genomics. Psychophysics forms the foundation of measurement, but the story does not stop there.
The typical approach in science, psychophysics included, focus on isolating one factor or variable, occasionally two or three, and even sometimes four variables, changing the variable in a systematic way, measuring the response, and then describing the pattern. The pattern may be a change in the nature of the type of response (qualitative), or the magnitude of the response (quantitative) or both. In psychology, especially in the study of thinking and how we process the information of the everyday, the isolation of a single variable and measuring the response to systematically changed levels of that single variable is popular, but becomes problematic in the study of everyday life, i.e., in the study of the typical situations in which people find themselves. The everyday decisions, those of the ordinary life, involve the interaction of several variables. Studying one variable at time may be fine for artificial laboratory situations but is not fine for the study of common decision-making, for example voting for a political candidate, or buying a product, respectively. The research to study everyday must involve the study of combinations of variables, such combinations created according to an underlying set of procedures called an ‘experimental design’ [9]. In mathematical psychology and in subsequent applications by marketers the focus on one variable at a time has evolved to the focus on several variables simultaneously interacting [6,10]. The approach is called conjoint measurement. It is conjoint measurement which constitutes the second leg of the emerging science of Mind Genomics.
The third ‘leg’ of the Mind Genomics science can be found in the world of projective techniques [11]. The experimental design used by Mind Genomics allows the researcher to present many combinations of independent variables to the respondent, who is instructed to treat the combination as a single idea, a single proposition, and rate that entire proposition on a scale. For the study reported here, one group of respondents evaluated combinations of messages, specifically names of individuals or groups, on the likelihood that the whole group described in the test stimulus could solve a particular social problem, defined as ‘access to medical care.’ The other group were shown the same combinations of messages but instructed to rate the incremental or decremental amount of TAXES that the group would impose on the population to solve the problem.
The final, fourth leg of the research was the creation of a general picture of the mind of the consumer, done by putting together all the combinations, and creating a single equation or model showing how each of the elements drives either the likelihood of solving the problem ((Experiment #1) or how much of an increase in taxes each element would incur to solve the problem (Experiment #2I). The metaphor for this fourth leg is the MRI, magnetic resonance imaging, which takes many pictures of the underlying stimulus, pictures from different angles, and then recombines them afterwards, using a computer program to assemble them into one three-dimensional image [8].
The Two Mind Genomics Studies – Problem/Solution and Taxes
The studies reported here were occasioned by the discussions among the authors on different occasions about the need to systematize social science research, and if possible, bring to it the rigors of experimentation such as those found in experimental psychology, and especially in psychophysics. The notion was to create an integrated database, with the researcher empowered to investigate a range of ‘topics’, here ‘social issues,’ with the same tools, in a manner that might be called ‘industrial-scale research.’ Most of the research to which the authors had been introduced to, and had practiced, required meticulous attention to detail, and were studies which were complete in and of themselves, with very tenuous connections to other data collected by researchers on the same topic. The authors were aware of review papers, which attempted to pull together the diverse and divergent research efforts over many years, and by so doing create a structure by which to better understand the area. These are called review papers or the meta-analyses.
Mind Genomics provides an entirely different approach to the problem, an approach which lends itself to scalability in terms of application to many different problems, generating common data, and inspiring the research to create a ‘data warehouse.’ The governing vision in this study was to apply the Mind Genomics paradigm, explained below, to understand aspects of access to medical care, from the mind of the citizen consumer. As will be explained below, the same approach could be, and indeed was, applied to investigated 26 other social and economic problems. The current paper is just the first of a set of 27 integrated pairs of studies. of the same type.
The Mind Genomics Paradigm Explicated Using the Data Front the Two Studies
Mind Genomics studies follow a simple paradigm, making the research almost programmatic, so-called ‘cookie-cutter’ by those who feel that the acquisition of knowledge in research cannot or should be done in an industrial fashion, viz., scaled-up, rapid, efficient, and inexpensive. Although there are many researchers who frown upon ‘cookie-cutter’ research, feeling that each study must be unique as well as elegant, the value of a standardized, templated, quickly executed method should not be underestimated. The steps below, applied and executed less than 24 hours, from start to finish, provides the researcher with a rare opportunity to create a useful database which addresses many existing questions, opening new vistas by revealing hitherto unexpected patterns in the way people can be shown to ‘think’ about a topic.
Step 1 – Identify the Topic
This step identifies the problem. The actual task is harder than it may sound. We are not accustomed to thinking in terms of tight, limited scopes. The topic here is improving access to medical care at an affordable price.
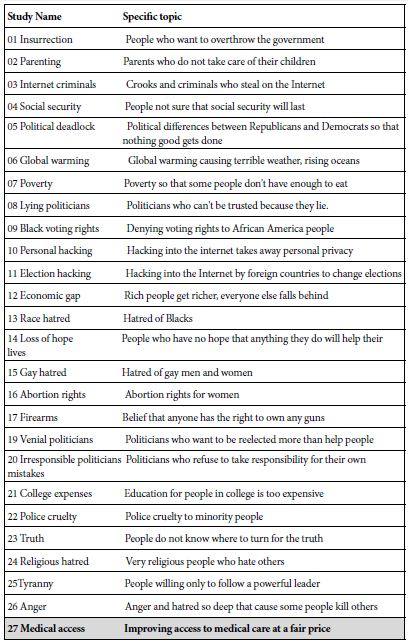
The study reported here comes from a set of 27 studies on problems, all run in the same way. Table 1 shows the list of the problems, and the language used for each. The structure of analysis for this study shows what can be learned from virtually a superficial plunge into the data analysis, viz., the results which lie at the surface.
Table 1: The topics or problems originally comprising the set of issues to be investigated using this one study.
Step 2: Create Four Questions Which Tell a Story, and Four Answers to Each Question
The study here on access to medical care does not lend itself easily to the question-and-answer format. Rather, the strategy is to identify four groups of authorities, these authorities being of different kinds. Each authority takes the place of a question. Each of the four specific individuals or groups takes the place of an answer. Table 2 shows the four general groups of authorities, and the four specifics for each authority.
Table 2: The raw material, comprising the four types of authorities, and the four specifics within each type.
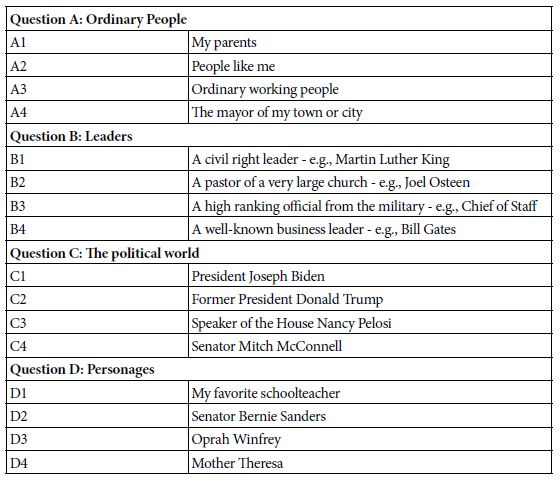
The use of common symbols, viz., people, was done to explore the potential of moving beyond the typical research approach which often use factual descriptive phrases as elements or answers to the questions. Instead, the objective here was to use ‘cognitively-rich’ stimuli, without explanation, allowing the respondent to link these stimuli with the question. The approach here took as its origin the work relating color to feeling, and to the psychophysical method of ‘cross-modality matching,’ where the respondents adjust the perceived intensity of one continuum (e.g., the loudness of sounds) to match the perceived intensity of another continuum (e.g., the brightness of lights). That breakthrough in psychophysics, first reported in the early 1950’s, almost 70 years ago, stimulated the conjecture that perhaps one could match problems to people in a similar way [5].
Step 3: Create a Set of Combinations Using the Principles of Experimental Design
Step 3 creates combinations of the four types of elements (A1-A4, B1-B4, C1-C4, D1-D4). Experimental design was used to create 200 different sets of test vignettes. Each set of test vignettes conformed to the same experimental design, but the elements in the design were permuted, keeping the basic structure of the design, albeit with different combinations [9,12].
Each vignette comprised a specific combination of 2-4 answers or elements, with at most one answer element from a question, but often with no answers. The vignettes were thus not all complete, although the 24 systematically varied combinations comprised a complete experimental design. Each element of the 16 appeared exactly five times in the 24 combinations and was absent 19 times in the 24 combinations. The combinations were set up so that the 16 elements were statistically independent of each other.
These set-up efforts permit the researcher to analyze the data from one respondent as easily as analyze the data from 100 respondents, since at the most granular level each respondent’s data matrix can be analyzed by itself, using standard methods, such as OLS (ordinary least-squares) regression. It will be that property of each respondent’s data following its own complete experimental design which will allow the researcher to create individual-level models, and cluster or group the respondents based upon the pattern of their coefficients. The computer requires the format shown in Table 3 to apply the method of OLS (ordinary least squares) to deconstruct the ratings (or the transformed ratings, see below) into the contributions of each element.
Table 3: Example of three vignettes, combinations of elements, and their recoding into 16 independent variables. For the recoding 1=present, 0 = absent.
| Combination | A1 | A2 | A3 | A4 | B1 | B2 | B3 | B4 | C1 | C2 | C3 | C4 | D1 | D2 | D3 | D3 | D4 | |
| 1 | A1 B4 C4 D4 | 1 | 0 | 0 | 0 | 0 | 0 | 0 | 1 | 1 | 0 | 0 | 0 | 0 | 0 | 0 | 0 | 1 |
| 2 | A1 B3 D1 | 1 | 0 | 0 | 0 | 0 | 0 | 1 | 0 | 0 | 0 | 0 | 0 | 1 | 0 | 0 | 0 | 0 |
| 3 | A4 B4 C1 D4 | 0 | 0 | 0 | 1 | 0 | 0 | 0 | 1 | 1 | 0 | 0 | 0 | 0 | 0 | 0 | 0 | 1 |
Table 3 shows an example of three of the 24 combinations that a respondent will evaluate. The respondent sees actual combinations rather than the combinations. It is at this point that the Mind Genomics paradigm diverges from the more conventional approaches, by assigning each respondent to a different design. This approach differs dramatically from the typical methods in science, which focus on averaging out variability by evaluating the same limited set of stimuli with many respondents, until the mean becomes stable. The Mind Genomics worldview is more like that of the MRI, magnetic resonance imagery. Each experimental design becomes a snapshot. At the end of the study, the modeling combines these snapshots to produce a coherent whole incorporating all the different ‘views’ of the same underlying object being investigated. In our study that ‘object’ is the way people react.
Step 4: Create a Short Introduction to the Topic and Provide a Rating Scale
The introduction should present as little information as possible. Instead of formulating the entire situation in the introduction, the researcher should let the elements themselves, the different groups and individuals to provide the necessary information on which the respondent will assign a judgment. Table 4 shows the orientations for the two experiments, the first study dealing with the ability to cooperate and solve the problem, the second with the expected taxes. Table 4 also shows the rating scale for each study. The rating scale is how the respondent communicates her or his feelings about what has been read. The first experiment allows for five possible responses. These will be subsequent deconstructed to yield four scales, only one of which will be of interest here, the ability to solve the problem. The second experiment, focusing on taxes, uses a more traditional scale, dealing with the expected increase in taxes. There are five options here as well. The options are not in simple order, but rather presented in irregular order, forcing the respondents to give some thought to the issue. Respondents are prevented from simply using the scale as one of magnitude, where the five points are equally spaced, and in order.
Table 4: The two questions and the rating scales.
| What will happen when these people work together to solve this problem: Improving access of everyone to good medical care without paying an unaffordable price |
| 1=Cannot cooperate … and … No real solution will emerge |
| 2=Cannot cooperate … but … Real solution will emerge |
| 3=Honestly cannot tell |
| 4=Can cooperate … but … No real solution will emerge |
| 5=Can cooperate … and … Real solution will emerge |
| What will happen to our FEDERAL TAXES when these people work together to solve this problem: Improving access of everyone to good medical care without paying an unaffordable price |
| 1= 19% increase in Federal Tax |
| 2= 0% increase in Federal Tax |
| 3= 27% increase in Federal Tax |
| 4= 7% increase in Federal Tax |
| 5=11% increase in Federal Tax |
Step 5: Follow the Templated Process
Create combinations of vignettes according to an underlying experimental design, present these combinations to the respondents, and obtain both a rating on the appropriate scale, and record response time. Response time is the time between the appearance of the vignette and the assignment of the response by the respondent on the 1-5 scale. The template makes it possible for the researcher to set up a study with 20-30 minutes, launch the study, and have the data back with 30-60 minutes, with the results analyzed.
The important things to keep in mind while doing the experiment revolve around the shift in thinking from confirming one’s hypotheses (the hypothetico-deductive approach) to creating what might be best called a ‘cartography of the mind.’ There need not be any formal hypothesis One is simply measuring responses to variations of stimuli, to identify which variations, which features, drive the responses.
Step 6: Transform the Data
The two rating scales provide information, but the ratings must first be transformed to allow for subsequent analysis by modeling and clustering.
Scale #1, for attitude (cooperate and solve the problem) can be transformed in at least two ways. One way is to create a binary scale for solving the problem. In that case, ratings 1, 2 and 3 are converted to 0 to denote that the problem cannot be solved, whereas ratings 4 and 5 are converted to 0 to denote that the problem can be solved. A second way is to create a binary scale for cooperation. In that case the ratings are converted in a different fashion. Ratings 2 and 5 are converted to 100 to denote that the groups in the vignette can cooperate, whereas ratings 1, 3 and 4 are converted to 0 to denote that the groups in the vignette cannot cooperate to solve the problem.
Our focus in this analysis is on the ability to solve the problem, so that the first transformation is followed, with ratings 1, 2 and 3 transformed to 0, and ratings 4 and 5, in turn, transformed to 100. A small random number, < 10-4, is added to each rating, after transformation. The small random number does not affect the analysis but ensures necessary variation in the dependent variable in the situation where a respondent assigns all vignettes ratings which all end up either 0 or 100, respectively.
Rating scale #2, for tax, is transformed to the relative tax values, in percent. Thus no increase in tax would be transformed to 100, to denote 100% of current taxes. A 27% increase in tax would be transformed to 127, to denote 127% of current taxes.
The transformations provide two types of information. The first is a no (0) or a yes (100), appropriate for the ratings of the first of the two experiments. There is no sense of magnitude, just of no/yes. The second is a magnitude of the effect.
We can get a sense of the basic interest in the data by comparing averages across respondents. Figure 1 (top) shows the distribution of beliefs across the different vignettes that the access problem can be solved. Each filled circle corresponds to one of the 102 respondents. The figure is not particularly interesting. What will be more interesting will be the linkage of the solution to the individuals. In contrast, Figure 1 (bottom), far more interesting, gives a sense of the average impact on the tax expected across a variety of different individuals who would get involved in the effort to provide access. Figures of the type shown here are of basic interest because they deal with a simple quantity, taxes.
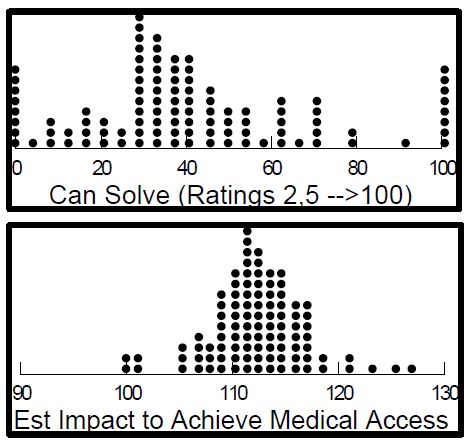
Figure 1: Distributions of average transformed ratings. The top panel shows the averages across 102 respondents for the belief that the group can solve the problem of affordable access to medical care. The bottom panel shows the average taxes (vs current) to achieve the goal of affordable access to medical care.
Step 7: Build Equations Using OLS (Ordinary Least Squares Regression), without an Additive Constant
At both a group level, and at a respondent level, relate the presence/absence of the 16 elements to the transformed rating of able to solve the problem (study #1), or expected increase in taxes (study #2). For these studies, a single form of the OLS regression was used, one without an additive constant. The rationale for using the equation in without the additive constant is from the desire to compare coefficients across studies (solve the problem vs taxes), and to compare coefficients across transformations (solve the problem versus cooperate).
It is important to note that the pattern of coefficients is similar (high correlation) when one estimates the coefficients using an equation which has the additive constant, versus an equation which is absent the additive constant. The same patterns emerge but the magnitudes of the coefficients differ, being large for the equations lacking the additive constant.
Experiment #1 – Cooperate/Solve (ratings 4 & 5 transformed to 100): Binary Rating = k1A1 + k2A2 + k3A3…K16D4
Each coefficient shows the incremental (or decremental) proportion of responses driving the binary rating. Thus, a coefficient of +15 means that when the element is included in the vignette, 15% more of the responses are 4 or 5. High coefficients suggest strong drivers of the solution; low coefficients suggest weak drivers of the solution.
Experiment #2 – Taxes: Percent of Current Taxes = k1A1 + k2A2 + k3A3 …. K16D4
Each coefficient shows the incremental (or decremental) percent of taxes to be expected when the specific element (individual) is included in the group.
When the analysis is done at the group level, all respondents incorporated into the model, the coefficients are relatively low. For models or equations computed without the additive constant, coefficients around 16 or higher are considered ‘statistically significant’. Comparable elements in models estimated with an additive constant require a value of +8, or higher, just about half.
Table 5 suggests ranges coefficients, but few reaching statistical significance. More important, there are no clear patterns. The patterns will emerge from segmenting the respondents. For response time, only one element generates a long inspection time, A4, the mayor of my city. It is also clear that, at least for the total panel, response time does not covary with the coefficients of the elements.
Table 5: Coefficients from the experiments. The columns correspond to the dependent variables.
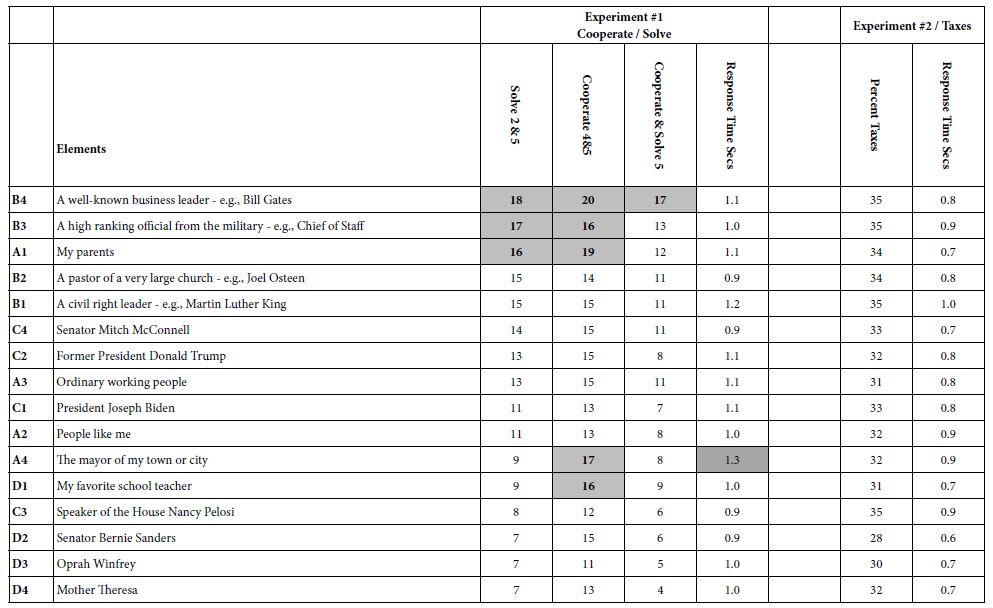
Table 5 also shows response times, based upon using the above models to relate the presence/absence of the 16 elements to the response time. The response time was measured along with the respondent’s rating, allowing OLS regression (without the additive constant) to relate the presence/absence of the elements to the response time. Table 5 no clear relation between coefficients for either cooperate or solve, and coefficients for response time in seconds, although the response time for older respondents was longer than the response time for younger respondents, confirming previous findings for response time versus age [13,14].
Step 8: Cluster the Respondents into a Limited Set of Groups Whose Patterns of Coefficients within a Group are Like Each Other
Clustering is a well-accepted procedure in statistics. Our 16 coefficients for each respondent give us a sense of how the respondent feels about either the ability of the individual/group to solve the problem (experiment #1), or the expected change versus current in the taxes one will incur to solve the problem (experiment #2).
The clustering method used here is called k-means clustering [15]. Clustering puts objects into a limited set of groups based upon the statistical criteria set up at the start of the study. The criteria here was to minimize the ‘distances’ within a cluster, and to maximize the distances between the centroids of the clusters, these being the centroids or average coefficient values of the 16 elements. The measure of distance, D, is defined as the quantity (1-Pearson Correlation Coefficient). The quantity D has the lowest value of 0 when the correlation coefficient is 1 (1-1 = 0), and the highest value of 2 when the correlation coefficient is -1, viz. the two patterns are exactly opposite (1- – 1 = 0).
The clustering was done three times:
a. Cluster the respondents on the basis of pattern of the 16 coefficients estimated for “solve the problem” (Experiment #1).
b. Cluster the respondents using the pattern of the 16 coefficients estimated for “cooperate together” (Experiment #1).
c. Cluster the respondents using the pattern of expected taxes for the 16 individuals (Experiment #2).
Step 9: For each Clustering, Extract Three Mind-sets Based on the Pattern of Coefficients
Tables 6 and 7 show the sorted coefficients from Experiment 1, attitudes. Only positive coefficients are shown, with strong performers shown in green. The cut-point for a strong performing element is a coefficient of 16 or higher, corresponding to the coefficient of +8 or higher for those models or equations estimated with an additive coefficient.
Table 6: Coefficients of the 16 elements, based upon clustering ‘who will solve the problem’ (ratings 2 and 5 transformed to 100).
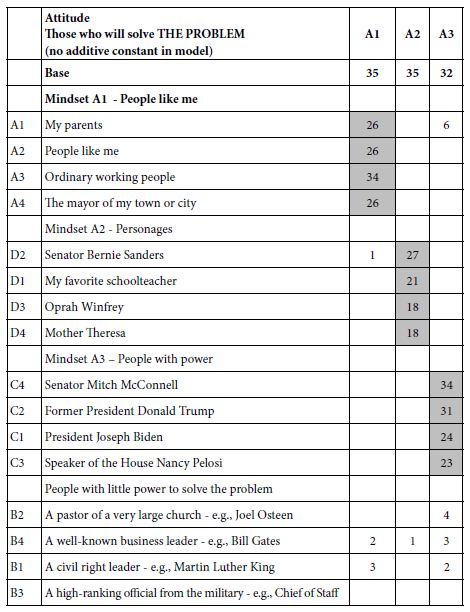
Table 7: Coefficients of the 16 elements, based upon clustering ‘who will be able to collaborate to solve the problem’ (ratings 4 and 5 transformed to 100).
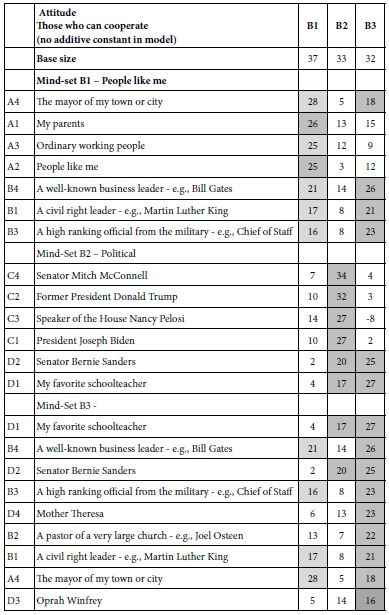
The clustering reveals three clearly different mind-sets emerging from clustering based on the perceived ability to solve a problem. In contrast, the three mind-sets created from the estimated ability to cooperate. The clarity of mind-sets for solving problems contrasts with the rather noisy mind-sets emerging from cooperation.
Table 8 (top) shows the expected percent of taxes attributed to each of the elements, sorted by the highest to the lowest increases. Table 8 (bottom) shows the same data, the same data, this time sorted from bottom up. The mind-sets moderately clear, but not as well defined as the mind-sets emerging from clustering ability to solve problems, but far clearer than the mind-sets emerging from clustering cooperation.
Table 8: Expected percent of taxes to be levied by each of the individuals, responding to the need to provide affordable medical care to the population
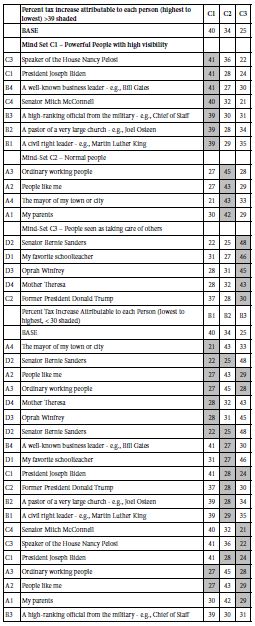
The preparation of the tables was done with the taxes themselves, assigned to each vignette, with the tax replacing the rating number. This means that one can add up the coefficients for the taxes to estimate the relative tax to be levied to solve the problem. As an example, consider mind-set C1. These respondents feel that three groups involved, C3 (Nancy Pelosi), B3 (Working with a high-ranking official from the military – e.g., Chief of Staff), and with A pastor of a very large church – e.g., Joel Osteen, would incur a relative tax of 41% +41% + 39% or 121% of current taxes.
Consider now the response of mind-set C2 to these same three individuals. The relative taxes would be 36 + 30 + 28 or 94%, viz., 94% of current taxes, a 6% tax reduction!
Finally, consider now the respondent of mind-set C3 to these same three individuals. The relative taxes would be 22% + 30% + 34% viz, 86% of current taxes, a 14% tax reduction!
Discussion
The typical approach to social problems involves questionnaires, which allow the respondent to think about the issue in a rational way. To a great degree these suffer from biases of expectation, and political correctness, where the respondent provides an answer consistent with a predetermined from of reference, or an answer that feels intuitively ‘acceptable’. People are sensitive to interviewers, and often want to know the ‘right answer’ even when the interview or survey is conducted on the web, in total privacy. The desire to get the right answer, to outguess and perhaps outfox the researcher, muddies the waters. The respondent may not be able to state at a conscious level that she or he was trying to ‘outguess’ the interwar, but such behavior is far more common than one thinks. In such cases strict controls in design and execution must be taken.
To address the issue of expectations, the development of Mind Genomics began with the presentation to the respondent what the words of Harvard’s noted psychologist, Wm James, might call a ‘blooming, buzzing confusion.’ The combinations seem to be haphazard, but they are not. Furthermore, in study after study the data appears to be meaningful and consistent, making a great deal of sense, and in the words of the research community, ‘telling a coherent story.’ The approach of using these combinations of messages.
This paper moves one step beyond the traditional Mind Genomics studies. Rather than providing simple statements of fact, the study uses names of people. The names themselves carry rich meanings to the individuals. The respondents are not asked to decide based upon intellectual factors. Rather, the respondents are asked to give their ‘gut feel’ based upon the feeling of a set of names with complex meaning. The consequence of the approach is a new way of looking at people and thinking. The objective is to move beyond conscious, purpose-driven evaluations of single ideas, and instead move towards the complexities of everyday life, where decisions are made. Only time will tell whether this incorporation of psychophysics, experimental design, personality psychology, and consumer research methods can live up to the potential of becoming a new way to measure the minds of people for topics that can be considered important parts of ordinary life.
References
- Alvesson M (2010) Interpreting Interviews. Sage.
- Berinsky AJ (2018) Telling the truth about believing the lies? Evidence for the limited prevalence of expressive survey responding. The Journal of Politics 80: 211-224.
- Eckman S, Koch A (2019) Interviewer involvement in sample selection shapes the relationship between response rates and d&and Lucchina, L.A., 2016. The color of emotion: A metric for implicit color associations. Food Quality and Preference 52: 203-210. [crossref]
- Western S (2016) Political correctness and political incorrectness: A psychoanalytic study of new authoritarians. Organisational and Social Dynamics 16: 68-84.
- Stevens SS (1975) Psychophysics: Introduction to its Perceptual, Neural and Social prospects. John Wiley & Sons.
- Luce RD, Tukey JW (1964) Simultaneous conjoint measurement: A new type of fundamental measurement. Journal of Mathematical Psychology 1: 1-27.
- De Vos GA, Boyer LB, Borders O (1989) Symbolic Analysis Cross-Culturally: The Rorschach Test. Univ of California Press.
- Chalah MA, Kauv P, Lefaucheur JP, Hodel J, Créange A, et al. (2017) Theory of mind in multiple sclerosis: a neuropsychological and MRI study. Neuroscience Letters 658: 108-113. [crossref]
- Box GE, Hunter WH, Hunter S (1978) Statistics for Experimenters, New York: John Wiley and Sons 664.
- Green PE, Krieger AM, Wind Y (2001) Thirty years of conjoint analysis: Reflections and prospects. Interfaces 31: S56-S73.
- Goertz G, Mahoney J (2013) Methodological Rorschach tests: Contrasting interpretations in qualitative and quantitative research. Comparative Political Studies 46: 236-251.
- Gofman A, Moskowitz H (2010) Isomorphic permuted experimental designs and their application in conjoint analysis. Journal of Sensory Studies 25: 127-145.
- Hultsch DF, MacDonald SW, Dixon RA (2002) Variability in reaction time performance of younger and older adults. The Journals of Gerontology Series B: Psychological Sciences and Social Sciences 57: 101-115. [crossref]
- Wason PC (1959) The processing of positive and negative information. Quarterly Journal of Experimental Psychology 11: 92-107.
- Dubes R, Jain AK (1979) Validity studies in clustering methodologies. Pattern Recognition 11: 235-254.