Monthly Archives: April 2020

Clinical Evidence on Apatinib in Treating Chemotherapy-Refractory Metastatic Esophageal Squamous Cell Carcinoma

DOI: 10.31038/JCRM.2020313

Abstract

Majority Chinese esophageal cancer patients are squamous cell carcinoma (ESCC) and with metastasis at initial diagnosis. Treatment for metastatic ESCC who failed first-line chemotherapy is an unmet medical need. Targeting human epidermal growth factor receptor 2 (HER2) and vascular endothelial growth factor receptor 2 (KDR) have been approved to be effective for esophageal adenocarcinoma (EAC). We explored the clinical relevance of these molecular signaling in ESCC cohorts and collected clinical evidence on applying apatinib, a Chinese FDA-approved KDR inhibitor for late-stage gastric carcinoma, in 26 patients with chemotherapy-refractory metastatic ESCC. The clinical response rate and disease control rate of these patients to apatinib 500mg once daily regimen was 12% and 60%, respectively. The patients’ median progression-free survival time (PFS) was 3.2 months (95% CI, 2.23-4.17 months) and overall survival time (OS) was 5.3 months (95% CI, 4.46-6.14 months). The commonest grade 3-4 treatment related adverse events included leukopenia (7.7%) and anemia (7.7%). No drug-related death occurred. In conclusion, apatinib has favorable activity and acceptable safety, and could be a new treatment option for patients with chemotherapy-refractory metastatic ESCC.

Keywords

apatinib, chemotherapy-refractory, metastatic, esophageal squamous cell carcinoma

Introduction

In China, esophageal carcinoma (EC) is the third most frequent cancer and the fourth leading cause of cancer death [1]. As it’s different from western countries where esophageal adenocarcinoma (EAC) is more common, 95% of the clinical pathological type of Chinese EC is squamous cell carcinoma (ESCC)[1]. Approximately 130,000 new cases of ESCCs are diagnosed annually in China and most of them are with metastasis at initial diagnosis [1]. Even for patients undergo surgery at an early stage, more than half of ESCCs proceed recurrence or metastases within 2-3 years [2]. Treatment of ESCC has not really changed for 30-40 years and primarily consists of chemotherapy [3]. Platinum or fluorouracil-based regimens are the first-line treatment for metastatic ESCC, with a median progression-free survival (PFS) less than 6 months [4]. No chemotherapeutic regimen has been defined for those who failed first-line chemotherapy.

Several targeted therapies have been approved for the treatment of EAC by the US Food and Drug Administration (FDA), including trastuzumab for human epidermal growth factor receptor 2 (HER2)-positive esophageal or gastric adenocarcinomas, and the anti-vascular endothelial growth factor (VEGF) receptor 2 (KDR) antibody ramucirumab either as a single agent or in combination with paclitaxel in the second-line setting. To explore the scientific rationale of these targeted strategy in ESCC, we did a comprehensive analysis of the expressions of HER2, KDR and VEGF in clinical ESCC cohorts in comparing to normal esophagus tissue. The results indicate that KDR and VEGF are consistently over-expressed in multiple ESCC cohorts, while the expression of HER2 is even downregulated in ESCC, suggesting a potential anti-KDR strategy for ESCC.

Apatinib was approved by Chinese FDA in 2014 for patients with latestage gastric carcinoma through targeting KDR. It has been reported to inhibit VEGF-mediated tumor microvascular density and tumor growth in ESCC cell lines and xenograft mice [5]. Some patients with advanced EC have tried various targeted drugs as a subsequent line treatment including apatinib [6, 7]. However, most of the studies were not stratified according to tumor histology, a systematic study focusing on the efficacy and safety of apatinib for the ESCC patient with chemotherapy-refractory metastasis is barely reported. In this regard, we conducted a retrospective study and investigated the efficacy and toxicity of apatinib in treating 26 patients with chemotherapy-refractory metastatic ESCC.

Methods

Bioinformatics data mining

GSE23400 dataset including 53 ESCC tumor samples and 53 adjacent paired normal esophagus samples [8] and GSE20347 dataset including 17 ESCC micro-dissected tumor samples and 17 matched samples from adjacent normal esophagus tissue [9] were used to analyze the mRNA expression and DNA copy number of HER2, KDR and VEGF in ESCC. GSE13898 dataset including 75 EAC samples from 64 patients and 28 paired normal esophageal samples [10] and GSE36458 dataset including 112 EAC and 45 normal tissue [11] were used to analyze HER2, KDR and VEGF expression in EAC. Analyses were performed using GEO2R with default settings.

Patients

This single-institution single-arm retrospective study was approved by the Ethics Committees of Henan Cancer Hospital and carried out in accordance with the Declaration of Helsinki. All patients provided written informed consent before participating in the study. Patients with chemotherapy-refractory metastatic ESCC received apatinib as subsequent line treatment between December 2015 and December 2016 were included. ESCC was confirmed histologically, and was surgically unresectable or recurrent. Metastasis in these patients were examined in lymph nodes, liver, lung or mediastinum. Patients had to have first-line chemotherapy failure before participating in the study. Treatment failure was defined as intolerable adverse effects or disease progression during treatment. Additional enrollment criteria were as following: at least one measurable lesion as defined by Response Evaluation Criteria in Solid Tumors (RECIST) version 1.1; Eastern Cooperative Oncology Group (ECOG) performance status of 0-2; a life expectancy of >12 weeks; and acceptable hematologic, hepatic, and renal function. Patients with uncontrolled blood pressure with medication (140/90 mmHg), or with bleeding tendency, or receiving thrombolytics or anticoagulants were excluded.

Treatment

Patients received oral apatinib 500 mg (Hengrui Pharmaceutical Co., Ltd., Shanghai, China) in tablet form once daily. A treatment cycle was 28 days. No local radiotherapy or interventional therapy was offered during apatinib dosing. Dose reduction was allowed one time to a dose level not lower than 250mg once daily. Dose re-escalation was not permitted. Patients continued treatment until disease progression or experienced intolerable toxicity or withdrew consent from the study.

Statistical analysis

Response was assessed according to the RECIST version 1.1 as complete response (CR), partial response (PR), stable disease (SD) or progressive disease (PD) in patients with measurable lesions. Tumor assessments took place every 8 weeks using computed tomography. Progression free survival (PFS) was measured from the initiation of apatinib to the occurrence of progression, or death without evidence of progression. Overall survival (OS) was measured from the first day of apatinib administration to the day of death or to the final day of the follow-up period. Survival curves for OS and PFS were estimated using the Kaplan-Meier method. Toxicities were graded according to the National Cancer Institute’s Common Terminology Criteria for Adverse Events (CTCAE) version 4.0. Safety analysis set consisted of all patients who received at least one dose of apatinib and completed the required safety data collection. Primary end points were safety and PFS. The last follow-up was performed on May 1, 2017.

Results

Gene expression of HER2, KDR and VEGF in EC cohorts

There are much less clinical annotated gene profiling datasets of EC than other common cancers. We chose four most comprehensive datasets (GSE23400, GSE20347, GSE13898 and GSE36458) with relative large sample size to evaluate the gene expression of HER2, KDR and VEGF in ESCC and EAC cohorts. As shown in Figure 1, EAC cohorts have consistently increased mRNA expression and DNA copy number of HER2 (P=0.038 and 8.51E-04, respectively), while only have over-expressed KDR (P=0.007) but not VEGF (P=0.194). In contrast, ESCC cohorts have consistently over-expressed KDR and VEGF (P=0.019 and 1.44E-07, respectively) but even downregulated mRNA and DNA copy number of HER2 (Log2 fold change = -1.037, and -2.164, respectively) (Figure 2). These results not only provided scientific supports to the anti-HER2 treatment strategy for EAC, but also may indicate the potential of anti-KDR strategy for ESCC.

JCRM-3-1-1-g001

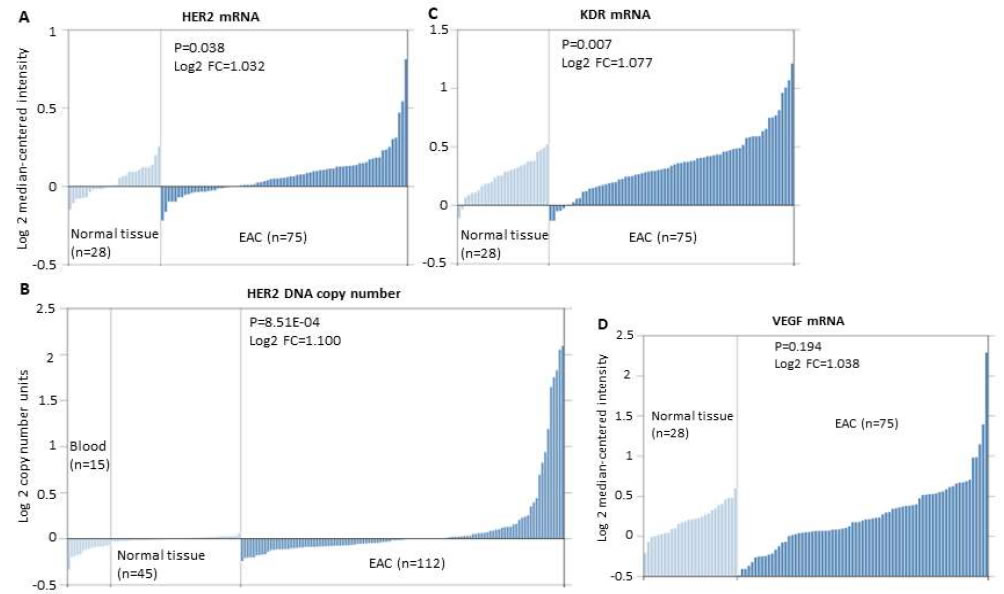
Figure 1.Expression of HER2, KDR and VEGF mRNA or DNA copy number in EAC vs. normal esophageal tissue in the GSE13898 (10) and GSE36458 (11) datasets. A. HER2 mRNA expression in EAC tissue (n=75) is significantly higher than that in the normal esophageal tissue (n=28). Log2 FC=1.032, P=0.038. B. HER2 DNA copy number in EAC tissue (n=112) is significantly higher than that in the normal esophageal tissue (n=45). Log2 FC=1.100, P=8.51E-04. C. KDR mRNA expression in EAC tissue (n=75) is significantly higher than that in the normal esophageal tissue (n=28). Log2 FC=1.077, P=0.007. D. VEGF mRNA expression in EAC tissue (n=75) and normal esophageal tissue (n=28). Log2 FC=1.038, P=0.194.

JCRM-3-1-1-g002

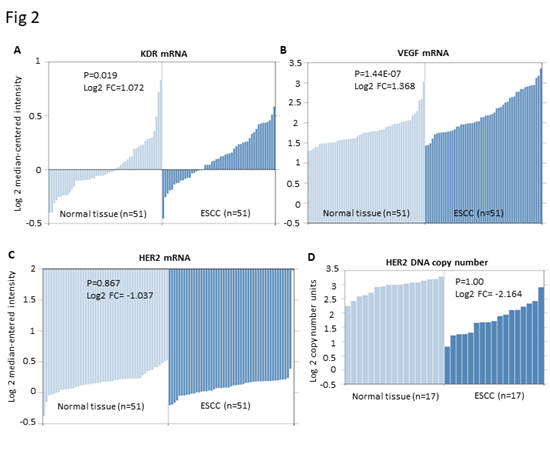
Figure 2.Expression of HER2, KDR and VEGF mRNA or DNA copy number in ESCC vs. normal esophageal tissue in the GSE23400 (8) and GSE20347 (9) datasets. A. KDR mRNA expression in ESCC tissue (n=51) is significantly higher than that in the normal esophageal tissue (n=51). Log2 FC=1.072, P=0.019. B. VEGF mRNA expression in ESCC tissue (n=51) is significantly higher than that in the normal esophageal tissue (n=51). Log2 FC=1.368, P=1.44E-07. C. HER2 mRNA expression in ESCC tissue (n=51) and normal esophageal tissue (n=51). Log2 FC= -1.037, P=0.867. D. HER2 DNA copy number in ESCC tissue (n=51) and normal esophageal tissue (n=51). Log2 FC= -2.164, P=1.00.

Patient characteristics

Between December 2015 and December 2016, 26 patients were enrolled in this study, and 5 patients were excluded because of ineligibility. The median age was 64 years (range: 48–75 years). Nineteen patients (73.1%) had good performance status, with an ECOG score of 0 or 1. Eight patients had esophagectomy and 18 patients had un-resectable primary ESCC. All patients had metastasis and the most common metastatic sites were lymph nodes (80.8%), liver (46.2%), lung (38.5%) and mediastinum (34.6%). All patients were failed to prior treatment: 17 patients received first-line chemotherapy and the other 9 patients received second-line chemotherapy. The baseline characteristics are summarized in Table 1.

Table 1.Baseline Patient Characteristics

N=26

Characteristic

No.

%

Sex

Male

17

65.4

Female

9

34.6

Age, years

Range

48-75

Median

64

ECOG Performance status

0

8

30.8

1

11

42.3

2

7

26.9

Prior chemotherapy

First line

17

65.4

Second line

9

34.6

Third line

0

0

Metastases

Lymph nodes

21

80.8

Mediastinum

9

34.6

Lung

10

38.5

Liver

12

46.2

Bone

4

15.4

Others

5

19.2

Esophagectomy

Yes

8

30.8

NO

18

69.2

Radiotherapy

Yes

12

46.2

NO

14

53.8

Abbreviations: ECOG: Eastern Cooperative Oncology Group

Toxicity

A total of 26 patients received at least one dose of apatinib and were included in safety analyses. All grade adverse events are listed in Table 2.

Table 2.Adverse Events graded based on CTCAE 4.0

Apatinib(N=26)

Adverse Events

Grade 1/2, n(%)

Grade 3, n(%)

Grade 4, n (%)

Hematologic

Leukopenia

8(30.8)

1(3.8)

1(3.8)

Neutropenia

6(23.1)

1(3.8)

Thrombocytopenia

4(15.4)

Anemia

10(38.5)

2(7.7)

Non-hematologic

Proteinuria

3(11.5)

Hypertension

6(23.1)

1(3.8)

Bleeding

2(7.7)

Esophageal fistula

1(3.8)

Fatigue

6(23.1)

1(3.8)

Appetite loss

9(34.6)

Nausea

7(26.9)

Vomiting

5(19.2)

Abdominal pain

  4(15.4)

Diarrhea

6(23.1)

Hand-foot skin reaction

3(11.5)

Hypoproteinemia

3(11.5)

Hypocalcemia

2(7.7)

1(3.8)

Liver function

Hyperbilirubinemia

4(15.4)

Elavatedtrasaminase

5(19.2)

Renal disorder

Creatinine clearance decrease

2(7.7)

Hypothyroidism

4(15.4)

1(3.8)

Others

 Heart failure

1(3.8)

Abbreviations: CTCAE, Cancer Institute’s Common Terminology Criteria for Adverse Events

The most common adverse events are grade 1 to 2 and manageable. For seven patients, apatinib was reduced to 250mg daily. The main reasons for dose reduction were appetite loss, fatigue, hypertension, hypothyroidism and renal function impairment. The most common grade 3 side effects included hypertension (3.8%), fatigue (3.8%), esophageal fistula (3.8%), hypocalcaemia (3.8%), hypothyroidism (3.8%) and heart failure (3.8%). Two patients withdrew the study because of grade 3 esophageal fistula and acute heart failure. Except for 1 patient who had grade 4 leukopenia, no other grade 4 toxicities were observed. One patient died of injuries after receiving 24 days of apatinib treatment. No drug-related death was observed.

Treatment efficacy

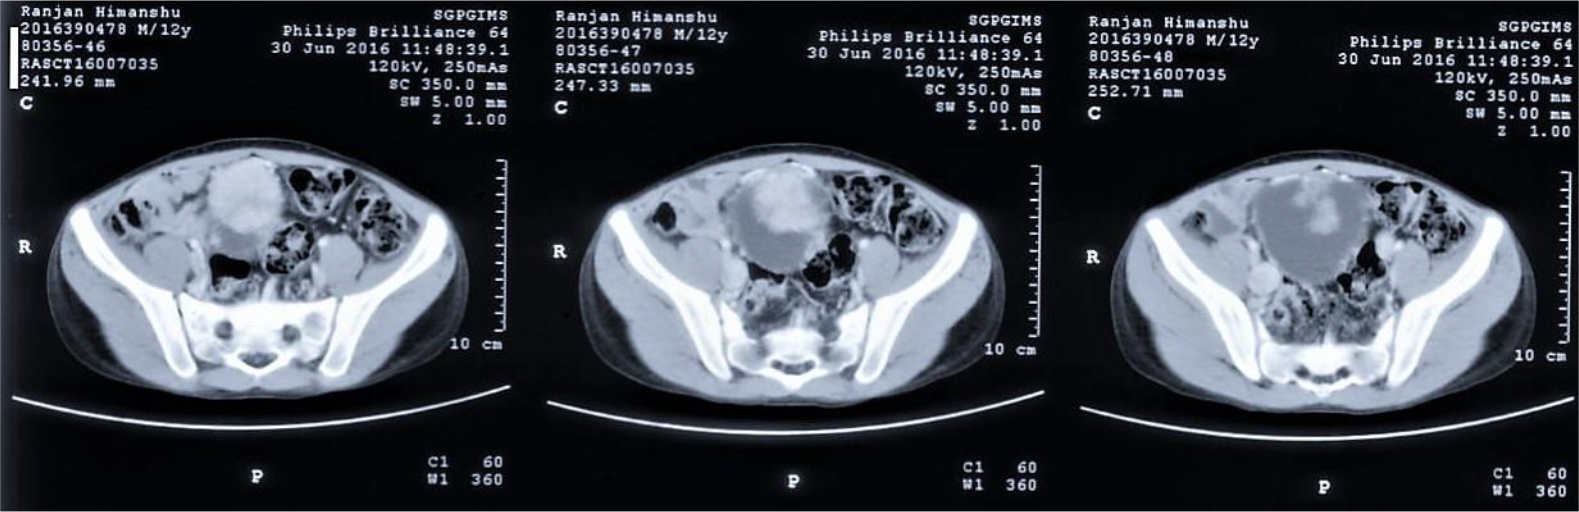
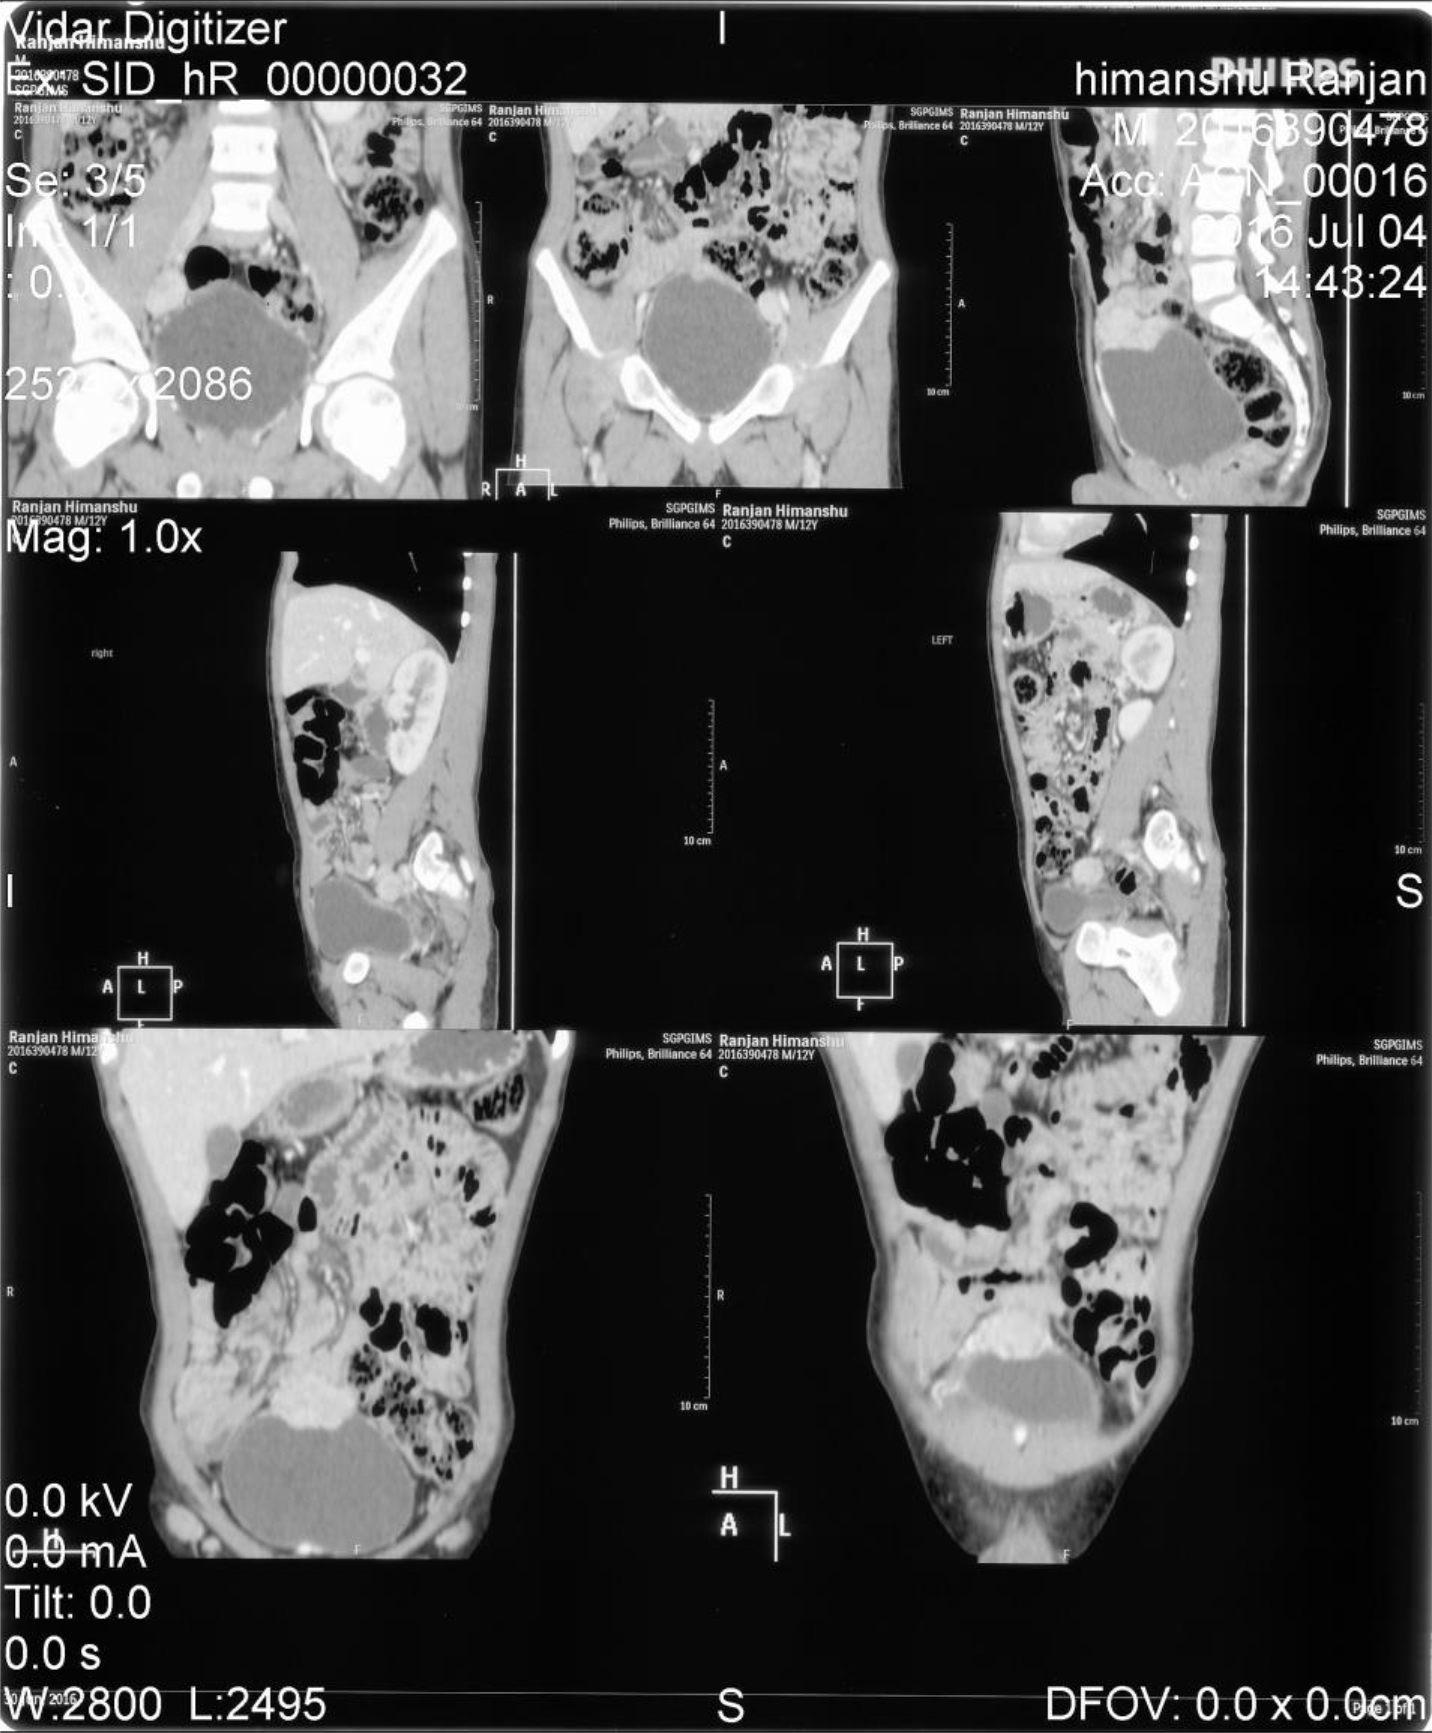
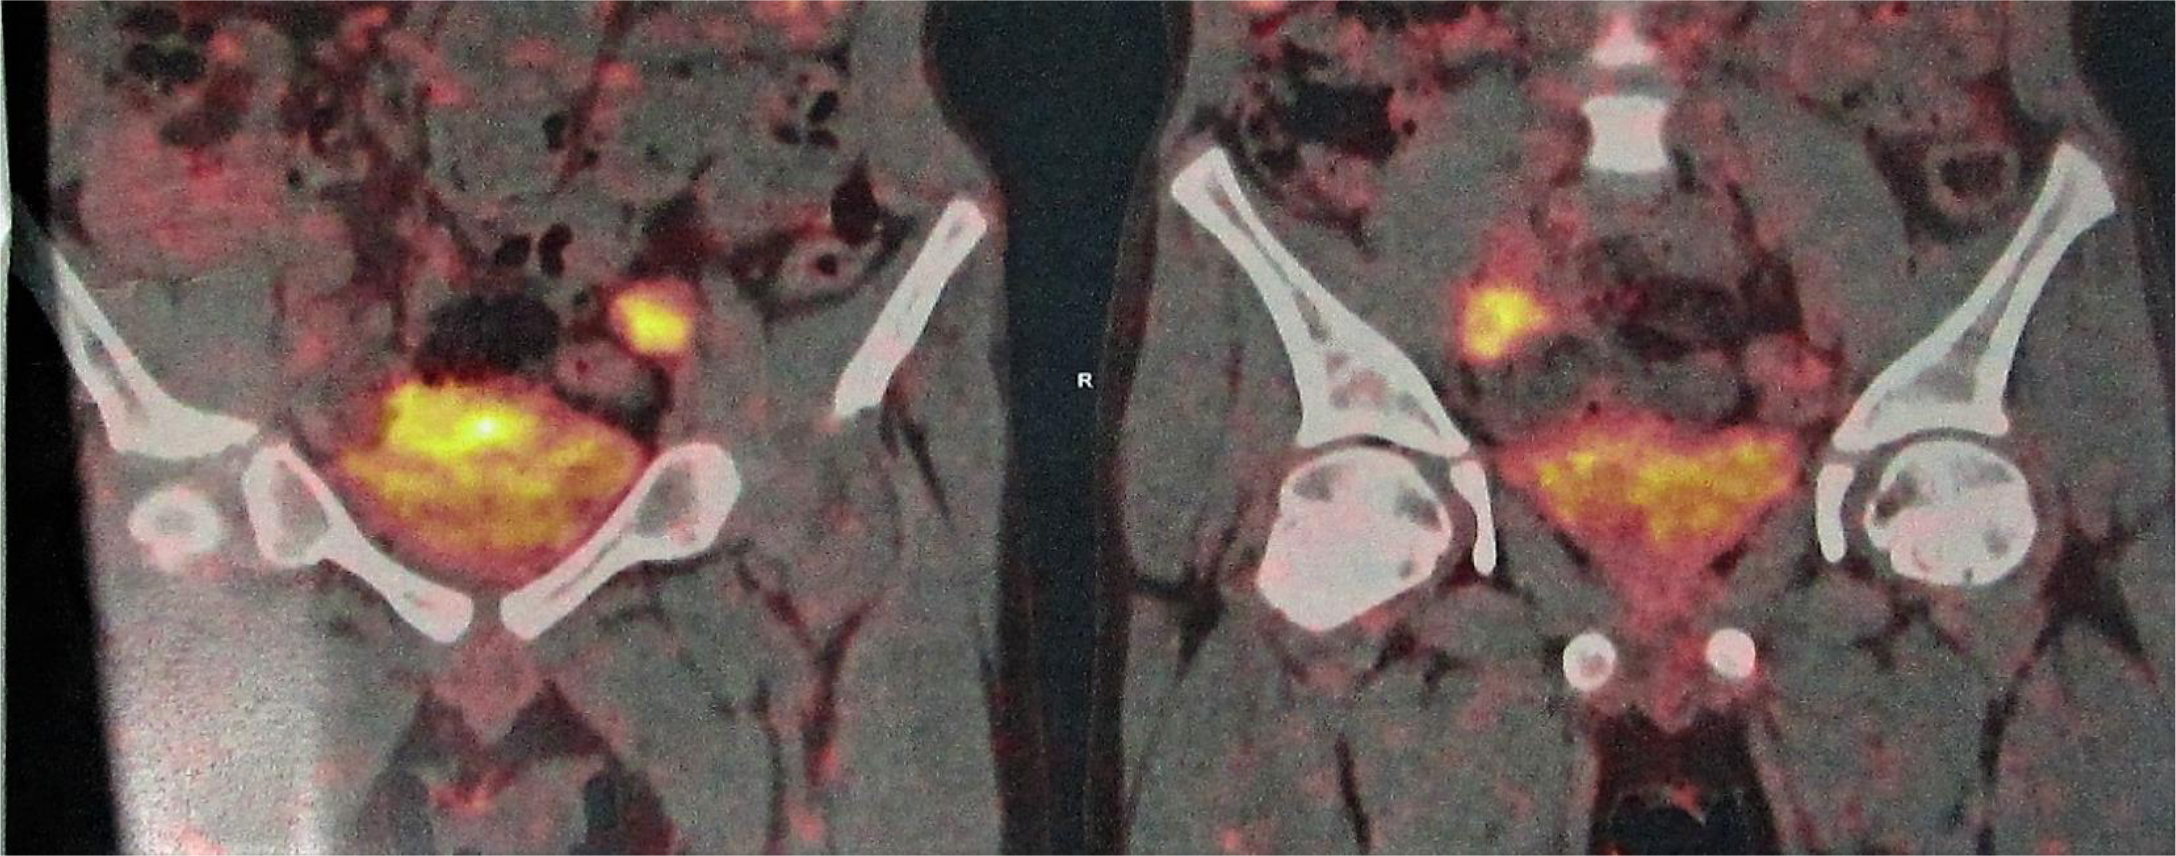
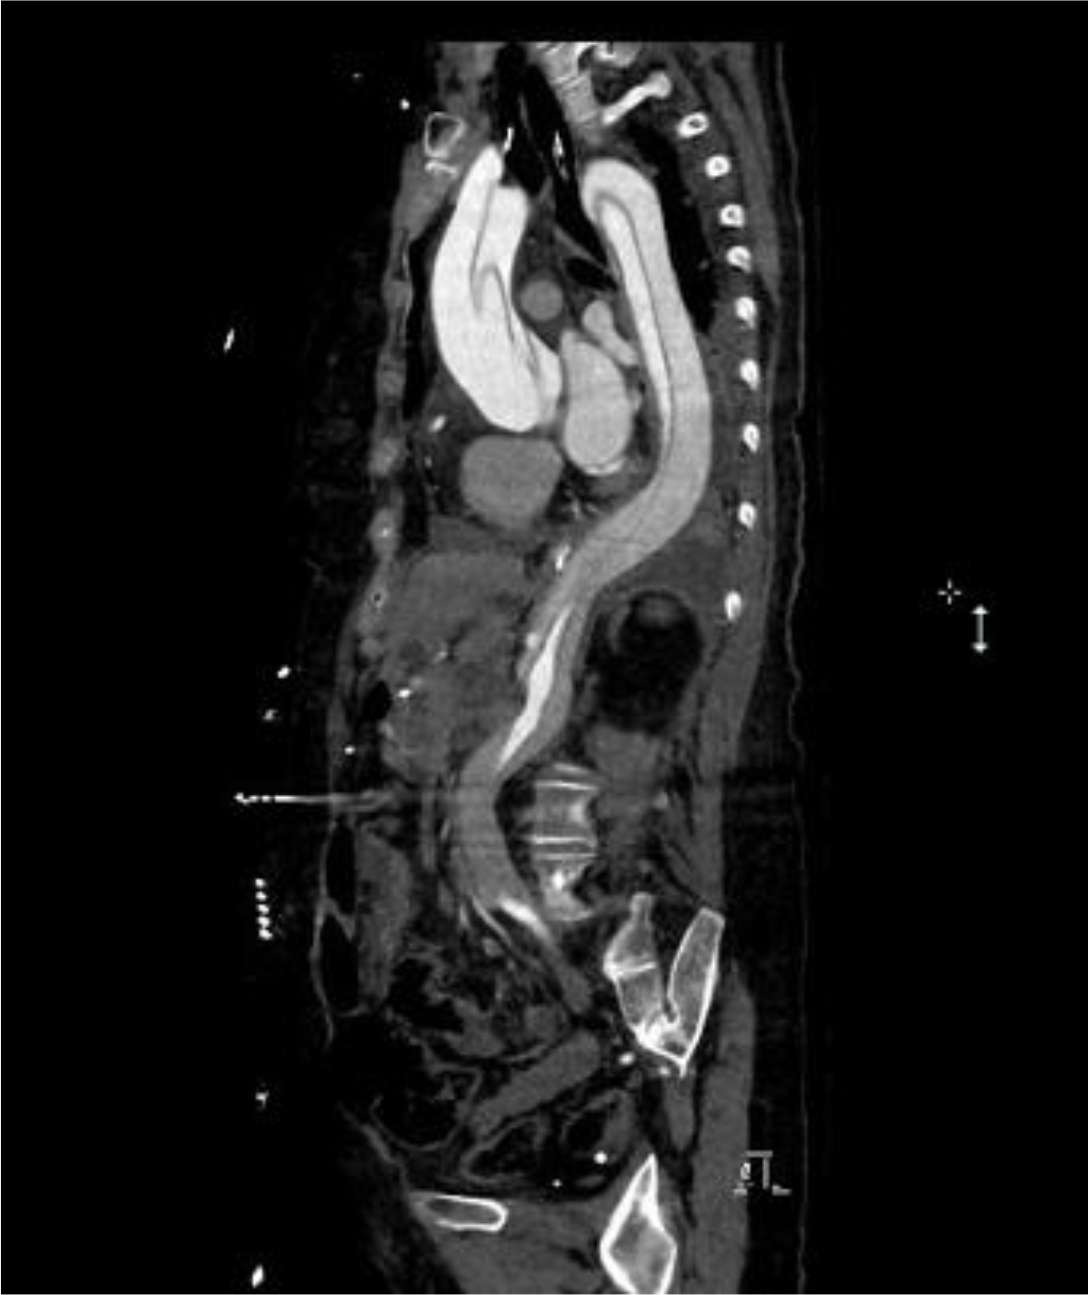
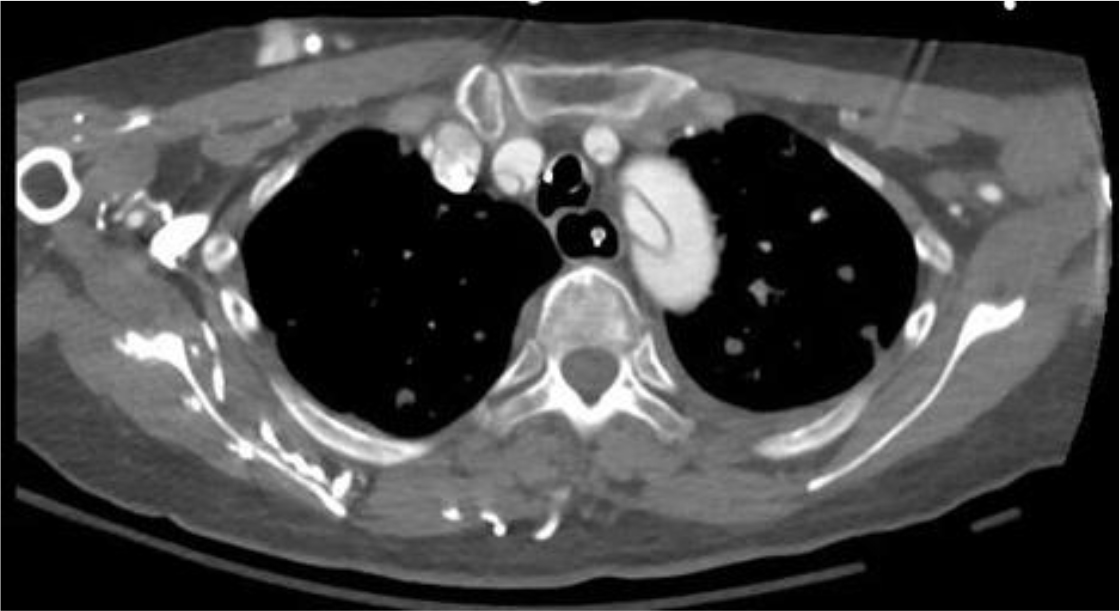
Of the 25 evaluable patients, PR was observed in 3 patients (12%) and SD was observed in 12 patients (48%). No patients met CR. Ten patients (40%) experienced disease progression. The overall response rate (ORR) and disease control rate (DCR) was 12% and 60%, respectively (Table 3). The median PFS of all 26 patients was 3.2 months (95% CI, 2.23-4.17 months) (Figure 3) and OS was 5.3 months (95% CI, 4.46-6.14 months) (Figure 4). We noted that the metastatic tumors were well responsive to the apatinib treatment in the 15 patients with PR or SD. As shown in Figure 5, metastatic tumors in lung and lymph nodes of one patient were ~50% reduced after one cycle apatinib treatment; in another patient apatinib killed ~80% liver metastatic tumors. Even in the patients experienced tumor progression for their primary ESCCs, 8 of the 10 patients showed mild shrinkage or no-change for the metastatic tumors after the apatinib treatment.

Table 3. Analysis of clinical efficacy

Apatinib

Efficacy

Number of patients (N=25)

%

Complete response

0

0

Partial response

3

12

Stable disease

12

48

Disease progression

10

40

Disease control rate (%)

60

Overall response rate (%)

12

JCRM-3-1-1-g003

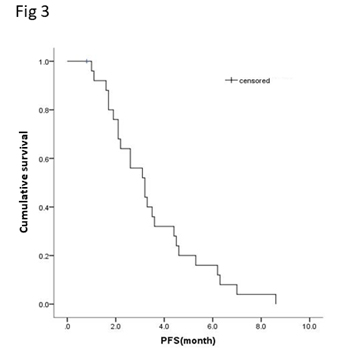
Figure 3.Kaplan-Meier curve of progression free survival (PFS) of patients with apatinib treatment.

JCRM-3-1-1-g004

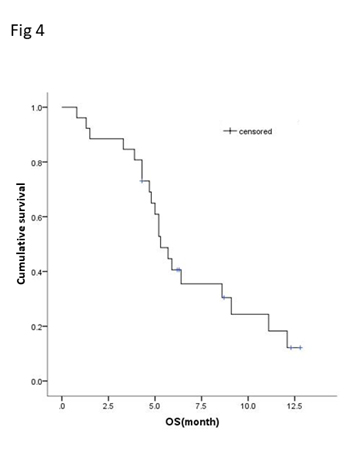
Figure 4.Kaplan-Meier curve of overall survival (OS) of patients with apatinib treatment.

JCRM-3-1-1-g005

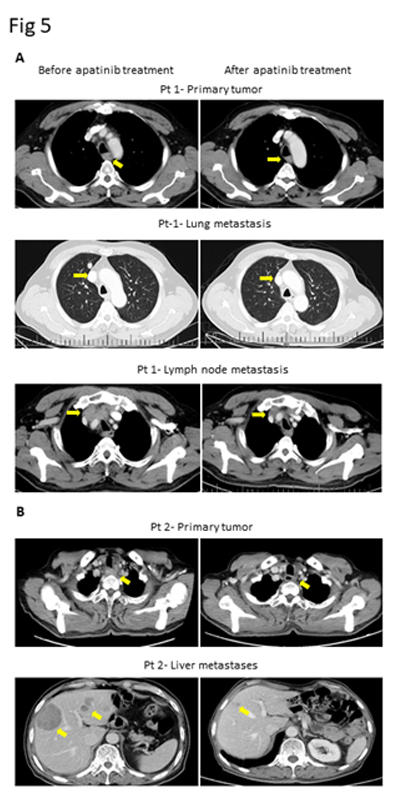
Figure 5.CT images of two ESCC patients with lung and lymph node metastasis (Pt 1, A) and liver metastasis (Pt 2, B).

Discussion

Prognosis of patients with metastatic ESCC after progression on first-line chemotherapy is poor, further cytotoxic chemotherapy provides little benefits and with significant treatment-related toxicity.

Therefore, it’s always under an urgent need to discover novel targeted therapies, which are more effective and less toxic than traditional chemotherapy options. It’s known that EAC and ESCC have completely different molecular biological characteristics. Although there have been several approved targeted therapy for EAC, whether they are beneficial to ESCC patients need exploration. In the current study, we provided both scientific and clinical evidence on apatinib through targeting the VEGF-KDR signaling in chemotherapy-refractory metastatic ESCC patients and with well-tolerated side effects.

Data from our study suggests a promising beneficial effect of apatinib in managing the metastatic ESCC patients after failed to chemotherapy. Overall, we observed a profound inhibition on metastatic tumor growth in the cohort, including tumor shrinkage at metastatic sites in all 15 patients with PR or SD, and effective controlling of tumor growth at metastatic sites in 8 of the 10 patients experienced tumor progression for their primary ESCCs. In comparing with EAC, metastatic ESCC patients have higher activations of VEGFKDR signaling in tumor tissue and blood [12], and tumor lesions at metastatic sites are more VEGF-KDR dependently angiogenic [13]. Apatinib has been shown in several tumor metastasis models in inhibiting angiogenesis and has superior anti-tumor effects [14-16]. Ideally, we would perform a tissue correlative study to compare the expression of KDR in the before- vs post-treated tumor samples. However, in these advanced and heavily-treated patients, multiple re-sampling of tumor tissue is almost impossible, and we didn’t have chance to obtain any tissue from the post-treated tumors. Anti-angiogenesis agents usually do not directly induce tumor cell cytotoxicity. Thus a prospective study in combining apatinib with switched chemotherapy is planned in our hospital.

We also observed a median PFS of 3.2 months and OS of 5.3 months in the cohort, and a 12% clinical response rate and 60% disease control rate, which is consistent with a recent study of apatinib in advanced ESCC patients [7]. Other anti-VEGFR inhibitors including sorafenib and sunitinib have been explored in advanced EC patients [17, 18], suggested their ability to stabilize chemotherapy-refractory disease. However, these studies were not exclusive to ESCC and 80% of the enrolled populations were EAC, thus the results were not stratified according to histology. In addition, we examined similar or less toxicities of apatinib than sorafenib or sunitinib in the study cohort. Grade 3/4 toxicities of single sorafenib in patients with advanced EC included a relative high percentage of rash/hand-foot reaction, even causing treatment discontinuation [17]. Combination of sunitinib with paclitaxel in advanced EC patients demonstrated more serious toxicities than single apatinib or sorafenib [18]. Grade 3/4 toxicities included high percentages of leukopenia/neutropenia (25%) and anemia (18%). Several grade 5 toxicities were even observed including upper gastrointestinal hemorrhage and esophageal fistula [18]. Our study suggests a favorable safety profile of apatinib in comparison with these anti-angiogenic agents for chemotherapy refractory metastatic ESCC patients.

We strongly agree that successes of targeted therapies depend on biomarker-driven patient selection. There has been no conclusion on biomarkers for all anti-angiogenic drugs. A biomarker study of apatinib in patients with breast cancer showed that high expression of phosphorylated KDR in tumor tissue could predict treatment efficacy [19]. For metastatic tumors, circulating VEGF might be more revealing than tissue analyses. A clinical correlative study in further investigating circulating VEGF and tissue KDR expression as potential biomarkers to predict the efficacy of apatinib in metastatic ESCC patients is undergoing in our hospital.

In conclusion, apatinib has demonstrated favorable activity and acceptable safety, and could be a new treatment option for patients with chemotherapy refractory metastatic ESCC. For further study, apatinib 500 mg once daily is the recommended dose. The prospective phase II trial including circulating biomarkers to predict treatment response is ongoing (NCT03170310).

Acknowledgement

This work was supported by National Natural Science Foundation of China (grant number 81201954).

References

  1. Chen W, Zheng R, Baade PD, et al. (2016) Cancer statistics in China, 2015. CA Cancer J Clin66: 115-132, [crossref]
  2. Su XD, Zhang DK, Zhang X, Lin P, Long H and Rong TH (2014) Prognostic factors in patients with recurrence after complete resection of esophageal squamous cell carcinoma. J Thorac Dis 6: 949-957, [crossref]
  3. Chen M, Shen M, Lin Y, et al.(2018) Adjuvant chemotherapy does not benefit patients with esophageal squamous cell carcinoma treated with definitive chemoradiotherapy. Radiat Oncol 13: 150, [crossref]
  4. Hamamoto Y and Kitagawa Y: (2014) [Current perspective of treatment for advanced esophageal squamous cell carcinoma]. Nihon Shokakibyo Gakkai Zasshi 111: 253-259,
  5. Chi Y, Wang F, Meng X, Shan Z, Sun Y and Fan Q: (2019) Apatinib inhibits tumor progression and promotes antitumor efficacy of cytotoxic drugs in esophageal squamous cell carcinoma. Journal of Clinical Oncology 37: e15554-e15554,
  6. Li J, Jia Y, Gao Y, et al. (2019) Clinical efficacy and survival analysis of apatinib combined with docetaxel in advanced esophageal cancer. Onco Targets Ther 12: 2577-2583, [crossref]
  7. Li J and Wang L (2017) Efficacy and safety of apatinib treatment for advanced esophageal squamous cell carcinoma. Onco Targets Ther 10: 3965-3969, [crossref]
  8. Su H, Hu N, Yang HH, et al.(2011) Global gene expression profiling and validation in esophageal squamous cell carcinoma and its association with clinical phenotypes. Clin Cancer Res 17: 2955-2966, [crossref]
  9. Hu N, Clifford RJ, Yang HH, et al.(2010) Genome wide analysis of DNA copy number neutral loss of heterozygosity (CNNLOH) and its relation to gene expression in esophageal squamous cell carcinoma. BMC Genomics 11: 576, [crossref]
  10. Kim SM, Park YY, Park ES, et al.(2010) Prognostic biomarkers for esophageal adenocarcinoma identified by analysis of tumor transcriptome. PLoS One 5: e15074, [crossref]
  11. Dulak AM, Schumacher SE, van Lieshout J, et al.(2012) Gastrointestinal adenocarcinomas of the esophagus, stomach, and colon exhibit distinct patterns of genome instability and oncogenesis. Cancer Res 72: 4383-4393, [crossref]
  12. Dreikhausen L, Blank S, Sisic L, et al.(2015) Association of angiogenic factors with prognosis in esophageal cancer. BMC Cancer 15: 121, [crossref]
  13. Goel HL and Mercurio AM (2013) VEGF targets the tumour cell. Nat Rev Cancer 13: 871-882, [crossref]
  14. Wu S, Zhou J, Guo J, Hua Z, Li J and Wang Z (2019) Apatinib inhibits tumor growth and angiogenesis in PNET models. Endocr Connect 8: 8-19, [crossref]
  15. Zhang J, Liu P, Zhang Z, et al.(2019) Apatinib-loaded nanoparticles inhibit tumor growth and angiogenesis in a model of melanoma. Biochem Biophys Res Commun[crossref]
  16. Liang Q, Kong L, Du Y, Zhu X and Tian J (2019) Antitumorigenic and antiangiogenic efficacy of apatinib in liver cancer evaluated by multimodality molecular imaging. Exp Mol Med 51: 76, [crossref]
  17. Janjigian YY, Vakiani E, Ku GY, et al.(2015) Phase II Trial of Sorafenib in Patients with Chemotherapy Refractory Metastatic Esophageal and Gastroesophageal (GE) Junction Cancer. PLoS One 10: e0134731, [crossref]
  18. Schmitt JM, Sommers SR, Fisher W, et al.(2012) Sunitinib plus paclitaxel in patients with advanced esophageal cancer: a phase II study from the Hoosier Oncology Group. J Thorac Oncol 7: 760-763, [crossref]
  19. Fan M, Zhang J, Wang Z, et al.(2014) Phosphorylated VEGFR2 and hypertension: potential biomarkers to indicate VEGF-dependency of advanced breast cancer in anti-angiogenic therapy. Breast Cancer Res Treat 143: 141-151, [c rossref]

Heparan Sulfate-Modifying Enzymes: Intriguing Players in Cancer Progression

DOI: 10.31038/CST.2020513


Heparan sulfate (HS) is a sulfated glycosaminoglycan that is deposited in human tissue matrices at specialized sites [1,2]. HS interacts with diverse extracellular matrix (ECM) components with HS binding sites, including inflammatory cytokines, and heparin-binding growth factors (HBGFs) [3,4]. Within the ECM and in the cell surface glycocalyx, HS-proteoglycans (HSPGs) act as reservoirs for cytokines and HBGFs, and as cofactors for surface receptors where they stabilize active signaling complexes [5–7]. The bioavailability and activity of HBGFs stored on HSPGs are primarily regulated by HS-modifying enzymes that act on HSPGs, such as perlecan, the syndecans and the glypicans [8,9]. Therefore, HSPGs and their enzymic modifiers are crucial for tissue homeostasis, both in normal biology, as in development and wound healing, and in pathological processes such as fibrosis and cancer biology [1,10,11]. To date, studies have identified three key extracellular enzymes that modulate HS function and growth factor signaling: tissue heparanase (HPSE) and the extracellular endosulfatases SULF1 and SULF2. HPSE is an endoglycosidase that cleaves HS chains yielding diffusible HS fragments [12] that often still retain bound growth factors (Fig. 1A). HS-bound growth factors can subsequently bind to surface receptors to form HS-HBGF-receptor ternary complexes (Fig. 1B) [12]. Like HPSE, SULFs are secreted but, for the most part, stay peripherally associated with the cell surface through the interaction with HSPGs in the glycocalyx, primarily syndecans and glypicans [13,14]. Enzymatic activity of SULFs involves selectively removing 6-O-sulfate groups from HS polymers (Figure 1A) [14,15]. Because many HBGFs require 6-O-sulfate for high-affinity binding to HSPGs or surface coreceptors [3,15,16], SULFs release HBGFs in a form free from HS chains. Freed HBGFs can bind subsequently to cognate cell surface receptors to form signaling complexes, or they may rebind to distant unmodified HSPGs that retain 6-O-sulfate. Therefore, both HPSE and SULFs are crucial enzymes that define activation parameters of HS-independent signaling networks in both positive and negative ways that often are context-dependent [17,18].

CST 2020-502-Daniel D. Carson_F1

Figure 1. HS-modifying enzymes HPSE and SULFs release HBGFs with outcomes that are influenced by context. A. HPSE directly cuts HS chains to increase availability of HBGFs bound to HS fragments, while SULFs remove 6-O-sulfate residues (light blue circles) and release HBGFs free of HS. B. HS can act as a cofactor and stabilize HBGF binding to receptors via ternary complexes, while other factors transduce their signals via binary complexes. C. Spatial distribution of HPSE and SULFs produce opposing signaling effects when these enzymes act at the cell surface versus release factors bound in the ECM. At the cell surface, SULFs can disrupt ternary complex formation by HS desulfation, inhibiting downstream signaling. D. Infiltration and activation of tumor-associated cells, both TAMs and CAFs, contribute to regulation of HPSE and SULF expression and enrich the tumor milieu with HSPGs and HBGFs.

Better understood than the SULFs, HPSE generally is regarded as a tumor promoter. Cleavage of HS by HPSE releases and increases the availability of HBGFs, including vascular endothelial growth factors, hepatocyte growth factors [19–22] and fibroblast growth factors [23–26], thereby improving their access to their cell surface receptors and enabling downstream growth signaling. Consequently, HPSE can stimulate pro-tumorigenic processes including neoangiogenesis, tumor cell proliferation and invasion, inhibition of apoptosis, and metastasis, all among the well-accepted hallmarks of cancer [27,28]. Because of the intricacies from potential outcomes of SULF activity, predicting their impact on complex microenvironments, a priori, such as tumors, is more complicated. Numerous studies have implicated the SULFs as significant players involved in critical aspects of cancer progression, including proliferation, invasion and metastasis [1,15]. The expression of these intriguing enzymes is abnormal in many carcinoma cells, yet no consensus conclusion has been made as to whether they support or inhibit general cancer progression. Some of this confusion may be attributed to differences in regulation of gene expression between SULF1 and SULF2. For example, tumor necrosis factor α (TNFα) [29] and Wilm’s tumor transcriptional factor [30] stimulate SULF1 expression to a greater extent than SULF2. In contrast, SULF2, but not SULF1, is a p53 target [31]. A comparison of potential transcription factor binding sites (TFBS) in the SULF1 and SULF2 promoter regions in silico revealed that ~50% of TBFS were not shared between these two genes [32]. Therefore, dysregulated transcriptional programs and different transcriptional targeting in SULF genes both in cancer cells and cells in the tumor microenvironment may partially explain some of the apparently contradicting data concerning SULF functions in tumorigenesis.

A review of studies focusing on SULFs and published in the past twenty years reveals contrasting expression levels and opposing effects on tumor growth depending on the type of cancer and the surrounding microenvironment. For instance, an analysis of SULF1/SULF2 in various cancer cell lines suggested a mostly tumor-suppressing role of SULFs [33]. In contrast, other researchers demonstrated that high SULF1 or SULF2 levels correlate with poor prognosis in a wide range of tumor types [34]. Additionally, contrary to SULF2, SULF1 can exert a tumor suppressor effect in cancers, including myeloma, ovarian, head and neck, breast, liver, and pancreatic [33,35–39] cancers, despite being upregulated in others [40]. The paradox of how SULFs, sharing essentially identical target specificity, have different biological functions remains an open research question. In seeking to reconcile these observations, an essential point to consider is the signaling context. Most of the studies mentioned above solely focused on the cancer compartment, where cultured cells respond to artificially supplied HBGFs. However, there is overwhelming evidence that associated “bystander” stromal cells play a vital role in the regulation of tumor growth [41–13]. Cancers with reduced expression of HPSE or the SULFs still may be impacted by the actions of these enzymes in scenarios where they are being produced by cancer-associated fibroblasts (CAFs) and/or tumor-associated macrophages (TAMs). In recent years, the role of immune cells in cancer progression has gained increased attention. TAMs stand out as a major cell population in the tumor stroma [44] where they can, together with CAFs, modulate the expression of matrix remodeling enzymes, HSPGs, and HBGFs via pro- and anti-inflammatory cytokines [45–48] (Fig. 1D).

Also part of the signaling context controlling cell behavior are the specific ligands and their binding preferences to various HS modifications, spatial distribution of the enzymes themselves, cellular composition of the microenvironment, and the combination of HBGFs and cytokines present. Examples of such variations include whether: 1) ligands require HS fragments as cofactors for ternary complex signaling (Fig. 1B); 2) desulfation results in HBGF release or disruption of cofactor potential; 3) the enzymes are more abundant at the cell surface or in the ECM (Fig. 1C); 4) a robust reactive stroma response supporting cancer progression is present. While SULFs have been shown to suppress signaling at the cell surface through disruption of coreceptor functions, their release of HBGFs from fibroblasts in a desmoplastic stroma might favor growth. To date, studies exploring the influence of these different aspects of the signaling context are scarce, primarily from a lack of in vitro model systems that can reproduce the convoluted tumor microenvironment. Recent improvements in bioengineered cancer tissues are changing this, and new insights are on the horizon. While several HPSE inhibitors have reached and/or are currently undergoing clinical trials [49,50], no drug targeting the SULFs specifically has reached the clinic. Given the diverse nature of SULF expression and opposing activity in different contexts, as discussed above, targeting SULFs for cancer therapy is a complex endeavor. A key concern relates to the consequences of potentiating or inhibiting SULF activity. While silencing SULFs can lead to anti-tumor effects in some cancers, in others where they act as tumor suppressors, SULF inhibition could enhance tumorigenicity. A significant amount of pre-clinical work is needed to understand the full repertoire of pro- and anti-tumor activities of the SULFs such that SULF-based therapies can be designed with confidence. Nonetheless, the undeniable involvement of HPSE and SULFs in regulating cancer progression makes these enzymes attractive both as therapeutic targets and prognostic indicators of tumor progression.

Acknowledgements

This work was supported by P01CA098912 from the National Institutes of Health and the Brazilian Coordination for the Improvement of Higher Education Personnel (CAPES).

Keywords

Heparin-binding growth factors, Heparan sulfate-Proteoglycans, Matrix-remodeling enzymes

References

  1. Knelson EH, Nee JC, Blobe GC (2014) Heparan sulfate signaling in cancer. Trends Biochem Sci 39: 277–288.
  2. Sasisekharan R, Venkataraman G (2000) Heparin and heparan sulfate: Biosynthesis, structure and function. Curr Opin Chem Biol 4: 626–631.
  3. Ishihara M, Takano R, Kanda T, Hayashi K, Hara S, et al. (1995) Importance of 6-O-sulfate groups of glucosamine residues in heparin for activation of FGF-1 and FGF-2. J Biochem 118(6): 1255–60. [Crossref]
  4. Merry CLR, Lyon M, Deakin J A, Hopwood JJ, Gallagher JT (1999) Highly sensitive sequencing of the sulfated domains of heparan sulfate. J Biol Chem 274: 18455–18462. [Crossref]
  5. Szatmári T, Dobra K (2013) The role of syndecan-1 in cellular signaling and its effects on heparan sulfate biosynthesis in mesenchymal tumors. Front Oncol 3: 310.
  6. Farach-carson MC, Carson DD (2007) Perlecan — a multifunctional extracellular proteoglycan scaffold. Glycobiology 17: 897–905. [Crossref]
  7. Iozzo R V (1994) Perlecan: A gem of a proteoglycan. Matrix Biol 14: 203–208.
  8. Raman R, Thomas RG, Weiner MW (2010) Border Patrol: Insights into the Unique Role of Perlecan/Heparan Sulfate Proteoglycan2 at Cell and Tissue Borders. 23: 333–336.
  9. Hammond E, Khurana A, Shridhar V, Dredge K (2014) The Role of Heparanase and Sulfatases in the Modification of Heparan Sulfate Proteoglycans within the Tumor Microenvironment. Front Oncol 4: 1–15. [Crossref]
  10. Suhovskih A V, Domanitskaya N V, Tsidulko AY, et al. (2015) Tissue-specificity of heparan sulfate biosynthetic machinery in cancer. Cell Adh Migr 9: 452–459. [Crossref]
  11. Flier JS, Underhill LH, Dvorak HF (1986) Tumors: Wounds That Do Not Heal. N Engl J Med 315: 1650–1659.
  12. Vreys V, David G (2007) Mammalian heparanase: What is the message? J Cell Mol Med 11: 427–452. [Crossref]
  13. Uchimura K, Morimoto-Tomita M, Bistrup A, et al. (2006) HSulf-2, an extracellular endoglucosamine-6-sulfatase, selectively mobilizes heparin-bound growth factors and chemokines: effects on VEGF, FGF-1, and SDF-1. BMC Biochem 7: 2. [Crossref]
  14. Hossain MM, Hosono-Fukao T, Tang R, et al. (2009) Direct detection of HSulf-1 and HSulf-2 activities on extracellular heparan sulfate and their inhibition by PI-88. Glycobiology 20: 175–186. [Crossref]
  15. Tang R, Rosen SD (2009) Functional consequences of the subdomain organization of the sulfs. J Biol Chem 284: 21505–21514. [Crossref]
  16. El Masri R, Seffouh A, Lortat-Jacob H, Vivès RR (2017) The “in and out” of glucosamine 6-O-sulfation: the 6th sense of heparan sulfate. Glycoconj J 34: 285–298. [Crossref]
  17. Ai X, Do AT, Lozynska O, et al. (2003) QSulf1 remodels the 6-O sulfation states of cell surface heparan sulfate proteoglycans to promote Wnt signaling. J Cell Biol 162: 341–351. [Crossref]
  18. Fellgett SW, Maguire RJ, Pownall ME (2015) Sulf1 has ligand-dependent effects on canonical and non-canonical Wnt signalling. J Cell Sci 128: 1408–1421. [Crossref]
  19. Tan KW, Chong SZ, Wong FHS, et al. (2013) Neutrophils contribute to inflammatory lymphangiogenesis by increasing VEGF-A bioavailability and secreting VEGF-D. Blood 122: 3666–77.
  20. Sanderson RD, Yang Y, Kelly T, MacLeod V, Dai Y, et al. (2005) Enzymatic remodeling of heparan sulfate proteoglycans within the tumor microenvironment: Growth regulation and the prospect of new cancer therapies. J Cell Biochem 96: 897–905. [Crossref]
  21. Kano MR, Morishita Y, Iwata C, Iwasaka S, Watabe T, et al. (2005) VEGF-A and FGF-2 synergistically promote neoangiogenesis through enhancement of endogenous PDGF-B-PDGFRbeta signaling. J Cell Sci 118: 3759–3768. [Crossref]
  22. Robinson CJ, Mulloy B, Gallagher JT, Stringer SE (2006) VEGF165-binding sites within heparan sulfate encompass two highly sulfated domains and can be liberated by K5 lyase. J Biol Chem 281: 1731–1740. [Crossref]
  23. Michael Elkin, Neta Ilan, Rivka Ishai-Michaeli, Yael Friedmann, Orit Papo, et al. (2001) Heparanase as mediator of angiogenesis: mode of action. FASEB J 15: 1661–1663.
  24. Myler HA, West JL (2002) Heparanase and platelet factor-4 induce smooth muscle cell proliferation and migration via bFGF release from the ECM. J Biochem 131: 913–922. [Crossref]
  25. Reiland J, Kempf D, Roy M, Denkins Y, Marchetti D (2006) FGF2 Binding, Signaling, and Angiogenesis Are Modulated by Heparanase in Metastatic Melanoma Cells. Neoplasia 8: 596–606. [Crossref]
  26. Duchesne L, Octeau V, Bearon RN, Beckett A, Prior IA, et al. (2012) Transport of fibroblast growth factor 2 in the pericellular matrix is controlled by the spatial distribution of its binding sites in heparan sulfate. PLoS Biol 10: 16. [Crossref]
  27. Hulett MD, Freeman C, Hamdorf BJ, Baker RT, Harris MJ, et al. (1999) Cloning of mammalian heparanase, an important enzyme in tumor invasion and metastasis. Nat Med 5: 803–809. [Crossref]
  28. Parish CR, Freeman C, Brown KJ, Francis DJ, Cowden WB (1999) Identification of sulfated oligosaccharide-based inhibitors of tumor growth and metastasis using novel in vitro assays for angiogenesis and heparanase activity. Cancer Res 59: 3433–3441. [Crossref]
  29. Sikora AS, Hellec C, Carpentier M, Martinez P, Delos M, et al. (2016) Tumour-necrosis factor-α induces heparan sulfate 6-O-endosulfatase 1 (Sulf-1) expression in fibroblasts. Int J Biochem Cell Biol 80: 57–65. [Crossref]
  30. Langsdorf A, Schumacher V, Shi X, Tran T, Zaia J, et al. (2011) Expression regulation and function of heparan sulfate 6-O-endosulfatases in the spermatogonial stem cell niche. Glycobiology 21: 152–161. [Crossref]
  31. Chau BN, Diaz RL, Saunders MA, Cheng C, Chang AN, et al. (2009) Identification of SULF2 as a novel transcriptional target of p53 by use of integrated genomic analyses. Cancer Res 69: 1368–1374. [Crossref]
  32. Holmes RS (2017) Comparative and Evolutionary Studies of Vertebrate Extracellular Sulfatase Genes and Proteins: SULF1 and SULF2. J Proteomics Bioinform 10: 32–40.
  33. Lai JP, Sandhu DS, Shire AM, Roberts LR (2008) The tumor suppressor function of human sulfatase 1 (SULF1) in carcinogenesis. J Gastrointest Cancer 39: 149–158. [Crossref]
  34. Bret C, Moreaux J, Schved JF, Hose D, Klein B (2011) SULFs in human neoplasia: Implication as progression and prognosis factors. J Transl Med 9: 72. [Crossref]
  35. Narita K, Staub J, Chien J, Meyer K, Bauer M, et al. (2006) HSulf-1 inhibits angiogenesis and tumorigenesis in vivo. Cancer Res 66: 6025–6032. [Crossref]
  36. Lai JP, Chien J, Strome SE, Staub J, Montoya DP, et al. (2004) HSulf-1 modulates HGF-mediated tumor cell invasion and signaling in head and neck squamous carcinoma. Oncogene 23: 1439–1447. [Crossref]
  37. Lai J, Chien J, Staub J, Avula R, Greene EL, et al. (2003) Loss of HSulf-1 up-regulates heparin-binding growth factor signaling in cancer. J Biol Chem 278: 23107–23117. [Crossref]
  38. Mondal S, Roy D, Camacho-Pereira J, Khurana A, Chini E, et al. (2015) HSulf-1 deficiency dictates a metabolic reprograming of glycolysis and TCA cycle in ovarian cancer. Oncotarget 6: 33705–33719. [Crossref]
  39. Khurana A, Beleford D, He X, Chien J, Shridhar V (2013) Role of heparan sulfatases in ovarian and breast cancer. Am J Cancer Res 3: 34–45. [Crossref]
  40. Lee HY, Yeh BW, Chan TC, Yang KF, Li WM, et al. (2017) Sulfatase-1 overexpression indicates poor prognosis in urothelial carcinoma of the urinary bladder and upper tract. Oncotarget 8: 47216–47229. [Crossref]
  41. Hao NB, Lü MH, Fan YH, Cao YL, Zhang ZR, et al. (2012) Macrophages in tumor microenvironments and the progression of tumors. Clin Dev Immunol 2012: 948098. [Crossref]
  42. Solinas G, Schiarea S, Liguori M, Fabbri M, Pesce S, et al. (2010) Tumor-conditioned macrophages secrete migration-stimulating factor: a new marker for M2-polarization, influencing tumor cell motility. J Immunol 185: 642–652. [Crossref]
  43. Balkwill FR, Mantovani A (2012) Cancer-related inflammation: Common themes and therapeutic opportunities. Semin Cancer Biol 22: 33–40. [Crossref]
  44. Solinas G, Germano G, Mantovani A, Allavena P (2009) Tumor-associated macrophages (TAM) as major players of the cancer-related inflammation. J Leukoc Biol 86: 1065–1073. [Crossref]
  45. Germano G, Allavena P, Mantovani A (2008) Cytokines as a key component of cancer-related inflammation. Cytokine 43: 374–379. [Crossref]
  46. Silzle T, Kreutz M, Dobler MA, Brockhoff G, Knuechel R, et al. (2003) Tumor-associated fibroblasts recruit blood monocytes into tumor tissue. Eur J Immunol 33: 1311–1320. [Crossref]
  47. Li R, Hebert JD, Lee TA, Xing H, Boussommier-Calleja A, et al. (2017) Macrophage-secreted TNFα and TGFβ1 Influence Migration Speed and Persistence of Cancer Cells in 3D Tissue Culture via Independent Pathways. Cancer Res 77: 279–290. [Crossref]
  48. Barron DA, Rowley DR (2012) The reactive stroma microenvironment and prostate cancer progression. Endocr Relat Cancer 19: 187–204. [Crossref]
  49. Miao HQ, Liu H, Navarro E, Kussie P, Zhu Z (2006) Development of Heparanase Inhibitors for Anti-Cancer Therapy. Curr Med Chem 13: 2101–2111. [Crossref]
  50. McKenzie EA (2007) Heparanase: a target for drug discovery in cancer and inflammation. Br J Pharmacol 151: 1–14. [Crossref]

Malignant Urinary bladder paraganglioma in 12 year old boy

DOI: 10.31038/EDMJ.2020415

Introduction

Paraganglioma of the urinary bladder is rarely encountered and its biological behavior is uncertain. Paragangliomas are extra-adrenal neoplasms of the neural crest derivation, and if hormonally active, they are termed pheochomocytoma. They account for less than 0.05 % of all bladder tumors and less than 1 % of all pheochromocytomas [1]. In the genitourinary tract, the urinary bladder is the most common site (79.2 %), followed by the urethra (12.7 %), pelvis (4.9 %), and ureter (3.2 %) [2,3]. Haematuria and intermittent hypertension during micturition are among the usual clinical signs along with generalised symptoms due to raised catecholamines such as headache, blurred vision, heart palpitation and flushing. Furthermore, the consequences of hypertension itself may muddle the initial diagnostic picture of these patients. Patients often seek medical attention only when their hypertension has become so advanced as to cause syncope, retinopathy or intracranial haemorrhage. In addition, symptoms and signs of urethral obstruction may occur when the tumour is within the vicinity of the urethral opening(4).However, 27 % of pheochromocytoma of the urinary bladder do not feature any hormonal activity [3]. The pheochromocytoma of the bladder was first described by Zimmermann in 1953 [5], and a little more than 100 cases have been spotted since then [1].

Treatment strategies for these tumours are not well-defined because of their rare incidence. We present a rare case of paraganglioma of the urinary bladder where a partial cystectomy was performed.

Case report

12yr old boy presented with history of episodic severe headache for 2 months duration; severe, holocranial associated with vomiting episodes. Headache was often accompanied with diaphoresis, anxiety and nervousness. He also had history of left retinal detachment one year back .On evaluation he was found to be hypertensive, BP – 200/170 mm Hg. There was no history of any familial disorder (MEN syndrome) or family h/o hypertension. Biochemical assessment revealed an elevated 24-hour normetanehrine of 3863/24 hours (<600).Initial localization of the paraganglioma was through contrast enhanced computed tomography (CT) of the abdomen and pelvis which revealed intensely enhancing lesion (4.5 x 2.7 cm) at superior border of urinary bladder with loss of fat planes; two more similar lesions (? Lymph nodes) were present in peri-vesicle locations along iliac vessels. GA 68 – DOTANOC PET scan confirmed disease limited to urinary bladder and Bilateral iliac lymph nodes. After an extensive effort to control his blood pressure with prazosin and Metoprolol, excision of the tumour along with pelvic lymph node excision was performed under general anaesthesia. Prior cystoscopic examination extrinsic compression at dome of bladder with increased vascularity. Bilateral ureteric catheterisation (5 Fr) was performed in view of identification of ureters during pelvic lymph node dissection. Partial cystectomy with pelvic lymph nodal dissection was successfully performed with minimal fluctuation of his blood pressure. The post-operative period was uneventful and histopathological examination confirmed the diagnosis of pheochromocytoma of the urinary bladder. All anti-hypertensive medications were discontinued immediately after the operation. Micturating Cysto-Uretherogram (MCU) done on 10th post-operative day reveal satisfactory bladder capacity (250 ml) with no leak or residual volume. Histopathological report was malignant paraganglioma with lymph node metastasis.  Two external iliac lymph nodes were positive for metastatic deposits.

Kushagra EDMJ_f1

Image 1 – CT scan images showing transverse sections at level of urinary bladder showing enhancing mass lesion(4.5cm x 2.7 cm) at superior border of Urinary border.

Kushagra EDMJ_f2

Image 2 – CT scan showing coronal and saggital images of lesion at superior border of urinary bladder along with two similarly enhancxinglesions (lymph nodes) in perivesical location.

Kushagra EDMJ_f3

Image 3 – Gallium – 68 DOTANOC PET scan showing somatostatin expressing urinary bladder mass lesion with bilateral external iliac lymph nodal involvement.

Kushagra EDMJ_f4

Image 4 – Surgical specimen showing Bladder paraganglioma(5x5xcm,inner surface seen) and bilateral external iliac lymph node ( about 3x 2cm , 3 in number, largest – 3×2 cm, firm).

Kushagra EDMJ_f5

Image 5 – Low power view of tumor. Tumor shows nests of cuboidal cells separated by vascularised fibrous septa. This pattern of arrangement of tumor cells is k/a Zellballen.

Kushagra EDMJ_f6

Image 6 – High power view Shows zellballen formation and tumor cells with moderate amount of cytoplasm.

Discussion

The commonest bladder tumor in children is rhabdomyosarcoma. (Huppmann AR, Pawel BR. Polyps and masses of the pediatric urinary bladder: a 21-year pathology review. Pediatr Dev Pathol. 2011; 14(6): 438-44.) Paragangliomas of the urinary bladder are rare tumors that can present at any age (range 11–84 years) with a mean age of 45 years and with slight female sex predilection [1]. In the pediatric population they are extremely rare, with just over 12 cases reported in the literature [6]. The commonest site within the bladder is the trigone and the posterior wall [8].The lateral wall has also been cited as a common site [7].As many as 50% of the paragangliomas are hereditary and may be associated with familial paraganglioma, neurofibromatosis type 1, von Hippel- Lindau disease, and the Carney triad [9].Histologically, they are characterized by cells arranged in discrete nests separated by a prominent sinusoidal network. Malignant paraganglioma of the urinary bladder constitutes 10% of all the bladder paragangliomas [10, 12]. No reliable histologic criteria exist to distinguish malignant from benign neoplasms. Differentiation from benign bladder paragangliomas is based on local invasion, lymph node involvement, or distant metastases [10]. Approximately 30 malignant cases have been reported so far in the literature [11].

Suspected cases of paraganglioma should first be investigated by measuring the levels of catecholamine and metabolites such as metanephrine and vanillylmandelic acid secretion in either blood or urine. However, in cases of nonfunctional paragangliomas, the metabolites may be normal. Imaging can be used to evaluate the primary tumor as well as metastatic lesions. MR imaging is highly useful for imaging extra-adrenal pheochromocytomas. It may reliably differentiate pheochromocytoma from the more common epithelial neoplasms of the bladder which are characteristically poorly enhancing. On MR imaging paragangliomas are typically more hyper intense on both T1- and T2-weighted images.[13]

Bladder Pheochromocytomas is mainly treated by surgical excision. Preoperative catecholamine blockade is necessary for functional tumors. Metastatic or recurrent tumors are treated with palliative therapy [1]. Cystoscopic examination prior to the excision helps to delineate the exact location of the lesion, especially with regard to the depth of invasion and the involvement of the ureters. Biopsy should be avoided. On cystoscopy, pheochromocytomas appear as solid reddish brown granulated and lobulated lesions with or without ulceration [14]. Since the sympathetic plexus of the bladder is scattered between all the layers of the bladder, transurethral resection alone is associated with a high rate of recurrence and partial cystectomy is the standard of care where bladder can be preserved or else a total cystectomy is done. Open approach is preferred [14, 15, 16] although laparoscopic approach, as reported by Kozlowski et al, has recently been shown to be feasible [17].

References

  1. Beilan JA, Lawton A, Hajdenberg J and Rosser CJ (2013) Pheochromocytoma of the urinary bladder: a systematic review of the contemporary literature. BMC Urol 13: 22.
  2. Das S and Lowe P (1980) Malignant pheochromocytoma of the bladder. J Urol 123: 282–4.
  3. Hanji AM, Rohan VS, Patel JJ and Tankshali RA (2012) Pheochromocytoma of the urinary bladder: a rare cause of severe hypertension. Saudi J Kidney Dis Transpl 23: 813–6.
  4. Bonacrzu Kazzi G. Asymptomatic bladder pheochromocytoma in a 7-year-old boy. J. Paediatr Child Health 2001; 37: 600–2.
  5. Zimmerman I J, Biron RE and MacMahon HE (1953) Pheochromocytoma of the urinary bladder. N Engl J Med 249: 25–6.
  6. Bohn OL, Pardo-Castillo E, Fuertes-Camilo M, Rios-Luna NP, Martinez A and Sanchez-Sosa S. Urinary bladder paraganglioma in childhood: a case report and review of the literature. Pediatr Dev Pathol 2011; 14: 327–32
  7. Cheng L, Leibovich BC, and Cheville JC. Paraganglioma of the urinary bladder: can biologic potential be predicted? Cancer. 2000; 88: 844–52.
  8. Messing EM. Urothelial tumors of the bladder. In: Wein AJ, Kavoussi LR, Novick AC, Partin AW and Peters CA. Campbell-Walsh urology. 9th ed. Philadelphia: Saunders; 2007. p. 2407.
  9. Young WF Jr. Paragangliomas: clinical overview. Ann N Y Acad Sci. 2006; 1073: 21–9.
  10. Ka iri-Vassilatou E, Argeitis J, Nika H, Grapsa D, Smyrniotis V and Kondi-Pafiti A. Malignant paraganglioma of the urinary bladder in a 44-year-oldfemale: Clinicopathological and immunohistochemical study of a rare entity and literature review. Eur J Gynaecol Oncol 2007; 28: 149–51.
  11. Palla AR, Hogan T and Singh S. Malignant paraganglioma of the urinary bladder in a 45-year-old woman. Clin Adv Hematol Oncol 2012; 10: 836–9.
  12. Ansari MS, Goel A, Goel S, Durairajan LN and Seth A. Malignant paraganglioma of the urinary bladder. A case report. Int Urol Nephrol 2001; 33: 343–5.
  13. Loveys FW, Pushpanathan C and Jackman S. Urinary Bladder Paraganglioma: AIRP Best Cases in Radiologic-Pathologic Correlation. Radiographics. 2015; 35(5): 1433–1438. doi: 10.1148/rg.2015140303
  14. Doran F, Varinli S and Bayazit Y. Pheochromocytoma of the urinary bladder. APMIS 2002; 110: 733–6.
  15. Young WF Jr. Paragangliomas: clinical overview. Ann N Y Acad Sci. 2006; 1073: 21–9.
  16. Dahm P and Gschwend JE. Malignant non-urothelial neoplasms of the urinary bladder: a review. Eur Urol. 2003; 44: 672–81.
  17. Klingler HC, Klingler PJ, Martin JK Jr, Smallridge RC, Smith SL and Hinder RA. Pheochromocytoma. Urology. 2001; s57: 1025–32.

The Anger Felt by Cancer Patients. It Could Be An Unexpected Obstacle To The Treatment Path?

DOI: 10.31038/CST.2020512

Abstract

Anger is one of the possible reactions to cancer. There are mutual influences between cancer and psychological status, with repercussions on the immune system. The aim of this study was to analyze differences in the experience, expression and control of anger by gender and to measure the relationship between anger, anxiety, depression, quality of life, and progression of the disease. We have conducted a cross-sectional study assessing 281 cancer patients, using the STAXI-2, HADS and a visual analogue scale to measure Quality of Life. Results: Females reported significantly higher State and Trait Anger scores and lower Anger Control Out scores than males. In the whole sample the anger subscale scores increased with levels of anxiety or depression. In males, high State, Trait and Expression Anger subscale scores resulted associated with low Quality of Life, among females, this relationship seems to be weak. No differences emerged on STAXI-2 scales and subscales between patients in progression of disease. Conclusions: Anxiety, depression and anger seem to be organized into a pattern of a general emotional reaction. Since immunotherapy is the anticancer treatment that increases the body’s natural defenses to fight disease, a balanced immune system has become the main concern. In conclusion, clinicians could gain important insights about their patients by looking at the result of validated self-report patient questionnaires, to identify patients with inadequate expression of emotion or too high levels of emotional reaction in order to improve quality of care and response to treatment.

Keywords

anger scale, cancer management, depression assessment, immunological characteristics quality of life

Introduction

Anger is an emotion that in these present times is making itself noticed in many contexts and in everyday life. It is the reaction to the frustration that people are experiencing due to the poor prospects of economic development, the lack of work, for young and old, etc. In oncology, clinicians are led to think that anger is the emotional reaction that characterizes the moments behind the diagnosis to then give way to emotional experiences of anxiety and then later depression. For a long time it was hypothesized that there could be a sequence of psychological reactions conditioned by the distance from the diagnosis. Today the experience and manifestations of anger must be studied in a more specific way, especially in light of the evidence that has shown a sex-specific differences in activity of emotion processing regions [1,2]. In medicine we know that sex hormones influence the onset and severity of various immuno-modulate disease [3,4], and the role of the psychological state on the disease and vice versa is known. Different diseases could be influenced by the psychological status and gender, just as diagnoses influence the psychological status of the patient, perhaps differently in the two sexes. If on the one hand the knowledge on prevalence of anxiety and depression is now consolidated [5], on the other, knowledge about the differences between the sexes in anger is still limited. Common sense leads us to think that the expression of anger outward is more frequent among males, although Aghaei [6] has found very similar anger scores between males and females in a sample of cancer patients admitted to the hospital for surgery. There is a need to study in depth the complex relationships between sex, psychological distress and disease, especially today that the use of immunotherapy treatments makes the picture more complicated. Scientific literature has proposed to distinguish among different components of anger. There are differences between expressing or inhibiting anger, between controlling it by adopting relaxation methods or rather strategies to shift attention towards other stimuli. Studies that investigated the aspects of suppression, repression, or restraint of anger [7] found that the suppressed anger was associated with health risk factors and early mortality for all-cause, included cardiovascular and cancer mortality, in women [6,8]. The inhibition of negative emotions plays an important role in how cancer patients adjust to the disease [9,10]. Low levels of anger were associated with maladaptive coping strategies to cancer [3,4]. Differently other researchers have found that a reaction of anger expression may be an important factor in the fight against cancer [11]. However, patients with high levels of intensity of anger should be evaluated carefully to determine whether the risk of acting out their anger represents a potential danger to themselves and others. Differently, moderate anger experiences may guide problem-solving behaviour and people may be more assertive than aggressive.

Anyways anger is a human emotion that can vary in component, intensity, expression and control [12] and each pattern can have different meaning and relationship with other emotional feeling and behavioural experiences for people. To study the multifaceted construct of anger the State-Trait Anger Expression Inventory-2TM [13,14] has been developed and validated. The questionnaire has been developed to recognizes 11 components of experience, expression and control of anger. The State Anger refers to the intensity of the individual’s angry feelings at a specified time or at the time of testing. The State Anger splits into 3 domains: Feeling Angry, to Feel like Expressing Anger Verbally and Feel like Expressing Anger Physically. The first is related with annoyance, irritation, anger or fury. The second, with the desire to express anger by swearing, cursing, yelling or screaming. The third, reflects the inclination to hit someone or to break things. Trait anger measures a predisposition to become angry and is critical for understanding how often a person becomes angry. Anger experienced quickly and with little provocation reflects an Angry Temperament, as a predisposition, while the tendency to become angry when people receives negative feedback is Angry Reaction. Anger Expression Out and Anger Expression In describe the extent to which people expresses emotional experiences of anger in an outwardly negative and poorly controlled way or vice versa to be under-reactive, suppressing, repressing, or denying anger feelings because uncomfortable. Anger Control Out involves the expenditure of energy to monitor and control the expression of angry. People with high Anger Control Out may not be in touch with their emotions and may not recognize the need to act on solving the problem causing the anger. Last, Anger Control In reflects how a person attempts to relax and reduce angry before got out of control. The aim of this study was to measure the sexes differences among cancer patients related to: (1) experience, expression and control of anger; (2) relationship between anger components and anxiety, depression, quality of life, and progression of disease.

Materials and Methods

142 male cancer patients (mean age= 65.19; standard deviation, SD = 12.53) and 139 female cancer patients (mean age = 62.57; SD = 11.47) admitted for oncological treatment at the Day Hospital were consecutively enrolled in this study. Informed consent was obtained for all patients at the enrolment in the study. The Committee of Ethics of the hospital approved the study protocol (Prot. n. 39/CE/2017, 04 Oct 2017).

Questionnaires

State-Trait Anger Expression Inventory-2TM (STAXI-2) [13,14]. The 57-item STAXI-2 consists of six main scales (State Anger, Trait Anger, Anger Expression Out, Anger Expression In, Anger Control Out and Anger Control In) and five subscales (for State Anger: Feeling Angry, to Feel like Expressing Anger Verbally and Feel like Expressing Anger Physically; for Trait Anger: Angry Temperament and Angry Reaction) to measure experience, expression and control of anger. The State Anger scale assesses the intensity of anger as an emotional state at a data time. The Trait Anger scale measures how often angry feelings are experienced over time. The Anger Expression Out and Anger Expression In, Anger Control Out and Anger Control Out In scales assess four independent anger-related traits: expression of anger toward other persons or objects in the environment; holding in or suppressing angry feelings; controlling angry feelings by preventing the expression of anger toward other persons or objects in the environment; controlling suppressed angry feelings by calming down or cooling off, respectively. Each item has 4 options and the subjects graded themselves by using a 4-point Likert scale (from 1=almost never to 4=usually). In this study, internal consistency was good to excellent for all STAXI-2 scales, with Cronbach’s alpha coefficients ranging from 0.69 (Anger Expression Out) to 0.93 (State Anger) for males, and from 0.72 (Anger Expression Out) to 0.93 (State Anger) for females.

Hospital Anxiety and Depression Scale (HADS) [15]. The HADS is a 14-item screening instrument for anxiety (7 items) and depression (7 items) in a non-psychiatric setting. Each item is scored from 0 (not present) to 3 (highly present). Separately for each scale (range 0–21), scores <8 suggest absence of disease, scores from 8 to 10 are considered borderline, and those >10 identify probable cases of anxiety or depression [16]. In this study, Cronbach’s alpha coefficients were 0.78 and 0.79 for males and 0.82 and 0.75 for females, respectively for anxiety and depression.

Quality of life (QoL) and perception of severity and curability of the disease [17] were self- assessed by the patients using a 10-point rating scale (bad/excellent quality of life, very/not very severe, difficult/very easy to cure). Sociodemographic data and clinical information were also collected.

Statistical Analyses

For descriptive purpose we divided patients into two categories according to differences in education (<=13yrs of school versus >13yrs). Marital status was dichotomized into persons living alone (single, divorced, widowed) and into those cohabiting (married, cohabiting). Data about presence of metastasis, lymphectomia, and progression of disease were also dichotomized (absent versus present). Cancer type with less than 5 patients were grouped together and labeled “other”. For sub-analyses purpose, data about HADS anxiety and depression were divided into three groups (no disease, score 0–7; borderline, score 8–10, cases 11–21). All the raw questionnaire and 10-point rating scale scores were linearly transformed to 0–100 scales to allow comparability, using the

Formula:

Tscore = (X – Xmin)/X range)*n

where Tscore is the adjusted variable, X is the original variable, Xmin is the minimum observed value on the original variable and Xrange is the difference between the maximum potential score and the minimum potential score on the original variable and n is the upper limit of the rescaled variable. The Tscores are characterized by a distribution with a mean of 50 and a standard deviation (SD) of 10, with 0 and 100 assigned to the lowest and highest possible values, respectively. Continuous variables were reported as medians (and interquartile ranges [IQRs]) and as means (and SD or 95% Confidence Intervals, 95%CIs), and inferences were tested with parametric or non- parametric tests accordingly with their distribution. Even if the sample distribution of the values was asymmetric, the data were also presented as means to allow better visualization of the results, since the median often coincided with the quartiles. Categorical variables were reported as proportions and chi-squared or Fisher’s exact test were used for comparison. Cronbach’s alpha was adopted to evaluate internal consistency of questionnaires scales and subscales. The analyzes were conducted separately from gender. All statistical analyses have been performed using STATA, version 11.0 (StataCorp, College Station, Tex).

Results

A total of 281 cancer patients, 142 males and 139 females, aged from 31 to 88 years, were enrolled in the study. Sociodemographic and clinical features are reported in Table 1, separately for gender. Males were older at diagnosis (p=0.016), they had more frequently metastasis (p<0.001) and an advanced cancer stadium (p<0.001), a shorter length of disease (p=0.038) and less chemotherapeutic treatments (p=0.001), compared to females. In Table 2 mean values and 95%CIs of STAXI-2 and HADS domains, perception of qol, severity and curability of the disease are shown separately for males and females. Males reported lower mean scores in State (p=0.019) and Trait Anger (p=0.030), and higher mean scores in Anger Control In, than females. No differences emerged in Anger Expression, Out and In, and in Anger Control In between gender.

Table 1. Sociodemographic and clinical characteristics of the sample, separately for gender.

Males
(N=142; 50,53%)

Females
(N=139; 49,47%)

N

%

N

%

pvalue*

age, years (mean; 95%CI)

65,19

63,11–67,27

62,57

60,65–64,49

0,069

education

<13yrs

113

79,58

105

75,54

0,417

>13yrs

29

20,42

34

24,46

married

no

19

13,48

28

20,59

0,115

yes

122

86,52

108

79,41

age at diagnosis (mean; 95%CI)

63,13

60,96–65,30

59,43

57,34–61,52

0,016

length of disease, years

2,06

1,41–2,70

3,17

2,33–4,00

0,038

0–1yrs

98

69,01

79

56,83

2–8 yrs

34

23,94

41

29,50

9+ yrs

10

7,04

19

13,67

0.065

cancer type

colon

37

26,06

22

15,83

<0.001

melanoma

26

18,31

24

17,27

lung

34

23,94

14

10,07

breast

0

0,00

46

33,09

vescica

10

7,04

3

2,16

ovaio

0

0,00

12

8,63

gastrico

7

4,93

3

2,16

other

28

19,72

15

10,79

cancer stadium

I

4

2,92

6

4,65

<0.001

II

2

1,46

22

17,05

III

26

18,98

23

17,83

IV

105

76,64

78

60,47

linfectomia

no

67

47,18

33

23,74

<0.001

yes

68

47,89

101

72,66

missing value

7

4,93

5

3,60

metastasis at diagnosis

no

72

50,70

104

74,82

<0.001

yes

69

48,59

35

25,18

missing value

1

0,70

0

0,00

radiotherapy

no

111

78,17

91

65,47

<0.001

adjuvant

5

3,52

33

23,74

palliative

24

16,90

14

10,07

esclusiva

2

1,41

1

0,72

CHT

no

103

72,54

63

45,32

<0.001

neoadjuvant

4

2,82

3

2,16

adjuvant

35

24,65

73

52,52

pre-CHT line (mean; 95%CI)

2,30

1,70–2,91

4,03

3,33–4,72

<0.001

progression of disease

no

28

19,72

45

32,37

0,016

yes

114

80,28

94

67,63

* Chi2 test; Student t test

Table 2: Descriptive statistics for STAXI-2 scales, HADS scales, patient perception of quality of life (QOL), cancer severity and curability.

males

females

(N=142; 50,53%)

(N=139; 49,47%)

mean

95%CI

mean

95%CI

p-value*

STAXI

Anger state

7,84

5,47–10,21

11,45

8,71–14,18

0,019

feeling angry

12,35

9,46–15,24

17,55

13,99–21,12

0,040

verbal anger

7,56

4,50–10,62

12,09

8,46–15,72

0,023

physical anger

3,62

1,56–5,67

4,70

2,61–6,69

0,472

Ange trait

24,88

21,50–28,27

29,34

25,93–32,74

0,030

temperament

19,07

15,59–22,56

25,00

21,61–28,39

0,002

reaction

31,87

27,70–36,04

35,13

31,05–39,21

0,145

Anger expression

out

23,88

21,26–26,51

24,85

22,16–27,54

0,566

in

34,33

31,12–37,54

33,69

30,10–37,29

0,577

Anger control

out

66,33

62,15–70,51

60,19

55,96–64,43

0,036

in

58,51

54,56–62,46

57,27

53,23–61,28

0,723

HADS

anxiety

26,89

24,02–29,77

35,46

32,28–38,63

<0.001

depression

27,20

24,16–30,23

31,41

28,35–34,48

0,054

QOL

6,81

6,45–7,17

6,40

6,03–6,78

0,091

Cancer severity perception

5,13

4,70–5,56

4,96

4,53–5,38

0,539

Cancer curability perception

6,38

5,99–6,78

6,20

5,79–6,62

0,517

* Kruskal-wallis test

Males also reported lower mean score in HADS-Anxiety (p<0.001) and Depression scale (p=0.054). No significant differences emerged in perception of QoL, severity and curability of cancer between gender. Sixteen males (11.27%) and 32 females (23.02%) resulted probably-cases of anxiety (HADS- Anxiety score>10); anxiety was absent (score<8) in 76.76% of males and 56.12% of females, and borderline (scores between 8 and 10) in 11.97% of males and 20.86% of females. Eighteen males (12.68%) and 17 females (12.23%) resulted probably-cases of depression (HADS-Depression score>10); depression was absent (score<8) in 70.42% of males and 64.75% of females, and borderline (scores between 8 and 10) in 16.90% of males and 23.02% of females. STAXI-2 scale and subscale descriptive statistics, separately for categories of HADS-anxiety (absent, borderline, cases) and gender are shown in Table 3. Independently of gender, the anger subscale scores increased with levels of anxiety, excepted for both the Anger Control subscales with the exception for males for which the Anger Control Out scores decreased from absence to cases of anxiety. A similar pattern of associations (shown in Table 4) emerged respect to categories of HADS-depression (absent, borderline, cases). No relationship has been found between levels of Depression and Anger Control Out. The higher anger scores resulted in Anger Control In, Reaction and Anger Expression In compared to the other STAXI-2 subscale scores. STAXI-2 scale and subscale descriptive statistics, separately for Quality of Life levels (low, medium, high) and gender are shown in Table 5. For males, a low QoL score was associated with high anger subscale scores, excepted for Anger Control subscales (high scores are associated with high QoL). Among females, the relationship between anger and QoL seems to be weak, excepted for the Anger Control subscales, which elevated scores are associated with good QoL. No differences emerged between STAXI-2 scales and subscales and progression of disease (PD) among females. Males in PD feel annoyance, irritation, anger or fury (p=0.051). The predisposition to become angry is not different between those with PD and no-PD. Differently, anger experienced quickly and with little provocation was higher among patients with PD than no-PD (see Table 6).

Table 3: Descriptive statistics of STAXI-2 scales and subscales, separately for categories of HADS-Anxiety and Gender

HADS-Anxiety
Males, N=142

absent (<=7)
N=109

borderline (8–10)
N=17

cases (>=11)
N=16

pvalue

Anger, state

mean, SD

4,38

8,07

10,59

13,30

28,47

26,66

median, IQR

0,00

0–4,44

6,67

4,44–13,33

17,78

6,67–53,33

<0,001

feeling

mean, SD

7,77

11,95

18,82

14,76

36,67

27,65

median, IQR

0,00

0–13,33

20,00

13,33–26,67

30,00

13,33–63,33

<0,001

verbal anger

mean, SD

3,79

10,48

8,63

22,58

32,08

33,40

median, IQR

0,00

0–0

0,00

0–6,67

16,67

3,33–60

<0,001

physical anger

mean, SD

1,59

5,73

4,31

14,52

16,67

27,76

median, IQR

0,00

0–0

0,00

0–6,67

0,00

0–23,33

0,002

Anger, trait

mean, SD

21,37

17,80

33,33

25,32

39,81

23,17

median, IQR

14,81

7,41–29,63

25,93

14,81–44,44

38,89

20,37–53,70

0,002

temperament

mean, SD

15,60

18,95

29,90

25,01

31,25

22,87

median, IQR

8,33

0–25

25,00

8,33–50

33,33

8,33–41,67

0,002

reaction

mean, SD

28,44

22,60

38,24

29,76

48,44

29,85

median, IQR

25,00

8,33–41,67

25,00

25–33,33

37,50

29,17–79,17

0,017

Expression Out

mean, SD

22,13

14,86

25,74

16,35

33,85

18,81

median, IQR

20,83

8,33–33,33

25,00

12,5–33,33

31,25

22,92–43,75

0,038

Expression IN

mean, SD

31,15

18,73

42,89

17,85

46,88

18,35

median, IQR

29,17

16,67–41,67

45,83

29,17–54,17

45,83

35,42–62,5

0,001

Control Out

mean, SD

69,46

24,68

60,50

19,47

51,19

28,70

median, IQR

76,19

57,14–90,48

57,14

42,86–71,43

50,00

30,95–73,81

0,016

Control In

mean, SD

59,82

24,03

58,82

17,61

49,22

26,93

median, IQR

62,50

45,83–79,17

54,17

50–66,67

43,75

33,33–72,92

0,289

HADS-Anxiety
Females, N=139

absent (<=7)
N=78

borderline (8–10)
N=29

cases (>=11)
N=32

pvalue

Anger, state

mean, SD

5,36

8,55

11,57

15,53

25,56

22,01

median, IQR

2,22

0–6,67

4,44

2,22–20

18,89

8,89–43,33

<0,001

feeling

mean, SD

9,40

14,71

16,78

15,80

36,25

25,34

median, IQR

6,67

0–13,33

13,33

6,67–20

36,67

10–56,67

<0,001

verbal anger

mean, SD

5,56

12,73

12,41

21,58

27,71

30,06

median, IQR

0,00

0–6,67

0,00

0–20

20,00

0–46,67

<0,001

physical anger

mean, SD

1,11

3,47

5,52

14,04

12,71

19,63

median, IQR

0,00

0–0

0,00

0–0

0,00

0–20

<0,001

Anger, trait

mean, SD

22,27

16,16

32,57

23,31

43,63

18,69

median, IQR

18,52

11,11–33,33

29,63

14,81–48,15

44,44

29,63–55,55

<0,001

temperament

mean, SD

17,95

15,90

28,16

20,94

39,32

21,30

median, IQR

16,67

8,33–25

25,00

8,33–41,67

33,33

25–54,17

<0,001

reaction

mean, SD

27,99

21,36

38,51

27,59

47,48

21,58

median, IQR

25,00

8,33–41,67

33,33

16,67–58,33

50,00

33,33–62,5

<0,001

Expression Out

mean, SD

21,63

14,50

25,86

14,23

31,77

19,10

median, IQR

20,83

12,5–29,17

25,00

16,67–37,5

27,08

20,83–39,58

0,016

Expression In

mean, SD

28,79

19,83

30,89

16,20

48,18

23,45

median, IQR

25,00

12,5–45,83

29,17

20,83–41,67

47,92

29,17–60,42

<0,001

Control Out

mean, SD

62,82

25,87

55,67

23,64

57,89

25,11

median, IQR

66,67

42,86–85,71

52,38

38,09–76,19

57,14

40,48–80,95

0,280

Control In

mean, SD

59,56

24,82

52,30

21,20

56,12

24,20

median, IQR

62,50

41,67–75

54,17

37,5–66,67

62,50

33,33–75

0,211

* Kruskal-wallis test

Table 4: Descriptive statistics of STAXI-2 scales and subscales, separately for categories of HADS-Depression and gender

HADS, Depression
Males, N=142

absent (<=7)
N=100

borderline (8–10)
N=24

cases (>=11)
N=18

p-value

Anger, state

mean, SD

4,09

8,10

15,28

21,48

18,77

19,97

median, IQR

0,00

0–4,44

6,67

3,33–18,89

10,00

6,67–31,11

<0,001

feeling

mean, SD

6,60

9,11

23,61

23,91

29,60

24,21

median, IQR

0,00

0–13,33

20,00

6,67–30,00

23,33

13,33–40

<0,001

verbal anger

mean, SD

3,93

12,72

14,17

26,25

18,89

25,90

median, IQR

0,00

0–0,00

0,00

0–13,33

6,67

0–33,33

<0,001

physical anger

mean, SD

1,73

7,62

8,06

19,75

8,15

18,37

median, IQR

0,00

0–0,00

0,00

0–6,67

0,00

0–6,67

0,006

Anger, trait

mean, SD

21,19

18,52

31,64

18,85

36,42

26,17

median, IQR

14,81

7,41–29,63

29,63

22,22–50,00

24,07

18,52–62,96

0,003

temperament

mean, SD

15,25

19,21

27,78

21,80

28,70

24,12

median, IQR

8,33

0–25,00

33,33

4,17–41,67

20,83

8,33–50,00

0,003

reaction

mean, SD

28,33

23,21

36,46

25,63

45,37

30,28

median, IQR

25,00

8,33–33,33

33,33

12,5–54,17

37,50

25–83,33

0.024

Expression Out

mean, SD

21,88

14,57

28,65

16,95

28,70

19,43

median, IQR

20,83

8,33–31,25

27,08

16,67–41,67

27,08

16,67–41,67

0,105

Expression IN

mean, SD

30,83

19,27

41,32

17,55

44,44

16,85

median, IQR

27,08

16,67–41,67

41,67

29,17–54,17

45,83

33,33–54,17

0,002

Control Out

mean, SD

70,90

24,48

59,92

20,30

49.47

27,14

median, IQR

76,19

57,14–90,48

59,52

42,86–76,19

45,24

33,33–71,43

0,001

Control In

mean, SD

62,33

23,42

52,78

21,02

44,91

23,94

median, IQR

66,67

47,92–79,17

54,17

43,75–66,67

43,75

29,17–58,33

0,004

HADS, Depression
Females, N=139

absent (<=7)
N=90

borderline (8–10)
N=32

cases (>=11)
N=17

p-value

Anger, state

mean, SD

7,41

12,64

17,78

20,59

19,74

18,34

median, IQR

2,22

0–8,89

13,33

0–22,22

17,78

2,22–24,44

<0.001

feeling

mean, SD

12,22

17,20

23,75

23,34

30,59

25,06

median, IQR

6,67

0–13,33

20,00

0–43,33

33,33

6,67–53,33

0.002

verbal anger

mean, SD

7,48

17,04

19,58

27,09

22,35

25,71

median, IQR

0,00

0–6,67

10,00

0–26,67

13,33

0–33,33

0.001

physical anger

mean, SD

2,52

8,75

10,00

17.92

6,27

14,43

median, IQR

0,00

0–0,00

0,00

0–16,67

0,00

0–0,00

0,038

Anger, trait

mean, SD

26,01

18,61

31,60

23,48

42,70

17,23

median, IQR

22,22

11,11–37,04

29,62

12,96–44,44

40,74

33,33–55,56

0,004

temperament

mean, SD

21,85

17,47

26,56

23,99

38,72

21,44

median, IQR

16,67

8,33–33,33

25,00

8,33–41,67

33,33

25–58,33

0,012

reaction

mean, SD

31,57

23,62

37,05

25,49

49,51

21,14

median, IQR

25,00

8,33–50,00

33,33

16,67–58,33

50,00

33,33–66,67

0,013

Expression Out

mean, SD

22,96

14,54

26,95

17,13

30,88

20,20

median, IQR

20,83

12,5–33,33

22,92

14,58–37,50

25,00

20,83–37,50

0,227

Expression In

mean, SD

30,60

20,68

32,29

16,93

52,70

24,24

median, IQR

25,00

16,67–45,83

31,25

20,83–41,67

50,00

33,33–66,67

0,003

Control Out

mean, SD

63,76

23,89

52,83

26,43

55,18

27,72

median, IQR

66,67

47,92–80,95

50,00

33,33–76,19

61,94

38,10–76,19

0,083

Control In

mean, SD

60,93

23,50

50,39

23,00

50,74

25,44

median, IQR

64,58

45,83–75,00

45,83

35,42–66,67

54,17

29,17–75,00

0,029

* Kruskal-wallis test

Table 5: Descriptive statistics of STAXI-2 scales and subscales, separately for Quality of Life and gender

Quality of Life
Males, N=142

low (1–3)
N=100

medium (4–7)
N=24

high (8–10)
N=18

pvalue

Anger, state

mean, SD

21,11

24,72

8,01

13,27

5,09

11,21

median, IQR

7,78

2,22–41,11

4,44

0–8,89

0,00

0–4,44

0,002

feeling

mean, SD

30,56

30,01

13,73

16,53

7,31

12,11

median, IQR

16,67

6,67–56,67

6,67

0–20,00

0,00

0–13,33

0,001

verbal anger

mean, SD

25,00

33,77

6,27

14,66

5,59

16,69

median, IQR

6,67

0–50,00

0,00

0–6,67

0,00

0–0,00

0,017

physical anger

mean, SD

7,78

14,17

4,02

13,97

2,37

9,96

median, IQR

0,00

0–10,00

0,00

0–0,00

0,00

0–0,00

0,040

Anger, trait

mean, SD

41,36

23,79

26,31

20,99

20,13

17,22

median, IQR

44,44

24,07–55,56

20,37

11,11–37,04

14,81

7,41–25,93

0,006

temperament

mean, SD

34,72

22,43

20,96

21,57

13,98

18,47

median, IQR

33,33

12,5–54,17

16,67

0–33,33

8,33

0–25,00

0,004

reaction

mean, SD

46,53

27,40

33,46

26,33

27,28

22,29

median, IQR

41,67

29,17–62,50

25,00

16,67–45,83

25,00

8,33–33-33

0,032

Expression Out

mean, SD

31,60

22,29

24,94

14,32

21,24

15,68

median, IQR

29,17

14,58–39,58

20,83

14,58–33,33

16,67

8,33–29,17

0,131

Expression IN

mean, SD

38,54

19,15

39,52

18,37

27,82

18,81

median, IQR

35,42

29,17–47,92

41,67

25–52,08

25,00

8,33–41,67

0,001

Control Out

mean, SD

40,87

19,63

70,03

22,77

67,20

26,17

median, IQR

38,10

28,57–52,38

73,81

52,38–90,48

71,43

52,38–85,71

0,001

Control In

mean, SD

36,46

15,19

60,23

21,48

60,89

25,59

median, IQR

41,67

29,17–45,83

60,42

45,83–77,08

66,67

45,83–79,17

0,001

Quality of Life
Females, N=139

low (1–3)
N=12

medium (4–7)
N=77

high (8–10)
N=50

pvalue

Anger, state

mean, SD

12,41

10,05

13,33

17,38

7,91

15,44

median, IQR

15,56

2,22–17,78

6,67

2,22–20,00

2,22

0–6,67

0,008

feeling

mean, SD

25,56

20,66

19,05

20,34

12,13

20,90

median, IQR

20

6,67–46,67

13,33

0–26,67

6,67

0–13,33

0,006

verbal anger

mean, SD

8,89

11,84

15,57

24,49

7,33

17,68

median, IQR

0

0–20,00

0

0–20,00

0,00

0–0,00

0,023

physical anger

mean, SD

2,78

6,64

5,28

13,86

4,27

11,33

median, IQR

0

0–0,00

0

0–0,00

0,00

0–0,00

0,868

Anger, trait

mean, SD

34,26

23,64

32,28

21,62

23,63

16,05

median, IQR

27,78

16,67–55,56

29,63

14,81–44,44

22,22

11,11–33,33

0,078

temperament

mean, SD

31,94

25,08

27,16

21,90

20,00

14,96

median, IQR

25

16,67–50,00

25

8,33–41,67

16,67

8,33–33,33

0,194

reaction

mean, SD

36,81

29,4

38,53

25,22

29,50

20,91

median, IQR

29,17

12,5–66,67

33,33

16,67–58,33

25,00

16,67–50,00

0,181

Expression Out

mean, SD

26,74

24,58

25,38

14,77

23,58

15,76

median, IQR

18,75

10,42–35,42

25

12,5–33,33

20,83

12,5–33,33

0,618

Expression IN

mean, SD

30,9

21,35

37,12

19,78

29,08

23,34

median, IQR

27.08

18,75–37,50

33,33

20,83–50,00

25,00

12,5–41,67

0,037

Control Out

mean, SD

44,84

28,31

62,77

23,62

59,90

26,14

median, IQR

42,86

28,57–64,29

66,67

42,86–80,95

61,90

38,09–80,95

0,102

Control In

mean, SD

37,15

23,13

59,63

22,76

58,42

24,22

median, IQR

33,33

18.75–52,08

62,50

41,67–75,00

62,50

41,67–75,00

0,017

* Kruskal-wallis test

Table 6: Descriptive statistics of STAXI-2 scales and subscales by progression of disease and gender

Progression of disease
Males, N=142

No
N=28

Yes
N=114

p-value

Anger, state

mean, SD

4,21

7,61

8,73

15,38

median, IQR

0,00

0–5,56

4,44

0–8,89

0.079

feeling

mean, SD

7,14

11,61

13,63

18,40

median, IQR

0,00

0–13,33

6,67

0–20,00

0,051

verbal anger

mean, SD

5,00

12,65

8,19

19,59

median, IQR

0,00

0–0,00

0,00

0–6,67

0,382

physical anger

mean, SD

0,48

1,75

4,39

13,71

median, IQR

0,00

0–0,00

0,00

0–0,00

0,125

Anger, trait

mean, SD

20,11

19,74

26.06

20,46

median, IQR

14,81

5,56–25,93

22,22

11,11–37,04

0,120

temperament

mean, SD

12,80

20,22

20,61

21,01

median, IQR

8,33

0–12,50

16,67

0–33,33

0,032

reaction

mean, SD

27,68

22,46

32,89

25,74

median, IQR

25,00

8,33–33,33

25,00

16,67–41,67

0,442

Expression Out

mean, SD

23,21

14,80

24,05

16,15

median, IQR

20,83

12,5–33,33

22,92

12,5–33,33

0,918

Expression IN

mean, SD

33,18

20,27

34,61

19,23

median, IQR

31,25

18,75–45,83

33,33

20,83–45,83

0,721

Control Out

mean, SD

73,13

19,58

64,66

26,20

median, IQR

73,81

59,52–90,48

71,43

42,86–85,71

0,183

Control In

mean, SD

65,33

20,26

56,83

24,37

median, IQR

64,58

52,08–83,33

58,33

41,67–75,00

0,113

Progression of disease
Females, N=139

No
N=45

Yes
N=94

p-value

Anger, state

mean, SD

9,98

12,69

11,94

17,80

median, IQR

6,67

2,22–13,33

2,22

0–17,78

0,530

feeling

mean, SD

18,07

19,63

16,67

21,48

median, IQR

13,33

6,67–20,00

6,67

0–26,67

0,271

verbal anger

mean, SD

8,44

16,66

13,83

23,55

median, IQR

0,00

0–13,33

0,00

0–20,00

0,261

physical anger

mean, SD

3,41

9,06

5,32

13,81

median, IQR

0,00

0–0,00

0,00

0–0,00

0,984

Anger, trait

mean, SD

29,79

14,71

29,12

22,56

median, IQR

29,63

18,52–40,74

22,22

11,11–44,44

0,362

temperament

mean, SD

23,33

15,65

25,80

22,13

median, IQR

25,00

8,33–33,33

25,00

8,33–33,33

0,875

reaction

mean, SD

37,41

19,75

34,04

26,29

median, IQR

33,33

25–50,00

29,17

8,33–58,33

0,227

Expression Out

mean, SD

24,81

12,96

24,87

17,40

median, IQR

20,83

16,67–33,33

20,83

12,5–33,33

0,567

Expression IN

mean, SD

33,89

18,65

33,60

22,76

median, IQR

33,33

20,83–45,83

29,17

16,67–50,00

0,650

Control Out

mean, SD

60,11

23,31

60,23

26,26

median, IQR

61,90

42,86–76,19

61,90

42,86–80,95

0,869

Control In

mean, SD

57,41

22,27

57,18

24,87

median, IQR

62,50

41,67–75,00

62,50

41,67–75,00

0,941

* Kruskal-wallis test

Discussion

Among patients with a diagnosis of cancer, anger is one of the “expected” emotional reactions. Surprisingly we failed to found relationships between the characteristics of anger, its expression and control, and the clinical objective characteristics of the cancer as type, stadium, progression of disease, years from diagnosis, and being in chemotherapeutic treatment. Neither association have been found with patients’ sociodemographic characteristics, with the exclusion of years of education. To have less than 14 years of school is associated with high scores in State and Trait Anger, while having more than 13 years of school is associated with more Anger Control In, males and females attempted to relax them to reduce angry. In this sample we have found low scores related to the intensity of the individual’s angry feelings (Anger State), especially among males, and more high scores in the tendency to become angry when people faced with a negative or difficult to control situation (Anger Reaction). At the same time, the Anger Expression scores, especially “In”, reflect that these patients tend to suppress, repress, deny anger feelings. Together with high Anger Control scores reflecting the expenditure of energy that people do to monitoring and control the expression of angry. Generally, people emotionally over-reactive with a high control of emotions experienced an internal conflict and become anxious and depressed especially if the situation causing anger persists. In this sample, males and females showed differently their emotional state of anger. Males tend to repress anger and show a lack of control of anger towards the outside, more than females. Adopting anger repression as the preferred mode of expression of anger could lead to depression and directly affects the immune system.

Nonetheless responses of anxiety, depression and anger seem to be organized into a pattern of a general emotional reaction. A first hypothesis is that worsening mood is associated with increased communication between the amygdala and hippocampus, which are linked to emotion and memory respectively. Probably due to individual and gender differences. Testosterone has been associated with increased emotional reactivity in the brain [18] and patient’s personal history could explain why an anger mood (in the amygdala) became a trigger for the recollection of sad memories (in memory). In this framework patient’s ability to control anger could be the defense that consent patient to feel better. And we have seen that this ability differs in males and females. From an immunological point of view, we know that there are different interconnections between emotions and immune response and between gender and immune response. Gender differences have also been reported recently in the response to immunotherapy treatments by Botticelli [19]. Many genes involved in the immune response are located on the X chromosome and gender and diet are implicated in differences in the function of microbiota in the modulate of the immune system. The study of specific differences between the sexes in the processing and reactions to emotions could have important implications for immunotherapy treatment use in cancer due to its different efficacy in males and females.

From an oncological point of view some serious considerations are to be taken on commitment at this time that immunotherapy is becoming an important cancer treatment. If we want to boost the body’s natural defenses to fight cancer therefore the healthy immune systems became our primary concern. In conclusion, staff working in oncological day hospital should be trained to identify patients with emotional difficulties and facilitate referral for treatment. Today there is a growing interest in the use of patient-reported outcome measures that could capture some peculiar aspects that are not normally understood during the doctor-patient visit. Clinicians could gain important insights about their patients by looking at the result of validated self-report patient questionnaires, to identify patients with inadequate expression of emotion or too high levels of emotional reaction in order to improve quality of care and a better response to treatment.

Abbreviations: CI, Confidence Interval; HADS, Hospital Anxiety and Depression Scale; IQR, interquartile range; PD, progression of disease; QoL, quality of life; SD, standard deviation; STAXI, State-Trait Anger Expression Inventory.

References

  1. Heany SJ, van Honk J, Stein DJ, Brooks SJ (2016) A quantitative and qualitative review of the effect of testosterone on the function and structure of the human social-emotional brain. Metabolic Brain Disease 31: 157–167. [Crossref]
  2. Van Wingen GA, Ossewaarde L, Backstrom T, Hermans EJ, Fernandez G (2011) Gonadal hormone regulation of the emotion circuity in humans. Neuroscience 191: 38–45. [Crossref]
  3. Barinkova K, Mesarosova M (2013) Anger, coping and quality of life in female cancer patients. Social behavior and personality 41: 135–142.
  4. Cox T, Mackay C (1982) Psychosocial factors and psychophysiological mechanism in the aetiology and development of cancer. Social Science & Medicine 16: 381–396.
  5. Diagnostic and Statistical Manual of Mental Disorders, Fifth Edition, DSM-5. (2013) American Psychiatric Publishing, Arlington, VA.
  6. Aghaei M, Ghorbani N, Rostami R, Mahdavi A (2015) Comparison of anger management, anxiety and perceived stress in patients with cancer and Coronary Heart Disease (CHD). Journal of Medicine and Life 8: 97–101. [Crossref]
  7. Thomas SP, Groer M, Davis M, Droppleman P, Mozingo J, et al. (2000) Anger and cancer: an analysis of the linkages. Cancer Nurs 23: 344–349. [Crossref]
  8. Harburg E, Julius M, Kaciroti N, Gleiberman L, Schork MA (2003) Expressive/suppressive anger- coping responses, gender, and types of mortality: a 17-year follow-up (Tecumseh, Michigan, 1971–1988). Psychosom Med  65: 588–597.
  9. Appel MA, Holroyd KA, Gorkin L (2005) Anger and the etiology and progression of physical illness. In: Temoshok L, Van Dyke C, Zegans LS (eds.) Emotions in health and illness. Grune & Straton, New York, 73–87.
  10. Greer S, Morris T (1975) Psychological attributes of women who develop breast cancer: A controlled study. Journal of Psychosomatic Research 19: 147–153.
  11. White VM, English DR, Coates H, Lagerlund M, Borland R, et al. (2007) Is cancer risk associated with anger control and negative affect? Findings from a prospective cohort study. Psychosom Med 69: 667–674. [Crossref]
  12. Berkowitz L, Harmon-Jones E (2004) Toward an understanding of the determinants of anger. Emotion 4: 107–130. [Crossref]
  13. Spielberger CD. STAXI-2: State-Trait Anger Expression Inventory-2: Professional Manual. PAR Psychological Assessment Resources 1999.
  14. Vagg PR, Spielberger CD. State-Trait Anger Expression Inventory™ Interpretive Report (STAXI-2: IR™). PAR Psychological Assessment Resources 1999.
  15. Zigmond AS, Snaith RP (1983) The hospital anxiety and depression scale. Acta Psychiatr Scand 67: 361–370. [Crossref]
  16. Bjelland I, Dahl AA, Haug TT, Neckelmann D (2002) The validity of the hospital anxiety and depression scale: an updated literature review. J Psychosom Res 52: 69–77. [Crossref]
  17. Mazzotti E. Sebastiani C, Marchetti P (2012) Patient-perception of the disease control and relationship with psychosocial variables. Cancer Management and Research 4: 335–340.
  18. Klein S, Kruse O, Tapia Leon I, Stalder T, Stark R, et al. (2019) Increased neural reactivity to emotional pictures in men with high hair testosterone concentrations. Social Cognitive and Affective Neuroscience 14: 1009–1016.
  19. Botticelli A, Onesti CE, Zizzari I (2017) The sexist behaviour of immune checkpoint inhibitors in cancer therapy? Oncotarget 8: 99336–99346. [Crossref]

Acute Massive Aortic Dissection Secondary to Vascular Endothelial Growth Factor Inhibitor: An Uncommon Presentation of Drug-Induced Cardiovascular Toxicity

DOI: 10.31038/JCCP.2020316

Introduction

In a patient presenting with severe acute chest or back pain, aortic dissection is a concerning etiology and requires immediate attention due to its profound morbidity and mortality. Less common presentations include altered mental status, stroke symptoms, and syncope, which represent less than 30% of aortic dissections. Risk factors have been well described, and include history of uncontrolled hypertension, connective tissue disease, and vasculitis. We present a case of acute Stanford Type A aortic dissection in a patient without risk factors but with recent history of bevacizumab treatment, who also presented with atypical symptoms.

Case Description

The patient is a 60 year old female with past medical history of colon cancer metastatic to liver and lung, who woke from sleep with severe chest pain, followed by right facial droop and right upper extremity weakness. Stroke code was called and Glasgow Coma Scale was 5 on admission, but CT Head was negative for hemorrhage or large-territory infarct. CT angiography of the brain and neck partially showed a Stanford type A aortic dissection, and CT aneurysm study confirmed the dissection, which extended from the aortic valve to the femoral arteries and included the great vessels, celiac trunk, and superior mesenteric artery. She was in shock on admission, was intubated and sedated. Based on the patient’s frailty she was a poor surgical candidate, and the family stated she would have declined repair. She lived for another day in the ICU before transitioning to comfort care.

Postmortem review revealed no classic risk factors for aortic dissection. The patient had no history of hypertension, connective tissue disease, or vasculitis, prompting further evaluation of her extensive history of chemotherapy. She was originally diagnosed with moderately-differentiated colon cancer in 2012 and subsequently underwent multiple resections of the primary tumor and metastasis (liver and peritoneum). Bilateral pulmonary nodules were found and treated medically. Multiple antitumor agents were used since 2012, the majority of which involved many iterations of fluorouracil and bevacizumab. The last chemotherapy regimen consisted of FOLFIRI and bevacizumab, which was resumed four months prior to the dissection.

Discussion

This case illustrates the broad range of presentations of aortic dissection, including altered mental status or stroke symptoms, as well as devastating complications of certain antitumor regimens. Cardiovascular side effects can be the most profound, especially in the use of fluoropyrimidines (e.g. fluorouracil) and vascular endothelial growth factor (VEGF) pathway inhibitors (e.g. bevacizumab). In the absence of typical risk factors, repetitive vascular toxicity from these agents likely represents the causative pathophysiology for the acute dissection. While aortic dissection is an uncommon complication of these therapies, it is incumbent on providers to recognize this possibility and recall the variable presentations of the pathology.

JCCP_2020-Joey Saliba L-f1

Figure 1. Sagittal view showing Stanford type A aortic dissection extending from aortic valve
into abdomen

JCCP_2020-Joey Saliba L-f2

Figure 2. Axial view showing aortic dissection involving arch and all three arch arterial
branches.

Splenic Changes in Heart Surgery with Circular Circulation

DOI: 10.31038/JCCP.2020315

Summary

Cardiac surgery-related morbidity and mortality may be higher in patients with malignant neoplastic disease. Inflammatory phenomena and immunological alterations secondary to the use of cardiopulmonary bypass may also increase tumor recurrence. The aging population favors the early diagnosis of cancer and new therapies that increase the survival of patients with malignant neoplasms. emergence of cancer patients who at the same time have a cardiomyopathy that requires surgery. The benefits, especially in terms of long-term survival and risks, have not yet been clearly established. This study evaluated the characteristics of cancer patients undergoing cardiac surgery with Cardiopulmonary Bypass (CPB) indicated for a different cause of the tumor: type of procedure required, morbidity and mortality, long-term survival and incidence of tumor recurrence. To carry out this study, we used bibliographic research, performing a review on the topic.

Keywords

Cardiac surgery, Extracorporeal circulation, Splenic changes

Introduction

Controversy over the appropriateness of cardiac surgery in cancer patients, especially if they are not in complete remission, is increasing in daily clinical practice. As there are no objective reasons to justify higher mortality in these patients, the interest of the procedure focuses on the prospects for long-term survival and the risks arising from the use of CPB through direct alteration of the immune system, may exacerbate the tumor and favor dissemination and / or relapse [1]. Since the 1990s, studies on cancer patients undergoing cardiac surgery have been published. Some exclude newly diagnosed or untreated cancers and others refer exclusively to the association of cardiac surgery and the simultaneous or deferred surgical excision of lung tumors. A third group describes the results of surgical treatment of cancers that affect the heart as a primary tumor or metastasis and require CPB for resection [2]. Finally, a final group includes patients affected by tumors with special characteristics, such as hematologic malignancies. The publications are few and far between and the series are limited and heterogeneous due to the low number of operated patients. The risk of selection bias is difficult to avoid and, in addition, the different origins, stages and degrees of tumor differentiation and spread make it difficult to compare results [3]. Although clinical treatment of heart disease progresses from year to year and the less invasive approach is expanding rapidly, cardiac surgery is the preferred intervention in some cases of heart disease [4]. Therefore, this study deals with cardiopulmonary bypass and cardiac surgery, considering the main theoretical findings on the subject.

Cardiopulmonary Bypass

Supportive cardiopulmonary bypass during cardiac surgery is unique because blood exposed to foreign surfaces of nonendothelial cells is collected and continuously recirculated throughout the body. This contact with synthetic surfaces within the perfusion circuit, as well as open tissue surfaces within the wound, trigger a defensive reaction involving at least five plasma protein systems and five circulating blood cell types [5]. This inflammatory response to cardiopulmonary bypass initiates a powerful thrombotic stimulus and the production, release, and circulation of vasoactive and cytotoxic substances that affect all organs and tissues of the body. Because of this, open-heart surgery using cardiopulmonary bypass is not possible without anticoagulation, which is usually with heparin; thus, the inflammatory response to cardiopulmonary bypass involves the consequences of exposure of heparinized blood to foreign surfaces uncoated with endothelial cells [6]. During Cardiopulmonary Bypass (CPB) for cardiac surgery, blood is typically severely drained into the venous reservoir of the heart-lung machine through cannulae placed in the superior and inferior vena cava or a single cannula placed in the right atrium. Specialized cannulae can also be placed in the inferior vena cava through a femoral approach [7].

The blood from the reservoir is then pumped through a hollow fiber oxygenator after appropriate gas exchange that occurs in the systemic arterial system through a cannula placed in the distal ascending aorta, femoral artery or axillary artery. This basic extracorporeal perfusion system can be adapted to provide partial or full circulatory and respiratory support or partial support for the left or right heart or lungs separately [8]. That is, Cardiopulmonary Bypass (CPB) is used to maintain the patient’s blood circulation and / or pulmonary function outside the body. Oxygen-depleted blood is diverted out of the body and enriched with oxygen, passing it through an artificial lung (oxygenator) before being pumped back into the patient’s circulation for up to six hours [9].

Results Analysis and Discussion

Heart Disease And Cardiopulmonary Bypass (CPB)

In order to perform different types of cardiac surgeries, Cardiopulmonary Bypass (CPB) remains a frequent procedure, aiming to provide a clean surgical field, preserve the functional characteristics of the heart and provide safety to the surgical team [10]. Cardiopulmonary Bypass (CPB) is a form of circulation in which the patient’s blood is diverted from the heart and lungs out of the body. The normal physiological functions of the heart and lungs, including blood circulation, oxygenation and ventilation, are temporarily taken over by the ECC machine [7,11]. In most cases, the heart is also separated from the circulation (eg, aortic clamping) and the cardioplegia solution is administered to allow the cardiac surgeon to operate on a heart not beating in a bloodless field while other end organs they are adequately oxygenated and perfused [12].

General Principles

Equipment and Physiology

CPB components include pumps, tubing, and gas exchange (oxygenator) and heat exchange units. Modern CPB machines are also equipped with systems that continuously monitor line or circuit pressure, temperature and blood parameters (eg, oxygen saturation, blood gases, hemoglobin [Hgb], potassium) as well as safety features such as air and fluid level detection. Systems and a blood filter in the arterial line [10,12,13]. During cardiopulmonary bypass, venous blood is drained from the right atrium and is diverted through the venous line of the CPB circuit to a venous reservoir [14]. CPB machines are typically equipped with vacuum assisted technology that facilitates drainage to maintain a bloodless surgical field and allows the use of smaller venous cannulas and reduced CPB circuit volumes. The arterial pump acts as an artificial heart by drawing blood from this reservoir and propelling it through a heat exchanger, an artificial lung (oxygenator or gas exchanger) and, finally, an arterial line filter [15]. The blood is then returned to the patient through an arterial cannula positioned in the ascending aorta or other major artery. Additional cardiopulmonary bypass pumps or other components are employed as needed to suck blood from the surgical field, provide cardioplegia solution to produce cardiac electromechanical silence, decompress the heart through a vent and remove fluid (ultrafiltration) [9,16]. Thus, the cardiopulmonary machine temporarily assumes the functions of the heart, lungs and, to a lesser extent, the kidneys [17].

The contact of blood with non-endothelial surfaces of the CPB circuit induces an intense inflammatory response. This results in platelet activation and initiation of the coagulation cascade with decreased levels of circulating coagulation factors. Endothelial cells and leukocytes are activated, releasing mediators that may contribute to capillary leakage and tissue edema. Many of the challenges encountered during weaning from CPB and in the postoperative period are considered consequences of this inflammatory sequence [17]. In addition, the CPB circuit priming solution (typically 1 to 2 liters of a balanced crystalloid solution) results in hemodilution with anemia and temporary or persistent coagulopathy [18].

Protocol

Surgical procedures that require CPB follow a predictable sequence of events including CPB circuit initiation and testing, anticoagulation, vascular cannulation, CPB initiation and maintenance, and finally CPB weaning and termination. Myocardial arrest with myocardial protection and myocardial reperfusion are additional considerations when a stationary heart and a bloodless field are desired. Protocols established for the management of CPB parameters approaching normal physiology [19].

  • In adults, the target flow rate during CPB is 2.2 to 2.4 Liters / min / m² in normothermic patients to approach a normal cardiac index; cardiac index is appropriately decreased if hypothermia is induced [6,20].
  • Mean arterial pressure (MAP) is usually directed to ≥65 mmHg, but the goal may be higher in elderly patients and those with cerebrovascular disease. MAP should not exceed 100 mmHg [20,21].
  • The adequacy of target organ perfusion is determined by the analysis of arterial blood gases and mixed venous oxygen saturation (SvO2), which is continuously monitored and maintained ≥75 percent throughout CPB. Arterial blood gas analysis, baseline deficit and lactate levels are intermittently checked (approximately every 30 minutes) [22].
  • ECB weaning preparations and checklists to ensure readiness for weaning are described separately [9,18].

Cardiopulmonary Bypass

Objectives during CPB include maintenance of general anesthesia, anticoagulation, and parameters that approximate normal physiology for optimal end-organ function [23]. Arterial oxygenation, ventilation and blood gas – Arterial pO 2 is maintained at 150 to 250 mmHg during CPB. A continuous arterial blood pressure monitoring system is located on the arterial line of the CPB circuit, and a continuous venous oximeter is located on the venous return line. Arterial blood gas values are checked in the laboratory or by point-of-care testing approximately every 30 minutes, which also allows intermittent recalibration of the continuous blood gas monitor in the arterial line [24]. More specific oxygenation strategies (eg targeting hyperoxia) have not been shown to be clinically beneficial. A 2018 systematic review of 12 randomized trials noted little evidence of differences in the outcome of a hyperoxic rather than normoxic oxygenation strategy used during cardiac surgery, but the studies were small and heterogeneous [21,22,8]. Two studies [9,25] reported a reduction in postoperative myocardial enzymes and one study reported a reduction in mechanical ventilation time in normoxic groups. Alpha-stat management of arterial blood gases without temperature correction is used to maintain a normal range for pCO 2 (35 to 45 mmHg [4.7 to 6 kPa]) and pH (7.35 to 7.45) [25]. Maintaining PaCO 2 and pH within this physiological range during CPB is important to preserve cerebral self-regulation [26].

Ventilation of the lungs during CPB has not been shown to improve lung function and may increase the technical difficulty for the surgeon. Some doctors use continuous positive airway pressure (CPAP) during CPB. In a meta-analysis of seven small randomized trials, the use of 5 to 15 cmH20 CPAP improved the postoperative alveolar-arterial oxygen gradient (Aa gradient) by a weighted average difference of approximately 31 mmHg [23]. Pump flow and mixed venous oxygen saturation – CPB flow rates are set at 2.2 to 2.4 Liters / min per m² in a normothermic patient to provide adequate blood flow for optimal brain and other end organ perfusion. . These rates may be slightly decreased if hypothermia is employed [27]. Acute decreases in Mean Arterial Pressure (MAP) or increases in Central Venous Pressure (CVP) may indicate a sharp reduction in venous return due to the surgeon’s lifting of the heart (causing a reduction in flow), a misplaced or twisted arterial or venous cannula, or obstruction of blood flow by an air blockage. With severe reduction in venous return, the perfusionist may need to administer volume to the CPB reservoir or reduce arterial flow. Persistent reductions in arterial line flow and / or venous return should be urgently addressed, identifying and correcting the cause [2,5,24].

Mixed venous oxygen saturation (SvO2) is maintained ≥75% throughout CPB as a peripheral perfusion adequacy monitor. Persistent SvO 2 values <75% may indicate inadequate oxygen supply and are associated with worse outcomes, including postoperative delirium and decreased long-term survival [27]. In addition, lactate and baseline deficit values are measured when arterial blood gases are obtained approximately every 30 minutes. Although absolute lactate values are multifactorial, increasing levels during CPB represent anaerobic metabolism at the cellular level due to inadequate tissue oxygen delivery and may reflect hypoperfusion during CPB, particularly if maintained or associated with low mixed venous saturation. oxygen (SvO 2 <70%) [28]. Treatment for SvO 2 <75 percent, baseline deficit less than -5, or lactate level> 4 mEq / L is directed to increasing CPB flow rate as well as ensuring that blood gas and hemoglobin levels ( Hgb) are suitable. It is common practice to administer sodium bicarbonate for a baseline deficit below -5, or lactate level> 4 mEq / Liter, but excessive administration of sodium bicarbonate may cause postoperative hypernatremia [19,20]. Although increased lactate level during CPB is more often the result of inadequate tissue perfusion, persistent postoperative lactic acidosis may occur due to other factors (eg, beta-adrenergic metabolic effects of epinephrine infusion) [28]. Mean blood pressure – In the context of acceptable CPB flow rates, MAP is generally directed to ≥ 65 mmHg; a higher target may be selected in elderly patients and in those with cerebrovascular disease [28].

In a retrospective study30 of nearly 7500 patients, postoperative stroke was associated with prolonged periods with MAP <65 mmHg, with an adjusted odds ratio (OR) of 1.13 for each 10-minute period that was 55 to 64 mmHg during and after surgery. After CPB (95% CI 1.05–1.21) and adjusted OR of 1.16 for each 10-minute period when MAP was <55 mmHg (95% CI 1.08–1.23) Other factors associated with stroke in this study were advanced age, history of hypertension, combined procedures of valvular myocardial revascularization, prolonged CPB duration, emergency surgery, and new onset of postoperative atrial fibrillation [11,29]. However, a randomized study in 197 patients showed no reduction in the number or volume of cerebral infarcts in those who received vasopressor therapy to maintain a nearly physiological MAP target (70 to 80 mmHg) compared to those who had a smaller target. MAP (40 to 50 mmHg) [30]. Episodes of low or high blood pressure during CPB have been associated with the risk of brain events and other adverse outcomes, although a causal relationship has not been established [21]. A retrospective study [31] observed that impaired cerebral self-regulation is common, occurring in almost one third of patients undergoing cardiac surgery with CPB. In this study, impaired self-regulation was associated with small brain vessel disease (identified with brain magnetic resonance imaging) but was not associated with large vessel disease (identified by transcranial Doppler). However, it is not yet clear how these data inform the management of blood pressure in individual patients.

During attempts to increase MAP, it is important to ensure adequate pump flow and to maintain clear communication between the anesthesiologist (who may be adjusting the systemic vascular resistance of the vasopressor patient) and the perfusionist (who may be adjusting the flow rate) effective heart rate with changes in pump flow) [34]. MAP should not exceed 100 mmHg, in most patients a range of MAP from 65 to 100 mmHg allows for self-regulation of cerebral circulation and other target organs throughout CPB, although it is not possible to determine an accurate range of self-regulation for each patient. Individual [3,25].

Hypotension

Moderate hypotension – In the context of acceptable CPB flow rates, if MAP is below the target range, the perfusionist may increase pump flow (equivalent to increasing cardiac output), particularly if <2.4 L / min / m². If hypotension persists after increased pump flow, a vasopressor may be administered as an intravenous (IV) bolus or by continuous infusion. In many institutions, small bolus doses of phenylephrine (eg 40 to 100 mcg) are administered directly into the CPB reservoir to treat hypotension. Phenylephrine infusions at 10 to 200 mcg / min, vasopressin at 0.04 units / min or norepinephrine at 0.02 to 0.06 mcg / kg / min are also commonly employed [22]. Severe vasoplegia – systemic vasodilation, characterized by markedly decreased systemic vascular resistance (SVR) and low MAP during and after CPB, occurs in 5 to 25 percent of patients undergoing cardiac surgery. Risk factors include the preoperative use of agents such as angiotensin converting enzyme (ACE) inhibitors, heparin or calcium channel blockers, as well as hemodynamic instability before passage [17]. Before treating low blood pressure near the end of the CPB period, it is important to verify that radial blood pressure is not markedly underestimating central aortic pressure. A significant central pressure gradient associated with end-CPB rewarming is often present during cardiac surgery. Attaching a pressure transducer to the side port of the aortic cannula after CPB is complete, or the use of a surgeon-inserted femoral intraarterial catheter in the field will usually provide an accurate estimate of true central aortic pressure [33].

If hypotension due to vasoplegia (low SVR) is confirmed, a continuous vasopressor infusion is usually necessary. Although an optimal approach for vasopressor selection during CPB has not been established, observations in the distributive shock scenario suggest that administration of vasopressin or a combination of vasopressin with noradrenaline or phenylephrine is associated with lower atrial fibrillation rates compared to administration. isolated from norepinephrine [34]. If these agents are ineffective, methylene blue 1 to 2 mg / kg IV for 20 minutes may be administered to reduce the responsiveness of nitric oxide resistance vessels. Notably, methylene blue should be avoided in patients receiving chronic serotonin therapy (eg, fluoxetine) because of the risk of serotonin syndrome and may interfere with monitors employing oximetry to measure oxygen saturation (pulse oximetry and cerebral oximetry) [5,29]. Hypertension – If MAP increases to> 90 mmHg during CPB, treatment includes increasing the concentration of volatile anesthetic administered through the CPB circuit and / or administering additional IV anesthetic. Occasionally, administration of a vasodilator may be required. For brief periods, pump flow may be reduced while these pharmacological interventions are effective [35]. Anticoagulation Maintenance – The adequacy of heparin anticoagulation is measured with point-of-care tests such as activated whole blood clotting time (ACT) every 30 minutes to maintain a target value during CPB (typically above 480 seconds). If available, plasma heparin concentrations may also be determined by treatment point assays such as Hepcon with target heparin concentration ≥4 units / mL. Protocols in some institutions emphasize the treatment of heparin concentrations <4 units / mL, even if ACT values are adequate [36].

Special Population Management

Specific management strategies are employed during CPB for patients with aortic insufficiency, cerebrovascular disease, renal failure, or vasoplegia and for those undergoing a period of elective deep hypothermic circulatory arrest (DHCA) [6,30]. Pre – existing Aortic Regurgitation (AR) can be diagnosed and its severity characterized by intraoperative Transesophageal Echocardiography (TEE) examination in the pre – reception period. During CPB, the presence of AR may limit the effectiveness of administration of anterograde cardioplegia solution to the coronary artery ostia after the ascending aorta is crossed [37]. Much of the cardioplegia solution will regurgitate through the incompetent aortic valve to the Left Ventricle (LV). The severity of RA can be influenced by the increased aortic root pressure that occurs during attempted delivery of anterograde cardioplegia and surgical manipulations that further distort the normal aortic root and valve geometry [38]. In addition, cardioplegia solution that flows back through the incompetent aortic valve may cause LV distention as the ventricle is not ejecting regularly due to bradycardia, asystole or ventricular fibrillation. Distension causes increased LV wall tension. In combination with inadequate coronary delivery of anterograde cardioplegia solution, this may result in inadequate myocardial protection and severe LV dysfunction. In this situation, a LV ventilator is placed by the surgeon to keep the ventricle in an uncompressed state [4,15,28].

Correct ventilation placement and effective LV decompression are confirmed with the TEE examination. Subsequently, continuous monitoring of TEE and Pulmonary Artery Pressure (PAP) supplement the surgical detection of a displaced LV output or recurrence of LV distension [28]. If the administration of anterograde cardioplegia is inadequate due to RA, the cardiac surgeon usually minimizes the attempted delivery by this route, opting for retrograde cardioplegia provided by the coronary sinus. In selected aortic valve or aortic root procedures, it may be necessary to implant cardioplegia solution directly into the coronary ostia after aortic clamping and opening of the aortic root [36]. Rapid and severe LV distension may occur in a patient with significant RA, even before aortic clamping, if ventricular fibrillation occurs at the onset of CPB and on cooling. In this situation, the CPB flow rate may be temporarily reduced to allow the surgeon to manually decompress the LV, since defibrillation is more likely if the heart is empty (not distended). Defibrillation is performed with internal paddles applied directly to the heart to provide 10 to 20 joules of electricity. Subsequently, if LV distension recurs after the application of aortic cross forceps, a left ventricular opening may be inserted [39].

Cerebrovascular disease is common in patients undergoing cardiac surgery. A study that used preoperative magnetic resonance imaging observed a major brain vessel disease in 25% and small vessel disease present in 35% of 346 patients undergoing cardiac surgery with CPB. Considerations for patients with known cerebrovascular disease and / or evidence of severe aortic atherosclerosis include maintaining a higher mean arterial pressure than patients without these comorbidities, with careful attention to maintaining hemoglobin (Hb) and hematocrit (Hct) levels. and the prevention of cerebral hyperthermia. The use of intraoperative oximetry and the maintenance of regional cerebral oxygen saturation (rSO2) in 20% of baseline values has been advocated by patients at high risk of adverse neurological outcomes, including those with known cerebrovascular disease [23,39].

Conclusion

Cardiopulmonary Bypass (CPB) is a form in which the patient’s blood is diverted from the heart and lungs out of the body. Normal physiological functions of the heart and lungs, including blood circulation, oxygenation, and ventilation, are temporarily taken over by the CPB machine. Most studies do not show a significant increase in the morbidity and mortality of CPB cardiac surgery in cancer patients, even at an active stage, compared to the normal population. It appears that the survival of cancer patients undergoing cardiac surgery is more related to tumor progression than to the surgical procedure. Medium-term survival is acceptable, although less in active cancer patients at the time of intervention and in those <2 years between cancer diagnosis and surgery. Readmission rates are higher than in the general population and are mainly due to the need for cancer treatment and / or complications arising from it. Typical parameters during CPB in adults include controlled flow rate of 2.2 to 2.4 Liters / min / m², maintenance of mean arterial pressure (MAP) ≥ 65 mmHg and mixed venous oxygen saturation ≥ 75%. Maintaining renal blood flow is achieved by maintaining adequate CPB pump flow throughout CPB to minimize the risk of Acute Kidney Injury (AKI). Inadequate anesthetic depth is treated by increasing the volatile anesthetic concentration administered by the CPB circuit or by the administration of additional Intravenous (IV) anesthetic agents. It is reasonable to monitor processed EEG indices (eg bispectral index) or unprocessed EEG to provide data that may detect inadequate anesthesia during CPB. Decreasing the dose of the selected Neuromuscular Blocking Agent (NMBA) may be adequate during the hypothermic CPB period; however, additional NMBA is usually required during reheat. Individual assessment of each case should consider both the tumor stage and the chances of complete remission (even in active cancers) before discounting cardiac surgery. Larger studies are needed to allow comparison of morbidity and mortality outcomes and survival with and without CPB to identify their influence on these variables and long-term recurrence.

References

  1. Knapik P, Nadziakiewicz P, Urbanska E, Saucha W, Herdynska M, et al. (2009) A circulação extracorpórea aumenta a glicemia pós-operatória e o consumo de insulina após cirurgia coronariana. Ann ThoracSurg 87: 1859–1865.
  2. Kaya K, Cavolli R, Telli A, MF Soyal, Aslan A, (2010) Cirurgia de revascularização miocárdica com circulação extracorpórea com circulação extracorpórea na síndrome coronariana aguda: uma análise clínica. J CardiothoracSurg.
  3. Mistiaen WP, van Cauwelaert P, Muylaert P Wuyts F, Harrison F Bortier H (2004) Efeito de malignidade prévia na sobrevivência após cirurgia cardíaca. Ann ThoracSurg 77: 1593–1597.
  4. Musleh GS, Patel NC, Grayson AD, Pullan DM, Keenan DJ, et al. (2003) A cirurgia de revascularização do miocárdio sem circulação extracorpórea não reduz as complicações gastrointestinais. Eur J CardiothoracSurg 23: 170–174.
  5. Nurözler F, Kutlu T, Kücük G (2006) Bypass coronário sem circulação extracorpórea para pacientes com neoplasia concomitante. Circ J  70: 1048–1051.
  6. Pivoto FL, Lunardi Filho WD, Santos SS, Almeida MA, da Silveira RS (2010) Diagnósticos de enfermagem em pacientes no pós-operatório de cirurgia cardíaca. Acta Paul Enferm 23: 665–670.
  7. Woods SL, Froelicher ES, Motzer SU (2005) Enfermagem em cardiologia. 4a ed. São Paulo; Barueri (SP): Manole.
  8. Barry AE, Chaney MA, Londres MJ (2015) Manejo anestésico durante a circulação extracorpórea: uma revisão sistemática. AnesthAnalg 120: 749.
  9. Warren OJ, Smith AJ, Alexiou C, (2009) Resposta inflamatória à circulação extracorpórea: parte 1 – mecanismos da patogênese. J CardiothoracVascAnesth 23: 223.
  10. Wan S, LeClerc JL, Vincent JL (1997) Resposta inflamatória à circulação extracorpórea: mecanismos envolvidos e possíveis estratégias terapêuticas. Peito 112: 676.
  11. Dia JR, Taylor KM (2005) Síndrome da resposta inflamatória sistêmica e circulação extracorpórea. Int J Surg 3: 129.
  12. Warren OJ, Watret AL, de Wit KL (2009) A resposta inflamatória à circulação extracorpórea: parte 2 – estratégias terapêuticas antiinflamatórias. J CardiothoracVascAnesth 23: 384.
  13. Murphy GS, Hessel EA 2º, Noivo RC (2009) Perfusão ideal durante o bypass cardiopulmonar: uma abordagem baseada em evidências. AnesthAnalg 108: 1394.
  14. Hogue Jr CW, Palin CA, Arrowsmith JE (2006) Manejo do bypass cardiopulmonar e desfechos neurológicos: uma avaliação baseada em evidências das práticas atuais. AnesthAnalg 103: 21.
  15. Joshi B, Ono M, Brown C (2012) Prever os limites da autorregulação cerebral durante o bypass cardiopulmonar. AnesthAnalg 114: 503.
  16. Shann KG, Likosky DS, Murkin JM, et al. (2006) Uma revisão baseada em evidências da prática de circulação extracorpórea em adultos: um foco na lesão neurológica, controle glicêmico, hemodiluição e resposta inflamatória. J ThoracCardiovascSurg 132: 283.
  17. Heinrichs J, Lodewyks C, Neilson C (2018) O impacto da hiperóxia nos resultados após cirurgia cardíaca: uma revisão sistemática e síntese narrativa. Pode J Anaesth 65: 923.
  18. Murkin JM, Martzke JS, Buchan AM, et al. (1995) Estudo randomizado da influência da técnica de perfusão e da estratégia de manejo do pH em 316 pacientes submetidos à cirurgia de revascularização do miocárdio. II. Resultados neurológicos e cognitivos. J ThoracCardiovascSurg 110: 349.
  19. Reis Miranda D, Gommers D, Struijs A, et al. (2004) O conceito de pulmão aberto: efeitos sobre a pós-carga ventricular direita após cirurgia cardíaca. Br J Anaesth 93: 327.
  20. Bignami E, Guarnieri M, Saglietti F (2016) Ventilação mecânica durante o bypass cardiopulmonar. J CardiothoracVascAnesth 30: 1668.
  21. Svenmarker S, Haggmark S, Östman M, et al. (2013) A saturação venosa central de oxigênio durante a circulação extracorpórea prediz uma sobrevida em três anos. Interact CardiovascThoracSurg 16:21.
  22. Wang YC, Huang CH, Tu YK (2018) Efeitos da pressão positiva nas vias aéreas e ventilação mecânica dos pulmões durante a circulação extracorpórea em eventos adversos pulmonares após cirurgia cardíaca: uma revisão sistemática e meta-análise. J CardiothoracVascAnesth 32: 748.
  23. Andersen LW (2017) Elevação de lactato durante e após a cirurgia cardíaca em adultos: uma revisão de etiologia, valor prognóstico e gerenciamento. AnesthAnalg 125: 743.
  24. Smulter N, Lingehall HC, Gustafson Y, et al. (2018) Distúrbios no equilíbrio de oxigênio durante o bypass cardiopulmonar: um fator de risco para o delirium pós-operatório. J CardiothoracVascAnesth 32: 684.
  25. Smulter N, Lingehall HC, Gustafson Y, et al. (2018) Distúrbios no equilíbrio de oxigênio durante o bypass cardiopulmonar: um fator de risco para o delirium pós-operatório. J CardiothoracVascAnesth 32: 684.
  26. Ghadimi K, Gutsche JT, Ramakrishna H, et al. (2016) Uso de bicarbonato de sódio e risco de hipernatremia em pacientes cirúrgicos da aorta torácica com acidose metabólica após parada circulatória hipotérmica profunda. Ann CardAnaesth 19: 454.
  27. Ghadimi K, Gutsche JT, Ramakrishna H, et al. (2016) Uso de bicarbonato de sódio e risco de hipernatremia em pacientes cirúrgicos da aorta torácica com acidose metabólica após parada circulatória hipotérmica profunda. Ann CardAnaesth 19: 454.
  28. Totaro RJ, Raper RF (1997) Acidose láctica induzida por epinefrina após circulação extracorpórea. CritCareMed 25: 1693.
  29. Ono M, Brady K, Easley RB (2014) A duração e a magnitude da pressão arterial abaixo do limiar de autorregulação cerebral durante a circulação extracorpórea estão associadas à maior morbidade e à mortalidade operatória. J ThoracCardiovascSurg 147: 483.
  30. Hori D, Brown C, Ono M, etai. (2014) A pressão arterial acima do limite superior da autorregulação cerebral durante a circulação extracorpórea está associada ao delírio pós-operatório. Br J Anaesth 113: 1009.
  31. Nomura Y, Faegle R, Hori D (2018) Vasos pequenos cerebrais, mas não grandes da doença, estão associados com autorregulação cerebral prejudicada durante o bypass cardiopulmonar: um estudo de coorte retrospectivo. AnesthAnalg 127: 1314.
  32. Fischer GW, Levin MA (2010) Vasoplegia durante cirurgia cardíaca: conceitos e gestão atuais. SeminThoracCardiovascSurg 22: 140.
  33. Mekontso-Dessap A, Houël R, Soustelle C (2001) Fatores de risco para vasoplegia pós-circulação extracorpórea em pacientes com função ventricular esquerda preservada. Ann ThoracSurg 71: 1428.
  34. Shaefi S, Mittel A, Klick J, et al. (2018) Vasoplegia Após Procedimentos Cardiovasculares – Fisiopatologia e Terapia Direcionada. J CardiothoracVascAnesth 32: 1013.
  35. Stern DH, Gerson JI, Allen FB, Parker FB (1985) Podemos confiar na pressão arterial radial direta imediatamente após o bypass cardiopulmonar? Anestesiologia 62: 557.
  36. Bazaral MG, Nacht A, Petre J, et al. (1988) Pressões da artéria radial em comparação com a pressão da artéria subclávia durante a cirurgia da artéria coronária. CleveClin J Med 55: 448.
  37. Bazaral MG, Welch M, Golding LA, Badhwar K (1990) Comparação da monitorização da pressão arterial braquial e radial em pacientes submetidos à cirurgia de revascularização miocárdica. Anestesiologia 73:38.
  38. Denault AY, Tardif JC, Mazer CD, et al. (2012) Separação difícil e complexa da circulação extracorpórea em pacientes cirúrgicos cardíacos de alto risco: um estudo multicêntrico. J CardiothoracVascAnesth 26: 608.
  39. Hajjar LA, Vincent JL, Barbosa Gomes Galas FR, et al. (2017) Vasopressina versus noradrenalina em pacientes com choque vasoplégico após cirurgia cardíaca: o ensaio clínico randomizado VANCS. Anestesiologia 126: 85.
  40. Sun LY, Chung AM, Farkouh ME, et al. (2018) Definindo um limiar de hipotensão intraoperatória em associação com acidente vascular cerebral em cirurgia cardíaca. Anestesiologia 129: 440.
  41. Vedel AG, Holmgaard F, Rasmussen LS, etai. (2018) Alta Alvo versus o Controle da Pressão Arterial com Alvos Baixos durante a Derivação Cardiopulmonar para Prevenção de Lesão Cerebral em Pacientes com Cirurgia Cardíaca: Um Ensaio Controlado Aleatório. Circulação 137: 1770.
  42. Omar S, Zedan A, Nugent K. (2015) Síndrome da vasoplegia cardíaca: fisiopatologia, fatores de risco e tratamento. Am J MedSci 349: 80.

Cardiac Surgery in Pregnant Women

DOI: 10.31038/JCCP.2020314

Summary

The need for cardiac surgery during pregnancy is rare. Only 1% to 4% of pregnancies are complicated by maternal heart disease and most of them can be treated with medical therapy and lifestyle changes. Occasionally, whether due to the natural progression of underlying heart disease or precipitated by cardiovascular changes in pregnancy, cardiac surgical therapy should be considered. Cardiac surgery is inherently dangerous for both mother and fetus with mortality rates close to 10% and 30%, respectively. For some conditions, percutaneous cardiac intervention offers effective therapy with much less risk for the mother and her fetus. For others, cardiac surgery, including procedures that require the use of cardiopulmonary bypass, should be considered to save the mother’s life. Given the extreme risks to the fetus, if the patient is in the third trimester, serious consideration should be given to pre-operative delivery involving cardiopulmonary bypass. At earlier gestational ages, when this is not feasible, modifications to the infusion protocol, including higher flow rates, normothermic perfusion, pulsatile flow, and the use of intraoperative monitoring of the external fetal heartbeat should be considered.

Keywords

Cardiac surgical procedures, Cardiopulmonary bypass, Cardiovascular, Surgery, Complications of pregnancy, Heart defects congenital, Pregnancy

Introduction

Cardiovascular adaptations during pregnancy are usually well tolerated in healthy women. However, 2% to 4% of women of childbearing age have some degree of concomitant heart disease, and these changes may compromise cardiac function. Of these, some who do not respond to medical treatment may require surgical correction. In this scenario, the maternal mortality rate improved to levels similar to non-pregnant women. However, the fetal mortality rate remains high (up to 33%). Factors contributing to the high rates of fetal mortality include the timing of the operation, the urgency of the operation, and the fetal / fetoplacental response to cardiopulmonary bypass. Modulation of the fetoplacental response to cardiopulmonary bypass may prevent placental dysfunction and sustained uterine contractions that underlie fetal hypoxia and acidosis. In this article, we reviewed the cardiovascular adaptations to pregnancy and the pathophysiological effects of cardiopulmonary bypass on the mother, fetus and fetoplacental unit, and talked about whether manipulating these responses can help improve fetal outcome. Finally, approaches to perfusion management and cardiac surgical techniques without extracorporeal circulation in pregnancy were made.

Khandelwal et al [1] points out that approximately 2% to 4% of women of childbearing age have concomitant heart disease. According to Abbas [2], Congenital Heart Disease (CHD) is responsible for most structural heart diseases that affect women of childbearing age. Abbas [2] also points out that the acquired heart disease observed during pregnancy is mainly valvular in nature, usually a consequence of rheumatic fever. Although rheumatic fever is decreasing in developed countries, it remains a serious problem in the developing world. Immigrants also form a high-risk population, especially those who are unaware of the risks inherent in heart disease during pregnancy or unaware of the presence of any heart disease. In this regard, mitral stenosis is the most commonly found lesion. Abbas [2] further states that although its incidence is declining, aortic valve disease is less common: aortic incompetence is usually a consequence of endocarditis (1 in 8,000 pregnancies) or aortic dissection, in which case there may be tissue disease. underlying connective tissue such as Marfan syndrome. Thus, significant aortic stenosis is uncommon in this age group. Parry [3] points out that ischemic events during pregnancy are rare. The incidence of myocardial infarction is approximately 1 in 10,000 pregnancies. Mabie [4] states that infarction is usually secondary to underlying coronary artery disease, although spontaneous coronary artery dissection appears to be more common during pregnancy and accounts for 30% of all myocardial infarctions seen in pregnancy.

Maternal and Fetal Predictors

Siu [5] highlights that heart disease in the mother is the leading cause of maternal death during pregnancy. Of these patients, 25% have congenital heart disease. In a large prospective multicenter study on pregnancy outcomes among women with heart disease, adverse cardiovascular events were observed in 13% of patients. Independent predictors of maternal cardiac complications included previous cardiac events, functional class III / IV, left heart obstruction, and left ventricular systolic dysfunction. Neonatal complications were observed in 20% and were associated with functional class or poor cyanosis, left heart obstruction or smoking. Klairy [6] says that a recent prospective observational study in pregnant patients with congenital heart disease found that both cardiac complication and neonatal complication rates were considerable in these women. In mothers, right subpulmonary ventricular systolic dysfunction and severe pulmonary regurgitation were predictors of an adverse fetal outcome

Drenthen [7], in his bibliographic review, describes that the results of 2,491 pregnancies among women with structural heart disease (congenital heart disease), were observed substantial cardiac complications in 11% of pregnancies. Obstetric complications do not appear to be more prevalent except for hypertensive disorders and thromboembolic events. In patients with complex CHD, rates of preterm delivery ranged from 22% to 65%, and neonates were lower than normal for gestational age.

Maternal Cardiovascular Changes During Pregnancy

In the presence of maternal heart disease, circulatory changes in pregnancy may result in decompensation and death of the mother or fetus. Pregnancy produces changes in the cardiovascular system that have profound implications for heart surgery. Cardiac output increases markedly by the end of the first trimester, followed by a more gradual increase of 30% to 40% above baseline until the third trimester partly due to an increase in stroke volume and heart rate. In most patients, this hyperdynamic situation results in mild midsystolic murmur [8]. Diastolic murmurs may be normal, but deserve further investigation. At the end of pregnancy, compression of the lower uterine vena cava in the supine position decreases venous return and reduces cardiac output. Relief of vena cava compression is easily achieved by positioning the patient in the left lateral position. Systemic and pulmonary vascular resistance falls due to the effects of circulating prostaglandins in addition to other hormones and the poor resistance of the placental circulation. This lowers blood pressure during the first half of pregnancy, but pressure tends to increase in the second half [9].

Blood volume increases with a concomitant increase in plasma volume and red blood cell volume. Plasma volume expands by approximately 40% at term, when red cell mass increases by about 20%. Consequently, there is a drop in hematocrit and blood viscosity [10]. Hemoglobin’s oxygen carrying capacity is increased by a right shift on the oxygen dissociation curve. Pregnancy induces a procoagulant state with a 2-fold increase in fibrinogen level and an increase in factors V, VII, VIII, IX, and X, which has teleological advantage as it helps in hemostasis and reduces blood loss. during childbirth. In addition, this state ensures the optimal supply of oxygen and nutrients to the mother and fetus

Responses to Cardiopulmonary Bypass

Maternal

As the circulation of pregnant women has already undergone significant changes, the additional effect of Cardiopulmonary Bypass (CPB) induces a non-physiological hemodynamic state that may adversely affect the mother during cardiac surgery. This effect is amplified by simultaneous changes in the cellular and protein components of the blood. Hemodilution and changes in coagulation, complement activation, release of vasoactive substances by leukocytes, gas embolism and hypotension during CPB are further added to the deleterious effect. However, these effects are relatively well tolerated by the mother, as the maternal mortality rate associated with CPB in pregnant women is similar to that of non-pregnant women undergoing CPB-like cardiac procedures [3].

Uterine

Sustained uterine contractions during cardiac surgery and CPB are accepted as the most important cause of fetal death. Sustained uterine contractions reduce uterine blood flow and interventional perfusion, resulting in fetoplacental insufficiency and subsequent fetal hypoxia. Cardiopulmonary bypass has other potentially deleterious effects on the uterus during pregnancy. Both cooling and reheating phases are associated with increased sustained uterine contractions. This observation is supported by the fact that there is a noticeably higher fetal mortality rate with hypothermic CPB than with normothermic CPB [3]. Uterine muscle excitability is probably increased by hormonal dilution, especially by progesterone dilution. Postoperative progesterone administration successfully eliminated preterm labor.

Fetoplacental shunt

Experimental studies of fetal CPB provided much information on the fetoplacental response, which could shape future management of CPB in pregnant women. Studies in sheep have repeatedly shown that standard non-pulsatile flow perfusion rapidly causes severe placental dysfunction dominated by a strong vasoconstrictor reaction. Vasodilators have been used with some success to overcome this increase in placental vascular resistance, producing improvement in both placental blood flow and acidosis [11]. A study of the human placenta under physiological conditions reveals that an active fetal renin-angiotensin system can modulate placental perfusion in vivo. Endothelial dysfunction is a cause or an effect of excessive renin-angiotensin activity that has yet to be resolved. Lactate levels during CPB pulsatile flow were stable, while a continuous increase is observed with non-pulsatile CPB. Manipulation of the fetal lamb during CPB has been shown to produce significant lactic acidosis; this was considered as a result of metabolic debt of fetal stress, and anesthesia. Since lactate release into the maternal circulation was similar between the beginning and the end of CPB, the increase in fetal lactate probably originated from within the fetus. The placenta plays an important role in regulating circulating lactate levels under hypoxic conditions, thus allowing the fetus to maintain stable lactate levels. However, a reduction in placental perfusion prevents lactate clearance in the fetal circulation [11].

Fetal

The fetal mortality rate during maternal cardiac surgery with CPB ranges from 16% to 33%. Increased gestational age and increased hypothermia are factors known to increase fetal morbidity during CPB. Unfortunately, little experimental evidence is available on the fetal response to maternal CPB. Fetal cardiac monitoring usually shows that the onset of CPB is bradycardia, which in most cases reverts to sinus rhythm immediately after CPB cessation [13]. Alternatively, an initial tachycardia may occur, accompanied by an increase in blood pressure. Fetal bradycardia observed after the onset of CPB is corrected by increased blood flow and the restoration of maternal circulation upon CPB discontinuation. The mechanism of this bradycardic response is unknown, but several causes have been postulated, including fetoplacental dysfunction, fetal hypoxia and acidosis, maternal hypothermia, and drugs that cross the placental barrier, such as β-adrenergic blockers [14]. Fetal hypoxia during CPB may be a consequence of hemodilution, as hemodilution reduces the oxygen content in the maternal blood. Other causes of fetal hypoxia include reduced uterine perfusion pressure and increased uterine vascular resistance [14] Because placental blood vessels are maximally dilated during pregnancy, uterine blood flow is not self-regulating but directly depends on maternal mean arterial pressure and uterine vascular resistance.

Decreased maternal blood pressure may result in fetal bradycardia shortly before the onset of CPB. Maternal hypotension soon after cardiopulmonary bypass is caused by decreased systemic vascular resistance caused by reduced flow rate, hemodilution, and release of vasoactive substances, which may result in a significant reduction in placental perfusion. Cardiac fetal decelerations observed during CPB are probably caused by reduced blood flow to the interventional spaces and the resulting fetal hypoxia. Factors such as non-pulsatile flow, uterine arteriovenous bypass, and obstruction of venous drainage by cannulation of the inferior vena cava, particulate and gas emboli, and spasm of the uterine artery may reduce placental circulation and lead to fetal hypoxia. When CPB is prolonged, there is a significant risk that the fetus will develop a prolonged bradycardic response. Changes in fetal heart rate may be observed even when maternal circulation, acid-base balance and perfusion pressure are stable. Therefore, it has been postulated that these changes are related to the narcotic effect of drugs used during anesthesia. Vasoconstrictors may reduce uteroplacental flow (direct evidence of this is lacking) and should be avoided, although phenylephrine and ephedrine are considered safe during pregnancy.

Surgical Issue

The principles for the management of pregnant patients undergoing cardiac surgery with CPB are similar to those of pregnant women undergoing surgical intervention. These include: attention to maternal well-being, prevention of teratogenic drugs, prevention of intrauterine hypoxia and prevention of premature labor. In addition, strong consideration should be given to the administration of maternal corticosteroids to initiate endothelial membrane stability and fetal lung maturation, which can substantially improve fetal outcome if delivery occurs after CPB. In summary, the main concerns in optimal management of pregnant patients undergoing CPB are temperature control, perfusion pressure, and the nature of bypass flow. Current evidence favors the maintenance of normothermic CPB, avoiding the use of vasoconstrictors (which may have a profound effect on the placental unit) and maintaining high hematocrit rates and high blood flow rates. Fetal hypoperfusion and hypoxia may also be alleviated by the use of pulsatile perfusion. Other adjuncts, such as the use of arterial line filters or leukocyte depletion filtration, have not been evaluated in the specific context of pregnant patients [15].

Extracorporeal Circulation

Aggarwal and coauthors [16] reported that closed mitral valvotomy offers excellent results, comparable to non-surgical treatments; It is still the procedure of choice in certain parts of the world. Myocardial revascularization without cardiopulmonary bypass is a safe and accepted technique for coronary revascularization; However, its role in pregnancy needs further evaluation. The current medical literature contains only 1 documented case of myocardial revascularization during pregnancy – that of a 32-year-old woman at the 22nd week of gestation who had a spontaneous dissection of the left anterior descending artery and subsequently delivered a healthy baby at term. Hemodynamic instability during unsupported myocardial revascularization (CABG) surgery – involving a decrease in mean systemic blood pressure and an increase in mean pulmonary pressure during distal anastomosis construction and heart manipulation to gain access to the lateral and posterior branches – may not be well tolerated by pregnant patients and could cause significant placental malfunction. However, if only one anterior target (such as the anterior descending coronary artery territory) is grafted, this can usually be accomplished with minimal hemodynamic compromise and avoid all risks inherent to CPB, such as hemodilution, systemic inflammatory response to CPB and increased risk of bleeding [17].

To deepen our understanding of the placental and fetoplacental response to off-pump myocardial revascularization surgery, it is useful to look at how other vascular beds, such as splanchnic circulations, behave during off-pump coronary artery bypass grafting (CABG). If we hypothesize that splanchnic and fetoplacental circulations will respond similarly to hemodynamic insults during CPB myocardial revascularization surgery, much can be learned by observing splanchnic and gastrointestinal physiology during cardiac operations. L-lactate concentration has been significantly higher in the intestinal mucosa of patients undergoing myocardial revascularization with CPB than without CPB [17]. This supports the view that without CPB produces less dysfunction in these vascular beds than CPB. When Fiore et al. [18] examined upper mesenteric blood flow during myocardial revascularization, they found that cardiac manipulation to gain access to the lower and lateral walls caused hemodynamic changes that resulted in significant mesenteric hypoperfusion. Such information can help us plan the approach to revascularization we want to perform in pregnant patients who develop spontaneous coronary artery dissection.

Conclusion

Spontaneous single vessel or two vessel dissections, particularly in the anterior descending territory or right coronary artery territory, are probably the best candidates for off-pump surgery: the use of CPB in these instances avoids manipulation of the heart to reach the posterior artery. and inferior, thus avoiding hemodynamic instability and its effects on fetoplacental circulation More observational data should be collected in the context of myocardial revascularization in pregnancy, with particular attention to responses. fetal and maternal cardiovascular diseases, before myocardial revascularization can be safely recommended as the ideal therapy for this challenging group of patients.

References

  1. Khandelwal M, Rasanen J, Ludormirski A, Addonizio P, Reece EA (2015) Avaliação da hemodinâmica fetal e uterina durante a circulação extracorpórea materna. Obstet Gynecol 88: 667–671.
  2. Abbas AE, Lester SJ, Connolly H (2005) Gravidez e sistema cardiovascular. Int J Cardiol 98: 179–189.
  3. Parry AJ, Westaby S (2015) Circulação cardiopulmonar durante a gravidez. Ann Thorac Surg 61: 1865–1869.
  4. Mabie WC, Freire CM (2012) Dor súbita no peito e emergências cardíacas no paciente obstétrico. Obstet Gynecol Clin North Am 22: 19–37.
  5. Siu SC, Sermer M, Colman JM, Alvarez AN, Mercier LA, et al. (2001) Estudo prospectivo multicêntrico dos resultados da gravidez em mulheres com doença cardíaca. Circulation 104: 515–521.
  6. Khairy P, Ouyang DW, Fernandes SM, Lee-Parritz A, Economia KE, et al. (2006) Resultados da gravidez em mulheres com cardiopatia congênita. Circulation 113: 517–524.
  7. Drenthen W, Pieper PG, Roos-Hesselink JW, van Lottum WA, Voors AA, et al. (2007) Desfecho da gravidez em mulheres com cardiopatia congênita: uma revisão de literatura. J Am Coll Cardiol 49: 2303–2311.
  8. Edmonds KD, Dewhurst J (1999) Em: livro de obstetrícia e ginecologia de Dewhurst para pós-graduados. 6a ed. Malden (MA): Ciência Blackwell.
  9. Clark SL, Cotton DB, Lee W, Bispo C, Hill T, et al. (2009) Avaliação hemodinâmica central da gravidez a termo normal. Am J Obstet Gynecol 161: 1439–1442.
  10. Pomini F, D Mercogliano, Cavalletti C, Caruso A, Pomini P (2015) Circulação cardiopulmonar na gravidez. Ann Thorac Surg 61: 259–268.
  11. Vedrinne C, Tronc F, Martinot S, Robin J, Allevard AM, et al. (2000) Melhor preservação da função endotelial e diminuição da ativação da via renina-angiotensina fetal com o uso de fluxo pulsátil durante a derivação fetal experimental. J Thorac Cardiovasc Surg 120: 770–777.
  12. Sabik JF, Heinemann MK, Assad RS, Hanley FL (2011) Esteróides de altas doses impedem a disfunção placentária após o bypass cardíaco fetal. J Thorac Cardiovasc Surg 107: 116–125.
  13. Ralston DH, Shnider SM, DeLorimier AA (2011) Efeitos da efedrina equipotent, metaraminol, mephentermine, e metoxamina no fluxo sanguíneo uterino na ovelha grávida. Anesthesiology 40: 354–370.
  14. Lees MH, Herr RH, Hill JD, Morgan CL, Ochsner AJ 3, et al. (2010) Distribuição do fluxo sanguíneo sistêmico do macaco rhesus durante a circulação extracorpórea. J Thorac Cardiovasc Surg 61: 570–586.
  15. Silberman S, D Fink, Berko RS, B Mendzelevski, Bitran D (2015) Cirurgia de revascularização miocárdica durante a gravidez. Eur J Cardiothorac Surg 10: 925–926.
  16. Aggarwal N, Suri V, Goyal A, Malhotra S, Manoj R, et al. (2005) Valvotomia mitral fechada na gravidez e no trabalho de parto. Int J Gynaecol Obstet 88: 118–121.
  17. Perner A, Jorgensen VL, Poulsen TD, Steinbruchel D, Larsen B e Andersen LW (2005) Concentrações aumentadas de L-lactato no lúmen retal em pacientes submetidos à circulação extracorpórea. Ir. J Anaesth 95: 764–768.
  18. Fiore G, N Brienza, Cicala P, Tunzi P, N Marraudino, et al. (2006) Superior modificações do fluxo sanguíneo da artéria mesentérica durante a cirurgia coronária sem CEC. Ann Thorac Surg 82: 62–67.
  19. Levy DL, Warriner RA 3a, Burgess GE 3a. (2010) Resposta fetal à circulação extracorpórea. Obstet Gynecol 56: 112–115.

Surgical Treatment of Pulmonary Arterial Thrombosis

DOI: 10.31038/JCCP.2020313

Summary

Right Thromboses Floating (RHT) are in transit from the legs to the pulmonary arteries and are therefore a severe form of Venous Thromboembolism (VTE) with a high early mortality rate without treatment. There is a lack of evidence-based recommendations for its management, which is why, motivated the accomplishment of this study, dealing with the subject, addressing the surgical treatment of pulmonary arterial thrombosis, considering professional experiences in the surgical management of the thrombus in transit and Pulmonary Embolism (PE).

Keywords

Pulmonary arterial thrombosis, Pulmonary embolism, Surgical treatment

Introduction

The presence of thrombi in right heart chambers may be a consequence of Venous Thromboembolism (VTE) or may develop in situ as a consequence of cardiac conditions. Transient Thrombus (TT) or floating thrombus is defined as a thrombus temporally located in the right cardiac chambers en route to the Pulmonary Artery (AP). It is, therefore, a severe manifestation of VTE and very often (more than 90%) is associated with Deep Vein Thrombosis (DVT) or Pulmonary Embolism (PE). Given the high mortality rate without treatment (90%) and being very early (in the first 24 hours), monitoring in critical units and urgent treatment (including systemic fibrinolysis or surgical embolectomy, in addition to conventional anticoagulation) is justified. TT is an uncommon manifestation of symptomatic PE, with an approximate frequency of 4%. Currently, there is insufficient evidence on the best treatment option, and the recommendations are based on conclusions drawn from case series. The objective of this study is to discuss theoretical findings and experience of early surgical treatment of patients with TT and PE.

Discussion on the Topic

The presence of thrombi in the right cardiac chambers may be a consequence of VTE or may develop in situ as a consequence of cardiac conditions. This differentiation is of great importance considering that they have different treatment and prognosis [1]. TT or floating thrombus is defined as thrombus temporarily located in the right cardiac chambers en route to the PA. It is, therefore, a severe manifestation of VTE and with very high frequency (more than 90%) is associated with DVT or PE [2]. Thus, the presence of a TT confirms the diagnosis of PE and implies the desire for immediate treatment without the need for additional diagnostic tests. Three types of right thrombus were described using the Transthoracic Echocardiogram (TTE): type A thrombi are the most common and tend to be large, free floating masses with a high propensity for distal embolization; Type B thrombi are small clots of immobile right chambers attached to walls originating in situ; finally, type C thrombi are rare and have great mobility mimicking atrial myxomas. TT is an uncommon manifestation of symptomatic PE, with an approximate frequency of 4%.

Although coexisting Right Heart Thrombus (RHT) does not commonly occur in patients with acute symptomatic PE, studies have validated THR as a predictor of poor prognosis [3]. Despite anticoagulation, the mortality rate has been reported high (23.2-44.7%), especially in the first 24 hours [3]. In a recent meta-analysis, which included 15,220 patients with symptomatic acute PE, patients with detectable RHT concomitantly with echocardiography had a three-fold increased risk of short-term death compared to patients without RHT [4]. Similar results were found in a study of patients with PE from the Computerized Registry of the Thrombotic Infirmary (RIETE), which included 12,441 patients with PE, of which 325 had RHT.

Severe hypoxemia and the occurrence of cardiac arrest were significantly related to in-hospital mortality in patients with concomitant acute and concurrent PH. For these reasons, early diagnosis and treatment are essential. However, some studies have shown that clinical prognostic scores (PESI, simplified PESI) have demonstrated excellent accuracy for the identification of patients with low risk of short-term complications and have shown that coexisting TT in normotensive patients with PE did not lead to greater all-cause mortality. However, the data suggest an increased risk of mortality for patients with TT and RV dysfunction. On the other hand, the prognosis is generally good after discharge.

Most TT is detected by TTE in patients diagnosed or suspected of acute PE. Therefore, TTE is an important tool for early recognition. In case of doubt, it would be necessary to perform a transesophageal echocardiogram, which is also useful in the detection of thrombi in PA and in the coexistence of Patent Foramen Ovale (FOP). The presence of FOP should be taken into account as it is a source of paradoxical embolism (emboli originating within the venous system, which passes through a FOP and enters the systemic circulation) and may be a site for the clot to be lodged. Some authors such as Barrios et al  and Bodia favor the surgical removal of these thrombi with simultaneous pulmonary embolectomy due to the imminent risk of displacement, which can lead to massive PE or paradoxical systemic embolism. Despite its prognostic importance, current guidelines do not propose that echocardiography be performed routinely in all patients with acute PE or in all patients with a low-risk PESI assessment. However, they stimulate the evaluation of right ventricular function by echocardiography and / or measurement of cardiac biomarkers if, after clinical evaluation, there is uncertainty about whether patients need more intensive monitoring or thrombolytic therapy [4].

Current guidelines suggest that patients with acute hypotension (ie systolic BP <90 mmHg for 15 min) and no high risk of bleeding should be treated with thrombolytic therapy. The development of hypotension suggests that thrombolytic therapy is indicated. Deterioration that has not resulted in hypotension may also lead to the use of thrombolytic therapy. For example, there may be a progressive increase in HR, a decrease in systolic BP (which remains> 90 mmHg), increased jugular venous pressure, worsening of gas exchange, shock signals (eg, cold sweat, diuresis reduction, confusion ), progressive dysfunction of the right heart on echocardiography, or increase in cardiac biomarkers [4]. However, few studies, only series of cases and retrospective studies, have compared thrombolysis with surgical therapy in acute PE and have recommended considering surgical pulmonary embolectomy in case of hypotension and contraindication for thrombolysis or life-threatening situations such as thrombolysis failure, RV failure, cardiogenic shock and TT.

According to current guidelines, in patients with TT, the therapeutic benefits of thrombolysis remain controversial. Surgical embolectomy is justified in some cases of TT, for example, those with coexistence of FOP. The ideal treatment for concomitant acute and concurrent PH is not currently defined due to the absence of randomized clinical trials and should be considered on a case-by-case basis by multidisciplinary teams following a risk-benefit assessment [4]. Patients who did not receive therapy had a mortality rate of 90 to 100%. In addition, the mortality rate is high (21.1%) in the first 24 hours, which justifies an immediate treatment. Thus, inotropic support with catecholamine infusion should be prepared immediately after the diagnosis of TT and administered as soon as the patient’s blood pressure drops below 100 mm Hg or there is suspicion of cardiogenic shock. It may be preferable to admit patients to an ICU because sudden death is a risk and mechanical ventilation may also be required. Different therapeutic approaches have been reported for acute PE with concomitant TT: anticoagulation with Unfractionated Heparin (UFH), systemic thrombolysis with Recombinant Tissue Plasminogen Activator (RTPA), surgical embolectomy with exploration of the right chambers and pulmonary arteries in complete extracorporeal circulation, and endovascular thrombectomy.

According to Marti (2014), systemic thrombolysis and surgical embolectomy were more likely to survive (81.5% and 70.45%, respectively) than anticoagulation (47.7%). However, there are contradictory data regarding the management of TT; a recent study that included patients with acute RI associated with TT from the RIETE registry showed that there were no significant differences in mortality and bleeding between reperfusion (thrombolysis, surgery) and anticoagulation therapy. Regarding the superiority of thrombolysis or surgical thrombectomy, [4] say that both are effective strategies, with a slight increase in the probability of survival with thrombolysis in some studies. They were, however, plagued by selection bias, small numbers and lack of comparable groups. A prospective, randomized, well-planned study is needed to determine the optimal treatment of acute PD and concomitant TT.

Conclusion

Transit thrombus is an uncommon and severe manifestation of VTE. The high rate of early mortality ensures rapid and effective treatment. Surgical embolectomy in patients with PE and concomitant thrombus in transit may be an effective treatment in selected patients, although the current evidence to support this approach is not definitive.

References

  1. Arboine-Aguirre L, Figueroa-Calderón E, Ramírez-Rivera A (2017) Trombo em trânsito e tromboembolismo pulmonar submassivo tratado com sucesso com tenecteplase. Gac Med Mex 153: 129–133.
  2. Athappan G, Sengodan P, Chacko P (2015) Eficácia comparativa de diferentes modalidades para tratamento de trombos cardíacos direitos em trânsito: uma análise conjunta. Vasc Med 20: 131–138.
  3. Agarwal V, Nalluri N., Shariff MA (2014) Embolia grande em trânsito – um dilema terapêutico não resolvido (relato de caso e revisão da literatura). Coração Pulmão 43: 152–154.
  4. Barrios D, Rosa-Salazar V, Morillo R (2017) Significado prognóstico dos trombos do coração direito em pacientes com embolia pulmonar sintomática aguda: revisão sistemática e metanálise. Baú de 151: 409–416.

Showcase to illustrate how the web-server iRNAMethyl is working

DOI: 10.31038/JMG.2020322

Short Commentary

In 2015 a very powerful web-server predictor has been established for identifying N6-methyladenosine (m6A), which is one of the most abundant modifications in RNA [1].

To see how the web-server is working, please do the following.

Step 1: Open the web server at http://lin.uestc.edu.cn/server/iRNA-Methyl and you will see the top page of the iRNA-Methyl predictor on your computer screen, as shown in Fig.1. Click on the Read Me button to see a brief introduction about the predictor and the caveat when using it.

JMG 202-302_Kuo-Chen Chou_F_1

Figure 1. A semi screenshot for the top page of iRNA-Methyl (Adapted from [1] with permission).

Step 2: Either type or copy/paste the query RNA sequences into the input box at the center of Fig.1. The input sequence should be in FASTA format.  For the examples of RNA sequences in FASTA format, click the Example button right above the input box.

Step 3: Click on the Submit button to see the predicted result. For example, if you use the query RNA sequences in the Example window as the input, you will see the following shown on the screen of your computer. (1) RNA sequence-1 contains 5 “GAC” (with adenine at its middle) consensus motifs, of which only those at the sequence positions 128 is predicted to be the methylation sites or  site, and all the others are not. (2) RNA sequence-2 contains 8 “GAC” consensus motifs, of which only those at the sequence positions 332 is predicted to be the methylation sites, while all the others are not. All these results are fully consistent with the experimental observations.

Step 4: Click on the Data button to download the datasets used to train and test the model.

Step 5: Click on the Citation button to find the relevant paper that document the detailed development and algorithm of iRNA-Methyl.

It is instructive to point out that the web-server predictor has been developed by strictly observing the guidelines of “Chou’s 5-steps rule” and hence have the following notable merits (see, e.g., [2–14] and three comprehensive review papers [15–17]: (1) crystal clear in logic development, (2) completely transparent in operation, (3) easily to repeat the reported results by other investigators, (4) with high potential in stimulating other sequence-analyzing methods, and (5) very convenient to be used by the majority of experimental scientists.

Moreover, it has not escaped our notice that during the development of iRNA-Methyl web-server, the approach of general pseudo amino acid components [18] or PseAAC [19] had been utilized and hence its accuracy would be much higher than its counterparts, as concurred by many investigators [15, 18–266].

It is anticipated that iRNA-Methyl may become a useful high throughput tool for conducting genome analysis as well as drug development.

For the remarkable and awesome roles of the “5-steps rule” in driving proteome, genome analyses and drug development, see a series of recent papers [16, 17, 267–276] where the rule and its wide applications have been very impressively presented from various aspects or at different angles.

References

  1. Chen W, Feng P, Ding H, Lin H, Chou KC (2015) iRNA-Methyl: Identifying N6-methyladenosine sites using pseudo nucleotide composition. Analytical Biochemistry 490: 26–33. [Crossref]
  2. Barukab O, Khan YD, Khan SA, Chou KC (2019) iSulfoTyr-PseAAC: Identify tyrosine sulfation sites by incorporating statistical moments via Chou’s 5-steps rule and pseudo components Current Genomics.
  3. Cheng X, Lin WZ, Xiao X, Chou KC (2019) pLoc_bal-mAnimal: predict subcellular localization of animal proteins by balancing training dataset and PseAAC. Bioinformatics 35: 398–406. [Crossref]
  4. Chou KC, Cheng X, Xiao X (2019) pLoc_bal-mHum: predict subcellular localization of human proteins by PseAAC and quasi-balancing training dataset. Genomics 111: 1274–1282. [Crossref]
  5. Chou KC, Cheng X, Xiao X (2019) pLoc_bal-mEuk: predict subcellular localization of eukaryotic proteins by general PseAAC and quasi-balancing training dataset. Med Chem 15: 472–485. [Crossref]
  6. Ehsan A, Mahmood MK, Khan YD, Barukab OM, Khan SA, et al. (2019) iHyd-PseAAC (EPSV): Identify hydroxylation sites in proteins by extracting enhanced position and sequence variant feature via Chou’s 5-step rule and general pseudo amino acid composition. Current Genomics 20: 124–133. [Crossref]
  7. Feng P, Yang H, Ding H, Lin H, Chen W, et al. (2019) iDNA6mA-PseKNC: Identifying DNA N(6)-methyladenosine sites by incorporating nucleotide physicochemical properties into PseKNC. Genomics 111: 96–102. [Crossref]
  8. Hussain W, Khan SD, Rasool N, Khan SA, Chou KC (2019) SPalmitoylC-PseAAC: A sequence-based model developed via Chou’s 5-steps rule and general PseAAC for identifying S-palmitoylation sites in proteins. Anal Biochem 568: 14–23. [Crossref]
  9. Hussain W, Khan YD, Rasool N, Khan SA, Chou KC (2019) SPrenylC-PseAAC: A sequence-based model developed via Chou’s 5-steps rule and general PseAAC for identifying S-prenylation sites in proteins. J Theor Biol 468: 1–11. [Crossref]
  10. Ilyas S, Hussain W, Ashraf A, Khan YD, Khan SA, Chou KC (2019) iMethylK-PseAAC: Improving accuracy for lysine methylation sites identification by incorporating statistical moments and position relative features into general PseAAC via Chou’s 5-steps rule. Current Genomics
  11. Jia J, Li X, Qiu W, Xiao X, Chou KC (2019) iPPI-PseAAC(CGR): Identify protein-protein interactions by incorporating chaos game representation into PseAAC. Journal of Theoretical  Biology 460: 195–203. [Crossref]
  12. Khan YD, Batool A, Rasool N, Khan A, Chou KC (2019) Prediction of nitrosocysteine sites using position and composition variant features. Letters in Organic Chemistry 16: 283–293.
  13. Khan YD, Jamil M, Hussain W, Rasool N, Khan SA, et al. (2019) pSSbond-PseAAC: Prediction of disulfide bonding sites by integration of PseAAC and statistical moments. J Theor Biol 463: 47–55.[Crossref]
  14. YLu SA, Wang S, Wang J, Zhou G, Zhang Q et al. (2019) An Epidemic Avian Influenza Prediction Model Based on Google Trends. Letters in Organic Chemistry 16: 303–310.
  15. Chou KC (2011)  Some remarks on protein attribute prediction and pseudo amino acid composition (50th Anniversary Year Review, 5-steps rule). Journal of Theoretical Biology 273: 236–247. [Crossref]
  16. Chou KC (2019) Advance in predicting subcellular localization of multi-label proteins and its implication for developing multi-target drugs. Current Medicinal Chemistry 26: 4918–4943. [Crossref]
  17. Chou KC (2019) Impacts of pseudo amino acid components and 5-steps rule to proteomics and proteome analysis. Current Topics in Medicinak Chemistry 19: 2283–2300. [Crossref]
  18. Chou KC (2001) Prediction of protein cellular attributes using pseudo amino acid composition. Proteins 43: 246–255. [Crossref]
  19. Chou KC (2005) Using amphiphilic pseudo amino acid composition to predict enzyme subfamily classes. Bioinformatics 21: 10–19. [Crossref]
  20. Guo ZM (2002) Prediction of membrane protein types by using pattern recognition method based on pseudo amino acid composition.
  21. Cai YD, Chou KC (2003) Nearest neighbour algorithm for predicting protein subcellular location by combining functional domain composition and pseudo amino acid composition. Biochem  Biophys Res Comm 305: 407–411. [Crossref]
  22. Chou KC, Cai YD (2003)  Predicting protein quaternary structure by pseudo amino acid composition. Proteins 53: 282–289. [Crossref]
  23. Chou KC, Cai YD (2003) Prediction and classification of protein subcellular location: sequence-order effect and pseudo amino acid composition. Journal of Cellular Biochemistry 90: 1250–1260. [Crossref]
  24. Pan YX, Zhang ZZ, Guo ZM, Feng GY, Huang ZD, et al. (2003) Application of pseudo amino acid composition for predicting protein subcellular location: stochastic signal processing approach. Journal of Protein Chemistry 22: 395–402. [Crossref]
  25. Chou KC, Cai YD (2004) Predicting subcellular localization of proteins by hybridizing functional domain composition and pseudo amino acid composition. Journal of Cellular Biochemistry 91: 1197–1203. [Crossef]
  26. Wang M, Yang J, Liu GP, Xu ZJ, Chou KC (2004) Weighted-support vector machines for predicting membrane protein types based on pseudo amino acid composition. 17: 509–516.
  27. Cai YD, Chou KC (2005) Predicting enzyme subclass by functional domain composition and pseudo amino acid composition. Journal of Proteome Research 4: 967–971. [Crossref]
  28. Cai YD, Zhou GP, Chou KC (2005) Predicting enzyme family classes by hybridizing gene product composition and pseudo amino acid composition. Journal of Theoretical Biology 234: 145–149. [Crossref]
  29. Gao Y, Shao SH, Xiao X, Ding YS, Huang YS (2005) Using pseudo amino acid composition to predict protein subcellular location: approached with Lyapunov index, Bessel function, and Chebyshev filter. Amino Acids 28: 373–376. [Crossref]
  30. H Liu, J Yang, M Wang, L Xue, KC Chou (2005) Using Fourier spectrum analysis and pseudo amino acid composition for prediction of membrane protein types. The Protein Journal 24: 385–389. [Crossref]
  31. Shen HB, Chou KC (2005) Using optimized evidence-theoretic K-nearest neighbor classifier and pseudo amino acid composition to predict membrane protein types. Biochemical & Biophysical Research Communications 334: 288–292. [Crossref]
  32. Shen HB, Chou KC (2005) Predicting protein subnuclear location with optimized evidence-theoretic K-nearest classifier and pseudo amino acid composition. Biochem Biophys Res Comm 337: 752–756. [Crossref]
  33. Cai YD, Chou KC (2006) Predicting membrane protein type by functional domain composition and pseudo amino acid composition. Journal of Theoretical Biology 238: 395–400. [Crossref]
  34. Chen C, Tian YX, Zou XY, Cai PX, Mo JY (2006) Using pseudo amino acid composition and support vector machine to predict protein structural class. J Theor Biol 243 444–448. [Crossref]
  35. Chen C, Zhou X, Tian Y, Zou X, Cai P (2006) Predicting protein structural class with pseudo amino acid composition and support vector machine fusion network. Analytical Biochemistry 357: 116–121. [Crossref]
  36. Du P, Li Y (2006) Prediction of protein submitochondria locations by hybridizing pseudo amino acid composition with various physicochemical features of segmented sequence. BMC Bioinformatics 7: 518. [Crossref]
  37. Mondal S, Bhavna R, Mohan Babu R, Ramakumar S (2006) Pseudo amino acid composition and multi-class support vector machines approach for conotoxin superfamily classification. J Theor Biol 243: 252–260. [Crossref]
  38. Shen HB, Yang J, Chou KC (2006) Fuzzy KNN for predicting membrane protein types from pseudo amino acid composition. Journal of Theoretical Biology 240: 9–13. [Crossref]
  39. Wang SQ, Yang J, Chou KC (2006) Using stacked generalization to predict membrane protein types based on pseudo amino acid composition. Journal of Theoretical Biology 242: 941–946. [Crossref]
  40. Xiao X, Shao SH, YS Ding SH, Huang ZD, Chou KC (2006) Using cellular automata images and pseudo amino acid composition to predict protein subcellular location. Amino Acids 30: 49–54. [Crossref]
  41. Xiao X, Shao SH, Huang ZD, Chou KC (2006) Using pseudo amino acid composition to predict protein structural classes: approached with complexity measure factor. Journal of Computational Chemistry 27: 478–482.
  42. Zhang SW, Pan Q, Zhang HC, Shao ZC, Shi JY (2006)Prediction protein homo-oligomer types by pseudo amino acid composition: Approached with an improved feature extraction and naive Bayes feature fusion. Amino Acids 30  461–468. [Crossref]
  43. Zhou GP, Cai YD (2006) Predicting protease types by hybridizing gene ontology and pseudo amino acid composition. Proteins 63: 681–684. [Crossref]
  44. Chen YL, Li QZ (2007)  Prediction of apoptosis protein subcellular location using improved hybrid approach and pseudo amino acid composition. Journal of Theoretical Biology 248: 377–381. [Crossref]
  45. Ding YS, Zhang TL, Chou KC (2007) Prediction of protein structure classes with pseudo amino acid composition and fuzzy support vector machine network. Protein & Peptide Letters 14: 811–815. [Crossref]
  46. Lin H, Li QZ (2007) Predicting conotoxin superfamily and family by using pseudo amino acid composition and modified Mahalanobis discriminant. Biochem Biophys Res Commun 354: 548–51. [Crossref]
  47. Lin H, Li QZ (2007)  Using Pseudo Amino Acid Composition to Predict Protein Structural Class: Approached by Incorporating 400 Dipeptide Components. Journal of  Computational  Chemistry 28: 1463–1466. [Crossref]
  48. Mundra P, Kumar M, Kumar KK, Jayaraman VK, Kulkarni BD (2007) Using pseudo amino acid composition to predict protein subnuclear localization: Approached with PSSM. Pattern Recognition Letters 28: 1610–1615.
  49. Shi JY, Zhang SW, Pan Q, Cheng Y M,  J Xie (2007) Prediction of protein subcellular localization by support vector machines using multi-scale energy and pseudo amino acid composition. Amino Acids 33: 69–74. [Crossref]
  50. Zhang TL, Ding YS (2007) Using pseudo amino acid composition and binary-tree support vector machines to predict protein structural classes. Amino Acids 33: 623–629. [Crossref]
  51. Zhou XB, Chen C, Li ZC, Zou XY (2007) Using Chou’s amphiphilic pseudo amino acid composition and support vector machine for prediction of enzyme subfamily classes. Journal of Theoretical Biology 248 546–551. [Crossref]
  52. Diao Y, Ma D, Wen Z, Yin J, Xiang J et al. (2008) Using pseudo amino acid composition to predict transmembrane regions in protein: cellular automata and Lempel-Ziv complexity. Amino Acids 34: 111–117. [Crossref]
  53. Ding YS, Zhang TL (2008) Using Chou’s pseudo amino acid composition to predict subcellular localization of apoptosis proteins: an approach with immune genetic algorithm-based ensemble classifier. Pattern Recognition Letters 29: 1887–1892.
  54. Fang Y, Guo Y, Feng Y, Li M (2008) Predicting DNA-binding proteins: approached from Chou’s pseudo amino acid composition and other specific sequence features. Amino Acids 34: 103–109. [Crossref]
  55. Gu Q, Ding Y, Zhang T (2008) Prediction of G-protein-coupled receptor classes with pseudo amino acid composition.
  56. Jiang X, Wei R, Zhang TL, Gu Q (2008) Using the concept of Chou’s pseudo amino acid composition to predict apoptosis proteins subcellular location: an approach by approximate entropy. Protein & Peptide Letters 15: 392–396. [Crossref]
  57. X Jiang, R Wei, Y Zhao, T Zhang (2008) Using Chou’s pseudo amino acid composition based on approximate entropy and an ensemble of AdaBoost classifiers to predict protein subnuclear location. Amino Acids 34: 669–675. [Crossref]
  58. Li FM, Li QZ (2008) Using pseudo amino acid composition to predict protein subnuclear location with improved hybrid approach. Amino Acids 34: 119–125. [Crossref]
  59. Li FM, Li QZ (2008) Predicting protein subcellular location using Chou’s pseudo amino acid composition and improved hybrid approach. Protein & Peptide Letters 15: 612–616. [Crossref]
  60. Lin H (2008) The modified Mahalanobis discriminant for predicting outer membrane proteins by using Chou’s pseudo amino acid composition. Journal of Theoretical Biology 252: 350–356. [Crossref]
  61. Lin H, Ding H, Feng-Biao Guo FB, Zhang AY, Huang J (2008) Predicting subcellular localization of mycobacterial proteins by using Chou’s pseudo amino acid composition. Protein & Peptide Letters 15: 739–744. [Crossref]
  62. Nanni L, Lumini A (2008) Genetic programming for creating Chou’s pseudo amino acid based features for submitochondria localization. Amino Acids 34: 653–660. [Crossref]
  63. Shen HB, Chou KC (2008) PseAAC: a flexible web-server for generating various kinds of protein pseudo amino acid composition. Analytical Biochemistry 373: 386–388. [Crossref]
  64. Shi JY, Zhang SW, Pan Q, Zhou GP (2008) Using Pseudo Amino Acid Composition to Predict Protein Subcellular Location: Approached with Amino Acid Composition Distribution. Amino Acids 35: 321–327. [Crossref]
  65. Xiao X, Lin WZ, Chou KC (2008) Using grey dynamic modeling and pseudo amino acid composition to predict protein structural classes. Journal of Computational Chemistry 29: 2018–2024. [Crossref]
  66.  Xiao X, Wang P, Chou KC (2008) Predicting protein structural classes with pseudo amino acid composition: an approach using geometric moments of cellular automaton image. Journal of Theoretical Biology 254: 691–696. [Crossref]
  67. Zhang GY, Fang BS (2008) Predicting the cofactors of oxidoreductases based on amino acid composition distribution and Chou’s amphiphilic pseudo amino acid composition. Journal of Theoretical Biology 253: 310–315. [Crossref]
  68. Zhang GY, Li HC, Gao JQ, Fang BS (2008)  Predicting lipase types by improved Chou’s pseudo amino acid composition. Protein & Peptide Letters 15: 1132–1137. [Crossref]
  69. Zhang SW, Chen W, Yang F, Pan Q (2008) Using Chou’s pseudo amino acid composition to predict protein quaternary structure: a sequence-segmented PseAAC approach. Amino Acids 35: 591–598. [Crossref]
  70. Zhang SW, Zhang YL, Yang HF, Zhao CH, Pan Q (2008) Using the concept of Chou’s pseudo amino acid composition to predict protein subcellular localization: an approach by incorporating evolutionary information and von Neumann entropies. Amino Acids 34: 565–572. [Crossref]
  71. Zhang TL, Ding YS, Chou KC (2008) Prediction protein structural classes with pseudo amino acid composition: approximate entropy and hydrophobicity pattern. Journal of Theoretical Biology 250: 186–193. [Crossref]
  72. Chen C, Chen L, Zou X, Cai P (2009) Prediction of protein secondary structure content by using the concept of Chou’s pseudo amino acid composition and support vector machine. Protein & Peptide Letters 16: 27–31. [Crossref]
  73. Chou KC (2009) Pseudo amino acid composition and its applications in bioinformatics, proteomics and system biology. Current Proteomics 6: 262–274.
  74. Ding H, Luo L, Lin H (2009) Prediction of cell wall lytic enzymes using Chou’s amphiphilic pseudo amino acid composition. Protein & Peptide Letters 16: 351–355. [Crossref]
  75. Du P, Cao S, Li Y (2009) SubChlo: predicting protein subchloroplast locations with pseudo amino acid composition and the evidence-theoretic K-nearest neighbor (ET-KNN) algorithm. Journal of Theoretical Biolology 261: 330–335. [Crossref]
  76. Gao QB, Jin ZC, Ye XF, Wu C, He J (2009) Prediction of nuclear receptors with optimal pseudo amino acid composition. Analytical Biochemistry 387: 54–59. [Crossref]
  77. Georgiou DN, Karakasidis TE, Nieto JJ, Torres A (2009) Use of fuzzy clustering technique and matrices to classify amino acids and its impact to Chou’s pseudo amino acid composition. Journal of Theoretical Biology 257 17–26. [Crossref]
  78. http://en.wikipedia.org/wiki/Pseudo_amino_acid_composition, Pseudo amino acid composition, Wikipedia, 2009
  79. Li ZC, Zhou XB, Dai Z, Zou XY (2009) Prediction of protein structural classes by Chou’s pseudo amino acid composition: approached using continuous wavelet transform and principal component analysis. Amino Acids 37 415–425. [Crossref]
  80. Lin H, Wang H, H Ding, YL Chen, QZ Li (2009) Prediction of Subcellular Localization of Apoptosis Protein Using Chou’s Pseudo Amino Acid Composition. Acta Biotheoretica 57: 321–330. [Crossref]
  81. Qiu, Huang JH, Liang RP, Lu XQ (2009) Prediction of G-protein-coupled receptor classes based on the concept of Chou’s pseudo amino acid composition: an approach from discrete wavelet transform. Analytical Biochemistry 390: 68–73. [Crossref]
  82. Xiao X, Wang P, Chou KC (2009) Predicting protein quaternary structural attribute by hybridizing functional domain composition and pseudo amino acid composition. Journal of Applied Crystallography 42: 169–173.
  83. Zeng YH, Guo YZ, Xiao RQ, Yang L, Yu LZ, et al. (2009) Using the augmented Chou’s pseudo amino acid composition for predicting protein submitochondria locations based on auto covariance approach. Journal of Theoretical Biology 259: 366–372.
  84. Esmaeili M, Mohabatkar H, Mohsenzadeh S (2010) Using the concept of Chou’s pseudo amino acid composition for risk type prediction of human papillomaviruses. Journal of Theoretical Biology 263: 203–209. [Crossref]
  85. Gao QB, Ye XF, Jin ZC, He J (2010) Improving discrimination of outer membrane proteins by fusing different forms of pseudo amino acid composition. Analytical Biochemistry 398: 52–59. [Crossref]
  86. Gu Q, Ding Y, Zhang T, Shen Y (2010) Prediction of G-protein-coupled receptor classes with pseudo amino acid composition. 27: 500–504.
  87. Gu Q, Ding YS, Zhang TL (2010) Prediction of G-Protein-Coupled Receptor Classes in Low Homology Using Chou’s Pseudo Amino Acid Composition with Approximate Entropy and Hydrophobicity Patterns. Protein & Peptide Letters 17: 559–567. [Crossref]
  88. Kandaswamy KK, Pugalenthi G, Moller S, Hartmann E, Kalies KU et al. (2010) Prediction of Apoptosis Protein Locations with Genetic Algorithms and Support Vector Machines Through a New Mode of Pseudo Amino Acid Composition. Protein and Peptide Letters 17: 1473–1479.
  89. Liu T, Zheng X, Wang C, Wang J (2010) Prediction of Subcellular Location of Apoptosis Proteins using Pseudo Amino Acid Composition: An Approach from Auto Covariance Transformation. Protein & Peptide Letters 17: 1263–1269. [Crossref]
  90. Mohabatkar H (2010) Prediction of cyclin proteins using Chou’s pseudo amino acid composition. Protein & Peptide Letters 17 1207–1214. [Crossref]
  91. Nanni H, Brahnam S, Lumini A (2010) High performance set of PseAAC and sequence based descriptors for protein classification. Journal of Theoretical Biology 266: 1–10. [Crossref]
  92. Niu XH, Li NN, Shi F, Hu XH, Xia JB, et al. (2010) Predicting protein solubility with a hybrid approach by pseudo amino Acid composition. Protein and Peptide Letters 17: 1466–1472. [Crossref]
  93. Qiu JD, Huang JH, Shi SP, Liang RP (2010) Using the concept of Chou’s pseudo amino acid composition to predict enzyme family classes: an approach with support vector machine based on discrete wavelet transform. Protein &  Peptide Letters 17: 715–722. [Crossref]
  94. Sahu SS, Panda G (2010) A novel feature representation method based on Chou’s pseudo amino acid composition for protein structural class prediction. Computational Biology and Chemistry 34: 320–327.
  95. Wang YC, Wang XB, Yang ZX, Deng NY (2010) Prediction of enzyme subfamily class via pseudo amino acid composition by incorporating the conjoint triad feature. Protein & Peptide Letters 17: 1441–1449. [Crossref]
  96. Wu J, Li ML, Yu LZ, Wang C (2010) An ensemble classifier of support vector machines used to predict protein structural classes by fusing auto covariance and pseudo amino acid composition. Protein J 29: 62–67. [Crossref]
  97. YuL, Guo Y, LiY, Li G, Li M (2010) SecretP: Identifying bacterial secreted proteins by fusing new features into Chou’s pseudo amino acid composition. Journal of Theoretical Biology 267: 1–6. [Crossref]
  98. Ding H, Liu L, Guo FB, Huang J, Lin H (2011) Identify Golgi protein types with modified mahalanobis discriminant algorithm and pseudo amino acid composition. Protein & Peptide Letters 18: 58–63. [Crossref]
  99. Guo J, Rao N, Liu G, Yang Y, Wang G (2011) Predicting protein folding rates using the concept of Chou’s pseudo amino acid composition. Journal of  Computational Chemistry 32: 1612–1617. [Crossref]
  100. Hayat M, Khan A (2011) Predicting membrane protein types by fusing composite protein sequence features into pseudo amino acid composition. Journal of Theoretical Biology 271: 10–17. [Crossref]
  101. Hu L, Zheng L, Wang Z, Li B, Liu L (2011) Using pseudo amino Acid composition to predict protease families by incorporating a series of protein biological features. Protein and Peptide Letters 18: 552–558. [Crossref]
  102. Y Huang, L Yang, T Wang (2011) Phylogenetic analysis of DNA sequences based on the generalized pseudo amino acid composition. Journal of Theoretical Biology 269: 217–223. [Crossref]
  103. X Jingbo, Z Silan, S Feng, X Huijuan, H Xuehai, et al. (2011) Using the concept of pseudo amino acid composition to predict resistance gene against Xanthomonas oryzae pv. oryzae in rice: An approach from chaos games representation. Journal of  Theoretical Biology 284: 16–23. [Crossref]
  104.  B Liao, JB Jiang, QG Zeng, W Zhu (2011) Predicting Apoptosis Protein Subcellular Location with PseAAC by Incorporating Tripeptide Composition. Protein & Peptide Letters 18: 1086–1092. [Crossref]
  105.  Lin H, Ding H (2011) Predicting ion channels and their types by the dipeptide mode of pseudo amino acid composition. Journal of Theoretical Biology 269: 64–69. [Crossref]
  106. Lin J, Wang Y (2011) Using a novel AdaBoost algorithm and Chou’s pseudo amino acid composition for predicting protein subcellular localization. Protein & Peptide Letters 18: 1219–1225. [Crossref]
  107. Lin J, Wang Y, Xu X (2011) A novel ensemble and composite approach for classifying proteins based on Chou’s pseudo amino acid composition. African Journal of Biotechnology 10: 16963–16968.
  108. Liu XL, Lu JL, Hu XH (2011) Predicting Thermophilic Proteins with Pseudo Amino Acid Composition: Approached from Chaos Game Representation and Principal Component Analysis. Protein & Peptide Letters 18  1244–1250. [Crossref]
  109. Mahdavi A, Jahandideh S (2011) Application of density similarities to predict membrane protein types based on pseudo amino acid composition. Journal of Theoretical Biology 276: 132–137. [Crossref]
  110. Mohabatkar H, Mohammad Beigi M, Esmaeili A (2011) Prediction of GABA(A) receptor proteins using the concept of Chou’s pseudo amino acid composition and support vector machine. Journal of Theoretical Biology 281: 18–23. [Crossref]
  111. Mohammad B.M, Behjati M, Mohabatkar H (2011) Prediction of metalloproteinase family based on the concept of Chou’s pseudo amino acid composition using a machine learning approach. Journal of Structural and Functional Genomics 12  191–197. [Crossref]
  112. Qiu JD, Sun XY, Suo SB, Shi SP, Huang SY, et al. (2011) Predicting homo-oligomers and hetero-oligomers by pseudo amino acid composition: an approach from discrete wavelet transformation. Biochimie 93: 1132–1138. [Crossref]
  113. Qiu JD, Suo SB, Sun XY, Shi SP, Liang RP (2011) OligoPred: A web-server for predicting homo-oligomeric proteins by incorporating discrete wavelet transform into Chou’s pseudo amino acid composition. Journal of Molecular Graphics & Modelling 30: 129–134. [Crossref]
  114. Shi R, Xu C (2011) Prediction of rat protein subcellular localization with pseudo amino Acid composition based on multiple sequential features. Protein and Peptide Letters 18: 625–633. [Crossref]
  115. Shu M, Cheng X, Zhang Y, Wang Y, Lin Y (2011) Predicting the Activity of ACE Inhibitory Peptides with a Novel Mode of Pseudo Amino Acid Composition. Protein & Peptide Letters 18: 1233–1243. [Crossref]
  116. Wang D, Yang L, Fu Z, Xia J (2011) Prediction of thermophilic protein with pseudo amino Acid composition: an approach from combined feature selection and reduction. Protein & Peptide Letters 18: 684–689. [Crossref]
  117. Wang W, Geng XB, Dou Y, Liu T, Zheng X (2011) Predicting protein subcellular localization by pseudo amino Acid composition with a segment-weighted and features-combined approach. Protein and Peptide Letters 18: 480–487. [Crossref]
  118. Xiao X, Chou KC (2011) Using pseudo amino acid composition to predict protein attributes via cellular automata and other approaches. Current Bioinformatics 6: 251–260.
  119. Xiao X, Wang P, Chou KC (2011) GPCR-2L: Predicting G protein-coupled receptors and their types by hybridizing two different modes of pseudo amino acid compositions. Molecular Biosystems 7: 911–919. [Crossref]
  120. Zia Ur R, Khan A (2011) Prediction of GPCRs with Pseudo Amino Acid Composition: Employing Composite Features and Grey Incidence Degree Based Classification. Protein & Peptide Letters 18: 872–878. [Crossref]
  121. Zou D, He Z, He J, Xia Y (2011) Supersecondary structure prediction using Chou’s pseudo amino acid composition. Journal of Computational Chemistry 32: 271–278. [Crossref]
  122. Cao JZ, Liu WQ, Gu H (2012) Predicting Viral Protein Subcellular Localization with Chou’s Pseudo Amino Acid Composition and Imbalance-Weighted Multi-Label K-Nearest Neighbor Algorithm. Protein and  Peptide Letters 19: 1163–1169. [Crossref]
  123. Chen C, Shen ZB, Zou XY (2012) Dual-Layer Wavelet SVM for Predicting Protein Structural Class Via the General Form of Chou’s Pseudo Amino Acid Composition. Protein & Peptide Letters 19: 422–429. [Crossref]
  124. Chen YL, Li QZ, Zhang LQ (2012) Using increment of diversity to predict mitochondrial proteins of malaria parasite: integrating pseudo amino acid composition and structural alphabet. Amino Acids 42: 1309–1316. [Crossref]
  125. Du P, Wang X, Xu C, Gao Y (2012) PseAAC-Builder: A cross-platform stand-alone program for generating various special Chou’s pseudo amino acid compositions. Analytical Biochemistry 425: 117–119. [Crossref]
  126. Fan GL, Li QZ (2012) Predict mycobacterial proteins subcellular locations by incorporating pseudo-average chemical shift into the general form of Chou’s pseudo amino acid composition. Journal of Theoretical Biology 304: 88–95. [Crossref]
  127. Fan GL, Li QZ (2012) Predicting protein submitochondria locations by combining different descriptors into the general form of Chou’s pseudo amino acid composition. Amino Acids 43: 545–555. [Crossref]
  128. Gao QB, Zhao H, Ye X, He J (2012) Prediction of pattern recognition receptor family using pseudo amino acid composition. Biochemical and Biophysical Research Communications 417: 73–77. [Crossref]
  129. Hayat M, Khan A (2012) Discriminating Outer Membrane Proteins with Fuzzy K-Nearest Neighbor Algorithms Based on the General Form of Chou’s PseAAC. Protein & Peptide Letters 19: 411–421. [Crossref]
  130. Li LQ, Zhang Y, Zou LY, Zhou Y, Zheng XQ (2012) Prediction of Protein Subcellular Multi-Localization Based on the General form of Chou’s Pseudo Amino Acid Composition. Protein & Peptide Letters 19: 375–387. [Crossref]
  131. Liao B, Xiang Q, Li D (2012) Incorporating Secondary Features into the General form of Chou’s PseAAC for Predicting Protein Structural Class. Protein & Peptide Letters 19: 1133–1138. [Crossref]
  132. Lin WZ, Fang JA, Xiao X, Chou KC (2012) Predicting Secretory Proteins of Malaria Parasite by Incorporating Sequence Evolution Information into Pseudo Amino Acid Composition via Grey System Model.
  133. Liu L, Hu XZ, Liu XX, Wang Y, Li SB (2012) Predicting Protein Fold Types by the General Form of Chou’s Pseudo Amino Acid Composition: Approached from Optimal Feature Extractions. Protein & Peptide Letters 19: 439–449. [Crossref]
  134. Mei S (2012) Multi-kernel transfer learning based on Chou’s PseAAC formulation for protein submitochondria localization. Journal of Theoretical Biology 293: 121–130. [Crossref]
  135. Mei S (2012) Predicting plant protein subcellular multi-localization by Chou’s PseAAC formulation based multi-label homolog knowledge transfer learning. Journal of Theoretical Biology 310: 80–87. [Crossref]
  136. Nanni L, Brahnam S, Lumini A (2012) Wavelet images and Chou’s pseudo amino acid composition for protein classification. Amino Acids 43  657–665. [Crossref]
  137. Nanni L, Lumini A, Gupta D, Garg A (2012) Identifying bacterial virulent proteins by fusing a set of classifiers based on variants of Chou’s pseudo amino acid composition and on evolutionary information. IEEE-ACM Transaction on Computational Biolology and Bioinformatics 9: 467–475.
  138. Niu XH, Hu XH, Shi F, Xia JB (2012) Predicting Protein Solubility by the General Form of Chou’s Pseudo Amino Acid Composition: Approached from Chaos Game Representation and Fractal Dimension. Protein & Peptide Letters 19: 940–948. [Crossref]
  139. Qin YF, Wang CH, Yu XQ, Zhu J, Liu TG (2012) Predicting Protein Structural Class by Incorporating Patterns of Over- Represented k-mers into the General form of Chou’s PseAAC. Protein & Peptide Letters 19: 388–397. [Crossref]
  140. Ren LY, Zhang YS, Gutman I (2012) Predicting the Classification of Transcription Factors by Incorporating their Binding Site Properties into a Novel Mode of Chou’s Pseudo Amino Acid Composition. Protein & Peptide Letters 19: 1170–1176. [Crossref]
  141. Sun XY, Shi SP, Qiu JD, Suo SB, Huang SY (2012) Identifying protein quaternary structural attributes by incorporating physicochemical properties into the general form of Chou’s PseAAC via discrete wavelet transform. Molecular BioSystems 8: 3178–3184.
  142. Wang J, Li Y, Wang Q, You X, Man J et al. (2012) ProClusEnsem: predicting membrane protein types by fusing different modes of pseudo amino acid composition. Comput Biol Med 42: 564–574. [Crossref]
  143. Yu X, Zheng X, Liu T, Dou Y, Wang J (2012) Predicting subcellular location of apoptosis proteins with pseudo amino acid composition: approach from amino acid substitution matrix and auto covariance transformation. Amino Acids 42 1619–1625. [Crossref]
  144. Zhao XW, Ma ZQ, Yin MH (2012) Predicting protein-protein interactions by combing various sequence- derived features into the general form of Chou’s Pseudo amino acid composition. Protein & Peptide Letters 19:  492–500. [Crossref]
  145. Zia-ur-Rehman, Khan A (2012) Identifying GPCRs and their Types with Chou’s Pseudo Amino Acid Composition: An Approach from Multi-scale Energy Representation and Position Specific Scoring Matrix. Protein & Peptide Letters 19: 890–903. [Crossref]
  146. Cao DS, Xu QS, Liang YZ (2013) propy: a tool to generate various modes of Chou’s PseAAC. Bioinformatics 29: 960–962. [Crossref]
  147. Chang TH, Wu LC, Lee TY, Chen SP, Huang HD et al. (2013) EuLoc: a web-server for accurately predict protein subcellular localization in eukaryotes by incorporating various features of sequence segments into the general form of Chou’s PseAAC. Journal of Computer-Aided Molecular Design 27: 91–103. [Crossref]
  148. Chen YK, Li KB (2013) Predicting membrane protein types by incorporating protein topology, domains, signal peptides, and physicochemical properties into the general form of Chou’s pseudo amino acid composition. Journal of Theoretical Biology 318: 1–12. [Crossref]
  149. Fan GL, Li QZ, Zuo YC (2013) Predicting acidic and alkaline enzymes by incorporating the average chemical shift and gene ontology informations into the general form of Chou’s PseAAC. Pocess Biochemistry 48: 1048–1053.
  150. Fan GL, Li QZ (2013) Discriminating bioluminescent proteins by incorporating average chemical shift and evolutionary information into the general form of Chou’s pseudo amino acid composition. Journal of Theoretical Biology 334: 45–51. [Crossref]
  151. Georgiou DN, Karakasidis TE, Megaritis AC (2013) A short survey on genetic sequences, Chou’s pseudo amino acid composition and its combination with fuzzy set theory. The Open Bioinformatics Journal 7: 41–48.
  152. Gupta MK, Niyogi R, Misra M (2013) An alignment-free method to find similarity among protein sequences via the general form of Chou’s pseudo amino acid composition. SAR QSAR Environ Res 24: 597–609. [Crossref]
  153. Huang C, Yuan J (2013) Using radial basis function on the general form of Chou’s pseudo amino acid composition and PSSM to predict subcellular locations of proteins with both single and multiple sites. Biosystems 113: 50–57. [Crossref]
  154. Huang C, Yuan JQ (2013) A multilabel model based on Chou’s pseudo amino acid composition for identifying membrane proteins with both single and multiple functional types. J Membr Biol 246: 327–34. [Crossref]
  155.  Huang C, Yuan JQ (2013) Predicting protein subchloroplast locations with both single and multiple sites via three different modes of Chou’s pseudo amino acid compositions. Journal of Theoretical Biology 335: 205–12. [Crossref]
  156. Khosravian M, Faramarzi FK, Beigi MM, Behbahani M, Mohabatkar H (2013) Predicting Antibacterial Peptides by the Concept of Chou’s Pseudo amino Acid Composition and Machine Learning Methods. Protein & Peptide Letters 20: 180–186. [Crossref]
  157. Lin H, Ding C, Yuan LF, Chen W, Ding H (2013) Predicting subchloroplast locations of proteins based on the general form of Chou’s pseudo amino acid  composition: Approached from optimal tripeptide composition. International Journal of Biomethmatics
  158. Lin H, Ding C, Yuan LF, Chen W, Ding H et al. (2013) Predicting subchloroplast locations of proteins based on the general form of Chou’s pseudo amino acid composition: approached from optimal tripeptide composition. International Journal of Biomathematics
  159. Liu B, Wang X, Zou Q, Dong Q, Chen Q (2013) Protein remote homology detection by combining Chou’s pseudo amino acid composition and profile-based protein representation. Molecular Informatics 32: 775–782.
  160. Mohabatkar H, Beigi MM, Abdolahi K, Mohsenzadeh S (2013) Prediction of Allergenic Proteins by Means of the Concept of Chou’s Pseudo Amino Acid Composition and a Machine Learning Approach. Medicinal Chemistry 9: 133–137. [Crossref]
  161. Pacharawongsakda E, Theeramunkong T (2013) Predict Subcellular Locations of Singleplex and Multiplex Proteins by Semi-Supervised Learning and Dimension-Reducing General Mode of Chou’s PseAAC. Transactions on Nanobioscience 12: 311–320. [Crossref]
  162. Qin YF, Zheng L, Huang J (2013) Locating apoptosis proteins by incorporating the signal peptide cleavage sites into the general form of Chou’s Pseudo amino acid composition. International Journal of Quantum Chemistry 113: 1660–1667.
  163. Sarangi AN, Lohani M, Aggarwal R (2013) Prediction of Essential Proteins in Prokaryotes by Incorporating Various Physico-chemical Features into the General form of Chou’s Pseudo Amino Acid Composition. Protein Pept Lett 20: 781–795. [Crossref]
  164. Wan S, Mak MW, Kung SY (2013) GOASVM: A subcellular location predictor by incorporating term-frequency gene ontology into the general form of Chou’s pseudo amino acid composition. Journal of Theoretical Biology 323: 40–48. [Crossref]
  165. Wang X, Li GZ, Lu WC (2013) Virus-ECC-mPLoc: a multi-label predictor for predicting the subcellular localization of virus proteins with both single and multiple sites based on a general form of Chou’s pseudo amino acid composition. Protein & Peptide Letters 20: 309–317. [Crossref]
  166. Xiao X, Min JL, Wang P, Chou KC (2013) iCDI-PseFpt: Identify the channel-drug interaction in cellular networking with PseAAC and molecular fingerprints. Journal of Theoretical Biology 337: 71–79. [Crossref]
  167. Xiaohui N, Nana L, Jingbo X, Dingyan C, Yuehua P (2013) Using the concept of Chou’s pseudo amino acid composition to predict protein solubility: An approach with entropies in information theory. Journal of Theoretical Biology 332: 211–217. [Crossref]
  168. Xie HL, Fu L, Nie XD (2013) Using ensemble SVM to identify human GPCRs N-linked glycosylation sites based on the general form of Chou’s PseAAC. Protein Eng Des Sel 26: 735–742. [Crossref]
  169. Xu Y, Ding J, Wu LY, Chou KC (2013) iSNO-PseAAC: Predict cysteine S-nitrosylation sites in proteins by incorporating position specific amino acid propensity into pseudo amino acid composition
  170. Xu Y, Shao XJ, Wu LY, Deng NY, Chou KC (2013) iSNO-AAPair: incorporating amino acid pairwise coupling into PseAAC for predicting cysteine S-nitrosylation sites in proteins. PeerJ .
  171. Du P, Gu S, Jiao Y (2014) PseAAC-General: Fast building various modes of general form of Chou’s pseudo amino acid composition for large-scale protein datasets. International Journal of Molecular Sciences 15: 3495–3506.
  172. Hajisharifi Z, Piryaiee M, Mohammad Beigi M, Behbahani M, Mohabatkar H (2014) Predicting anticancer peptides with Chou’s pseudo amino acid composition and investigating their mutagenicity via Ames test. Journal of Theoretical Biology 341: 34–40. [Crossref]
  173. Han GS, Yu ZG, Anh V (2014) A two-stage SVM method to predict membrane protein types by incorporating amino acid classifications and physicochemical properties into a general form of Chou’s PseAAC. J Theor Biol 344: 31–39. [Crossref]
  174. Hayat M, Iqbal N (2014) Discriminating protein structure classes by incorporating Pseudo Average Chemical Shift to Chou’s general PseAAC and Support Vector Machine. Comput Methods Programs Biomed 116: 184–192. [Crossref]
  175. Jia C, Lin X, Wang Z (2014) Prediction of Protein S-Nitrosylation Sites Based on Adapted Normal Distribution Bi-Profile Bayes and Chou’s Pseudo Amino Acid Composition. Int J Mol Sci 15: 10410–10423. [Crossref]
  176. Kong L, Zhang L, Lv J (2014) Accurate prediction of protein structural classes by incorporating predicted secondary structure information into the general form of Chou’s pseudo amino acid composition. J Theor Biol 344: 12–18. [Crossref]
  177. Li L, Yu S, Xiao W, Li Y, Li M (2014) Prediction of bacterial protein subcellular localization by incorporating various features into Chou’s PseAAC and a backward feature selection approach. Biochimie 104: 100–107.
  178. Liu B, Xu J, Lan X, Xu R, Zhou J (2014) iDNA-Prot|dis: identifying DNA-binding proteins by incorporating amino acid distance-pairs and reduced alphabet profile into the general pseudo amino acid composition.
  179. Mondal S, Pai PP (2014) Chou’s pseudo amino acid composition improves sequence-based antifreeze protein prediction. J Theor Biol 356: 30–35. [Crossref]
  180. Nanni L, Brahnam S, Lumini A (2014) Prediction of protein structure classes by incorporating different protein descriptors into general Chou’s pseudo amino acid composition. J Theor Biol 360: 109–116. [Crossref]
  181. Qiu WR, Xiao X, Chou KC (2014) iRSpot-TNCPseAAC: Identify recombination spots with trinucleotide composition and pseudo amino acid components. Int J Mol Sci  15: 1746–1766. [Crossref]
  182. Qiu WR, Xiao X, Lin WZ, Chou KC (2014) iMethyl-PseAAC: Identification of Protein Methylation Sites via a Pseudo Amino Acid Composition Approach. Biomed Res Int. [Crossref]
  183. Xu Y, Wen X, Shao XJ, Deng NY, Chou KC (2014) iHyd-PseAAC: Predicting hydroxyproline and hydroxylysine in proteins by incorporating dipeptide position-specific propensity into pseudo amino acid composition. International Journal of Molecular Sciences 15: 7594–7610. [Crossref]
  184. Xu Y, Wen X, Wen LS, Wu LY, K.C. Chou (2014) iNitro-Tyr: Prediction of nitrotyrosine sites in proteins with general pseudo amino acid composition.
  185. Zhang J, Sun P, Zhao X, Ma Z (2014) PECM: Prediction of extracellular matrix proteins using the concept of Chou’s pseudo amino acid composition. Journal of Theoretical Biology 363: 412–418. [Crossref]
  186. Zhang J, Zhao X, Sun P, Ma Z (2014) PSNO: Predicting Cysteine S-Nitrosylation Sites by Incorporating Various Sequence-Derived Features into the General Form of Chou’s PseAAC. Int J Mol Sci 15: 11204–11219. [Crossref]
  187. Zhang L, Zhao X, Kong L (2014) Predict protein structural class for low-similarity sequences by evolutionary difference information into the general form of Chou’s pseudo amino acid composition. J Theor Biol 355: 105–110. [Crossref]
  188. Zuo YC, Peng Y, Liu L, Chen W, Yang L (2014) Predicting peroxidase subcellular location by hybridizing different descriptors of Chou’s pseudo amino acid patterns. Anal Biochem 458: 14–19. [Crossref]
  189. Ahmad S, Kabir M, Hayat M (2015) Identification of Heat Shock Protein families and J-protein types by incorporating Dipeptide Composition into Chou’s general PseAAC. Comput Methods Programs Biomed 122: 165–174. [Crossref]
  190. Ali F, Hayat M (2015) Classification of membrane protein types using Voting Feature Interval in combination with Chou’s Pseudo Amino Acid Composition. J Theor Biol 384: 78–83. [Crossref]
  191. Chen L, Chu C, Huang T, Kong X, Cai YD (2015) Prediction and analysis of cell-penetrating peptides using pseudo amino acid composition and random forest models. Amino Acids 47: 1485–1493. [Crossref]
  192. Dehzangi A, Heffernan R, Sharma A, Lyons J, Paliwal K (2015) Gram-positive and Gram-negative protein subcellular localization by incorporating evolutionary-based descriptors into Chou’s general PseAAC. J Theor Biol 364: 284–294. [Crossref]
  193. Fan GL, Zhang XY, Liu YL, Nang Y, Wang H (2015) DSPMP: Discriminating secretory proteins of malaria parasite by hybridizing different descriptors of Chou’s pseudo amino acid patterns. J Comput Chem 36: 2317–2327. [Crossref]
  194. Huang C, Yuan JQ (2015) Simultaneously Identify Three Different Attributes of Proteins by Fusing their Three Different Modes of Chou’s Pseudo Amino Acid Compositions. Protein Pept Lett 22: 547–556. [Crossref]
  195. Jia J, Liu Z, Xiao X, Chou KC (2015) iPPI-Esml: an ensemble classifier for identifying the interactions of proteins by incorporating their physicochemical properties and wavelet transforms into PseAAC. J Theor Biol 377: 47–56. [Crossref]
  196. Ju Z, Cao JZ, Gu H (2015) iLM-2L: A two-level predictor for identifying protein lysine methylation sites and their methylation degrees by incorporating K-gap amino acid pairs into Chous general PseAAC. J Theor Biol 385: 50–57. [Crossref]
  197. Khan ZU, Hayat M, Khan MA (2015) Discrimination of acidic and alkaline enzyme using Chou’s pseudo amino acid composition in conjunction with probabilistic neural network model. J Theor Biol 365: 197–203. [Crossref]
  198. Kumar R, Srivastava A, Kumari B, Kumar M (2015) Prediction of beta-lactamase and its class by Chou’s pseudo amino acid composition and support vector machine. J Theor Biol 365: 96–103. [Crossref]
  199. Liu B, Chen J, Wang X (2015) Protein remote homology detection by combining Chou’s distance-pair pseudo amino acid composition and principal component analysis. Mol Genet Genomics 290: 1919–1931.
  200. Liu B, Xu J, Fan S, Xu R, Jiyun Zhou J et al. (2015) PseDNA-Pro: DNA-binding protein identification by combining Chou’s PseAAC and physicochemical distance transformation. Molecular Informatics 34: 8–17    [Crossref]
  201. Liu B, Xu J, Fan S, Xu R, Zhou J, et al. (2015) PseDNA-Pro: DNA-binding protein identification by combining Chou’s PseAAC and physicochemical distance transformation. Molecular Informatics 34: 8–17. [Crossref]
  202. Mandal M, Mukhopadhyay A, Maulik U (2015) Prediction of protein subcellular localization by incorporating multiobjective PSO-based feature subset selection into the general form of Chou’s PseAAC. Med Biol Eng Comput 53: 331–344. [Crossref]
  203. Sanchez V, Peinado AM, Perez-Cordoba JL, Gomez AM (2015) A new signal characterization and signal-based Chou’s PseAAC representation of protein sequences. J Bioinform Comput Biol 13: 1550024. [Crossref]
  204. Sharma R, Dehzangi A, Lyons J, Paliwal K, Tsunoda T, et al. (2015) Predict Gram-Positive and Gram-Negative Subcellular Localization via Incorporating Evolutionary Information and Physicochemical Features Into Chou’s General PseAAC. IEEE Trans Nanobioscience 14: 915–926. [Crossref]
  205. Wang X, Zhang W, Zhang Q, Li GZ (2015) MultiP-SChlo: multi-label protein subchloroplast localization prediction with Chou’s pseudo amino acid composition and a novel multi-label classifier. Bioinformatics 31: 2639–2645. [Crossref]
  206. Xu R, Zhou J, Liu B, He Y, Zou Q, et al. (2015) Identification of DNA-binding proteins by incorporating evolutionary information into pseudo amino acid composition via the top-n-gram approach. Journal of Biomolecular Structure & Dynamics (JBSD) 33: 1720–1730. [Crossref]
  207. Zhang M, Zhao B, X. Liu (2015) Predicting industrial polymer melt index via incorporating chaotic characters into Chou’s general PseAAC. Chemometrics and Intelligent Laboratory Systems (CHEMOLAB) 146: 232–240.
  208. Zhang S (2015) Accurate prediction of protein structural classes by incorporating PSSS and PSSM into Chou’s general PseAAC. Chemometrics and Intelligent Laboratory Systems (CHEMOLAB) 142: 28–35.
  209. Zhu PP, Li WC, Zhong ZJ, Deng EZ, Ding H, et al. (2015) Predicting the subcellular localization of mycobacterial proteins by incorporating the optimal tripeptides into the general form of pseudo amino acid composition. Mol Biosyst 11: 558563.
  210. Ahmad K, Waris M, Hayat M (2016) Prediction of Protein Submitochondrial Locations by Incorporating Dipeptide Composition into Chou’s General Pseudo Amino Acid Composition. J Membr Biol 249: 293–304.
  211. Behbahani M, Mohabatkar H, Nosrati M (2016) Analysis and comparison of lignin peroxidases between fungi and bacteria using three different modes of Chou’s general pseudo amino acid composition. J Theor Biol 411: 1–5. [Crossref]
  212. Fan GL, Liu YL, Wang H (2016) Identification of thermophilic proteins by incorporating evolutionary and acid dissociation information into Chou’s general pseudo amino acid composition. J Theor Biol 407: 138–142. [Crossref]
  213. Jia J, Liu Z, Xiao X, Liu B, Chou KC (2016) Identification of protein-protein binding sites by incorporating the physicochemical properties and stationary wavelet transforms into pseudo amino acid composition (iPPBS-PseAAC). J Biomol Struct Dyn (JBSD) 34: 1946–1961. [Crossref]
  214. Jia J, Liu Z, Xiao X, Liu B, Chou KC(2016) pSuc-Lys: Predict lysine succinylation sites in proteins with PseAAC and ensemble random forest approach. Journal of Theoretical Biology 394: 223–230. [Crossref]
  215. Jia J, Liu Z, Xiao X, Liu B, Chou KC (2016) iCar-PseCp: Identify carbonylation sites in proteins by Monto Carlo sampling and incorporating sequence coupled effects into general PseAAC. Oncotarget 7: 34558–34570. [Crossref]
  216. Jia J, Zhang L, Liu Z, Xiao X, Chou KC (2016) pSumo-CD: Predicting sumoylation sites in proteins with covariance discriminant algorithm by incorporating sequence-coupled effects into general PseAAC. Bioinformatics 32: 3133–3141. [Crossref]
  217. Jiao YS, Du PF (2016) Prediction of Golgi-resident protein types using general form of Chou’s pseudo amino acid compositions: Approaches with minimal redundancy maximal relevance feature selection. J Theor Biol 402: 38–44. [Crossref]
  218. Ju Z, Cao JZ, Gu H (2016) Predicting lysine phosphoglycerylation with fuzzy SVM by incorporating k-spaced amino acid pairs into Chou’s general PseAAC. J Theor Biol 397: 145–150. [Crossref]
  219. Kabir M, Hayat M (2016) iRSpot-GAEnsC: Identifing recombination spots via ensemble classifier and extending the concept of Chou’s PseAAC to formulate DNA samples. Molecular Genetics and Genomics 291: 285–96. [Crossref]
  220. Qiu WE, Sun BQ, Xiao X, Xu ZC, Chou KC (2016) iHyd-PseCp: Identify hydroxyproline and hydroxylysine in proteins by incorporating sequence-coupled effects into general PseAAC. Oncotarget 7: 44310–44321. [Crossref]
  221. Tahir M, Hayat M (2016) iNuc-STNC: A sequence-based predictor for identification of nucleosome positioning in genomes by extending the concept of SAAC and Chou’s PseAAC. Mol Biosyst 12: 2587–2593. [Crossref]
  222. Tang H, Chen W, Lin H (2016) Identification of immunoglobulins using Chou’s pseudo amino acid composition with feature selection technique. Mol Biosyst 12: 1269–1275. [Crossref]
  223. Tiwari AK (2016) Prediction of G-protein coupled receptors and their subfamilies by incorporating various sequence features into Chou’s general PseAAC. Comput Methods Programs Biomed 134: 197–213. [Crossref]
  224. Xu C, Sun D, Liu S, Zhang Y (2016) Protein Sequence Analysis by Incorporating Modified Chaos Game and Physicochemical Properties into Chou’s General Pseudo Amino Acid Composition. J Theor Biol 406: 105–115. [Crossref]
  225. Zou HL, Xiao X (2016) Predicting the Functional Types of Singleplex and Multiplex Eukaryotic Membrane Proteins via Different Models of Chou’s Pseudo Amino Acid Compositions. J Membr Biol 249: 23–29. [Crossref]
  226. Zou HL, Xiao X (2016) Classifying Multifunctional Enzymes by Incorporating Three Different Models into Chou’s General Pseudo Amino Acid Composition (doi:10.1007/s00232-016-9904-3). J Membr Biol  249: 561–567. [Crossref]
  227. Cheng X, Xiao X, Chou KC (2017) pLoc-mPlant: Predict subcellular localization of multi-location plant proteins via incorporating the optimal GO information into general PseAAC. Molecular BioSystems 13: 1722–1727. [crossref]
  228. Cheng X, Xiao X, Chou KC (2017) pLoc-mVirus: Predict subcellular localization of multi-location virus proteins via incorporating the optimal GO information into general PseAAC. Gene 628: 315–321. [Crossref]
  229. Ju Z, He JJ (2017) Prediction of lysine propionylation sites using biased SVM and incorporating four different sequence features into Chou’s PseAAC. J Mol Graph Model 76 356–363.
  230. Ju Z, He JJ (2017) Prediction of lysine crotonylation sites by incorporating the composition of k-spaced amino acid pairs into Chou’s general PseAAC. J Mol Graph Model 77: 200–204. [Crossref]
  231. Khan M, Hayat M, Khan SA, Iqbal N (2017) Unb-DPC: Identify mycobacterial membrane protein types by incorporating un-biased dipeptide composition into Chou’s general PseAAC. J Theor Biol 415: 13–19.
  232. Liang Y, Zhang S (2017) Predict protein structural class by incorporating two different modes of evolutionary information into Chou’s general pseudo amino acid composition. J Mol Graph Model 78: 110–117.
  233. Liu LM, Xu Y, Chou KC (2017) iPGK-PseAAC: Identify lysine phosphoglycerylation sites in proteins by incorporating four different tiers of amino acid pairwise coupling information into the general PseAAC. Med Chem 13: 552–559. [Crossref]
  234. Meher PK, Sahu TK, Saini V, Rao AR (2017) Predicting antimicrobial peptides with improved accuracy by incorporating the compositional, physico-chemical and structural features into Chou’s general PseAAC. Sci Rep 7: 42362. [Crossref]
  235. Qiu WR, Sun BQ, Xiao X, Xu D, Chou KC (2017) iPhos-PseEvo: Identifying human phosphorylated proteins by incorporating evolutionary information into general PseAAC via grey system theory. Molecular Informatics 36: 5–6. [Crossref]
  236. Qiu WR, Zheng QS, Sun BQ, Xiao X (2017) Multi-iPPseEvo: A Multi-label Classifier for Identifying Human Phosphorylated Proteins by Incorporating Evolutionary Information into Chou’s General PseAAC via Grey System Theory. Mol Inform 36.
  237. Rahimi M, Bakhtiarizadeh MR, Mohammadi-Sangcheshmeh A (2017 ) OOgenesis_Pred: A sequence-based method for predicting oogenesis proteins by six different modes of Chou’s pseudo amino acid composition. J Theor Biol 414: 128–136.
  238. Tripathi P, Pandey PN (2017) A novel alignment-free method to classify protein folding types by combining spectral graph clustering with Chou’s pseudo amino acid composition. J Theor Biol 424: 49–54. [Crossref]
  239. Xiao X, Cheng X, Su S, Nao Q, Chou KC (2017) pLoc-mGpos: Incorporate key gene ontology information into general PseAAC for predicting subcellular localization of Gram-positive bacterial proteins. Natural Science 9: 331–349.
  240. Xu C, Ge L, Zhang Y, Dehmer M, Gutman I (2017) Prediction of therapeutic peptides by incorporating q-Wiener index into Chou’s general PseAAC. J Biomed Inform 75: 63–69.
  241. Xu Y, Wang Z, Li C, Chou KC (2017) iPreny-PseAAC: Identify C-terminal cysteine prenylation sites in proteins by incorporating two tiers of sequence couplings into PseAAC. Med Chem 13: 544–551. [Crossref]
  242. Yu B, Li S, Qiu WY, Chen C, Chen RX, et al. (2017) Accurate prediction of subcellular location of apoptosis proteins combining Chou’s PseAAC and PsePSSM based on wavelet denoising. Oncotarget 8: 107640–107665. [Crossref]
  243. Yu B, Lou L, Li S, Zhang Y, Qiu W, et al. (2017) Prediction of protein structural class for low-similarity sequences using Chou’s pseudo amino acid composition and wavelet denoising. J Mol Graph Model 76: 260–273.
  244. Ahmad J, Hayat M (2018) MFSC: Multi-voting based Feature Selection for Classification of Golgi Proteins by Adopting the General form of Chou’s PseAAC components. J Theor Biol 463: 99–109. [Crossref]
  245. Akbar S, Hayat M (2018) iMethyl-STTNC: Identification of N(6)-methyladenosine sites by extending the Idea of SAAC into Chou’s PseAAC to formulate RNA sequences. J Theor Biol 455: 205–211. [Crossref]
  246. Arif M, Hayat M, Jan Z (2018) iMem-2LSAAC: A two-level model for discrimination of membrane proteins and their types by extending the notion of SAAC into Chou’s pseudo amino acid composition. J Theor Biol 442: 11–21. [Crossref]
  247. Butt AH, Rasool N, Khan YD (2018) Predicting membrane proteins and their types by extracting various sequence features into Chou’s general PseAAC. Mol Biol Rep 45: 2295–2306. [Crossref]
  248. Cheng X, Xiao X, Chou KC (2018) pLoc-mEuk: Predict subcellular localization of multi-label eukaryotic proteins by extracting the key GO information into general PseAAC. Genomics 110: 50–58. [Crossref]
  249. Cheng X, Xiao X, Chou KC (2018) pLoc-mGneg: Predict subcellular localization of Gram-negative bacterial proteins by deep gene ontology learning via general PseAAC. Genomics 110: 231–239. [Crossref]
  250. Cheng X, Xiao X, Chou KC (2018) pLoc-mHum: Predict subcellular localization of multi-location human proteins via general PseAAC to winnow out the crucial GO information. Bioinformatics 34 (2018) 1448–1456.
  251. Cheng X, Xiao X, Chou KC (2018) pLoc_bal-mGneg: Predict subcellular localization of Gram-negative bacterial proteins by quasi-balancing training dataset and general PseAAC. Journal of Theoretical  Biology 458: 92–102. [Crossref]
  252. Cheng X, Xiao X, Chou KC (2018) pLoc_bal-mPlant: Predict subcellular localization of plant proteins by general PseAAC and balancing training dataset. Curr Pharm Des 24: 4013–4022.
  253. Contreras-Torres E (2018) Predicting structural classes of proteins by incorporating their global and local physicochemical and conformational properties into general Chou’s PseAAC. J Theor Biol 454: 139–145. [Crossref]
  254. Fu X, Zhu W, Liso B, Cai L, Peng L, et al. (2018) Improved DNA-binding protein identification by incorporating evolutionary information into the Chou’s PseAAC. IEEE Access 20
  255. Ghauri AW, Khan YD, Rasool N, Khan SA, Chou KC (2018) pNitro-Tyr-PseAAC: Predict nitrotyrosine sites in proteins by incorporating five features into Chou’s general PseAAC. Curr Pharm Des 24: 4034–4043. [Crossref]
  256. Javed F, Hayat M (2018) Predicting subcellular localizations of multi-label proteins by incorporating the sequence features into Chou’s PseAAC. Genomics 111: 1325–1332.
  257. Ju Z, Wang SY (2018) Prediction of citrullination sites by incorporating k-spaced amino acid pairs into Chou’s general pseudo amino acid composition. Gene 664: 78–83. [Crossref]
  258. Khan YD, Rasool N, Hussain W, Khan SA, Chou KC (2018) iPhosT-PseAAC: Identify phosphothreonine sites by incorporating sequence statistical moments into PseAAC. Analytical Biochemistry 550: 109–116. [Crossref]
  259. Khan YD, Rasool N, Hussain W, Khan SA, Chou KC (2018) iPhosY-PseAAC: Identify phosphotyrosine sites by incorporating sequence statistical moments into PseAAC. Mol Biol Rep 45: 2501–2509. [Crossref]
  260. Krishnan MS (2018) Using Chou’s general PseAAC to analyze the evolutionary relationship of receptor associated proteins (RAP) with various folding patterns of protein domains. J Theor Biol 445: 62–74. [Crossref]
  261. Mei J, Fu Y, Zhao J (2018) Analysis and prediction of ion channel inhibitors by using feature selection and Chou’s general pseudo amino acid composition. J Theor Biol 456: 41–48. [Crossref]
  262. Mei J, Zhao J (2018) Prediction of HIV-1 and HIV-2 proteins by using Chou’s pseudo amino acid compositions and different classifiers. Sci Rep 8: 2359.
  263. Mei J, Zhao J (2018) Analysis and prediction of presynaptic and postsynaptic neurotoxins by Chou’s general pseudo amino acid composition and motif features. J Theor Biol 427: 147–153. [Crossref]
  264. Mousavizadegan M, Mohabatkar H (2018) Computational prediction of antifungal peptides via Chou’s PseAAC and SVM. J Bioinform Comput Biol. [Crossref]
  265. Rahman SM, Shatabda S, Saha S, Kaykobad M, Sohel Rahman M (2018) DPP-PseAAC: A DNA-binding Protein Prediction model using Chou’s general PseAAC. J Theor Biol 452: 22–34. [Crossref]
  266. Sankari ES, Manimegalai DD (2018) Predicting membrane protein types by incorporating a novel feature set into Chou’s general PseAAC. J Theor Biol 455: 319–328.
  267. Chou KC (2019) Two kinds of metrics for computational biology. Genomics.
  268. Chou KC (2019) Proposing pseudo amino acid components is an important milestone for proteome and genome analyses. International Journal for Peptide Research and Therapeutics .
  269. Chou K.C (2019) An insightful recollection for predicting protein subcellular locations in multi-label systems. Genomics.
  270. Chou KC (2019) Progresses in predicting post-translational modification. International Journal of Peptide Research and Therapeutics .
  271. Chou KC (2019) Recent Progresses in Predicting Protein Subcellular Localization with Artificial Intelligence (AI) Tools Developed Via the 5-Steps Rule. Japanese Journal of Gastroenterology and Hepatology 2: 1–4.
  272. Chou KC (2019) An insightful recollection since the distorted key theory was born about 23 years ago. Genomics.
  273. Chou KC (2019) Artificial intelligence (AI) tools constructed via the 5-steps rule for predicting post-translational modifications. Trends in Artificial Inttelengence 3: 60–74.
  274. Chou KC (2020) Distorted Key Theory and Its Implication for Drug Development. Current Genomics.
  275. Chou KC (2019) An insightful recollection since the birth of Gordon Life Science Institute about 17 years ago. Advancement in Scientific and Engineering Research 4: 31–36.
  276. Chou KC (2019) Gordon Life Science Institute: Its philosophy, achievements, and perspective. Annals of Cancer Therapy and Pharmacology 2: 1–26.

SARS-Cov2: A Review of this Novel Coronavirus

DOI: 10.31038/IMROJ.2020511

Abstract

Background: Coronaviruses are a group of RNA viruses responsible for respiratory and gastrointestinal illness. Of this group two have been associated with pandemics in recent years. As of December 2019, a new coronavirus (SARS-CoV2) was reported in Wuhan, China which despite best efforts has spread internationally prompting panic and universal public-health measures.

Methods: A literature review was conducted utilising the PubMed database in March 2020. Search terms included ‘Wuhan’ OR ‘Coronavirus’ OR ‘2019-nCoV’ OR ‘SARS-CoV2’ AND ‘pneumonia’ OR ‘Outbreak’ OR ‘Infection’. These were used in isolation and combination to yield results. Papers were selected if they explored the diagnosis, management, transmission and/or treatment of SARS-CoV2. Following these 68 papers were screened of which 48 papers were included in this review.

Results & Discussion: Early studies highlight that SARS-CoV2 has an incubation period of between 3–7 days and commonly presents with fever (93%), cough (69.8%) and dyspnoea (34.5%) and prominent upper respiratory tract symptoms. Patients are predominantly male and there is high prevalence of significant comorbid disease in fatal cases (overall case: fatality ratio-2–3%). Encouragingly, supportive treatments are mainstay with the need for invasive ventilation and extracorporeal life support (ECLS) low. Diagnosis of SARS-CoV2 is made by demonstration of the virus by RT-PCR of throat/lavage specimens; however given the propensity for false negatives, CT-imaging is being used diagnostically with characteristic findings reported and can even detect disease in the asymptomatic phase where transmission is possible. International interventions have been to adhere to 14-day observation periods for suspected cases, the wearing of N95 facemasks alongside social distancing and hand-hygiene due to fomites. While antiviral treatments have been trialled in case-series no clear consensus has been made regarding their use but it remains clear that concurrent antibiotics are mainstay with restrictive fluid replacement. Emerging therapies which may show benefit include chloroquine, remdesivir, tocilizumab, azithromycin and sunitinib with the discontinuation of ACE inhibitors proposed.

Conclusion: SARS-CoV2’s impact is greatest in the elderly and comorbid. Research has indicated key targets which may be important in producing effective treatments and an efficacious vaccine. On-going aims must be to try to alter behaviours and limit viral spread through social distancing, good hand hygiene and Personal Protective Equipment (PPE). Future trials must attempt to prognosticate patients further and understand the role if any of redeployed treatments which have showed some promise. In addition, questions surrounding long term immunity require further investigation.

Introduction

Coronaviruses are a group of spherical positive-strand RNA viruses. Prior to SARS-CoV2 (formerly known as Ncorv-19/covid-19) six coronaviruses were thought to exist, with two causing pandemics in recent times: Severe Acute Respiratory Syndrome (SARS) and Middle Eastern Respiratory Syndrome (MERS). This group of viruses are not unique to humans and can be found in birds, domesticated animals, camels and bats who serve as hosts and reservoirs of the disease [1, 2]. It is thought that 30% of annual respiratory illnesses are caused by coronaviruses leading to wide ranging presentations from pharyngitis to pneumonia, with a predominantly respiratory droplet spread. Increasingly, human-human transmission and transmission by asymptomatic carriers of coronaviruses is being appreciated [3, 4].

On 8–9th December 2019, 7 patients presented within Wuhan, Hubei province, China with a viral pneumonia of unknown origin, but a common exposure to the Huanan seafood market where many wild animals are held in close proximity [1, 5]. As of 31st December the World Health Organization (WHO) were informed of these novel cases and the first identification of this virus as a coronavirus was on the 9th January 2020. Complete analysis of the viral genome revealed it is a beta coronavirus with 79% similarity to SARS and 50% similarity to MERS, which are also beta coronaviruses, but is nearly completely homologous with two bat derived SARS who are the likely host and reservoir of the SARS-CoV2. The viral genome was made publicly available from the 12th January 2020 allowing for the first Reverse Transcriptase polymerase chain reaction (RT-PCR) testing to occur [3, 6]. The structure of a coronavirus is such that there are Spike (S), Envelop (E) and membrane (M) proteins. The (S) protein is the primary determinant of cellular infection and it itself has two domains; S1 which mediates receptor binding, and S2 which allows for virion fusion to the cell membrane. Distinct in SARS-CoV2 is an additional activation loop in the S1/S2 proteins not shared with either MERS or SARS [7]. As of 23rd March 2020, 170 countries have declared cases, with patient numbers globally standing at >300,000, and over 14,509 deaths with a reported case fatality rate of 2–3% which is much lower than initial reports highlighted [8, 9]. In comparison MERS spread to 27 countries and resulted in 858 deaths with a case fatality rate of 34.4% with SARS affecting 26 countries with 774 deaths: a corresponding case fatality rate of 9.5%. It is because of the inexorable spread of this virus that as of 30th January 2020 the WHO branded SARS-Cov2 as a global public emergency. This has resulted in a multitude of countries taking enormous steps to limit international travel, and more dramatic interventions here in the UK for example with public transport limited to key workers. This was provoked by by the first wave of mortality here in the UK and quarantine in Italy [10, 11]. Borne from this panic there are increasing reports of discrimination against Chinese people, and mounting hysteria with regards to the possible apocalyptic nature of this outbreak. However, even with the rapid increase in cases noted through means such as a contact tracing and screening, overall case: fatality rate remains 2% with severe disease occurring predominantly in the elderly with attendant comorbidities [12].

In this review we explore the knowns of SARS-Cov2 regarding its prevention, diagnosis, presentation and management and the vast unknowns which have made this disease entity the one of the most globally important of the century so far.

Methods

Literature review was conducted in March 2020. Papers were identified via a literature search using the PubMed database. Papers were selected if they were written in English and published in peer reviewed journals between December and March 2020. Articles were selected if they documented cases of SARS-CoV2 (formerly known as 2019-nCoV/n-cov19) and dealt with the diagnosis, management, transmission and/or treatment of the infection.

Search terms included ‘Wuhan’ OR ‘Coronavirus’ OR ‘2019-nCoV’ OR ‘n-cov19’ OR ‘SARS-CoV2’ AND ‘pnuemonia’ OR ‘Outbreak’ OR ‘Infection’. These terms were used in isolation and combination to locate search results.

This search obtained 78 results from which both authors conducted a screen of their titles, study design and abstracts. Issues highlighted at this stage were addressed by contacting the paper authors. Papers were excluded if they were not written in English, not peer reviewed, did not explore in detail the diagnosis, management, transmission and treatment of SARS-CoV2 leading to 57 papers. Data was extracted from each paper regarding the population, end points, follow up and methods employed. All papers with a conflict of interest or, publication bias and overlapping patient or outcome data were removed. Application of the above criteria yielded 48 papers which were utilised in this review.

Results and Discussion

Following the identification of SARS-CoV2, much has been done to understand the natural history of the condition and its presentation. Early studies revealed that SARS-CoV2 has an incubation period of between 3–7 days with a case series reporting a median of 7 days (4.0–8.0 days) between symptom onset and hospitalisation and from symptom onset to ICU admission 10.5 days (8.0–17.0 days) [5, 13]. In terms of presentation fever (93%) was the most common initial symptom followed by cough (69.8%), dyspnoea (34.5%), sore throat (15%), headache (7.2%) and diarrhoea (6.1%) which corroborates with other studies [5, 6]. These symptoms are common amongst the betacoronaviruses however SARS-CoV2 uniquely also presents with upper respiratory tract infection (URTI) symptoms including sore throat, rhinorrhoea, anosmia and sneezing. Of those patients who went on to die, death occurred between 6–41 days after symptom onset (median 14 days). Unsurprisingly in those patients >70 years old the interval between symptom and onset and death was significantly decreased [13, 15].

To date one of the largest reviews of SARS-CoV2 patients (n=278) utilised data from 3 large scale studies. Of included patients 61.9% were male with an average age of 54.7 years. This gender disparity is described elsewhere in the literature with a male preponderance of up to 70% reported [16]. Among study patients the most common comorbid conditions included hypertension (15–31%), cardiovascular disease (14–40%) and type 2 diabetes mellitus (10–19%). Results from this review revealed that 72 patients required Intensive Care Unit (ICU) admission, 56 of these being diagnosed with Acute Respiratory Distress Syndrome (ARDS). Of these 23 (8% total cohort) required invasive ventilations and 9 (3% total cohort) required extracorporeal life support (ECLS). Overall mortality differed amongst the incorporated studies ranging from 4–14% with inherent differences between study groups [6]. In a review of 99 patients with SARS-CoV2 treated at a major tertiary infectious disease hospital in Wuhan, only 4% required invasive ventilation and 3% required ECLS respectively. Importantly these patients could be predicted to need higher levels of support with existing early warning score models. However, no comparison of patients in these studies receiving such treatments in the context of their MuLBSTA score was undertaken. The MuLBSTA score is a validated tool for assessing the 90-day mortality risk using 6 parameters in the setting of viral pneumonia, somewhat synonymous with the CURB-65 severity score of community acquired pneumonias [17, 18]. Formal studies are required to assess the use of this scoring system and others in predicting outcomes in SARS-CoV2.

Common amongst these multiple reviews is the higher prevalence of disease in middle-aged men with pre-existing cardiovascular disease. One debated risk factor is that of smoking. Interestingly, smoking status in affected patients is both poorly recorded and investigated. Of the one systematic review that could be found on this subject utilizing only 5 papers, a positive association between smoking and both disease progression (OR 1.28) and ICU admission (RR 2.4) was recorded. However no relationship between relative tobacco exposures or e-cigarette use and these outcomes was explored [8, 19]. While larger and further studies are needed it would seem prudent that physicians and health agencies reinforce the need for smoking cessation especially as the public are possibly more motivated to follow health messages at this time. While it is necessary in a minority to utilise invasive ventilation and ECLS, it remains unclear what benefit the latter will offer in SARS-CoV2. Whilst ECLS was utilised in SARS to modest effect, mortality reduction was seen in some cohort studies of MERS [20, 3]. However, experience from the larger H1N1 pandemic of 2009–2011 has cast doubt regarding the efficacy of ECLS in ARDS of viral aetiology, with the EOLIA trial suggesting that 60-day mortality is not altered with this therapy versus invasive ventilation. Recent guidance from the WHO recommends prone ventilation, restrictive fluid practice and lung protective ventilation. Whilst there has been enthusiasm for corticosteroid use in SARS-CoV2 ARDS, there is little evidence for their prescription, and they are not currently recommended having shown no promise in SARS or MERS previously. At present high-flow nasal oxygen therapy is considered a good highly available intervention that can in patients prevent the need for intubation but requires intense monitoring [21–25]. Given the large numbers of patients affected by SARS-CoV2, massive coordinated action must be undertaken by health agencies to increase both ICU beds and expertise amongst non-ICU trained staff on traditional hospital wards. It may be however that the propensity for severe respiratory disease in some patients may be linked to neurological involvement. Evidence from studies of SARS in both human and animal models indicated it could cause severe brainstem infection and by involving the cardiorespiratory centres depress respiration centrally. Whilst this is difficult to reverse, awareness of this possible mechanism of respiratory decline is important for all physicians to consider in the nonresponding patient [26].

As mentioned previously, predicting outcomes in patients is key to allow for health services to deploy resources accordingly. Analysis of patients requiring ICU admission versus those who did not revealed statistically increased total neutrophils, decreased lymphocyte counts and increased serum pro-inflammatory cytokines levels (e.g. IL-6, TNFα), highlighting the role of immune activation and the ‘cytokine storm’ in SARS-CoV2 infection. Moreover, serum IL-6 and TNFα levels have been found to correlate with risk of death in SARS-CoV2 infection [16, 8]. Key to the innate immune systems response to viral infection is the production of interferon following recognition of viral associated pathogen associated molecular patterns (PAMPs) such as viral RNA by toll-like-receptors leading to activation of signalling cascades. It appears clear that there is attenuation of this process in the closely related SARS infection, with immune evasion mechanisms at work including degradation of RNA detecting proteins, which in part explains the prolonged incubation period of SARS-CoV2 versus other common viral infections. For long term control of viral infections Th1 adaptive immune responses are needed with evidence Th2 responses in SARS-CoV2 is linked to negative outcomes. Therefore, a prerequisite for any future vaccines trialled in SARS-CoV2 must be to produce this response with DNA based vaccines more likely to elicit strong durable immune responses of this nature [27].

Currently the diagnosis of SARS-CoV2 requires pathological evidence of the virus through RT-PCR of suitable samples (e.g throat swab/bronchoalveolar lavage (BAL), however radiological imaging is important in determining both severity of disease and ruling out differentials [13]. Imaging studies (CXR/Computer Tomography (CT)) of affected patients demonstrates that SARS-CoV2 presents variably with bilateral ground glass opacifications the most common finding, but focal/lobar consolidation, pleural effusion, mediastinal lymphadenopathy and pneumothorax also being described [4, 28]. In addition CT findings vary in SARS-CoV2 infection depending on the underlying stage of the disease (Table 1). Currently no serological testing is routinely used in SARS-CoV2 diagnosis.

Table 1. CT findings by stage of SARS-CoV2 infection [13].

Stage (Days)

CT Findings

Ultra-Early

Focal / ground glass nodules

Early [1–3]

Congestion of alveolar capillaries, interstitial oedema

Rapid Progression [3–7]

Worsening alveolar and interstitial oedema

Consolidation [7–14]

Multiple patchy consolidation, fibrous alveolar exudates

Dissipation [14–21]

Strip like consolidation

One study assessing the range of radiological findings of SARS-CoV2 in 90 patients (39 men; 51 women; median age 50 years) showed that on baseline noncontrast CT 69/90 (77%) had radiological abnormalities with 53% having multiple lobe involvement with a predilection for the lower lung lobes noted. The most common radiological pattern was ground glass opacification (72%) followed by consolidation (13%), in addition 56% had pleural thickening. It is thought ground glass opacities represent diffuse alveolar damage and their filling with pus or exudate. Of the 52 patients reimaged between 1–6 days post initial CT, 19% had no changes, 73% had disease progression and 3% demonstrared new bilateral ground glass opacities having had normal previous imaging [28]. Interestingly, in a retrospective analysis of 51 confirmed patients with SARS-CoV2 of median age 45 years, while only 36 (71%) had positive RT-PCR throat swabs on first testing with a further 12 testing positive on the second throat swab this compared to 50/51 (98%) on initial noncontrast CT showing signs of viral pneumonia (p<0.001) [29]. This corresponds to a large review of 1014 cases in China where the sensitivity of chest CT was 97%, with 70% of patients with a negative RT-PCR test showing typical CT findings for SARS-Cov2 infection. This highlights an important fact that the total positive rate of RT-PCR of throat swabs is between 30–60% and as such cannot be relied upon by itself for diagnosis and may miss affected patients. Importantly, the time between initial negative to positive RT-PCR testing of throat swabs can be up to 6 days [30]. Moreover, there have been findings of CT changes in keeping with SARS-CoV2 in otherwise asymptomatic patients suggesting that even subclinical disease can lead to pathological changes to the lung space and therefore a low threshold of imaging should be used in patients with suitable exposure to allow for earlier treatment [4]. Therefore, the ongoing focus for diagnosis must be to further optimise the RT-PCR testing process including sample collection, transport and storage to ensure no possible tampering of results. Clinicians must therefore not be deterred by a negative result in the context of a high index of suspicion; although vigilance for superadded bacterial or fungal processes should be both considered and investigated as required.

At present no cases of death have been reported in children, although cases have been reported in children between ages 1.5 months-17 years and appear to manifest in a similar way to adult patients albeit milder with recovery anticipated within 1–2 weeks [31]. It remains unclear the possible mechanism of this protection afforded by youth. Encouragingly there is no evidence of maternal transmission of SARS-CoV2 during pregnancy like both SARS and MERS. However, it is in this patient group that worse outcomes are seen with pneumonia of all types with 25% of those affected needing ventilatory support [1]. While no formal cases of SARS-CoV2 have been identified in pregnant women lessons can be learnt from the SARS and MERS pandemic. In the seven cases of SARS in pregnant women in Hong Kong: four sustained spontaneous miscarriage in the first trimester. Moreover, in case control studies pregnant women with SARS were more likely to suffer renal failure and disseminated intravascular coagulopathy (p=0.006) with 60% and 40% requiring ICU admission and intubation respectively. In MERS of the five documented cases all required ICU, with two mothers dying, and two cases of perinatal death recorded [1]. As such a low threshold for testing and isolating pregnant women is needed, and while no link to the unborn child has been found given the severity of related coronaviruses in this patient group, treatment should be given without delay.

Key to the control of this pandemic is to limit the spread of SARS-CoV2 which is linked to the transmissibility of the virus itself. One key aspect is its reproductive rate (R0 value). This refers to the average number of people who will be infected from one contagious person and is quoted to allow us to predict potential spread of a pathogen. Based on initial data and cases as they appeared, quoted R0 values have included 1.68 (31 December – Jan 2020) 2.24 (10–24th January 2020) [6], case reports quoting 5.5 with the WHO quoting between 1.4–2.5. This is in keeping with most major viral infections which have resulted in global concern (Table 2) [32, 33]. It remains to be seen if the R0 of SARs-CoV2 continues to change, this is because notable among the coronaviruses is the frequency of both replication errors and recombination events that can take place during its reproductive cycle and can result in quasispecies with increased virulence. So far analysis of the SARS-CoV2 genome shows little evidence of significant recombination. However, with more cases and geographical spread of the virus this may change [33]. One way to decrease the R0 has been to limit both domestic and international travel with at international airports and borders thermal scanning being undertaken to detect possible cases however when this method was evaluated during the H1N1 pandemic a sensitivity of only 5.8% was reported. Regardless however it can be considered important in raising public awareness of the condition and improve overall participation in risk reducing behaviours such as social distancing [2]. Upon analysing the effect of travel restrictions on SARS-CoV2 dissemination since 23rd January 2020, utilising the Global Epidemic and Mobility Model (GLEAM), it has been shown that even in the instance of 90% travel reductions if the transmission rate of SARS-CoV2 remains constant then the delay achieved in peak number of cases is only by 2 weeks with the peak number of cases in Wuhan expected in March 2020. Therefore, key to any government strategy for SARS-CoV2 is to propagate effective hygiene behaviours and enforce quarantine. This requires considerable investment in easy to access, reputable public information sources and importantly quashing of false information that can now be easily disseminated through social media services. [34] At present common practices include 14 days observation period for exposed and symptomatic persons and to attend hospital if concerned or systemically unwell, wearing of N95 masks by healthcare workers who have had close contact to affected cases and standing at least 1m from other members of the public. These recommendations are supported by the Centres for Disease Control and Prevention (CDC) and have since become internationally adopted [13, 35]. Suspected cases here were defined as those individuals who have been in close contact with confirmed cases in a workplace/study/vehicular environment or have been involved treating a confirmed case. These recommendations are even more relevant given the first reports of human-human transmission (20th January 2020) which involved a family cluster with a male in Vietnam developing the infection having never travelled to an affected area but only having contact with his parents who had flown from Wuhan some 3 days earlier.[36] Moreover, in the hospital environment reports have circulated of nosocomial outbreaks of SARS-CoV2 highlighting the need for strict hand hygiene and Personal Protective Equipment (PPE) use particularly in aerosol generating procedures. One study assessing 3 patients treated in Singapore in isolation rooms with air sampling, environmental and PPE sampling showed that there was significant environmental and PPE contamination, particularly on the toilet bowel and sinks but not outside of the isolation rooms themselves. This highlights firstly the possibility of faecal shedding of the virus further suggested by the symptoms of diarrhoea in reported cases but also the awareness needed of fomite transmission Emerging evidence suggests the virus can persist on plastic and metal surfaces for up to 3 days. Interestingly after routine decontamination practices these isolation rooms showed no contamination whatsoever proving current procedures are adequate when performed properly and regularly and that adequate PPE resources are mandatory to limit hospital spread [37, 38]. One contentious issue however is mass public masking. This is for several reasons this includes not only a global shortage of masks but also a lack of evidence regarding its effectiveness. While logically their use limits droplet spread, they have never been truly studied in this regard being designed for occupational not environmental exposures. It is because of this the WHO offers rather vague guidance in this regard. However, it must be remembered that if hand hygiene isn’t followed than masks can usher a false sense of security and can easily become contaminated and thereby useless. Regardless clear alternatives are needed given that disposable surgical masks provide huge financial and environmental burdens [39].

Table 2. Relative reproductive rates of commonly encountered viruses [32, 33].

Virus

R0 value

SARs-CoV

2–5

MERS-CoV

<1

H1N1

1.2–1.6

Rhinovirus

6

HIV
Measles
Influenza
Ebola

2–4
12–18
1–2
1.5–2.5

At present there is no consensus on the treatment of SARS-CoV2. Likewise, while many treatments were trialled in the case of SARS/MERS no vaccine was produced. Review of the literature reveals that antibiotics are being trialled in up to 90% with 76–85% receiving antivirals. Other treatments trialled include intravenous immunoglobulin (IVIg) and corticosteroids but none have demonstrated dramatic success [6, 17]. Antiviral choice so far has included among others oseltamivir, ganciclovir [17], lopinavir/ritonavir [2] and while a tendency to improved outcomes and/or reduced viral loads have been reported these have been restricted by their small sample sizes and inadequate methodology. Novel medications that may help in SARS-CoV2 infection include combination chloroquine with remdesivir and hydroxychloroquine. Indeed, in a multiple drug panel analysis looking at half-cytotoxic concentration and selectivity index both chloroquine and remdesivir (adenosine analogue) were able to do so at low micromolar concentrations in in vitro assays and have a proven safety record with the former of these used for some 70 years in clinical medicine [6, 40]. Indeed since this initial report intravenous remdesivir has been given in a case report with a positive outcome [41]. Underlying chloroquine’s antiviral effect is alteration to lysosomal pH which is thought may reduce SARS-CoV2 membrane binding with hydroxychloroquine demonstrating up to 3 times the potency of chloroquine in vitro. Of the few open label clinical trials that exist, one demonstrated that of the 20 patients who received hydroxychloroquine (of which 6 also received azithromycin) a reduction at 6 days in viral carriage of 57.1% and 100% was reported. No evidence of cardiotoxicity was observed in these patients. However, this study was limited by its high dropout rate and limited follow up but does demonstrate some possible means of both prophylaxis and treatment in shedding patients [42]. Common to some of these drugs are their anti-rheumatic properties and it may be that rheumatoid arthritis patients who are on these drugs are less likely to develop SARS-CoV2, although this has not yet been epidemiologically demonstrated. IL-6 blockers (e.g. tocilizumab) have been among rheumatoid drugs shown to have some efficacy in SARS-CoV2 infection and can be assumed to limit the cytokine storm which has been observed in critically ill patients. Small initial retrospective studies in SARS-CoV2 infection patient show that tocilizumab can produce clinical, biochemical and radiological improvements even in severe disease and has now been chosen for phase 2 trials [43]. As we understand more about SARS-CoV2 life cycle so has our identification of potential drug targets. It is now appreciated that SARS-CoV2 utilises the Angiotensin Converting Enzyme 2 (ACE2) receptor to enter mammalian cells via receptor mediated endocytosis with TMPRSS2 a serine protease implicated in this process. The ACE2 receptor is ubiquitous but is particularly expressed within AT2 alveolar epithelial cells which are prone to viral infection and raises two main points. Firstly, Animal studies suggest that ACE inhibitors can significantly increase ACE2 activity, and therefore may potentiate SARS-CoV2 virulence. As such we must determine whether we can limit the risk of severe disease by switching these agents when appropriate. This would be a very easy and inexpensive option that could be pre-emptively done [44, 45]. Secondly, key to infection of these cells is AP2-associated protein kinase 1 (AAK1), which on drug screening is effectively blocked by sunitinib and erlotinib and could represent potential drug targets. It is thought this would offer a means of decreasing virion entry into cells alongside camostate mesylate, a TMPRSS2 inhibitor which has proven in vitro activity in preventing SARS-CoV2 infection in multiple lung cell lines. However, sunitinib and others of the class have significant side-effects such as Posterior Reversible Encephalopathy Syndrome (PRES), Thyroiditis and pancytopenia. Baracitnib, a closely related JAK-kinase inhibitor may avoid these issues however safety concerns with regards to potentiating progression of SARS-CoV2 infection have been raised [44, 46, 47]. While targeting of the S1 subunit of the virus seems ideal considering its role in entering susceptible cells , previous studies in MERS have shown the (E) protein is integral and that when it is deleted both defective viral propagation and beneficial host immune responses to the virus are seen. Considering this (E)-protein based therapies may possibly yield promising results. Suitable animal models could include ferrets as they can replicate some of the URTI symptoms of the condition and therefore the main method by which SARS-CoV2 spreads this, deserves further investigation [3, 48].

Conclusion

SARS-CoV2 represents the 7th coronavirus and is novel in both its genomics, degree of spread and the fear it has inspired. Thus far its impact is greatest in the elderly and comorbid. Early institution of mechanical ventilation to control droplet spread may be important with consequences for critical care service planning, and in more severe ARDS presentations, there will be increasing demand for invasive therapies, which should primarily be undertaken by experienced centres with high case volume. Research has indicated key targets which may be important in producing an efficacious vaccine, but this may not be available until later waves of disease, as has been seen with prior pandemics. At present current aims must be to try to alter behaviours and limit viral spread, especially as we expect to reach the peak number of cases soon and aware of the viruses stability on surfaces. In established severe disease, lung protective ventilation and prone positioning will be important. Trials should now be undertaken to further prognosticate patients and understand the role of redeployed treatments have in SARS-CoV2 infection as well as the likelihood of possible long-term immunity in those who survive.

References

  1. Shwartz DA, Graham AL (2020) Potential Maternal and infant outcomes from coronavirus 2019-nCoV (SARS-Cov-2) Infection in pregnant women: lessons from SARS, MERS and other human coronavirus. infections. Virus 12: 194. [Crossref]
  2. Kim JY, Choe PG, Oh Y, Oh KJ, Kim J, et al. (2020) The first case of 2019 novel coronavirus pneumonia imported into Korea from Wuhan, china: implication for infection prevention and control measures. J Korean Med Sci 35. [Crossref]
  3. Ralph R, Lew J, Zeng T, Francis M, Xue B, et al. (2020) 2019-nCoV (Wuhan virus), a novel coronavirus: human-to-human transmission, travel related cases, and vaccine readiness. The Journal of Infection in Developing Countries 14: 3–17. [Crossref]
  4. Fuk-Woo Chan J, et al. (2020) A familial cluster of pneumonia associated with the 2019 novel coronavirus indicating person-to-person transmission: a study of a family cluster. Lancet.
  5. Wu D, Wu T, Liu Q, Yang Z (2020) The SARS-CoV2 outbreak: what we know. International Journal of Infectious Diseases.
  6. Lai CC, Shih TP, Ko WC, Tang HJ, Hsueh PR (2020) Severe acute respiratory syndrome coronavirus 2 (SARS-CoV-2) and coronavirus disease-2019 (COVID-19): The epidemic and the challenges. International Journal of Antimicrobial Agents 7: 4. [Crossref]
  7. Jaimes JA, et al. Structural modelling of 2019-novel coronavirus (nCoV) spike protein reveals a proteolytically sensitive activation loop as a distinguishing feature compared to SARS-CoV and related SARS like coronaviruses.
  8. Lai CC, Liu YH, Wang CY, Wang YH, Hsueh SC, et al. (2020) Asymptomatic carrier state, acute respiratory disease, and pneumonia due to severe acute respiratory syndrome coronavirus 2 (SARS-CoV2): Facts and myths. Journal of Microbiology Immunology and Infection S1684-1182(20)30040–30042. [Crossref]
  9. Coronavirus disease 2019 (COVID-19) Situation Repoer-43. World Health Organization.
  10. Coronavirus: WHO declares global emergency. Politico
  11. Coronavirus: Woman in 70s becomes first virus fatality in UK.
  12.  Ipplotio G, Hui DS, Ntoumi F, Maeurer M, Zumla A (2020) Toning down the 2019-nCoV media hype- and restoring hope. Lancet 8: 230–231. [Crossref]
  13. Jin YH, Cai L, Cheng ZS, Cheng H, Deng T, et al. (2020) A rapid advice guideline for the diagnosis and treatment of 2019 novel coronavirus (2019-nCoV) infected pneumonia. Military Medical Research 7: 4. [Crossref]
  14.  Rothan HA, Byrareddy SN (2020) The epidemiology and pathogenesis of coronavirus disease (COVID-19) outbreak. Journal of Autoimmunity. [Crossref]
  15. Wang W, Tang J, Wei F (2020) Updated understanding of the outbreak of 2019 novel coronavirus (2019-nCoV) in Wuhan, China. J. Med. Virol 92; 441–447. [Crossref]
  16. Yan X, Yu Y, Xu J, Shu H, Xia J, et al. (2020) Clinical course and outcomes of critically ill patients with SARS-CoV2 pnuemonia in Wuhan, china: a single centres, retrospective, observational study. The Lancet: Respiratory Medicine.[Crossref]
  17.  Chen N, Zhou M, Dong X, Qu J, Gong F, et al. (2020) Epidemiological and clinical characteristics of 99 cases of 2019 novel coronavirus pneumonia in Wuhan, China: a descriptive study. The Lancet 395: 507–513. [Crossref]
  18. Guo L, Wei D, Zhang X, Wu Y, Li Q, et al. (2019) Clinical Features Predicting Mortality Risk in Patients with Viral Pneumonia: The MulBSTA score. Frontiers in Microbiology. [Crossref]
  19. Vardavas CI, Nikitat K (2020) COVID-19 and smoking: A syetmatic review of the evidence. Tobacco Induced Diseases. [Crossref]
  20. Alsharani MS, Sindi A, Alshamsi F, Al-Omari A, EI Tahan M, et al. (2018) Extracorporeal membrane oxygenation for severe middle east respiratory syndrome coronavirus. Ann Intensive Care 8: 3. [Crossref]
  21. Pharm Tai, Combes A, Rozé H, Chevret S, Mercat A, et al. (2013) Extracorporeal Membrane Oxygenation for Pandemic Influenza A (H1N1) -inducted Acute Respiratory Distress. A cohort Study and Propensity-matched analysis. Am J Respir Crit Care Med 187: 376–285. [Crossref]
  22. World Health Organization: Clinical management of severe acute respiratory infection when novel coronavirus (2019-nCoV) infection is suspected.
  23. Stockman LJ, Bellamy R, Gamer P (2006) SARS: systematic review of treatment effects. PLoS Med 3. [Crossref]
  24. Sameed M, Meng Z, Ellen TM (2019) EOLIA trial: the future of extracorporeal membrane oxygenation in acute respiratory distress syndrome therapy? Breathe (Sheff) 15: 244–246. [Crossref]
  25. Arabi Y, Mandourah Y, Al-Hameed F, Sindi AA, Almekhlafi GA, et al. (2018) Corticosteroid therapy for critically ill patients with middle east respiratory syndrome. Am J Respir Crit Care Med 197: 757–767. [Crossref]
  26. Li YC, Bai WZ, Hashikawa T (2020) The neuroinvasive potential of SARS-CoV2 may play a role in the respiratory failure of COVID-19 patients. J Med Virol. [Crossref]
  27. Propetchara E, Ketlay C, Palaga T (2020) Immune responses in COVID-19 and potential vaccines: Lessons learned from SARS and MERS epidemic. Asian Pacific Journal of Allergy and Immunology.[Crossref]
  28. Xu X, Yu C, Qu J, Zhang L, Jiang S, et al. Imaging and clinical features of patients with 2019 novel coronavirus SARS-CoV2. European Journal of Nuclear Medicine and Molecular Imaging. [Crossref]
  29. Ai T, Yang Z, Hou H, Zhan C, Chen C, et al. (2020) Correlation of Chest CT and RT-PCR testing in coronavirus disease 2019 (COVID-19) in China: A report of 1014 cases. Radiology. [Crossref]
  30. Fang Y, Zhang H, Xie J, Lin M, Ying L, et al. Sensitivity of chest CT for covid-19: comparison to RT-PCR. Radiology. [Crossref]
  31. Shen K, Yang Y, Wang T, Zhao D, Jiang Y, et al. (2020) Diagnosis, treatment and prevention of 2019 novel coronavirus infection in children: experts’ consensus statement. World Journal of Paediatrics. [Crossref]
  32. Hawes MK (2017) The Reappearance of Vaccine Preventable Diseases. VIGILINT.
  33.  Chen J (2020) Pathogenicity and transmissibility of 2019-nCoV – a quick overview and comparison with other emerging viruses. Microbes and Infection.
  34. Chinazzi M, Davis JT, Ajelli M, Gioannini C, Litvinova M, et al. (2020) The effect of travel restrictions on the spread of the 2019 novel coronavirus (COVID-19) outbreak. Science. [Crossref]
  35. Pasel A, Jernigan DB (2020) Initial public health response and interim clinical guidance for the 2019 novel coronavirus outbreak-unites states, December 31, 2019- February 4, 2020. Morbidity and Morality Weekly Report 69: 140–146. [Crossref]
  36. Phan LT, Nguyen TV, Luong QC, Nguyen TV, Nguyen HT, et al. (2020) Importation and human-to-human transmission of a novel coronavirus in Vietnam. New England Journal of Medicine 282: 872–874. [Crossref]
  37. Ong SWX, Tan YK, Chia PY, Lee TH, Ng OT, et al. (2020) Air surface environmental and personal protective equipment contamination by severe acute respiratory syndrome coronavirus 2 (SARS-CoV2) from a symptomatic treatment. JAMA. [Crossref]
  38. New Coronavirus stable for hours on surfaces. National Institutes of Health.
  39. Chan LY, Leung CC, Lam TH, Cheng KK (2020) To wear or not to wear: WHO’s confusing guidance on masks in the COVID-19 pandemic. BMJ.
  40. Wang M, Cao R, Zhang L, Yang X, Liu J, et al. (2020) Remdesivir and chloroquine effectively inhibit the recently emerged novel coronavirus (2019-nCoV) in vitro. Cell Research 30: 269–271. [Crossref]
  41. Li H, Zhou Y, Zhang M, Wang H, Zhao Q, et al. (2020) Updated approaches against SARS-CoV2. Antimicrob. Agents Chemother. [Crossref]
  42. Gautret P, Lagier JC, Parola P, Hoang VT, Meddeb L, et al. (2020) Hydroxychloroquine and azithromycin as a treatment of COVID-19: results of an open-label non randomized clinical trial. Int J Antimicrob Agents.[Crossref]
  43. Favalli EG, et al. (2020) COVID-19 infection and rheumatoid arthritis: Faraway, so close! Autoimmunitu Reviews.
  44. Hoffman M, Kleine-Weber H, Schroeder S, Krüger N, Herrler T, et al. (2020) SARS-CoV2 cell entry depends on ACE2 and TMPRSS2 and is blocked by a clinically proven protease inhibitor. CELL. [Crossref]
  45. Sommerstein R, et al. Preventing a covid-19 pandemic. BMJ.
  46. National Institute for Health and Care Excellence: Sunitinib.
  47. Richardson P, Griffin I, Tucker C, Smith D, Oechsle O, et al. Baricitinib as potential treatment for 2019-nCoV acute respiratory disease. Lancet. [Crossref]
  48. Guo YR, Cao QD, Hong ZS, Tan YY, Chen SD, et al. (2020) The origin, transmission and clinical therapies on coronavirus disease 2019 (COVID-19) outbreak- an update on the status. Miliatary Medical Research 7: 11. [Crossref]