Author Archives: author

“A Spirit Encroachment”: Hysterical Possession, Case Study from Kerala

DOI: 10.31038/AWHC.2024724

Abstract

The Present case of a 45-year-old female with a 10th-grade education who presented with a history of episodes where she would display extraordinary strength while becoming aggressive towards her family members and displaying bizarre behavior. The period was short. She was diagnosed with hysterical based on possession. She would always claim amnesia for the event. She claimed a hidden treasure that was in her dream in her backyard and seemed to be also possessed with spirit as she said. The family tried black magic to cure it. But the black magician tries to physically assault her. Later she starts showing physical symptoms of hysterical possession. She always tries to avoid her family husband and children. The suggestions of a close family member brought the patient for consultation in the hypnotherapy and counseling clinic. The present case illustrates how sexual harassment can lead to possession. Visualization hypnotherapy and counseling were the treatments given to the client. Finally, the client completely cured.

Keywords

Hysterical possession, Hypnotherapy, Counseling, spirit

Introduction

The word “hysteria” is frequently used to define highly charged, seemingly uncontrollably emotional behavior. During the Victorian era, the term hysteria was a common medical diagnosis, especially for women. Hysteria was viewed as a psychological disorder as far back as 1900 BCE. The word hysteria comes from the Greek “hystera”, which means “uterus”. This is when ancient Egyptians first described the condition, adding that it was caused by “spontaneous uterus movement.” This was also sometimes referred to as having a wandering uterus. In the early 1600s, the focus switched, such as when anatomist Thomas Willis concluded that hysteria did not originate in the uterus, but in the brain. This understanding opened the possibility that hysteria could affect men as well. In the 1800s, for instance, French neurologist Jean-Martin Charcot utilized hypnosis to treat women suffering from hysteria. It was Freud’s work with colleague Josef Breuer on the case of Anna O, a young woman experiencing symptoms of hysteria. that helped lead to the development of psychoanalytic therapy.Carl Jung, a colleague of Freud’s, treated a young woman named Sabina Spielrein who was also thought to suffer from hysteria. The term “hysterical neurosis” was first mentioned in the second edition of the DSM (DSM-II), published in 1968, but has since been abandoned in favor of a diagnosis of somatic symptom disorder, dissociative disorder, or conversion disorder [1-8].

Sensory Disturbances

These disturbances include paresthesia, hypersensitivity, and complete or partial loss of sensation. In severe cases, hysteria may also cause damage to other sensory organs and cause blindness, hearing loss, and loss of taste or smell.

Motor Symptoms

Motor symptoms include complete paralysis, tremors, or convulsions. When the disease progresses, it may even cause loss of speech, vomiting, hiccuping, etc. However, when undergoing a neurological examination of the affected site, these individuals present intact neuromuscular apparatus with normal electrical activity, response, and stimulation.

Psychic Symptoms

These symptoms are generally called dissociative reactions, where a person presents with attacks of amnesia and sleepwalking and can also present with multiple personalities. For example, a person with a dissociative reaction sometimes forgets his name or house address or has a split personality. Females with hysterical behaviors can behave emotionally charged, and out of control [9].

Discussion

Case Presentation

The case on the current study was took place in March 2016. The client was a 45-year-old woman and had a 10th-grade education. She had a husband and two daughters in the family. The beginning was that she showed some special unusual symptoms like strange behavior, extreme unrest, change of voice, seizures and acquiring tremendous strength shown to the children and the husband, especially to the husband. In Kerala, associated with the Hindu belief system, a spirit (called “Yakshi -A female spirit”) enters the body in myths and old texts. That belief is still being followed to some extent in Kerala, the majority of the parts. The client grew up amide such beliefs. Once one night she dreamed that a treasure was hidden in her backyard. Even then and before that, she was experiencing symptoms like unusual psychomotor agitation. Her husband brought the information to a black magician. He summoned everyone at night two 2 am and cast a spell. Finally, the black magician was relieved to let the woman sit in the room and asked the other relatives to go out. Then he closed the door and tried to rape her. She screamed. Everyone ran to her. After that incident, she has unusual psychomotor agitation when she sees her husband. She assumes that the spirit has entered her body. Sometimes swearing at someone who resembles her husband also causes symptoms.

Patient History in Their Words

As soon as the client came, unusual behavior was visible to therapist. They asked to stop the red light coming from the computer monitor on the table.

“That red light should be turned off,” she strictly said

When asked if she believed she was infected, she gave the therapist strange wordings with expression.

“I will kill you and drink your blood”

When asked to her, she did not remember anything that happened at that time of possession, she spoke in such a way that she had the knowledge that others had told to her.

The information given by the client confirmed what the bystanders. They also believed that there was treasure in the back yard and she is possessed by the spirit.

Medical History

Her whole family members believed in superstitious things. After the appearance of the black magician they again visited many other several faith healers and swamis with no improvement in her condition. They had no idea that she was mentally ill and this mental illness should need to be treated. They visit the therapist for consultation only after when one of their educated close family members suggests. The client was not at all interested in that particular decision. She never visits a doctor or psychologist or takes any other medication for this illness.

Treatment History

Visualization hypnotherapy and Counseling were the treatments given to the client.

Visualization Hypnotherapy

Visualization is just about the most powerful form of suggestion imaginable. The more senses that are stimulated, the more realistic the image to the brain, and the easier it is to establish that all-important process of selective thought within the hypnotic state. Just about any sort of hypnotic suggestion we might wish to give somebody can be enhanced by the use of the “four-sense” method of creative visualization. It means we include sounds, feelings, and even smells — in addition to any visual imagery [10].

Counseling

Counseling is a talking therapy that involves a trained therapist listening to you and helping you find ways to deal with emotional issues. Sometimes the term “counseling” is used to refer to talking therapies in general, but counseling is also a type of therapy in its own right [11].

Clinical Findings General Examination

She was not properly tied his hair. She had an average mode of dressing. Other than that on examination, all general parameters were normal.

Differential Diagnosis

  1. Possession syndrome (most likely diagnosis for discussion).
  2. Schizo-Hysteria (not in the diagnostic classification system).
  3. Schizophrenia (not meeting the criteria).
  4. Organic brain syndrome (ruled out).

Diagnostic Findings

  • Cannot control themself: She didn’t know what she was doing. She was unable controlhimself. She used to be violent towards family members especially, her husband and children.
  • New personality: New personality, introduced to her- the victim becomes a different person and acts and speaks as one who is controlled by another personality
  • Different voice: A slight change and tone in her voice identifies
  • Supernatural knowledge: She repeatedly says that a treasure in the backyard
  • New abilities: She, those possessed by can demonstrate superhuman strength, the family reported

Her family was a lower class one. Finances have overwhelmed them to spend their days constantly. Being a family that strongly followed the superstitious belief, she believed that they would get a way out of that one day. That may be the reason she believes there is treasure in their backyard, her family must have believed it too. It is also a reason to introduce the black magician. There is a common belief in Kerala that only a person with supernatural powers can take the treasure.

What made this client the most difficult was the insecure feeling that came to her. The fact that the black magician tried to physically harm the client after letting her husband, children and relatives out and closing the door while they were outside, caused a great impact on them. The reason for their anger towards her husband is that, it was her husband who brought the man there. She hated everyone who had left her alone in front of the man and guarded her. It was that hatred that later came out as possession symptoms.

Therapeutic Intervention

Hypnotherapy and counseling methods were used for the client.

Hypnotherapy

In getting the true basic information about the client, the therapist talked to the client, the bystanders that arer her husband, children, and the two elder brothers of the client. The therapist did not have to use any form of hypnotic techniques for information gathering, because it was clearly understood that the information given by them was accurate and the necessary information was already available. But here hypnotherapy was used as a treatment modality later. The visualization technique was used. Being a hysteric patient, the suggestibility of the client was high. So that it was also possible to bring the client into deep hypnosis very quickly. Through suggestions, she went to “Aluva Manappuram” (the place where the Aluva Manappuram temple is located, Ernakulam), which is a very important sacred place according to the Hindu faith and “Periyar” (the largest river in Kerala) flows nearby it. Curative suggestions are that when you immerse yourself in the river, the spirit goes away with the very strong flow of the river and the spirit is unable to swim back to her. The client was following the suggestion exactly. The situation was explained in detail. So it was easy for her to follow it. After the procedure, let her sleep and when awakened visible difference started to be seen. It was with just one trial. She was that much cooperative. As a follow-up, she was subjected to hypnotherapy for three consecutive days to make counseling in her subconscious mind. Both of those times they were subjected to light hypnosis and after that time she seems to be almost completely free.

Counseling

The suggestions given in light hypnosis convinced her even when she was awake. She understood what her problem was and said that she would never have that problem again. Therapist gave satisfactory answers to her questions. Client gave counseling three times more every each week.

Conclusion

Possession syndrome is important diagnostic category that should be considered especially in cross culture contexts. Because most of the times it’s deeply connected with culture. If it is in India or especially in Kerala is has another dimension too. The religion Psychotic illnesses can manifest in various forms. We can’t predict it anyway. It depends on so many psycho -socio- cultural factors. Cultural consultation is important in treatment.

Foot note

Informed consent: Yes

Competing interests: None

Patient consent: Obtained

References

  1. Baloh RW (2021) Early Ideas on Hysteria. In: Medically Unexplained Symptoms. Copernicus,
  2. Britannica (2020) Conversion disorder.
  3. C, Rapetti M, Carta MG, Fadda B (2012) Women and hysteria in the history of mental health. Clin Pract Epidemiol Ment Health 8: 110-119. [crossref]
  4. Arraez-Aybar L, Navia-Alvarez P, Fuentes-Redondo T, Bueno-Lopez J (2015) Thomas Willis, a pioneer in translational research in anatomy (on the 350th anniversary of Cerebri anatome) J Anat 226(3). [crossref]
  5. Carota A, Calabrese P (2014) Hysteria around the world. Front Neurol Neurosci 35. [crossref]
  6. Tsuman L Anna O. (2020) Encycloped Personal Indiv Diff.
  7. Balbuena F (2020) Sabina Spielrein: From being a psychiatric patient to becoming an analyst Am J Psychoanal 80(3). [crossref]
  8. North C (2015) The classification of hysteria and related disorders: Historical and phenomenological considerations. Behav Sci 5(4). [crossref]
  9. Gandhi VA (2022) Hysteria – Types, Causes, Diagnosis, and The virtual  hospital.
  10. com (2022) Creative Visualization and Self Hypnosis Available from: https://www.selfhypnosis.com/creative-visualization/
  11. NHS (2021) Counselling.

The CaCl2-to-Rutile Phase Transition in SnO2 from High to Low Pressure in Nature

DOI: 10.31038/GEMS.2024642

Abstract

Raman studies on cassiterite from the Sauberg mine near Ehrenfriedersdorf showed that besides the tetragonal rutile-type phase in the root zone of a cassiterite vein, there is also present orthorhombic cassiterite with the CaCl2 structure. According to Raman measurements, a maximal pressure of 18.9 GPa results. Such pressure implies the origin of that cassiterite from great depths, brought with supercritical fluids into the lower crustal level. The results show a reverse transition from high-pressure to low-pressure polymorphs of SnO2 in nature.

Keywords

Raman spectroscopy, Tetragonal and orthorhombic Cassiterite, CaCl2-to-rutile transition, Supercritical fluids

Introduction

The naturally occurring form of cassiterite is usually tetragonal, with the point group 4/m 2/m 2/m (point group number 128), and crystallizes as a rutile type phase. The paper by Thomas [1] described unusual cassiterite crystals from the tin deposit Ehrenfriedersdorf, Erzgebirge/Germany, as orthorhombic ones.

However, in the Balakrishnan et al. [2], only the bands at 446 (444 and 448 cm-1) are present for the stable SnO2 polymorphs. The data for the metastable phases are not given. All in all, the authors mentioned 20 relatively stable polymorphs. Seven stable polymorphs are tabulated. The band at 832 cm-1 is missing for all stable newly identified orthorhombic cassiterites. However, in the case of Ehrenfriedersdorf, at azimuthal rotation under the Raman microscope, some crystals show two unusual Raman bands at about 446 and 832 cm-1, which are very strong at specific azimuthal positions and room temperature and room pressure. These authors (Balakrishnan et al., [2] have also stated that one polymorph can easily transformed into another by varying temperature or pressure. That must be true also for a combination of both variables. However, the transformation is sluggish enough to conserve precede phase states. In the case of the specific cassiterite from Ehrenfriedersdorf, we assume that the cassiterite came very fast from mantle deeps via supercritical fluids indicated by minerals like diamond, graphite, moissanite, OH-rich topaz, and the high-temperature feldspar kumdykolite [NaAlSi3O8] in the closer paragenesis [1]. Therefore, it is quite possible that at room temperature and pressure, “abnormal” cassiterite contains quenched remnants of high-temperature and high-pressure indications in the form of unusual Raman bands. This paper serves as a starting point for more systematic studies of cassiterite as a natural pressure sensor.

Sample Material

All sample material for this study came from a specimen, about 10 x 7 x 3 cm large, taken from the Prinzler counter vein in the Sauberg mine near Ehrenfriedersdorf by Puffe in 1936. The main minerals are quartz (~6 cm long), cassiterite (2 cm in diameter), and violet to green, sometimes pink fluorite (up to 1 cm in diameter). In the root zone, there are inclusions in different minerals (topaz, quartz, muscovite), which are generally tiny crystals of albite, kumdykolite, plagioclase, trilithionite, calcite, colorless high-temperature fluorite, OH-rich topaz, rynersonite, cassiterite, mangancolumbite, uraninite, monazite, xenotime, graphite, diamond, moissanite, and Ti-carbides [1]. Figures 1-3 show the studied cassiterite crystals, which are very different in appearance. In muscovite, there are smaller crystals beside the crystal shown in Figure 1, which are spherical or elliptical. The cassiterite crystal in Figure 2 is 500 µm thick as the tick section is. Figure 3 is a sizeable orthorhombic cassiterite crystal in spherical muscovite inclusion surrounded by dark tetragonal cassiterites. All cassiterites with the untypical Raman bands at 445 and 832 cm-1 are inclusion- free, and the trace element concentration is low (about at the detection limit of the microprobe). Tiny crystals are colorless.

FIG 1

Figure 1: Cassiterite crystal I with rhombohedral cross-section in muscovite. The Raman bands of muscovite are entirely suppressed.

FIG 2

Figure 2: Cassiterite (Cst) crystall (crystal-II), about 250 x 390 µm large, beside tetragonal cassiterite (black), OH-rich topaz (OH-Toz) and calcite (Cal).

FIG 3

Figure 3: Large orthorhombic cassiterite crystal (o-Cst) in a muscovite inclusion (white) between normal tetragonal cassiterite (Cst). That is the sample cassiterite III.

The differentiation between tetragonal and orthorhombic cassiterite is under the Raman microscope with a rotating stage simple. Rutile-type cassiterite shows at room temperature only one strong Raman band at about 633 cm-1 during azimuthal rotation under the polarized Raman light. Strong Raman bands at about 76, 448, 635, and 834 cm-1 are characteristically for orthorhombic cassiterite. The symmetry of the CaCl2-type structure is orthorhombic and has the space group P42/mnm.

Microscopy and Raman Spectroscopy: Methodology

For the study of the cassiterite sample and the paragenetic minerals, we use the Zeiss JENALAB pol as well as the Raman spectrometer EnSpectr R532 combined with the Olympus BX43 microscope both for transmitted and reflected light and equipped with a rotating stage. For the identification of minerals and slight mineral inclusions, we used an Olympus long-distance LMPLFL100x objective lens. For the identification of different minerals, we used the RRUFF and the Hurai et al. [3] Raman mineral databases [3-4]. As references, we applied a water-clear diamond crystal from Brazil and a semiconductor-grade silicon single-crystal.

Results

In contrast to the typical tetragonal cassiterite of the Erzgebirge with the usual bands at 474, 633, and 775 cm-1 (both bands at 474 and 775 cm-1 are generally weak), the here-discussed cassiterite shows additional azimuthal-depending strong bands at 446, 832 cm-11, beside the 633 cm-1 band [1]. In the compilation [2] of the Raman modes of stable SnO2 polymorphs, only the orthorhombic cassiterite Pbcn (point group 2/m 2/m 2/m (number 60 in the room group list) contains a Raman active band at about 446 cm-1. The 832 cm-1 band is completely missing in the list of polymorphs. Figure 4 shows a typical Raman spectrum of cassiterite crystal III. Conspicuous are the strong bands at 76, 448, 635, and 834 cm-1.

FIG 4

Figure 4: Raman spectrum (a choice of 46 spectra) of SnO2 (sample III).

According to the measurements of the Raman intensity of both bands (446 and 832 cm-1), there is a good correlation shown in Figure 5. That means that both Raman bands belong together.

FIG 5

Figure 5: Correlation between the Raman intensity of the 446 and 832 cm-1 bands; I832cm-1=-89.829 + 0.609 * I446 cm-1, r2=0.989.

Because mineral inclusions in all the studied cassiterite crystals here are missing, the Raman bands are clearly components of the orthorhombic cassiterite, and both are strongly correlated. Also, the other crystals show a correlation between the two bands with near the same incline. That also will be clear from the following diagram (Figure 6). This figure shows the intensity ratio between the 633 and 832 cm-1 bands in dependence on the azimuth position. The figure (Figure 6) shows, in principle, the results for all three studied cassiterite crystals (I to III), which only show a peaks’ position dependence on the crystal orientation (a synchronous shift of the maxima to right or left).

FIG 6

Figure 6: Intensity ratio between the 633 and the 832 cm-1 bands versus the azimuth position for crystal I. Similar figures resulted for the cassiterite crystals II and III.

Figure 7 shows the azimuthal Raman intensity distribution for the orthorhombic cassiterite main band at 633 cm-1. The position of the points depends on the orientation of the studied sample. The points for the 446 and 832 Raman bands lie almost perpendicular to the 150° – 330° line. In the case of tetragonal cassiterite, the open red points would form a circle.

FIG 7

Figure 7: Cassiterite, crystal-III: Raman intensity distribution for the 633 cm-1 band in dependence on the azimuth position of the crystal. The numbers on the left are intensities.

Interpretation

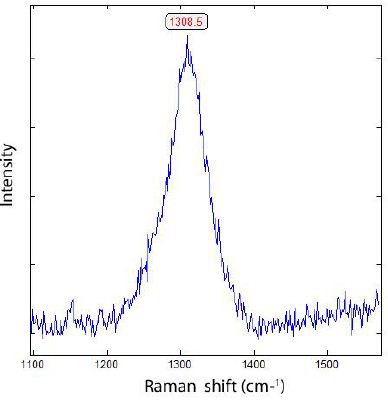
The Raman bands at 446, 633, and 832 cm-1 are strongly polarized, and the bands at 446 and 832 have a different symmetry – they are almost perpendicular to the 633 cm-1 band. The explanation is not simple. Have we, in this case, a different polymorph phase of SnO2 not described in Balakrishnan et al., [2]? Or are the unusual Raman bands of SnO2 frozen high-temperature and high-pressure remnants of the rutile-type, orthorhombic, or the CaCl2 phase of cassiterite?. Note that in Figure 8, the points for the 832 cm-1 Raman band show a twisted form. From 38 measurements of the 832 cm-1 band on the cassiterite crystal-III, we obtain a mean of 833.9 ± 0.4 cm-1. This value corresponds to Hellwig et al. [5] for the B2g mode to a pressure of 10.5 GPa and falls into the rutile-type cassiterite. According to Girao [6], we can assume that the high-temperature and high-pressure cassiterite are well-crystallized (indicated by the intense and sharp Raman bands), are nano-particles in high concentrations, or contain larger domains. According to Girao [6] [Table 4, p.105], it results from the mean of 833.9 cm-1, a pressure of about 15 GPa. This pressure marks the rutile- to CaCl2-type transition. The rutile polymorph of SnO2 underwent a phase transition to a CaCl2 polymorph at 11.8 GPa under hydrostatic conditions [2]. Sometimes, we observe on the 833.9 band a shoulder at 849.7 ± 1.1 cm-1 (n = 10). Using Table 4 in Girao [6], it results in a pressure of 18.9 GPa and is, obviously, a high-pressure remnant of the CaCl2-type cassiterite.

FIG 8

Figure 8: Cassiterite, crystal-III: Raman intensity distribution for the 633 cm-1 (red) and the 832 cm-1 (green) bands in dependence on the azimuth position of the crystal. The other orientation of the 832 cm-1 band is good to see. The measured intensities are the numbers on the right side of the diagram.

Generally, besides the 633 cm-1 prominent bands, small bands at 695.9 ± 2.1 cm-1 are present. After Figure 7 and Table 4 in Hellwig et al. [5], results for this A1g mode band a pressure of 12.2 GPa and, according to Girao [6] [Figure 54 and Table 4], a pressure of 13.7 GPa. For the cassiterite crystal-III, we could also determine for the B1g mode a mean of 76.1 ± 0.5 cm-1 (n = 46). The intensity of this Raman band is very high. Using Figure 8 in Hellwig et al. [5] results in a pressure of 10.8 GPa. By some uncertainties (strong asymmetry of this band) of the soft mode in the CaCl2 phase [5], the 76.1 cm-1 band can also represent the CaCl2-type phase. The symmetry is similar to the 446 and 832 cm-1 bands.

The band at 448.2 ± 0.4 cm-1 strongly correlated with the 833 cm-1 band (n = 38) (see Figure 5), resulting after Girao [6] only a pressure of 5.7 GPa. That means the freezing behavior for the different Raman bands of different SnO2 polytypes is not regular.

Discussion

The exceptional Raman band at 832 cm-1, shown at first by Thomas [1], can explained, according to Hellwig et al. [5] and Girao [6], as frozen remnants of high-pressure phases of rutile- and CaCl2-type cassiterite structures.

Because together with the orthorhombic cassiterite at room temperature, there are also present high-pressure and high-temperature indicator minerals, like diamond, moissanite, Ti-carbides, and kumdykolite [1], the interpretation of the extreme Raman bands finds his explanation. That means that a part of the cassiterite of the Ehrenfriedersdorf Sauberg mine comes directly from the mantle regions. Schütze et al., [7] came after careful studies to the result that the Ehrenfriedersdorf granite presents the differentiation products of subducted altered ocean crust. The proof of high-pressure cassiterite (with signs up to 18.9 GPa) underlines this interpretation. After a couple of studies (for example, Thomas and Rericha, 2023) [8], the transport of high-pressure cassiterite (suspended as solid phases) happens via supercritical fluids from mantle regions to the crust. We have not considered the influence of the temperature on the band shift [9].

We found many deposits in the Erzgebirge (Germany) and the Slavkovsky les (Czech Republic), which prove the presence of orthorhombic cassiterites. More sophisticated studies on the natural cassiterite samples are necessary.

Acknowledgments

For the sample, we are grateful to Professor Ludwig Baumann (1929-2008) from the Mining Academy Freiberg. We thank Pierre Bouvier, Grenoble, France, and Jörg Acker, Cottbus, Germany, for the courtesy of critical references and for starting the discussion on the unusual cassiterite from Ehrenfriedersdorf.

References

  1. Thomas R (2023) Unusual cassiterite mineralization, related to the Variscan tin- mineralization of the Ehrenfriedersdorf deposit, Germany. Aspects in Mining & Mineral Science 11 : 1233-1236.
  2. Balakrishnan K, Veerapandy V, Fjellvåg H, Vajeeston P (2022) First-principles exploration into the physical and chemical properties of certain newly identified SnO2 ACS Omega 7 : 10382-10393. [crossref]
  3. Hurai V, Huraiova M, Slobodnik M, Thomas R (2015) Geofluids – Developments in Microthermometry, Spectroscopy, Thermodynamics, and Stable Isotopes. Elsevier, 489 pp.
  4. Lafuente B, Downs RT, Yang H, Stone N (2015) The power of database: s RRUFF In: Armbruster T, Danisi RM (eds.). Highlights in mineralogical crystallography. Berlin 1-30.
  5. Hellwig H, Goncharov AF, Gregoryanz E, Mao H, Hemley RJ (2003) Brillouin and Raman spectroscopy of the ferroelastic rutile-to CaCl2 transition in SnO2 at high Physical Review 67 : 174110-1174110-7
  6. Girao HT (2018) Pressure-induced disorder in bulk and nanometric SnO2. Material Chemistry, Theses, Université de Lyon, 139 pp.
  7. Schütze H, Stiehl G, Wetzel K, Beuge P, Haberland R, et al. (1983) Isotopen-und elementgeochemische sowie radiogeochronologische Aussagen zur Herkunft des Ehrenfriedersdorfer Granits-Ableitung erster Modellvorstellungen. ZFI-Mitteilungen 76 : 232-254.
  8. Thomas R, Rericha A (2023) The function of supercritical fluids for the solvus formation and enrichment of critical elements. Geology, Earth and Marine Science 5 : 1-4.
  9. Diéguez A, Romano-Rodríguez A, Vilà A, Morante JR (2001) The complete Raman spectrum of nanometric SnO2 Journal of Applied Physics 90 s: 1550-1557.

Applications of Ezrin Peptide Therapy to Long COVID, Drug Resistant Infections, Chronic Inflammation and in the Support of Healthy Aging

DOI: 10.31038/MIP.2024512

Introduction

Ezrin peptides amplify adaptive immunity through the RANTES/CCL5 pathways that lead to cures of drug resistant infections due to bacteria, viruses, fungi and protozoans. Ezrin peptides simultaneously suppress chronic pro-inflammatory cytokine and chemokine signalling, leading to cures for chronic inflammatory disease of the muscular-skeletal system (for example; Ankylosing Spondylitis): inflammatory gut diseases (for example; ulcerative colitis): inflammatory liver diseases (for example; HCV induced hepatitis) and inflammatory heart disease (for example; myocarditis).

Ezrin peptide pharmaceutical technology evolved from a prototype HIV peptide vaccine program in London UK and San Antonio TX, USA, established by Dr Rupert Holms in the mid-1980s. In the early 1990s, Dr Holms discovered that the amino-acid sequence at the C-terminus of HIV gp120 mimics part of the Alpha domain of human ezrin, a protein that builds multi-protein cell signalling complexes of adhesion molecules and receptors on the cell surface; with adaptor proteins, kinases and cytoskeletal components attached to the sub-surface of the cell-membrane. Aqueous solutions of Ezrin peptides are active on mucosal membrane surfaces and seem to behave as a ligand for a surface-exposed “receptor” transition conformation of human ezrin, which causes allosteric changes in the submembrane multi-protein complex that triggers intra-cellular signaling [1].

Dr Holms organised development of Human Ezrin Peptide One (HEP1) which was a synthetic peptide copy of the protein sequence between amino-acids 324 and 337 of human ezrin, at The Gamaleya Institute and Institute of Immunology in Moscow. Safety and efficacy of HEP1 was first demonstrated in HIV and AIDS opportunistic infections, and later in drug resistant sex infections. The first ezrin peptide product (HEP1) was launched on the Russian market in 2001 (brand name “Gepon”) as an adaptive immune amplifier that simultaneously down-regulated inflammation for treatment of AIDS and other defective immune responses to infection.

A normal course of treatment is 2mg ezrin peptide per day for 5 days. Ezrin peptides have been clinically demonstrated as safe: no adverse reactions, nor adverse drug interactions, nor allergic responses, have been reported. Human Ezrin Peptide One (HEP1) and Regulatory Ezrin Peptide Glycine 3 (RepG3) are closely related fourteen amino acid synthetic peptides, which are highly charged, highly soluble, 4-turn alpha helical peptides, mimicking the Alpha domain of human ezrin. Ezrin peptides are cheap and simple to manufacture and the active substance costs less than one pound per milligram (mg). Ezrin peptides are stable at room temperature in solid form for at least 2 years. In aqueous solution, ezrin peptides degrade at about 1% per month.

Treatment of Drug Resistant Infections

After the registration of HEP1 in the Russian Federation, a large number of clinical trials were performed with ezrin peptide HEP1 in the treatment of drug resistant chronic sex infections. Generally the clinical trials of HEP1 treatment of chronic viral, bacterial, fungal or protozoan infection, demonstrated approximately ninety per cent success rates, either in combination with existing therapy or as monotherapy, and there were no reports of any adverse reactions. Clinical use of ezrin peptide therapy in Russia to treat and prevent Candida, Chlamydia, Trichomonas vaginalis, Syphilis, HPV and Herpes (HSV-1 & 2) revealed a broad clinical potential for this adaptive immunity amplification technology. HEP1 was also used to successfully treat HCV hepatitis in HIV patients and as an adjuvant to increase antibody titres during hepatitis B vaccination of children [2,3].

Treatment of Acute COVID

Between 2020 and 2022, experimental ezrin peptide therapy using generation one ezrin peptide HEP1 or generation three ezrin peptide RepG3, was used to successfully treat acute COVID, based on earlier clinical successes using ezrin peptides to treat acute viral respiratory infections with inflammatory complications [4]. Investigation of the pro-inflammatory cell-signalling problem triggered by spike protein of SARS-CoV-2, identified RAGE, PKC, p38, NFkB & IL-6 hyper-expression as important components of the problem. The understanding of a possible disease mechanism, suggested both ezrin peptide therapy and also vaso active intestinal peptide (VIP) therapy as potential solutions in which suppression of NFkB mediated chronic expression of pro-inflammatory cytokine expression could be achieved by the induction of PKA>CREB signaling [5].

Treatment of Long COVID and mRNA Vaccine Injury

Long COVID, also referred to as Post-Acute Sequelae of COVID (PASC), is probably triggered during acute SARS-CoV-2 infection by Spike protein binding and hyper-activating the cell-membrane expressed Receptor for Advance Glycation End-products (mRAGE) and Toll-Like Receptor 4 (TLR4). SARS-CoV-2 infects lung monocytes by Spike binding to mRAGE (not ACE2). During acute COVID-19, high levels of IL-6 hyper-stimulate S100A8/A9 expression and secretion. Although no viral protein nor mRNA can be detected in half of long COVID (PASC) patients, there is a significant elevation of serum levels of IL-1b, IL-6, TNFa, and S100A8/A9. It appears that a pathological pro-inflammatory feedback loop (the TLR4/RAGE-loop) is established during acute COVID-19, which is maintained by S100A8/A9 > RAGE/TLR4 chronic inflammatory signalling, even after SARS-CoV-2 has been cleared from the body [6].

However, more evidence has emerged of chronic spike expression over long periods of time, both as a result of SARS-CoV-2 infection and the use of mRNA COVID vaccines. NewalR&D established a volunteer experimental ezrin peptide treatment program for Long COVID and COVID vaccine injury in which more than sixty volunteers have been treated on an individual unmet medical need basis (this data is anecdotal and is not a clinical trial). However the general observation is that ezrin peptide therapy is safe in Long COVID and COVID vaccine injury patients, about half report symptom improvement and about ten per cent report a significant benefit. The most common symptomatic improvements suggest reduction of inflammation in the gut, brain and heart. Ezrin peptides have already been shown to be clinically effective as anti-inflammatory therapy for any ulceration or inflammation in the gut, including the treatment and prevention of stomach & duodenal ulcers, and ulcerative colitis [7-9].

During the treatment of a vaccine injury patient, blood results provided new information that ezrin peptide RepG3 was inducing enhanced RANTES/CCL5 expression, providing an explanation for the amplification of adaptive immunity which has been observed with ezrin peptide treatment over the previous thirty years. In addition a second control pathway was identified that had a dominant suppressive effect on pro-inflammatory cytokine expression [10]. Results from individual Long COVID patients with other co-morbidities, also revealed a potent ezrin peptide cure for the inflammatory spine disease Ankylosing Spondylitis, and relief from myocarditis chest pains experienced by COVID vaccine injury patients, in addition to the reduction of symptoms of gut inflammation and “brain fog” due to CNS inflammation.

Current Developments

Research and clinical use of ezrin peptides over three decades has revealed the unusually broad beneficial biological activities of ezrin peptides, in the absence of adverse reactions. The scientific endeavour is to develop an integrated theory to explain these diverse results.

Ezrin peptides induce RANTES/CCL5 amplification of adaptive immunity while simultaneously suppressing pro-inflammatory cytokines and chemokines. Ezrin peptides are effective therapy for drug resistant infection whether viral, bacterial, fungal or protozoan, and are effective as monotherapy or in combination with existing therapy, to over-come Anti-Microbial Resistance (AMR). 17 clinical trials have been performed that showed clinical efficacy in a variety of sexually transmitted infections that failed to respond to existing therapy.

Ezrin peptides amplify adaptive B-cell and T-cell programmed immune responses, mediated via RANTES/CCL5 secondary signalling. Ezrin peptides also suppress pro-inflammatory cytokines (IL1b, IL6, IL8, IL13 & TNFa) and chemokines (MIP1a & MIP1b). Ezrin peptides amplify programmed B-cell responses, increase antibody titres and have vaccine adjuvant effects. Ezrin peptides also induce leukocyte migration and fibroblast activation. They stimulate tissue repair, wound healing, ionization radiation recovery and ulcer healing. Ezrin peptides stimulate NK-cell responses and have anti-solid tumour activity in animal models.

Ezrin peptides activate various cell signalling pathways: such as the Ras>Raf>MEK>ERK growth signalling and PI3K>AKT anti-apoptotic signalling, and possibly the JNK stress response pathway, and “Hippo” cell proliferation control pathway. Observations of anti-solid tumour activity, recovery from ionizing radiation damage and tissue regeneration suggest “Hippo” signalling and JNK signalling may be modulated by ezrin peptides.

Over the thirty years ezrin peptide technology has evolved, the evidence has grown that these peptides are operating at a deep level of living systems. For example, in chronic toxicity-safety studies mice displayed features of a slow-down of the rate of aging (healthier hair and higher fecundity). Ezrin peptides may enhance activity of transcription factor FOXO3: it is already known that some FOXO3 SNPs that enhance its activity are associated with extreme human longevity. Ezrin peptides have potential applications in the treatment of radiation sickness and in the enhancement of healthy aging but much more research needs to be done.

References

  1. Holms RD, Ataullakhanov RI (2021) Ezrin Peptide Therapy from HIV to COVID: Inhibition of Inflammation and Amplification of Adaptive Anti-Viral Immunity. Int J Mol Sci 22: 11688. [crossref]
  2. Holms RD (2023) Pandemics of Sexually Transmitted Infections (STIs): Clinical Use of Ezrin Peptide Therapy in Russia to Treat and Prevent Candida, Chlamydia, Trichomonas vaginalis, Syphilis, HPV and Herpes (HSV-1 & 2) Microbiology & Infectious Diseases. Microbiol Infect Dis 7.
  3. Salamov G, Rupert Holms RD, Wolfgang G, Bessler WG, Ataullakhanov RI (2007) Treatment of Hepatitis C Virus Infection with Human Ezrin Peptide One (HEP1) in HIV Infected Patients. Arzneimittel-Forschung (Drug Research) 57: 497-504. [crossref]
  4. Holms RD, Ataullakhanov RI (2021) Ezrin Peptide Therapy: A Potential Treatment for COVID. J Bioprocess Biotech 12: 3. [crossref]
  5. Holms RD (2022) The COVID-19 Cell Signalling Problem: Spike, RAGE, PKC, p38, NFkB & IL-6 Hyper-Expression and the Human Ezrin Peptide, VIP, PKA-CREB Solution. Immuno 2: 260-282.
  6. Holms RD (2022) Long COVID (PASC) Is Maintained by a Self-Sustaining Pro-Inflammatory TLR4/RAGE-Loop of S100A8/A9 >TLR4/RAGE Signalling, Inducing Chronic Expression of IL-1b, IL-6 and TNFa: Anti-Inflammatory Ezrin Peptides as Potential Therapy Immuno 2: 512-533.
  7. Chulkina M, Negmadjanov U, Lebedeva E, Pichugin A, Mazurova D, et al. (2017) Synthetic peptide TEKKRRETVEREKE derived from ezrin induces differentiation of NIH/3T3 fibroblasts. European Journal of Pharmacology 811: 249-259. [crossref]
  8. Malakhova NS, Pichugin AV, Khaliph IL, Ataullakhanov RI (2005) Use of Immuno-Enhancer Gepon For The Treatment Of Ulcerative Colitis. [crossref]
  9. Chulkina MM, Pichugin AV, Ataullakhanov RI (2020) Pharmaceutical grade synthetic peptide Thr-Glu-Lys-Lys-Arg-Arg-Glu-Thr-Val-Glu-Arg-Glu-Lys-Glu ameliorates DSS-induced murine colitis by reducing the number and pro-inflammatory activity of colon tissue-infiltrating Ly6G+ granulocytes and Ly6C+ monocytes Peptides 132. [crossref]
  10. Holms R (2024) The therapeutic potential of RANTES/CCL5 across diverse infections and its synergistic enhancement by ezrin peptide RepG3 for long COVID. Microbes & Immunity 1: 2474.

Pattern of Presentation of Newly Diagnosed Diabetes Mellitus Among Sudanese Patients

DOI: 10.31038/EDMJ.2024824

Abstract

The objectives of this study is to know the pattern of presentation of newly diagnosed diabetic patients among Sudanese, and how late they present, after developing micro and macro vascular complications. Among 620 diabetic patients attending a medical clinic for ten month duration, 44 patient were newly diagnosed diabetes mellitus patients. 54.5% were male and 45.5% female, with the mean age of 49.6 year, hemoglobin A1c% (Hb A1c) ranging from 7.1 to 15.9 mean of (11.02%). Most of them have positive family history of diabetes 75%, other risk factors include obesity 47.7, and hypertension31.8%. 7 patients out of 44 patients (15%). presented with micro and macro vascular complications which was not related to the level of HbA1c at presentation. These results make the need for screening for diabetes mellitus in those with risk factors is important for early diagnosis to prevent or delay the development of these complications.

Main Objective

To study the pattern of presentation of newly diagnosed diabetic patients among Sudanese population.

Specific Objective

  1. To study the risk factors for diabetes
  2. To know how late is the presentation, after the development of the acute and chronic diabetic complication.
  3. To study the relation between the complication at presentation and the risk

Keywords

Type2 diabetes mellitus (T2DM), Hemoglobin A1c (Hb A1c), Hypertension (HTN)

Introduction

Diabetes mellitus is a growing health problem, leading to morbidity and mortality. Type 2 diabetes mellitus (T2DM) is increasing and the prevalence and number of adults affected, have risen faster in lower income than in high-income countries. Sudan is one of the lower income country, with poor income and resources. Diabetes Mellitus is common in Sudan, with some studies showing the prevalence is 19% of the adult population. Type 2 diabetes mellitus is sometimes diagnosed when chronic complications have already developed and one third of all people with type 2 diabetes mellitus may be undiagnosed until late. this make the screening for diabetes mellitus for those at high risk of developing diabetes is crucial [1]. Early diagnosis and control of blood sugar will delay if not prevent the development of micro and macro vascular complications.

Methodology

This is a retrospective study for the patients attending a medical clinic in the period from April 2022 to February 2023 (about 10 months duration), from 620 diabetic patients attending the clinic, 44 patients were newly diagnosed diabetes mellitus. 24 male patients (54.5%) and 20 female (45.5%) out of them 7 patients (15%) presented with micro and macro vascular complication.

The risk factor for most of them was the family history of diabetes 75.0%, followed by obesity 47.7%, hypertension 31.8%, and a single case with past history of gestational diabetes.

The study showed that males have significantly more obese than females (62.5% compared to 30.0%) p value <.032.

The mean age at presentation was 49.6 year. Hemoglobin A1c (HbA1c) at presentation was varying from 7.1 to 15.9 mean of (11.02%) (Table 1).

Table 1: Mean age

Mean

Std. Deviation

N

AGE

49.68

13.194

44

A1c%

11.018

2.2152

44

7 out of 44 patients (15%) have obvious diabetic complication at presentation including peripheral neuropathy 4.6%, diabetic septic foot, chronic kidney injury, ischemic heart disease, diabetic ketoacidosis and diabetic retinopathy 2.3% for each (Table 2).

Table 2: Diabetic complication

Frequency

Percent

Valid Percent

Valid CHRONIC KID INJ

1

2.3

2.3

DIAB KETO ACIDOS

1

2.3

2.3

DIAB SEP FOOT

1

2.3

2.3

IHD CHF

1

2.3

2.3

NO

37

84.1

84.1

PERIPH NEUROPATH

2

4.5

4.5

RETINOPATHY

1 2.3

2.3

Total

44

100.0

100.0

There was no relation between the presentation with diabetic complication and A1c% at presentation (Table 3).

Table 3: Relation between the presentation with diabetic complication and A1c% at presentation

A1c% COMPL

Mean

N

Std. Deviation

CHRONIC KID INJ

8.300

1 .

DIAB KETO ACIDOS

7.800 1

.

DIAB SEP FOOT

7.100

1 .

IHD CHF

10.500 1

.

NO

11.508

37 1.9916

PERIPH NEUROPATH

8.150 2

2.3335

RETINOPATHY

9.000

1 .

Total

11.018 44

2.2152

Discussion

This study describes the pattern of newly diagnosed diabetes mellitus in Sudan, and the risk factors and how late they present, after the appearance of micro and vascular complication. Similar to other studies in Africa, the age of presentation of newly diagnosed diabetes in our study was in younger age group (the mean is 49.6 year), in contrast to with that from higher income countries where diabetes incidence peak is between 60 and 70 years [2] The risk factor for developing diabetes in our study was mainly the non- modifiable risk factor, the familial predisposition, and family history of DM similar to that in Saudi Arabia, in addition to the other modifiable risk factors like obesity, hypertension and sedentary lifestyle [3]. The risk factors for developing type 2 diabetes mellitus in Sudan is high, according to the study done in North of Sudan, using Finnish score as a risk assessment for predicting type 2 diabetes mellitus, more than half of the population of the study group were at risk of developing type 2 diabetes mellitus, and if not discovered early are prone of developing diabetic complications [4]. The development of complications was not related to the level of HbA1c at presentation, diabetic complications may be related to the chronicity of the disease, rather than the blood sugar at the time of diagnosis Peripheral neuropathy was the most common diabetic complication at presentation, 28.5% of cases with micro and macro vascular complication at initial presentation similar to study done in Pakistan [5]. Peripheral neuropathy patients present with symptoms of numbness and paraethesia, with impaired sensation [6]. Patients with diabetic nephropathy present with proteinuria, renal impairment or chronic kidney injury. Diabetic retinopathy patients present with symptoms of blurring of vision, headache, pain in the eyes and impairment of vision. Final examination will show background diabetic retinopathy, new vascularization and intra retinal hemorrhage leading to loss of vision and blindness [6].

Notice: Formal visual examination wasn’t done in all patients.

Recommendation

We recommend screening for those who are at risk of developing diabetes mellitus, specifically those with family history of DM and other modifiable risk factors like obesity or sedentary lifestyle, so we can avoid the late presentation after developing micro and macro vascular complications.

References

  1. Clinical Practice Guidelines and Standards of Care of Diabetes Mellitus in Sudan 2020.
  2. Roy William Mayega et (2018) Clinical presentation of newly diagnosed diabetes patients in a rural district hospital in Eastern Uganda. Afr Health Sci. 18(3): 707-719 [crossref]
  3. Saudi Diabetes Clinical Practice Guidelines (SDCPG) 2021.
  4. Sufian et al. (2024) benefit of Finnish Score as a Risk Assessment Tool for predicting type 2 DM among Sudanese population in North Sudan, Sudan Journal of Medical Science.
  5. Nalia Naeem et al. (2014) Frequency of peripheral neuropathy in newly diagnosed patients of diabetes mellitus 2 on clinical and electrophysiological Pakistan Journal of Neurological Science vol 9 issue 4.
  6. A P Nambuya et The presentation of newly diagnosed diabetic patients in Uganda, Q J Med. [crossref]

Sex Differences in Anti-Obesity Drugs: Is it Time to be More Proactive in Engaging Men?

DOI: 10.31038/JCRM.2024721

Introduction

The paper “Sex-differences in response to treatment with liraglutide 3.0 mg” provides a critical analysis of how responses to obesity treatments can vary by sex, with a particular focus on the efficacy of liraglutide 3.0 mg in patients with obesity (BMI ≥ 30 kg/m2), but without type 2 diabetes (T2D) [1].

The emphasis on sex-specific responses in obesity places this study within a trend of increasing recognition, among clinicians and researchers, of the critical role of sex and gender at all levels of medical research [2]. Despite this growing awareness, sexual biology is often relegated to a specialized discipline rather than being integrated as a fundamental aspect [3], underscoring the need for integration of this analysis.

The authors provide a clear picture of the increasing rates of obesity in recent decades, and of the apparent sex differences in obesity prevalence, attitudes and behaviors [4].

While it is generally accepted that the prevalence of obesity appears to be slightly higher in women than in men, it is increasing in both sexes worldwide [5]. Interestingly, the authors report that recently in Italy, obesity appears to be higher in men than in women [6,7].

This discrepancy may explain why the authors chose to emphasize that, despite the overall higher prevalence of obesity in men, women are more likely to be included in obesity clinical trials, and to seek and to be prescribed anti-obesity pharmacotherapy [8].

In addition, although previous studies have suggested a sexually dimorphic response to GLP-1RAs, with greater weight loss in women than in men, as the authors note, most of these studies were conducted in people with T2D and, in any case, sex-specific analysis remains underexplored [2].

Overall, the study highlights the importance of better understanding sex-specific responses to obesity treatments, such as liraglutide, the first GLP-1 receptor agonist approved for weight management in Italy, in a real-world setting.

Results

The authors conducted a single-center, real-world, retrospective study at the Santa Maria Goretti Hospital in Italy, focusing on a specific cohort of patients with obesity, but without T2D. The study design includes criteria that help minimize confounding variables such as previous anti-obesity treatments or significant metabolic comorbidities or treatments, ensuring a more homogeneous sample. By including only patients who reached and maintained the maximum dose of liraglutide (3.0 mg) for at least 6 months, the study strengthens the validity of its findings regarding the effects of liraglutide on weight loss and improvements in metabolic parameters.

The results show significant sex differences in response to liraglutide. Men experienced significantly greater reductions in weight and BMI at both 3 (-10.7 vs -7.1 kg, -3.6 vs -2.6 kg/m2), and 6 months (-17.9 vs -11.9 kg, -6.0 vs -4.4 kg/m2) compared with women. In addition, the authors decided to include in the analysis the assessment of percentage weight loss (%WL) and the achievement of weight loss of >5% (WL>5%) and >10% (WL>10%), which are considered meaningful for clinicians, public health, and for anti-obesity drug targets [9,10]. A higher percentage of men achieved significant WL >5% (93.7% vs. 58.0%) and %WL (-9.2% vs. -6.5%) at 3 months than women, and this trend was maintained at 6 months, with WL >10% (87.5% vs. 29.0%) and %WL (-15.2% vs. -10.5%).

The inclusion of metabolic parameters adds depth to the study and has shown that men also experienced significantly greater improvements in total (-14.0 mg/dL vs. 9.5 mg/dL) and LDL cholesterol (-19.0 mg/dL vs. 6.8 mg/dL) and the fibrosis-4 index FIB-4 (-0.25 vs. -0.003) as an indicator of liver function than women. However, no significant sex-differences were observed in glucose metabolism or renal function [1].

Discussion

One of the key considerations in this study is the higher representation of women (65.9%) compared to men (34.0%) in the sample. This is consistent with other analyses in the literature suggesting that women are more likely than men to be enrolled in clinical trials of anti-obesity drugs [11], and may confirm that in the real world, women may also be more proactive in seeking weight management treatments in a clinical setting, possibly due to different attitudes and awareness of body weight than men [12].

In terms of results, while some previous studies have suggested superior weight loss in women with GLP-1 receptor agonists (GLP-1 RAs), this study found the opposite, confirming the complexity of sex-specific pharmacodynamics and pharmacokinetics.

The authors discuss possible explanations for these conflicting results, emphasizing that the majority of results have been obtained in people with T2D using other classes of GLP1-Ras [13-15]. Consistent with this, it has been suggested that the different molecules may have different pharmacokinetics and pharmacodynamics [13], and it is also known that diabetes is a known factor that can influence pharmacotherapy weight loss or changes in metabolic parameters in people with increased adiposity [16].

In addition, the authors noted that most studies reported different baseline body weights, and BMIs between the sex groups, describing a non-homogeneous sample. Despite in some studies researchers have hypothesized that the greater weight loss in women may be related to their greater exposure to the drug due to their lower body weight [13,15,17], while others have observed an association between women’s greater weight loss and their higher baseline BMI [15,18], these hypotheses remain contradictory.

Overall, the absence of baseline differences in weight, BMI, and comparison of percent body weight loss may have helped to attenuate any differences in the authors’ results, in addition to the absence of T2D and other metabolic treatments in a real-world setting, may potentially explain the different results from those reported in the literature.

Given the mean age of the cohort (50.8 years), the authors have also suggested that the contribution to the observed differences may be due to differences in body composition and hormonal changes experienced by women during the menopausal transition [19,20], which could also influence the pharmacokinetics and pharmacodynamics of the drugs [21]. Indeed, in a study conducted only in patients with obesity treated with liraglutide 3.0 mg, greater weight loss was observed in women than in men, but the mean age was 43.6 years [22], which may have influenced the results.

In line with the latter, it can be added that recent evidence suggests that central estrogen receptor (ER)α signaling is necessary for the effects of GLP-1 on food reward behavior [23,24], and that in ovariectomized animal models, lower estradiol (E2) levels were associated with hyperfagia and weight gain [25].

To date, weight loss interventions are not tailored to women’s menopausal status, nor to sex differences, and studies based on sex in response to liraglutide in people with obesity only remain very limited. This context allows to highlight the significance of these findings for clinical practice implications as a major strength of this paper. Given the recent increase in the prevalence of obesity in men and their underrepresentation in weight management programs, the findings of greater efficacy of liraglutide in men are particularly significant, and underscore the need for clinicians to be more proactive in engaging men in obesity treatment programs. In addition, given the higher cardiovascular risk in men, the notable improvements in total and LDL cholesterol and liver fibrosis in men raise important questions about the cardiometabolic benefits of liraglutide.

Conclusion

This paper makes a significant contribution to the field of obesity treatment by highlighting the importance of considering sex differences in clinical settings where, similar to lifestyle intervention trials, most pharmacological trials do not analyze weight loss separately for men and women due to the higher representation of women in pharmacological weight loss trials [11].

The potential for sex-specific tailoring of obesity treatments is in line with the need to develop more personalized treatment in the medical field, including dose adjustment where appropriate [24], with significant public health benefits.

Strengths of the study include its real-world setting, comprehensive data collection, and focus on a homogeneous cohort. However, the authors acknowledge several limitations, including the small sample size, retrospective design, and lack of data on changes in body composition, dietary habits, and physical activity levels.

Despite these limitations, the study provides valuable insights into the sex-specific effects of liraglutide and calls for further research into sex-specific responses to anti-obesity drugs to better understand the mechanisms behind these differences. In doing so, it paves the way for more effective, personalized obesity treatments that take into account the unique physiological and hormonal factors that influence treatment outcomes in men and women, and may increase men’s engagement in obesity treatment programs.

References

  1. Milani I, Guarisco G, Chinucci M, Gaita C, Leonetti F, et al. (2024) Sex-Differences in Response to Treatment with Liraglutide 30 mg. J Clin Med 13: 3369. [crossref]
  2. Cooper AJ, Gupta SR, Moustafa AF, Chao AM (2021) Sex/Gender Differences in Obesity Prevalence, Comorbidities, and Treatment Curr Obes Rep 10: 458-466. [crossref]
  3. Mauvais-Jarvis F, Bairey Merz N, Barnes PJ, Brinton RD, Carrero JJ, et al. Sex and gender: modifiers of health, disease, and medicin The Lancet 396: 565-582. [crossref]
  4. Li JB, Qiu ZY, Liu Z, Zhou Q, Feng LF, et al. (2021) Gender Differences in Factors Associated with Clinically Meaningful Weight Loss among Adults Who Were Overweight or Obese: A Population-Based Cohort Study. Obes Facts. 14: 108-120. [crossref]
  5. Flegal KM, Kruszon-Moran D, Carroll MD, Fryar CD, Ogden CL (2016) Trends in Obesity Among Adults in the United States, 2005 to 2014. JAMA 315: 2284-2291. [crossref]
  6. Osservatorio Nazionale sulla Salute nelle Regioni Italiane. Italian Observatory on Healthcare Report 2015 Health status and quality of care in the Italian Regions: https: //www.osservatoriosullasalute.it/wp-content/uploads/2016/09/synthesis_2015.pdf
  7. Italian Central Statistics Institute (Istituto Nazionale di Statistica). BES 2021: Equitable and Sustainable Well-Being in Italy. Available online: https: //www.istat.it/it/files/2021/10/BES-Report-2020.pdf (accessed on 22 June 2024).
  8. Thomas DD, Waring ME, Ameli O, Reisman JI, Vimalananda VG (2019) Patient Characteristics Associated with Receipt of Prescription Weight-Management Medications Among Veterans Participating in MOVE! Obesity. 27: 1168-1176. [crossref]
  9. Kompaniyets L, Freedman DS, Belay B, Pierce SL, Kraus EM, et al. (2023) Probability of 5% or Greater Weight Loss or BMI Reduction to Healthy Weight Among Adults With Overweight or Obesity. JAMA Netw Open 6: e2327358. [crossref]
  10. Horn DB, Almandoz JP, Look M (2022) What is clinically relevant weight loss for your patients and how can it be achieved? A narrative review. Postgrad Med 134: 359-375. [crossref]
  11. Kantowski T, Schulze zur Wiesch C, Aberle J, Lautenbach A (2024) Obesity management: sex-specific considerations. Arch Gynecol Obstet 309: 1745-1752. [crossref]
  12. Elliott M, Gillison F, Barnett, J (2020) Exploring the influences on men’s engagement with weight loss services: a qualitative study. BMC Public Health 20: 249. [crossref]
  13. Onishi Y, Oura T, Matsui A, Matsuura J, Iwamoto N (2017) Analysis of efficacy and safety of dulaglutide 075 mg stratified by sex in patients with type 2 diabetes in 2 randomized, controlled phase 3 studies in Japan. Endocr J 64: 553-560. [crossref]
  14. Gallwitz B, Dagogo-Jack S, Thieu V, Garcia-Perez LE, Pavo I, et al. (2018) Effect of once-weekly dulaglutide on glycated haemoglobin (HbA1c) and fasting blood glucose in patient subpopulations by gender, duration of diabetes and baseline HbA1c. Diabetes Obes Metab 20: 409-418. [crossref]
  15. Rentzeperi E, Pegiou S, Koufakis T, Grammatiki M, Kotsa K (2022) Sex Differences in Response to Treatment with Glucagon-like Peptide 1 Receptor Agonists: Opportunities for a Tailored Approach to Diabetes and Obesity Care. J Pers Med 12: 454. [crossref]
  16. Bays HE (2023) Why does type 2 diabetes mellitus impair weight reduction in patients with obesity? A review Obes Pillars 7: 100076. [crossref]
  17. Overgaard RV, Petri KC, Jacobsen LV, Jensen CB (2016) Liraglutide 30 mg for Weight Management: A Population Pharmacokinetic Analysis. Clin Pharmacokinet 55: 1413-1422. [crossref]
  18. Mirabelli M, Chiefari E, Caroleo P, Arcidiacono B, Corigliano DM, et al. (2019) Long-Term Effectiveness of Liraglutide for Weight Management and Glycemic Control in Type 2 Diabetes. Int J Environ Res Public Health 17: 207. [crossref]
  19. Muscogiuri G, Verde L, Vetrani C, Barrea L, Savastano S, et al. (2024) Obesity: a gender-view. J Endocrinol Invest 47: 299-306. [crossref]
  20. Boulet N, Briot A, Galitzky J, Bouloumié A (2022) The Sexual Dimorphism of Human Adipose Depots. Biomedicines 10: 2615. [crossref]
  21. Mauvais-Jarvis F, Berthold HK, Campesi I, Carrero JJ, Dakal S, et al. (2021) Sex- and Gender-Based Pharmacological Response to Drugs. Pharmacol Rev 73: 730-762. [crossref]
  22. Santini S, Vionnet N, Pasquier J, Gonzalez-Rodriguez E, Fraga M, et al. (2023) Marked weight loss on liraglutide 30 mg: Real-life experience of a Swiss cohort with obesity. Obesity 31: 74-82. [crossref]
  23. Richard JE, Anderberg RH, López-Ferreras L, Olandersson K, Skibicka KP (2016) Sex and estrogens alter the action of glucagon-like peptide-1 on reward. Biol Sex Differ 7: 6.
  24. Cataldi M, Muscogiuri G, Savastano S, Barrea L, Guida B, et al. (2019) Gender-related issues in the pharmacology of new anti-obesity drugs. Obesity Reviews 20: 375-384. [crossref]
  25. Marta G Novelle, Carlos Diéguez (2019) Updating gender differences in the control of homeostatic and hedonic food intake: Implications for binge eating disorder Molecular and Cellular Endocrinology 497. [crossref]

Addressing Global Inequities in Poxvirus Vaccination: Strategies for a More Equitable Future

DOI: 10.31038/IJVB.2024812

Abstract

There has been persistent vaccine inequity between high-income and low-income nations, resulting in the prevalence of infectious disease epidemics in Sub-Saharan African countries. While the global surge in poxvirus cases peaked in 2022, western and central African countries have struggled with this virus since the 1970s [1]. These nations face numerous barriers to accessing adequate vaccination. Wealthy nations acquire vaccines at higher rates due to their ability to bear the high costs, forcing poorer nations to rely on donations and low-cost subsidies. This situation is further complicated by inadequate healthcare infrastructure and socioeconomic, cultural, and geographical obstacles. To address these challenges, comprehensive, inclusive, and integrated approaches are essential, incorporating preventive measures, surveillance systems, low-cost vaccines, vaccine subsidies, the expansion of vaccine manufacturers, and vaccine education through multi-sectoral collaborations in both the public and private sectors.

Keywords

Poxvirus vaccination, Monkeypox, Disease surveillance, Vaccine awareness, Vaccine inequity

Preventive Measures and Community Involvement

Similar to other infectious diseases, preventive measures for the poxvirus include maintaining diligent sanitation, such as thoroughly washing hands with clean water and regularly cleaning and disinfecting spaces. However, these measures face significant obstacles in Africa due to limited access to clean water and inadequate water and sewage treatment facilities [2]. Resources need to be mobilized to develop water treatment plants, sanitation infrastructure, and waste management systems. Implementing preventive measures requires community involvement, with local village leaders playing a crucial role in educating residents about prevention and early treatment. To enhance prevention efforts, recruited local trainees can be mobilized.

Surveillance Systems

Since Mpox has both animal and human reservoirs, it is theoretically difficult to control and eradicate, necessitating the maintenance of active surveillance systems [3]. However, effective surveillance is challenging in most African countries due to a lack of diagnostic capacity to detect monkeypox [4]. Logistical barriers further contribute to the underreporting of cases, but this can be partially overcome by mobile phone apps, which allow for quick information delivery from remote areas to central health information systems. Effective surveillance relies on strengthening diagnostic capacity, providing affordable diagnostic tests, and ensuring adequate staff training.

Collaboration of Health Agencies

The 2022 Mpox outbreak led the WHO to create the Mpox Strategic Preparedness, Readiness, and Response Plan (SPRP) [5]. Collaboration between WHO staff and national and provincial health agencies is crucial for addressing global disparities in poxvirus vaccination. The WHO can adopt a proactive approach to assist countries in implementing the SPRP, increasing monkeypox vaccine production, donations, and subsidies, and enhancing disease surveillance systems and vaccine awareness campaigns.

Vaccines

Jynneos, Imvanex, and Imvamune vaccines can prevent Mpox, but the rollout of vaccination campaigns exposed significant global disparities in vaccine procurement and distribution. High-income countries or those with high vaccine production capacities were prioritized. In 2022, nearly 80% of the world’s Mpox vaccine supply was held by the U.S., while African nations faced considerable challenges in accessing vaccines [6]. The global shortage of Mpox vaccines, coupled with high prices, excluded low-income countries. Despite the U.S. allocating $1 billion for Mpox vaccines, only half of the affected countries received access [7].

To contain Mpox outbreaks in endemic African countries, subsidies for a low-cost vaccine are essential. A targeted vaccination approach, focusing on exposed and high-risk populations, requires fewer donated doses and is more cost-effective for donors. Despite facing high mortality rates from infectious diseases, Africa’s vaccine manufacturing capacity is limited. In response, the African Union and GAVI, The Vaccine Alliance, are expanding this capacity by increasing the number of manufacturers from 10 to 17 and diversifying vaccine portfolios [8]. American Tonix Pharmaceuticals, in collaboration with the Kenya Medical Research Institute, is also working on potential local vaccine production [9].

Vaccine Education

The distribution of the limited vaccines in African nations was impeded by an intricate tapestry woven from factors including unaffordable costs, lack of proximity to vaccination sites, inadequate medical services, and deeply entrenched socioeconomic and cultural barriers such as mistrust of vaccines, misinformation, and cultural opposition [10,11]. At the community level, vaccine advocates and opinion leaders should collaborate to disseminate vaccination knowledge to ensure that vulnerable populations understand the importance of vaccination and have easy access to it. Authorities should establish a monitoring system to engage with targeted communities, delivering timely and accurate information on poxvirus transmission, preventive measures, and treatment. Additionally, they should enhance access to vaccination sites through the use of mobile apps.

Conclusion

African nations are likely to experience more severe impacts from modern epidemics. Recognizing this sobering reality is essential for creating global cooperative pandemic-control organizations. Their collective efforts should focus on expanding vaccine procurement, production, and allocation in African nations. Drawing lessons from the global inequities in vaccination during the Covid-19 pandemic, high-income countries should support these nations, which face persistent infectious diseases and fragile healthcare infrastructures, by helping to expand preventive measures, vaccine donations, and subsidies [12]. As worldwide epidemics may occur routinely, healthcare decision-makers should continue to promote risk-mitigating behaviors, maintain open and transparent risk communication with the public, and foster community compliance. Future pandemic control efforts will depend heavily on global coordinated actions, cooperation, and communication, rather than competition and concealment, to develop affordable, widely distributed, broad-based, and long-lasting vaccines.

References

  1. Son BWK, Wambalaba OW, Wambalaba WF (2024) A Multi-pronged Approach to Addressing Global Poxviruses Vaccine Inequity: A Case of Monkeypox. In: Rezaei N (eds) Poxviruses. Advances in Experimental Medicine and Biology, vol 1451. Springer, Cham. [crossref]
  2. Mutono N, Wright J, Mutembei H, Muema J, Thomas M, Mutunga M, Thumbi SM (2020) The nexus between improved water supply and water-borne diseases in urban areas in Africa: a scoping review protocol. AAS Open Res 8(3): 12. [crossref]
  3. Golden J, Hooper J (2011) The strategic use of novel smallpox vaccines in the post-eradication world. Expert review of vaccines 10(7): 1021-1035 [crossref]
  4. Boodman C, Heymann D, Peeling R (2022) Inadequate diagnostic capacity for monkeypox—sleeping through the alarm again. The Lancet 23(2): 140-141 [crossref]
  5. WHO (2022) Monkeypox Strategic Preparedness, Readiness, and Response Plan (SPRP)
  6. Molteni M, Branswell H, Joseph A, Mast J (2022) 10 key questions about monkeypox the world needs to answer. Statnews. August 30, 2022.
  7. Zarocostas J (2022) Monkeypox PHEIC decision hoped to spur the world to act. The Lancet 400(10349): P347 [crossref]
  8. GAVI (2022) Expanding sustainable vaccine manufacturing in Africa: Priorities for Support. Gavi Vaccine Alliance.
  9. Tonix (2022) Tonix Pharmaceuticals Presents Development Update on Potential Smallpox and Monkeypox Vaccine TNX-801 in an Oral Presentation at the World Vaccine and Immunotherapy Congress.
  10. Lancet Editorial Board (2022) Monkeypox: a global wake-up call [Editorial]. The Lancet 400: 337 [crossref]
  11. Son B, South-Winter C (2018) Human Behavior Impacts on Health Care. Journal of International & Interdisciplinary Business Research 5(8): 138-146.
  12. Son, B.W.K (2023) A Multipronged Approach to Combat COVID-19: Lessons from Previous Pandemics for the Future. In: Rezaei N (eds) Integrated Science of Global Epidemics. Integrated Science, vol 14. Springer, Cham.

Progress towards Elimination of Viral Hepatitis B and C

DOI: 10.31038/IDT.2024514

Abstract

Worldwide the major causes of viral hepatitis are 5 viruses: the RNA hepatitis A virus (HAV), the  NA hepatitis B virus (HBV), the RNA hepatitis C virus (HCV), the RNA hepatitis delta viroid (HDV) and the RNA hepatitis E virus (HEV). Their epidemiology, life cycle, diagnosis, clinical course and associated diseases have been studied in great detail. Furthermore, effective treatment strategies and preventive measures have been developed and entered clinical practice.

lmportantly, with recent political commitments, policy updates and universal availability of highly effective preventive and therapeutic strategies against viral hepatitis B and C, respectively, low- and middle-income countries are scaling up their viral hepatitis prevention and therapy programs. ln this context, Egypt was leading the way for a public health approach to eliminate viral hepatitis C in October 2023.

While better tools and data than ever are now available to prevent, diagnose and treat viral hepatitis, including chronic hepatitis B and chronic hepatitis C and the recent political commitment of low- and middle-income countries with a high burden of viral hepatitis, such as China, lndia and Pakistan, the latest data from WHO show that hepatitis B and C are still a major public health challenge and far from the WHO goal of their elimination by 2030.

Keywords

Chronic viral hepatitis B and C, diagnosis, treatment, prevention, morbidity, mortality

Introduction

Worldwide, the causes of viral hepatitis are 5 hepatotropic viruses: the RNA hepatitis A virus (HAV), the DNA hepatitis B virus (HBV) [Figures 1 and 2], the RNA hepatitis C virus (HCV) [Figures 1 and 3], the RNA hepatitis delta viroid (HDV) [Figure 1] and the RNA hepatitis E virus (HEV). They infect the liver and can present with a broad spectrum of clinical signs and symptoms, ranging from an asymptomatic carrier state to acute/ fulminant hepatitis or chronic hepatitis with the potential to progress to liver cirrhosis and its sequelae, including hepatocellular carcinoma (HCC) [1]. Thus, viral hepatitis can be associated with significant morbidity and mortality and represents a global health care problem. ln the following, the history and epidemiology of viral hepatitis B [2-7] and hepatitis C [8-10], the world-wide burden of these diseases and the goals for their global elimination will be addressed.

FIG 1

Figure 1: Hepatitis B virus (HBV), hepatitis delta viroid (HDV), hepatitis C virus (HCV)

FIG 2

Figure 2: Worldwide prevalence of HBV infection in 2005 [13]

FIG 3

Figure 3: Worldwide prevalence of HCV infection in 2005 [14]

Combined, hepatitis B and C cause daily 3,500 deaths with increasing mortality and 6,000 new infections [1]. Worldwide, an estimated 254 million people are infected with hepatitis B and 50 million with hepatitis C. ln numerous countries, many people remain undiagnosed and even when diagnosed, the number of people receiving treatment is incredibly low. Although therapeutic agents are available at affordable prices, many countries do not take full advantage of this situation. Similarly, many infants do not receive the hepatitis B birth dose vaccination, despite the low cost of this intervention. Unfortunately, funding for viral hepatitis remains limited given the fact that viral hepatitis is about eight times more prevalent than HIV infection but receives less than one tenth of funding [1].

The COVID-19 pandemy severely affected strategies aimed at the elimination of viral hepatitis B and C

The COVID-19 pandemy urged many countries worldwide to adjust their health care priorities. ln particular, the COVID-19 pandemy affected 10 out of 38 WHO focus countries for the viral hepatitis response (China, lndia, lndonesia, Nigeria, Pakistan, Ethiopia, Bangladesh, Vietnam, Philippines and the Russian Federation). Among these 10 countries which account for about 80% of the global disease burden of viral hepatitis B and C, nearly two thirds were very much restricted in their viral hepatitis programs [1]. Together with a universal access to diagnosis, treatment and prevention by the special effort of the African Region, it is the goal to regain the momentum for achieving the Sustainable Development Goals.

Key findings of the WHO Global Hepatitis Report 2024. Overall, 304 million people were living with hepatitis B and C in 2022: an estimated 254 million (84%) with hepatitis B and an estimated 50 million (16%) with hepatitis C. Half the burden of chronic hepatitis is among people between 30 and 54 years old. Approx. 58% of all patients had a history of medical injections or other medical procedures, of newborns and children at risk for mother-to-child transmission of hepatitis B, of indigenous populations and mobile and migrant populations from countries with higher prevalence rates as well of key populations, such as people who inject drugs, people in prison or other closed settings, and men who have sex with men.

According to recent data from 187 countries [1] the estimated number of deaths from viral hepatitis increased from 1.1 million in 2019 to 1.3 million in 2022. 83% were caused by hepatitis B and 17% by hepatitis C. The estimated number of individuals newly infected by viral hepatitis declined from 2.5 million in 2019 to 2.2 million in 2022. Of these, 1.2 million (55%) were infected by hepatitis B and 1.0 million (45%) by hepatitis C. This reduction is due to hepatitis B and C prevention through immunization against hepatitis B and safe injection practices and the initial impact of novel curative antivirals against hepatitis C. Both HBV vaccination and cure of hepatitis C by widely available directly active antiviral agents (DAAs) are central for a sustainable viral response. Taken together, deaths from viral hepatitis B and C, unfortunately, increased from 2019 to 2022 while infections decreased.

Diagnosis, treatment and prevention of hepatitis B and C is still too low to achieve their elimination by 2030. By the end of 2022, 13% of people have been diagnosed with hepatitis B and only about an estimated 3% (7 million) have received long-term antiviral therapy, e.g., adefovir, entecavir, lamivudine, telbivudine, tenofovir disoproxil fumarate and tenofovir alafenamide [1-7].

Between 2015 and 2022, globally 36% of individuals with hepatitis C infection were diagnosed and 20% received curative treatment, e.g., genotype-specific or pangenotypic drugs or drug combinations (DAAs), After decades of interferon-based therapeutic strategies, the availability of DAAs has revolutionized the treatment of patients with chronic hepatitis C of any genotype with HCV elimination rates approaching 95-100% after treatment for 8-12 weeks [8-10]. The DAAs include protease inhibitors (e.g., telaprevir, boceprevir, asunaprevir, simeprevir, faldaprevir), non-nucleoside polymerase inhibitors (e.g., deleobuvir, filibuvir, setrobuvir, tegobuvir), NS5A inhibitors (e.g., daclatasvir, ledispavir) and NS5B polymerase inhibitors (e.g., sofosbuvir, mericitabine).

Vaccination against HBV infection, a cost-saving strategy in countries with high and intermediate endemicity, was applied to an estimated 45% of newborns within 24 hours after birth. Coverage varies between 18% in the African region and 80% in the Western Pacific Region [1].

To date, the global response to viral hepatitis B and C is off-track towards the global elimination of viral hepatitis and far below the global targets for eliminating viral hepatitis by 2030 [1-11]. Major public health activities are expected to reduce the incidence of chronic viral hepatitis by 95%, mortality by 65% and the cost by 15%. The benefits of achieving these global targets will save 2.85 million lives, avert 9.5 million new infections and 21 million cases of cancer. Looking to 2050, this will save nearly 23 million lives and prevent nearly 53 million new viral hepatitis infections and 15 million cases of cancer [1].

Summary and Perspectives

Overall, the worldwide prevalence of hepatitis B and C decreased from 2019 to 2022 while the deaths from these infections increased. ln 2022 about 1.3 million people died from chronic viral hepatitis, similar to the number of deaths from tuberculosis. lmportantly, the COVID-19 pandemy severely affected hepatitis services. The 2024 WHO report [1] presents information on access to health products from 38 WHO focus countries for viral hepatitis response. These countries account for about 80% of the global disease burden of hepatitis B and C. These 38 countries include 10 that account for nearly two thirds of the global burden: China, lndia, lndonesia, Nigeria, Pakistan, Ethiopia, Bangladesh, Viet Nam, Philippines and the Russian Federation. Universal access to prevention, diagnosis and treatment in these countries by 2026 together with a special effort in the African region should enable the global response to gain momentum for the elimination of HBV and HCV infections and their associated morbidities and mortalities by 2030.

The recent WHO report on the global health sector strategies for the period 2022-2030 [11] focuses on their implementation to achieve progress and to fill gaps in the worldwide elimination of HBV and HCV lnfection [12].

Conflict of interests

The author declares no conflict of interest.

Financial disclosure

The author has no financing to disclose.

Acknowledgement

The excellent contribution of Mr. Alain Conard to the content and formatting of the manuscript is gratefully acknowledged.

References

  1. Global hepatitis report 2024: action for access in low- and middle-income World Health Organization, Geneva 2024.
  2. Dusheiko G, Agarwal K, Maini MK (2023) New approaches to chronic hepatitis N Engl J Med 388: 55-69. [crossref].
  3. Naggie S, Lok AS (2020) New therapeutics for hepatitis B: the road to cure. Ann Rev Med 72: 93-105[crossref].
  4. Sarin SK, Kumar M, Lau GK, et (2016) Asian-Pacific clinical practice guidelines on the management of hepatitis B: A 2015 update. Hepatol Int 10: 1-98. [crossref]
  5. European Association for the Study of the Liver (2017) Clinical Practice guidelines on the management of hepatitis B virus J Hepatol 67: 370- 398. [crossref]
  6. Terrault NA, Lok ASF, McMahon BJ, et (2018) Update on prevention. diagnosis, and treatment of chronic hepatitis B. Hepatology 67: 1560-1599. [crossref]
  7. Yardeni D, Chang K-M, Ghany MG (2023) Current best practice in hepatitis management and understanding long-term prospects for Gastroenterology 164: 42-60. [crossref]
  8. HCV guidance: recommendation for testing, managing and treatment. Joint panel from the American Association of the Study of Liver Diseases and the Infection Disease Society of America. http://www.hcvguidelines.org/ (accessed on January 01, 2020)
  9. Spearman CW, Dusheiko GM, Hellard M, et (2019) Hepatitis C. Lancet 394: 1451- 1466.
  10. Koroumalis E, Voumvouraki A (2022) Hepatitis C virus: Approach to who really needs treatment. World J Hepatol 14: 1-44. [crossref]
  11. Global health sector strategies on, respectively, HIV, viral hepatitis and sexually transmitted infections for the period of 2022-2030. Geneva: World Health Organization 2022.
  12. Thomas DL (2019) Global elimination of chronic hepatitis, N Engl J Med 380: 2041-2050
  13. Ott J, Stevens GA, Groeger J, et al. (2012) Global epidemiology of hepatitis B infection: New estimates of age-specific HBsAg prevalence and Vaccine 30: 2212-2229. [crossref]
  14. Mohd Hanafiah K, Groeger J, Flaxman AD, et (2013) Global epidemiology of hepatitis C virus infection: New estimates of age-specific antibody to HCV seroprevalence Hepatology 57: 1333-1342. [crossref]

Pan Cancer Analysis Indicates TREM2 as a Target for Cancer Treatment

DOI: 10.31038/CST.2024924

Abstract

TREM2 is a receptor that interacts with a diverse range of ligands, many of which are characteristic indicators of tissue injury. TREM2 activity is limited to a few specific areas in physiological, but in pathological conditions, the TREM2 pathway becomes crucial for detecting tissue damage and preventing its spread. The TREM2 receptor is a crucial signaling hub in myeloid cells that is activated in response to tissue damage. It plays a key role in immune reprogramming. Studies have demonstrated that TREM2 is involved in regulating immunosuppressive, phagocytosis, survival, and healing functions in myeloid cells associated with neurodegenerative and metabolic pathologies. Although the significance of TREM2 in various diseases is well recognized, there is a lack of study on the relationship between TREM2 and human malignancies. Hence, our understanding of the connection between TREM2 and cancer is currently limited. In this study, we conduct a comprehensive analysis of TREM2 in several datasets including Protein Alta, Blood Alta, The Cancer Genome Atlas (TCGA), and single cell RNA Alta. We investigate the expression of TREM2, analyze its clinical aspects, and perform survival analysis on a variety of cancer patients. This study provides valuable insights into the potential of targeting TREM2 for cancer treatment in the future.

Keywords

TREM2; Pan cancer; Immune Evasion; Lipid Metabolism; Prognosis

Introduction

Recently, the scientific community has focused on the significant functions of myeloid cells in several diseases. Triggering receptor expressed on myeloid cells-2 (TREM2) has been identified as a crucial immunological signaling hub that is activated in these diseases [1- 6]. Scientists and biotechnology businesses are working towards activating TREM2 to induce microglia to engulf and eliminate amyloid-beta (Ab) plaques. The effectiveness of these strategies, currently being evaluated as a therapy for neurodegenerative disease [7,8], may also extend to autoimmune diseases and obesity-related comorbidities [6,9]. For instance, in conditions like atherosclerosis, where TREM2+ macrophages encircle aortic plaques, reactivating these macrophages can promote the engulfment of plaques and regulate inflammation [10]. TREM2 functions by suppressing NF- kappa-B signaling upon exposure to lipopolysaccharide. It enhances phagocytosis [11], reduces the production of pro-inflammatory cytokines and nitric oxide [12], prevents apoptosis, and increases the expression of IL10 and TGFB [13]. During periods of oxidative stress, it enhances the activation of anti-apoptotic NF-kappa-B signaling and ERK signaling [14]. The fundamental concept behind these tactics is to amplify TREM2 signaling through the use of agonistic drugs in order to augment the reparative functions of macrophages and microglia.

In addition to being expressed on immunosuppressive myeloid cells [15-18], there have been reports indicating that tumor cells also express TREM2 [19,20]. TREM2 expression on tumor cells may contribute to the formation of an immunosuppressive and pro-growth niche, working in coordination with myeloid cells for immune inhibition. As a result, T cell infiltration is excluded [21] and the efficacy of immune checkpoint inhibitors is downregulated [21]. Tumor cells also affect, influence, and educate myeloid cells, which in turn favor tumor growth. This interaction creates a cooperative and immunosuppressive environment. The expression and activities of TREM2 on microglia cells have been well elucidated [8,17,22]. Zhang et al. demonstrated that the levels of TREM2 mRNA and protein expression were markedly elevated in gastric cancer samples compared to normal gastric tissues [20,23]. However, they did not attribute the expression of TREM2 to any specific cell type. TREM2 has been proposed as a potential target in glioma and hepatocellular carcinoma. Studies have demonstrated that increased expression of TREM2 is linked to progression and advanced stage of tumors in these types of cancer [24,25].

In this research article, we hypothesized that the expression of TREM2 on tumor cells holds significant implications for tumor treatment and prognosis. Here we present a comprehensive analysis of TREM2 expression across many types of malignancies and normal tissues, with a focus on pan cancer. Our data shows that TREM2 has significant upregulation in various cancer types, particularly in metastatic tumors. Moreover, elevated levels of TREM2 are indicative of unfavorable prognosis outcomes in patients’ overall survival of many tumor types.

Results

TREM2 has Differential Expression Among Tissue Types and Cell Lines

Firstly, we made an all-tissue types expression analysis of TREM2 (Figure 1A). The Consensus Normalized expression (NX) levels were derived by integrating data from three transcriptomics datasets (HPA, GTEx, and FANTOM5) using an internal normalization workflow. These data include in total 55 tissue types and 6 blood cell types. The color-coding system is established according to tissue groups, which are composed of tissues that share similar functional characteristics. The color-coding system is established according to tissue groups, which are composed of tissues that share similar functional characteristics. We found that adipose tissue has the highest degree of TREM2 positivity, followed by brain, and lung, which is in accordance with the knowledge that TREM2 functions for lipid metabolism and M2 type macrophage functions.

Secondly, we wanted to know whether TREM2 are also expressed by blood cell types. The transcript expression levels obtained from the internal normalization pipeline for 18 blood cell types and total peripheral blood mononuclear cells (PBMC) are referred to as Normalized expression (NX). The color-coding system is determined by the lineage of blood cell types, which includes B-cells, T-cells, NK- cells, monocytes, granulocytes, dendritic cells, and total PBMC. An overview of the single cell RNA (NX) data encompassing all sorts of single cells. The process of color-coding involves categorizing cells into groups depending on their functional properties. Cell type analysis shows that Hoffbauer cells have the highest expression of TREM2, followed by Kupffer cells, blood and immune cells, monocytes (Figure 1B). The RNA expression summary provides a consensus of RNA data based on normalized expression (NX) data from three distinct sources: internally generated Human Protein Atlas (HPA) RNA-seq data, RNA-seq data from the Genotype-Tissue Expression (GTEx) project, and CAGE data from the FANTOM5 project.

In order to have a more detailed information of TREM2 expression among different cell types, we made a heatmap to show TREM2 expression in different cell types including B cells, macrophages, neutrophils, T cells and NK cells. Cell type markers were represented by the logarithm of transcripts per million (log(pTPM)) and their corresponding z-scores. The heatmap in this section displays the expression of the currently selected gene (at the top) and well-established markers for different single cell type clusters in this tissue. The left panel displays the cell type with which each marker is connected. The process of color-coding involves grouping cell types based on their shared functional properties (Figure 1C).

The concept of a Z-score involves transforming a variable so that its standard deviation becomes 1 and its mean becomes 0. Therefore, comparing all the genes is simplified due to their shared center and spread (Figure 1).

fig 1

Figure 1: TREM2 has differential expression among tissue types and cell lines. A Pan-tissue type expression analysis of TREM2, different tissue types have a differential expression of TREM2, with adipose has the highest TREM2 expression, followed by brain, and lung. We integrate data from three transcriptomics datasets (HPA, GTEx, and FANTOM5) using an internal normalization workflow. These data include in total 55 tissue types. B TREM2 are also expressed by blood cell types. We showed the transcript expression levels obtained from the internal normalization pipeline for 18 blood cell types. Hoffbauer cells have the highest expression of TREM2, followed by Kupffer cells, blood and immune cells, monocytes. C Heatmap analysis to show TREM2 expression in different cell types including B cells, macrophages, neutrophils, T cells and NK cells.

TREM2 are Highly Expressed by a Variety of Tumors

There are some studies which indicates that TREM2 are expressed by tumor cells. In order to have a more comprehensive idea of TREM2 expression on a variety of tumor types, we made a pan-cancer analysis of TREM2 expression among tumors and normal counterparts. We find that TREM2 are much highly expressed by tumors than the normal counterparts (Figure 2A). The pan-cancer analysis page presents the spectrum of gene expression for TREM2 gene across all tissues, utilizing RNA Seq data obtained from both normal and cancerous tissues. Mechanically, TREM2 promote tumor growth by upregulating PI3K-mTOR. We thus made a correlation between TREM2 and MTOR (Figure 2B). Compared with normal tissues, tumor cells have higher TREM2 and MTOR, supporting the idea that TREM2 facilitate tumor growth by upregulating MTOR and anabolic process.

Metastatic tumors differ from the original tumor site in many ways, usually the metastatic tumor cells are more aggressive and had high capacity for invasion and migration [26,27]. However, whether TREM2 plays a role in tumor metastasis is not clear. We made a comparison of TREM2 gene RNA expression level among normal, tumor and metastatic tumors (Figure 2C-2K). For all tumor types, the metastatic tumor has the highest level of TREM2, compared with the original tumor site, while the normal tissue has the lowest TREM2 RNA level. The Normal, Tumor, and Metastatic analysis offers comprehensive analysis of TREM2 in a specific tissue type utilizing gene chip-based data. Figure 2C-2K are esophageal squamous cancer, skin cancer, ovarian cancer, prostate cancer, thyroid cancer, colon cancer, kidney renal cancer, breast cancer, pancreatic ductal cancer (Figure 2).

fig 2

Figure 2: TREM2 are highly expressed by a variety of tumors. A Pan-cancer analysis of TREM2 expression among tumors and normal counterparts. The pan-cancer analysis page presents the spectrum of gene expression for TREM2 gene across all tissues, utilizing RNA Seq data obtained from both normal and cancerous tissues. In most tumors, TREM2 is higher than normal tissues. B Correlation analysis between TREM2 and MTOR shows a positive correlation between the two genes, supporting the idea that TREM2 facilitate tumor growth by upregulating MTOR and anabolic process. C-K TREM2 expression in normal, tumor, and metastatic parts. From C-K they are esophageal squamous cancer, skin cancer, ovarian cancer, prostate cancer, thyroid cancer, colon cancer, kidney renal cancer, breast cancer, pancreatic ductal cancer.

TREM2 has Different Staining Intensity Among Tumors

Although tumor cells usually have higher TREM2 expression level than the normal tissues, there are still some differential TREM2 staining intensity on tumor samples, and we classified them into negative, moderate, and strong. A selection of four standard cancer tissue samples that are representative of the overall staining pattern summarizes antibody staining in 20 distinct malignancies.

We get the TREM2 protein expression data from the Human Protein Atlas, from the immunohistochemical staining results of 4 types of tumors, we can see that tumors exhibit a differential staining intensity of TREM2 (Figure 3A-3D). Moderate cytoplasmic positivity was observed in malignant cells. Numerous cases of breast and colorectal cancer were significantly stained with TREM2 antibody. Several cases exhibited additional membranous positivity.

The percentage of patients (maximum 12 patients) with high and median protein expression levels is indicated by color-coded bars for each cancer. The cancer varieties are color-coded based on the type of normal organ from which they originate (Figure 3).

fig 3

Figure 3: TREM2 has different staining intensity among tumors. All IHC data are from the Human Protein Atlas. A Immunohistochemical staining of TREM2 protein in breast tumor, from left, middle, right they are negative, moderate, and strong TREM2 staining. B Immunohistochemical staining of TREM2 protein in lung squamous carcinoma, from left, middle, right they are negative, moderate, and strong TREM2 staining. C Immunohistochemical staining of TREM2 protein in prostate cancer, from left, middle, right they are negative, moderate, and strong TREM2 staining. D Immunohistochemical staining of TREM2 protein in hepatocellular carcinoma, from left, middle, right they are negative, moderate, and strong TREM2 staining.

High TREM2 Indicates Short Overall Survival in Many Cancer Types

The Survival Scatter plot displays the clinical outcome (i.e., whether the individual is deceased or alive) for all people in the patient cohort, using the same data as the related Kaplan-Meier plots. The x-axis displays the expression levels (FPKM) of the studied gene in the tumor tissue during the initial diagnosis. The y-axis represents the duration of time that has passed since the diagnosis, measured in years. Patients were categorized into two categories, namely “low” (below the cut-off point) or “high” (above the cut-off point), based on their degree of expression (Figure 4A-4H). Figure 4A-4H are breast cancer, esophageal squamous cancer, head and neck cancer, kidney renal cancer, lung adenocarcinoma, pancreatic ductal cancer, stomach adenocarcinoma, testicular germ cell tumor. This survival analysis indicated that high TREM2 expression of tumor cells could predict poor prognosis and short overall survival of patients for many cancer types. The x-axis represents the time of surviving in years, whereas the y-axis represents the likelihood of survival. They present a summary of the link between mRNA expression level and patient survival using Kaplan-Meier plots.

Both axes are accompanied with kernel density curves that illustrate the density of the data along the axes. The density map on the right displays the distribution of data density for the years of survival of deceased patients with both high and low expression levels. The data is divided based on the cutoff indicated by the vertical dashed line in the Survival Scatter plot (Figure 4).

fig 4

Figure 4: High TREM2 indicates short overall survival in a variety of tumor types. Kaplan-Meier plots analysis of TREM2 expression and patients’ overall survival. Patients were categorized into two categories, namely “low” (below the cut-off point) or “high” (above the cut-off point), based on their degree of expression. From A-D are breast cancer, esophageal squamous cancer, head and neck cancer, kidney renal cancer. From E-H are lung adenocarcinoma, pancreatic ductal cancer, stomach adenocarcinoma, testicular germ cell tumor.

Discussion

TREM2 gene is responsible for encoding an innate immune receptor that belongs to the immunoglobulin family [28]. In humans, this gene is located on chromosome 6, while in mice, it is positioned on chromosome 17 [28]. TREM2 is present on macrophages, dendritic cells, osteoclasts, and microglia [29,30]. The ligands that bind to TREM2 include ApoE, phosphatidylserine, sphingomyelin, Aβ, dead neurons, and damaged myelin [2,31]. TREM2 associates with the adaptor protein TyroBP or DAP12 to create a signaling complex. The process of ligand binding to TREM2 initiates phagocytosis and chemotaxis, while also exerting a negative regulatory effect on TLR- induced inflammatory responses [32,33]. Microglia create a network that covers the central nervous system (CNS) and perform functions such as sensing, maintaining the environment, and protecting against harmful internal and external stimuli. This helps prevent long-lasting inflammation in the brain, which can lead to damage and degeneration of nerve cells [22,34]. The extracellular domain of TREM2 can be secreted as a soluble protein known as sTREM2 (soluble TREM2). The levels of sTREM2 rise with age and under pathological situations.

Microglia lacking the TREM2 protein exhibit heightened autophagy in a mouse model of Alzheimer’s disease [35]. The absence of TREM2 inhibited mTOR activation and triggered compensatory AMPK and ULK1 activation, as well as autophagy, in BMDMs when faced with metabolic stress [36]. The integration of metabolic and RNA-seq data analysis uncovered abnormalities in metabolites and enzymes associated with glycolysis, TCA cycle, and pentose phosphate pathway in TREM2–/– BMDMs.

In contrast to AD, cancer presents a contrasting difficulty. TREM2’s pro-inflammatory and immunosuppressive effects have a negative impact, facilitating tumor development and evasion of the immune system [18]. The approach in cancer treatment involves inhibiting the signaling of TREM2 or removing TREM2+ myeloid cells from the tumor microenvironment. This enables the reactivation of the T cell driven immune response against the tumor. Utilizing anti-TREM2 antibody-dependent cellular cytotoxicity (ADCC) or monoclonal antibodies that function as TREM2 antagonists to reverse the immune-suppressive milieu of myeloid cells is a prominent and promising approach in cancer immunotherapy. Shi- Ting Li discovered that the expression of TREM2 was considerably higher in glioma tissues compared to non-tumorous brain tissues. Moreover, the expression of TREM2 exhibited a strong correlation with the pathological grade and overall survival of glioma patients [17].

CD8+ cytotoxic T lymphocytes play a crucial role in regulating tumor growth by eliminating cancer cells that display major histocompatibility complex class I molecules. Nevertheless, there is a communication of immune suppression occurring between cancer cells and other cell types present in the tumor microenvironment (TME), including cancer-associated fibroblasts, regulatory T cells, and M2-polarized macrophages. This communication leads to the inhibition of the immune response carried out by CD8+ T cells. Analysis of human tumor samples from various primary carcinomas, such as skin, liver, lung, breast, bladder, colon, stomach, pancreas, and kidney, has revealed the presence of TREM2+ macrophages in 75% of the samples. This suggests that TREM2 expression may play a role in the development of an immunosuppressive phenotype. TREM2 promotes phagocytosis and decreases the release of pro- inflammatory cytokines by macrophages, hence playing a role in regulating the immune response during infection. Existing evidence indicates that the expression of TREM2 on cells of the monocyte- macrophage lineage may have an immunoregulatory function in cancer by promoting an immunosuppressive environment [21].

TREM2 is expressed by many cell types present in the tumor microenvironment (TME). TREM2 may possess tumor cell intrinsic capabilities, in addition to its role in stromal cells and fibroblasts, that can either suppress or promote tumor growth, depending on the specific kind of cancer. Hence, it is crucial for us to gain a deeper comprehension of the processes by which TREM2 influences tumor suppression or oncogenic behavior in various cancer types.

The inhibition of TREM2 in the U87 and U373 glioma cell lines led to a substantial decrease in cell proliferation, migration, and invasion. The absence of TREM2 in glioma resulted in a notable upregulation of cleaved caspase 3 and Bax, accompanied by a downregulation of Bcl2, MMP2, MMP9, CXCL10, and CXCR3.

Our work unveils a universal expression of TREM2 by many tissues and cell types, by tumor cells and especially metastatic tumors. Furthermore, high expression of TREM2 is often indicative of short overall survival for many cancer types. Tumors with high TREM2 usually have high MTOR activity and hence promote tumor growth in this way. By gaining more knowledge about the signaling pathway, the genes that are affected by it, and the regulators of TREM2 expression, we may discover new targets and different approaches by targeting TREM2.

Availability of Data and Materials

The data generated in the current study can be obtained from the corresponding author at 109274952@qq.com.

Authors’ Contributions

Ruimin Wang and Rui Wang were responsible for the conception and design. Yuan Fang and Jingqiu Zhang conducted the data analysis and interpretation. Ruimin Wang composed the manuscript, which was subsequently revised by Jingqiu Zhang. The final manuscript was approved by all authors who read and reviewed it.

Acknowledgement

None

Grant Support

Rui Wang is sponsored by the China Scholarship Council (202206920039). The research received financial support from the Natural Science Foundation of Suqian Science and Technology Bureau (K201903, Z2018076, Z2018213, and Z2022065). Jiangsu Association for Science and Technology (JSTJ-2022-004).

Patient Consent for Publication

Not applicable

Competing Interests

The authors indicated no potential conflicts of interest.

References

  1. Xiong D, Y Wang and M You (2020) A gene expression signature of TREM2hi macrophages and γδ T cells predicts immunotherapy response. Nature Communications 11(1) [crossref]
  2. Hsieh CL (2009) A role for TREM2 ligands in the phagocytosis of apoptotic neuronal cells by J Neurochem, 109(4): 1144-56. [crossref]
  3. Wang E (2019) A Subset of TREM2(+) Dermal Macrophages Secretes Oncostatin M to Maintain Hair Follicle Stem Cell Quiescence and Inhibit Hair Cell Stem Cell, 24(4): 654-669.e6. [crossref]
  4. Schlepckow K (2017) An Alzheimer-associated TREM2 variant occurs at the ADAM cleavage site and affects shedding and phagocytic EMBO Mol Med, 9(10): 1356-1365. [crossref]
  5. Wang S (2020) Anti-human TREM2 induces microglia proliferation and reduces pathology in an Alzheimer’s disease J Exp Med, 2020. 217(9) [crossref]
  6. Sharif O (2021) Beneficial Metabolic Effects of TREM2 in Obesity are Uncoupled from its Expression on Macrophages. Diabetes [crossref]
  7. Gisslen M (2019) CSF concentrations of soluble TREM2 as a marker of microglial activation in HIV-1 Neurol Neuroimmunol Neuroinflamm, 6(1): e512. [crossref]
  8. Kiialainen A (2005) Dap12 and Trem2, molecules involved in innate immunity and neurodegeneration, are co-expressed in the Neurobiol Dis, 18(2): 314-22. [crossref]
  9. Liu C (2019) TREM2 regulates obesity-induced insulin resistance via adipose tissue remodeling in mice of high-fat feeding. J Transl Med, 17(1): 300.[crossref]
  10. Endo-Umeda K (2022) Myeloid LXR (Liver X Receptor) Deficiency Induces Inflammatory Gene Expression in Foamy Macrophages and Accelerates Arterioscler Thromb Vasc Biol, 42(6): 719-731.[crossref]
  11. Khantakova D, S Brioschi and M Molgora (2022) Exploring the Impact of TREM2 in Tumor-Associated Macrophages. Vaccines (Basel) 10(6) [crossref]
  12. Sessa G(2004) Distribution and signaling of TREM2/DAP12, the receptor system mutated in human polycystic lipomembraneous osteodysplasia with sclerosing leukoencephalopathy dementia. Eur J Neurosci, 20(10): 2617-28.[crossref]
  13. Yi S,(2020) IL-4 and IL-10 promotes phagocytic activity of microglia by up-regulation of Cytotechnology, 72(4): 589-602. [crossref]
  14. De Veirman K(2019) Myeloid-derived suppressor cells induce multiple myeloma cell survival by activating the AMPK Cancer Lett, 442: 233-241.[crossref]
  15. Daws MR (2001) Cloning and characterization of a novel mouse myeloid DAP12- associated receptor family. Eur J Immunol, 31(3): 783-91. [crossref]
  16. Katzenelenbogen Y (2020) Coupled scRNA-Seq and Intracellular Protein Activity Reveal an Immunosuppressive Role of TREM2 in Cancer. Cell, 182(4): 872-885.e19. [crossref]
  17. Neumann H. and K Takahashi (2007) Essential role of the microglial triggering receptor expressed on myeloid cells-2 (TREM2) for central nervous tissue immune J Neuroimmunol, 184(1-2): 92-9. [crossref]
  18. Nakamura K and MJ Smyth (2020) TREM2 marks tumor-associated Signal Transduct Target Ther, 5(1): 233. [crossref]
  19. Li C (2021) High expression of TREM2 promotes EMT via the PI3K/AKT pathway in gastric cancer: bioinformatics analysis and experimental verification. J Cancer, 12(11): 3277-3290. [crossref]
  20. Zhang X(2018) High TREM2 expression correlates with poor prognosis in gastric Hum Pathol 72: 91-99. [crossref]
  21. Zhang H (2022) Immunosuppressive TREM2(+) macrophages are associated with undesirable prognosis and responses to anti-PD-1 immunotherapy in non-small cell lung cancer. Cancer Immunol Immunother 71(10): 2511-2522. [crossref]
  22. Suarez-Calvet M (2016) Early changes in CSF sTREM2 in dominantly inherited Alzheimer’s disease occur after amyloid deposition and neuronal injury. Sci Transl Med 8(369): 369ra178. [crossref]
  23. Li C (2021) High expression of TREM2 promotes EMT via the PI3K/AKT pathway in gastric cancer: bioinformatics analysis and experimental verification. J Cancer 12(11): 3277-3290. [crossref]
  24. Overexpression of TREM2 enhances glioma cell proliferation and invasion: a therapeutic target in human glioma. [crossref]
  25. Zhou L (2022) Integrated Analysis Highlights the Immunosuppressive Role of TREM2(+) Macrophages in Hepatocellular Front Immunol 13: 848367. [crossref]
  26. Nguye B (2022) Genomic characterization of metastatic patterns from prospective clinical sequencing of 25,000 Cell, 185(3): 563-575.e11. [crossref]
  27. Ndlovu MN (2009) Hyperactivated NF-{kappa}B and AP-1 transcription factors promote highly accessible chromatin and constitutive transcription across the interleukin-6 gene promoter in metastatic breast cancer Mol Cell Biol, 29(20): 5488-504. [crossref]
  28. Deczkowska A, A Weiner and I Amit (2020) The Physiology, Pathology, and Potential Therapeutic Applications of the TREM2 Signaling Pathway. Cell, 181(6): 1207-1217. [crossref]
  29. Paloneva J (2003) DAP12/TREM2 deficiency results in impaired osteoclast differentiation and osteoporotic features. J Exp Med. 198(4): 669-75. [crossref]
  30. Humphrey MB (2006) TREM2, a DAP12-associated receptor, regulates osteoclast differentiation and function. J Bone Miner Res 21(2): 237-45. [crossref]
  31. Ferrara SJ (2021) TREM2 is thyroid hormone regulated making the TREM2 pathway druggable with ligands for thyroid hormone receptor. bioRxiv, [crossref]
  32. Hamerman JA (2006) Cutting edge: inhibition of TLR and FcR responses in macrophages by triggering receptor expressed on myeloid cells (TREM)-2 and J Immunol, 177(4): 2051-5. [crossref]
  33. Hamerman JA (2016) Negative regulation of TLR signaling in myeloid cells— implications for autoimmune diseases. Immunological reviews, 269(1): 212-227. [crossref]
  34. Gratuze M, C Leyns and DM Holtzman (2018) New insights into the role of TREM2 in Alzheimer’s Mol Neurodegener, 13(1): 66.
  35. Li C (2019) TREM2 inhibits inflammatory responses in mouse microglia by suppressing the PI3K/NF-kappaB Cell Biol Int 43(4): 360-372. [crossref]
  36. Ulland TK (2017) TREM2 Maintains Microglial Metabolic Fitness in Alzheimer’s Cell 170(4): 649-663.e13. [crossref]

Application of Meal Replacement in Patients with Type 2 Diabetes

DOI: 10.31038/EDMJ.2024823


Medical nutrition therapy (MNT) is the foundation of standardized diabetes management. According to guidelines, healthcare providers should customize diet plans to align with patients’ personal and cultural values, preferences, and treatment goals to ensure optimal adherence and benefits. Nevertheless, due to the limited medical resources, many patients with type 2 diabetes mellitus (T2DM) could not access to the guidance of MNT. Meal replacement (MR) provides a practical solution for portion control and caloric restriction. It is a commercial pre-packaged selection of foods, which typically consists of a combination of carbohydrates, fats, and proteins with added vitamins and minerals, in the form of milkshakes, nutrition bars, or soup. MR is commonly utilized to replace one or two main meals (partial meal replacement, PMR), or all meals (total meal replacement, TMR) per day. It has been demonstrated to improve dietary quality, weight management, and glycemic control of patients with T2DM [1-4].

Some guidelines recommend diabetic patients to use MR [5,6], but the optimal prescription of MR for patients with T2DM and its applicable objects remain uncertain. A prior meta-analysis explored the role of MR in the management of T2DM, which showed that MR led to significant reductions in body weight, BMI, HbA1c and fasting glucose compared with traditional weight loss diets [4]. However, due to the limited RCT clinical evidence available at that time, the certainty and precision of the effect estimates were restricted. As the evidence has been growing, a more comprehensive analysis of the efficacy and safety of MR, especially investigating the treatment effect of different MR administration manners in patients with different clinical backgrounds, is necessary for more detailed clinical recommendations. Therefore, we conducted a meta-analysis and systematic review with subgroup analyses to provide novel information that helps to guide MR applications in different clinical settings [7].

Overall Effects of MR on Patients with Type 2 Diabetes

A total of 17 randomized controlled trials involving 2112 participants were ultimately included in the study. Compared with conventional diabetic diets (CDs), MR significantly reduced HbA1c (MD -0.46%, P<0.001), fasting blood glucose (FBG, -0.62mmol/L, P<0.001), body weight (-2.43kg, P<0.001) and BMI (-0.65kg/m2, P<0.001), as well as improved other cardiometabolic risk factors. The MR-based dietary pattern further improved the glycemic control and adipose indicators in T2D patients. Our primary findings are similar to previous study and demonstrate the benefits of MR in the management of T2DM. Moreover, due to the increased number of included trials and a larger sample size, we were able to evaluate the impact of various patient characteristics and MR interventions on outcomes through subgroup analysis.

Tailoring MR Strategies for Diabetes Management

There were significant discrepancies in MR prescription and clinical characteristics of the included patients among studies investigating the efficacy of MR in patients with T2DM. For instance, MR was administered for varying duration, prescribed as TMR or PMR, and utilized with or without caloric restriction and exercise. Additionally, these studies included both those involving insulin users and those excluding them, with the minimum BMI criteria ranging from 18.5 kg/m2 to 30 kg/m2. The huge variability in clinical trials is not conducive to the precise utilization of MR. In order to identify who are more suitable for MR interventions, and determine the appropriate MR prescriptions for diverse clinical situations, we performed subgroup analyses in the systematic review and meta-analysis.

TMR vs. PMR

Several studies using TMR had similar interventions methods. The intervention consisted of total meal replacement (800-853 kcal/day MR for about 12 weeks), stepped food reintroduction (2-8 weeks), and structured support for long-term weight loss maintenance. The safety and efficacy of this intervention mode have been validated. Our subgroup analyses revealed that TMR led to greater improvement in HbA1c (-0.72% vs. -0.32%, P=0.01), FBG (-1.45 vs. -0.56mmol/L, P=0.02), body weight (-6.57 vs. -1.58kg, P<0.001), and BMI (-2.78 vs. -0.37kg/m2, P<0.001) than PMR. Therefore, for the purpose of improving both glycemic control and weight management, TMR under the guidance of professional doctors and nutritionist may be a preferred option for patients with T2DM.

MR with or Without Caloric Restriction

Several studies using MR additionally implemented caloric restriction, with restriction levels including 800-850 kcal/d, 500 kcal or a 25% energy deficit, and 20 kcal/kg·d. In our subgroup analyses, MR with caloric restriction showed more reductions in body weight (-3.20 vs. -0.75kg, P<0.001) and BMI (-0.84 vs. -0.24 kg/m2, P=0.003) compared with those without caloric restriction. MR with caloric restriction had a more favorable impact on weight management, highlighting the important role of caloric restriction in the management of T2DM, as emphasized in the guideline [8]. Meal replacement is a viable method to achieve portion control and caloric restriction.

MR and Anti-diabetes Treatment

Insulin

Compared to non-insulin users, patients on insulin are likely to have diabetes of increased severity and may have compromised pancreatic function [9]. Thus, many lifestyle intervention studies excluded patients treated with insulin. Brown et al. conducted a trial involving 90 participants with T2DM who were receiving insulin therapy and had a median duration of diabetes of 13.0 (9.0-20.0) years. They found that these participants achieved greater weight loss, glycemic control and quality of life through TMR intervention. In our subgroup analyses, MR showed comparable benefits in studies that included patients using insulin and those that didn’t (HbA1c -0.42% [-0.67, -0.16] vs. -0.54% [-0.83, -0.25], P=0.53; FBG -0.63 mmol/L [-1.48, 0.21] vs. -0.67 mmol/L [-1.05, -0.30], P=0.93; weight loss -4.23 kg [-7.08, -1.39] vs. -2.52 kg [-3.59, -1.44], P=0.27; BMI -2.36 kg/m2 [-4.49, -0.23] v s. -0.63 kg/m2 [-0.90, -0.36], P=0.11). Our study increases the evidence showing that MR usage is advantageous for both patients treated with or without insulin.

Some studies have reported the impact of MR on insulin treatment. Brown et al. and Kempf et al. have suggested the advantages of MR in terms of insulin discontinuation and reduction of insulin dosage. After one year of intervention, the changes in insulin dose were -47.3 ± 36.4U/day and -16.6 ± 33.6U/day in the MR intervention group in the two studies, compared to -33.3 ± 52.9 U/day and -1.4 ± 25.2 U/day in the control group, respectively [10,11]. But Shirai et al. did not observe significant difference in insulin discontinuation or reduction of insulin dose after a 24-week PMR intervention [12].

Oral Anti-diabetic Drugs

Besides, MR interventions have been reported to significantly reduce the use of oral anti-diabetes drugs [13-15], among which sulfonylureas were reported most frequently [10,12,16]. When using intensive MR intervention, such as TMR, it is advisable to presciently reduce the dose of anti-diabetes drugs, avoiding the occurrence of hypoglycemic events.

Overall, individuals on anti-diabetic drugs can safely use meal replacements, potentially reducing therapy intensity. However, high-quality trials are needed due to variability in previous studies.

MR and the Remission of T2DM

Recent studies indicated that MR, as part of lifestyle intervention, also holds significant potential in reversing T2DM. The DiRECT used TMR (825-853 kcal/day formula diet for 3-5 months), stepped food reintroduction and structured support for long-term weight loss maintenance. Diabetes remission rates was 46% at 1 year [14] and over 30% at 2 years [17]. The DIADEM-I trial adopted a dietary strategy similar to DiRECT, achieving 61% remission at 1 year [15]. These findings are clinically important as they demonstrated that MR, as part of intensive lifestyle intervention, is feasible in inducing T2DM remission in community settings.

Conclusion

MR holds a significant position in the medical nutrition therapy for patients with T2DM. The challenge of its application lies in tailoring MR interventions to suit individual characteristics. Current data suggests that appropriate calorie restriction and TMR may yield greater benefits, while both patients treated with or without insulin could similarly benefit from MR usage. Nonetheless, MR and structured support may be challenging for some patients, and long-term adherence to MR and lifestyle changes may be difficult to maintain. The current studies have laid the groundwork for personalized MR strategies, but more clinical studies are needed to ultimately refine the precise and effective MR utilization in the management of T2DM.

References

  1. Astbury NM, Piernas C, Hartmann-Boyce J, Lapworth S, Aveyard P, Jebb SA (2019) A systematic review and meta-analysis of the effectiveness of meal replacements for weight loss. Obes Rev 20(4): 569-587. [crossref]
  2. Thom G, Lean M (2017) Is There an Optimal Diet for Weight Management and Metabolic Health? Gastroenterology 152(7): 1739-1751. [crossref]
  3. Egger G (2006) Are meal replacements an effective clinical tool for weight loss? Med J Aust 184(2): 52-53. [crossref]
  4. Noronha JC, Nishi SK, Braunstein CR, et al. (2019) The Effect of Liquid Meal Replacements on Cardiometabolic Risk Factors in Overweight/Obese Individuals With Type 2 Diabetes: A Systematic Review and Meta-analysis of Randomized Controlled Trials. Diabetes Care 42(5): 767-776. [crossref]
  5. Draznin B, Aroda VR, Bakris G, et al. (2022) 8. Obesity and Weight Management for the Prevention and Treatment of Type 2 Diabetes: Standards of Medical Care in Diabetes-2022. Diabetes Care 45(Suppl 1): S113-S124. [crossref]
  6. Garber AJ, Handelsman Y, Grunberger G, et al. (2020) Consensus Statement by the American Association of Clinical Endocrinologists and American College of Endocrinology on the Comprehensive Type 2 Diabetes Management Algorithm. Endocr Pract 26(1): 107-139. [crossref]
  7. Ye W, Xu L, Ye Y, et al. (2023) . Efficacy and Safety of Meal Replacement in Patients With Type 2 Diabetes. J Clin Endocrinol Metab 108(11): 3041-3049. [crossref]
  8. Evert AB, Dennison M, Gardner CD, et al. (2019) Nutrition Therapy for Adults With Diabetes or Prediabetes: A Consensus Report. Diabetes Care 42(5): 731-754.
  9. Goldenberg JZ, Day A, Brinkworth GD, et al. (2021) Efficacy and safety of low and very low carbohydrate diets for type 2 diabetes remission: systematic review and meta-analysis of published and unpublished randomized trial data. BMJ [crossref]
  10. Brown A, Dornhorst A, McGowan B, et al. (2020) Low-energy total diet replacement intervention in patients with type 2 diabetes mellitus and obesity treated with insulin: a randomized trial. BMJ Open Diabetes Res Care 8(1) [crossref]
  11. Kempf K, Altpeter B, Berger J, et al. (2017) Efficacy of the Telemedical Lifestyle intervention Program TeLiPro in Advanced Stages of Type 2 Diabetes: A Randomized Controlled Trial. Diabetes Care 40(7): 863-871. [crossref]
  12. Shirai K, Saiki A, Oikawa S, et al. (2013) The effects of partial use of formula diet on weight reduction and metabolic variables in obese type 2 diabetic patients–multicenter trial. Obesity research & clinical practice 7(1): e43‐54. [crossref]
  13. Cheskin LJ, Mitchell AM, Jhaveri AD, et al. (2008) Efficacy of meal replacements versus a standard food-based diet for weight loss in type 2 diabetes – A controlled clinical trial. Diabetes Educator 34(1): 118-127. [crossref]
  14. Lean MEJ, Leslie WS, Barnes AC, et al. (2017) Primary care-led weight management for remission of type 2 diabetes (DiRECT): an open-label, cluster-randomised trial. Lancet. [crossref]
  15. Taheri S, Zaghloul H, Chagoury O, et al. (2020) Effect of intensive lifestyle intervention on bodyweight and glycaemia in early type 2 diabetes (DIADEM-I): an open-label, parallel-group, randomised controlled trial. Lancet Diabetes Endocrinol 8(6): 477-489. [crossref]
  16. Li Z, Hong K, Saltsman P, et al. (2005) Long-term efficacy of soy-based meal replacements vs an individualized diet plan in obese type II DM patients: relative effects on weight loss, metabolic parameters, and C-reactive protein. Eur J Clin Nutr 59(3): 411-418. [crossref]
  17. Lean MEJ, Leslie WS, Barnes AC, et al. (2019) Durability of a primary care-led weight-management intervention for remission of type 2 diabetes: 2-year results of the DiRECT open-label, cluster-randomised trial. Lancet Diabetes Endocrinol 7(5): 344-355. [crossref]

Prevalence and Associated Factors of Neonatal Hypoglycemia among Neonates Admitted to Neonatal Intensive Care Units in Northwest Amhara Region Comprehensive Specialized Hospitals, Northwest Ethiopia, 2022

DOI: 10.31038/EDMJ.2024822

Abstract

Introduction: Neonatal hypoglycemia is a metabolic problem characterized by decreased in blood glucose. It is the leading cause of neonatal mortality and is associated with multiple factors associated with neonatal hypoglycemia. However, there are limited studies on the prevalence and factors associated with neonatal hypoglycemia in the study area.

Objective: This study aimed to assess the prevalence and associated factors of neonatal hypoglycemia among neonates admitted to neonatal intensive care units in Northwest Amhara Region Comprehensive Specialized Hospitals, Northwest Ethiopia, in 2022.

Method: An institutional-based cross-sectional study was carried out among 497 neonates admitted to neonatal intensive care units in Northwest Amhara Region Comprehensive Specialized Hospitals from October 3, 2022 to November 3, 2022. A systematic random sampling technique was used to select study participants. Data were collected through maternal interviews using structured questionnaires and neonatal chart reviews using checklists. Finally, the data were entered into Epi-Data version 4.6.0.6 and analyzed using STATA version 14.0. Descriptive statistics were used to summarize the variables. Both bi-variable and multi-variable logistic regression models were used for the analysis. AOR and 95% CI were used to measure association and strength, with statistical significance assessed at a p-value <0.05

Results: The prevalence of neonatal hypoglycemia in the study area was 27.2% with 95%CI (23.4-31.4%). In this study variables such as maternal age 20-35 years [(AOR: 0.35, (95%CI: 0.167-0.73)], preterm birth [(AOR=2.60, 95%CI: 1.07-6.36)], low birth weight [(AOR: 3.07, 95%CI: 1.26-7.46)] and hypothermia [(AOR: 2.58, 95%CI: 1.27-5.23)], were factors associated with neonatal hypoglycemia.

Conclusions and recommendations: The prevalence of neonatal hypoglycemia in the neonatal intensive care unit of the northwest Amara region is relatively high. Preterm, low birth weight and hypothermia were significant factors for neonatal hypoglycemia. It is better for neonatal care providers in neonatal intensive care units to prioritize premature newborns or those with low birth weight and to follow the warm chain protocol.

Keywords

Hypoglycemia, NICU, Prevalence

Background

The term “hypoglycemia” refers to a low blood glucose level [1]. Neonatal hypoglycemia is defined as a blood glucose level of less than 40 mg/dL (2.2 mmol/L) [2]. It can be transient or persistent, and most cases of neonatal hypoglycemia are transient and respond simply to treatment, with a good prognosis [3]. The numerical explanation of neonatal hypoglycemia remains controversial [4]. Neonatal hypoglycemia is the most common metabolic problem observed in neonatal intensive care units [5].

In developing countries, the overall prevalence of neonatal hypoglycemia is 5%-15% of all babies [6]. In Sub-Saharan Africa, neonatal hypoglycemia affects (11%-30.5%) in all newborns [7-9]. Neonatal mortality is highest in South Asia and Sub-Saharan Africa (SSA) with mortality rates (NMR) of 24, and 27 deaths per 1,000 live births respectively, and hypoglycemia is a contributing factor [10,11]. Studies have found that neonates with hypoglycemia had higher mortality than neonates with normoglycemic [12-14].

Ethiopia ranks among the top countries with the highest number of neonatal deaths and has made little progress in lowering the neonatal mortality rate (NMR), According to the 2019 Ethiopian Demographic Health Survey (EDHS), NMR in Ethiopia was 33 /1000 live births [15]. Neonatal hypoglycemia is the most significant contributor to neonatal mortality [16]

Severe, prolonged hypoglycemia in the neonatal period can have devastating outcomes, including apnea, irritability, lethargy, seizures, long-term neurodevelopmental disabilities, cerebral palsy, and death. Neonates with persistent hypoglycemia have significantly higher rates of morbidity and mortality and 25 to 50% have developmental disabilities [17,18].

Direct costs attributable to the acute management of neonatal hypoglycemia can be large, particularly if the infant is admitted to the neonatal intensive care unit [19]. Both healthcare-related costs and the impact on quality of life due to, the long-term outcomes of neonatal hypoglycemia accrue over the lifetime of neonates [20]. Neonates who experienced neonatal hypoglycemia had a combined discounted hospital and post-discharge cost greater than neonates without hypoglycemia [21]

Various studies have shown that certain variables are associated with neonatal hypoglycemia, including premature infants; small for gestational age (SGA); large for gestational age (LGA); post-maturity; twins; infants of diabetic mothers; infants born to mothers who receive high-glucose infusion before delivery, delayed initiation of feeding, perinatal asphyxia, sex of the baby, meconium aspiration syndrome, and respiratory distress syndrome(RDS) [7,9,22,23].

There are limited studies in Ethiopia on the prevalence and factors associated with neonatal hypoglycemia among newborns admitted to the neonatal intensive care unit in the Northwest Amhara Region Comprehensive Specialized Hospitals. Although the Ethiopian national guidelines recommend early initiation of breastfeeding and prevention of hypothermia at birth to prevent hypoglycemia due to maternal, neonatal, and institutional problems, delays in feeding initiation and hypothermia are major problems observed among neonates admitted to NICUs [24]. Therefore this study aimed to determine the prevalence of neonatal hypoglycemia and identify the factors associated with neonatal hypoglycemia among newborns admitted to the neonatal intensive care unit in the Northwest Amhara Region Comprehensive Specialized Hospitals.

Methods and Materials

Study Design, Period, and Setting

An institution-based cross-sectional study was conducted from October 3, 2022, to November 3; 2022. This study was conducted in the Northwest Amhara region’s comprehensive specialized hospital, in Northwest Ethiopia. The Amhara region is the second-largest and most populous Region in Ethiopia with a total population of a 31 million [25]. In the Northwest Amhara region, there are five comprehensive specialized hospitals (CSH). These were the University of Gondar CSH, Felege Hiwot CSH, Tibebe Ghion CSH, Debre Tabor CSH, and Debre Markos CSH. The UoGCSH is located in the town of Gondar. Although neonatal hospitalization varies, this hospital has an average annual admission of 4560 and an average monthly admission of 380 neonates. Felege Hiwot and Tibebe Ghion CSH were found in Bahir Dar. These hospitals have an average annual neonatal admission of 1836 and 1920 neonates, and an average monthly admission of 153 and 160, respectively. Debre Tabor CSH, which is found in Debre Tabor town, has an average annual neonatal admission of 1560, and an average monthly admission of 130. Debre Marko’s CSH was found in the town of Debre Marko’s. This hospital has 1692 annual neonatal admissions; an average monthly admission of 141. These hospitals have NICUs with a mix of health professionals (neonatal and comprehensive nurses, general practitioners, pediatricians, and other staff). The major services in the NICU include general neonatal care services, blood and exchange transfusions, phototherapy, and ventilation support such as continuous positive air pressure.

Population Selection and Participation

The source population consisted of all neonates and their mothers who were admitted to the neonatal intensive care unit of the Northwest Amhara Region Comprehensive Specialized Hospitals. All neonates with their mothers who were admitted to the neonatal intensive care units during the study period comprised the study population. All neonates with their mothers who were admitted to the neonatal intensive care unit during the time of data collection were included in the study. Neonates whose mothers were critically ill, abandoned neonates and neonates with incomplete charts during the data collection period were excluded from the study.

Sample Size Determination and Sampling Procedures

For the first objective, the sample size was calculated by using a single population proportion formula taking the prevalence of neonatal hypoglycemia at 25% in St. Paul Hospital [9]

for 1

P=proportion hypoglycemia=25%

d = margin of error 4%

Z α/2= the corresponding Z score of 95% CI=1.96

n = Sample size.

By adding a 10% non-response rate, a total of 497 participants were included in the study.

For the second objective, the sample size was calculated using the double proportion formula by considering significant factor variables (Table 1).

Table 1: Sample size calculation by factors for the second objective. Data were collected through a review of the neonate’s medical chart it is not experiments on humans and/or the use of human tissue samples.

Neonatal Hypoglycemia

Variables

P1 P2 Power OR

Sample size

Prematurity

66%

22.89% 80% 6.537(26) 55

Low birth weight

24.3% 9.75% 80% 2.979(26)

258

Finally, the largest sample size which is obtained by the first objective (497) was taken.

Sampling Technique and Procedure

In the Northwest Amhara region, there were five comprehensive specialized hospitals: UoGCSH 380/month, FHCSH 153/month, TGCSH 160/month, DTCSH 130/month, and DMCSH has 141/month. In total, 964 neonates and their mothers were admitted to the hospital from October 3, 2022, to November 3, 2022. Based on the final calculated sample size proportional allocation was performed for each hospital. Systematic random sampling was used in this study. The k interval was determined (964/497; K = 2). After determining the Kth interval, the first neonates with mothers were selected randomly, and then based on the bed number of the neonates every other two neonates with mothers were selected using a systematic sampling technique.

Study Variables and Their Measurements

The outcome variable was the prevalence of neonatal hypoglycemia among neonates admitted to the neonatal intensive care unit. The independent variables were as follows: 1. socio-demographic factors (maternal age, residency, marital status, educational status and maternal occupation); 2. Obstetric factors (ANC follow-up, parity, mode of delivery, duration of labor, place of delivery, number of current pregnancies) 3. Maternal factors (DM, pregnancy-induced hypertension, preeclampsia, eclampsia, maternal HIV/AIDS, maternal drugs) 4. Neonatal factors (sex, gestational age, age at admission, birth weight, weight for gestational age, time of initiation of feeding, perinatal asphyxia (PNA), temperature, respiratory distress syndrome (RDS), sepsis, meconium aspiration syndrome)

Neonatal Hypoglycemia

A baseline or first blood glucose measurement value of less than 40 mg/dl in neonates [27].

Hypothermia

A baseline axillary body temperature below 36.5°C [28].

Perinatal Asphyxia

Apgar score of less than 7 in the 5th minute.

Macrosomia

Birth weight of 4000 grams and above.

Neonatal Respiratory Distress Syndrome

Diagnosed based on the presence of one or more of the following signs: an abnormal respiratory rate, expiratory grunting, nasal flaring, chest wall recessions, and thoracoabdominal asynchrony with or without cyanosis [29], and Physician diagnosis.

Pregnancy-induced Hypertension

Blood pressure greater than 140/90 mm Hg occurring after the 20th week of pregnancy or during the first 24 hours postpartum without evidence of proteinuria.

Preeclampsia

New-onset hypertension with proteinuria with or without edema.

Eclampsia

It is the development of convulsions coma or both in the clinical setting of preeclampsia.

Small for Gestational Age

It is related to birth weight and gestational age if the birth weight is less than the 10th percentile [28]

Large for Gestational Age

It is related to birth weight and gestational age if the birth weight is greater than the 90th percentile [28]

Incomplete Chart

Charts with one of the following factors are missed (gestational age, birth weight, neonatal age, parity, place of delivery, body temperature, maternal age and type of pregnancy, and random blood glucose level.

Data Collection Tool and Procedure

The data were collected using interviewer-administered and chart review through structured, pretested questionnaires that were adapted from a questionnaire developed from previous studies [9,20,23,28,31,42]. The questionnaire contains four sections: The first section contains five questions regarding the socio-demographic characteristics of the mothers. The second section contains six questions regarding the obstetric characteristics of the mothers; the third section contains six questions regarding maternal-related characteristics, and the fourth section contains eleven questions related to neonatal-related characteristics. The data were collected by five BSc nurses who worked in a neonatal intensive care unit and supervised by four MSc nurse professionals. Primary data was collected through structured questionnaires by using interviews, and secondary data were collected through a review of the neonate’s medical chart by using checklists to take the baseline neonatal characteristics such as blood glucose, body temperature, and birth weight.

Data Quality Assurance

To ensure the quality of the data, a pretest was given among 5% (25) neonates with their mothers at Dessie CSH. The training was given to all data collectors and supervisors on the purpose of the study, how to get informed consent, and the technique of selecting the study participants from the neonatal intensive care unit. The data was further assured through careful planning and translation of the questionnaire; the English version was translated into the local language, Amharic. To maintain the validity of the tool, its content was reviewed by senior pediatric and child health specialist nurses and instructors. Then the questions were checked for clarity, completeness, consistency, sensitivity, and ambiguity. The completeness of the collected data was checked onsite daily during data collection and received prompt feedback from the supervisor and the principal investigator. All completed data collection forms were examined for completeness and consistency during data management, storage, cleaning, and analysis.

Data Processing and Analysis

Data were checked, coded, and entered into Epi-Data version 4.6.0.6 and exported to STATA version 14 for analysis. Descriptive statistics were carried out using the mean, frequency, percentage, proportion, tables, and figures to present the findings. The outcome variable was dichotomized and coded as 0 and 1, representing those who are not hypoglycemia and hypoglycemia, respectively. Pearson rank chi-square assumption fulfillment was checked for categorical variables. An adjusted odd ratio (AOR) with a 95% CI was used to assess the relationship between factors associated with the occurrence of the outcome variable. A logistic regression model was used, and bi-variable and multi-variable logistic regression was done to determine the association between each independent variable and the outcome variable. Variables having p-value <0.25 in variables logistic regression analysis were taken into multivariable logistic regression analysis. In multivariable analyses, variables whose p-value was ≤, 0.05 were considered statistically significant. Multicollinearity was checked by using variance inflation factors (VIF = 1.04–4.17, mean VIF=1.59) and model goodness of fit test was checked by Hosmer and Lemeshow goodness of fit tests (p = 0.55)

Results

Socio-demographic Characteristics of the Mothers

In this study, a total of 497 study participants were enrolled, with a response rate of 96.18% The mean (±SD) age of mothers was 28.33 (±4.8) years, and the majority of 398 (83.25%), were between the ages of 20 and 35, with 273 (57.11%) living in urban. Of the mother’s educational status 124 (25.94%) completed secondary school and 142 (29.71%) were college and above; the majority of participants 455 (95.19%) were married (Table 2).

Table 2: Socio-demographic characteristics of study participants in Northwest Amhara region comprehensive specialized hospitals, 2022(n=478).

Variables

Categories frequency(n)

Percent (%)

Maternal age <20 years

17

3.56

20-35 years

398

83.26

>35Years

63

13.18

Marital status Married

455

95.19

Single

19

3.97

Divorced

4

0.84

Residency Urban

273

57.11

Rural

205

42.89

Educational status unable to read and write

128

26.78

primary school

84

17.57

Secondary school

124

25.94

College and above

142

29.71

Occupation Government Employee

99

20.71

Private employee

38

7.95

Merchant

63

13.18

Daily labor

5

1.05

House Wife

273

57.11

Maternal Clinical Related Factors

Among a total of 478 participants, 47 (9.83%) were diabetics Miletus, of which 42 (89.36) gestational diabetics Miletus; 69 (14.44%) were pregnancy-induced hypertension, of which 46 (66.67) eclampsia; 46 (9.62%) were given medications during pregnancy, and 16 (3.35%) were given medications during labor (Table 3).

Table 3: Maternal Clinical related factors of study participants in Northwest Amhara region comprehensive specialized hospitals, 2022(n=478).

Variables

 Categories Frequency (n)

Percent (%)

Maternal diabetic Mellitus Yes

47

9.83

No

431

90.17

Type of diabetic mellitus Pre gestational

5

10.64

Gestational

42

89.36

Pregnancy-induced hypertension Yes

69

14.44

No

409

85.56

Type Pregnancy-induced hypertension Preeclampsia

23

33.33

Eclampsia

46

66.67

Medication use during Pregnancy (Except iron-folic acid) Yes

46

9.62

No

432

90.38

Type of medication use during pregnancy Amoxicillin

2

4.35

Magnesium sulfate

38

82.6

Hydrazine

2

4.35

Ceftriaxone

4

8.7

Medication is given during labor and delivery Yes

16

3.35

No

462

96.65

Type of Medication given during labor and delivery Oxytocin

6

37.5

Ampicillin

4

25

Dexamethasone

6

37.25

HIV/AIDS

Yes

9

1.88

No

469

98.12

Obstetric Related Factors

Out of 478 maternal interviews and reviewed charts neonates admitted in NICU regarding Obstetric factors-More than half, 248(51.88%) of mothers were multipara. 425 (88.91%) had ANC follow-up, and 454 (94.98%) had a duration of labor less than 24 hours. Around two-thirds, 306 (64.02%) of mothers gave birth via spontaneous vaginal delivery (Table 4).

Table 4: Obstetric factors of study participants in Northwest Amhara region comprehensive specialized hospitals, 2022(n=478).

Variables

Category Frequency(n)

Percent (%)

Parity Primipara

230

48.12

multi para

248

51.88

ANC follows up on the current pregnancy Yes

425

88.91

No

53

11.09

Number of ANC follow-up 1 time

12

2.51

2times

37

7.74

3 times

125

26.15

4 and above

251

52.51

Duration of labor <24 hours

454

94.98

>24 hours

24

5.02

Place of delivery Hospital

294

61.51

Health center

64

34.31

Home

20

4.18

Modes of delivery Spontaneous vaginal delivery

306

64.02

Assisted vaginal delivery

52

10.88

Cesarean section

120

25.10

Number of current pregnancies?

Single

410

85.77

multiple

68

14.23

Neonatal Related Factors

Among admitted neonates more than half of 263 (55.02%) were male. Around 207 (43.31%) were preterm and 213 (44.56%) of them had low birth weight. Around two-thirds (65.6%) of the neonates had hypothermia. in respect of to Weight for Gestational age 439 (91.84%) was appropriate for gestational age. 223 (46.65%) of neonates were started feeding within one hour. Around one-third, 149 (31.17%) of the neonates had respiratory distress syndrome, and 60 (12.55%) of the neonates were meconium aspiration syndrome (Table 5).

Table 5: Neonatal-related factors of study participants in Northwest Amhara region comprehensive specialized hospitals, 2022(n=478).

Variables

Category

Frequency(n)

Percent (%)

Male

263

55.02

Female

215

44.98

Age at admission <24 hours

351

73.43

≥24 hours

127

26.57

Gestational age Preterm

207

43.31

Term

261

54.60

Post-term

10

2.09

Birth weight

Low birth weight

213

44.56

Normal birth weight

254

53.14

Macrosomia

11

2.30

Weight for Gestational age Small for gestational age

22

4.60

Appropriate for gestational age

439

91.84

Large for gestational age

17

3.56

Axillary body temperature at admission

Hypothermia

287

60.04

Normothermic

154

32.22

hyperthermia

 37

7.74

Initiation of feeding Within one hour

223

46.65

After one hour

255

53.35

Respiratory distress syndrome Yes

No

149

329

31.17

68.83

No

329

68.83

Meconium aspiration syndrome Yes

60

12.55

No

418

87.45

Sepsis Yes

290

60.67

No

188

39.33

PNA Yes

 49

10.25

No

 429

89.75

Neonatal hypoglycemia Yes

130

27.20

No

348

72.80

Prevalence of Neonatal Hypoglycemia

The study revealed that the prevalence of baseline neonatal hypoglycemia was found to be 27.2% with 95%CI (23.4-31.4%) (Figure 1).

fig 1

Figure 1: Prevalence of neonatal hypoglycemia among neonates admitted to neonatal intensive care units in Northwest Amhara Region Comprehensive Specialized Hospitals, Northwest Ethiopia, 2022.

Factors Associated with Neonatal Hypoglycemia

Bivariable analysis was carried out on all of which variables having p-value <0.25: maternal age, maternal diabetes miletus, pregnancy-induced hypertension, medication use during pregnancy and labor, parity, place of delivery, duration of labor and mode of delivery, age at admission, feeding initiation time, gestational age, birth weight, axillary body temperature, RDS, PNA, and sepsis. Then multivariable logistic regression analysis was used to adjust possible confounders. In multivariable logistic regression analysis factors that were significantly associated which showed p-value < 0.05 neonatal hypoglycemia were After controlling confounders in the final model, maternal age between 20 and 35 years, preterm, low birth weight, and hypothermia.

Maternal age group 20- 35 years old were 65% less likely to be hypoglycemic (COR; 95%CI 0.35, 0.17-0.73) as compared to the maternal age above 35 years old of the mothers.

Preterm neonates were 2.6 times more likely to be hypoglycemic as compared to term neonates (AOR = 2.60, 95% CI: 1.07, 6.36).

Low-birth-weight neonates were 3.07 times more likely to be hypoglycemic than neonates delivered with normal birth weight (AOR = 3.07, 95%, CI: 1.26–7.46).

The neonates who had hypothermia were 2.58 times more likely to develop neonatal hypoglycemia as compared to those who had normal body temperature (AOR = 2.58, 95% CI: 1.27–5.23) (Table 6).

Table 6: Bi-variable and multivariable logistic regression of neonatal hypoglycemia among neonates admitted to neonatal intensive care units in Northwest Amhara Region Comprehensive Specialized Hospitals, Northwest Ethiopia, 2022.

Variable

Categories  Neonatal Hypoglycemia COR with 95% CI AOR with 95% CI
Yes

No

Maternal age <20 years

8 (47.06%)

9(52.94%) (52.2.94%) 1.44(0.49-4.25) 1.13(0.29-4.37)

20-35 years

98 (24.62%) 300 (75.38%) 0.53(0.30- 0.93)

0.35(0.167-0.73)**

>35Years

24 (38.10%)

39(61.90%) 1 1

Maternal diabeticmellits

Yes

18(38.30%) 29(61.70%) 1.77(0.95- 3.31)

1.87(0.86-4.06)

No

112(25.99%)

319(74.01%) 1

1

Pregnancy-induced hypertension Yes

28(40.58%)

41(59.42%) 2.06(1.21-3.49)

1.07(0.47- 2.45)

No

102(24.94%)

307(75.06%) 1

1

Medication use during pregnancy pregnancy Yes

22(47.83%)

24(52.17%) 2.75(1.49-5.10)

2.11(0.81-5.52)

No

108(25.00%)

32(475.00%) 1

1

Medication use during labor Yes

7(43.75%)

9(56.25%) 2.14(0.78-5.88)

2.41(0.70-8.30)

No

123(26.62%)

339(73.38%) 1

1

Parity Primipara

70(30.43%)

160(69.57%) 1.37(0.92-2.05)

1.37(0.81-2.34)

Multipara

60(24.19%)

188(75.81%) 1

1

Duration of labor <24 hours

120(26.43%)

334(73.57%) 1

1

>24 hours

10(41.67%)

14(58.33%) 1.99(0.86-4.60)

2.08(0.67-6.45)

Place of delivery Hospital

90(30.61%)

204(69.39%) 1

1

Health center

36(21.95%)

128(78.05%) 0.64(0.41-0.99)

0.68 (0.39-1.19)

Home

4(20.00%)

16(80.00%) 0.57(1.18-1.74)

0.93(0.25-3.50)

Mod of delivery SVD

70(22.88%)

236(77.12%) 1

1

Instrumental

14(26.92%%

38(73.08%) 1.24(0.64-2.4)

1.62(0.73-3.63)

C/s

46(38.33%)

74(61.67%) 2.09(1.33-3.3)

1.19(0.65-2.17)

Age at admission <24 hours

107(30.48%)

244(69.52%) 1.98(1.19 -3.28)

0.67(0.33-1.37)

>24 hours

23(18.11%)

104(81.89%) 1

1

Gestational age Term

32(12.26%)

229(87.74%) 1

1

Preterm

96(46.38%)

111(53.62%) 6.18(3.91-9.80)

2.60(1.07-6.36)*

Post-term

2(20.00%)

8(80.00%) 1.79(0.36-8.79)

1.15(0.19-7.03)

Birth weight Normal birth weight

31(12.20%)

223(87.80%) 1

1

Low birth weight

98(46.01%)

115(53.99%) 6.13(3.86-9.73)

3.07(1.26-7.46)*

Macrosomic

1(9.09%)

10(90.91%) 0.72(0.09-5.81)

0.83 (0.09-747)

Body temperature Hypothermia

111(38.68%)

176(61.32%) 5.84(3.26-10.47)

2.58(1.27- 5.23)**

Hyperthermia

4(10.81%)

33(89.19%) 1.12(0.845-0 .35)

2.14(0.59-7.63)

Normothermic

15(9.74%)

139(90.26%) 1

1

Initiation of feeding Within 1 hour

33(14.80%)

190(85.20%) 1

1

After 1 hour

97(38.04%)

158(61.96%) 3.53(2.26-5.53)

1.75(0.97-3.15)

Respiratory distress syndrome Yes

62(41.61%)

87(58.39%) 2.74(1.79-4.17)

0.55(0.28-1.05)

No

68(20.67%)

261(79.33%) 1

1

Sepsis Yes

64(22.07%)

226(77.93%) 0.52(0.34-0.78)

0.91 (0.55 -1.53)

No

66(35.11%)

122(64.89%) 1

1

PNA Yes

17(34.69%)

32(65.31%) 1.49(0.79-2.78)

1.69(0.72-3.99)

No

113(26.34%)

316(73.66%) 1

1

Discussion

This study revealed that the prevalence of neonatal hypoglycemia was 27.2% with 95%CI (23.4-31.4%). The findings are consistent with those previously conducted in Ethiopia St. Paul Hospital (25%) [9] and Nigeria (30.5%) [30]. The possible reasons in Ethiopia St. Paul Hospital may have used a similar study design and similarity in the neonatal intensive care unit setting and the possible reasons in Nigeria may be due to similar sources of the population were used.

On the other hand, the findings of this study are lower than the study conducted in Iraq (39.1%) [31] and New Zealand (51%) [23]. This may be because these two studies were used among neonates identified as high-risk groups. In Iraq, the study was conducted among low birth weight and preterm neonates and excluded healthy term newborns, whereas in New Zealand source of the population only infants of diabetic mothers.

On the contrary, the result of this study is higher than the study conducted in Eastern Ethiopia (21.2%) [32], Uganda (2.2%) [33] and (7.5%) [34], Côte d’Ivoire (15.9) [35], Nigeria (11%) [22], India (15.38%) [36], Israel (23.2) [37], Iraq (16.25%) [38], and China (16.9%) [39] The possible explanation for Uganda may be due to the difference in the study area and the number of study participants. It was conducted in the community which is different from institutional-based because less likely to gate healthy individuals compared to the community-based study area and the large number of study participants involved in the study. In Nigeria, the possible reasons may be that the study conducted included a smaller sample size, and neonates less than 24 hours of age were included in the study [22]. The study conducted in Iraq and India excludes infants born to diabetic mothers, neonates born to hypertensive mothers, and newborns with severe congenital malformations [36,38]. Another possible justification is that the study conducted in China used a lower cut-off point (30.6 mg/dL) to diagnose neonatal hypoglycemia compared to the current study [39].

Neonates delivered from mothers who had a maternal age of 20- 35 years old were 65% less likely to develop neonatal hypoglycemia as compared to the maternal age above 35 years old of the mothers. This finding is supported by Saint Paul‘s Hospital in Ethiopia [9] and India [40]. The possible justification is that mothers who are 20–35 years old are more likely to have higher levels of maternal human capital, which includes maturity, experience, self-esteem, and mental health, than older mothers (> 35 years old) [41]. The ideal childbearing age is between 20 and 35 years old. This is the time when having the highest number of good quality eggs available and pregnancy-related risks are lowest compared to maternal ages older than 35 years [42]. Advanced maternal age at birth (35 years and older) is associated with gestational diabetes, pre-eclampsia, preterm birth, low birth weight, low Apgar scores, and neonatal hypoglycemia [43]

The study revealed that preterm neonates were 2.6 times more likely to be hypoglycemic as compared to term neonates. This finding is supported by a study conducted in Eastern Ethiopia [32], Nigeria [7], New Zealand [23], Iran [38], Indonesia [26], and Macedonia [44]. The possible reason may be that preterm newborns have higher metabolic demands. In preterm infants, the enzymes involved in gluconeogenesis are expressed at low levels; thus, their ability to produce endogenous glucose is poor, contributing to their risk of severe or prolonged low glucose concentrations [45]. Preterm neonates are uniquely predisposed to developing hypoglycemia and its associated complications due to their limited glycogen and fat stores, their inability to generate new glucose using gluconeogenesis pathways, and their decreased ability to breastfeed effectively [46]

In this study, low birth weight neonates were 3.07 times more likely to be hypoglycemic as compared to normal birth weight neonates. This is in keeping with other studies in the study: Khartoum  [47], Nigeria [7], New Zealand [23], Indonesia [26], and Japan [48], Since neonates with low birth weight are at risk for hypoglycemia because they are born with decreased glycogen stores, decreased adipose tissue and experience increased metabolic demands because of their relatively large brain size [49].

According to the current study, hypothermic neonates were 3.58 times more likely to be hypoglycemic as compared to neonates with normal body temperature. This finding is supported by the studies conducted in Eastern Ethiopia [32], Uganda [34], Nigeria [22], Israel [50], Iran [38], China [39] and India [40]. The possible justification is that newborn hypothermia develops, the baby gets cold, and it uses up more glycogen to keep warm. Then the baby must utilize his glucose stores to keep warm, and then the blood sugar drops and they become hypothermic and hypoglycemic, and the glucose requirement increases in neonates who have hypothermia, which will increase the utilization of glucose [51].

Limitations of the Study

This study does not include other risk factors like Polycythemia, rhesus hemolytic disease, and neonatal jaundice because the study design is a cross-sectional study design.

This study does not see the fluctuation of blood glucose after the management of neonates having low blood glucose.

Conclusions

The prevalence of neonatal hypoglycemia in the study area was relatively high. Furthermore, it was found that maternal age between twenty and thirty-five, preterm birth, low birth weight, and hypothermia were significantly associated with neonatal hypoglycemia.

Recommendations

For Hospitals and Health Care Providers

Every neonatal intensive care unit should have its own thermostat and humidity control so that neonatal intensive care unit personnel can adjust the thermostat as needed for any neonates. Neonatal intensive care units’ temperature and humidity should be documented four times per day. The postnatal and neonatal intensive care units should be suitably arranged for the delivery unit so that mothers can’t be in difficulty of skin-to-skin contact during intra-facility transportation. The practice of warm chain should also be supervised regularly.

Neonatal care providers have to adhere to the routine practice of warm chain by giving the most prioritized attention to newborns with health problems, preterm and low birth weight newborns Mothers should also be oriented about thermal care during their antenatal care while they are in labor, delivery, and postnatal unit. The mothers also apply kangaroo mother care especially for preterm and low birth weight newborns.

Health education about neonatal hypoglycemia and its risk factors and preventive measures should be given to all families starting from ANC follow-up.

It is better to regularly screen out pregnant mothers for maternal obstetric factors like pregnancy-induced hypertension and chronic illness so that they will be alarmed as this can put them at risk of delivery being preterm and low birth weight which may lead to poor neonatal adaptation and many associated co-morbidity that leads to neonatal hypoglycemia. Healthcare providers who work in the labor and delivery ward and neonatal intensive care unit routinely check the neonates’ blood sugar levels.

Amhara Health Bureau

Integrate the need for training for health professionals on general prevention of hypoglycemia and develop standard protocols for all facilities to aware all the health professionals attending delivery and working in NICUs. To strengthen the service of the neonatal intensive care unit, medical equipment and medical team including a neonatologist, pediatrician, medical doctor, and neonatal nurse have to fulfill.

Researchers

Further studies have to be carried out to address the other factors associated with neonatal hypoglycemia and also to determine the outcomes of this hypoglycemia neonate using a follow up study.

Declarations

Consent for Publication

Not applicable.

Author Contributions

AGA developed the research idea, designed the study, and was involved in proposal writing, training and supervision of the data collectors, analysis and interpretation of the results, and preparation of the manuscript. EGM and AWA participated in the critical revision of the proposal, study design, analysis and interpretation of the results, and writing of the manuscript. All authors contributed to the article and approved the submitted version.

Data Availability Statement

The original contributions presented in the study are included in the article; further inquiries can be directed to the corresponding author.

Ethics Approval and Consent to Participate

Ethical clearance was obtained from the ethical review committee of the School of Nursing on behalf of the institutional review board of the University of Gondar. An official letter was written to the Northwest Amhara region’s Comprehensive Specialized Hospitals for permission and support from the Ethical Review Committee of the School of Nursing with ref. no. SN/032/2015 on 03/10/2022 (G.C.) and with ref.no. SN/032/2015.A written permission letter was obtained from Amhara Public Health Institute for each hospital (ref. no. አሕጤኢ/ዋ/ዳ/03/1611). Finally, permission was obtained from the NICU head of each hospital to access the mother’s and neonates’ medical charts. As this is a prospective study, consent must come from the mothers. The confidentiality of the information was strictly maintained by omitting any personal identifier (name and medical record number) during the data collection.

Acknowledgments

First, the authors would like to express their deepest gratitude to the University of Gondar, College of Medicine and Health Sciences, and School of Nursing for providing me with this opportunity and financial support. Next, we would also like to acknowledge the Amhara Public Health Institute for permitting me to conduct the study at each hospital, and we would also like to thank the Northwest Amhara Region Comprehensive Specialized Hospital NICU Coordinators and healthcare providers for giving me general information related to the study area and study population. Finally, we would also like to extend our special thanks to the data collectors, supervisors, and study participants for their great contributions to the success of this study.

Funding Statement

Financial support was received from University of Gondar. The funding institution had no role in the preparation of the manuscript or in the decision to publish.

Conflict of Interest

The authors declare that the research was conducted in the absence of any commercial or financial relationships that could be construed as a potential conflict of interest.

Publisher’s Note

All claims expressed in this article are solely those of the authors and do not necessarily represent those of their affiliated organizations, or those of the publisher, the editors, and the reviewers. Any product that may be evaluated in this article, or claim that may be made by its manufacturer, is not guaranteed or endorsed by the publisher.

References

  1. Berard LD, Blumer I, Houlden R, Miller D, Woo V (2013) Monitoring glycemic control. Canadian journal of diabetes. 37: S35-S9. [crossref]
  2. NICU guideline 2021. 2017;1: 277.
  3. Training NICUN, Manual P (2021) Neonatal Intensive Care Unit (NICU) TrainingParticipants’ Manual Federal Ministry of Health. 2021.
  4. Kallem VR, Pandita A, Gupta G (2017) Hypoglycemia: when to treat? Clinical Medicine Insights: Pediatrics. 11: 1179556517748913. [crossref]
  5. Hansen AR, Stark AR, Eichenwald EC, Martin CR (2022) CLoherty and Stark’s Manual of neonatal care: Lippincott Williams & Wilkins;
  6. Makker K, Alissa R, Dudek C, Travers L, Smotherman C, Hudak ML (2018) Glucose gel in infants at risk for transitional neonatal hypoglycemia. American Journal of Perinatology. 35(11): 1050-6. [crossref]
  7. Efe A, Sunday O, Surajudeen B, Yusuf T (2019) Neonatal hypoglycemia: prevalence and clinical outcome in a tertiary health facility in North-Central Nigeria. Int J Health Sci Res. 9: 246-51.
  8. Mukunya D, Odongkara B, Piloya T, Nankabirwa V, Achora V, Batte C, et al (2020) Prevalence and factors associated with neonatal hypoglycemia in Northern Uganda. [crossref]
  9. Nurussen I, Fantahun B (2021) Prevalence And Risk Factors of Neonatal Hypoglycaemia at St. Paul’s Hospital Millennium Medical College, Ethiopia. Ethiopian Journal of Pediatrics and Child Health. 16(1).
  10. Blencowe H, Krasevec J, De Onis M, Black RE, An X, Stevens GA, et al (2019) National, regional, and worldwide estimates of low birth weight in 2015, with trends from 2000: a systematic analysis. The Lancet Global Health. 7(7): e849-e60.[crossref]
  11. Wardlaw T, You D, Hug L, Amouzou A, Newby H (2014) UNICEF Report: enormous progress in child survival but greater focus on newborns urgently needed. Reproductive health. 11(1): 1-4. [crossref]
  12. Dedeke I, Okeniyi J, Owa J, Oyedeji G (2011) Point-of-admission neonatal hypoglycemia in a Nigerian tertiary hospital: incidence, risk factors and outcome. Nigerian Journal of Paediatrics. 38(2): 90-4.
  13. El-Mekkawy MS, Ellahony DM (2019) Prevalence and prognostic value of plasma glucose abnormalities among full-term and late-preterm neonates with sepsis. Egyptian Pediatric Association Gazette. 67(1): 1-7.
  14. Masaba BB, Mmusi-Phetoe RM (2020) Neonatal survival in Sub-Sahara: a review of Kenya and South Africa. Journal of multidisciplinary healthcare. 13: 709.[crossref]
  15. Demographic E (2019) Health survey: Addis Ababa. Ethiopia and Calverton, Maryland, USA: Central Statistics Agency and ORC macro.
  16. EN. T (2021) Clinical Reference Manual for Advanced Neonatal Care in Ethiopia Ministry of Health ©UNICEF.. Frontiers in Endocrinology 12: : 59-62.
  17. De Angelis LC, Brigati G, Polleri G, Malova M, Parodi A, Minghetti D, et al (2021) Neonatal hypoglycemia and brain vulnerability. Frontiers in Endocrinology. 12: 634305.
  18. Thornton PS, Stanley CA, De Leon DD, Harris D, Haymond MW, Hussain K, et al(2015) Recommendations from the Pediatric Endocrine Society for evaluation and management of persistent hypoglycemia in neonates, infants, and children. The Journal of Pediatrics. 167(2): 238-45.[crossref]
  19. Glasgow MJ, Harding JE, Edlin R, Alsweiler J, Chase JG, Harris D, et al (2018) Cost analysis of treating neonatal hypoglycemia with dextrose gel. The Journal of Pediatrics. 198: 151-5. e1.[crossref]
  20. Harding JE, Harris DL, Hegarty JE, Alsweiler JM, McKinlay CJ (2017) An emerging evidence base for the management of neonatal hypoglycemia. Early human development. 104: 51-6.[crossref]
  21. Glasgow MJ, Edlin R, Harding JE (2021) Cost burden and net monetary benefit loss of neonatal hypoglycemia. BMC Health Services Research. 21(1): 1-13.[crossref]
  22. Ochoga MO, Aondoaseer M, Abah RO, Ogbu O, Ejeliogu EU, Tolough GI (2018) Prevalence of Hypoglycaemia in Newborn at Benue State University Teaching Hospital, Makurdi, Benue State, Nigeria. Open Journal of Pediatrics. 8(2): 189-98.
  23. Mitchell NA, Grimbly C, Rosolowsky ET, O’Reilly M, Yaskina M, Cheung P-Y, et al (2020) Incidence and risk factors for hypoglycemia during fetal-to-neonatal transition in premature infants. Frontiers in Pediatrics. 8: 34. [crossref]
  24. Tesfay EN (2021) Clinical Reference Manual for Advanced Neonatal Care in Ethiopia Ministry of Health 2021 ©UNICEF. Frontiers in Endocrinology. 12: 59-62.
  25. Ethiopia FDRo (2019) Public Expenditure and Financial Accountability (PEFA) Assessment (Regional Government of Amhara) Final Report
  26. Yunarto Y, Sarosa GI (2019) Risk factors of neonatal hypoglycemia. Paediatrica Indonesiana. 59(5): 252-6.
  27. Ng. 2021. 2017;2017;1: 277.
  28. Lunze K, Hamer D (2012) Thermal protection of the newborn in resource-limited environments. Journal of Perinatology. 32(5): 317-24. [crossref]
  29. Sweet DG, Carnielli V, Greisen G, Hallman M, Ozek E, Te Pas A, et al (2019) European consensus guidelines on the management of respiratory distress syndrome–2019 update. 115(4): 432-50. [crossref]
  30. West B, Aitafo J (2020) Prevalence and Clinical Outcome of Inborn Neonates with Hypoglycaemia at the Point of Admission as seen in Rivers State University Teaching Hospital, Nigeria. Journal of Pediatrics, Perinatology and Child Health. 4(4): 137-48. [crossref]
  31. Rajab AS, Chalabi DA, Al-Rabaty AA (2018) Prevalence and severity of hypoglycemia in a sample of neonates in Erbil city. Zanco Journal of Medical Sciences (Zanco JMed Sci) 22(1): 13440.
  32. Sertsu A, Nigussie K, Eyeberu A, Tibebu A, Negash A, Getachew T, et al (2022) Determinants of neonatal hypoglycemia among neonates admitted at Hiwot Fana Comprehensive Specialized University Hospital, Eastern Ethiopia: A retrospective cross-sectional study. SAGE Open Medicine. 10: 20503121221141801. [crossref]
  33. Mukunya D, Odongkara B, Piloya T, Nankabirwa V, Achora V, Batte C, et al (2020) Prevalence and factors associated with neonatal hypoglycemia in Northern Uganda: a community-based cross-sectional study. Tropical Medicine and Health. 48(1): 1-8. [crossref]
  34. Nabuuma T (2022) Prevalence and factors associated with abnormal glycemic status among term neonates admitted to special care unit Kawempe National Referral Hospital: Makerere University.
  35. Ouattara GJ, Cissé L, Koffi G, Yao J-JA, Enoh J, Sei C, et al (2017) Clinical and Epidemiological Features and Management of Neonatal Hypoglycemia at the University Teaching Hospital of Treichville (Abidjan-Côte d’Ivoire) Open Journal of Pediatrics. 7(4): 320-30.
  36. Magadla Y (2016) Infants of diabetic mothers: maternal and infant characteristics and incidence of hypoglycemia: Faculty of Health Sciences, University of the Witwatersrand.
  37. Zigron R, Rotem R, Erlichman I, Rottenstreich M, Rosenbloom JI, Porat S, et al (2022) Factors associated with the development of neonatal hypoglycemia after antenatal corticosteroid administration: It’s all about timing. International Journal of Gynecology & Obstetrics. 158(2): 385-9. [crossref]
  38. Sabzehei MK, Otogara M, Ahmadi S, Daneshvar F, Shabani M, Samavati S, et al (2020) Prevalence of Hypoglycemia and Hypocalcemia Among High-Risk Infants in the Neonatal Ward of Fatemieh Hospital of Hamadan in 2016-2017. Hormozgan Medical Journal. 24(1): e94453e.
  39. Zhou W, Yu J, Wu Y, Zhang H (2015) Hypoglycemia incidence and risk factors assessment in hospitalized neonates. The Journal of Maternal-Fetal & Neonatal Medicine. 28(4): 422-5. [crossref]
  40. Sasidharan C, Gokul E, Sabitha S (2010) Incidence and risk factors for neonatal hypoglycemia in Kerala, India. Ceylon Medical Journal. 49(4)
  41. Kessler RC, Berglund P, Demler O, Jin R, Merikangas KR, Walters EE (2005) Lifetime prevalence and age-of-onset distributions of DSM-IV disorders in the National Comorbidity Survey Replication. Archives of general psychiatry. 62(6): 593-602.
  42. Fall CH, Sachdev HS, Osmond C, Restrepo-Mendez MC, Victora C, Martorell R, et al (2015) Association between maternal age at childbirth and child and adult outcomes in the offspring: a prospective study in five low-income and middle-income countries (COHORTS collaboration) The Lancet Global Health. 3(7): e366-e77.
  43. Wambach KA, Cole C (2000) Breastfeeding and adolescents. Journal of Obstetric, Gynecologic, & Neonatal Nursing. 29(3): 282-94. [crossref]
  44. Stomnaroska O, Petkovska E, Jancevska S, Danilovski D (2017) Neonatal hypoglycemia: risk factors and outcomes. Prilozi (Makedonska akademija na naukite i umetnostite Oddelenie za medicinski nauki)
  45. Carmen S (1986) Neonatal hypoglycemia in response to maternal glucose infusion before delivery. Journal of Obstetric, Gynecologic, & Neonatal Nursing. 15(4): 319-23.
  46. Sharma A, Davis A, Shekhawat PS (2017) Hypoglycemia in the preterm neonate: etiopathogenesis, diagnosis, management and long-term outcomes. Translational pediatrics. 6(4): 335. [crossref]
  47. Hussein SM, Salih Y, Rayis DA, Bilal JA, Adam I (2014) Low neonatal blood glucose levels in cesarean-delivered term newborns at Khartoum Hospital, Sudan. Diagnostic Pathology. 9(1): 1-4.
  48. Shimokawa S, Sakata A, Suga Y, Isoda K, Itai S, Nagase K, et al. Incidence and risk factors of neonatal hypoglycemia after ritodrine therapy in premature labor: a retrospective cohort study. Journal of Pharmaceutical Health Care and Sciences. 2019;5(1): 1-7.
  49. Abramowski A, Ward R, Hamdan AH. Neonatal hypoglycemia (2021) StatPearls [Internet]: StatPearls Publishing;.
  50. Bromiker R, Perry A, Kasirer Y, Einav S, Klinger G, Levy-Khademi F (2019) Early neonatal hypoglycemia: incidence of and risk factors. A cohort study using universal point of care screening. The Journal of Maternal-Fetal & Neonatal Medicine. 32(5): 786-92.
  51. Adamkin DH, editor Neonatal hypoglycemia (2017) Seminars in Fetal and Neonatal Medicine; Elsevier.