Currently we are forming the editorial board
1 Reply
DOI: 10.31038/PEP.2021232
Abstract
Background: Tanzania is implementing Infection Prevention and Control (IPC) in health care settings using Standard Based Management and Recognition model. The country has developed standards that are used to assess compliance of IPC best practices in health facilities. In order to compare country’s standards with international standards of IPC achievement, the World Health Organization checklist has been used to assess six hospitals.
Aim: To evaluate the Infection Prevention and Control compliance mean scores by using national Standard Based Management and Recognition tool and WHO’s IPC Assessment Framework at Facility Level (IPCAF – Facility tool).
Methods: A comparative cross-sectional evaluation on IPC compliance using national SBM-R tool and IPCAF Facility (WHO tool) was done in January and May 2020 respectively. We conducted evaluation in six hospitals – four regional referral hospitals (RRHs) namely Bukoba RRH, Maweni RRH, Sekou Toure RRH, Temeke RRH, and two zonal referral hospitals which are Benjamin Mkapa Hospital and Mbeya Zonal Referral Hospital.
Results: Temeke Regional Referral Hospital showed the highest infection prevention and control compliance scores with difference in scores when using SBM-R tool and IPCAF Facility WHO tool of 28 (CI 27.74-28.26) p<0.0001; while the lowest difference mean score was from Sekou Toure RRH, which was 1 (CI 0.74 – 1.26) p<0.0001.
Conclusion: There was a significant difference between the mean scores when evaluation was done using SBM-R tool and the WHO-IPCAF tool in all health care facilities. Generally the scores were average in all cases.
Key words
Infection Prevention and Control, Standards Based Management and Recognition, IPCAF Facility WHO
Background
Compliance with Infection Prevention and Control (IPC) guidelines and standards in low-and middle- income countries (LMICs) continues to be a challenge [1]. This has been attributed to inadequate resources, poor infrastructure and other contextual factors which call for more research to identify approaches that work well in LMICs [2, 3]. Gaps in knowledge of IPC implementation strategies among Nurses in sub-Saharan Africa have been reported mainly on “understanding of which, in what combination, and in what context implementation strategies should be best utilized to ensure their safety and that of their patients” [4]. Analysis of a global situation on implementation of the IPC core components at national level reveal that “most countries have IPC programmes and guidelines, but have not invested adequate resources and neither have they translated them in to implementation and monitoring [5].
The COVID-19 pandemic caused by Severe Acute Respiratory Syndrome-Coronavirus-2 (SARS-CoV-2) underscores the need to strengthen IPC practices [2]. Infection Prevention and Control interventions are key in preventing COVID-19 and Healthcare Associated Infections (HAIs). Such interventions include hand hygiene and other hospital- based IPC practices and approaches which are highly required in limited resource settings especially in LMICs [6]. However, a study in the Cochrane Database of Systematic Reviews [7] found variability in certainty of evidence on which approach is better for improving hand hygiene compliance between multimodal and simpler interventions, hence calling for more robust studies. In the area of hand hygiene, Tanzania has been cited as an example of countries in Africa with hand hygiene policies embedded in the IPC policies, i.e., national IPC guidelines, standards and tools [8].
Information available regarding HAIs do not portray the real situation in African countries [9]. Some studies have outlined effective measures which can be implemented in settings where resources are inadequate in order to improve IPC compliance and prevent HAIs. These include developing and implementing policies and procedures on HAIs accompanied with rigorous monitoring and feedback mechanism; and regular education and training of health care workers, patients and visitors on the policies and procedures [10]. A position statement of the International Society for Infectious Diseases in 2020 regarding surveillance of surgical site infections (SSIs) in LMICs noted that the burden of SSIs ranges from 8% to 30% of procedures making it the most common HAI. The statement gives key areas to address in preventing HAIs based on surveillance (collecting valid, high-quality data; linking HAIs to economic incapacity; implementing SSI surveillance within IPC programs; prioritizing IPC training for healthcare workers in LMICs to conduct broad-based surveillance; and developing a highly accurate and objective international system for defining SSIs, which can be translated globally in a straightforward manner) [11].
In October 2015, the world adopted “the 2030 Agenda for Sustainable Development”, in which goal 3 is on “ensuring healthy lives and promoting well-being for all at all ages” with a target (target 3.8) to “achieve universal health coverage, including financial risk protection, access to quality essential health-care services and access to safe, effective, quality and affordable essential medicines and vaccines for all” [12]. The target on universal health coverage (UHC) contains, as one of its pillars, the quality aspect which includes IPC. Through the lens of UHC and learning from the COVID-19 pandemic, Karamagi and colleagues have proposed a framework for health systems functionality towards UHC in the WHO African Region in which compliance of standard precautions for IPC is one of proxy indicators for vital sign “patient safety” in the domain “effective demand for essential services” [13]. This puts further emphasis to member states to strengthen compliance of IPC guidelines, standards and tools. Likewise, Storr, et al, (2016) worked to propose key points for building a policy case for IPC in the context of quality UHC as well as support and guidance to national governments. They also described the eight (8) WHO IPC core components [14]. The compliance to the WHO IPC core components in Tanzania in the past two decades is shown in Table 1.
Table 1: Compliance with the WHO- IPC core components in Tanzania: 2004 to 2021
| WHO IPC core component (Storr, et al, 2016) | Description of status in Tanzania: 2004-2021 |
| Organisation of IPC Programmes
|
There is a sub-unit responsible for IPC within the Health Quality Assurance Unit at the Ministry of Health, Community Development, Gender, Elderly and Children [32]; with qualified staff with clear roles and responsibilities. Funding for IPC activities comes from Development Partners, Implementing Partners and the Government of Tanzania. Startup IPC programme in 2003 was funded by the US – PEPFAR [33].
|
| Technical Guidelines
|
National IPC Guidelines were developed in 2004 (MoH, 2004) and revised in 2018 to accommodate new scientific developments and recommendations by the WHO [17]. IPC standards:hospital standards, 2012; health centre standards, 2015, and dispensary standards, 2015 were revised in 2020 [34]. IPC Communication Strategy was developed in 2012 covering a period of 2012-2017 [3]. Dissemination of the revised guidelines, standards and standard operating procedures is ongoing. |
| Human Resources Education and Training
|
Training of health care workers has been the main component which included training of Tutors in health training institutions as a way of addressing gaps in pre-service curricula. There are IPC focal persons at health facilities both at regional and council levels. Generally, in the country the ministry had coordinated building the capacity of 2544 healthcare workers on IPC countrywide. |
| Surveillance of infections and assessment of compliance with IPC practices
|
The Ministry has developed tools to conduct surveillance on Surgical Site Infection (SSI). The tools are already in use in all six health facilities and some other hospitals in the country. The Ministry is also developing Monitoring and Evaluation system for IPC in which surveillance of SSIs is part of. |
| Microbiology Laboratory
|
Tanzania is complying with the WHO’s recommendations on Antimicrobial Resistance (AMR) interventions. IPC is one of the technical working groups that aimes to address AMR in the country. AMR surveillance is done through laboratories by conducting culture and sensitivity. |
| Built Environment, Material and Equipment
|
In the Ministry, there is an Environmental Health and Sanitation Section responsible for water, sanitation and hygiene (WASH) interventions under Division for Preventive Services. There are guidelines on WASH in health care facilities [36]; and guidelines for supervision of environmental health and sanitation are in place [37]. Patient placement, isolation facilities and storage of sterile |
| Monitoring and Evaluation of programmes | Ministry of Health, through the IPC programme, has developed IPC indicator matrix and is currently developing monitoring and evaluation system whereby all health facilities will be required to report on monthly basis. |
| Multimodal Strategies | IPC programme in Tanzania employs multimodal strategies such that various modalities are used to make IPC a continuous practice and agenda in health facilities. Some of the models used are frequent training, mentorships, supervisions, posters, job aids, and SoPs |
The MoHCDGEC, in collaboration with partners reviewed the National IPC Guidelines of 2004 [15] to a new version of 2018. Also, in 2019 the MoHCDGEC reviewed the IPC standards for hospitals, 2012 [16] and updated to a new version [17] that is in line with the revised national guideline, 2018. The MoHCDGEC has also embarked into countrywide dissemination of the revised national IPC guideline (2018) to health facilities [18] in order to improve IPC practices as one of key pillars to fight threats of emerging and reemerging infectious diseases including Ebola Virus Disease (EVD) that had been affecting the neighboring country of the Democratic Republic of Congo (DRC) [19]; and the recent pandemic of coronavirus disease of 2019 (COVID-19) which is caused by severe acute respiratory Syndrome coronavirus 2 (SARS-CoV-2) that was first reported in Wuhan city of China in December 2019 [20, 21].
In Tanzania, the standard based management recognition (SBM-R) tool has been mainly used to ensure compliance of IPC standards in hospitals [16]. The SBM‐R “consists of systematic utilization of detailed performance standards for rapid and repeated assessments of health facilities, including both clinical and support systems; identification of gaps in compliance with these standards; implementation of corrective interventions; and rewarding of achievements through recognition mechanisms” [22]. Quality Improvement Teams (QITs) are responsible for overall governance of quality improvement issues in hospitals. They provide advice to the Hospital Management Team (HMT) on matters related to quality, and supervise Work Improvement Teams (WITs) in departments [23, 24].
Strengthening compliance of IPC practices in health facilities is of utmost importance in this era of increasing emerging and re-emerging infectious diseases [25, 26]. Emerging and re-emerging diseases are global threats towards human existence. In Tanzania, the trend for emerging and reemerging diseases is increasing; and this is attributed to several factors including changes in ecology, climate and human demographics. Infectious diseases which are on the rise in Tanzania include Cholera, Rift Valley Fever, Plague, Anthrax, Swine Flu, and Dengue [27]. Among the notable emergency events in the country is the Cholera epidemic of August 2015 – July 2017, in which 30,269 cases were reported with 475 deaths (CFR of 1.6%) [28].
Tanzania has been affected by COVID-19 pandemic [29], which is an ongoing crisis all over the world. Moreover, Tanzania remains to be at high risk of EVD as neighboring DRC continues to suffer from repeated outbreaks since 2018 [30]. Hence, the need to implement effective and timely IPC measures is of paramount importance [31].
Tanzania has limited capacity of healthcare staffs in responding to potential infectious disease outbreaks. Also, HAIs prevention systems have not been effectively implemented at health facility levels; and there is limited coordination and collaboration between QITs and Working Improvement Teams (WITs) in addressing HAIs and eventually emerging and re-emerging diseases [23]. Also, in Tanzania the functionality of QITs in RRHs have been demonstrated to be inadequate, which may affect implementation of quality improvement activities [24]. Improving mentorship on prevention of HAIs offers an opportunity for optimal use of the limited resources in reducing of negative impacts on animal and human health. This paper aims at documenting the experience of IPC standards compliance in six hospitals using SBM-R approach and assesses the factors that are responsible for improved functionality of QITs and WITs as well as IPC sub-committee in the hospitals.
Objectives
The overall objective of the study was to gauge compliance with infection prevention and control in six referral hospitals by using National and World Health Organization checklists.
Specifically, the objectives of the study were to:
Hypothesis
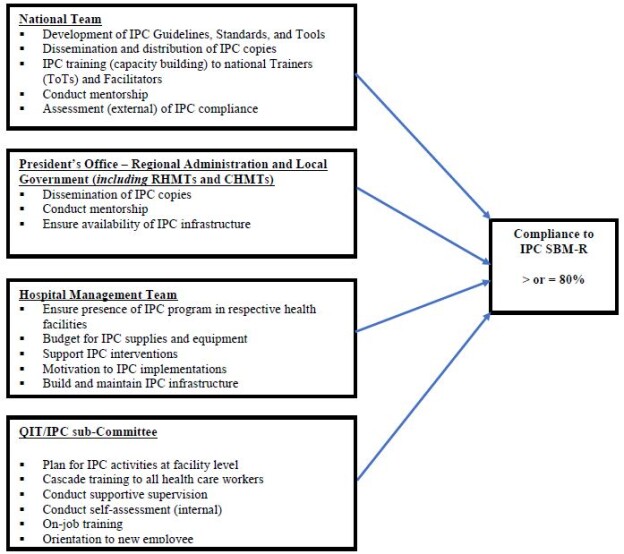
It was hypothesized that mentorship would improve compliance with IPC standards and measures through: (1) strengthening the functionality of quality governance structures (QITs and WITs) by providing members with opportunity for more hands-on practice; (2) building capacity of frontline workers in various departments and wards; and (3) clarification of challenging issues observed during assessments and observations in the service areas. Conceptual framework in the implementation of IPC activities in Tanzania is shown in figure 1.
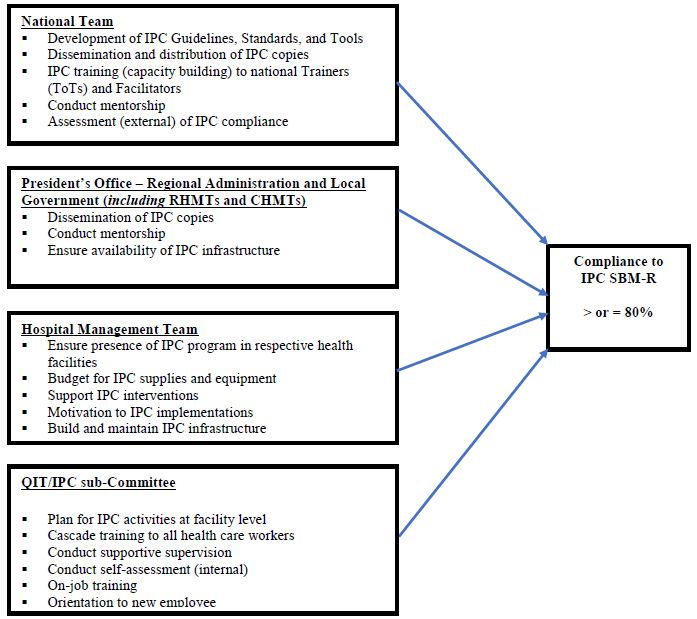
Figure 1: Conceptual framework in implementation of IPC activities in Tanzania (Credit: Bahegwa, R. P. (2021))
Methodology
Study design: A comparative cross-sectional study on IPC compliance using SBM-R tool and IPCAF – Facility WHO tool.
The national SBM-R tool has been used in Tanzania for assessment of IPC [38]. It is structured based on the functional areas within the health care facility like operating theatre, labour ward, etc. The checklist captures all standard and transmission-based precautions of IPC in all functional areas. Each functional area can score a maximum of hundred percent (100%). At the end the facility is assigned average score of all functional areas. The scores assigned are interpreted as follows: 0%-49%-poor: the facility needs a lot of work to improve; 50%-79%-moderate: needs to improve at some areas; and 80%-100%- acceptable and more investment is needed to sustain the compliance.
The IPCAF – Facility WHO tool was tested using a robust global study (in 46 countries, 181 hospitals and 324 individuals) and revised as necessary and then approved as an effective tool for IPC improvement in healthcare facilities [39]. The assessment of the facility through the use of IPCAF – Facility WHO tool focuses on eight (8) main core components of the IPC namely the IPC programme; IPC guidelines; IPC education and training; HAI surveillance; Multimodal strategies; Monitoring/audits of IPC practices and feedback; Workload, staffing and bed occupancy; and Built environment, materials and equipment for IPC at the facility level) which are then addressed by a total of 81 indicators. These indicators are based on evidence and expert consensus and have been framed as questions with defined answers to provide an orientation for assessment. Based on the overall score achieved in the eight sections, the facility is assigned to one of four levels of IPC promotion and practice: Inadequate (0-200): IPC core components implementation is deficient. Basic, (201-400): Significant improvement is required, some aspects of the IPC core components are in place, but not sufficiently implemented. Further improvement is required. Intermediate (401-600): Most aspects of the IPC core components are appropriately implemented. The facility should continue to improve the scope and quality of implementation and focus on the development of long-term plans to sustain and further promote the existing IPC programme activities. Advanced (601-800): The IPC core components are fully implemented according to the WHO recommendations and appropriate to the needs of the facility.
The assessment using SBM-R tool was conducted in January 2020 and the assessment using WHO’s IPCAF-Facility tool was done in May 2020. Prospective documentation of IPC compliance in the six hospitals – four regional referral hospitals (RRHs) namely Bukoba RRH, Maweni RRH, Sekou Toure RRH, Temeke RRH, and two zonal referral hospitals which are Benjamin Mkapa Hospital and Mbeya Zonal Referral Hospital, was done from January to May 2020.
Target population: All operating referral health care facilities in the country (regional, zonal and national hospitals) regardless of their ownership, i.e. public or private.
Study population: Prospective documentation of IPC implementation in the six hospitals –Bukoba RRH, Maweni RRH, Sekou Toure RRH, Temeke RRH, Benjamin Mkapa Hospital and Mbeya Zonal Referral Hospital, was done. The Assessment using SBM-R tool in those hospitals was followed by implementation of developed action plans by Hospital’s QIT through an IPC Focal Person who chairs an IPC sub-committee that reports to QIT.
Assessment by using the IPCAF – Facility WHO Tool was done in May 2020, as part of efforts to institutionalize IPC skills among the hospital’s IPC sub-committee to oversee IPC implementation. Also, the QITs conducted IPC assessment in the hospital on quarterly basis and the WITs in each department (functional area) conducted assessment in their functional area on monthly basis as part of SBM-R implementation in the respective hospital. In between the assessments, there have been mentorship visit in which IPC standards implementation was assessed using the IPC Hospital Standards Assessment Tool. The mentors worked as facilitators to the QITs, WITs and IPC sub-Committees in helping them to get hands-on knowledge and skills on IPC standards, standard operating procedures, as well as scoring using the tools; which ultimately helped the members of the teams to become champions. Also, qualitative information on the functionality of the QIT, WITs, IPC sub-Committee, as well as Hospital Management Team support to and commitment to IPC practices strengthening was documented, to help understand about possibility of sustaining the teams’ performance [24].
In order to ensure that decisions for strengthening IPC practices both at the facility as well as at national coordination levels are guided by the data collected, both mentors and the QITs and WITs emphasized on the importance of ensuring data quality [40].
Data management and analysis
Data was cleaned and checked for completeness and outliers before analysis. The established scores for compliance of IPC Standards were tested for normality by using the Shapiro Wilk test. We used Wilcoxon Signed-Ranks test for related samples to determine whether there was mean score differences between assessment done using national SBM-R tool and assessment done using IPCAF– Facility WHO Tool [41].
Descriptive statistics, tables and charts were used to summarize the data. Comparison between compliance mean scores between assessments done using the SBM-R tool and IPCAF- Facility WHO Tool were tested by T test; results were considered significant at p < 0.05.
Results
Compliance score of IPC Standards using national IPC standards checklist and IPCAF-Facility WHO tools.
The IPC compliance using the national Tool has revealed 2(33.34%) out of six hospitals had poor compliance of IPC best practices. The remaining 4(66.66%) had moderate compliance. No facility achieved the excellent level; the maximum score of health facilities by using national tool was moderate. Upon using the IPCAF – Facility WHO tool, three hospitals (50.00%) were found to meet the basic compliance level; while two hospitals (33.34%) were on intermediate level and one hospital (16.67%) met the advanced compliance level. The details are shown in figure 2 and table 2 below.
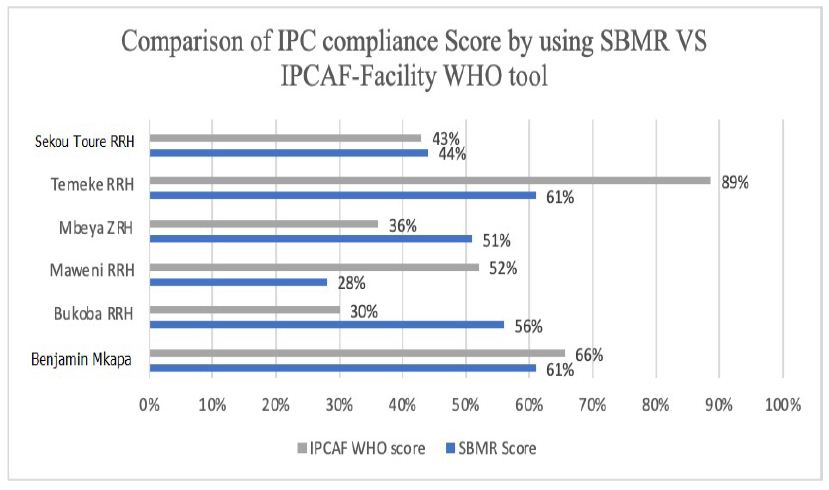
Figure 2: Scores of IPC compliance using national IPC SBM-R tool and IPCAF – Facility WHO tool
Table 2: Scores of IPC compliance using national IPC SBM-R tool and IPCAF – Facility WHO tool
| SN | Health Facility | Score of IPC assessment using Hospital IPC SBM-R standards (TZ) 20-24 January 2020 | Score of IPC Assessment by using IPCAF -Facility WHO Tool) 18 – 23 May 2020 |
| 1 | Bukoba RRH | 56% (Moderate) | 30% (Basic) |
| 2 | Maweni RRH | 28% (Poor) | 52% (Intermediate) |
| 3 | Sekou Toure RRH | 44% (Poor) | 43% (Basic) |
| 4 | Temeke RRH | 61% (Moderate) | 89% (Advanced) |
| 5 | Benjamin Mkapa ZRH | 61%(Moderate) | 66% (Intermediate) |
| 6 | Mbeya ZRH | 51%(Moderate) | 36% (Basic) |
ZRH = Zonal Referral Hospital
Comparison of compliance scores between national IPC standards tool and IPCAF-Facility WHO tool
There was a significant difference between the mean scores done by using national SBM-R tool and IPCAF – Facility WHO tool in all facilities. The details are shown in table 3.
Table 3: Comparison of scores of IPC compliance using national IPC SBM-R tool and IPCAF – Facility WHO tool
| Health Facility | Scores when using IPC SBM-R tool | Score while Using IPCAP WHO tool | Difference Score | 95% Confidence Interval | P-Value |
| Bukoba RRH | 56% | 30% | 26 | 24.74-26.26 | P < 0.0001 |
| Maweni RRH | 28% | 52% | 24 | 23.74-24.26 | P < 0.0001 |
| Sekou Toure RRH | 44% | 43% | 1 | 0.74 – 1.1.26 | P < 0.0001 |
| Temeke RRH | 61% | 89% | 28 | 27.74 – 28.26 | P < 0.0001 |
| Benjamin Mkapa Hospital | 61% | 66% | 5 | 4.74%-5.26 | P < 0.0001 |
| Mbeya Zonal Referral Hospital | 51% | 36% | 15 | 14.74-15.26 | P < 0.0001 |
Discussion
General outcome based on both national SBM-R and the IPCAF for facility-WHO tools
Assessment of IPC practices is key to monitor compliance, provide recommendations and hence improve quality of health care services delivery. Our assessments have delivered valuable insights into the state of art on implementation of key IPC structures and processes in Tanzania. Overall, the data gathered demonstrated that IPC is generally at a moderate level as demonstrated from the national SBM-R and IPCAF-Facility WHO tools. However, the use of IPCAF-Facility WHO tool in some areas revealed presence of all score levels: basic, poor and advanced.
Generally moderate level of IPC implementation was expected by both tools, as Tanzania is classified among the lower middle-income countries according to the World Bank classification. Even though, a considerable low number of participating hospitals which were only six (6), four 66.67% were allocated to merely an “intermediate/moderate” IPC level. This rather surprising finding could either be explained by a very strict interpretation of both National and IPCAF tools.
Besides the differences observed among the six participating referral hospitals in Tanzania with regard to the overall national and IPCAF tool scores, we noticed pronounced differences between facility scores of the respective national and IPCAF sections. Scores for Temeke RRH and Benjamin Mkapa were generally high as gauged by both tools. However, specific questions focusing on low scores of IPC compliance revealed mixed results. Maweni RRH scored low by using national SBM-R tool while Bukoba RRH scored low when using IPCAF -Facility tool.
Outcome based on the national SBM-R tool
The national SBM-R tool, which was structured based on standard and transmission-based precautions, was used to assess the following areas: hand hygiene; decontamination; safe waste management; safe handling of sharps; use of PPE; consider every person is potentially infectious and has risk to succumb infection;
These six hospitals did not consider every person (patient/clients or staff) as potentially infectious and susceptible to infection, hence the health care workers considered only those with clinical features as infectious. That was a risk not only to the healthcare workers but also to other patients/clients, community and the environment.
In healthcare settings, healthcare workers are required to use appropriate hand hygiene techniques. In these six facilities the critical moments to practice hand hygiene was not complied as per the requirement of WHO and the MoHCDGEC [42]. This finding compares with the study in Ethiopia which found that only 14.9% of health care providers in Central Gondar zone public primary hospitals, Northwest Ethiopia, had good hand hygiene compliance [43].
In addition to hand hygiene, healthcare workers are required to wear appropriate Personal Protective Equipment (PPE) whenever they provide healthcare services. However, in all the six hospitals visited, adherence was very low. This assessment is in-line with the study by Okello, et al (2017) which was conducted at St. Mary’s Hospital Lacor in Northern Uganda which found that 2% of healthcare workers do not know the purpose of PPE, 23.7% do not know how to don and doff PPEs, 13.6% do not use PPE even when indicated and 10% are not using an appropriate PPE [44].
In terms of management of sharps. healthcare workers in all the six hospitals visited were compliant in handling sharps appropriately. This includes use of sharps only once, avoiding recapping, and safe disposal in the sharp boxes. A study by Tariku, et al (2016) at Gondar University Comprehensive Specialized Hospital, Northwest Ethiopia found that 76.4% never bent needles with hands, 54.3% avoided removing used needles from disposable syringes, 87.2% placed used sharps in puncture-resistant container at point of use and 58.7% never recapped needles [45]. Handling of waste was low in all six facilities which were similar with the findings found at Gondar University Comprehensive Specialized hospital where level of adherence was 30.2% in segregation of noninfectious wastes in black color-coded dust bin, 34.4% in segregation of infectious medical wastes in yellow color-coded dust bin [45]. Appropriate patient management, and maintaining environmental cleanness, (eg. prompt and careful cleaning up spills of blood and other body fluids after the spill event) is also an area which was assessed and found to have fairly lower score in these six facilities which also happen to be similar to findings from Gondar University Comprehensive Specialized hospital which scored 38.3% [45].
In the six hospitals assessed, processing of instrument was good from cleaning to either sterilization or high-level disinfection; and this was consistent with the findings by Tariku and colleagues who reported compliance with sterilization of all reusable equipment before being used on another patient to be 73.7%. However, processing of linen was not following the standards and hence the linen used in these facilities is changing color from white to brown [45].
Cough etiquette to patients, caregivers and visitors with signs and symptoms of respiratory illness improved a lot. This was due to COVID-19 pandemic where all health facilities were implementing IPC and it was mandatory for everyone going to health facilities to wear a mask and observe cough etiquette.
Implementation of pre- and post-exposure prophylaxis (PEP): In Tanzania, the pre-exposure prophylaxis in the context of IPC in health provision setting is not recommended; however, (PEP) is recommended. The score in this area is low in terms of reporting and use of PEP which is comparable to finding by Maria, et al, (2016) in Tanzania that found that out of 357 health care workers who had a blood exposure in the previous 6 months, only 34% reported it and only 58% were offered PEP [46]. Provision of hepatitis B vaccination is the only vaccine which is given as far as the IPC is concerned. The challenges identified during assessment were lack of vaccine in the facilities and some of the health workers did not complete all the three doses, others had one and others had two doses and only a few had completed all the three as per schedule.
Outcome based on the IPCAF for facility-WHO tool
All the six hospitals were found to have IPC programmes/committees in place that are responsible for overseeing the IPC. In Tanzania these teams are QITs and IPC committees. The IPC subcommittee is a subunit of the Quality Teams. These teams were found to be actively supporting the IPC activities. However, doctors were not active and majority were nurses in these six hospitals. The other challenge of these teams is lack of advanced knowledge of IPC as recommended by WHO [47].
According to data from the assessment using IPCAF tool, the six hospitals had on-site trainers for conducting basic IPC training, as almost all hospitals reported having staff capable of performing basic IPC training. However, the trainers of basic IPC training revealed gaps especially with regard to the regularity of training and the understanding of complicated issues of IPC. The importance of consistent IPC training has been demonstrated in various publications, and given the presence of capable staff on-site, appears feasible in Tanzania hospitals [48].
The IPC guidelines were available in all six facilities. Tanzania has revised its IPC national guidelines to align with the WHO guidelines and other international updates. The guidelines have emphasized the emerging and reemerging infections as well as AMR [17]. The challenges concerning the guidelines were that not all functional areas within the health facilities were provided with the guidelines; and those that had the guidelines had limitations in terms of translating them into practice.
All the six hospitals reported documenting HAIs specifically SSIs. The documentation of the SSIs was an early inception of SSIs surveillance given the increase in awareness on the subject, following recommendations from WHO on the burden of HAIs. We found the area of surveillance to be a big gap in all the six facilities. The data from documentation of SSIs were not analyzed and used in these six facilities as recommended by the WHO [1].
Efforts to strengthen IPC in middle lower-income countries should place emphasis on multimodal strategies [49]. The concept of multimodal strategies is new in Tanzania. Effective implementation of IPC is needed to improve healthcare delivery. However, given the rather low scores obtained by the six hospitals in terms of implementing multimodal strategies in IPC interventions, it appeared that awareness for and implementation of multimodal strategies were not yet fully achieved.
Monitoring/audits of IPC practices and feedback is the area which scored lowest in all facilities. In Tanzania, the QITs /IPC teams are required to do internal assessment, supervision and mentorship. In these six facilities neither monitoring/audits of IPC practices and feedback nor assessments, supervisions and mentorships were done.
No health facility among the six hospitals had achieved standard workload, staffing and bed occupancy. As in many other sub-Saharan African countries, the ratio of healthcare staff to patients, staff work load, and bed occupancy are significantly below standard.
In the hospitals assessed, beds are arranged less than one meter apart and, in some wards, one bed was occupied by more than one patient.
These six hospitals have built environment, materials and equipment for IPC at the facility level though not at the level that national and international standards would require. However, the facilities had ongoing improvement strategy so as to attain the required standards.
Conflict of Interests
There were no conflicts of interest amongst authors.
Disclaimer
The authors alone are responsible for the views expressed in this article and they do not necessarily represent the views, decisions or policies of the institutions with which they are affiliated.
References
Abstract
The COVID 19 pandemic started as a cluster of unexplained pneumonia in Wuhan, China and till now more than 111 million cases have been reported. Due to stringent public health measures, including lockdown strategies, the international travels were tremendously reduced. Hopes rise for end of pandemic as Corona virus vaccinations proved to have high efficacy and the true real-world effectiveness is estimated to be very good. International travels will probably start and the many safety issues should be remembered and emphasized for all travelers and any destination. The most predictable and avoidable travel related illness is infectious diarrhea that may be reduced by simple measures as are hand hygiene, food and water safety and less by antibiotic use or other pharmacologic options.
Keywords
Traveler’s diarrhea, Guidelines, Antibiotics
The COVID-19 pandemic forced tourism to shift from the global to an idyllic local pattern within country’s borders but the Coronavirus vaccination strategies applied all over the world bring the expectation for less travel restrictions.
Travelers’ diarrhea (TD) was the most predictable travel-related illness with rates (30-70%) depending on destination, season, adventurous eating or sexual practices and resulting in unpleasant holiday, hospitalization and eventually prolonged recovery mainly in immunosuppresed patients [1-3].
The etiology is dominated by bacteria (80%-90%), less by viruses and protozoa. Guidelines are published in the Yellow Book by CDC, the International Society of Travel Medicine, providing relevant data, clinical evidence and consensus statements [2,3]. Diarrhea often occurs abruptly and is accompanied by abdominal cramping, fever, nausea, or vomiting. The previous severity definitions based on the number of unformed stools per day were revised by using the relevant criteria of functional impact. This therapeutic approach depending on severity, safety and the effectiveness of treatment classifies TD in: mild (acute diarrhea that is tolerable, is not distressing, and does not interfere with planned activities), moderate (acute diarrhea that is distressing or interferes with planned activities) and severe (acute diarrhea that is incapacitating or completely prevents planned activities). Acute severe diarrhea also includes dysentery (grossly bloody stools) and persistent diarrhea (lasting>2 weeks) [3].
The main exposures, epidemiological entities and etiologies are expressed as:
Any traveler should be advised about the probable exposures, food, water safety and hygiene, and informed about individual and other population consequences related to the travel (dissemination of antimicrobial resistance), the self assessment of disease severity and treatment [3,5].
High-risk destinations (TD incidence >20%) include Africa (exception of South Africa), South and Central America, South and Southeast Asia, Mexico, Haiti, and the Dominican Republic, intermediate-risk destinations (TD incidence 8 to < 20%) include Southern and Eastern Europe, Central and East Asia (including China and Russia), the Middle East (including Israel), South Africa, and Caribbean Islands and low-risk destinations (TD incidence < 8%) include North America, Northern and Western Europe, Australia, New Zealand, Singapore, and Japan [1,6]. Foodborne outbreaks may occur in well developed countries affecting local population and travelers as it happened in Spain in 2019, Listeria monocytogenes was linked to the consumption of domestically produced chilled pork roast from a single manufacturer in the municipality of Sevilla [7].
The incubation period is short for viruses and bacteria (6-72 hours) and much longer for intestinal parasites (1-3 weeks). Untreated bacterial diarrhea usually lasts 3-7 days, viral diarrhea 2-3 days and parasitic enteritis lasts a couple of weeks. Usually, the microbiologic testing is not necessary except for persistent or severe diarrhea in returning travelers (strong recommendation, low/very low level of evidence). Molecular testing may confirm frequent or rare etiologies when needed [2-4]. Klem et al. found that the most frequent long term complication is postinfectious irritable bowel syndrome, 41.9% after enteritis caused by parasites and protozoa, and 13.8% after bacterial infection [8].
There were many studies and meta-analyses upon prophylaxis and treatment options in TD with the conclusion that antibiotics are not to be considered routinely in mild and moderate acute diarrhea [2,3]. No vaccines are available for common enteric pathogens causing TD, except for cholera and typhoid fever. Live attenuated cholera vaccines are recommended to adults, as a single dose given orally with a good efficacy (90% at 10 days and 80% at 3 months). The vaccines are not recommended to immunosuppressed patients, except for asplenic patients or those having chronic kidney disease. The commonly used typhoid fever vaccine is an inactivated Vi capsular polysaccharide vaccine given intramuscularly, in children ≥ 2 years and adults with an efficacy of 50-80%, the booster dose can be given after 2 years after primary vaccination. Both vaccines are recommended only for travelers to high risk regions, unconventional itineraries and housing (Table 1) [2].
Table 1: Treatment options in TD diarrhea [2,3].
|
Treatment |
Grade Practice Recommendation/Level of Evidence |
|
| Acute mild diarrhea | 1. Oral rehydration (sealed beverages).
2. Antibiotics are not recommended. 3. Self treatment may be considered with Loperamide* or bismuth subsalicylate (BSS)**. |
2, 3. Strong recommendation, moderate level of evidence |
| Acute moderate diarrhea | 1. Oral rehydration [sealed beverages, oral rehydration solution (ORS) if dehydration is severe].
2. Loperamide may be considered for use as monotherapy or adjunctive therapy. 3. Antibiotics may be used: azithromycin, fluoroquinolones, rifaximin. |
2. Strong recommendation, high level of evidence.
3. Weak recommendation, moderate level of evidence. |
| Acute severe diarrhea | 1. Oral or parenteral rehydration.
2. Antibiotics should be used. 3. Azithromycin is preferred. 4. Fluoroquinolones or rifaximin may be used. |
2. Strong recommendation, high level of evidence.
3. Strong recommendation, moderate level of evidence. 4. Weak recommendation, moderate level of evidence. |
*Loperamide, 4 mg (2 mg/tb), as soon as possible then 2 mg after each lost stool, maximum 12 mg/day. Not recommended for children <12 years, in febrile or bloody diarrhea [9].
**BSS 524 mg (262 mg/tb) every 30 minutes to 1 hour as needed (maximum of 8 doses/24 hours). Not recommended for children <12 years, pregnant women, travelers taking aspirine or methotrexate [10,11].
Antibiotics in TD
Antibiotic regimens may be combined with loperamide because the anti-motility action is the fastest then completed by the curative antibiotic treatment and there are no more adverse effects with the combined strategy [3,9]. Doxycycline might be recommended for malaria prophylaxis and was associated with lower TD risk, suggesting bacterial enteropathogen susceptibility similar to previous observations and additional benefit in infection prevention [13].
Some studies showed higher rates of extended-spectrum β-lactamase producing Enterobacteriaceae (ESBL-E) if combined therapy (loperamide and antibiotic) was used in TD [3,14]. Arcilla et al. found that the most important predictors for the acquisition of ESBL-E during international travel were: antibiotic use during travel (adjusted odds ratio 2.69, 95% CI 1.79-4.05), persistent TD after return (2.31, 1.42-3.76), and pre-existing chronic bowel disease (2.10, 1.13-3.90) [5]. Ghandi et al. evaluated the patterns of empiric antibiotic self-treatment in international travelers from US using 31 Global TravEpiNet (GTEN) sites (Centers for Disease Control and Prevention sponsored consortium of clinics that provide pretravel health consultations). Between 2009 and 2018 the rate of antibiotic prescription declined steadily from >75%, mainly for fluoroquinolones showing that doctors and travelers are less prone to antibiotic treatment or prevention [15].
TD Prevention
Beyond hand hygiene, sanitation and food safety recommendations, antimicrobial prophylaxis is not routinely considered in international travelers (strong recommendation, low/very low level of evidence) being prescribed only for travelers at high risk of health-related complications of TD (strong recommendation, low/very low level of evidence). The most commonly recommended antibiotic is rifaximin which has an excellent safety profile [3,4,12].
BSS (two tabs 4 times a day) may be used for prophylaxis and can reduce the incidence of travelers’ diarrhea by almost half, though it should be avoided in children and pregnant women due salicylate side effects (strong recommendation, high level of evidence) [3,10,11]. Regarding probiotics and prebiotics there is insufficient evidence to recommend their use as preventive or treatment measure in TD. A recent systematic Cochrane review found that probiotics may not affect the duration of diarrhea [16].
Foodborne and waterborne infections, may be severe in immunocompromised people. Travelers with liver disease should avoid direct exposure to salt water that may expose them to Vibrio spp., and all immunocompromised hosts should avoid raw seafood. Drug interactions should be evaluated before considering antibiotic prophylaxis or self treatment. Fluoroquinolones and rifaximin have significant interactions with antiviral HIV treatment. Macrolides may have significant interactions with antiviral HIV medication and transplant-related immunosuppressive drugs. Fluoroquinolones and azithromycin in combination with calcineurin inhibitors and mTor inhibitors (tacrolimus, cyclosporine, sirolimus, everolimus) may cause prolonged QT interval [2].
With or without COVID-19 vaccine passports, probably more and more people will travel all over the world in the next years needing protection for the most frequent unpleasant event during the travel, TD. Somehow, a blessing in disguise, the COVID-19 pandemic imposed the highest hygiene rules and probably lower rates of infectious diarrhea in international travelers will be observed.
Author Contributions
Concept and writing of the manuscript (A.R.). The author approved the final version of the manuscript.
Funding
No external financial support was received.
Conflict of Interest
Nothing to declare for the author.
References
Abstract
Background: Due to the delayed communication by Chinese authorities and International bodies, it is difficult to settle when COVID-19 pandemic has started. Italy has been the first country outside Asia to experience the spreading of SARS-CoV-2 among general population, but it is possible that some patients had already developed the infection, before the first Italian official case was confirmed at the end of February.
Methods: We have performed a specific analysis from 1st August 2019 to 29th February 2020 on Google Trends, which is a publicly available tool that compares the volume of Internet searches concerning specific queries in different areas and periods. The analysis was retrospectively extended up to 5-years in order to study the seasonality of Google Trends’ search volumes in relation to potential COVID-19 symptoms.
Results: Our analyses concerning researchers on the Internet support the evidence that the outbreak onset in Italy could be set some weeks before the first confirmed case, maybe before flights closure between Italy and China imposed at the end of January 2020.
Conclusions: Internet-acquired data might represent a preliminary real-time surveillance and alert tool for healthcare systems to plan the most appropriate responses in case of health emergency such as COVID-19 pandemic.
Keywords
COVID-19; Symptoms; Internet; Web; Searches; Google trends
Introduction
The huge amount of searches run through Google creates trends data that can be analyzed by a specific function named “Google Trends” (GT), a publicly available tool that compares the volume of Internet searches concerning specific queries in different areas and periods [1]. Individuals affected by any clinical condition frequently use search engines, such as Google, to look for terms related to their diseases, possible causes and symptoms [2]. In this view, Google Trends can provide indirect approximations of the burden and symptoms of several diseases, so that they have been used for preliminary epidemiological surveillance purposes [2]. Google Trends can integrate and lead up to traditional surveillance systems in early stage detection of seasonal or annual outbreaks of infectious (i.e. influenza, scarlet fever, HIV) and non-infectious (i.e. cancer, epilepsy) diseases, presenting specific search patterns in different parts of the world [2].
Google Trends had positively been associated with the disease prevalence in many COVID-19 studies [3]. Accordingly, researchers hypothesized that this kind of “digital epidemiology” could come up with valuable insights into the spread of viral infections. We have specifically applied this methodology to evaluate the onset of COVID-19 outbreak in Italy, the first country in Europe to experience the spreading of coronavirus SARS-COV2. Italy was also the first country to impose a nationwide lockdown since Wuhan outbreak (February, 2020). Several clinical and epidemiological studies have been presented on the prevalence of COVID-19, but it is possible that some patients had already developed the infection although it was not specifically diagnosed before the first official case, confirmed in Italy at the end of Febraury [4]. Overall, the coronavirus activity has been associated with specific seasonal patterns in relation to other viral diseases such as influenza [3]. The aim of this work was to predict, through Google Trends, the amount of searches referring to COVID-19 related symptoms in Italian population that can be inferred from Internet-based searching before the first COVID-19 confirmed case in an Italian native patient.
Materials and Methods
We have used the publicly available tool “Google Trends” to determine the amount of searches concerning COVID-19 related symptoms from March 2015 to August 2020 performed by Italian users of Google engine. Search queries were ranged simultaneously into three blocks (most common, less common and severe) as listed by WHO [5]. The search was performed in Italian language to take into account only data belonging to people living in Italy. The first block was related to ‘most common symptoms’ and included: fever (in Italian: ’febbre’), tiredness (in italian: ’spossatezza’), and dry cough (in italian: ’tossesecca’). The second block concerned ‘less common symptoms’ corresponding to: rash(in italian: ’eruzione cutanea’), taste (in italian: ’gusto’), headache (in italian: ’mal di testa’), sore throat (in italian: ’mal di gola’), smell (in italian: ’olfatto’). The third block concerning ‘severe symptoms’ included: loss of voice (in italian: ‘afasia’), chest pain (in italian: ’dolore al petto’), muscles pain (in italian: ’dolori muscolari’), shortness of breath (in italian: ’fiatocorto’) [5,6].
Google Trends tool uses a fraction of searches for a specific term (‘keyword’ or ‘search term’) and automatically standardizes the data for the total number of searches gradually presenting them as comparative search volumes (ranging from 0 to 100), in order to compare variations of different search terms across time series and queries (topics in which the word was searched) [2]. Search volumes about COVID-19 symptoms were extracted from July 2015 to August 2020. The selection of the retrospective 5-years did not represent a random selection as it is bound by the extraction limits of the GT tool. Indeed, trends for periods equal or less than 5 years, are collected by days. This method allows for greater evidence than the monthly-based analysis. Scores, recorded per each day, are based on the absolute search volume for each term and day, being related to the absolute search volume on Google on the same day. Subsequently, GT was adjusted for the annual rate variation (provided by Italian Institute for Statistics, ISTAT) for the age groups showing the highest probability to use Internet (14-74 years old). Thus, for statistical purposes, the terms were aggregated by mean estimator to assess researches concerning COVID-19 ‘most common’, ‘less common’, and ‘severe’ symptoms performed by Italian Internet users.
The study includes three statistical analyses:
Main Analysis
As main analysis, an interrupted time series analysis (ITS) was used to examine the effect of coronavirus on Google searches for terms describing symptoms potentially related to COVID-19. Google Trends data were seasonally adjusted and analyzed by using auto-regressive integrated moving average (ARIMA) modelling. The implementation of the exposition was very clear with a ban on searches of symptoms terms throughout Italy across six months from August 2019 (estimated time when the virus was circulating yet) to February 2020 (the month before the first COVID-19 confirmed case in Italy, which actually occurred at the end of February) . As “control group”, we used Internet-based searches that presented the same characteristics of the exposures during continuous period (from March 2015 to July 2019), in order to evaluate the trend changes to the breaking point (F-value test). A model stratified by calendar months was adopted to control seasonality effects. The method includes a bootstrap model by default, which runs 250 replications of the main model with randomly drawn samples. A trimmed mean F-value (10 percent removed) is reported and a boot strapped p-value was derived from it. As exploratory analysis, a generalized linear models (GLM) was adapted to assess the trend peaks of epidemics.
Exploratory Analysis
The exploratory analysis was performed to study the seasonality of Google Trends’ search volume in Italy about potential COVID-19 from August 2019 to August 2020, and evaluate possible differences in relative search volumes for ‘most common’, ‘less common’ and ‘severe’ symptoms across different months, adjusted by years and during the last year since the pandemic. According to the date of the first infected with COVID-19 in Wuhan, the month of December 2019 was considered as reference month. The results were presented as rate ratio and 95% confidence intervals (CIs). Finally, cycle plots were built to show the GLM results and their monthly trends. The vertical positions of the inserted subseries plots indicate the average searches per month. The subseries plot was made up considering monthly trends fit of the y-variable (response variable) and its confidence band; the horizontal axis shows the mean y-value over the considered time interval.
Adherence Analysis
An adherence score, stratified by symptoms’ type, was provided to describe the degree to which Internet users correctly searched terms matching the study topic. The score was computed as the total of the queries that met the study objective on the total of the queries for each type of symptoms (ex: researches related to the ‘superenalotto’ topic are considered not adhering to the objective of the study).
SAS and R studio software have been used for data processing and statistical analyses. Results have been considered statistically significant if p<0.05.
Results
The results are presented in three sub-sections (Most common symptoms, Less common symptoms, Serious symptoms). Then the main analysis and the exploratory analysis are described for each category of symptoms:
Most Common Symptoms
The ‘most common’ symptoms had a positive and significant variation in the exposure group (Internet users’ searches from 1st August 2019 to 29th February 2020) than the control group (p<0.001; F-value=1.69). The Google Trends plot of key terms from February 2018 to April 2019 versus search volumes from February 2019 to April 2020 showed how the interest was considerably higher during the COVID-19 pandemic compared to the peak of previous annual flu outbreak (Figure 2A).
The exploratory analysis (under α=0.05)–performed using as reference the month of December, 2019 adjusted by year–showed a significant increased probability from 2019 to 2020 concerning the search volumes in January 2020 (p=0.018;OR=1.67; CI=1.09-2.55), February 2020 (p=0.003;OR=1.91; CI=1.26-2.91), March 2020 (p=0.002; OR=1.96, CI=1.29-2.99), June 2020 (p=0.007; OR=1.78; CI=1.68-2.71) and July 2020(p=0.008; OR=1.75; CI=1.15-2.67), and confirmed the peak between the end of February 2020 and the beginning of March 2020 (Figure 1A).
Less Common Symptoms
The ‘less common’ symptoms showed a positive and significant variation in the exposure group (users research from 1st August 2019 to 29th February 2020) than the control group (p<0.001; F-value=1.63). The Google Trends plot of key terms from February 2018 to April 2019 versus search volumes from February 2019 to April 2020 showed how the interest was considerably higher during the COVID-19 pandemic compared to the peak of previous year flu outbreak (Figure 2B).
The exploratory analysis (under α=0.05)-performed using as reference the month of December 2019 adjusted by year-showed a significant decreasing probability from 2019 to 2020 concerning the search volumes in January 2020(p=0.005; OR=0.62; CI=0.39-1.00), April 2020 (p=0.034; OR=0.60; CI=0.37-0.96), May 2020 (p=<0.001; OR=0.38; CI=0.22-0.65), June 2020 (p=<0.001; OR=0.32, CI=0.19-0.56) and July 2020 (p=<0.001; OR=0.34; CI=0.19-0.58) and reported the peak between the end of February and the beginning of March 2020 (Figure 1B).
Severe Symptoms
The ‘severe’ symptoms showed a positive and significant variation in the exposure group (Internet users’ searches from August 2019 to February2 020) than the control group (p<0.001; F-value=0.54). The Google Trends plot of key terms from February 2018 to April 2019 versus search volumes from February 2019 to April 2020 showed how the interest was considerably higher during the COVID-19 pandemic compared to the peak of previous year flu outbreak (Figure 2C).
The exploratory analysis (under α=0.05) performed using as reference month December 2019adjusted by year, showed a significant increased probability from 2019 to 2020 concerning the search volumes in February (p=0.048; OR=1.34; CI=1.00-1.78), March 2020(p=<0.001; OR=1.82, CI=1.31-1.54) and April 2020 (p=0.018; OR=1.42; CI=1.06-1.91) and reported the peak between the end of February 2020 and the beginning of March 2020 (Figure 1C).
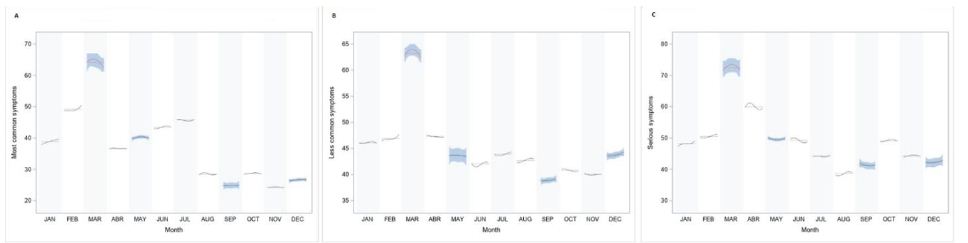
Figure 1: Cycle plot by monthly average GT search for Most common symptoms (A), Less common symptoms (B) and Serious symptoms (C). *Subseries shows the spline fit of search terms in each month.
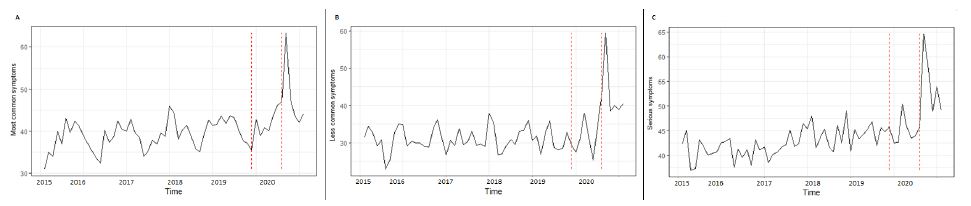
Figure 2: Interrupted time series of GT search for Most common symptoms (A), Less common symptoms (B) and Serious symptoms (C).
Discussion
In the last decade, growing evidence has been made available that Google Trends analyses may be a reliable tool for providing estimates of awareness about many diseases and treatments, which are parallel to real-world epidemiology of diseases and drug use data. This study is the first analysis concerning web search behaviours related to the coronavirus outbreak, both in quantitative and qualitative terms, aimed at assessing the time of COVID-19 onset in Italy. Additional objective of the study was to evaluate and possibly validate the epidemiological reliability of Google Trends in different non-clinical settings, for less common, most common and severe symptoms attributable to COVID-19.
Our findings confirmed how the virus may have been spreading in Italy some weeks before the first Italian native case was officially detected. Indeed, the GT symptom terms potentially related to COVID-19 (based on 250 bootstrap simulations) increased significantly in the exposure group (searches performed from 1st August 2019 to 29th February 2020) compared to the control group (users’ trends of the 5-year time series). Moreover, Google Trends for ‘less common’ ‘and ‘most common’ symptoms presented higher significant association (F-value=1.68 and 1.63, respectively) than severe symptoms (F-value=0.58) considering the exposures as reference group (August 2019 to February 2020). The reasons of these differences could be explained by the fact that ‘common’ terms (such as ‘less’ and ‘most’) considered in this analysis represent a kind of basic noisy as they are very similar to flu-like symptoms than terms used in searches concerning severe ones (such as loss of voice, chest pain, muscles pain and shortness of breath). It is also possible that the virus was initially carried by one or more people with negligible symptoms (mostly related to ‘most common’ and ‘less common’ GT term symptoms) some weeks before the outbreak.
The exploratory analysis of the results reinforces the thesis that the virus could be present in Italy several weeks before the lockdown (March 5th 2020): the ‘less common’ symptoms are more significant in the month of December 2019 than March 2020, which appears to be the peak of the pandemic (Figure 1). As highlighted in other studies [7,8], the ‘less common’ symptoms, such as loss of taste and loss of smell, are the most frequent clinical symptoms (about 90% of cases) in COVID-19 patients. Very recently, a young football player living nearby Lodi (the city where the first official Italian native case was coming from) has been proposed as the possible first documented case, as he showed SARS-COV-2 antibodies (identified on subsequent serum analyses) and severe COVID-related symptoms requiring admission to Intensive Care Unit at the beginning of February 2020, namely three weeks before the hospital admission of the first official Italian native case.
Furthermore, the temporal distribution of web-data seems consistent with the clinical trend of the pandemic: relative search volumes for ‘less common’ (Figure 2A), ‘most common’ (Figure 2B) and ‘severe’ symptoms (Figure 2C) in the period 2019-2020 were positively associated and presented a similar monthly sinusoidal pattern as previously shown in clinical studies evaluating the COVID-19 spread in Italy [9]. This was in line with the trend of hospitalizations in Italy recorded in the same months [9]. Also the spreading of the coronavirus by number of infections in the months of June, July and August 2020 is estimated to be higher than December 2019 (Figure 1B).
Nevertheless, our study has some limitations: the main one is that search volumes of Google Trends are frequently found to be increased in case of conditions with large media coverage or, at least, during periods characterized by a higher burden of disease, so that they are gaining attractivity in surveillance studies on several epidemiologically relevant diseases [10]. This is the case, for example, of coronavirus symptoms, which were the focus of large media coverage in the last months. Another limitation could be that search trends might be produced by people other than patients with COVID-19, who are nevertheless interested about this topic. Furthermore, available data are clearly limited to Google users, and are related to the possibility to use a computer with Internet access, as well as by computer literacy and skills. Therefore, a non-representative sampling bias might have occurred due to different factors, such as age, disability, income or preferred search engine [11]. To overcome this problem, the adherence analysis confirms the consistency between the terms analyzed in the study and the topics related to Covid-19. Google Trends queries related to the terms analyzed during the exposure period were highly adherent to the objective of the study (Table 1: ‘most common’ score=91.9; ‘less common’ score=82.4; ‘severe’ score=91.9). Despite this, in some cases, search biases may be found such as in the case of fever, sore throat, headache, loss of smell or taste and loss of voice (Table 1).
Table 1: Adherence scores of Google trends queries by types and terms related to COVID-19 symptoms during the exposure period (August 2019 to February 2020).
|
Type |
Term | Query* | Query Rate | StudyObjective | Adherence Score |
| Most Common |
Fever |
Influenza 2020 sintomi |
High | Yes |
91,9% |
|
Influenza 2020 durata |
High | Yes | |||
| Codici superenalotto la febbre del sabato sera | High |
No |
|||
|
Influenza senz afebbre 2020 |
High | Yes | |||
| Dopo quanto tempo fa effetto la tachipirina | High |
Yes |
|||
|
Tiredness |
spossatezza cause |
60% |
Yes |
||
|
Drycough |
Selentus sciroppo tosse secca |
High | Yes | ||
|
Sedativo tossesecca |
130% |
Yes |
|||
|
Tossesecca e grassa |
90% | Yes | |||
| Aereosoltossesecca | 70% |
Yes |
|||
|
Sciroppo per tossesecca |
60% |
Yes |
|||
|
Less Common |
Rashon skin |
Eruzionecutanea o rash | High |
Yes |
82,4% |
|
Taste |
Perditaolfatto e gusto | 100% |
Yes |
||
|
Hedache |
Mal di testa elodie |
High | No | ||
| Mal di testa pre ciclo | High |
Yes |
|||
| Mal di testa tutti i giorni | 160% |
Yes |
|||
|
Tachipirina 1000 |
130% | Yes | |||
| Svegliarsi con il mal di testa | 130% |
Yes |
|||
|
Sore throat |
Nenuco mal di gola |
High | No | ||
| Okitask | High |
Yes |
|||
|
Rimedio naturale mal di gola |
180% |
Yes |
|||
|
Rimedi naturali per il mal di gola |
110% | Yes | |||
| Mal di gola e raffreddore | 100% |
Yes |
|||
|
Smell |
Smell |
100% | Yes | ||
| Olfatto | 86% |
Yes |
|||
| Smelltraduzione | 19% |
No |
|||
|
Perditaolfatto |
8% | Yes | |||
| Olfattocane | 5% |
Yes |
|||
|
Severe |
Lossofspeach |
Afasiasinonimo |
High |
No |
91,9% |
| Afaisa primaria progressiva | 200% |
Yes |
|||
|
Afasia motoria |
180% |
Yes |
|||
|
Chestpain |
Dolore in mezzo al petto |
130% | Yes | ||
| Dolere al petto cause | 60% |
Yes |
|||
|
Dolore petto e schiena |
40% |
Yes |
|||
|
Muscules pain |
Tachipirina dolori muscolari | 70% |
Yes |
||
|
Shortnessofbreath |
Fiato corto cause |
100% | Yes | ||
| Fiato corto e tosse | 83% |
Yes |
|||
| Fiato corto cuore | 65% |
Yes |
Conclusions
This study provides additional evidence for seasonality of COVID-19 by using Google Trends. In light of our results, we have proposed a method for the right use of Google Trends to predict the pandemic’s trend. This method can serve as a baseline standard to ensure methodological understanding and reproducibility for researchers who choose to use the tool in the future for other countries or regions. In fact, a future approach could be to compare the results between countries or regions and investigate possible correlations with environmental conditions [11]. Internet-acquired data might represent a preliminary real-time surveillance tool and an alert for the care systems to plan the most appropriate resources in specific periods in case of health emergency such as epidemics or pandemics [2]. However, our results support the evidence that the beginning of the outbreak in Italy were probably seeded weeks before the first detection and possibly before the first COVID-19 patient detected and also before the flights closure between Italy and China were suspended at the end of January 2020. As a future perspective, COVID-19 related to Google Trends might be validated with external clinical data sets.
Author Contributions
Conceptualization, A.F. and P.P.; methodology, A.F.; software, A.F.; validation, P.A., P.P. and M.C.; formal analysis, A.F.; investigation, A.F.; resources, A.M.; data curation, P.P.; writing—original draft preparation, A.F and P.P.; writing—review and editing, G.I.; visualization, P.A.; supervision, A.M.; project administration, A.M.; All authors have read and agreed to the published version of the manuscript.
Funding
This research received no external funding.
Conflicts of Interest
The authors declare no conflict of interest.
References
Abstract
People going through the United States (US) criminal justice system often exhibit multiple behaviors that increase their risk of HIV infection and transmission. This paper examined the pattern of co-occurring HIV risk behaviors among male jail detainees in the US. We conducted multivariate analyses of baseline data from an HIV intervention study of ours, and found that: [1] cocaine use, heroin use and multiple sexual partners; and [2] heavy drinking and marijuana were often co-occurring among this population. From pairwise analyses, we also found that [1] heroin and IDU [2] unprotected sexes with main, with non-main, and in last sexual encounter were mostly co-occurring behaviors. Further analyses of risk behaviors and demographic characteristics of the population showed that IDU were more prevalent among middle ages (30-40) and multiple prior incarcerations, and having multiple sex partners was more prevalent among young males younger than 30 years, African American race, and those with low education. Our findings suggest that efficient interventions to reduce HIV infection in this high-risk population may have to target on these behaviors simultaneously and be demographically adapted.
Keywords
HIV risk, Co-occurring behaviors, Correctional facilities, Male jail detainees
Introduction
Over seven million people passed through the criminal justice system in the United State (US) in year 2012 [1]. Among this population, it was estimated that about 2% was infected with HIV including those unaware of their infection [2-4] — as a contrast, the prevalence among the US adult population is around 0.3% according to the US Centers for Disease Control and Prevention (CDC). The prevalence of HIV infection within jails and prisons was estimated to be about 3 to 6 times higher compared with that among non-incarcerated populations [4-8].
The reasons for this increased burden of HIV among populations in correctional settings are multi-factorial and include increased rates of substance abuse, mental illness, poverty and health disparities [9]. Persons who interact with the criminal justice system may be disenfranchised from health services in the community, such as screening programs. That makes the time of incarceration an important public health opportunity to provide HIV prevention and testing services and linkage to care [10-12].
The time period preceding incarceration has been shown to be characterized by increased substance use and risky sexual behaviors that increased exposure to HIV, viral hepatitis, and other transmitted diseases [13-18]. Release from correctional facilities might also be a time of high-risk of acquiring or spreading infections as persons re-entered their communities and resumed risk behaviors [19-21]. Thus, correctional-based HIV counseling and testing programs and prevention interventions may help to decrease their risk behaviors following release from the correctional environment and therefore reduce new HIV infections in this as well as the general population.
Although studies have documented prevalent (direct and indirect) HIV risk behaviors before entering jail (including heavy drinking, substance abuse, sexual promiscuity, and unprotected sex) [19-26] there is limited understanding of the interrelationships among these risk factors. To effectively target prevention interventions to persons at the greatest risk of HIV infection among this population, it is critically important to understand their risk profiles and quantify which risk behaviors are more likely to co-occur. In this paper, co-occurring behaviors are defined as behaviors that occur within certain time period (e.g. a 3 months window) and not necessarily always in the same episode (i.e. concurrently). This definition is consistent with the need of broader interventions on behaviors that are predictive of (not necessarily determinative of) each other and jointly place an individual at a higher risk of HIV infection.
In this paper, we conducted a secondary analysis of data from a study on HIV counseling and testing in jail [27]. Specifically, we used the baseline data of the study to investigate: 1) whether certain risk behaviors were co-occurring and to what extent, and 2) whether risk behaviors were prevalent among people with certain demographic characteristics.
Methods
Prior Study and Data
We previously conducted a two-arm randomized study [27] to assess HIV risk behaviors among males entering the Rhode Island Department of Corrections (RIDOC) jail and compared the efficacy of two methods of HIV counseling and testing (conventional versus rapid HIV testing) with respect to reducing post-release HIV risk behaviors. A total of 264 HIV-negative males met the study enrollment criteria, provided the written informed consent, were recruited within 48 hours of incarceration, and completed the study. The study was approved by the Miriam Hospital institutional review board, the Rhode Island Department of Corrections (RIDOC) Medical Research Advisory Group, and the Office for Human Research Protections of the Department of Health and Human Services. More details of the study are available elsewhere [27].
In this paper, we focused on data that were collected at the baseline of the study, including demographic information and self-reported HIV risk behaviors during 3 months prior to incarceration. The self-reported risk behaviors were collected using a written quantitative behavioral assessment survey on participant’s recent drinking, substance use behaviors (cocaine use, heroin use, marijuana use, injection of any drug) and sexual behaviors (multiple sexual partners, unprotected sex at last sexual encounter, unprotected sex with main partner, and unprotected sex with non-main partner). Because only data at the baseline prior to intervention randomization were used in this paper, we did not distinguish study participants by their study arms.
Statistical Analyses
We conducted three sets of statistical analyses, outlined as follows:
Analysis I
The co-occurrence of two risk behaviors (pair-wise analysis) was assessed using logistic regressions where one behavior (Behavior 1) was used as the dependent variable, and the other behavior (Behavior 2) as an predictor variable. The results are shown in Table 1. All regressions were adjusted for the following demographic covariates: age (categorized as <25; 25 ∼ 30; 30 ∼ 40; and > 40 years), race (Caucasian; Black; Hispanic; others), number of prior incarcerations (dichotomized at median: < 7; ≥ 7), length of incarceration as severity index of crime leading to incarceration (<2 wks; 2 wks ∼ 1/2 yr; > 1/2 yr), and education (did not finish high school; otherwise).
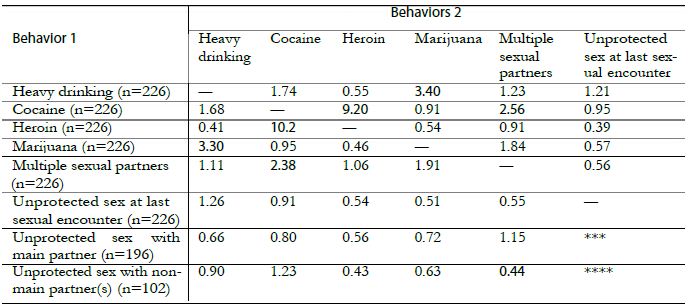
Table 1: Pair-wise association among risk behaviors.

(a) The table is not symmetric because the analyses are adjusted for the following covariates as predictors of Behavior 1: age, race, prior incarcerations, length of incarceration, and education.
(b) The numbers in parentheses are sample sizes.
(c) Bold indicates a p-value < 0.05 and italic < 0.10.
Pair-wise co-occurring risk behaviors were quantified using odds ratios (ORs), where an OR > 1 (OR < 1) suggests that the existence of one behavior was predictive of the existence (or absence) of the other behavior.
We used the available complete data for assessing risk behaviors, so the analysis sample size varied (range: 73-256 as in Tables 1 and 2). The overall missing data on risk behaviors were moderate (<5%), if we did not count systematic missingness as missing values (e.g. Missing sexual behaviors for those without sexual partner). Throughout, we made the missing at random (MAR) assumption [28]; that is, we assumed that with the same demographic profile, those who provided complete answers to the baseline questionnaire had engaged in similar risk behaviors as those who did not [29].
Table 2: Multivariate analyses of co-occurring risk behaviors.
(a) The table is not symmetric because the analyses are adjusted for the following demographic covariates: age, race, prior incarcerations, length of incarceration, and education.
(b) The numbers in parentheses are sample sizes.
(c) Bold indicates a p-value < 0.05 and italic < 0.10.
(d) *** “Unprotected sex at last sexual encounter” is not included as a predictor variable in the model.
Analysis II
Multiple co-occurring risk behaviors were assessed using multivariate logistic regressions where one risk behavior (Behavior 1) was used as the dependent variable and other behaviors (Behaviors 2) as predictor variables. The results are shown in Table 2. Similar to Analysis I, the co-occurring of Behavior 1 with other behaviors was characterized by ORs, which have similar interpretations except that the ORs in Table 2 are conditional ORs after accounting for all other behaviors of (Behaviors 2). Again, all analyses were adjusted for the same set of demographic characteristics as in Analysis I. When heavy drinking, cocaine, heroin, marijuana and multiple sexual partners were used as dependent variables, we excluded the risky behaviors ‘unprotected sex with main partner’ and ‘unprotected sex with non-main partner’, because they only applied to subsets of study participants with sexual partners and including them would reduce the sample size by half and reduce the analysis power. When ‘unprotected sex with main partner’ and ‘unprotected sex with non-main partner’ were used as the dependent variables, ‘unprotected sex at last sexual encounter’ was excluded from predictor variables because the later behavior strongly correlated with the former behaviors and therefore overwhelmed the associations of the former two behaviors with other risk factors. IDU was excluded from the analysis because the prevalence of injection drug use was low (overall 8%) leading to sparse data for multivariate analysis and unreliable estimates due to collinearity of heroin use and IDU [30].
Analysis III
Further, we examined the associations between HIV risk behaviors and various demographic characteristics using logistic regressions, where each risk behavior was used a dependent variable and predictor variables included: age, race, the number of prior incarcerations, length of incarceration as severity index of crime leading to incarceration, and education. The predictor variables were categorized in the same way as in Analyses I and II. The associations of each risk behaviors and certain demographic profiles were characterized by ORs.
Data were extracted and prepared using Access 2003 [31]. All analyses were conducted using the statistical program R [32]. Analysis lack of fit was assessed using Hosmer-Lemeshowtests. Statistical significance was set at a p-value < 0.05.
Results
Among the 264 male HIV-negative participants, the median age was 30 years (range 18-65); the majority was Caucasian (52% Caucasian, 22% Black, 14% Hispanic, 12% others); 51% did not finish high school; and the median number of lifetime incarcerations was 6 (range 1-200). Within the prior 3 months before incarceration, 103 (39%, data not available (NA) = 1) were heavy drinkers; 27 (10%, NA = 1) used heroin; 100 (38%, NA = 1) used cocaine; 161 (61%, NA = 1) used marijuana; and 22 (8%, NA = 1) had injected any type of drug. For the same time period, 203 (77%) had a main sexual partner and of those 170 (84%, NA = 1) never used a condom; 111 (42%) had a non-main sexual partner and of those 37 (36%, NA = 3) never used a condom; 81 (31%) had both main and non-main sexual partners; 61 (26%, NA = 4) had multiple (≥ 3) recent sexual partners; and 233 (90%, NA = 4) did not use a condom at last sexual encounter.
In Analysis I, cocaine use was found to be highly predictive of heroin use (OR = 5.21 with a 95% confidence interval (CI) of 1.8-15), IDU (OR = 6.65, CI = 1.9-23), and multiple sexual partners (OR = 2.45, CI = 1.1-5.3); see Table 1. Heroin use and IDU were mostly co-occurring, suggesting that injection might be the preferred route of heroin use. Heavy drinking and marijuana use were predictive of each other (OR = 2.88, CI = 1.6-5.3). Participants who had unprotected sex with their main and non-main sexual partner(s) were more likely to have unprotected sex at last sexual encounter (OR = 25.7, CI = 9.1-73.0 and OR = 88.6, CI = 15-200, respectively). Notably, unprotected sex with main partner and with non-main partner(s) was likely to co-occur (OR = 6.43, CI = 1.56-78.8). In terms of protective behaviors, participants who reported IDU and those with multiple sexual partners were found to be more likely to use condoms at “the last sexual encounter”, though this finding was marginally statistically insignificant (p-values = 0.08 and 0.07, respectively).
In Analysis II, we found that (1) cocaine use, heroin use, and multiple sexual partners, and (2) heavy drinking and marijuana use were mostly co-occurring (Table 2). Heavy drinking and marijuana use were highly predictive of each other (OR = 3.40, CI = 1.7-7.1). Cocaine use was predictive of heroin use (OR = 9.20, CI = 2.7-38.7) and multiple (≥ 3) sexual partnerships (OR = 2.56; CI = 1.1-6.0).
The analyses that examined the relationships between risk behaviors and demographic characteristics (Analysis III) showed that male jail detainees with age between 30-40 were more likely to abuse cocaine (OR = 8.6, CI = 3.5-23.2), heroin (OR = 4.7, CI = 1.2-23.7), and IDU (OR = 2.8, CI = 1.2-6.9). Younger males with age <30 were more likely to abuse marijuana (OR = 3.8, CI = 2.2-6.9) and had multiple sexual partners (OR = 2.1, CI = 1.2-3.8). African American were more likely to have multiple sexual partners (OR = 3.7, CI = 1.8-7.9), but less likely to engage in unprotected sex in last sexual encounter (OR = 0.3, CI = 0.1-0.6), with main partner (OR = 0.3, CI = 0.1-0.9) and non-main partner(s) (OR = 0.1, CI = 0.03-0.4). Having more than 7 prior incarcerations was predictive of heavy drinking (OR = 1.8, CI = 1.1-3.2), cocaine use (OR = 2.5, CI = 1.4-4.6), and IDU (OR = 2.9, CI = 1.1-7.7). Finishing high school was predictive of having less sexual partners (OR = 0.5, CI = 0.3-0.9) but more likely engaging in unprotected sex in last sexual encounter (OR = 3.3, CI = 1.6-7.2) and with main sexual partner (OR = 3.2, CI = 1.3-8.0).
Discussion
Our results indicate that males entering jail exhibit high rates of substance use and sexual risk behaviors that increase their risk of HIV and other infectious diseases. Our study adds to the existing literature by demonstrating high risk behaviors among incarcerated populations and by highlighting whether certain risk behaviors are more likely to be co-occurring thus compounding risk for HIV infection.
Particularly from our pairwise and multivariate analyses, we find that cocaine is co-occurring with several other risk behaviors including heroin use, injection drug use, and multiple sexual partners. Cocaine use has been reported to not only increase the probability of HIV transmission, but also the potential of poor health outcomes in those living with HIV infection [22,33-35]. Given that there is currently no pharmacotherapy based intervention for cocaine addiction as there is for opiate addiction, our study supports the need of developing behavior-based interventions for cocaine abuse that is appropriate for incarcerated populations in addition to addressing opiate use and risky sexual behaviors. Since jail incarcerations may be as short as several days, behavioral interventions such as contingency management (CM) [36-39] may provide immediate reinforcement for abstinence from cocaine use, and cognitive behavioral interventions that are paired with CM upon release may offer a bridge for continued abstinence following community re-entry [40]. However, these interventions have not been implemented among incarcerated populations [41].
The finding that unprotected sex with main partner is co-occurring with unprotected sex with non-main partner(s) is another important finding, as this suggests that some participants could be involved with concurrent sexual relationships. Concurrent sexual partnerships in incarcerated populations have been reported in several studies [42-46]. Further accounting for concurrent sexual partnerships (and social/sexual networks) in our analyses would strengthen our conclusions, but unfortunately as one limitation of this paper, collecting concurrent behaviors data is not a focus of our original study.
Heavy alcohol use and marijuana use are common substances used by this population and found to be mostly co-occurring. Previous findings with younger incarcerated men [47] suggested that prior to incarceration, the use of marijuana alone and alcohol alone increased the likelihood of multiple sexual partners (i.e. 3 or more) and when in used in combination, sexual HIV-risk behaviors and inconsistent condom use behaviors with female partners increased. Similar finding also can be found in [15,48]. Comparable to other drugs of abuse, alcohol and marijuana use can impair judgment thereby preventing safer sex behaviors, and hence remain an important domain for intervention.
This paper has several limitations. The risk behavior data were self-reported which might have introduced bias and possibly an underreporting of risk behaviors given the environment in which participants completed the questionnaire. Our findings are not generalizable to incarcerated women or the entire population, because it is known that incarcerated women have a different rate of HIV infection and other transmissible diseases compared to men. The study sample size is limited and study participants are restricted only to those at the RIDOC, which limits our analysis power to identify all co-occurring risk behaviors.
As the U.S. incarceration population continues to grow and disproportionate rates of HIV infection continue to rise among incarcerated individuals, the implications for intervention are important and imperative. Jails provide a unique opportunity for structural interventions for this high-risk population. The results of this study offer more insight into the risk behaviors of males entering the RIDOC jail, and elucidate the educational, counseling, and intervention needs of men at risk for HIV infection within the criminal justice system.
Sources of Funding Support
The research is supported by the Providence/Boston Center for AIDS Research (grant P30AI42853). Dr. Pinkston’s work is partially supported by a National Institute of Mental Health grant (5R01MH084757).
Conflicts of Interest
The authors declare that there is no conflict of interest regarding the publication of this paper.
References
Abstract
The paper presents the use of an emerging science, Mind Genomics, to understand a practical aspect of daily life: what motivates a person to donate to a specific charity. Beyond the knowledge of specific messages which are deemed to be potentially effective as a stimulus to donation, the paper shows how knowledge of a specific end-use can inform us about the mind of a person for a more general problem—how understanding the messages for donation drives a deeper understanding of human motivation. The paper moves from inexpensive pilot tests, through an affordable experiment, and onto the creation of a tool to assign new people worldwide to the proper groups, so they can receive the appropriately targeted messages.
Introduction
Knowing What to Say to Donors to Encourage Giving
In today’s world, departments of development for various organizations have become increasingly important and active. One is inundated daily by requests for donations for all sorts of causes, ranging from simple letters from individuals to sophisticated outreach including brochures and other presentations with information intended to tap one’s emotions and open one’s wallets. Most appeals from organizations appear to be ‘on point,’ with the proper phrases, the proper images, and so forth [1-3].
Approaches to Science – Idiographic versus Nomothetic
Today’s culture of science drives research towards large samples and well-defined stimuli. Despite the fact that a great deal of science is exploratory, the majority of studies published would have us believe that the studies are following the hallowed dicta of philosopher of science Karl Popper, invoking the hypothetico-deductive system, creating a hypothesis, and then falsifying it. The editors of major journals look for breakthrough work, combining a robust combination of novelty and familiarity. Such work is not common, although it occasionally surfaces. The evolving culture of science focuses on extensions of today’s state of knowledge as represented in the existing scientific literature. The typical phrase is ‘plugging holes in the literature,’ or ‘answer a call from the literature.’ Scientific rigor is as much rigorous statistics as rigorous thinking. The published work must convince by virtue of statistical differences, not by daring challenges which advance science. Despite what is promoted as scientific ‘doctrine,’ today’s scientific world frowns upon these new directions, however, when the content of journals and the reactions of reviewers are studied in detail. A quandary arises when the research is meant to explore a topic rigorously with good underlying design but with affordable samples, with the goal to be used for practical ends while truly adding to knowledge of a topic. Can this effort be called science? Typically, these problems emerge in the social and behavioral sciences, but less frequently in the harder sciences.
The focus of this paper is how one can quickly, inexpensively, and rigorously uncover the nature of the donor’s mind for a specific end recipient, that recipient being Children’s Cancer Center (name disguised to preserve confidentiality). The objective is to support children with cancer by addressing their medical, social, and psychological needs, as well as their family’s challenges. The problem is to discover what type of messages are likely to drive a person to donate. The problem is a practical one with a limited scope, specifically Children’s Cancer Center’s donations, but the learning which emerges from the study is relevant to an understanding of other communications driving support for a given charity. The empirical part of this paper shows the two steps followed to discover what to say to potential donors about Children’s Cancer Center. The combination of the two studies may be viewed as a discussion of ‘method,’ so-called methodological research. The specific findings of the second study, which is larger, but still small in terms of general practice, show what can be discovered for practical use.
About Children’s Cancer Center
Data from the World Health Organization (WHO) and the National Cancer Institute reveal that, in the United States, cancer is the leading cause of death by disease past infancy and will lead to the deaths of approximately 1,190 children in the U.S. in 2021. Further, As of January, 2015, the most recent data readily available, The National Cancer Institute reports that there are 429,000 survivors of childhood and adolescent cancer (diagnosed at ages 0 to 19 years) alive in the United States, and these survivors face serious medical problems during and after the acute phase of their disease (National Cancer Institute, 2018, 2020) [4,5].
Childhood cancer is a global issue. According to St. Jude Children’s Research Hospital’s website, cancer is diagnosed each year in about 175,000 children ages 14. The World Health Organization reports that more than 300,000 new cases are diagnosed annually in children ages 0-19. The number of actual cases is probably greater, because children in low-income countries are not likely to be included as part of the count. As Alex’s Lemonade website points out, “globally, cancer stole 11.5 million years of healthy life away from children in 2017.” This is because of life years taken away from kids who die, as opposed to a 90-year-old adult who dies of cancer and has very few life years left (Alex’s Lemonade, 2020) [6].
Despite the global prevalence of childhood cancer and the death rates associated with it, now 80% survival rates for US children but only 20% globally, only 4% of US government funding in the cancer sector is directed towards pediatric cancers. This has been challenged by pediatric cancer activists for years. A 2015 article by Kristin Connor in the Washington Examiner sheds light on the logic behind why our government doesn’t increase funding for childhood cancer:
“…cancer research funds are driven by the number of people — of any age — who have the disease. And, of course, adults, with decades of exposures and behaviors, experience cancer in much greater numbers than young children. This approach therefore seems like the “democratic” way to distribute federal money. Yet it doesn’t do much for the more than 15,700 children diagnosed each year with cancer, and the more than 40,000 children undergoing cancer treatment each year all across the United States. But instead of looking at the number of annual diagnoses, perhaps we should consider the number of life-years potentially saved. For each child with cancer, on average, as many as 71 potential life years might be saved. That’s an important factor that is not being considered when funding allocation decisions are made.” [7].
Despite great progress in US survival rates (84% of children diagnosed with cancer are alive at least five years after diagnosis), 16% are still dying AND those who do survive for five years are not necessarily cured, and many of them suffer from long-term side effects from their illness and associated treatments. According to Alex’s Lemonade, “Children who were treated for cancer are twice as likely to suffer chronic health conditions later in life versus children without a history of cancer.”
Some reason for optimism comes from the WHO: “most childhood cancers can be cured with generic medicines and other forms of treatments including surgery and radiotherapy. Treatment of childhood cancer can be cost-effective in all income settings.” Early intervention is critical to improving pediatric cancer outcomes. The WHO also calls for childhood cancer data systems, which are “needed to drive continuous improvements in the quality of care, and to drive policy decisions.” Donating to organizations like Children’s Cancer Center supports those factors that will lead to improved outcomes around the world. With the WHO’s statement that “the most effective strategy to reduce the burden of cancer in children is to focus on a prompt, correct diagnosis followed by effective therapy,” supporting an organization like Children’s Cancer Center is critical to reducing death rates of children worldwide [8].
The Mind Genomics Approach
Mind Genomics is an emerging science with roots in experimental psychology, sociology, consumer research, and statistics, respectively. The objective of a Mind Genomics study is to understand the messages for a topic which drive a specific response, such as ‘Dislike/Like,’ ‘Not interested/Interested,’ ‘Will Not donate/ will donate,’ ‘Will pay a certain amount,’ ‘expected to feel a certain way,’ and so forth. The purview of Mind Genomics is everyday life and the expected decisions that people make when they are presented with messages about a specific, granular, situation, of the type that would confront them daily. The process of Mind Genomics, the intellectual underpinnings, the statistics, and business-relevant patents have been documented extensively, and need not be repeated in their specifics. The reader is directed to a representative list [9-11]. Mind Genomics grew out of the need to create a new vision of science, one studying the behavior of the everyday, from the viewpoint of experimentation, rather than observation. Anthropology already studied individual cultures and behaviors in depth, with recent efforts attempting to move from purely descriptive to quantitative [12]. Sociology already studies everyday behavior but does not conduct experiments, and looks for general rules in everyday behavior, rules which are ‘nomothetic,’ dealing with generalities. Social psychology moves more closely into the world of the mind but again deals with issues of nomos. Social psychology is not experimental, and while it may deal with ordinary daily behavior, it attempts to provide a broad sweep of the behavior of people, rather than focusing on the topic itself. The topic of the study is only a means to understand the person. In the above disciplines, researchers focus on the person, using the normal situation to understand the person.
In contrast to other disciplines, Mind Genomics focuses on the specifics of the situation, using the person and the rules of judgment to understand. Thus, the learning is about the specifics of daily life, and less so about the person himself or herself. Indeed, one might use the metaphor that Mind Genomics focuses on the situation, with the situation ‘illuminated’ through the lights of different sources. These ‘lights,’ these different forms of illumination, are the people. The ultimate objective of Mind Genomics is to create a ‘Wiki of daily experience,’ a virtual encyclopedia of daily life and the different aspects of that daily life, dimensionalized into specifics, with the data being the aspect and numbers representing the way the ordinary person feels about that specific, on some type of scale. The problem for the ‘project of science’ is what type of information is acceptable for science? That is, the project discussed has a specific objective. Does the fact that there is such an objective invalidate the science, simply because the results pertain to a specific end-user, the Children’s Cancer Center charity? Furthermore, are the results not ‘valid’ because the base size is low? Finally, what is the status of the preparatory study—a small preliminary study to identify whether there are messages which resonate? Do preparatory studies deserve a place in the research report, because they illustrate the way towards making the larger discovery, by one or a set of small, ‘trial’ experiments?
Illustrating the Process of Mind Genomics Applied to Donations
Mind Genomics has already been used to study the nature of effective communication for donations [10,13]. The objective of the study is to understand the most productive and effective way to communicate to a prospective donor to Children’s Cancer Center. The relevance of the topic, donation, and the relevance of Children’s Cancer Center in the world of charity organizations for children with cancer will become obvious from the review of today’s information about children and cancer. Thus, anything helping to understand WHAT to communicate, and to WHOM, can play a major role in the world of health care and fundraising. The ordinary process for understanding what to communicate does not invoke science, nor does it invoke foundational experiments bridging the world of science and application. The ordinary process might be either to select previous messages that ‘worked’ to drive donations, or perhaps to classify the prospective donors into different groups, based upon WHO they are, WHAT they have done in the past, or how they THINK about general topics. The short case presented here shows how a rigorous scientific approach to understand how the mind of the donor can be applied to situations where guidance is needed, rather than where one wishes to establish for a scientific proposition with reasonable certainty. The underlying world view is that even within the world of application, one can create knowledge which informs the greater science. In the case study presented here, we show how a small pair of studies, one with four respondents and a succeeding one with 50 respondents, informs the world of charitable donations, establishing patterns that can used later on as springboards either for more application or for theory building. We now move to the science of Mind Genomics, following the process, not so much to establish general rules, but rather to investigate a specific, defined situation: donation to Children’s Cancer Center Hospital. We follow a series of steps, whether the Mind Genomics study is designed to understand charitable donations in general, or to understand charitable donations to a specific cause.
Our presentation of the process shows the results from two iterations. The first iteration, with the very small base size of four respondents (n=4), will show how Mind Genomics extracts information at virtually the level of one or a few individuals, in a manner similar to the way the anthropologist or the consumer researcher extracts information from in-depth interviews with one or two people or from focus groups of three or more people. The second iteration will move on with a more quantitative study of the responses from 50 individuals, after building on the learning from the first iteration, changing some of the material, and then testing. It is important to note that the process need not be restricted to one small study followed by one larger one, but might comprise several small studies, until these sequences of ‘iterations’ provide the information which seem to be most appropriate to answer the applied question, and to provide the structured knowledge for a ‘wiki of the mind’ with respect to the topic.
Step 1: Choose a Topic
This step sounds simple, but it requires the researcher to focus on a specific topic. Choosing the specific topic is the start of critical thinking required by Mind Genomics, whether the topic is a general one of daily behavior (what makes a person donate to a charity?) or a specific one (what makes a person want to donate to Children’s Cancer Center Hospital?).
Step 2: Create Four Questions Which ‘Tell a Story,’ Pertaining to the Topic
The iterative nature of Mind Genomics ensures that the researcher need not worry that the questions are correct. Indeed, part of the underlying world view of Mind Genomics is that science should be exploratory.
Step 3: Create Four Answers to Each Question
Again, these answers need not be the correct answers. The ability to iterate, to run a number of these small experiments, generate data which guide the researcher to better questions and better answers.
Step 4: Select a Rating Scale
The rating scale can be 5, 7 or 9 points. The actual number of scale points is left to the discretion of the respondents, as is the rating scale. There is no right or wrong scale. The topic of questions and scales has been a focus of researchers for a century. The pragmatic side of Mind Genomics is that the scale should be simple. The scale for this type of question (not donate vs. donate) should be simple to understand, anchored at both ends. An odd number of scale points is easier to work with when there is the possibility of a neutral point.
Step 5: Launch the Study and Get the Results Fully Analyzed within 90 Minutes
The process obtains respondents through a panel service (Luc.id), with the Mind Genomics platform automatically analyzing the data and returning a complete report, the entire process typically taking less than one to one and a half hours.
Step 6: Present the Appropriate Vignettes to the Respondent, Vignettes Created for That Respondent by the Permuted Experimental Design
Record the rating on the anchored 1-9 scale, and record the response time (consideration time), operationally defined as the number of seconds from the appearance of the vignette on the screen to the actual rating assigned by the respondent. Each respondent evaluates the appropriate set of vignettes to constitute an experimental design, allowing subsequent powerful analyses. Each respondent evaluates a unique set of combinations of messages, so that across the set of respondents the evaluations cover many of the possible combinations, rather than covering a few combinations, but with precision. The learning will be in the stimuli, not in the precision of the measurement.
Step 7: Obtain Data Analyzable Both at the Level of the Individual and at the Level of the Group, Respectively
Each respondent evaluates a full experimental design, analyzable at the level of the individual respondent. For the design comprising four questions and four answers (elements), the design prescribes 24 combinations (vignettes). Each vignette comprises 2-4 elements, no more than one element or answer from any question. The design ensures that each element appears 5x, uncorrelated with any other element; The experimental design is maintained, but the combinations are changed according to a permutation scheme [14,15]. Thus, the combinations cover more of the ‘design space’ than the usual approach using experimental design. The underlying rationale is that it is more productive to test many possible combinations with underlying variability (noise) in each measurement than to limit oneself to a few combinations, measuring each point in the design with many replicate measures to average out the variation. In short, the argument by Mind Genomics is that knowledge emerges from scope with modest precision at each point (the big pattern emerges), rather than from precision with narrow scope. This is the key tenet of Mind Genomics: scope is better than precision, at least in the early explorations of a topic.
Step 8: Convert the Rating Scale in Two Ways
The first transformation is ‘Top 3’ defined as a transformed value of 0 when the original rating was 1-6, defined as 100 when the original was 7-9. The first transformation focuses on what ‘drives’ a person to select ‘donate.’ The second transformation is ‘Bot 3’ defined as a transformed value of 0 when the original rating was 4-9, defined as a transformed value of 100 when the original rating was 1-3. The second transformation focuses on what ‘drives’ a person to select ‘will not donate.’ To all transformed ratings a small random number was added (<10-5) to ensure variation in the transformed rating, and thus to ensure that the OLS (ordinary least-squares regression) will ‘work,’ and not ‘crash.’ OLS regression requires variation in the dependent variable. The addition of the small random number ensures that variation without materially affecting the results.
Step 9: Cluster the Individual Respondents Based Upon the Pattern of Their 16 Coefficients for Top3
The clustering is done using k-means clustering with the measure of distance being (1-Pearson Correlation), viz., [16]. The Pearson correlation coefficient shows the strength of a linear relation between two sets of measures. When the relation is perfectly linear, increases in one measure correspond to precise increase in the other measure. There is no scatter, the Pearson correlation is +1, and the distance is 0 (1-1=0). In contrast, when the relation is perfectly inverse, increases in one measure correspond to precise decreases in the other measure. Again, there is no scatter, the Pearson correlation is -1, and the distance is 2 (1–1=2). The clustering program generates two, and then three groups, called mind-sets, because the clusters represent groups who attend to the elements or messages in different ways. We select that cluster solution (the array of mind-sets) which tells the most obvious story (interpretable), and which comprises the smallest number of segments (mind-sets). For the data in this study, the three-mind-set solution was easier to understand.
Step 10: Create the Model for All Appropriate Data from the Respondents from Each Key Subgroup
Each group (Total, three Mind-Sets) generates three models or equation; Top3 (drivers of positive response), Bot3 (drivers of negative response), and RT (response time, or consideration time, measure of engagement with the material, whether the response to the element was positive or negative).
The model is a simple weighted, linear equation of the form:
Top3 (or Bot3) = ko + k1(A1) + k2(A2) … k16 (D4)
Response Time = k1(A1) + k2(A2) …. K16 (D4)
The additive constant k0, shows the estimated Top3 (or Bot3) response in the absence of elements. The additive constant can be thought of as a baseline response, or the underlying, fundamental likelihood of the respondent to ‘donate’ (Top3) or ‘not donate’ (Bot3). The additive constant is not meaningful for response time RT, since in the absence of elements there is nothing to which one can respond.
Step 11: Assign a New Person to One of the Mind-sets by Means of a Short Questionnaire, the PVI, Personal Viewpoint Identifier
The PVI assigns a NEW person to one of the mind-sets, and by so doing expands the scope of the small-scale studies to practical use, whether to create a more effective campaign (application), or to understand the distribution and possibly nature of the people in the different mind-sets. This adds to our general knowledge of the minds of people regarding messages relevant to donations (science).
Results
The Two Studies
To illustrate the value of small studies and what can be learned with a sequential approach requiring 2-3 days, we present the results of two studies designed to understand what messages may work for a campaign. The project deals with messaging to drive donations for Children’s Cancer Center, a hospital devoted to pediatric cancer (name of actual hospital disguised to maintain confidentiality). To make the topic general, the actual study was conducted among the general population to uncover the messages which would appeal the general population, not simply appeal to previous donors to Children’s Cancer Center.
The knowledge development was done in two phases. The first phase, or experiment, can be considered a pilot study with 10 respondents, sufficient to provide deep insights. The key difference between a pilot study of 10 respondents and a larger scale study of 40-50 respondents, or even a much larger scale study of 100-200 respondents, is simply the ability to identify different groups in the population and study the pattern of their responses.
Study 1: Preliminary Learning through a ‘Mini-Study’
As noted above, the Mind Genomics project begins with the topic (donating to Children’s Cancer Center specifically, or a cancer hospital for children in general). The next step requires the researcher to formulate the four questions that ‘tell a story.’ The questions emerging from the initial discussion tell such a story. They may not be the only questions, but in an exploratory study the objective is to learn just ‘what works.’ The four questions are:
A. Question A: What is it like to be a pediatric cancer patient?
B. Question B: Why is it important to support Children’s Cancer Center?
C. Question C: What are the outcomes for children when you donate?
D. Question D: How do you give your donation?
The study was executed with 10 respondents chosen from a large group of panel participants recruited by Luc.id, Inc., based in Louisiana, a provider of panel participants for on-line studies. Each respondent evaluated a different set of 24 vignettes, constructed according to Step 6 above. With as few as one respondent the Mind Genomics study generates meaningful data, readable at the level of that single respondent. With 10 respondents, and occasionally even as few as three or four, patterns rapidly emerge, patterns which are relevant for the respondents, but which may or may not be projectible to the population at large.
Table 1 shows the coefficients for the response time, the positive coefficients for the positive responses (I will donate), and the positive coefficients for the negative responses (I will not donate).
Table 1: The four questions, four answers to each question and the coefficients from the grand model relating the 16 elements to the binary transformed rating. To help the underlying patterns emerge, only the positive, non-zero, coefficients are shown for Top3 and for Bot3. The response times are shown for all elements, but only the response times of 1.1 seconds are shown, those driving ‘engagement’.
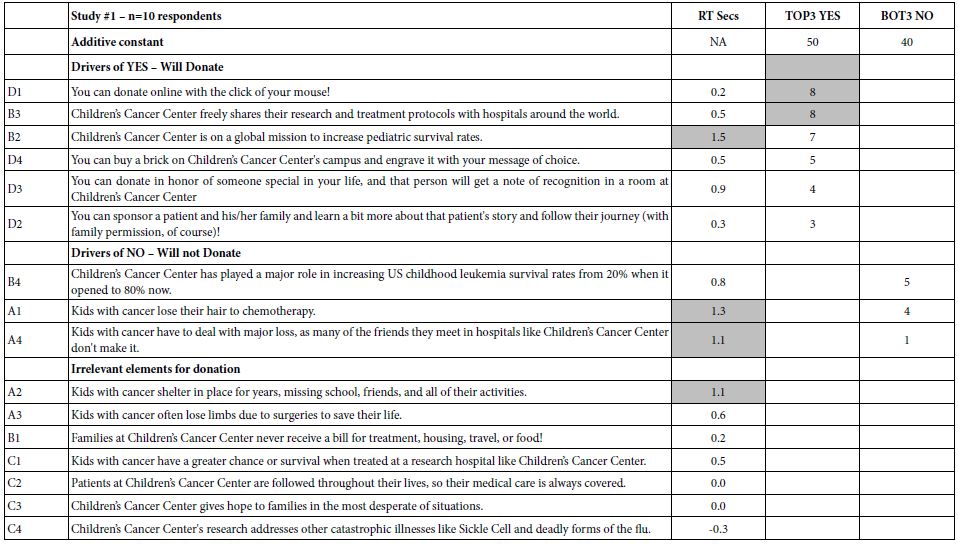
The response time gives a sense of the elements which most engage the respondent. Even with a small base size of 10 respondents, the data from the deconstruction of the ratings into the contribution of the elements gives a sense of the nature of elements that effectively engage. Those elements talk about the children, and survival. The elements may not ‘drive expected donations,’ but they do engage as shown by the long response time (consideration time). Moving on to the ratings, or more specifically the transformed ratings, Table 1 suggests that the additive constant, the proclivity to donate or not to donate ranges between 40 and 50. In the absence of elements which provide specific information, there is no dramatic drive to donate or not to donate, at least for these randomly chosen respondents. What is more important, however, is that among the 16 elements or, the messages, only two reach significance (coefficients of 8 or higher).
You can donate online with the click of your mouse!
Children’s Cancer Center freely shares their research and treatment protocols with hospitals around the world.
The two elements have little in common, suggesting that there is probably no single strong message. It is the nature of researchers to continue looking. These data suggest no ‘magic bullet.’ They do suggest that if there are any ‘magic bullets,’ they may be found in different mind-sets in the population, if such mind-sets can be identified. It is at this point that one can begin to formulate hypotheses about the psychology of donations. The hypothesis emerging here is that ‘painting a graphic word picture’ of the child will engage attention. The science of Mind Genomics has now enriched our thinking about the psychology of donations and generosity, suggesting that graphic design of the recipient is something to consider. The data suggest a further opportunity to understand the nature of the portrait being painted.
Study 2: Identifying the Underlying Structure of What Works for Donating to the Hospital
Study 1 constituted the first foray into the topic, executed with 10 respondents. Although 10 respondents are not often considered to be sufficient to establish results, a base of 10 respondents from one or two focus groups is acceptable when considered to be an exploratory step. Thus, we considered Study 1 to be exploratory, providing information in a disciplined way, but with simply too few respondents.
Here again are the questions from Study 1
Question A: What is it like to be a pediatric cancer patient?
Question B: Why is it important to support Children’s Cancer Center?
Question C: What are the outcomes for children when you donate?
Question D: How do you give your donation?
Based upon the patterns of responses, here are the four revised questions. The key change is Question D, and of course the text of the elements themselves.
Question A: What is it like to be a pediatric cancer patient (why would you want to help)?
Question B: Why is it important to support Children’s Cancer Center?
Question C: What are the outcomes for children when you donate?
Question D: What would inspire you to give?
The second study was conducted with 50 respondents, of which the data from 48 respondents were retained. The remaining two respondents did not provide age or gender, and so their data were eliminated.
Table 2 shows the same type of data as does Table 1, this time for the new set of respondents, and the new set of elements. Once again, each respondent evaluated a unique set of 24 vignettes, constructed by experimental design, so that the data can be analyzed down to the level of the individual respondent. This strategy, so-called ‘within-subjects design’ ensures that the data can be further deconstructed into subgroups called ‘mind-sets,’ based upon the patterns of the coefficients for each respondent. At first glance, the data reaffirm the previous finding from Study #1 that there are no elements which strongly driving expected donations, when the topic is associated with Children’s Cancer Center. One might consider this a failure when the objective is to discover the so-called ‘magic bullet,’ the message that will work for everyone. The result might be the continued search for this ‘magic bullet’ in successive efforts, only to realize in the end that there is no ‘magic bullet,’ or if there is, no one has any idea about what specifically it is and how to express it. At the practical level, the effort will be seen to have been wasted. There will be no science of communication about charitable contributions and how people feel. The unsatisfactory conclusion, soon to be discarded is ‘no business results, no contributions to the science of people, no additional knowledge for science of charity communications.’
Table 2: Results from the total panel from Study #2.
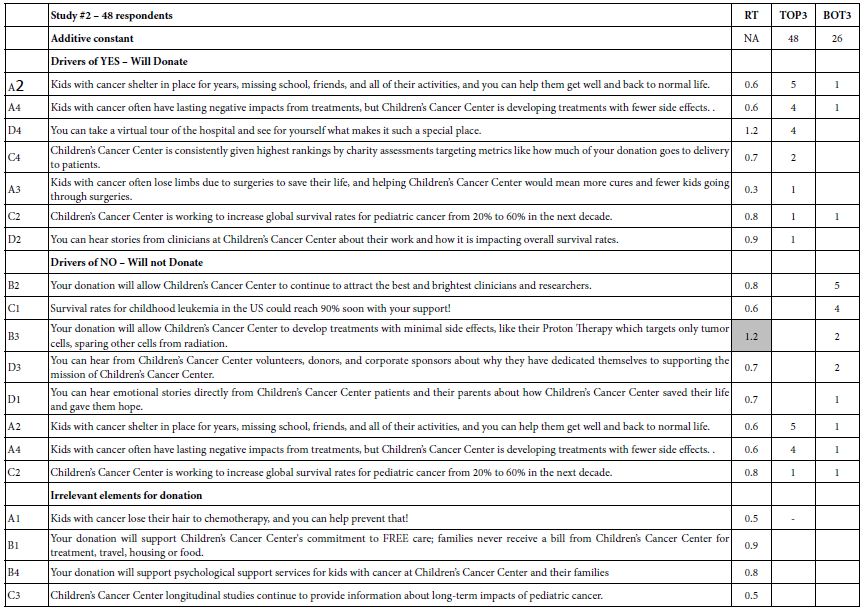
The picture changes, and significant learning for practical application and for foundational knowledge emerges, when one dives more deeply into Mind Genomics and discovers mind-sets. In Mind Genomics, the continuing data suggest the existence of what could be called mind-sets, different patterns of ideas which are interpretable in the form of a ‘story,’ patterns that seem to attach themselves to people. In the world of Mind-Genomics, considering people simply as ‘protoplasm which responds,’ there emerge groups of ideas which separately drive strong responses. People are the carriers of these ideas. People allow these groups of ideas to emerge. A person typically falls into a specific mind-set for a topic and not into the other mind-sets for the same topic. When we look at the data through the lens of mind-sets, using the computational process outlined in Steps 9 and 10 above and doing the computation on the Top3 (positive responses), we emerge with three new-to-the-world mind-sets, shown in Table 3 for Top3 (positive response – likely to donate), and in Table 4 for Bot3 (negative response – not likely to donate).
Table 3: Drivers of positive responses to messages, showing total panel, gender, and the three emergent mind-sets based on clustering using Top3.
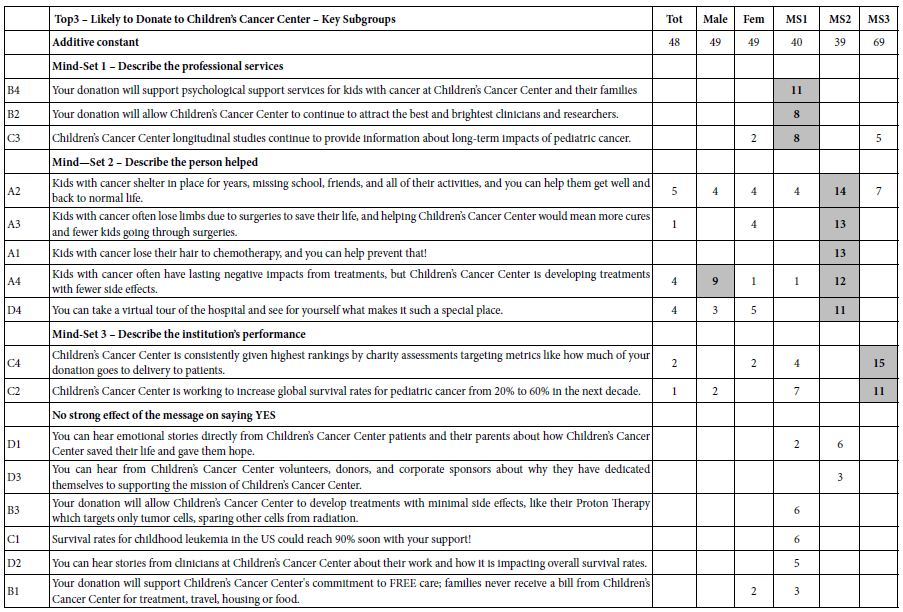
To strengthen the scientific aspect of the results—the learning which is meant to be foundational rather than simply a direction for messaging to raise money—we include gender, as well, comparing the responses of males and females. Table 3 suggests three mind-sets. It is in the mind-sets that the strong elements emerge, elements with coefficients of +8 or higher.
a. There are some positive elements by gender, but no strong performers at all. Both male and female respondents are modestly interested in donating (additive constant=49)
b. Mind-Set 1 – Describe the professional services (modestly interested in donating at a basic level, additive constant=40)
c. Mind-Set 2 – Describe the person helped (modestly interested in donating at a basic level, additive constant=39)
d. Mind-Set 3 – Describe the institution’s performance (strongly interested in donating at a basic level, additive constant=69).
Table 4 shows the messages that should be avoided, the messages driving the response of ‘Not Donate.’ The coefficients emerge from considering only ratings of 1 and 2 as relevant on the 5-point scale, with ratings of 3-5 (neutral, will donate) as not relevant, and coded as 0. The additive constant is far lower for Not Donate than it is for Donate, meaning that people are more inclined to say that they will donate. Several messages to be used by the Center are likely to ‘backfire’, driving donors away. Mind-Set 2 is especially sensitive to the wrong messages.
Table 4: Drivers of negative responses to messages, showing total panel, gender, and the three emergent mind-sets based on clustering using Top3.
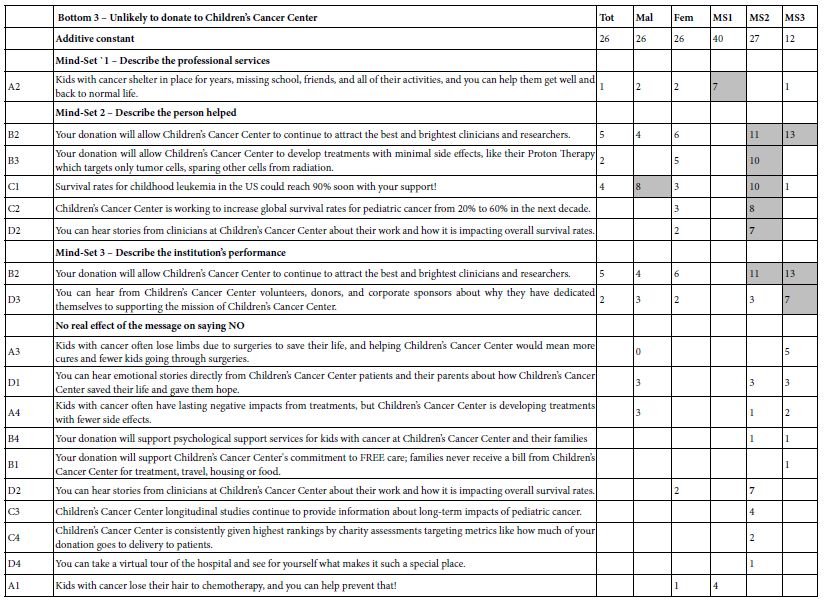
Finding these Respondents in the Population
A continuing topic in Mind Genomics is the value of a ‘next step’ beyond the already-important discovery of mind-sets. Mind-sets themselves provide a way of understanding daily life, through a new focus on the every-day and the way people differ in their typical behaviors. Yet, beyond the scientific contribution of knowledge is the remarkable potential of expanding the value of the learning, moving beyond the respondents tested in the study to the entire world. A simile is the colorimeter used to quantify colors of objects. The science of color can be developed in any location with any material. The real value of the science in terms of the ‘world outside’ is to measure the colors of new objects, not by repeating the study in which the colors were discovered, but rather by measuring the colors of the new objects using a machine in which the science has been already programmed [17-23]. The approach used in Mind Genomics is called the PVI, the personal viewpoint identifier. The objective is to use the data from Table 3 (MS1, MS2, MS3) to create a short questionnaire (six questions), on a simple to-use scale. The questions come from the actual study. The pattern of responses assigns a NEW PERSON to one of the three mind-sets. There are 64 possible patterns, each pattern mapping to one of the three mind-sets. Figure 1 shows the PVI, doing so in two parts. The left part is a short introduction, to introduce the person to the task, and to obtain optional background information. The right part is the actual PVI, including some basic questions about attitudes towards ‘giving’ and the six-question PVI. The results are forwarded to a database and can be sent to the respondents, as well.
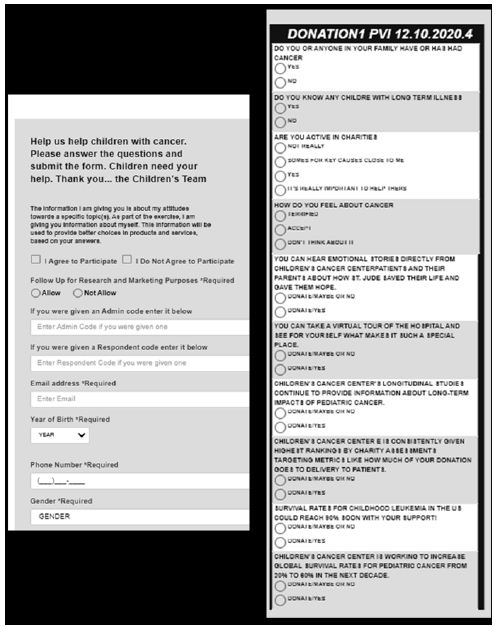
Figure 1: The PVI, personal viewpoint identifier, based upon the second study. The PVI is located at: https://www.pvi360.com/TypingToolPage.aspx?projectid=1261&userid=2018.
Discussion and Conclusion
The empirical results are simple to discover, just by looking at the table of elements and how the elements or messages drive interest in donating. The message used in requesting should be straightforward and focus on how the organization saves and changes lives for the better. The outcome of the organization’s work, and not the process, should be the main message. One should avoid directly focusing on needs and tax breaks, respectively. Although a minority of prospective donors will care about needs or tax advantages, most people say that they will contribute when they are suitably convinced by the cause and mission of the effort and in the vision detailing how their contribution can help. It is at this point that one can begin to formulate hypotheses about the psychology of donations. The hypothesis emerging here is that ‘painting a graphic word picture’ of the child will engage attention. The science of Mind Genomics has now enriched our thinking about the psychology of donations and generosity, suggesting that graphic design of the recipient is something to consider. The data suggest a further opportunity to understand the nature of the portrait being painted. It is not important to point out major ‘learnings’ from the results, learnings which confirm or disconfirm what is known in the literature, or what is hypothesized to be the case for the psychology of donors or the psychology of children with cancer. That information is, of course, important to know for science. What is more important, however, is the ability to have at one’s disposal a tool for small-scale, iterative experimentation: Mind Genomics, a tool which returns rich information even with remarkably small base sizes, such as n=10 or even fewer. In the world of science, Mind Genomics becomes a tool bridging the gap between the idiographic (individual) and the nomothetic (the general world). Just as important, Mind Genomics becomes both a practical tool to increase donations, as well as a tool for the development of systematized knowledge, both for the current generation and for those to come—a ‘wiki of the mind.’ Finally, viewed from the grand proscenium arch of civilization, Mind Genomics provides a record of how people of a certain time, in a specific environment, and faced with known needs, think about topics— a record of inestimable value to philosophy, psychology, history, sociology, anthropology, and economics, just to name a few disciplines where knowledge of the granular is important.
References