Monthly Archives: November 2020

fig 1

Molecular Characterization of a New Motu Ochoterenella (Nematoda: Onchocercidae: Waltonellinae): A Case Report of a Novel Subcutaneous Filarial Parasite Infesting a Wild-Caught Red-Eyed Tree Frog (Agalychnis callidryas) in Costa Rica 2019

DOI: 10.31038/IJVB.2020423

Abstract

A clinically ill red-eyed tree frog (Agalychnis callidryas) was submitted to the Escuela de Medicina Veterinaria, Universidad Nacional, Heredia, Costa Rica that was infested with slender subcutaneous parasites located in its dorsal subcutis. We humanely euthanized the frog and the parasites and tissues collected for further study. Light microscopic examination of histological sections of the frog’s heart and stomach displayed numerous microfilaria in these tissues. DNA was isolated from the adult nematodes and PCR used to amplify regions of the 18S small ribosomal subunit (18S rRNA), 28S large ribosomal subunit (28S rRNA), mitochondrial cytochrome oxidase 1 (COI) gene and the mitochondrial 12S ribosomal subunit (12S rRNA). The amplicon DNA sequences were determined, and submitted as BLAST searches of the NIH GenBank nucleotide database. Results demonstrated that portions of the parasites gene sequences were unique, but closely related to nematodes in the superfamily Filarioidea. The 4 gene sequences of the red-eyed frog parasite gene sequences were concatenated and aligned with concatenated sequences of the same 4 gene regions in 35 other species within the superfamily Filarioidea, and 1 species in the superfamily Spirurida as the outgroup, for phylogenetic analysis using MEGA X software. We aligned the dataset using MUSCLE, analyzed for the evolutionary model that best fit the data using jModeltest, followed by tree construction using a Maximum Likelihood method of phylogenetic analysis. The results assign the filarial parasite of the red-eyed tree frog to the genus Ochoterenella. DNA isolated from the adult parasites did not contain 16S rRNA sequences of the bacterium Wolbachia, consistent with other members of the Ochoterenella genus. Based on our phylogenetic analysis of the concatenated 4 gene sequences from this parasite, review of the current literature, and the subcutaneous location of the adult parasites in the frog, we surmise this is the first molecular characterization of this filarial parasite of the red-eyed tree frog.

Keywords

Agalychnis calidryas, Costa Rica, Filarioidea, Microfilaria, Phylogeny, Wolbachia

Introduction

Nematodes of the superfamily Filarioidea consist of parasites of vertebrate animals some of which are associated with pathology in humans and animals [1]. The adult filarid parasites dwell in body cavities, blood vessels, lymphatic vessels, subcutaneous tissues or the eye depending on the species. Female filarial parasites produce microfilaria offspring that circulate in the blood, lymphatic tissues and tissue fluids. Microfilaria ingested by biting arthropods that feed on host species blood, lymph and/or subcutaneous tissues fluids further develop to an infectious stage transmitted in subsequent blood meals. Biting arthropods are an obligatory intermediate host in the life cycle of filarial parasites and once ingested the microfilaria molt continuing their development. Moreover, the biological relationship between some genera of filarial parasites and arthropods may have included transfer of the endosymbiotic bacteria in the genus Wolbachia, most commonly found in the gametes of arthropods, particularly insects, but also found in some filarial genera [2].

Wolbachia are bacterial endosymbionts that provide energy rich metabolites to their host cells similar to the role mitochondria play in eukaryotic cells [2]. In the relationship with filarial hosts, Wolbachia supply energy supporting metabolically demanding stages of the filarid’s life such as production of microfilaria. Wolbachia likely co-evolved with some filariae from a single infection event and their removal sterilizes dependent female filariae species [3].

During routine surveillance of native frogs in Costa Rica to assess their blood for the presence of hematogenous parasites, a single red-eyed tree frog (Agalychnis callidryas) was captured that was infested with slender round parasites in the subcutis of over the dorsal lymph sacs. The subcutaneous nematodes were isolated and DNA sequences of four genes were determined and analyzed using standard molecular methods. Through the molecular analyses of gene sequences in this study, and review of the literature, we determined that the red-eyed tree frog filarial parasite is in the genus Ochoterenella had not previously been characterized.

Materials and Methods

Specimen Collection

A clinically ill frog Agalychnis callidryas from the province of Guanacaste, Costa Rica, was referred to the Parasitology laboratory, and given case number PA-043-19. The frog was euthanized according to the current AVMA guidelines for euthanasia of animals [4]; benzocaine was topically applied to the inguinal area of amphibian, and once immobilized from the drug it was placed in refrigeration for 30 minutes. Four adult nematodes were found in the dorsal subcutaneous tissues and two were used for this molecular sequence analysis. Tissues and organs of the frog were collected post-mortem and fixed in 10% buffered formalin solution overnight for histopathologic examination. Paraffin-embedded sections (five μm) were cut and stained with hematoxylin and eosin (H&E). Two additional five micrón paraffin sections of the frog’s heart and stomach containing microfilaria were collected for DNA isolation. The parasites were not adequately preserved to obtain morphological measurements, and were dehydrated in 100% ethanol prior to isolating their DNA.

Gene Amplification and Cloning

DNA was isolated from two adult filarial parasites using DNeasy Tissue Kit (Qiagen®, Germantown, Maryland) by macerating the nematodes in a one-ml glass tissue grinder containing 180µL of ATL buffer and 20 µL proteinase-K. The proteinase-K digestion proceeded overnight at 55°C. DNA isolation proceeded the next day according to manufacturer’s recommendations for animal tissue, we used 50 µL of 70°C buffer AE for the final DNA elution. DNA was isolated from paraffin sections by dissolving two (five µM) sections in xylene overnight, followed by sequential one hr rehydration steps in 100% ethanol, 70% ethanol followed by water. Digestion of the de-paraffinized tissue in ATL buffer and proteinase-K at 55°C proceeded overnight and DNA was isolated using DNeasy Tissue Kit (Qiagen) according to manufacturer’s recommendations, however DNA elution used 50 µL of 70°C buffer AE.

Isolated nematode DNA was quantified on a ThermoFisher® Nanodrop Lite spectrophotometer (ThermoFisher, Wilmington, Delaware) and two µL samples were subjected to five different PCR reactions using Platinum Taq polymerase (Thermofisher-Invitrogen®, Carlsbad, California): 12S rRNA, 18S rRNA, 28S rRNA, COI and Wolbachia 16S rRNA.

The PCR primer sequences used to amplify the nematode 18S rRNA have been previously described [5]. The nematode cox1 PCR primer sequences were designed from a MUSCLE alignment created using MEGA X software Kumar et al. (2018) analysis of GenBank accessions of COI in Loa loa (AJ544875), Dirofilaria repens (AB973225), Brugia malayi (KP760171), Setaria digitata (EF174427) and Diptelonema evansi (KR184816). The PCR primer sequences used targeting the 12S rRNA and 28S rRNA genes were those published [6-8]. We used the primer sequences that targeting the 16S rRNA of Wolbachia bacteria published [3]. DNA sequences for all primers and primer annealing conditions for the five amplification reactions appear in Table 1.

Table 1: PCR Primer sequences and annealing conditions.

Primer Designation

Primer Sequence (5’-3’) Target

Annealing (°C)

Filarid mMCO1F

GTAGTTGAACTTTTTAYCCTCC

COI

55

Filarid mMCO1R

AACAGCAATYCARATAGAAGCAA

Nema 18S F635

GAGGGCAAGTCTGGTGCCAGCAG

18S rDNA

65

Nema 18S R1728

YATACCTATTCGAAGGGATAG

12SF

GTTCCAGAATAATCGGCTA

12S rDNA

50

12SdegR

ATTGACGGATGRTTTGTACC

F28SF1

CCTCAACTCAGTCGTGATTACC

28S rDNA

58

F28SintdR1*

TCTTYACTTTCATTAYGCTT

Wolbachia 16SF

YATACCTATTCGAAGGGATAG

16S rDNA

45

Wolbachia 16SR

AGCTTCGAGTGAAACCAATCC

Extension for all reactions was at 72°F for one minute/kilobase, 40 PCR cycles.

We cloned one microliter of each PCR amplicon into plasmid pCR4-TOPO (Thermofisher-Invitrogen) and used to transform chemically competent TOP-10 Escherichia coli (Thermofisher-Invitrogen). The transformed TOP-10 bacteria were grown overnight on Luria-Bertani agar containing kanamycin 50µg/mL (LBK agar). We picked six clones the next day and inoculated into individual six mL LBK broth cultures, and were grown overnight. The pCR4 plasmid containing amplicon insert was isolated from each clone’s broth culture using Plasmid Miniprep (Qiagen) and the purified plasmid DNA diluted to 50 ng/µl in 2 mM EDTA buffer. Plasmid clones were sent to Genewiz, LLC (South Plainfield, New Jersey) and the amplicon nucleic acid sequences determined by the Sanger method, initiating sequencing from both of the T3 and T7 promoter sites located upstream of the amplicon on opposite DNA strands. We analyzed the sequences obtained using the software suite MEGA X [6]. Plasmid sequences were removed from the resulting forward and reverse amplicon sequences, 1 strand from each clone was reverse transcribed, and the amplicon information from all clones were aligned using the MUSCLE algorithm to obtain a consensus sequence for each of the 4 genes from the red-eyed tree frog filarial parasite.

Phylogenetic Analyses

The NIH GenBank accession for all four genes of the red-eyed tree frog filarial parasite are in Table 2. The GenBank accession information for the homologous gene sequences of the other 35 filarial parasites and one outgroup used for phylogenetic analysis are provided in Table 2. All manipulation of DNA sequences used the software package MEGA X.

Table 2: Species within the superfamily Filarioidea in the analysis, rooted to a member of superfamily Spiruridea

Organism

cox1

12S 18S

28S

Ochoterenella sp. 1 SHF-2019

MN368875

MT150113 MN334554

MT153694

Acanthocheilonema viteae

KP760169

KX022983 KP760117

KP760359

Breinlia jittapalapongi

KP760170

KP760316 KP760119

KP760361

Brugia pahangi

MT027204

KP760318 KP760121

KP760363

Brugia timori

KP760173

KP760319 KP760122

KP760364

Cercopithifilaria bainae

KP760175

KP760321 KP760123

KP760365

Cruorifilaria tuberocauda

KP760176

KP760322 KP760125

KP760367

Dipetalonema caudispina

KP760178

KP760323 KP760127

KP760369

Dipetalonema gracile

KP760181

KP760326 KP760130

KP760372

Dipetalonema graciliformis

KP760182

KP760328 KP760131

KP760373

Dipetalonema robini

KP760183

KP760329 KP760132

KP760374

Dirofilaria immitis

KT716014

KP760330 KP760133

KP760375

Dirofilaria repens

KP760185

KP760331 KP760134

KP760376

Foleyella candezei

KP760187

FR827906 KP760136

KP760378

Icosiella neglecta

KP760189

KP760334 KP760138

KP760380

Litomosoides brasiliensis

KP760191

KP760336 KP760140

KP760382

Litomosoides hamletti

KP760192

KP760337 KP760141

KP760383

Litomosoides solarii

KP760193

KP760338 KP760142

KP760385

Loa loa

KP760194

KP760339 KP760143

KP760386

Loxodontofilaria caprini

AM749242

AM779822 KP760144

KP760387

Madathamugadia hiepei

JQ888272

JQ888290 KP760146

KP760389

Mansonella ozzardi

KP760195

KP760340 KP760147

KP760390

Monanema martini

KP760196

KP760341 KP760149

KP760391

Ochoterenella sp. 1 EL-2015

KP760198

KP760343 KP760151

KP760394

Ochoterenella sp. 2 EL-2015

KP760199

KP760344 KP760152

KP760395

Ochoterenella sp. 3 EL-2015

KP760197

KP760342 KP760150

KP760393

Onchocerca dewittei japonica

KP760203

KP760349 KP760154

KP760397

Onchocerca gutturosa

AJ271617

KP760347 KP760156

KP760399

Onchocerca ochengi

KC167358

KP760348 KP760157

KP760400

Onchocerca skrjabini

AM749274

AM779809 KP760158

KP760401

Oswaldofilaria chabaudi

KP760204

KP760350 KP760159

KP760402

Oswaldofilaria petersi

KP760205

KP760351 KP760160

KP760403

Pelecitus fulicaeatrae

KP760206

KP760352 KP760161

KP760404

Protospirura muricola

KP760207

KP760353 KP760162

KP760405

Rumenfilaria andersoni

JQ888279

JQ888297 KP760163

KP760406

Setaria labiatopapillosa

MF589585

KP760354 KP760164

KP760407

Setaria tundra

KU508985

KP760355 KP760165

KP760408

Individual MUSCLE alignments (in MEGA X) were created for each of the 4 genes using sequences from our red-eyed tree frog filarial parasite, and the homologous gene sequences from 35 Filarioidea and 1 Spirurida outgroup (Protospirurida muricola). We truncated each gene sequence so that all the alignment begins at the same 5’-nucleotide position (with the one exception of the 5’ end of COI gene of Monanema martini) and end at the same 3’ nucleotide position. These alignments were concatenated (using MEGA X) forming a 2,604 nucleotide long dataset, and aligned with the MUSCLE (non-coding) algorithm. The best evolutionary model for the concatenated dataset was determined using jModeltest [7]. Phylogenetic analysis was performed using the maximum likelihood method with the following settings: 1,000 bootstrap replicates, GTR+G+I model, six discrete gamma transition/transversion rates, Nearest-Neighbor-Interchange heuristic method of tree inference, and the branch swap filter set at moderate. The resulting phylogram was rooted to the Spirurida outgroup, nodes with less than 50% bootstrap agreement were collapsed and the phylogram exported for text annotations using Corel Draw® (Ottawa, Ontario, Canada).

Results

Figure 1 is a photograph of the live restrained Agalychnis callidryas prior to euthanasia and necropsy. The dorsal skin visibly deformed was due to the presence of adult nematodes in the subcutis. Light microscopic examination of H&E stained sections of heart and stomach revealed microfilaria in the small vessels of the heart and stomach (Figure 2a and 2b).

fig 1

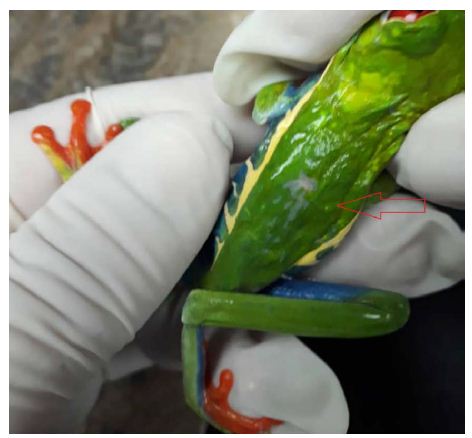
Figure 1: Depicted is a photograph of the restrained red-eyed tree frog (Agalychnis callidryas), a nematode is located in the subcutis seen at the tip of the arrow.

fig 2

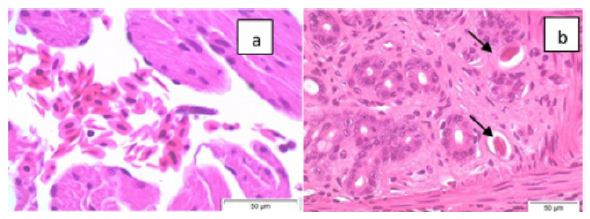
Figure 2: Photomicrographs (x60 magnification) of H&E stained paraffin-embedded sections of heart (a) and stomach (b) showing microfilaria (arrows) in these tissues.

Gene specific PCRs amplified 1,098 bp of the 18S rRNA, 1,131 bp of the 28S rRNA, 470 bp of COI gene and 503 bp of the 12S rRNA from the red-eyed tree frog filarial parasite. We deposited the sequences for each gene from this parasite of the red-eyed frog into the NIH GenBank (accession numbers appear in Table 2). BLAST search of the GenBank nucleotide database using each gene sequence from the red-eyed tree frog filarial parasite as the subject, and the BLAST default search settings, retrieved members of the superfamily Filarioidea. Moreoever, the red-eyed tree frog parasite has the highest degree of similarity to sequences of members in the genus Ochoterenella. Sequence identity between the concatenated sequence of the red-eyed tree frog Ochotenerella and the other Ochotenerella sequences from the GenBank are in Table 3. The concatenated gene sequences of the red-eyed tree frog Ochotenerella has 96.7% identity with Ochotenerella sp. 3 EL-2015 (Table 3).

Table 3: Pairwise similarities between concatenated sequences of Ochotenerella species.

Ochotenerella sp. 1 SHF-2019

Ochotenerella sp. 3 EL-2015 Ochotenerella sp. 1 EL-2015

Ochotenerella sp. 2 EL-2015

Ochotenerella sp. 1 SHF-2019

100

Ochotenerella sp. 3 EL-2015

96.7

100

Ochotenerella sp. 1 EL-2015

92.1

91.5

100

Ochotenerella sp. 2 EL-2015

92.1

92.7 95.1

100

DNA isolated from paraffin sections of heart and stomach subjected to COI PCR produced amplicons whose DNA sequence was identical to that of the COI sequence from the adult filarid in the subcutis.

jModeltest analysis determined that the best fit evolutionary model for our nucleotide dataset is General Time Reversible, with six gamma distributed rates, and some invariant sites (GTR+G+I). GTR+G+I had the lowest corrected Akaike Information Criteria and Bayesian Information Criteria when compared to 88 other evolutionary models in this analysis. The jModeltest tree using the GTR+G+I model with the highest log likelihood had a value of -23584.41, a rate Gamma distribution with six categories (+G, parameter = 0.2963) and 26.32% of sites evolutionarily invariable. Tree construction using maximum likelihood with bootstrap phylogenetic analysis grouped the red-eyed tree frog filarial parasite with members in the genus Ochoterenella, with other filaria known to parasitize frogs in the Central and South Americas (Figure 3). The red-eyed tree frog Ochotenerella is most closely related to Ochoterenella sp. 3 EL-2015 voucher 194JW MNHN, which parasitizes Phyllomedusa bicolor the Brazilian tree frog (also called blue-and-yellow frog, bi-colored tree frog, giant monkey frog, giant-leaf frog, or waxy-monkey tree frog) in the Family Hylidae. The red-eyed tree frog Ochoterenella and Ochoterenella sp. 3 EL-2015 form a subclade with two other species of Ochoterenella, the latter nematodes parasitizing anurans in the family Bufonidae: Rhinella marina (the cane toad; Ochoterenella sp. 2 EL-2015 voucher 194JW MNHN) and Rhinella granulosa (the granular toad, common lesser toad; Ochoterenella sp. 1 EL-2015 voucher 194JW MNHN).

fig 3

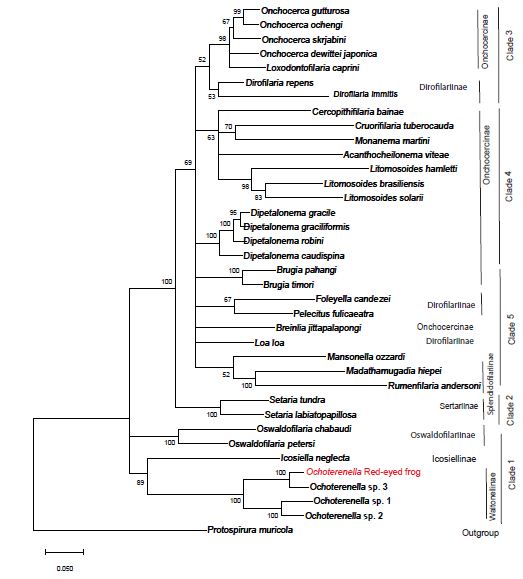
Figure 3: The phylogenetic tree represents the evolutionary history inferred by using the maximum likelihood method using the General Time Reversible model. The tree with the highest log likelihood (-23746.39) is shown. The percentage of trees in which the taxa group together is next to the branches points (based on consensus among 1,000 replicates). Partitions in which the percentage of trees is less than 50% bootstrap replicates are collapsed, partitions 50% consensus or greater are shown next to the branches. The length of each branch corresponds to the number of nucleotide substitutions per site and we provide a scale for branch length. Depicted on the right are the eight traditional subfamilies determined by morphological characters and to their right are the 5 ONC clades proposed by Lefoulon et al. (2015).

Wolbachia PCR of DNA isolated from the adult red-eyed tree frog filarial parasite did not produce a 450 bp amplicon, when compared with the amplicon resulting from PCR of total mosquito DNA as a positive control (data not shown).

Based upon our analysis of the concatenated gene sequences of the red-eyed frog filarid, the host Agalychnis callidryas, the parasite’s unique anatomical location in the host, and the absence of Wolbachia, we determined that this parasite is undescribed previously by nucleic sequence analysis and represents a unique molecular taxonomic unit.

Discussion

This is the initial molecular characterization of a red-eyed tree frog subcutaneous filarial parasite, which according to our analysis is in the genus Ochoterenella. Our data and analyses recapitulate a portion of the data from a more detailed multi-locus study of Filarioidea published by Lefoulon [8]. The study by Lefoulon [8] used sequences from three additional gene loci (hsp70, Rbp1 and myoHC) and included 11 additional filarial species in their analysis, beyond the four loci and 36 species in the current study. In that previous study and our current study, both datasets supported the GTR+G+I evolutionary substitution model. In the previous study by Lefoulon [8], the authors concluded that the 46 members of the superfamily Filarioidea in their study should be subdivided into five clades (designated ONC1 through ONC 5), not the eight subfamilies previously created using morphological characters. The ancestral clade is ONC1, containing members of the genera Oswaldofilaria, Icosiella and Ochoterenella), the ONC2 diverged from ONC1 and contains members of the genus Setaria, and the clade ONC3 contains Onchocerca, Loxodontofilaria and Dirofilaria. Our current study supports the conclusion of Lefoulon [8] to assign those same genera to the subfamilies ONC1, ONC2 and ONC3 abandoning the previous subfamily nomenclature. However, the further grouping by Lefoulon [8] of two additional clades (ONC4 and ONC5) is unsupported by our analysis. Comparing our study to that of Lefoulon [8], our study lacks the sequence information from three additional genes (myoHC, Rbp1, Hsp70). The additional information from three genes resulted in better resolution of relationships that supported Lefoulon [8] separating the ONC4 and ONC5 clades. Our molecular data supports the conclusion that the red-eyed frog filarid parasite had not previously characterized by molecular methods, and that this parasite is in the genus Ochoterenella whose members parasitize frogs. Of the four Ochoterenella that have been characterized by molecular analyses, the two that parasitize Hylidae (tree frogs) show greater similarity to each other relative to the two Ochotenerella that parasitize Bufonidae (true toads).

Previous surveys of nematode parasites in Hyalid anurans in Area de Conservacion Guanacaste, Costa Rica did not detect any microfilaria in their blood [9,10]. The Checklist of Helminth parasites of Amphibians from South America [11] catalogs publications of Filarioidea forms in Hyaloidea none of which include location of adult parasites in the subcutaneous tissues of their host: Foleyella convoluta in the body cavity of Hypsiboas faber, Leptodactylus latrans, and Leptodactylus pentadactylus; Ochoterenella convoluta in the body cavity or intestines of Dendropsophus microcephalus (Hyla microcephala), Scinax nebulosus, Leptodactylus fuscus (Leptodactylus silbilatrix and Leptodactylus typhonius), Leptodactylus latrans and Leptodactylus pentadactylus; Ochoterenella digicaudata in the body cavity of Hypsiboas albopunctata, Hypsiboas lanciformis, Leptodactylus labyrinthicus, Leptodactylus latrans, Trachycephalus mesophaeus and Hyla mesophaea; Ochoterenella scalaris in sublingual tissue and body cavity of Leptodactylus latrans and Leptodactylus pustulatus; and Ochoterenella vellardi the body cavity of Osteocephalus taurinus, Hypsiboas (Boana) fasciatus (Hyla fasciata), and Osteocephalus taurinus.

The arthropod intermediate host that transmits the red-eyed frog Ochoterenella is unknown. The intermediate host for the life cycle of most filaria of frogs are either ticks or mites, although mosquitos could also function in this role. Determining the intermediate host of the red-eyed tree frog filarial parasite will provide insight into the geographic range of amphibian hosts that may harbor this nematode. Studies that included examining filarial parasites of amphibians and reptiles for Wolbachia [2], concluded that members of the genus Ochoterenella did not contain the endosymbiont bacteria, recapitulated by our finding in the filarid of the red-eyed tree frog.

Abbreviations

DNA: Deoxyribonucleic Acid

16S rRNA: Bacterial Small Ribosomal Subunit Gene

18S rRNA: Eukaryotic Large Ribosomal Subunit Gene

12S rRNA: Mitochondrial Small Ribosomal Subunit Gene

28S rRNA: Eukaryotic Large Ribosomal Subunit Gene

COI: Mitochondrial Cytochrome Oxidase Type I Gene

myoHC: Myosin Heavy Chain Gene

Rbp1: DNA-Dependent RNA Polymerase Type 1 Gene

Hsp70: Heat-Shock Protein 70 Kilodalton Gene

µL: Microliter

µM: Micromolar

LBK: Luria-Bertani Agar or Broth with kanamycin.

References

  1. Eamsobhana P, Lim PE, Yong HSc (2013) Molecular phylogeny of filarial worms (Nematoda: Filarioidea). The Raffles Bulletin of Zoology 29: 99-109.
  2. Taylor MJ, Voronin D, Johnston KL, Ford L (2013) Wolbachia filarial interactions. Cellular Microbiology 15: 520-526. [crossref]
  3. Ferri E, Bain O, Barbuto M, Martin C, Lo N, et al. (2011) New insights into the evolution of Wolbachia infections in filarial nematodes inferred from a large range of screened species. PLOS One 6: 20843. [crossref]
  4. Leary S, Underwood W, Anthony R, Cartner S, Grandin T, et al. (2020) AVMA Guidelines for the Euthanasia of Animals: 2020 Edition. American Veterinary Medical Association, Schaumburg, Illinois.
  5. Feldman SH, Bowman SG (2007) Molecular phylogeny of the pinworms of mice, rats and rabbits, and its use to develop molecular beacon assays for the detection of pinworms in mice. Lab Animal (Nature) 36: 43-50. [crossref]
  6. Kumar S, Stecher G, Mi L, Knyaz C, Tamura K (2018) MEGA X: Molecular Evolutionary Genetics Analysis across computing platforms. Mol Biol and Evol 35: 1547-1549. [crossref]
  7. Posada D (2008) jModelTest: Phylogenetic model averaging. Mol Biol and Evol 25: 1253-1256. [crossref]
  8. Lefoulon E, Bain O, Bourret J, Junker K, Guerrero R, et al. (2015) Shaking the tree: Multi-locus sequence typing usurps current Onchocercid (filarial nematode) phylogeny. PLoS Neglected Trop Dis 9: 0004233. [crossref]
  9. Bursey CR, Brooks DR (2010) Nematode parasites of 41 anuran species from the Area de Conservacion Guanacaste, Costa Rica. Comp Parasitol 77: 221-231.
  10. Desser SS (2001) The blood parasites of anurans from Costa Rica with reflections on the taxonomy of their trypanosomes. J Parasitol 87: 152-160. [crossref]
  11. Compião KM, Morais DH, Dias OT, Aguiar A, Toledo G, et al. (2014) Checklist of helminth parasites of amphibians from South America. Zootaxa 3843: 1-93. [crossref]

The Significant and Profound Impacts of Pseudo K-Tuple Nucleotide Composition

DOI: 10.31038/AMM.2020111


The “pseudo K-tuple nucleotide composition” or “PseKNC” [1], is an extended version of “pseudo amino acid composition” [2] or “PseAAC” [3].

Both PseAAC and PseKNC are of vector descriptor, but the former represents protein or peptide sequences while the latter represents DNA or RNA sequences.

Just like “PseAAC” (see, e.g., [4-35]) or “Pseudo amino acid composition” being very successful (see, e.g., [36-127]), it is indeed both significant and profound.

References

  1. Chen W, Lei TY, Jin DC, Lin H, Chou KC, PseKNC, et al. (2014) a flexible web-server for generating pseudo K-tuple nucleotide composition. Anal Biochem 456: 53-60.[crossref]
  2. Chou (2001) Prediction of protein cellular attributes using pseudo amino acid composition, PROTEINS : Structure, Function, and Genetics (Erratum: ibid., Vol.44, 60), 43: 246-255. [crossref]
  3. Chou KC (2005) Using amphiphilic pseudo amino acid composition to predict enzyme subfamily classes. Bioinformatics 21: 10-19. [crossref]
  4. Hayat M, Khan A (2012) Discriminating Outer Membrane Proteins with Fuzzy K-Nearest Neighbor Algorithms Based on the General Form of Chou’s PseAAC. Protein & Peptide Letters 19: 411-421. [crossref]
  5. Liao B, Xiang Q, Li D (2012) Incorporating Secondary Features into the General form of Chou’s PseAAC for Predicting Protein Structural Class. Protein & Peptide Letters 19: 1133-1138.
  6. Mei S (2012) Multi-kernel transfer learning based on Chou’s PseAAC formulation for protein submitochondria localization. J Theor Biol 293: 121-130.
  7. Mei S (2012) Predicting plant protein subcellular multi-localization by Chou’s PseAAC formulation based multi-label homolog knowledge transfer learning. J Theor Biol 310: 80-87.
  8. Qin YF, Wang CH, Yu XQ, Zhu J, Liu TG, Zheng XQ, et al. (2012) Predicting Protein Structural Class by Incorporating Patterns of Over-Represented k-mers into the General form of Chou’s PseAAC. Protein & Peptide Letters 19: 388-397. [crossref]
  9. Sun XY, Shi SP, Qiu JD, Suo SB, Huang SY, Liang RP, et al. (2012) Identifying protein quaternary structural attributes by incorporating physicochemical properties into the general form of Chou’s PseAAC via discrete wavelet transform. Molecular BioSystems 8: 3178-3184. [crossref]
  10. Cao DS, Xu QS, Liang YZ, propy (2013) a tool to generate various modes of Chou’s PseAAC. Bioinformatics 29: 960-962. [crossref]
  11. Chang TH, Wu LC, Lee TY, Chen SP, Huang HD, Horng JT, EuLoc, et al. (2013) a web-server for accurately predict protein subcellular localization in eukaryotes by incorporating various features of sequence segments into the general form of Chou’s PseAAC. Journal of Computer-Aided Molecular Design 27: 91-103. [crossref]
  12. Fan GL, Q.-Z. Li, Y.-C. Zuo (2013) Predicting acidic and alkaline enzymes by incorporating the average chemical shift and gene ontology informations into the general form of Chou’s PseAAC. Pocess Biochemistry 48: 1048-1053. [crossref]
  13. Pacharawongsakda E, Theeramunkong T (2013) Predict Subcellular Locations of Singleplex and Multiplex Proteins by Semi-Supervised Learning and Dimension-Reducing General Mode of Chou’s PseAAC. IEEE Transactions on Nanobioscience 12: 311-320.
  14. Xie HL, Fu L, Nie XD (2013) Using ensemble SVM to identify human GPCRs N-linked glycosylation sites based on the general form of Chou’s PseAAC. Protein Eng Des Sel 26: 735-742. [crossref]
  15. Han GS, Yu ZG, Anh V (2014) A two-stage SVM method to predict membrane protein types by incorporating amino acid classifications and physicochemical properties into a general form of Chou’s PseAAC. J Theor Biol 344: 31-39. [crossref]
  16. Li L, Yu S, Xiao W, Li Y, Li M, Huang L, Zheng X, Zhou S, Yang H, et al. (2014) Prediction of bacterial protein subcellular localization by incorporating various features into Chou’s PseAAC and a backward feature selection approach. Biochimie 104: 100-107. [crossref]
  17. Zhang J, Zhao X, Sun P, Ma Z (2014) PSNO: Predicting Cysteine S-Nitrosylation Sites by Incorporating Various Sequence-Derived Features into the General Form of Chou’s PseAAC. Int J Mol Sci 15: 11204-11219. [crossref]
  18. Liu B, Xu J, Fan S, Xu R, Jiyun J Zhou, Wang X (2015) PseDNA-Pro: DNA-binding protein identification by combining Chou’s PseAAC and physicochemical distance transformation. Molecular Informatics 34: 8-17. [crossref]
  19. Mandal M, Mukhopadhyay A, Maulik U (2015) Prediction of protein subcellular localization by incorporating multiobjective PSO-based feature subset selection into the general form of Chou’s PseAAC. Medical & Biological Engineering & Computing53: 331-344. [crossref]
  20. Sanchez V, Peinado AM, Perez-Cordoba JL, Gomez AM (2015) A new signal characterization and signal-based Chou’s PseAAC representation of protein sequences. Journal of Bioinformatics and Computational Biology 13 1550024.
  21. Kabir M, Hayat M (2016) iRSpot-GAEnsC: identifing recombination spots via ensemble classifier and extending the concept of Chou’s PseAAC to formulate DNA samples. Molecular Genetics and Genomics 291: 285-296. [crossref]
  22. Tahir M, Hayat M (2016) iNuc-STNC: a sequence-based predictor for identification of nucleosome positioning in genomes by extending the concept of SAAC and Chou’s PseAAC. Mol Biosyst 12: 2587-2593. [crossref]
  23. Ju Z, He JJ (2017) Prediction of lysine propionylation sites using biased SVM and incorporating four different sequence features into Chou’s PseAAC. J Mol Graph Model 76: 356-363. [crossref]
  24. Yu B, Li S, Qiu WY, Chen C, Chen RX, Wang L, Wang MH, Zhang Y, et al. (2017) Accurate prediction of subcellular location of apoptosis proteins combining Chou’s PseAAC and PsePSSM based on wavelet denoising. Oncotarget 8: 107640-107665. [crossref]
  25. Ahmad J, Hayat M (2018) MFSC: Multi-voting based Feature Selection for Classification of Golgi Proteins by Adopting the General form of Chou’s PseAAC components. J Theor Biol 463: 99-109. [crossref]
  26. Akbar S, Hayat M (2018) iMethyl-STTNC: Identification of N(6)-methyladenosine sites by extending the Idea of SAAC into Chou’s PseAAC to formulate RNA sequences. J Theor Biol 455: 205-211. [crossref]
  27. Contreras-Torres E (2018) Predicting structural classes of proteins by incorporating their global and local physicochemical and conformational properties into general Chou’s PseAAC. J Theor Biol 454: 139-145. [crossref]
  28. Fu X, Zhu W, Liso B, Cai L, Peng L, Yang J, et al. (2018) Improved DNA-binding protein identification by incorporating evolutionary information into the Chou’s PseAAC. IEEE Access 18: 43-66. [crossref]
  29. Javed F, Hayat M (2018) Predicting subcellular localizations of multi-label proteins by incorporating the sequence features into Chou’s PseAAC. Genomics 17: 793-821. [crossref]
  30. Mousavizadegan M, Mohabatkar H (2018) Computational prediction of antifungal peptides via Chou’s PseAAC and SVM. Journal of Bioinformatics and Computational Biology [crossref]
  31. Zhang S, Liang Y (2018) Predicting apoptosis protein subcellular localization by integrating auto-crosscorrelation and PSSM into Chou’s PseAAC. J Theor Biol 457: 163-169. [crossref]
  32. Ahmad J, Hayat M (2019) MFSC: Multi-voting based feature selection for classification of Golgi proteins by adopting the general form of Chou’s PseAAC components. J Theor Biol 463: 99-109. [crossref]
  33. Butt AH, Rasool N, Khan YD (2019) Prediction of antioxidant proteins by incorporating statistical moments based features into Chou’s PseAAC. J Theor Biol 473: 1-8.
  34. Javed F, Hayat M (2019) Predicting subcellular localization of multi-label proteins by incorporating the sequence features into Chou’s PseAAC. Genomics 111: 1325-1332. [crossref]
  35. Tahir M, Hayat M, Khan SA (2019) iNuc-ext-PseTNC: an efficient ensemble model for identification of nucleosome positioning by extending the concept of Chou’s PseAAC to pseudo-tri-nucleotide composition. Molecular Genetics and Genomics: MGG 294: 199-210. [crossref]
  36. Ding YS, Zhang TL (2008) Using Chou’s pseudo amino acid composition to predict subcellular localization of apoptosis proteins: an approach with immune genetic algorithm-based ensemble classifier. Pattern Recognition Letters 29: 1887-1892. [crossref]
  37. Fang Y, Guo Y, Feng Y, Li M (2008) Predicting DNA-binding proteins: approached from Chou’s pseudo amino acid composition and other specific sequence features. Amino Acids 34: 103-109. [crossref]
  38. Jiang X, Wei R, Zhang TL, Gu Q (2008) Using the concept of Chou’s pseudo amino acid composition to predict apoptosis proteins subcellular location: an approach by approximate entropy. Protein & Peptide Letters 15: 392-396. [crossref]
  39. Jiang X, Wei R, Zhao Y, Zhang T (2008) Using Chou’s pseudo amino acid composition based on approximate entropy and an ensemble of AdaBoost classifiers to predict protein subnuclear location. Amino Acids 34: 669-675. [crossref]
  40. Li FM, Li QZ (2008) Predicting protein subcellular location using Chou’s pseudo amino acid composition and improved hybrid approach. Protein & Peptide Letters 15: 612-616. [crossref]
  41. Lin H (2008) The modified Mahalanobis discriminant for predicting outer membrane proteins by using Chou’s pseudo amino acid composition. J Theor Biol 252: 350-356. [crossref]
  42. Lin H, Ding H, Guo FB, Zhang AY, Huang J (2008) Predicting subcellular localization of mycobacterial proteins by using Chou’s pseudo amino acid composition. Protein & Peptide Letters 15: 739-744. [crossref]
  43. Nanni L, Lumini A (2008) Genetic programming for creating Chou’s pseudo amino acid based features for submitochondria localization. Amino Acids 34: 653-660. [crossref]
  44. Zhang GY, Li HC, Gao JQ, Fang BS (2008) Predicting lipase types by improved Chou’s pseudo amino acid composition. Protein & Peptide Letters 15: 1132-1137. [crossref]
  45. Zhang SW, Chen W, Yang F, Pan Q (2008) Using Chou’s pseudo amino acid composition to predict protein quaternary structure: a sequence-segmented PseAAC approach, Amino Acids 35: 591-598. [crossref]
  46. Zhang SW, Zhang YL, Yang HF, Zhao CH, Pan Q (2008) Using the concept of Chou’s pseudo amino acid composition to predict protein subcellular localization: an approach by incorporating evolutionary information and von Neumann entropies. Amino Acids 34: 565-572. [crossref]
  47. Chen C, Chen L, Zou X, Cai P (2009) Prediction of protein secondary structure content by using the concept of Chou’s pseudo amino acid composition and support vector machine. Protein & Peptide Letters 16: 27-31. [crossref]
  48. Georgiou DN, Karakasidis TE, Nieto JJ, Torres A (2009) Use of fuzzy clustering technique and matrices to classify amino acids and its impact to Chou’s pseudo amino acid composition. J Theor Biol 257: 17-26. [crossref]
  49. Li ZC, Zhou XB, Dai Z, Zou XY (2009) Prediction of protein structural classes by Chou’s pseudo amino acid composition: approached using continuous wavelet transform and principal component analysis. Amino Acids 37: 415-425. [crossref]
  50. Lin H, Wang H, Ding H, Chen YL, Li QZ (2009) Prediction of Subcellular Localization of Apoptosis Protein Using Chou’s Pseudo Amino Acid Composition. Acta Biotheoretica 57 321-330. [crossref]
  51. Qiu JD, Huang JH, Liang RP, Lu XQ (2009) Prediction of G-protein-coupled receptor classes based on the concept of Chou’s pseudo amino acid composition: an approach from discrete wavelet transform. Anal Biochem 390: 68-73. [crossref]
  52. Zeng YH, Guo YZ, Xiao RQ, Yang L, Yu LZ, Li ML, et al. (2009) Using the augmented Chou’s pseudo amino acid composition for predicting protein submitochondria locations based on auto covariance approach. J Theor Biol 259: 366–372.
  53. Esmaeili M, Mohabatkar H, Mohsenzadeh S (2010) Using the concept of Chou’s pseudo amino acid composition for risk type prediction of human papillomaviruses. J Theor Biol 263: 203-209. [crossref]
  54. Gu Q, Ding YS, Zhang TL (2010) Prediction of G-Protein-Coupled Receptor Classes in Low Homology Using Chou’s Pseudo Amino Acid Composition with Approximate Entropy and Hydrophobicity Patterns. Protein & Peptide Letters 17: 559-567. [crossref]
  55. Mohabatkar H (2010) Prediction of cyclin proteins using Chou’s pseudo amino acid composition. Protein & Peptide Letters 17: 1207-1214. [crossref]
  56. Qiu JD, Huang JH, Shi SP, Liang RP (2010) Using the concept of Chou’s pseudo amino acid composition to predict enzyme family classes: an approach with support vector machine based on discrete wavelet transform. Protein : Peptide Letters 17: 715-722. [crossref]
  57. Sahu SS, Panda G (2010) A novel feature representation method based on Chou’s pseudo amino acid composition for protein structural class prediction. Computational Biology and Chemistry 34: 320-327.
  58. Yu L, Guo Y, Li Y, Li G, Li M, Luo J, Xiong W, Qin W, et al. (2010) SecretP: Identifying bacterial secreted proteins by fusing new features into Chou’s pseudo amino acid composition. J Theor Biol 267: 1-6. [crossref]
  59. Guo J, Rao N, Liu G, Yang Y, Wang G (2011) Predicting protein folding rates using the concept of Chou’s pseudo amino acid composition. Journal of: Computational Chemistry 32: 1612-1617. [crossref]
  60. Lin J, Wang Y (2011) Using a novel AdaBoost algorithm and Chou’s pseudo amino acid composition for predicting protein subcellular localization. Protein & Peptide Letters 18: 1219-1225.
  61. Lin J, Wang Y, Xu X (2011) A novel ensemble and composite approach for classifying proteins based on Chou’s pseudo amino acid composition. African Journal of Biotechnology 10: 16963-16968.
  62. Mohabatkar H, Mohammad Beigi, Esmaeili A (2011) Prediction of GABA(A) receptor proteins using the concept of Chou’s pseudo amino acid composition and support vector machine. J Theor Biol 281: 18-23. [crossref]
  63. Mohammad BM, Behjati M, Mohabatkar H (2011) Prediction of metalloproteinase family based on the concept of Chou’s pseudo amino acid composition using a machine learning approach. Journal of Structural and Functional Genomics 12: 191-197. [crossref]
  64. Qiu JD, Suo SB, Sun XY, Shi SP, Liang RP (2011) OligoPred: A web-server for predicting homo-oligomeric proteins by incorporating discrete wavelet transform into Chou’s pseudo amino acid composition. Journal of Molecular Graphics & Modelling 30: 129-134. [crossref]
  65. Zou D, He Z, He J, Xia Y (2011) Supersecondary structure prediction using Chou’s pseudo amino acid composition. J Comput Chem 32: 271-278. [crossref]
  66. Cao JZ, Liu WQ, Gu H (2012) Predicting Viral Protein Subcellular Localization with Chou’s Pseudo Amino Acid Composition and Imbalance-Weighted Multi-Label K-Nearest Neighbor Algorithm. Protein and Peptide Letters 19: 1163-1169. [crossref]
  67. Chen C, Shen ZB, Zou XY (2012) Dual-Layer Wavelet SVM for Predicting Protein Structural Class Via the General Form of Chou’s Pseudo Amino Acid Composition. Protein & Peptide Letters 19: 422-429. [crossref]
  68. Du P, Wang X, Xu C, Gao Y (2012) PseAAC-Builder: A cross-platform stand-alone program for generating various special Chou’s pseudo amino acid compositions. Anal Biochem 425: 117-119. [crossref]
  69. Fan GL, Li QZ (2012) Predict mycobacterial proteins subcellular locations by incorporating pseudo-average chemical shift into the general form of Chou’s pseudo amino acid composition. J Theor Biol 304: 88-95. [crossref]
  70. Fan GL, Li QZ (2012) Predicting protein submitochondria locations by combining different descriptors into the general form of Chou’s pseudo amino acid composition. Amino Acids 43: 545-555. [crossref]
  71. Li LQ, Zhang Y, Zou LY, Zhou Y, Zheng XQ (2012) Prediction of Protein Subcellular Multi-Localization Based on the General form of Chou’s Pseudo Amino Acid Composition. Protein & Peptide Letters 19: 375-387.
  72. Liu L, Hu XZ, Liu XX, Wang Y, Li SB (2012) Predicting Protein Fold Types by the General Form of Chou’s Pseudo Amino Acid Composition: Approached from Optimal Feature Extractions. Protein & Peptide Letters 19: 439-449. [crossref]
  73. Nanni L, Brahnam S, Lumini A (2012) Wavelet images and Chou’s pseudo amino acid composition for protein classification. Amino Acids 43: 657-665. [crossref]
  74. Nanni L, Lumini A, Gupta D, Garg A (2012) Identifying bacterial virulent proteins by fusing a set of classifiers based on variants of Chou’s pseudo amino acid composition and on evolutionary information. IEEE-ACM Transaction on Computational Biolology and Bioinformatics 9: 467-475. [crossref]
  75. Niu XH, Hu XH, Shi F, Xia JB (2012) Predicting Protein Solubility by the General Form of Chou’s Pseudo Amino Acid Composition: Approached from Chaos Game Representation and Fractal Dimension. Protein & Peptide Letters 19: 940-948. [crossref]
  76. Ren LY, Zhang YS, Gutman I (2012) Predicting the Classification of Transcription Factors by Incorporating their Binding Site Properties into a Novel Mode of Chou’s Pseudo Amino Acid Composition. Protein & Peptide Letters 19: 1170-1176. [crossref]
  77. Zhao XW, Ma ZQ, Yin MH (2012) Predicting protein-protein interactions by combing various sequence- derived features into the general form of Chou’s Pseudo amino acid composition. Protein & Peptide Letters 19: 492-500.
  78. Zia-ur-Rehman, Khan A (2012) Identifying GPCRs and their Types with Chou’s Pseudo Amino Acid Composition: An Approach from Multi-scale Energy Representation and Position Specific Scoring Matrix. Protein & Peptide Letters 19: 890-903. [crossref]
  79. Chen YK, Li KB (2013) Predicting membrane protein types by incorporating protein topology, domains, signal peptides, and physicochemical properties into the general form of Chou’s pseudo amino acid composition. J Theor Biol 318: 1-12. [crossref]
  80. Fan GL, Li QZ (2013) Discriminating bioluminescent proteins by incorporating average chemical shift and evolutionary information into the general form of Chou’s pseudo amino acid composition. J Theor Biol 334: 45-51. [crossref]
  81. Georgiou DN, Karakasidis TE, Megaritis AC (2013) A short survey on genetic sequences, Chou’s pseudo amino acid composition and its combination with fuzzy set theory. The Open Bioinformatics Journal 7: 41-48. [crossref]
  82. Gupta MK, Niyogi R, Misra M (2013) An alignment-free method to find similarity among protein sequences via the general form of Chou’s pseudo amino acid composition. SAR QSAR Environ Res 24: 597-609. [crossref]
  83. Huang C, Yuan J (2013) Using radial basis function on the general form of Chou’s pseudo amino acid composition and PSSM to predict subcellular locations of proteins with both single and multiple sites. Biosystems 113: 50-57. [crossref]
  84. Huang C, Yuan JQ (2013) A multilabel model based on Chou’s pseudo amino acid composition for identifying membrane proteins with both single and multiple functional types. J Membr Biol 246: 327-334. [crossref]
  85. Huang C, Yuan JQ (2013) Predicting protein subchloroplast locations with both single and multiple sites via three different modes of Chou’s pseudo amino acid compositions. J Theor Biol 335: 205-212.
  86. Khosravian M, Faramarzi FK, Beigi MM, Behbahani M, Mohabatkar H, et al. (2013) Predicting Antibacterial Peptides by the Concept of Chou’s Pseudo amino Acid Composition and Machine Learning Methods. Protein & Peptide Letters 20: 180-186. [crossref]
  87. Lin H, Ding C, L.-F. Yuan, Chen W, Ding H, Z.-Q. Li, F.-B. Guo, Huang J, N.-N. Rao, et al. (2013) Predicting subchloroplast locations of proteins based on the general form of Chou’s pseudo amino acid composition: Approached from optimal tripeptide composition. International Journal of Biomethmatics 6: 1350003.
  88. Liu B, Wang X, Zou Q, Dong Q, Chen Q (2013) Protein remote homology detection by combining Chou’s pseudo amino acid composition and profile-based protein representation. Molecular Informatics 32: 775-782. [crossref]
  89. Mohabatkar H, Beigi MM, Abdolahi K, Mohsenzadeh S (2013) Prediction of Allergenic Proteins by Means of the Concept of Chou’s Pseudo Amino Acid Composition and a Machine Learning Approach. Medicinal Chemistry 9: 133-137. [crossref]
  90. Qin YF, Zheng L, Huang J (2013) Locating apoptosis proteins by incorporating the signal peptide cleavage sites into the general form of Chou’s Pseudo amino acid composition. Int J Quantum Chem 113: 1660-1667.
  91. Sarangi AN, Lohani M, Aggarwal R (2013) Prediction of Essential Proteins in Prokaryotes by Incorporating Various Physico-chemical Features into the General form of Chou’s Pseudo Amino Acid Composition. Protein Pept Lett 20: 781-795. [crossref]
  92. Wan S, Mak MW, Kung SY (2013) GOASVM: A subcellular location predictor by incorporating term-frequency gene ontology into the general form of Chou’s pseudo amino acid composition. J Theor Biol 323: 40-48. [crossref]
  93. Wang X, Li GZ, Lu WC (2013) Virus-ECC-mPLoc: a multi-label predictor for predicting the subcellular localization of virus proteins with both single and multiple sites based on a general form of Chou’s pseudo amino acid composition. Protein & Peptide Letters 20: 309-317. [crossref]
  94. Xiaohui N, Nana L, Jingbo X, Dingyan C, Yuehua P, Yang X, Weiquan W, Dongming W, Zengzhen W, et al. (2013) Using the concept of Chou’s pseudo amino acid composition to predict protein solubility: An approach with entropies in information theory. J Theor Biol 332: 211-217. [crossref]
  95. Du P, Gu S, Jiao Y (2014) PseAAC-General: Fast building various modes of general form of Chou’s pseudo amino acid composition for large-scale protein datasets. International Journal of Molecular Sciences 15: 3495-3506. [crossref]
  96. Hajisharifi Z, Piryaiee M, Mohammad M Beigi, Behbahani M, Mohabatkar H (2014) Predicting anticancer peptides with Chou’s pseudo amino acid composition and investigating their mutagenicity via Ames test. J Theor Biol 341: 34-40. [crossref]
  97. Jia C, Lin X, Wang Z (2014) Prediction of Protein S-Nitrosylation Sites Based on Adapted Normal Distribution Bi-Profile Bayes and Chou’s Pseudo Amino Acid Composition. Int J Mol Sci 15: 10410-10423. [crossref]
  98. Kong L, Zhang L, Lv J (2014) Accurate prediction of protein structural classes by incorporating predicted secondary structure information into the general form of Chou’s pseudo amino acid composition. J Theor Biol 344: 12-18. [crossref]
  99. Nanni L, Brahnam S, Lumini A (2014) Prediction of protein structure classes by incorporating different protein descriptors into general Chou’s pseudo amino acid composition. J Theor Biol 360: 109-116. [crossref]
  100. Zhang J, Sun P, Zhao X, Ma Z (2014) PECM: Prediction of extracellular matrix proteins using the concept of Chou’s pseudo amino acid composition. J Theor Biol 363: 412-418. [crossref]
  101. Zhang L, Zhao X, Kong L (2014) Predict protein structural class for low-similarity sequences by evolutionary difference information into the general form of Chou’s pseudo amino acid composition. J Theor Biol 355: 105-110. [crossref]
  102. Zuo YC, Peng Y, Liu L, Chen W, Yang L, Fan GL (2014) Predicting peroxidase subcellular location by hybridizing different descriptors of Chou’s pseudo amino acid patterns. Anal Biochem 458: 14-19. [crossref]
  103. Ali F, Hayat M (2015) Classification of membrane protein types using Voting Feature Interval in combination with Chou’s Pseudo Amino Acid Composition. J Theor Biol 384: 78-83. [crossref]
  104. Fan GL, Zhang XY, Liu YL, Nang Y, Wang H (2015) DSPMP: Discriminating secretory proteins of malaria parasite by hybridizing different descriptors of Chou’s pseudo amino acid patterns. J Comput Chem 36: 2317-2327. [crossref]
  105. Huang C, Yuan JQ (2015) Simultaneously Identify Three Different Attributes of Proteins by Fusing their Three Different Modes of Chou’s Pseudo Amino Acid Compositions. Protein Pept Lett 22: 547-556.
  106. Khan ZU, Hayat M, Khan MA (2015) Discrimination of acidic and alkaline enzyme using Chou’s pseudo amino acid composition in conjunction with probabilistic neural network model. J Theor Biol 365: 197-203. [crossref]
  107. Kumar R, Srivastava A, Kumari B, Kumar M (2015) Prediction of beta-lactamase and its class by Chou’s pseudo amino acid composition and support vector machine. J Theor Biol 365: 96-103. [crossref]
  108. Wang X, Zhang W, Zhang Q, Li GZ (2015) MultiP-SChlo: multi-label protein subchloroplast localization prediction with Chou’s pseudo amino acid composition and a novel multi-label classifier. Bioinformatics 31: 2639-2645. [crossref]
  109. Jiao YS, Du PF (2016) Prediction of Golgi-resident protein types using general form of Chou’s pseudo amino acid compositions: Approaches with minimal redundancy maximal relevance feature selection. J Theor Biol 402: 38-44. [crossref]
  110. Tang H, Chen W, Lin H (2016) Identification of immunoglobulins using Chou’s pseudo amino acid composition with feature selection technique. Mol Biosyst 12: 1269-1275. [crossref]
  111. Zou HL, Xiao X (2016) Predicting the Functional Types of Singleplex and Multiplex Eukaryotic Membrane Proteins via Different Models of Chou’s Pseudo Amino Acid Compositions. J Membr Biol 249: 23-29.
  112. Huo H, Li T, Wang S, Lv Y, Zuo Y, Yang L (2017) Prediction of presynaptic and postsynaptic neurotoxins by combining various Chou’s pseudo components. Sci Rep 7: 5827.
  113. Rahimi M, Bakhtiarizadeh MR, Mohammadi A -Sangcheshmeh (2017) OOgenesis_Pred: A sequence-based method for predicting oogenesis proteins by six different modes of Chou’s pseudo amino acid composition. J Theor Biol 414: 128-136. [crossref]
  114. Tripathi P, Pandey PN (2017) A novel alignment-free method to classify protein folding types by combining spectral graph clustering with Chou’s pseudo amino acid composition. J Theor Biol 424: 49-54. [crossref]
  115. Yu B, Lou L, Li S, Zhang Y, Qiu W, Wu X, Wang M, Tian B, et al. (2017) Prediction of protein structural class for low-similarity sequences using Chou’s pseudo amino acid composition and wavelet denoising. J Mol Graph Model 76: 260-273. [crossref]
  116. Al Maruf MA, Shatabda S (2018) iRSpot-SF: Prediction of recombination hotspots by incorporating sequence based features into Chou’s Pseudo components. Genomics 18: 63-82. [crossref]
  117. Arif M, Hayat M, Jan Z (2018) iMem-2LSAAC: A two-level model for discrimination of membrane proteins and their types by extending the notion of SAAC into Chou’s pseudo amino acid composition. J Theor Biol 442: 11-21. [crossref]
  118. Cui X, Yu Z, Yu B, Wang M, Tian B, Ma Q (2018) UbiSitePred: A novel method for improving the accuracy of ubiquitination sites prediction by using LASSO to select the optimal Chou’s pseudo components. Chemometrics and Intelligent Laboratory Systems (CHEMOLAB) 17: 512-538. [crossref]
  119. Mei J, Zhao J (2018) Prediction of HIV-1 and HIV-2 proteins by using Chou’s pseudo amino acid compositions and different classifiers. Sci Rep 8: 2359.
  120. Zhang L, Kong L (2018) iRSpot-ADPM: Identify recombination spots by incorporating the associated dinucleotide product model into Chou’s pseudo components. J Theor Biol 441: 1-8. [crossref]
  121. Zhang S, Yang K, Lei Y, Song K (2018) iRSpot-DTS: Predict recombination spots by incorporating the dinucleotide-based spare-crosscovariance information into Chou’s pseudo components. Genomics 11: 457-464. [crossref]
  122. Al Maruf MA, Shatabda S (2019) iRSpot-SF: Prediction of recombination hotspots by incorporating sequence based features into Chou’s Pseudo components. Genomics 111: 966-972. [crossref]
  123. Nosrati M, Mohabatkar H, Behbahani M (2019) Introducing of an integrated artificial neural network and Chou’s pseudo amino acid composition approach for computational epitope-mapping of Crimean-Congo haemorrhagic fever virus antigens. International Immunopharmacology 78: 106020. [crossref]
  124. Pan Y, Wang S, Zhang Q, Lu Q, Su D, Zuo Y, Yang L, et al. (2019) Analysis and prediction of animal toxins by various Chou’s pseudo components and reduced amino acid compositions. J Theor Biol 462: 221-229. [crossref]
  125. Tahir M, Tayara H, Chong KT (2019) iRNA-PseKNC(2methyl): Identify RNA 2′-O-methylation sites by convolution neural network and Chou’s pseudo components. J Theor Biol 465: 1-6.
  126. Tian B, Wu X, Chen C, Qiu W, Ma Q, Yu B (2019) Predicting protein-protein interactions by fusing various Chou’s pseudo components and using wavelet denoising approach. J Theor Biol 462: 329-346. [crossref]
  127. Zhang L, Kong L (2019) iRSpot-PDI: Identification of recombination spots by incorporating dinucleotide property diversity information into Chou’s pseudo components. Genomics 111: 457-464. [crossref]

Substitution of Expensive Protein Sources by Soybean Meal Supplemented with a β-Mannanase Enzyme Results in Improved General Clinical Health Score during the Post-Weaning Period

DOI: 10.31038/IJVB.2020422

Abstract

Enzyme supplementation with a β-mannanase to degrade β-mannan fibers present in the diet has been to shown restore and improves performance in swine. The current study compared the effects of a commercial 2-phase piglet post-weaning diet (Control) and an adapted diet supplemented with a β-mannanase (Hemicell HT; Elanco) (Enzyme) on the performance of post-weaned piglets. The alternative diet with β-mannanase performed equal to the regular commercial formulation (P > 0.05) with no need for antimicrobial treatment during the entire trial period. No mortality occurred in any of treatments. The general clinical condition scores were significantly (P < 0.05) better in the Enzyme-treated as compared to the Control group. Fecal clinical scores did not differ significantly (P > 0.05) among treatment groups. In conclusion, the current study suggests that the use of an exogenous heat-tolerant β-mannanase allowed reduced levels of expensive protein sources to be used in the first diet post-weaning, and an energy reduction of 63 kcal/kg net energy to be used in the second diet without adverse effects on intestinal health or overall performance. In fact, the general clinical condition was scored significantly (P < 0.05) better on the β-mannanase supplemented diets.

Keywords

β-Mannanase, Protein substitution, Weaned piglets, Performance

Introduction

Piglet post-weaning diets are by far the most expensive diets in the swine industry, mainly due to the need to reduce Post-Weaning Diarrhea (PWD) and optimize growth performance by including highly digestible feed ingredients with low content of antinutritive factors. It would therefore be economically advantageous, if some of the expensive protein sources that are generally considered necessary in diets for newly weaned piglets could be substituted with soy bean meal (SBM). Unfortunately, SBM contains several antinutritive factors, and β-mannan is one of them, which also is found in many other common feed ingredients [1], that have received increasing attention in recent years. β-Mannans are linear polysaccharides with a backbone mainly composed of repeating units of β-1,4-mannose and α-1,6-galactose and/or glucose units attached to the backbone [2,3]. They are considered unsuitable for young piglets due to their antinutritive properties, mainly due to stimulation of the innate immune response. The innate immune cells identify pathogens using distinct molecules, called pathogen associated molecular patterns (PAMP), expressed on the pathogen surface [4]. Binding of PAMP to pathogen recognition receptors (PRR), present on innate immune cells, results in the release of innate defense molecules such as reactive oxygen and nitrogen species, bacteriolytic enzymes, antimicrobial peptides and complement proteins [5]. These PAMP include complex polysaccharides such as β-mannan [4]. Therefore, β-mannans from feed can create a false signal about the presence of pathogens in the gut, that elicits an unwarranted immune activation [6,7], which is also known as a feed induced immune response (FIIR). The recognition of β-mannans elicits a futile immune response that causes energy and nutrients to be wasted [3]. Hydrolysis of these β-mannans by dietary inclusion of an exogenous β-mannanase enzyme can reduce and potentially eliminate their ability to induce FIIR.

Supplementation of β-mannanase to low- and high-mannan diets has the potential to improve the performance of growing pigs [8]. Moreover, ingredients with high β-mannan content like palm kernel meal (PKM) or copra meal may partially replace SBM without reducing pig performance if β-mannanase is supplemented to the diet [8,9]. Some researchers have suggested that the improved pig performance following β-mannanase supplementation to corn-SBM-PKM diets might be due to increased ileal digestibility of different amino acids [10-12]. Others concluded that β-mannanase improved growth performance in both weanling and growing-finishing pigs on corn-SBM diets [13-15] with minimal effects on nutrient digestibility [14]. Innate immune activation is accompanied by down-regulation of anabolic functions [16], which translates into a reduced performance capacity. Understanding energy and nutrient partitioning in immune-stressed piglets may provide more insights into the effects of FIIR activation by β-mannans from feed.

The objective of the current study was to evaluate the effects of β-mannanase supplementation to nursery diets with reduced content of expensive, high quality proteins on performance of nursery piglets in the presence of a natural E. coli PWD infection.

Materials and Methods

Description of Experimental Farm

The trial was performed in a post-weaning facility receiving batches of piglets (n = 160) from the same sow farm in Flanders (Belgium), operated with a 4-week batch-management system. The post-weaning facility is managed on all-in/all-out basis in all production phases. This management approach improved the health status for several respiratory pathogens [17].

Piglets were weaned at 21 days of age, and immediately transported to a specifically equipped post-weaning facility, where they were raised for 47 days post-weaning (dpw). The post-weaning facility was equipped with 2 compartments, each with 16 pens of 10 piglets with one central inspection aisle. Every pen was equipped with a dry feeder, a separate waterer, and fully slatted plastic floors. Heating was provided by hot water tubes on the ceiling and ventilation was performed through one evacuation ventilator positioned centrally in the compartment. Fresh air entered into the compartment through a system of door ventilation following a passage through a central corridor.

Experimental Design

Treatment Groups and Feeding Regimen

Two experimental treatments were used, where T-1 (Control) received the standard diets and T-2 (Enzyme) received the adapted nursery diets. A 2-phase feeding program with two basal mash diets was used: a common commercial diet, and a similar adapted diet with 300 g/tonne of a heat-tolerant endo-1,4-β-mannanase (Hemicell HT Dry; Elanco), where expensive protein sources were partially replaced with extruded SBM in phase 1. The β-mannanase enzyme was added on top in phase 1 and formulated to provide 63kcal/kg NE in phase 2. The composition and nutrient content of the diets are given in Tables 1 and 2. The phase 1 diets were offered from days 1-21 and phase 2 from days 22-47.

Table 1: Composition of the diets.


Phase 1

Phase 2

Composition (%)

Control

Enzyme

Control

Enzyme

Wheat

32.00

32.00

33.42

26.75

Barley

19.82

18.94

25.00

25.00

Wheat gluten feed

0.00

5.00

Danex GGO-F (extruded SBM)

10.00

8.00

Soya 48

7.74

9.88

18.74

17.58

Corn

7.50

7.50

10.00

10.00

Rice feed meal

3.00

3.00

Whey powder, sweet

6.00

6.00

Rape seed meal

1.47

2.00

Corn, extruded

5.00

5.00

Potato protein

2.00

1.85

Wheat milling byproduct (15,3% CP; 8,4% CF; 21% starch)

0.00

2.43

Beet pulp

2.00

2.00 2.00

2.00

Spelt bran

2.00

2.00 2.00

2.00

Soy oil

0.39

0.91 0.34

0.00

Fish oil

0.50

0.50

Fatty acids 30% linoleic acid

0.50

0.50

Premix, enzymes, amino acids, acids, salt

5.05

5.12 2.97

2.91

Monocal

0.31

0.28

Limestone

0.25

0.24

Hemicell HT (10%)

0.00

0.30 0.00

0.30

Table 2: Calculated nutrient content of the diets.


Phase 1

Phase 2

Nutrient content

Control

Enzyme Control

Enzyme

Crude protein (%)

17.74

17.69 17.50

17.50

Crude fat (%)

4.82

4.97 3.50

3.58

Crude fibre (%)

4.12

4.11 4.38

4.81

Crude ashes (%)

4.53

4.55 4.34

4.49

Sugar (%)

5.59

5.62 3.71

4.00

Starch (%)

38.65

38.16 42.17

39.51

NE content (kcal/kg)

2450

2,450 2,400

2,337

Lysine, total (%)

1.37

1.37 1.19

1.19

Methionine, total (%)

0.50

0.50 0.38

0..39

Lysine, digestible (%)

1.13

1.13 0.96

0.96

Methionine & Cysteine, digestible (%)

0.66

0.66 0.56

0.56

Methionine, digestible (%) dv VARK

0.44

0.44 0.32

0.32

Threonine, digestible (%)

0.71

0.71 0.61

0.61

Trypsin, digestible (%)

0.23

0.23 0.23

0.23

Isoleucine, digestible (%)

0.57

0.57 0.55

0.54

Leucine, digestible (%)

1.07

1.07 1.03

1.01

Valine, digestible (%)

0.74

0.74 0.63

0.63

Calcium (Ca; %)

0.60

0.60 0.60

0.60

Phosphor, total (P; %)

0.52

0.52 0.49

0.49

Phosphor, digestible (P; %)

0.38

0.38 0.30

0.30

Sodium (Na; %)

0.23

0.23 0.20

0.20

Magnesium (Mg; S)

0.17

0.17 0.18

0.20

Potassium (K: %)

0.77

0.77 0.74

0.77

Chlorine (Cl; %)

0.36

0.36 0.28

0.28

Na+K-Cl (meq/kg)

19.65

19.79 19.90

20.72

Study Animals

Two batches of 160 newly weaned piglets were allocated to treatment by weight and sex. Castrated males and females were penned separately. The same number of castrated male and female piglets were allocated to both treatment groups. All piglets were ear tagged with individual identification numbers.

Data Collection

Pigs were evaluated daily and any unusual observations were recorded, including but not limited to altered behavior and disease.

Normal performance data were collected such as bodyweight on day 1 (trial start), day 21 (end phase 1) and day 49 (end of trial). General clinical score (GCS) and fecal clinical score (FCS) were assessed weekly from day 4 until the end of the trial (day 47) and described by pen. GCS or general pig appearance was scored on a scale from 1-8 with 1 rated as poor and 8 as excellent. FCS or diarrhea scores were assessed for each pen by scoring five droppings per pen based on the criteria shown in Table 3. Feed allocation was recorded daily as feed bags of 25 kg were added to the feeders, and assumed to equal feed intake. Average daily weight gain (ADWG), feed intake (FI), and feed conversion ratio (FCR) were calculated for each feeding period and overall. No veterinary treatments were needed during the duration of the trial. No adjustments for mortality and culls were performed, since mortality was below 2.0% and no culls occurred during the trial.

Table 3: Comprehensive description of the pen fecal clinical score with its interpretation and clinical aspect of the fecal clinical score (adapted from [18,19]).

Score

Interpretation

Clinical aspect

0 Normal Normal fecal consistency
1 Pasty to mild Soft pasty consistency with more particles than fluid
2 Moderate to severe More fluid than particles

Statistical Analysis

Feeder was the experimental unit for data collected related to ADWG, FCR FI, FCS and GCS. The data were examined for outliers (defined as results that deviate from the mean by over 3 standard deviations), and none were found. The performance results were analyzed for differences between treatment groups by ANOVA using JMP version 14.0.

Results

Piglet Weight and Average Daily Weight Gain

Piglets were weaned at 21 days of age and an average weight of 5.73 kg (± 0.06) and were randomly distributed on two treatment groups. At the end of phase 1 weighing (day 21), T-1 piglets were slightly, but not-significantly (P > 0.05) lighter compared to T-2 piglets (10.02 ± 0.12 kg vs. 10.25 ± 0.13 kg, respectively). The final weight differed by only 100 g (23.33 ± 0.26 kg vs. 23.43 ± 0.29 kg, respectively) and was not significantly different (P > 0.05) (Figure 1).

fig 1

Figure 1: Individual piglet weight (kg; mean ± SEM) at weaning (Start), intermediate weighing (End phase 1; 21 dpw), and end of the trial (Final; 47 dpw). No significant differences (P > 0.05) between groups could be observed.

Average daily weight gain in phase 1 was 12 g/d lower in T-1 piglets compared to T-2 piglets. In phase 2, T-2 piglets grew a little slower with 7 g/d lower ADWG as compared to T-1. Average daily weight gain was not significantly (P > 0.05) different between treatments (Figure 2).

fig 2

Figure 2:  Average daily weight gain (g/d; mean ± SEM) in phase 1 (0-21 dpw) and phase 2 (22-47 dpw). No significant differences (P > 0.05) between groups could be observed.

Feed Intake and Feed Conversion Rate

Feed intake in T-1 piglets was 17 g/d lower in phase 1 and 3 g/d higher in phase 2 as compared to T-2 piglets. However, the differences in FI were not significant (P < 0.05) between treatment groups (Figure 3).

fig 3

Figure 3:  Piglet feed intake per phase (kg/piglet; mean ± SEM) in phase 1 (0-21 dpw), and phase 2 (22-47 dpw). No significant differences (P > 0.05) between groups could be observed.

Feed conversion rate in phase 1 did not differ significantly between treatment groups (1.32 ± 0.012 and 1.33 ± 0.017 for T-1 and T-2 piglets (P > 0.05), respectively). In phase 2, FCR in T-2 piglets (1.67 ± 0.012) was slightly, but not significantly higher (P > 0.05) as compared to T-1 piglets (1.65 ± 0.017) (Figure 4).

fig 4

Figure 4:  Feed conversion ratio (kg feed/kg weight gain; mean ± SEM) in phase 1 (0-21 dpw) and phase 2 (22-47 dpw). No significant differences (P > 0.05) between groups could be observed.

Pen fecal Clinical Score and General Clinical Score

Pen FCS was collected weekly for each individual pen from 4 to 47 dpw. No differences were found in FCS between treatments, neither in weekly average pen FCS, nor in pen FCS, expressed as area under the curve (AUC) (P > 0.05).

Pen GCS was collected weekly from 4 to 47 dpw. Weekly average pen GCS (mean ± SEM) is given in Figure 5. Pen GCS, expressed as AUC, was significantly better (P < 0.05) in the Enzyme-treated group as compared to the Control group.

fig 5

Figure 5:  Average general clinical score (mean ± SEM) from 4 to 46 dpw. Piglets in each pen were scored weekly on a scale from 1-8 (1=poor, 8=perfect) during the trial. The overall general clinical score was significant better (P ≤ 0.05) in the Enzyme-treated piglets as compared to the Control piglets.

Mortality and Antimicrobial Treatment

No mortality and no culls were recorded during the trial. Antimicrobial treatment was not necessary during the duration of the trial.

Discussion

In the current study, we substituted a part of the most expensive protein sources (patato protein concentrate and Danex GGO-F) with dehulled SBM (soya 48) in phase 1, and wheat was partially substituted with wheat gluten feed and wheat milling byproduct in phase 2. The basal diets were estimated to have similar and relatively high soluble β-mannan content of 0.30% in phase 1 and 0.33% in phase 2, a known antinutritive factor [1], which may stimulate an innate immune response through their resemblance with PAMPs [4]. This activation has been called FIIR and leads to an unnecessary immune activation, which causes energy and nutrients to be wasted [3]. The current results from phase 1 revealed no differences between treatments in piglet weight, FI, ADWG or FCR. The results confirmed that the adapted diet with an exogenous β-mannanase and lower content of expensive protein sources performed equal to the standard diet used in phase 1. These results are in accordance with other recent studies [8].

In phase 2, the Enzyme-treated diet was formulated to contain 63 kcal/kg NE less than the control diet, which reduced the inclusion of soya oil from 0.34% to 0%. Again, in phase 2 only minor numerical performance differences were observed between treatments. The overall result therefore confirmed that the addition of β-mannanase to diets formulated with reduced content of expensive protein sources in phase 1 and about 3% lower dietary net energy content in phase 2 allowed performance to be maintained. Others concluded that β-mannanase improved growth performance in both weanling and growing-finishing pigs on corn-SBM diets [13-15]. The energy sparing effect observed in phase 2 has also been observed by others. Supplementation of β-mannanase to common nursery diets resulted in similar performance as comparable diets with 2% added soya oil [14]. In our study, a further substitution of potato protein with a cheaper protein source, would likely have been possible. Nevertheless, from a commercial perspective, equal piglet performance on diets with 63 kcal/kg lower net energy content in phase 2 is an attractive option for the animal feed industry [20].

In conclusion, the current study suggests that the use of an exogenous heat-tolerant β-mannanase allowed reduced levels of expensive protein sources to be used in the first diet fed post-weaning, and 63 kcal/kg lower net energy content to be used in the second diet without loss of performance or adverse effects on intestinal health. In fact, the general clinical score was significantly improved on the diets with β-mannanase.

Acknowledgement

The authors greatly acknowledge the technical staff of the experimental facility (Quartes-Verzele, Nevele) for their assistance in randomization, weighing and data collection.

Abbreviations

AUC: Area Under the Curve

dpw: Days Post-Weaning

FCS: Fecal Clinical Score

FIIR: Feed Induced Immune Response

GCS: General Clinical Score

NSP: Non-Starch Polysaccharide

PAMP: Pathogen Associated Molecular Pattern

PRR: Pathogen Recognition Receptor

PWD: Post-Weaning Diarrhea

SBM: Soybean Meal

References

  1. Ferrel J, Anderson DM, Hsiao HY (2014) Content of Soluble Non-Starch Polysaccharides β-Mannan and Xylan in Legume Meals, Non-Legume Meals, and Cereal Grains or Cereal Grain by-products. Journal Animal Science 92: 328.
  2. Jackson ME, Geronian K, Knox A, McNab J, McCartney E (2004) A dose-response study with the feed enzyme β-mannanase in broilers provided with corn-soybean meal based diets in the absence of antibiotic growth promoters. Poult Sci 83: 1992-1996. [crossref]
  3. Hsiao HY, Anderson DM, Dale NM (2006) Levels of β-mannan in soybean meal. Poult Sci 85: 1430-1432. [crossref]
  4. Forsberg NE, Wang Y (2006) Nutrition and immunity in dairy cattle: implications to hemorrhagic bowel syndrome. Mid-South Rum Nutr Conf 11-20.
  5. Sukhithasri V, Nisha N, Biswas L, Kumar VA, Biswas R (2013) Innate immune recognition of microbial cell wall components and microbial strategies to evade such recognitions. Microb Res 168: 396-406. [crossref]
  6. Zhang L, Tizard IR (1996) Activation of a mouse macrophage cell line by acemannan: the major carbohydrate fraction from Aloe vera gel. Immunopharmacology 35: 119-128. [crossref]
  7. Duncan CJG, Pugh N, Pasco DS, Ross SA (2002) Isolation of a galactomannan that enhances macrophage activation from the edible fungus Morchella esculenta. J Agric Food Chem 50: 5683-5685. [crossref]
  8. Kim JS, Ingale SL, Hosseindoust AR, Lee SH, Lee JH et al. (2017a) Effects of mannan level and β-mannanase supplementation on growth performance, apparent total tract digestibility and blood metabolites of growing pigs. Animal 11: 202-208.
  9. Kim HJ, Nam SO, Jeong JH, Fang LH, Yoo HB, et al. (2017b) Various levels of copra meal supplementation with β-mannanase on growth performance, blood profile, nutrient digestibility, pork quality and economical analysis in growing-finishing pigs. J Anim Sci Technol 59: 19-28.
  10. Mok CH, Lee JH, Kim BG (2013) Effects of exogenous phytase and β-mannanase on ileal and total tract digestibility of energy and nutrient in palm kernel expeller-containing diets fed to growing pigs. Anim Feed Sci Technol 186: 209-213.
  11. Upadhaya SD, Park JW, Lee JH, Kim IH (2016) Ileal digestibility of nutrients and amino acids in low quality soybean meal sources treated with β-mannanase for growing pigs. Animal 10: 1148-1154. [crossref]
  12. Jeon SM, Hosseindoust A, Choi YH, Kim MJ, Kim KY et al. (2019) Comparative standardized ileal amino acid digestibility and metabolizable energy contents of main feed ingredients for growing pigs when adding β-mannanase. Anim Nutr 5: 359-365.
  13. Lv JN, Chen YQ, Guo XJ, Piao XS, Cao YH et al. (2013) Effects of supplementation of β-mannanase in corn-soybean meal diets on performance and nutrient digestibility in growing pigs. Asian-Aust J Anim Sci 26: 579-587.
  14. Pettey LA, Carter SD, Senne BW, Shriver JA (2002) Effects of beta-mannanase addition to corn-soybean meal diets on growth performance, carcass traits, and nutrient digestibility of weanling and growing-finishing pigs. J Anim Sci 80: 1012-1019. [crossref]
  15. Jo JK, Ingale SL, Kim JS, Kim YW, Kim KH, et al. (2012) Effects of exogenous enzyme supplementation to corn- and soybean meal-based or complex diets on growth performance, nutrient digestibility, and blood metabolites in growing pigs. J Anim Sci 90: 3041-3048. [crossref]
  16. Humphrey BD, Klasing KC. 2005. The acute phase response alters cationic amino acid transporter expression in growing chickens (Gallus gallus domesticus). Comp. Biochem. Physiol. A Mol. Integr. Physiol. 142: 485-494.
  17. Vangroenweghe F, Suls L, Van Driessche E, Maes D, De Graef E (2012) Health advantages of transition to batch management system in farrow-to-finish pig herds. Vet Med 57: 83-91.
  18. Vangroenweghe F, Thas O. 2020a. Improved piglet performance and reduced antibiotic use following oral vaccination with a live avirulent Escherichia coli F4 vaccine against post-weaning diarrhea. J Clin Res Med 3: 1-8.
  19. Vangroenweghe F, Thas O. 2020b. Application of high energy and protein diets in combination with a live avirulent Escherichia coli F4 vaccine against post-weaning diarrhea. Vacc Res 7: 1-9.
  20. Cromwell GL, Soybean Meal InfoCenter, Arkeny IA (2017) Soybean meal: an exceptional protein source.
fig 2

Comparison Sensor Study of US Cooked Meals Postprandial Plasma Glucose and Worldwide Fasting Plasma Glucose between Pre-Virus and Virus Periods Using GH-Method: Math-Physical Medicine (No. 344)

DOI: 10.31038/EDMJ.2020445

Abstract

The author conducts a numerical analysis to compare his diabetes control situations for two sub-periods over 2.4 years or 29+ months: the pre-Covid-19 (pre-Virus) period, from 5/5/2018 to 1/18/2020, and the Covid-19 (Virus) period, from 1/19/2020 to 10/10/2020. Special attention has been placed on the quantitative comparison of three glucose components and their measured data via a continuous glucose monitoring (CGM) sensor device on his arm, including fasting plasma glucose (FPG), postprandial plasma glucose (PPG), and daily glucose waveform.

The sensor collected PPG data comparison study is based on data associated with only US home-cooked meals. PPG values are closely related to food and meals (~40% contribution) varying from country to country depending on the food material and preparation method. In addition, he has stayed in the US exclusively during this Virus quarantined period; therefore, he must extract his US sensor PPG data out from his massive database (a data mining effort) in order to conduct a fair comparison. On the other hand, his FPG reflects his pancreatic beta cells’ health status which is directly related to his body weight (~90%% correlation) and has no identifiable direct connection with his diet. The pre-virus FPG values are based on his worldwide data collected from all nations with heavy traveling prior to the Virus period.

In summary, the US sensor PPG difference between two periods is within the range of 11 mg/dL to 13 mg/dL (8%-9%) and worldwide sensor FPG difference is 13 mg/dL (11%-12%). In terms sensor FPG, the difference between the pre-Virus and Virus periods are 13 mg/dL.

The average daily sensor glucose is 131 mg/dL for the pre-Virus period and 117 mg/dL for the Virus period. There is a 14 mg/dL (11%) of daily average glucose reduction during the Virus period in comparison with the pre-Virus period. Once again, his glucose control situation in the Virus period is better than the pre-Virus period.

The COVID-19 virus is the worst pandemic in recent human history in terms of its spreading speed and space, mortality rate, and emotional impact on the world population. People belonging to the “vulnerable” groups, such as the elderly with history of chronic diseases and their complications, require special attention on their health conditions as well as the lifestyle management program during this period.

Although the author belongs to one of the vulnerable groups, he achieved even better results on his diabetes control in terms of FPG, PPG, and daily glucose during the Virus period. This finding has proven once again unasked on data of PPG from the US-based home cooked food database and FPG from worldwide collected database.

Furthermore, by utilizing this data mining, segmentation data analysis, and other mathematical tools, he has further demonstrated his pancreatic beta cells’ self-repair phenomenon which was disclosed in several of his prior medical publications.

The quiet, stable, and undisturbed lifestyle during the Virus quarantined period contributes to his better glucose control situation. In fact, he turned the COVID-19 crisis into his health advantage. He established these same observed conclusions repeatedly with similar findings. More importantly, he also learned that he should try his best to continue this kind of good lifestyle in the future.

Introduction

The author conducts a numerical analysis to compare his diabetes control situations for two sub-periods over 2.4 years or 29+ months: the pre-Covid-19 (pre-Virus) period, from 5/5/2018 to 1/18/2020, and the Covid-19 (Virus) period, from 1/19/2020 to 10/10/2020. Special attention has been placed on the quantitative comparison of three glucose components and their measured data via a continuous glucose monitoring (CGM) sensor device on his arm, including fasting plasma glucose (FPG), postprandial plasma glucose (PPG), and daily glucose waveform.

The sensor collected PPG data comparison study is based on data associated with only US home-cooked meals. PPG values are closely related to food and meals (~40% contribution) varying from country to country depending on the food material and preparation method. In addition, he has stayed in the US exclusively during this Virus quarantined period; therefore, he must extract his US sensor PPG data out from his massive database (a data mining effort) in order to conduct a fair comparison. On the other hand, his FPG reflects his pancreatic beta cells’ health status which is directly related to his body weight (~90% correlation) and has no identifiable direct connection with his diet. The pre-virus FPG values are based on his worldwide data collected from all nations with heavy traveling prior to the Virus period.

Methods

Background

To learn more about the GH-Method: math-physical medicine (MPM) methodology, readers can review his article to understand his MPM analysis method [1], along with the outlined history of his personalized diabetes research and application tools development [2].

Overview of Diabetes Conditions

During 2015 and 2016, he dedicated his time to research and develops four prediction models related to his type 2 diabetes (T2D) conditions such as weight, PPG, FPG, and HbA1C (A1C). As a result from using his own developed metabolism model and four prediction tools, his weight reduced from 220 lbs (100 kg) in 2010 to 171 lbs. (89 kg) in 2018, and finally reached 168 lbs. (76 kg) in 2020; his waistline decreased from 44 inches (112 cm) in 2010 to 33 inches (84 cm) in 2020; his average finger glucose value reduced from 280 mg/dL in 2010 to 116 mg/dL in 2018, and finally reached to 106 mg/dL in 2020; and his A1C from 10% to 6.5% in 2018, and finally reached to 6.1% in 2020. One of his major accomplishments is that he no longer takes any diabetes medications since 12/8/2015.

In 2017, he achieved excellent results on all fronts, especially glucose control. However, during 2018 and 2019 (overlapping the pre-COVID-19 period), he traveled to 50+ international cities to attend 60+ medical conferences and made ~120 oral presentations. This kind of hectic traveling schedule inflicted damage to his diabetes control, through dinning out along with exercise disruption, plus jet-leg and sleep pattern disturbance, due to irregular life routines through traveling.

Data Collection

Since 1/1/2012, he measured his glucose values using the finger-piercing method: once for FPG and three times for PPG each day. In the finger glucose database, FPG occupies 25% of daily glucose while PPG occupies 75% of daily glucose. He did not use high finger glucose data in this particular analysis.

On 5/5/2018, he applied a CGM sensor device on his upper arm and checked his glucose measurements every 15 minutes, a total of ~96 times each day. After the first bite of his meal, he measured his PPG level every 15 minutes for a total of 3-hours or 180 minutes. He has maintained the same measurement pattern since 5/5/2018 until present day of 10/10/2020. In this CGM sensor glucose database, FPG occupies 29% of daily glucose, PPG takes up 38% of daily glucose, and pre-meals plus pre-bed periods occupy 33% of his daily glucose.

Mathematical Tools Utilized

In this glucose study, he utilized data mining, segmentation analysis, pattern recognition method, time-series analysis, and candlestick K-line model as explained [3-8].

Results

Figure 1 shows the US home cooked meals’ sensor PPG data over a 3-hour timespan and worldwide collected sensor FPG data over 7-hour timespan for the pre-Virus period (5/5/2018-1/18/2018) and Virus period (1/19/2020-10/10/2020).

fig 1

Figure 1: Data table of US sensor PPG and Worldwide sensor FPG.

In Figure 2, it shows the US sensor PPG curve and worldwide sensor FPG curve comparison between the pre-Virus period and Virus period. It is obvious that the diagrams have very high correlation coefficients between these two periods, with 99% for the US PPG and 98% for worldwide FPG. The actual glucose value comparisons listed below in the order of (peak PPG/average PPG) and (bottom FPG/average FPG):

fig 2

Figure 2: PPG and FPG waveforms comparison between two periods.

US Sensor PPG

Pre-Virus period: (143/133)

Virus period: (130/122)

Period’s differences: (13/11).

Worldwide sensor FPG

Pre-Virus period: (108/114)

Virus period: (95/101)

Period’s differences: (13/13).

In summary, the US sensor PPG difference between the two period is within the range of 11 mg/dL to 13 mg/dL (8%-9%) and worldwide sensor FPG difference is 13 mg/dL (11%-12%). In terms FPG difference of bottom and averaged values between the pre-virus and the Virus periods are 13 mg/dL.

Figure 3 depicts some vital data and candlestick charts of five PPG glucoses. The following table summarizes five key data of PPG waveforms of both periods in the order of five PPG values: (open/close/minimum/maximum/average).

fig 3

Figure 3: Comparison of daily glucose among 3 periods (pre-Virus, Virus, and total).

Pre-Virus Period K-line PPG

(128/126/109/169/135).

Virus Period K-line PPG

(112/119/101/153/123).

Sensor PPG differences

(6/7/8/16/12).

From Figure 3, it is obvious that all of the five K-line PPG values during the pre-Virus period are higher than the Virus period.

Here are some additional information listed below:

Pre-Virus Period (US Home-Cooked)

622 meals, carbs/sugar 10.1 grams, post-meal walking 4,285 steps.

Virus Period (US Home-Cooked)

726 meals, carbs/sugar 12.1 grams, post-meal walking 4,255 steps.

It should be noted that despite the carbs/sugar amount per meal during the Virus period is 2 grams more than the pre-Virus period, where both periods’ post-meal walking steps are almost equal; however, the PPG during the Virus period is actually ~13 mg/dL (or ~10%) lower than the pre-Virus period. The most logical explanation is that not only is his diabetes conditions have been improving due to his stringent lifestyle management program, but also his pancreatic beta cells’ insulin capability and quality have been self-repairing continuously over the past 10 years [6]. A similar phenomenon can also be detected from his worldwide sensor FPG difference of 13 mg/dL (or 11%-12%) improvement due to his beta cells’ insulin self-repair.

The phenomenon mentioned above can be observed in the general glucose comparison between two periods and the total period of 5/5/2018 through 10/10/2020 (Figure 3).

The average daily sensor glucose is 131 mg/dL for the pre-Virus period and 117 mg/dL for the Virus period. There is a 14 mg/dL (11%) of daily average glucose reduction during the Virus period in comparison with the pre-Virus period. Once again, his glucose control situation in the Virus period is better than the pre-Virus period.

Conclusions

The COVID-19 virus is the worst pandemic in recent human history in terms of its spreading speed and space, mortality rate, and emotional impact on the world population. People belonging to the “vulnerable” groups, such as the elderly with history of chronic diseases and their complications, require special attention on their health conditions as well as the lifestyle management program during this period.

Although the author belongs to one of the vulnerable groups, he achieved even better results on his diabetes control in terms of FPG, PPG, and daily glucose during the Virus period. This finding has proven once again unasked on data of PPG from the US-based home cooked food database and FPG from worldwide collected database.

Furthermore, by utilizing this data mining, segmentation data analysis, and other mathematical tools, he has further demonstrated his pancreatic beta cells’ self-repair phenomenon which was disclosed in several of his prior medical publications.

The quiet, stable, and undisturbed lifestyle during the Virus quarantined period contributes to his better glucose control situation. In fact, he turned the COVID-19 crisis into his health advantage. He established these same observed conclusions repeatedly with similar findings. More importantly, he also learned that he should try his best to continue this kind of good lifestyle in the future.

References

  1. Hsu, Gerald C (2020) Biomedical research methodology based on GH-Method: math-physical medicine (No. 310).
  2. Hsu, Gerald C (2020) Glucose trend pattern analysis and progressive behavior modification of a T2D patient using GH-Method: math-physical medicine (No. 305).
  3. Hsu, Gerald C. March (2019) Linkage among metabolism, immune system, and various diseases using GH-Method: math-physical medicine (No. 235).
  4. Hsu, Gerald C. May (2020) Building up fundamental strength to fight against COVID-19 for patients with chronic diseases and complications (No.253).
  5. Hsu, Gerald C (2020) A Case Study on the Prediction of A1C Variances over Seven Periods with guidelines Using GH-Method: math-physical medicine (No. 262).
  6. Hsu, Gerald C (2020) Self-recovery of pancreatic beta cell’s insulin secretion based on annualized fasting plasma glucose, baseline postprandial plasma glucose, and baseline daily glucose data using GH-Method: math-physical medicine (No. 297).
  7. Hsu, Gerald C (2020) Glucoses and HbA1C comparison study between pre- COVID-19 and COVID-19 using GH-Method: math-physical medicine (No. 318).
  8. Hsu, Gerald C (2019) Using Candlestick Charting Techniques to Investigate Glucose Behaviors via GH-Method: Math-Physical Medicine (No. 76).
fig 3

Positive Impact of Scaling and Root Planing on Glycaemia among Asian Indian Type 2 Diabetes Patients with Periodontitis

DOI: 10.31038/EDMJ.2020444

Abstract

Aim: To study whether a non-surgical therapy such as scaling and root planing (SRP) will help in improving the glycaemic control in type 2 diabetes (T2D) patients as assessed by Glycosylated haemoglobin (HbA1c) measured at baseline and during the follow-up dental examinations in a diabetes hospital in Southern India.

Methods: In this retrospective study among T2D patients, the intervention group underwent SRP in addition to conventional treatment for hyperglycaemia, the control group had only conventional treatment. Both groups had mild to moderate Periodontal Disease (PD) at baseline. Glycaemic variations, change in HbA1c were assessed between 4 and 6 months. Impact of baseline characteristics and SRP on follow-up HbA1c was assessed using multiple logistic regression analysis.

Results: Out of the 1164 patients identified, 319 were selected, 124 patients in the control group and 135 in the intervention group satisfied the criteria for analysis. At baseline, gender distribution, diabetes duration, body mass index and mean HbA1c were similar in these groups. The intervention group was younger (p = 0.02), higher percentage of them were on oral hypoglycaemic agents (p = 0.006).

At follow-up, only the intervention group showed a significant reduction in HbA1c (9.0% (75 mmol/mol) to 8.0% (64 mmol/mol), p<0.0001), while no change was seen in the control group (8.7% (72 mmol/mol) to 8.8% (73 mmol/mol)). Importantly with intervention 52.6% shifted to optimal level of HbA1c, while 52.3% of the control group had uncontrolled diabetes. Improvement in HbA1c was inversely associated with baseline HbA1c, duration of diabetes and treatment with only oral hypoglycaemic agents (OHA) versus OHA plus insulin. Intervention with SRP was independently and significantly associated with improvement in HbA1c (≤7.5%, 59 mmol/mol) [odds ratio (OR), 95% confidence interval (CI) 3.390 (1.786-6.434), p<0.0001].

Conclusion SRP, a simple and practical procedure had independent, significant beneficial effect on glycaemic control among Asian Indian T2D patients with PD.

Keywords

Type 2 diabetes, Periodontitis, Scaling and root planing, Glycaemic control, Glycosylated haemoglobin

Introduction

Diabetes is a major healthcare challenge both in developed and in developing countries. India has a large number with diabetes (72 million) and more than 90% of them have type 2 diabetes (T2D) [1]. Diabetes poses a healthcare burden not only because of the chronic requirement for the management of hyperglycaemia but also due to the associated micro and macro vascular risk factors and disorders [1,2]. Persistent hyperglycaemia can lead to several complications which include periodontal disease (PD), known to be a major complication of diabetes [3,4]. PD is caused due to exogenous bacterial infection and the resultant host response to bacterial challenge. The increased inflammatory response destroys both the endogenous bacteria and also releases cytokines that causes destruction of periodontal tissues [5]. There is emerging evidence to support the existence of a bidirectional relationship between diabetes and PD [6-9] with diabetes increasing the risk for PD and periodontal inflammation negatively affecting glycemic control [10]. It is also suggested that periodontitis may be a risk factor itself for other diabetes complications [11]. Due to the non-uniformity of the methodology, regions, age groups, the presence of habits such as tobacco use and awareness about oral hygiene it is not possible to derive a definite rate of prevalence of periodontitis in India [12,13].

We investigated in this study the effect of a non-surgical periodontal therapy, scaling and root planing (SRP) on metabolic control among T2D patients. There are only a few studies from India on the beneficial effect of SRP on glycaemic control [14-16]. Moreover, studies in large numbers and also with a comparative group are limited.

The aim was to analyse the change in glycaemic control as assessed by the HbA1c values measured at the time of baseline dental examination and during the follow-up after SRP in comparison with a control group without SRP.

Methods and Materials

Patient Selection

This was a retrospective study among T2D patients who were referred to the dental department of Dr.A.Ramachandran’s Diabetes Hospitals, Chennai, India. It included a study group who underwent periodontal therapy and a control group that only had the usual care for diabetes during the study period. The selection of patients for the analysis is shown in the flow diagram (Figure 1). Patients with diagnosis of PD and had follow-up data between 4 and 6 months of their initial visit were included. For this, medical records of T2D patients, both men and women of age 25-65 years followed-up during June 2018 and December 2019 were selected. The reasons for exclusion were unwillingness to undergo a mechanical treatment, inability to report for follow-up within the prescribed time period or having had treatment with antibiotic or anti-inflammatory drugs. Patients with habit of smoking, pan or tobacco chewing were also excluded.

fig 1

Figure 1: Flowchart showing the selection of study participants and group allocation.

A written informed consent was obtained from the patients prior to inclusion in the study to use their clinical data for research purposes without disclosing their identity. The study was approved by the Ethics Committee of the India Diabetes Research Foundation and Dr. A. Ramachandran’s Diabetes Hospitals, Chennai.

Clinical and Dental Assessment

Details on patient’s treatment history including advice on diet and physical activity were recorded. Body mass index (BMI, kg/m2) was calculated. Initial diagnosis of diabetes was made using the World Health Organisation criteria with a fasting plasma glucose (FPG) level ≥ 126 mg/dl (7.0 mmol/l) and/or 2-h post-load glucose level ≥ 200 mg/dl (11.1 mmol/l) [17]. We recorded HbA1c levels at the baseline and during the follow-up visits. HbA1c was measured by immunoturbidimetry method using TINA-QUANT II (Roche Diagnostics Corporation, Germany).

Presence of mild to moderate chronic periodontitis was diagnosed with a probing depth of >5 mm and clinical attachment loss (CAL) of >3 mm and radiographic evidence of 30 to 50% bone loss.

Study Groups

Patients chosen for the intervention group underwent SRP after the initial diagnosis of PD. The control group did not undergo SRP but received conventional treatment for glycaemia. Both groups reported for follow-up to the dental department between 4 and 6 months of the baseline visit.

Statistical Analyses

Severity of glycaemia is shown in terms of mean HbA1c values categorized as mild (HbA1c ≤7.5% (59mmol/mol)), moderate (HbA1c 7.6(60 mmol/mol)-8.5% (69 mmol/mol)) and severe (HbA1c >8.5% (>69 mmol/mol)) glycaemia. Comparisons between the baseline and follow-up values in the total group and in the 3 categories of glycaemia were made. The impact of intervention (SRP) on the mean HbA1c values and also in the 3 categories of HbA1c was compared with the respective values in the control group during the follow-up.

Data are presented as mean ± SD for continuous variables with a normal distribution, as median (interquartile range) for skewed variables and as frequency (%) for categorical variables. Intergroup differences were tested using independent sample‘t’ test and chi-square test for continuous and categorical variables respectively. For skewed variables Mann-Whitney U test was used. A multiple logistic regression analysis (MLR) (enter method) was done to assess the impact of baseline variables and SRP versus conventional treatment on the control of HbA1c at follow-up. The dependent variable was HbA1c of ≤7.5% (59 mmol/mol) versus >7.5% (>59 mmol/mol) at follow-up. Independent variables used were age, BMI, duration of diabetes, baseline HbA1c (as continuous variables), gender (reference: female), treatment of diabetes (only oral hypoglycemic agents (OHA) versus insulin plus OHA (reference)) and groups (SRP versus no SRP (reference)).

All statistical analyses were done using IBM SPSS (version 21.0). A value of p < 0.05 was considered as statistically significant.

Results

Among the total of 1164 records identified, patients from outstation (n = 845) were excluded because of their inability to report for follow-up visit during the study period. Details of 176 patients who underwent SRP (Intervention group) and 143 patients who did not undergo SRP (Control group) were included in the study. Patients in both study groups reported for the clinical follow-up between 4 and 6 months of their baseline visit. Among them, 19 patients in the control group and 41 patients in the intervention group were excluded due to the requirement for treatment with antibiotic or anti-inflammatory drugs or because of smoking habits. For the final analysis, 124 patients in the control group and 135 patients in the intervention group were included (Figure 1).

The baseline characteristics of the study participants in the control and intervention groups are shown in Table 1. The gender distribution, duration of diabetes, BMI and mean HbA1c values were similar in both groups. Higher percentage (p<0.0001) in the intervention group had calculi and/or stains. The intervention group was younger (p = 0.02), and a higher percentage of them was on treatment with OHA for diabetes (p = 0.006). Only a small percentage was on lifestyle modification, more so in the control group (p = 0.02).

Table 1: Baseline characteristics of the Control and Intervention groups.

Variables

Control

n = 124

Intervention

n = 135

Gender
Male, n (%)

83 (66.9)

94 (69.6)

Female, n (%)

41 (33.1)

41 (30.4)

Age (years) mean±SD

55.4 ± 6.5*

53.4 ± 7.2

BMI (kg/m2) mean±SD

27.4 ± 4.2

27.1 ± 5.4

Duration of Diabetes (months) median, IQR

170 (96-252)

133 (90-224)

Treatment
OHA, n (%)

60 (48.4)

88 (65.1) #

Insulin ± OHA, n (%)

52 (41.9)

43 (31.9)

Diet & Exercise, n (%)

12 (9.7)$

4 (3.0)

*p = 0.02 (‘t’ test), #p = 0.006, $p = 0.02 (Chi-square test).

BMI: Body Mass Index; OHA: Oral Hypoglycemic Agent.

Figure 2 shows the changes in the mean HbA1c values at the baseline and follow-up in the study groups. In the control group, both values were similar, whereas in the intervention group the mean value had decreased significantly at the follow-up (p<0.0001). As mentioned above, the mean baseline HbA1c value was similar in both groups. At follow-up, the control group had a higher value when compared with the intervention group (p<0.0001).

fig 2

Figure 2: Mean HbA1c (%) at baseline and at follow up.

Figure 3 shows the distribution in percentage in the categories of HbA1c in the control and intervention groups. At the baseline (Panel A), the maximum number of patients in both groups were in the highest category (>8.5% (69 mmol/mol)) of HbA1c. At follow-up (Panel B), it was observed that with intervention a larger percentage had shifted to the optimal level of HbA1c (52.6%, p<0.0002). In contrast, a larger percentage of the control group was in the uncontrolled category (53.2%, p<0.0001).

fig 3

Figure 3: Distribution in Percentage in the categories of HbA1c

In the second category of HbA1c (7.6% (60 mmol/mol)-8.5% (69 mmol/mol)) there was no significant difference between the values at baseline and follow-up in either group.

The multiple logistic regression analysis showed that age, gender and BMI did not have significant association with the outcome. The duration of diabetes, baseline HbA1c and treatment with only OHA had inverse association with good control of HbA1c. Treatment with SRP had a significant influence on the glycaemic outcome independent of the above parameters [odds ratio (OR), 95% confidence interval (CI) 3.390 (1.786-6.434), p<0.0001] (Table 2).

Table 2: Variables associated with the glycaemic outcome (HbA1c) – results of the multiple logistic regression analysis.

Variables

β Constant (SE)

OR (95% CI)

p value

Age (years)

0.044 (0.026)

1.045 (0.993-1.100)

0.091

Gender (Male)

0.648 (0.361)

1.911 (0.942-3.875)

0.073

BMI (kg/m2)

-0.014 (0.036)

0.986 (0.920-1.057)

0.699

Duration of diabetes (months)

-0.004 (0.002)

0.996 (0.992-1.000)

0.035

Baseline HbA1c (%)

-0.534 (0.108)

0.586 (0.474-0.724)

<0.0001

Treatment of Diabetes (OHA)

-0.926 (0.382)

0.396 (0.187-0.837)

0.015

Group (Intervention)

1.221 (0.327)

3.390 (1.786-6.434)

<0.0001

Dependent variable: HbA1c of ≤ 7.5% (59 mmol/mol) versus >7.5% (59 mmol/mol) at follow-up.

Independent variables used in the equation were age, BMI, duration of diabetes, baseline HbA1c (as continuous variables), gender (reference: female), treatment of diabetes (only oral hypoglycemic agents (OHA) versus insulin plus OHA (reference)) and groups (SRP versus no SRP (reference)).

OR: Odds Ratio; CI: Confidence Interval; BMI: Body Mass Index; OHA: Oral Hypoglycemic Agents.

Treatment with SRP showed a definite additive effect on the conventional treatment for diabetes in patients who also had PD.

Discussion

In this study, the important observation was that mechanical treatment of PD with SRP had facilitated improvement of glycaemia in diabetes patients during the follow-up assessment between 4 to 6 months. In comparison with the control group, treated with the conventional methods including regular clinical follow-up, better glycaemic outcome was seen with SRP even among the patients who had severe glycaemia. At follow-up, majority of the patients in the intervention group showed optimal control of glycaemia when compared to the control group (52.6% versus 29.9%, p = 0.0002). The MLR showed that treatment with SRP had an independent impact on the improvement of glycaemic outcome [OR (95% CI): 3.390 (1.786-6.434), p<0.0001]. Persons with uncontrolled diabetes and also required combined OHA and insulin treatment showed better impact with SRP as indicated by the inverse significant association with the outcome.

Previous studies have also reported the beneficial effects on diabetes control as measured by the HbA1c levels following non-surgical periodontal treatment [14-16,18]. While the first line of treatment for glycaemic control is lifestyle modification, use of OAD and /or insulin and adjunctive therapy for PD such as SRP is shown to result in better glycaemic outcome [14,18]. SRP removes the causative factors such as plaque and calculi which result in inflammation and improves the glycaemic control, also preventing its further accumulation [19]. Improved HbA1c can be also attributed to diminished gingivitis. Number of studies in India [14-16] and in several other countries [18,20] had reported that periodontal therapy is associated with reduction of infection and inflammation facilitating metabolic control of diabetes. However, some studies did not have comparative data from control groups [14,21]. A study by Stewart et al. [18] showed improvement in 17.1% in 10 months versus 6.7% in matched control groups.

Another study, with a controlled study design in India had reported outcomes similar to our findings [15]. However, the study group comprised of only 45 T2D patients [15]. A larger study in India by Sunder et al, in 266 T2D patients with a post treatment HbA1c level of 8.4 (68 mmol/mol) ± 1.9% showed a significant reduction following SRP in a follow-up period of 6 months [14]. The baseline HbA1c, mean age and inclusion criteria were similar to our study design, but there was no control group included.

Some studies had shown an effect of mechanical treatment as observed in our study and few others showed a combined effect of mechanical and antibiotic / anti-inflammatory treatment for PD on glycaemic control [22].

While many studies showed enhanced benefit of SRP as an adjunctive therapy for PD in glycaemic control, a few studies did not support this observation [23-27].

Our study has shown that in addition to the conventional therapy for hyperglycaemia, mechanical therapy such as SRP has a beneficial role even among T2D patients with severe hyperglycaemia. This procedure is simple and practical with minimal discomfort to the patients. Periodic dental check-up and application of such adjunctive therapy should become a part of diabetes management.

Declarations

Funding

The study was funded by India Diabetes Research Foundation, Chennai.

Conflict of Interest

None

Ethics Approval

The study was approved by the Ethics Committee of the India Diabetes Research Foundation and Dr. A. Ramachandran’s Diabetes Hospitals.

Authors’ Contributions

RV, CS, Arun R, AN, AR contributed to the study design. RY, A Rajeswari coordinated in data collection. AR, CS, KS and PS contributed to analyses and drafted the manuscript. All authors have reviewed the manuscript with critical input and approved the final draft of the manuscript.

Acknowledgements

We are grateful to all the patients for having consented to utilise their medical records for the purpose of research analysis. The support rendered by the department of dental care of Dr.A.Ramachandran’s Diabetes Hospitals, Chennai is greatly acknowledged.

Abbreviations

     BMI: Body Mass Index

     CAL: Clinical Attachment Loss

     CI: Confidence Interval

     FPG: Fasting Plasma Glucose

     HbA1c: Glycosylated Haemoglobin

     MLR: Multiple Logistic Regression

     OHA: Oral Hypoglycaemic Agents

     OR: Odds Ratio

     PD: Periodontal Disease

     SRP: Scaling and Root Planing

     T2D: Type 2 Diabetes

References

  1. International Diabetes Federation. IDF Diabetes Atlas, 9th edn. Brussels, Belgium: 2019. Available at: http://www.diabetesatlas.org. Last accessed on 11th March 2020.
  2. Ramachandran A, Ma RC, Snehalatha C (2010) Diabetes in Asia. Lancet 375: 408-418. [crossref]
  3. Jones JA, Miller DR, Wehler CJ, Rich SE, et al. (2007) Does periodontal care improve glycemic control? The Department of Veterans Affairs Dental Diabetes Study. J Clin Periodontol 34: 46-52. [crossref]
  4. Iacopino AM (2001) Periodontitis and diabetes interrelationships: role of inflammation. Ann Periodontol 6: 125-137. [crossref]
  5. Southerland JH, Taylor GW, Offenbacher S (2005) Diabetes and periodontal infection: making the connection. Clin Diabetes 23: 171-178. [crossref]
  6. Taylor GW, Borgnakke WS (2008) Periodontal disease: associations with diabetes, glycemic control and complications. Oral Dis 14: 191-203. [crossref]
  7. PatinoMarın N, Loyola Rodrıguez JP, Medina Solis CE, Pontigo Loyola AP, et al. (2008) Caries, periodontal disease and tooth loss in patients with diabetes mellitus types 1 and 2. Acta Odontol Latinoam 21: 127-133. [crossref]
  8. Wang TT, Chen TH, Wang PE, Lai H, et al. (2009) A population-based study on the association between type 2 diabetes and periodontal disease in 12,123 middle-aged Taiwanese (KCIS No. 21). J Clin Periodontol 36: 372-379. [crossref]
  9. Nesse W, Linde A, Abbas F, Lucien Spijkervet FK, et al. (2009) Dose-response relationship between periodontal inflamed surface area and HbA1c in type 2 diabetics. J Clin Periodontol 36: 295-300. [crossref]
  10. Taylor GW (2001) Bidirectional interrelationships between diabetes and periodontal diseases: and epidemiologic perspective. Ann Periodontol 6: 99-112. [crossref]
  11. Grossi SG (2001) Treatment of periodontal disease and control of diabetes: an assessment of the evidence and need for future research. Ann Periodontol 6: 138-145. [crossref]
  12. Chandra A, Yadav OP, Narula S, Dutta A (2016) Epidemiology of periodontal diseases in Indian population since last decade. J Int Soc Prev Community Dent. 6: 91-96. [crossref]
  13. Shaju JP, Zade RM, Das M (2011) Prevalence of periodontitis in the Indian population: A literature review. J Indian Soc Periodontol 15: 29-34. [crossref]
  14. Sundar C, Ramalingam S, Mohan V, Pradeepa R, et al. (2018) Periodontal therapy as an adjunctive modality for HbA1c reduction in type-2 diabetic patients. J Educ Health Promot. 28;7: 152. [crossref]
  15. Singh S, Kumar V, Kumar S, Subbappa A (2008) The effect of periodontal therapy on the improvement of glycemic control in patients with type 2 diabetes mellitus: A randomized controlled clinical trial. Int J Diabetes Dev Ctries. 28: 38-44. [crossref]
  16. Kiran M, Arpak N, Unsal E, Erdoğan MF (2005) The effect of improved periodontal health on metabolic control in type 2 diabetes mellitus. J Clin Periodontol 32: 266-272. [crossref]
  17. World Health Organization (2006) Definition and diagnosis of diabetes mellitus and intermediate hyperglycaemia: report of a WHO/IDF consultation. Geneva: World Health Organization,1-50.
  18. Stewart JE, Wager KA, Friedlander AH, Zadeh HH (2001) The effect of periodontal treatment on glycemic control in patients with type 2 diabetes mellitus. J Clin Periodontol 28: 306-310. [crossref]
  19. Cugini MA, Haffajee AD, Smith C, Kent RL Jr, et al. (2000) The effect of scaling and root planing on the clinical and microbiological parameters of periodontal diseases: 12-month results. J Clin Periodontol. 27: 30-36. [crossref]
  20. Nishimura F, Murayama Y (2001) Periodontal inflammation and insulin resistance-lessons from obesity. J Dent Res 80: 1690-1694.
  21. Moeintaghavi A, Arab HR, Bozorgnia Y, Kianoush K, et al. (2012) Non-surgical periodontal therapy affects metabolic control in diabetics: a randomized controlled clinical trial. Aust Dent J 57: 31-37. [crossref]
  22. Ryan ME (2008) Diagnostic and therapeutic strategies for the management of the diabetic patient. Compend Contin Educ Dent 29: 32-38, 40-44.
  23. Morita I, Inagaki K, Nakamura F, Noguchi T, et al. (2012) Relationship between periodontal status and levels of glycated hemoglobin. J Dent Res. 91: 161-166. [crossref]
  24. Sun WL, Chen LL, Zhang SZ, Ren YZ, et al. (2010) Changes of adiponectin and inflammatory cytokines after periodontal intervention in type 2 diabetes patients with periodontitis. Arch Oral Biol. 55: 970-974. [crossref]
  25. Venkataraman K, Kannan AT, Mohan V (2009) Challenges in diabetes management with particular reference to India. Int J Diabetes Dev Ctries 29: 103-109. [crossref]
  26. Petersen PE, Ogawa H (2005) Strengthening the prevention of periodontal disease: the WHO approach. J Periodontol. 76: 2187-2193. [crossref]
  27. Engebretson SP, Hyman LG, Michalowicz BS, Schoenfeld ER, et al. (2013) The effect of nonsurgical periodontal therapy on hemoglobin A1c levels in persons with type 2 diabetes and chronic periodontitis: a randomized clinical trial. JAMA 310: 2523-2532. [crossref]

Recurrent Gallbladder Cancer Presenting as Ovarian Neoplasm: A Case Report

DOI: 10.31038/CST.2020533

Introduction

Gallbladder carcinoma is reported to be incidentally diagnosed during approximately 1% of all cholecystectomies. Only 30% of gallbladder carcinomas are recognized intra-operatively, the remaining 70% are identified with final pathologic confirmation. Unfortunately, the prognosis for these malignancies is poor and the overall 5-year survival rate is reported to be less than 5%. Risk factors for the development of gallbladder carcinoma include chronic inflammation and gallstones with a direct correlation between the size of the stones and the risk of cancer. Chronic inflammation may come in the form of chronic cholecystitis, porcelain gallbladder, chronic bacterial infection and primary sclerosing cholangitis. Inflammation of tissues is thought to exacerbate DNA damage, increasing the risk of oncogenic transformation [1].

As it stands, there are few cases in literature of gallbladder carcinoma presenting as ovarian metastasis. To our knowledge, all other reports of ovarian metastasis have been in the primary setting [2,3]. As such, we present a case report of a woman with oligometastatic recurrence of gallbladder carcinoma in the ovary.

Case Presentation

A 67-year-old female with past medical history significant for diabetes mellitus type 2, idiopathic thrombocytopenia purpura, hypertension, bilateral foot drop and cauda equina syndrome status post spinal fusion presented to the hospital for acute cholecystitis. The patient underwent a laparoscopic cholecystectomy and final pathology revealed adenocarcinoma of the gallbladder with infiltration to the soft tissues near the cystic duct. She then underwent an open cystic duct resection, portal lymphadenectomy, and 4b5 liver resection with the final pathology revealing no metastasis to the liver at the time. Following her surgical recovery, she began adjuvant therapy with Gemcitabine, Cisplatin, and Xeloda.

Post treatment positron emission tomography and computed tomography scan (PET/CT), however, revealed a new pelvic mass arising from the left ovary and patient was referred to Gynecology Oncology for surgical management. The patient obtained pre-operative tumor markers and her CEA was found to be elevated at 14.2, while CA-125 and CA19-9 were within normal limits. She subsequently underwent a laparoscopic bilateral salpingooophorectomy. Intraoperatively, the patient was found to have a 5cm solid firm mass arising from the left ovary and no other evidence of intra-abdominal disease. The left fallopian tube, right fallopian tube and right ovary were found to be grossly normal appearing. Intraoperative frozen pathology demonstrated adenocarcinoma likely metastatic in origin. Final pathology confirmed adenocarcinoma in bilateral ovaries, favoring metastasis from gallbladder. Immunohistochemistry was positive for CA 19.9 and CDX2, and negative for PAX8 stains, supporting metastasis of gallbladder adenocarcinoma as opposed to an ovarian primary malignancy. Recommendations were made to the patient to obtain systemic adjuvant chemotherapy.

Discussion

Many gallbladder adenocarcinomas are incidental findings, most commonly identified during cholecystectomy for seemingly benign conditions, such as cholecystitis. Early identification is confounded by the fact that symptoms can mimic, or occur concurrently with, much more common benign diseases such as cholecystitis or cholelithiasis. Metastatic spread commonly involves nearby organs such as the liver (76-86%), lymph nodes (60%), spleen, and kidney [4]. Other reported sites of metastasis include the brain, breast, and thyroid [4,5]. Unless treated promptly, this malignancy remains a major source of mortality worldwide [1].

Classically, Krukenburg tumor refers to an ovarian tumor with a gastrointestinal primary site. Most commonly, this refers to gastric adenocarcinoma [5]. In our presented case, the primary location was the gallbladder, which was suspected prior to the laparoscopic bilateral salpingo-oophorectomy. Several case reports have focused on gallbladder cancer metastasis to the ovary in primary setting [2,3]. To our knowledge this is the first reported case of gallbladder cancer metastasizing to the ovary in a metasynchronous fashion.

The optimal therapeutic options for these patients depend on a variety of factors, including location of primary tumor, and presence of additional metastasis. Due to the rarity of diagnosis, there are no studies which have looked solely at the treatment and prognosis of ovarian metastasis from biliary origin. Several studies have suggested Hyperthermic Intraperitoneal Chemotherapy (HIPEC) may be beneficial in Krukenberg tumors with a gastric or colorectal primary [3,6].

One retrospective study reviewed prognosis of 147 patients with metastasis to the ovary from extragenital primary sites and reported the overall survival of approximately 6 months. The negative prognostic indicators included spread beyond the ovaries, local invasion, massive ascites, and bilateral ovarian metastasis [7]. However, it should be noted that only 2 patients presented with metastasis from a primary biliary carcinoma suggesting more research is needed for this subsect of patients [7].

Ovarian metastasis from a primary gallbladder cancer is a rare entity. It should be suspected in any patient with a history of biliary cancer presenting with a new-onset ovarian mass.

Consent

Informed consent was obtained from the patient for the publication of this case report.

References

  1. Goetze TO (2015) Gallbladder carcinoma: Prognostic factors and therapeutic options. World Journal of Gastroenterology 21: 12211-12217. [crossref]
  2. Kumar et al. (2010) Occult gallbladder carcinoma presenting as a primary ovarian tumor in two women: two case reports and a review of the literature. Journal of Medical Case Reports 4: 202.
  3. Lee TY, Wang CW, Chen TW, Chan DC, Liao GS, et al. (2018) Ovarian metastases from gallbladder mimics primary ovarian neoplasm in young patient: a case report. BMC Research Notes 11: 185.
  4. Rawla P, Sunkara T, Thandra K, Barsouk A (2019) Epidemiology of gallbladder cancer. Clinical and Experimental Hepatology 5: 93-102. [crossref]
  5. Pesce A, Destri GL, Amore FF, Magro G, La Greca G, et al. (2019) A rare case of Krukenberg tumor by gallbladder cancer. Annals of Medicine and Surgery 47: 50-52. [crossref]
  6. Jain V, Gupta K, Kudva R, Rodrigues GS (2006) A case of ovarian metastasis of gall bladder carcinoma simulating primary ovarian neoplasm: diagnostic pitfalls and review of literature. Int J Gynecol. Cancer 16: 319-321. [crossref]
  7. W Li, H Wang, J Wang, LV F, X Zhu, et al. (2012) Ovarian metastases resection from extragenital primary sites: outcome and prognostic factor analysis of 147 patients. BMC Canc 12: 278. [crossref]
fig 1

Coated Silver Nanoparticles Exhibit Unique Stability and Cytotoxicity in Media with Human Serum

DOI: 10.31038/NAMS.2020325

Abstract

Commercially available silver nanoparticles with five different coatings were measured for stability in media supplemented with human serum (HS) to better mimic conditions that particles might be exposed to in biomedical applications. The particles were then tested for cytotoxicity and cellular uptake in two cell lines. The stability of the particles differs from what is observed in media supplemented with fetal bovine serum (FBS). There is also a change in both the cytotoxicity of the particles and their cellular uptake in hepatocytes and neurons. These changes show that the behaviour of particles in living organisms may differ considerably from what is observed in standard in vitro testing as the particles will behave differently in the different extracellular environment they are exposed to, highlighting one of the challenges of translating in vitro studies for nanoparticles to regulatory frameworks.

Keywords

Silver, Nanoparticle, Cytotoxicity, Stability, Spectroscopy

Introduction

Silver nanoparticles are used in a wide array of commercial products that can ultimately lead to human exposure [1-3]. They are also being developed as diagnostic biomedical contrast agents and nanoscale delivery vehicles for a wide array of applications including imaging and drug delivery to the brain [4-6]. Silver nanoparticles have well established antimicrobial properties [7-10] and have shown antiviral activity in some studies [4,11-14]. There is currently a great need to better understand the underlying mechanisms of how silver nanoparticles interact with biological environments in order to facilitate their safe use in protective equipment and other healthcare products. Understanding how particles behave in vivo is challenging and most in vitro data tests particles in standard cell culture medium that is supplemented with fetal bovine serum [15]. Attempts to compensate for particle dynamics, for example, measuring sedimentation, have been attempted, however, such models fail to appreciate the complexities of the systems [16]. Nanoparticles will sediment at vastly different rates depending on their concentration, the components of the media, the media concentration and the specific properties of the nanomaterial. It is impractical to measure sedimentation at each does in a toxicity curve, and changes in volume from a 96 well plate may perturb the kinetics. The does will also change over time, as will the cellular response. Aggregated nanoparticles also may not contribute to dose in the same way as non-aggregated particles, changing the route of uptake, or removing them entirely from the bioavailable pool.

Silver nanoparticles are particularly sensitive to their aqueous environment, and thus the composition of the medium plays a critical role in the transport and stability of the particles, ultimately affecting their bioavailability or targeted uptake [17-25]. We have previously noted that particles treated with human serum albumin are more stable than those coated with bovine serum albumin, the most abundant proteins in sera [26]. We have also shown that the size dependent stability of silver particles changes in media supplemented with human serum [27]. Here we have tested how commercial particles with different coatings behave in media with human proteins and biomolecules as opposed to those from fetal bovine serum, how the particles evolve over time and how that affects their uptake and cytotoxicty. While cells are typically grown in media with FBS, they can be grown equally well in media with HS and so we sought to measure the outcome of this serum substitution in order to develop a more ‘humanized’ assay to better model one component of the cytotoxicity assays toward in vivo conditions.

Materials and Methods

Materials

Silver nanoparticles were purchased from Nanocomposix as aqueous suspensions. 40 nm particle coatings included polyvinylpyrrolidone (PVP), branched polyethylimine (BPEI), polyethylene glycol (PEG), lipoic acid and citrate. Sizes were validated by UV-Vis and DLS and data were compared to those supplied by Nanocomposix for the specific batch numbers.

Cell Culture

SH-SY5Y and HepG2 cells (American Tissue Culture Center) were all grown in Dulbecco’s modified Eagle’s medium (DMEM) (Gibco) supplemented with 10% Human AB serum (HS) (Sigma) and 1% penicillin-streptomycin (Pen/strep) (50 µg/ml, Gibco) unless stated otherwise and under standard culture conditions (37°C, 5% CO2). Media was filtered through 0.2 μm filters after the addition of HS to remove any precipitates from the media. Cells were grown in T75 flasks (Falcon) and Trypsin-EDTA solution (Gibco) was used for passaging cells (3 mL per T75 flask for HepG2 and 2 mL for SH-SY5Y). For passaging, SH-SY5Y cells were treated with Trypsin-EDTA at room temperature for 5 min, while HepG2 cells were incubated for 10 minutes at 37 degrees.

Ultraviolet-Visible (UV-Vis) Spectroscopy

Samples were run on a Varian Cary 5000 UV-Vis spectrometer at ambient temperature under a nitrogen atmosphere using plastic (Brand) cuvettes with a 1 mL sampling volume. Samples for time courses were prepared as 1:1 mixtures of DMEM (no phenol red, Gibco) with 10% HS and 1% penicillin-streptomycin and silver particles suspended in water at 20 μg/mL. This results in a final concentration of 5 % HS and 10 μg/mL silver nanoparticle, a media mixture consistent with what was used for the cytotoxicity assays. At each time point a background of water/media without particles was measured to normalize any drift that might arise from the media changing over time.

Dynamic Light Scattering (DLS)

Samples were run on a Malvern Zetasizer Nano-ZS. Samples were run in plastic cuvettes (BRAND) with a 1 mL sample volume. Each sample was measured 5 times. All initial values for particles were consistent with manufactures specifications for the particles. Samples for time courses were prepared as 1:1 mixtures of DMEM (no phenol red) with 10% HS and 1% penicillin-streptomycin and silver particles suspended in water at 20 μg/mL. This results in a final concentration of 5 % FBS and 10 μg/mL silver nanoparticle.

3-(4,5-Dimethylthiazol-2-yl)-2,5-Diphenyltetrazolium Bromide (MTT) Assay

Cells were seeded into wells in a 96-well plate (Falcon) (1 x 10⁵ cells/ml, 100 µl per well) to cover a 9 x 6 grid, filling 54 wells. Remaining wells were filled with 200 µl of PBS. After 24 hours, 100 µl volumes of dilutions of particles in water spanning from 20 µg/mL to 0.1 µg/mL were added to the seeded wells (final concentrations spanning 10 µg/mL to 0.05 µg/mL). For each nanoparticle, eight dilutions were prepared and for each dilution six replicates were performed. In the remaining 6 wells, 100 µL of water was added as a particle-free control. Cells were then incubated with nanoparticles for 72 h. After 72 h, 50 µL of a PBS solution of MTT (2.5 mg/ml) was added to each well and then incubated for 3 h. After 3 h, media was aspirated from all wells, leaving purple formazan crystals in those wells with viable cells. To each well, 150 µl of DMSO was added. Plates were then agitated for 30 s to dissolve the crystals and analyzed using a plate reader (Fluorstar Omega, BMG Labtech.) to determine the absorbance of each well at 570 nm. This reading divided by the average from the reading of the six control wells was plotted to determine the IC50 value of each complex for each cell line. Six replicates were performed for each sample on each cell line for each experiment, and each experiment was repeated three times. The values and errors reported are calculated from 18 unique measurements after curves were fit with a 4-variable sigmoidal curve to calculate the IC50 values.

Metal Analysis

To determine the AgNP uptake into each cell line, 5 mL cell suspensions of 105 cells/mL cells were plated into 3 cm Petri dishes. After 24 h, 250 μL of nanoparticles (stock suspensions of 20 μg/mL) were added to the cells. These samples were incubated for 24 h, at which times the media was removed and the cells rinsed twice with PBS. Trypsin-EDTA (2 mL of 0.25 %) was then added to detach the cells from the plate surface, and an additional 3 mL of PBS added to resuspend the cells. These suspensions were transferred to 15 mL conical Falcon tubes and centrifuged for 5 min at 800 rpm. The supernatant was discarded and the cells resuspended and rinsed twice with PBS in this manner to remove particles from the cell surface. Cell pellets were then resuspended in 2 mL of PBS and counted using a LUNA automated cell counter (Logos Biosystems). Cell suspension ranged between 1 to 2 x 10⁶ cells per sample for HepG2 cells and between 0.5 and 1.5 x 10⁶ cells per sample for SH-SY5Y cells. After counting the cells in each sample, the cells were centrifuged again for 5 min at 2000 rpm and the supernatant discarded. The cell pellet was dried overnight. To each dried pellet, 100 µL of concentrated nitric acid was added and the sample left for 24 h to be digested. Samples were then diluted with H2O and submitted for ICP-MS (Element XR, Thermo Fisher Scientific, Bremen, Germany) analysis to determine the silver content. The results were then normalized to the number of cells in each sample. Each experiment was repeated 3 times and the values and errors reported are the average of these 3 measurements. Samples for residual silver ion content were prepared by centrifuging samples at 30k rpm for 30 minutes. An aliquot for the top of the supernatant was removed and measured for silver content.

Results and Discussion

Particle Dynamics in Cell Culture Media

The silver nanoparticles are all stable in water and show now variation by UV-Vis or DLS over 72 hours. We have previously shown; however, that the spectra of particles do change over time and that the coating on the nanoparticles plays a role in determining how fast and in what manner the particles change over time in media with FBS [28]. The particles are mixed as a 1:1 mixture of the nanoparticle stock solution (20 μg/ml) and DMEM containing 1% pen/strep and 10% HS with spectral measurements made at 0, 1, 3, 24, 48, and 72 hours. In all five cases, the spectra of the particles in media with HS shows significant differences over time compared to those for particles in media with FBS. Generally, if the spectra maxima shift left or right, this is indicative of the particle shrinking in size (dissolving) or growing in size (agglomerating or seeding from dissolved ions), respectively. Decreases in the absorption maximum indicate agglomeration that has led to the particles settling out of suspension and increases may be the result of a change in the shape of the particle [26]. The data for the particles in media with FBS has been previously published; [28] however, data from the spectra are included in Table 1 for comparison. For citrate particles (Table 1 and Figure 1) the peak maximum of the spectrum decreased much more rapidly between 3 and 24 hours than it did in media supplemented with FBS; however, the total shift of the peak was less, suggesting that particles were aggregating and precipitating from the media. This was observable by eye as a thin red film slowly formed on the bottom of the cuvette. Similarly, for PVP coated particles, the maximum of the spectrum decreased more rapidly from 3 to 24 hours. In media with HS, the intensity of the maximum also continued to drop over the entire time course, whereas in FBS there was an increase in peak intensity after 48 hours. For PEG coated particles, the spectral maximum in media with HS shifted 4 nm to longer wavelength over 72 hours, while in media with FBS it shifted 3 nm in the opposite direction after 72 hours. For lipoic acid functionalized particles, there is no change in the position of the absorbance maximum, while in media with FBS there was a significant shift to longer wavelength of 15 nm over the same time frame. Finally for the BPEI coated particles, the immediate change observed in media with FBS is not observed here, and instead a much slower decrease in the spectral intensity is observed over the entire 72 hour time course. From all of these spectral analyses, it is clear that not only are the particles behaving differently in media with HS, but that each particle is behaving uniquely, not following any specific trend that can be applied to all particles when the type of serum is changed.

Table 1: Summary of the observed plasmonic absorption maxima for commercially tested 40 nm silver nanoparticles in media supplemented with human serum compared to media supplemented with fetal bovine serum. Data in FBS has been previously reported and is included here for comparison [28].


Sample

In HS

In FBS
Initial λmax (nm)

72 hour λmax (nm)

Δ λmax (nm)

Initial λmax (nm) 72 hour λmax (nm)

Δ λmax (nm)

40 nm citrate

424

424 0 423 428

5

40 nm PVP

420

424 4 416 429

13

40 nm BPEI

422

421 1 422 442

20

40 nm PEG

409

413 4 413 410

3

40 nm lipoic acid

434

434 0 421 436

15

fig 1

Figure 1: UV-Vis spectra of 40 nm silver nanoparticles with different surface coatings and functional groups recorded in cell culture media with a final concentration of 5% human male AB serum and 0.5% PEN/STREP. Spectra were recorded immediately upon mixing and then at 1, 3, 24, 48 and 72 h.

We then used DLS to further characterize changes to the size of the particles in the particle media suspensions over time (Table 2). Here, DLS measurements were made every 24 hours for 72 hours. Like with the UV-Vis spectra, the DLS data over time also shows different behaviour of the particles in media with HS compared to what we have previously reported in media with FBS [28]. For both citrate and PVP stabilized particles, the measured hydrodynamic diameter increased significantly over the first 24 hours, then decreased again, while in media with FBS the measured hydrodynamic diameter remained relatively constant throughout the 72 hour time course. For the BPEI stabilized particles, the initial measured diameter was now 50% greater than it was in FBS and decreased after 24 hours, whereas in FBS the particles continued to increase in size throughout the time course. Like for the PVP and citrate coated particles, the lipoic acid coated particles also increased in size at 24 hours, while only the PEG functionalized particles showed similar behaviour in both media. While this seems incompatible with the UV-Vis data, we can assume that the small changes in the spectral maximum of the PEG particles over time measured by UV-Vis and small decreases in size measured by DLS indicate small rearrangements at the particle surface interface with media components and highlight the complexity of quantifying changes to particles in cell culture media when so many components can interact at the particle-media interface. For 3 of the particles coatings, there is a significant change in the measured particle hydrodynamic diameters over the time course compared to data for particles in media with FBS suggesting that the particles age differently in this media and that greater levels of agglomeration likely occur from interactions with media components that do not occur in media with FBS, and that from the UV-Vis data this seems to occur generally within the first 24 hours after introduction of the particles to the media.

Table 2: Z-average hydrodynamic diameter as measured by DLS for commercially tested 40 nm silver nanoparticles in media supplemented with human serum Data is listed as average hydrodynamic diameter (standard error)/PDI value (standard error).

Sample

Initial diameter (nm)/PDI

24 hour diameter (nm)/PDI 48 hour diameter (nm)/PDI

72 hour diameter (nm)/PDI

40 nm citrate

50 (2)/0.56 (0.03)

47.9 (0.8)/0.57 (0.01) 50.2 (0.4)/0.55 (0.05)

48.9 (0.6)/0.54 (0.03)

40 nm PVP

63 (1)/0.46 (0.01)

61 (2)/0.47 (0.01) 52 (01)/0.45 (0.03)

50 (2)/0.44 (0.02)

40 nm BPEI

114.5 (0.8)/0.26 (0.01)

141 (3)/0.6 (0.1) 76.5 (0.7)/0.42 (0.02)

68.1 (0.4)/0.36 (0.03)

40 nm PEG

133 (2)/0.18 (0.01)

203 (9)/0.6 (0.1) 96.2 (0.9)/0.45 (0.02)

85 (3)/0.40 (0.05)

40 nm lipoic acid

89.9 (0.9)/0.19 (0.01)

143 (5)/0.44 (0.01) 100 (1)/0.25 (0.01)

91 (2)/0.26 (0.01)

Toxicity of AgNPs

Toxicity of the nanoparticles was measured by an MTT assay in HepG2 and SH-SY5Y cells. We have previously shown that this assay is a reliable and highly reproducible assay for measuring the cytotoxicity of silver nanoparticles in these cell lines and continued to use these cell lines because of the high levels of nanoparticles that end up in the liver after exposure to circulation, and the known persistence of silver nanoparticles in the brain after prolonged or targeted exposure [29,30]. Silver nanoparticles are also affective anti-microbial agents [6,7,9,31-34] and their use to fight infection could be improved by understanding how to modulate their uptake by and toxicity to human cells via modified surface chemistry while still retaining their antimicrobial activity.

Again, cells are grown in media with HS and particles are tested in this media, to better understand how particles modified by HS exposure behave differently in in vitro assays (Table 3). In HepG2 cells, all of the particles are significantly more toxic compared to when exposed in media with FBS except for the particles coated with lipoic acid which are slightly less toxic. The IC50 values for the PVP and citrate stabilized particles are lower by a factor of two showing a very significant increase in cytotoxicity against this cell line under these conditions. The values in the SH-SY5Y cells are less consistent. Very significant increases in toxicity are observed for the citrate and BPEI stabilized particles, while changes for the PVP and lipoic acid stabilized particles are about the same, and the PEG stabilized particles are significantly less toxic under these conditions. These changes highlight the need to carefully interpret in vitro toxicity data as the choice of media and cell line can skew the measured results raising or diminishing the potential threat posed by exposure to the particles. And changes in how particles agglomerate under specific media conditions may contribute to their rate of endocytosis into cells. There is clearly a need for better in vitro testing methods and a broad selection of both cell lines and media conditions to better mimic in vivo conditions, as the nanoparticles are highly susceptible to subtle changes in their immediate aqueous environment.

Table 3: IC50 values using an MTT assay for 40 nm silver nanoparticles with different surface coatings in two cell lines after 72 h and are reported in μg silver/mL in media supplemented with human serum compared to media supplemented with fetal bovine serum which has been previously reported [28]. For AgNO3 the IC50 value is reported in μmoles/L.

Sample

In HS

In FBS

HepG2

SH-SY5Y

HepG2

SH-SY5Y

40 nm citrate

0.8 ± 0.2

1.2 ± 0.3 1.8 ± 0.2

4.2 ± 0.3

40 nm PVP

0.9 ± 0.2

1.7 ± 0.2 1.8 ± 0.2

1.7 ± 0.2

40 nm BPEI

0.9 ± 0.3

0.5 ± 0.2 1.3 ± 0.2

2.5 ± 0.2

40 nm PEG

1.0 ± 0.3

5.0 ± 0.4

1.6 ± 0.2

1.8 ± 0.2

40 nm lipoic acid

1.6 ± 0.3

1.3 ± 0.3

1.2 ± 0.2

1.6 ± 0.2

AgNO3

3.5 (0.2)

4.8 (0.3)

3.7 (0.2)

3.2 (0.2)

Uptake of AgNPs by Cells

We next sought to determine if the changes in cytotoxicity data with media with HS could be correlated to changes in particle uptake that may arise from their different stability dynamics that we measured in media with HS (Table 4). In HepG2 cells there is little change in the measured silver in the cells when exposed to the same concentration of PVP, PEG and lipoic acid stabilized particles for the same time in media with HS as with FBS. This seems to counter the notion that the bioavailability of these particles is changing. For the BPEI particle, there is a small increase in the amount of measured silver, and for the citrate particles, a considerable decrease. For the citrate stabilized particles this is particularly odd as the decrease in uptake correlates with an increase in toxicity as opposed to the opposite as we expected. Centrifugation of the media was performed to attempt to measure changes in dissolved silver in the media by removing the particles and proteins in the media, but this did not indicate any difference in dissolved silver content between FBS and HS media; however, it is possible that the dissolved silver is more bio-available through coordination to species unique to HS that enhance their cytotoxicity. This argument, however, is countered by the fact that cytotoxicity of silver nitrate does not change in media with HS against HepG2 cells and the IC50 actually increases against SH-SY5Y cells compared to the IC50 values measured in media with FBS. It is clear that further investigation in required to understand why lower accumulated doses of silver under these exposure conditions are resulting in an increase in the measured cytotoxicity.

Table 4: Metal uptake analysis was performed on cell pellets treated with 40 nm silver nanoparticles with different coatings for 24 h in media supplemented with human serum compared to media supplemented with fetal bovine serum which have been previously reported [28]. Values reported are in ng silver/106 cells.

Sample

In HS

In FBS

HepG2

SH-SY5Y

HepG2

SH-SY5Y

40 nm citrate

12 ± 2

3 ± 1

40 ± 6

63 ± 8

40 nm PVP

30 ± 3

3 ± 1

43 ± 7

28 ± 6

40 nm BPEI

55 ± 6

221 ± 10

32 ± 5

190 ± 10

40 nm PEG

31 ± 3

3 ± 1

30 ± 5

170 ± 10

40 nm lipoic acid

35 ± 4

7 ± 2

31 ± 5

25 ± 6

In SH-SY5Y cells, there is nearly an order of magnitude less silver measured in the cells when using media with HS compared to media with FBS. In the case of BPEI, the silver content is much higher, however, this appears to arise from precipitated large agglomerates that could not be separated from the harvested cells, even with repeated washes, and as such should not be counted as an intracellular accumulation of silver nanoparticles. Ignoring the data for BPEI then, it is also clear from the SH-SY5Y cell data, that there is not a direct correlation between cellular uptake and cytotoxicity. The measured value for BPEI coated particles does correlate with a very low IC50 value, and so we cannot say that there is not an increase in uptake that is driving this increase in toxicity, however, observing black particle agglomerates in the cell pellet suggests that the absolute value reported may not be a true reflection of the actual uptake into the cells. To clarify this we are now pursing various microscopic and single cell sorting techniques to quantify the silver content of the cells.

Conclusion

Assessing the safe use of nanoparticles is critical to the successful implementation of particles to the commercial market space. Measurement of silver nanoparticle cytotoxicity has been performed by several groups with mixed outcomes; however, it is clear that if the intended outcome is toxicity to human cells, then measuring particles under conditions that more closely mimic in vivo conditions is important. Changing the serum in cell culture media from FBS to Human male AB serum has a pronounced effect of the stability of silver nanoparticles, their uptake into cells and their cytotoxicity in HepG2 and SH-SY5Y cells. The increased toxicity does not correlate to uptake or to changes in dissolved silver ion content suggesting a more complex relationship between the particles and media components that are driving the cytotoxicity that is measured. As we continue to test nanoparticles for safety, it is critically important that we advance the quality of the in vitro tests performed and focus on building better models of the in vivo environment as any small changes can have a profound impact on the behaviour of nanoparticles and the myriad of interactions that can occur at their surfaces.

References

  1. Benn T, Cavanagh B, Hristovski K, Posner JD, Westerhoff P (2010) The release of nanosilver from consumer products used in the home. J Environ Quality 39: 1875-1882. [crossref]
  2. Calderon-Jimenez B, Johnson ME, Montoro Bustos AR, Murphy KE, Winchester MR, et al. (2017) Silver Nanoparticles: Technological Advances, Societal Impacts, and Metrological Challenges Front Chem 5: 6. [crossref]
  3. Pourzahedi L, Vance M, Eckelman MJ (2017) Life Cycle Assessment and Release Studies for 15 Nanosilver-Enabled Consumer Products: Investigating Hotspots and Patterns of Contribution. Environ Sci Technol 51: 7148-7158.
  4. Karunamuni R, Tsourkas A, Maidment AD (2014) Exploring silver as a contrast agent for contrast-enhanced dual-energy X-ray breast imaging. Brit J Radiol 87: 20140081. [crossref]
  5. Liang P, Shi H, Zhu W, Gui Q, Ya X, et al. (2017) Oncotarget, Silver nanoparticles enhance the sensitivity of temozolomide on human glioma cells. Oncotarget 8: 7533-7539. [crossref]
  6. Sotiriou GA, Pratsinis SE (2011) Engineering nanosilver as an antibacterial, biosensor and bioimaging material. Current opinion in chemical engineering 1: 3-10. [crossref]
  7. Bhatia D, Mittal A, Malik DK (2016) Antimicrobial activity of PVP coated silver nanoparticles synthesized by Lysinibacillus varians. Biotech 6: 196.
  8. Hartemann P, Hoet P, Proykova A, Fernandes T, Baun A, et al. (2015) Nanosilver: Safety, health and environmental effects and role in antimicrobial resistance Mater Today 18: 122-123.
  9. Hsueh YH, Lin KS, Ke WJ, Hsieh CT, Chiang CL, et al. (2015) The Antimicrobial Properties of Silver Nanoparticles in Bacillus subtilis Are Mediated by Released Ag+ Ions. PloS one 10: 0144306.
  10. Niska K, Knap N, Kedzia A, Jaskiewicz M, Kamysz W, et al. (2016) Capping Agent-Dependent Toxicity and Antimicrobial Activity of Silver Nanoparticles: An In Vitro Study. Concerns about Potential Application in Dental Practice. Int J Med Sci 13: 772-782.
  11. Mori Y, Ono T, Miyahira Y, Nguyen VQ, Matsui T, et al. (2013) Antiviral activity of silver nanoparticle/chitosan composites against H1N1 influenza A virus. Nanoscale research letters 8: 93.
  12. Morris D, Ansar M, Speshock J, Ivanciuc T, Qu Y, et al. (2019) Antiviral and Immunomodulatory Activity of Silver Nanoparticles in Experimental RSV Infection. Viruses 11: 732. [crossref]
  13. Orlowski P, Kowalczyk A, Tomaszewska E, Ranoszek-Soliwoda K, Wegrzyn A, et al. (2018) Antiviral Activity of Tannic Acid Modified Silver Nanoparticles: Potential to Activate Immune Response in Herpes Genitalis. Viruses 10: 524. [crossref]
  14. Poon WL, Alenius H, Ndika J, Fortino V, Kolhinen V, et al. (2017) Nano-sized zinc oxide and silver, but not titanium dioxide, induce innate and adaptive immunity and antiviral response in differentiated THP-1 cells. Nanotoxicology 11: 936-951. [crossref]
  15. Burdusel AC, Gherasim O, Grumezescu AM, Mogoanta L, Ficai A, et al. (2018) Biomedical Applications of Silver Nanoparticles: An Up-to-Date Overview. Nanomaterials 8: 681. [crossref]
  16. DeLoid GM, Cohen JM, Pyrgiotakis G, Demokritou P (2017) Preparation, characterization, and in vitro dosimetry of dispersed, engineered nanomaterials. Nature Protocols 12: 355-371. [crossref]
  17. Azimzada A, Tufenkji N, Wilkinson KJ (2017) Transformations of silver nanoparticles in wastewater effluents: links to Ag bioavailability. Environmental Science: Nano 4: 1339-1349.
  18. Beer C, Foldbjerg R, Hayashi Y, Sutherland DS, Autrup H (2012) Toxicity of silver nanoparticles – nanoparticle or silver ion? Toxicology Letters 208: 286-292. [crossref]
  19. Behra R, Sigg L, Clift MJD, Herzog F, Minghetti M, et al. (2013) Bioavailability of silver nanoparticles and ions: from a chemical and biochemical perspective. Journal of the Royal Society Interface 10: 20130396. [crossref]
  20. Durán N, Silveira CP, Durán M, Martinez DST (2015) Silver nanoparticle protein corona and toxicity: a mini-review. Journal of Nanobiotechnology 13: 55. [crossref]
  21. Guo X, Li Y, Yan J, Ingle T, Jones MY, et al. (2016) Size- and coating-dependent cytotoxicity and genotoxicity of silver nanoparticles evaluated using in vitro standard assays. Nanotoxicology 10: 1373-1384. [crossref]
  22. Meier C, Voegelin A, Pradas del Real A, Sarret G, Mueller CR, et al. (2016) Transformation of Silver Nanoparticles in Sewage Sludge during Incineration. Environmental Science & Technology 50: 3503-3510.
  23. Molleman B, Hiemstra T (2017) Time, pH, and size dependency of silver nanoparticle dissolution: the road to equilibrium. Environmental Science: Nano 4: 1314-1327.
  24. Sharma VK, Siskova KM, Zboril R, Gardea-Torresdey JL (2014) Organic-coated silver nanoparticles in biological and environmental conditions: Fate, stability and toxicity. Advances in Colloid and Interface Science 204: 15-34. [crossref]
  25. Tejamaya M, Romer I, Merrifield RC, Lead JR (2012) Stability of citrate, PVP, and PEG coated silver nanoparticles in ecotoxicology media. Environmental Science & Technology 46: 7011-7017. [crossref]
  26. Kennedy DC, Qian H, Gies V, Yang L (2018) Human serum albumin stabilizes aqueous silver nanoparticle suspensions and inhibits particle uptake by cells. Environmental Science: Nano 5: 863-867.
  27. Kennedy DC, Gies V, Jezierski A, Yang L (2019) Effects of human serum on the stability and cytotoxicity of silver nanoparticles. SN Applied Sciences 1: 1510.
  28. Kennedy DC, Gies V, Jezierski A, Yang L (2019) Changes in the physical properties of silver nanoparticles in cell culture media mediate cellular toxicity and uptake. Journal of Nanoparticle Research 21: 132.
  29. Afifi M, Saddick S, Abu Zinada OA (2016) Toxicity of silver nanoparticles on the brain of Oreochromis niloticus and Tilapia zillii. Saudi Journal of Biological Sciences 23: 754-760.
  30. Antsiferova A, Yu B, Demin V, Kashkarov P, Kovalchuk M, et al. (2015) Extremely low level of Ag nanoparticle excretion from mice brain in in vivo experiments. IOP Conference Series: Materials Science and Engineering 98: 012003.
  31. Jung WK, Koo HC, Kim KW, Shin S, Kim SH, et al. (2008) Antibacterial Activity and Mechanism of Action of the Silver Ion in Staphylococcus aureus and Escherichia coli. Applied and Environmental Microbiology 74: 2171-2178. [crossref]
  32. Le Ouay B, Stellacci F (2015) Antibacterial activity of silver nanoparticles: A surface science insight. Nano Today 10: 339-354.
  33. Salomoni R, Léo P, Montemor AF, Rinaldi BG, Rodrigues M (2017) Antibacterial effect of silver nanoparticles in Pseudomonas aeruginosa. Nanotechnology science and applications 10: 115-121. [crossref]
  34. Tang S, Zheng J (2018) Antibacterial Activity of Silver Nanoparticles: Structural Effects. Advanced healthcare materials 7: 1701503. [crossref]

Layered Double Hydroxide

DOI: 10.31038/NAMS.2020324

Mini Review

Layered double hydroxides (LDHs) or hydrotalcites are inorganic clay materials with many promising properties. LDHs are represented in the general formula: [MII1-xMIIIx(OH)2.[An-x/n.mH2O], where MII and MIII are divalent and trivalent metal ions within the brucite-like layers and An- represents an interlayer anion. The flexibilities of the chemical composition (combination of various M(II) and M(III)) and excellent anion exchange tendency make them highly efficient and potential materials for wastewater treatment, drug deliver and catalysis. The M(II)/ M(III) LDH category (M(II): Mg2+, Fe2+, Co2+, Ni2+, Zn2+ , etc.; M(III): Al3+, Fe3+, Cr3+, etc.). M+ and M4+ cations can also be incorporated in the layers but examples are limited to specific cations such as Li+, Ti4+, and Zr4+. In the layers of LDH hosts, the M2+ and M3+ cations are orderly distributed. The positive charge is balanced by inorganic or organic anions (Cl, NO3, ClO4, CO32-, SO42-, RCO2, etc.) located in the interlayer with variable amounts of interlayer hydration water molecules. The first property inherent to this structure is the anion exchange capacity that occurs through the reaction represented by Equation below.

[MII1-xMIIIx(OH)2.[An-x/n.mH2O] + x/mBn- → [MII1-xMIIIx(OH)2.[Bn-x/n.mH2O], +( x/m)An-

Anion affinity for the LDH interlayer has been found to be based on the size of the ion and its associated charge. Monovalent anions have lower affinities than divalent anions and they are therefore more likely to precipitate in anion-exchange reactions. The ease of exchange of monovalent anions is in the order OH> F>C1> Br>NO3. Divalent anions such as SO42- and CO32-, have higher selectivity than monovalent anions. Therefore, the most suitable LDH for anion-exchange syntheses are those that have monovalent anions in the interlayer due to the relative ease of exchange [1-4].

LDH compounds have been synthesized by direct methods, which include coprecipitation [5-8], sol-gel synthesis [9-12], chimie douce [13], salt oxide reaction [14-16], hydrothermal growth [17,18] and electrochemical synthesis [19-24]. Indirect methods include all syntheses that use an LDH as a precursor. Examples of these are all anion exchange based methods such as direct anion exchange, anion exchange by acid attack with elimination of the guest species in the interlayer region and anion exchange by surfactant salt formation [25,26]. The non-anion exchange methods include the delamination-restacking method [27-30] and LDH reconstruction method [31,32].

LDHs are reported as very efficient drug nanovehicles [33,34]. In comparison to other inorganic nanovehicles, including silica and gold nanoparticles, quantum dots, and carbon nanotubes, they are featured with excellent biocompatibility [35], high drug loading capacity [36], and pH-responsive property [37], with biodegradability in the cellular cytoplasm [38]. Such outstanding properties make LDHs an efficient non-viral drug delivery vehicle, and also a reservoir for bioactive or bio-fragile molecules. Note that the intercalated drugs can be released either by deintercalation through anionic exchange with the surrounding anions (such as Cl and phosphate), or through the acidic dissolution of LDH hydroxide layers.

LDHs are regarded as a valuable adsorbent for removal of heavy metals and wastewater treatment arising from their unique properties including their high stability and other physicochemical properties [39]. Environmental problems associated with the use of highly mobile herbicides are of current concern because of the increasing presence of the agrochemicals in ground and surface waters. Anionic herbicides are of particular concern because they are weakly retained by most of the components of soil sediment, so they remain dissolved in the soil solution and can rapidly move around [40]. One approach to minimizing such transport losses is to use controlled release formulation in which the herbicides and drugs are incorporated in a matrix or carrier before application, thereby limiting the amount available for unwanted processes [41-43]. LDHs were widely used in the removal of Cr (VI) ions from solutions as reported in many studies [44,45] and, recently, they are used in Cr (VI) soil remediation [46].

Conclusion

Layered double hydroxide is an inorganic materials with the surface positive charge that can be synthesized by different techniques and highly applicable for environmental remediation and drug delivery.

References

    1. Mukarram Zubair, Muhammad Daud, Gordon McKay, Farrukh Shehzad, Mamdouh A Al-Harthi (2017) Recent progress in layered double hydroxides (LDH)-containing hybrids as adsorbents for water remediation. Applied Clay Science 143: 279-292.
    2. Rives V, Ulibarri AM (1999) Layered double hydroxides (LDH) intercalated with metal coordination compounds and oxometalates. Coord Chem Rev 181: 61-120.
    3. Gu Z, Atherton JJ, Xu ZP (2015) Hierarchical layered double hydroxide nanocomposites: structure, synthesis and applications. Chem Commun 51: 3024-3036.
    4. Daud M, Kamal MS, Shehzad F, Al-Harthi MA (2016) Graphene/layered double hydroxides nanocomposites: a review of recent progress in synthesis and applications. Carbon 104: 241-252.
    5. Feitknecht WV (1942) Über die Bildung von Doppelhydroxyden zwischen zweiund dreiwertigen Metallen. Helvetica Chimica Acta 25: 555-569.
    6. Reichle WT (1986) Synthesis of anionic clay minerals (mixed metal hydroxides, hydrotalcite). Solid State Ionics 22: 135-141.
    7. Reichle WT (1985) Catalytic reactions by thermally activated, synthetic, anionic clay minerals. Journal of Catalysis 94: 547-557.
    8. Miyata S (1983) Anion-exchange properties of hydrotalcite-like compounds. Clays Clay Miner 31: 305-311.
    9. Tadanaga K, Miyata A, Ando D, Yamaguchi N, Tatsumisago M (2012) Preparation of Co–Al and Ni–Al layered double hydroxide thin films by a sol– gel process with hot water treatment. Journal of sol-gel science and technology 62: 111-116.
    10. Chubar N, Gerda V, Megantari O, Mičušík M, Omastova M, et al., (2013) Applications versus properties of Mg–Al layered double hydroxides provided by their syntheses methods: Alkoxide and alkoxide-free sol–gel syntheses and hydrothermal precipitation. Chemical engineering journal 234: 284-299.
    11. Jitianu M, Zaharescu M, Bãlãsoiu M, Jitianu A (2003) The sol-gel route in synthesis of Cr (III)-containing clays. Comparison between Mg-Cr and Ni-Cranionic clays. Journal of sol-gel science and technology 26: 217-221.
    12. Prinetto F, Ghiotti G, Graffin P, Tichit D (2000) Synthesis and characterization of sol–gel Mg/Al and Ni/Al layered double hydroxides and comparison with coprecipitated samples. Microporous and Mesoporous Materials 39: 229-247.
    13. Delmas C, Borthomieu Y (1993) Chimie Douce Reactions: A New Route to Obtain Well Crystallized Layer Double Hydroxides. Journal of solid state chemistry 104: 345-352.
    14. De Roy A, Forano C, El Malki K, Besse JP (1992) Anionic clays: trends in pillaring chemistry. In Expanded Clays and other microporous solids 108-169.
    15. De Roy A, Forano C, Besse JP (2001) Layered double hydroxides: Synthesis and post-synthesis modification. Layered Double Hydroxides: Present and Future 1-39.
    16. Boehm HP, Steinle J, Vieweger C (1977) [Zn2Cr (OH) 6] X·2H2O, New layer compounds capable of anion exchange and intracrystalline swelling. Angewandte Chemie International Edition 16: 265-266.
    17. Prevot V, Caperaa N, Taviot-Gueho C, Claude Forano (2009) Glycine-assisted hydrothermal synthesis of nial-layered double hydroxide nanostructures. Crystal Growth & Design 9: 3646–3654.
    18. Kloprogge, JT, Hickey L, Frost RL, (2004) The effects of synthesis pH and hydrothermal treatment on the formation of zinc aluminum hydrotalcites. J Solid State Chem 177: 4047-4057.
    19. VishnuáKamath P, Loknathan I (1994) Electrogeneration of base by cathodic reduction of anions: novel one-step route to unary and layered double hydroxides (LDHs). Journal of Materials Chemistry 4: 1487-1490.
    20. Yarger MS, Steinmiller EM, Choi KS (2008) Electrochemical synthesis of Zn−Al layered double hydroxide (LDH) films. Inorganic chemistry 47: 5859-5865.
    21. Li Y, Zhang L, Xiang X, Yan D, Li F (2014) Engineering of ZnCo-layered double hydroxide nanowalls toward high-efficiency electrochemical water oxidation. Journal of Materials Chemistry A 2: 13250-13258.
    22. Scavetta E, Ballarin B, Gazzano M, Tonelli D (2009) Electrochemical behavior of thin films of Co/Al layered double hydroxide prepared by electrodeposition. Electrochimica Acta 54: 1027-1033.
    23. Liu X, Ma R, Bando Y, Sasaki T (2012) A general strategy to layered transitionmetal hydroxide nanocones: tuning the composition for high electrochemical performance. Advanced Materials 24: 2148-2153.
    24. Fang J, Li M, Li Q, Zhang W, Shou Q, et al., (2012) Microwave-assisted synthesis of CoAl-layered double hydroxide/graphene oxide composite and its application in supercapacitors. Electrochimica Acta 85: 248-255.
    25. Olfs HW, Torres-Dorante LO, Eckelt R, Kosslick H (2009) Comparison of different synthesis routes for Mg–Al layered double hydroxides (LDH): Characterization of the structural phases and anion exchange properties. Applied Clay Science 43: 459-464.
    26. Meyn M, Beneke K, Lagaly G (1990) Anion-Exchange Reactions of Layered Double Hydroxides. Inorganic Chemistry 29: 5201-5207.
    27. O’Leary S, O’Hare D, Seeley G (2002) Delamination of layered double hydroxides in polar monomers: new LDH-acrylate nanocomposites. Chemical Communications 21: 1506-1507. [crossref]
    28. Wang Q, O’Hare D (2012) Recent advances in the synthesis and application of layered double hydroxide (LDH) nanosheets. Chemical reviews 112: 4124-4155. [crossref]
    29. Wu Q, Sjåstad AO, Vistad ØB, Knudsen KD, Roots J, et al., (2007) Characterization of exfoliated layered double hydroxide (LDH, Mg/Al=3) nanosheets at high concentrations in formamide. Journal of Materials Chemistry 17: 965-971.
    30. Hibino T (2004) Delamination of layered double hydroxides containing amino acids. Chemistry of materials 16: 5482-5488.
    31. Miyata S (1983) Anionic exchange properties of hydrotaicitelike compounds. Clays Clay Miner 31: 305-311.
    32. Sato T, Okawaki A (1991) Intercalation of benzenecarboxylate ions into the interlayer of hydrotalcite. Solid State Ionics 45: 43-48.
    33. Saha S, Ray S, Acharya R, Chatterjee TK, Chakraborty J (2017) Magnesium, zinc and calcium aluminium layered double hydroxide-drug nanohybrids: A comprehensive study. Appl Clay Sci 135: 493-509.
    34. Naz S, Shamoon M, Wang R, Zhang L, Zhou J, et al., (2019). Advances in therapeutic implications of inorganic drug delivery nano-platforms for cancer. Int J Mol Sci 20: 965. [crossref]
    35. Choi SJ, Choy JH (2011) Layered double hydroxide nanoparticles as target-specific delivery carriers: Uptake mechanism and toxicity. Nanomedicine 6: 803-814. [crossref]
    36. Lv F, Xu L, Zhang Y, Meng Z (2015) Layered Double Hydroxide Assemblies with Controllable Drug Loading Capacity and Release Behavior as well as Stabilized Layer-by-Layer Polymer Multilayers. ACS Appl Mater Interfaces 7: 19104-19111. [crossref]
    37. Choi G, Lee JH, Oh YJ, Choy YB, Park MC, et al., (2010) Inorganic-polymer nanohybrid carrier for delivery of a poorly-soluble drug, ursodeoxycholic acid. Int J Pharm 402: 117-122.
    38. Gu Z, Zuo H, Li L, Wu A, Xu ZP (2015) Pre-coating layered double hydroxide nanoparticles with albumin to improve colloidal stability and cellular uptake. J Mater Chem 3: 3331-3339.
    39. Basu D, Das A, Stockelhuber K, Wagenknecht U, Heinrich G (2014) Advances in layered double hydroxide (LDH)-based elastomer composites. Progress in Polymer Science 39: 594-626.
    40. Cardoso LP, Valim JB (2006) Study of acids removal by calcined Mg-Al-CO3-LDH. Journal of Physics and Chemistry of Solid 67: 987-993.
    41. Ambrogi V, Fardella G, Grandolini G, Perioli L (2001) Intercalation compounds of hydrotalcite-like anionic clays with antiinflammatory agents—I. Intercalation and in vitro release of ibuprofen. Int J Pharm 220: 23-32. [crossref]
    42. Khan AI, Lei L, Norquist AJ, O’Hare D (2001) Intercalation and controlled release of pharmaceutically active compounds from a layered double hydroxide. Chem Commun 22: 2342-2343. [crossref]
    43. Oh JM, Park M, Kim ST, Jung JY, Kang YG, et al., (2006) Efficient delivery of anticancer drug MTX through MTX- LDH nanohybrid system. J Phys Chem Solids 67: 1024-1027.
    44. He X, Qiu X, Chen J (2017) Preparation of Fe (II)-Al layered double hydroxides: application to the adsorption/reduction of chromium. Colloids and Surfaces A: Physicochemical and Engineering Aspects 516: 362-374.
    45. Leite VdSA, Jesus BGLD, Duarte VGDO, Constantino VRL, Izumi CMS, et al., (2019) Determination of chromium (VI) by dispersive solid-phase extraction using dissolvable Zn-Al layered double hydroxide intercalated with l-Alanine as adsorbent. Microchemical Journal 146: 650-657.
    46. He X, Zhong P, Qiu X (2018) Remediation of hexavalent chromium in contaminated soil by Fe (II)-Al layered double hydroxide. Chemosphere 210: 1157-1166.