Abstract
The author conducts a numerical analysis to compare his diabetes control situations for two sub-periods over 2.4 years or 29+ months: the pre-Covid-19 (pre-Virus) period, from 5/5/2018 to 1/18/2020, and the Covid-19 (Virus) period, from 1/19/2020 to 10/10/2020. Special attention has been placed on the quantitative comparison of three glucose components and their measured data via a continuous glucose monitoring (CGM) sensor device on his arm, including fasting plasma glucose (FPG), postprandial plasma glucose (PPG), and daily glucose waveform.
The sensor collected PPG data comparison study is based on data associated with only US home-cooked meals. PPG values are closely related to food and meals (~40% contribution) varying from country to country depending on the food material and preparation method. In addition, he has stayed in the US exclusively during this Virus quarantined period; therefore, he must extract his US sensor PPG data out from his massive database (a data mining effort) in order to conduct a fair comparison. On the other hand, his FPG reflects his pancreatic beta cells’ health status which is directly related to his body weight (~90%% correlation) and has no identifiable direct connection with his diet. The pre-virus FPG values are based on his worldwide data collected from all nations with heavy traveling prior to the Virus period.
In summary, the US sensor PPG difference between two periods is within the range of 11 mg/dL to 13 mg/dL (8%-9%) and worldwide sensor FPG difference is 13 mg/dL (11%-12%). In terms sensor FPG, the difference between the pre-Virus and Virus periods are 13 mg/dL.
The average daily sensor glucose is 131 mg/dL for the pre-Virus period and 117 mg/dL for the Virus period. There is a 14 mg/dL (11%) of daily average glucose reduction during the Virus period in comparison with the pre-Virus period. Once again, his glucose control situation in the Virus period is better than the pre-Virus period.
The COVID-19 virus is the worst pandemic in recent human history in terms of its spreading speed and space, mortality rate, and emotional impact on the world population. People belonging to the “vulnerable” groups, such as the elderly with history of chronic diseases and their complications, require special attention on their health conditions as well as the lifestyle management program during this period.
Although the author belongs to one of the vulnerable groups, he achieved even better results on his diabetes control in terms of FPG, PPG, and daily glucose during the Virus period. This finding has proven once again unasked on data of PPG from the US-based home cooked food database and FPG from worldwide collected database.
Furthermore, by utilizing this data mining, segmentation data analysis, and other mathematical tools, he has further demonstrated his pancreatic beta cells’ self-repair phenomenon which was disclosed in several of his prior medical publications.
The quiet, stable, and undisturbed lifestyle during the Virus quarantined period contributes to his better glucose control situation. In fact, he turned the COVID-19 crisis into his health advantage. He established these same observed conclusions repeatedly with similar findings. More importantly, he also learned that he should try his best to continue this kind of good lifestyle in the future.
Introduction
The author conducts a numerical analysis to compare his diabetes control situations for two sub-periods over 2.4 years or 29+ months: the pre-Covid-19 (pre-Virus) period, from 5/5/2018 to 1/18/2020, and the Covid-19 (Virus) period, from 1/19/2020 to 10/10/2020. Special attention has been placed on the quantitative comparison of three glucose components and their measured data via a continuous glucose monitoring (CGM) sensor device on his arm, including fasting plasma glucose (FPG), postprandial plasma glucose (PPG), and daily glucose waveform.
The sensor collected PPG data comparison study is based on data associated with only US home-cooked meals. PPG values are closely related to food and meals (~40% contribution) varying from country to country depending on the food material and preparation method. In addition, he has stayed in the US exclusively during this Virus quarantined period; therefore, he must extract his US sensor PPG data out from his massive database (a data mining effort) in order to conduct a fair comparison. On the other hand, his FPG reflects his pancreatic beta cells’ health status which is directly related to his body weight (~90% correlation) and has no identifiable direct connection with his diet. The pre-virus FPG values are based on his worldwide data collected from all nations with heavy traveling prior to the Virus period.
Methods
Background
To learn more about the GH-Method: math-physical medicine (MPM) methodology, readers can review his article to understand his MPM analysis method [1], along with the outlined history of his personalized diabetes research and application tools development [2].
Overview of Diabetes Conditions
During 2015 and 2016, he dedicated his time to research and develops four prediction models related to his type 2 diabetes (T2D) conditions such as weight, PPG, FPG, and HbA1C (A1C). As a result from using his own developed metabolism model and four prediction tools, his weight reduced from 220 lbs (100 kg) in 2010 to 171 lbs. (89 kg) in 2018, and finally reached 168 lbs. (76 kg) in 2020; his waistline decreased from 44 inches (112 cm) in 2010 to 33 inches (84 cm) in 2020; his average finger glucose value reduced from 280 mg/dL in 2010 to 116 mg/dL in 2018, and finally reached to 106 mg/dL in 2020; and his A1C from 10% to 6.5% in 2018, and finally reached to 6.1% in 2020. One of his major accomplishments is that he no longer takes any diabetes medications since 12/8/2015.
In 2017, he achieved excellent results on all fronts, especially glucose control. However, during 2018 and 2019 (overlapping the pre-COVID-19 period), he traveled to 50+ international cities to attend 60+ medical conferences and made ~120 oral presentations. This kind of hectic traveling schedule inflicted damage to his diabetes control, through dinning out along with exercise disruption, plus jet-leg and sleep pattern disturbance, due to irregular life routines through traveling.
Data Collection
Since 1/1/2012, he measured his glucose values using the finger-piercing method: once for FPG and three times for PPG each day. In the finger glucose database, FPG occupies 25% of daily glucose while PPG occupies 75% of daily glucose. He did not use high finger glucose data in this particular analysis.
On 5/5/2018, he applied a CGM sensor device on his upper arm and checked his glucose measurements every 15 minutes, a total of ~96 times each day. After the first bite of his meal, he measured his PPG level every 15 minutes for a total of 3-hours or 180 minutes. He has maintained the same measurement pattern since 5/5/2018 until present day of 10/10/2020. In this CGM sensor glucose database, FPG occupies 29% of daily glucose, PPG takes up 38% of daily glucose, and pre-meals plus pre-bed periods occupy 33% of his daily glucose.
Mathematical Tools Utilized
In this glucose study, he utilized data mining, segmentation analysis, pattern recognition method, time-series analysis, and candlestick K-line model as explained [3-8].
Results
Figure 1 shows the US home cooked meals’ sensor PPG data over a 3-hour timespan and worldwide collected sensor FPG data over 7-hour timespan for the pre-Virus period (5/5/2018-1/18/2018) and Virus period (1/19/2020-10/10/2020).
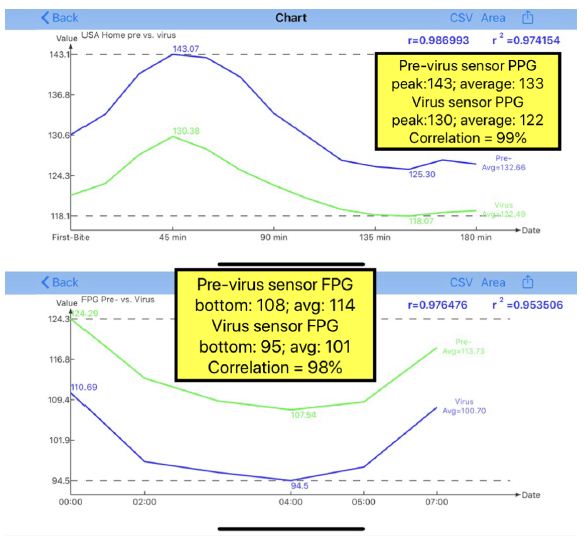
Figure 1: Data table of US sensor PPG and Worldwide sensor FPG.
In Figure 2, it shows the US sensor PPG curve and worldwide sensor FPG curve comparison between the pre-Virus period and Virus period. It is obvious that the diagrams have very high correlation coefficients between these two periods, with 99% for the US PPG and 98% for worldwide FPG. The actual glucose value comparisons listed below in the order of (peak PPG/average PPG) and (bottom FPG/average FPG):
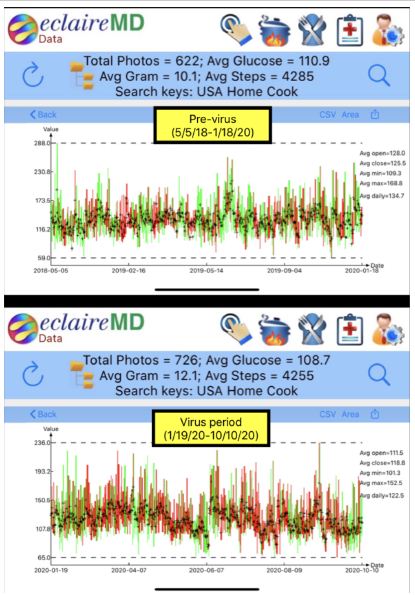
Figure 2: PPG and FPG waveforms comparison between two periods.
US Sensor PPG
Pre-Virus period: (143/133)
Virus period: (130/122)
Period’s differences: (13/11).
Worldwide sensor FPG
Pre-Virus period: (108/114)
Virus period: (95/101)
Period’s differences: (13/13).
In summary, the US sensor PPG difference between the two period is within the range of 11 mg/dL to 13 mg/dL (8%-9%) and worldwide sensor FPG difference is 13 mg/dL (11%-12%). In terms FPG difference of bottom and averaged values between the pre-virus and the Virus periods are 13 mg/dL.
Figure 3 depicts some vital data and candlestick charts of five PPG glucoses. The following table summarizes five key data of PPG waveforms of both periods in the order of five PPG values: (open/close/minimum/maximum/average).
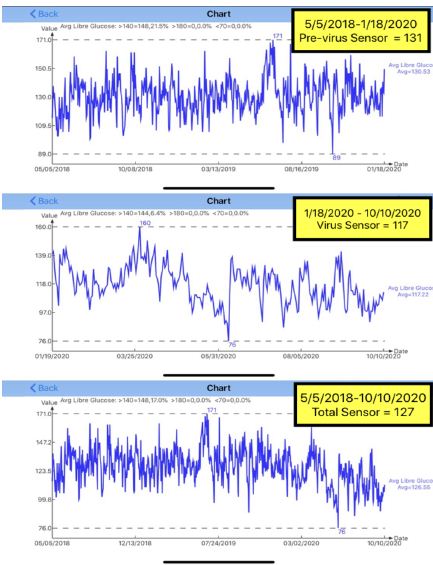
Figure 3: Comparison of daily glucose among 3 periods (pre-Virus, Virus, and total).
Pre-Virus Period K-line PPG
(128/126/109/169/135).
Virus Period K-line PPG
(112/119/101/153/123).
Sensor PPG differences
(6/7/8/16/12).
From Figure 3, it is obvious that all of the five K-line PPG values during the pre-Virus period are higher than the Virus period.
Here are some additional information listed below:
Pre-Virus Period (US Home-Cooked)
622 meals, carbs/sugar 10.1 grams, post-meal walking 4,285 steps.
Virus Period (US Home-Cooked)
726 meals, carbs/sugar 12.1 grams, post-meal walking 4,255 steps.
It should be noted that despite the carbs/sugar amount per meal during the Virus period is 2 grams more than the pre-Virus period, where both periods’ post-meal walking steps are almost equal; however, the PPG during the Virus period is actually ~13 mg/dL (or ~10%) lower than the pre-Virus period. The most logical explanation is that not only is his diabetes conditions have been improving due to his stringent lifestyle management program, but also his pancreatic beta cells’ insulin capability and quality have been self-repairing continuously over the past 10 years [6]. A similar phenomenon can also be detected from his worldwide sensor FPG difference of 13 mg/dL (or 11%-12%) improvement due to his beta cells’ insulin self-repair.
The phenomenon mentioned above can be observed in the general glucose comparison between two periods and the total period of 5/5/2018 through 10/10/2020 (Figure 3).
The average daily sensor glucose is 131 mg/dL for the pre-Virus period and 117 mg/dL for the Virus period. There is a 14 mg/dL (11%) of daily average glucose reduction during the Virus period in comparison with the pre-Virus period. Once again, his glucose control situation in the Virus period is better than the pre-Virus period.
Conclusions
The COVID-19 virus is the worst pandemic in recent human history in terms of its spreading speed and space, mortality rate, and emotional impact on the world population. People belonging to the “vulnerable” groups, such as the elderly with history of chronic diseases and their complications, require special attention on their health conditions as well as the lifestyle management program during this period.
Although the author belongs to one of the vulnerable groups, he achieved even better results on his diabetes control in terms of FPG, PPG, and daily glucose during the Virus period. This finding has proven once again unasked on data of PPG from the US-based home cooked food database and FPG from worldwide collected database.
Furthermore, by utilizing this data mining, segmentation data analysis, and other mathematical tools, he has further demonstrated his pancreatic beta cells’ self-repair phenomenon which was disclosed in several of his prior medical publications.
The quiet, stable, and undisturbed lifestyle during the Virus quarantined period contributes to his better glucose control situation. In fact, he turned the COVID-19 crisis into his health advantage. He established these same observed conclusions repeatedly with similar findings. More importantly, he also learned that he should try his best to continue this kind of good lifestyle in the future.
References
- Hsu, Gerald C (2020) Biomedical research methodology based on GH-Method: math-physical medicine (No. 310).
- Hsu, Gerald C (2020) Glucose trend pattern analysis and progressive behavior modification of a T2D patient using GH-Method: math-physical medicine (No. 305).
- Hsu, Gerald C. March (2019) Linkage among metabolism, immune system, and various diseases using GH-Method: math-physical medicine (No. 235).
- Hsu, Gerald C. May (2020) Building up fundamental strength to fight against COVID-19 for patients with chronic diseases and complications (No.253).
- Hsu, Gerald C (2020) A Case Study on the Prediction of A1C Variances over Seven Periods with guidelines Using GH-Method: math-physical medicine (No. 262).
- Hsu, Gerald C (2020) Self-recovery of pancreatic beta cell’s insulin secretion based on annualized fasting plasma glucose, baseline postprandial plasma glucose, and baseline daily glucose data using GH-Method: math-physical medicine (No. 297).
- Hsu, Gerald C (2020) Glucoses and HbA1C comparison study between pre- COVID-19 and COVID-19 using GH-Method: math-physical medicine (No. 318).
- Hsu, Gerald C (2019) Using Candlestick Charting Techniques to Investigate Glucose Behaviors via GH-Method: Math-Physical Medicine (No. 76).