Monthly Archives: June 2020

A Discussion of the Current Limitations of Diabetes Etiology

DOI: 10.31038/EDMJ.2020431

Abstract

The immense amounts of research into diabetes reflects the need for a better understanding of what is diabetes (DM), how it can be measured, and how it can be treated and/or managed however despite the enormous amounts invested in diabetes research there is not unanimity from the research community on any of these matters. The issue which faces diabetes researchers is whether to continue with ‘more of the same’ lines of research or whether to strike out and seek more radical solutions.

It is clear that the biology of the pancreas plays a significant role; in particular the many factors which influence the genetic expression of insulin (type 1 diabetes) and the subsequent ability of insulin to react with its reactive substrate (type 2 diabetes); however there must be additional factors which are consistent with the laws of chemistry and physics which are not yet being seriously considered in the etiology of DM i.e. that the known biology of DM is only part of the complex etiology of DM.

The author raises a number of issues in this paper which address a number of inconsistencies in the screening and treatment of diabetes. Heillustrates that type 1 and type 2 diabetes exist as comorbidities, that the onset of diabetes leads inevitably to the onset of a range of diabetic comorbidities,  and that ‘the regulation of blood glucose levels’ exhibits the characteristics of a neurally regulated physiological system. Such observations have immense significance regarding how we screen for diabetes and how we treat diabetes and diabetic comorbidities.

The Biology of Diabetes

The first step to consider in the process of Diabetes (DM) is that of genetic expression in which a wide spectrum of genes, currently considered to be more than 60 genes [1], coherently interact in order to express pre-pro-insulin (type 1 diabetes) however the interpretation of such data is complicated when considering that the spectrum of genes which express pre-pro-insulin can differ [2] e.g. between different racial subtypes.

There are few instances, if any, where a single gene acts independently of all other genes in order to express a particular protein or where a single gene is considered to be responsible for a particular medical indication e.g. in the case of Rett’s syndrome [3], which is considered to be widely attributable to a single mutation in the MECP2 gene, a more in-depth examination of the literature reveals a lack of certainty surrounding such a conclusion e.g.

• ‘Mutations in a gene called MECP2 underlie almost all cases of classic Rett syndrome’

• ‘Using a systematic gene screening approach, we have identified mutations in the gene (MECP2) encoding X-linked methyl-CpG-binding protein 2 (MeCP2) as the cause of some cases of RTT’.

• ‘In 5 of 21 sporadic patients, we found 3 de novo missense mutations in the region encoding the highly conserved methyl-binding domain (MBD) as well as a de novo frameshift and a de novo nonsense mutation, both of which disrupt the transcription repression domain (TRD)’

• ‘In two affected half-sisters of a RTT family, we found segregation of an additional missense mutation not detected in their obligate carrier mother’

This indicates that there is conceivably a phenomenon of greater significance than gene chemistry but which nevertheless involves gene chemistry. It can only be explained if our DNA and genes are continually seeking out more stable states, in a best-fit manner i.e. changing between different conformational and energetic states [4] in order to find the most stable state.

It conceivably explains why therapies, which were designed to influence the genetic profile in order to be effective in their specific areas of application (viruses, virus-like particles and/or and vaccines), are associated with predisposition to type 1 diabetes [5].

1. It is often overlooked that genetic expression is a chemical reaction in which various components e.g. the genetic spectrum,transcriptases and minerals; influence the rate and extent to which pre-pro-insulin is expressed however transcriptases are often dependent upon magnesium and zinc for their structure, function and reactivity.  This is significant in DM becausethe level of essential minerals and/or their reactivity are dependent upon the prevailing intercellular pH therefore a deficit of minerals, in particular magnesium and zinc which is commonly observed in the diabetic [6], must influence the structure and/or reactivity of the enzyme and hence the extent of expression of pre-pro-insulin.

In general, the conversion of pre-pro-insulin to pro-insulin is considered to proceed without any significant hindrances however it should be emphasised that the conversion of pre-pro-insulin is dependent upon the availability and reactivity of signal peptidases and hence is likely to be influenced by the prevailing intercellular pH and levels of minerals and cofactors although the extent to which this occurs is uncertain.

2. Similarly the conversion of pro-insulin to insulin must also be dependent upon the prevailing reaction kinetics. Moreover, it is encoded by the INS gene [7] so any changes of gene structure [1] due to the influence of viruses and/or virus-like particles, the presence of mutant alleles, the influence of epigenetic components, the action of reactive oxygen species upon gene structure, alterations of gene conformation and energetics, and the prevailing reaction conditions e.g. pH and mineral levels;must also influence this process to some extent.

3. It is considered that because pro-insulin has a longer half-life than insulin (if not insulin levels would be in a perpetual deficit)and that this accounts for 5-30% of the insulin-like structures in the blood however there does not appear to be any significant explanations for this broad range of pro-insulin levels [8]. This may be significant, especially so if we consider that only one of the many insulin-like structures – insulin monomer – will react with its receptor protein IRP2.

4. Pro-insulin is converted to insulin by endopeptidases (PC1 & PC2) and Carboxypeptidase E which function at rates determined by their unique chemical properties and the corresponding reaction kinetics involving intercellular pH, levels of minerals, etc.

5. Insulin is a very large and highly reactive protein comprises 51 amino-acids. It exists as a dimer (particularly so when complexed as the zinc-hexamer), comprising an A chain and a B chain which are connected by disulphide bonds but reacts as the monomer. Its chemical properties are that it exists as a coiled moiety, is a polar entity with -NH2 and –COOH groups at its extremities, is water soluble, and highly reactive (half-life of ca 3 minutes) so if the pH is not maintained at the appropriate level this will influence insulin conformation, energetic state and half-life.

6. The relatively slow genetic expression/productionof insulin, conceivably because it is such a large and highly reactive molecule, requires that insulin is stored in the pancreas as a zinc-hexamer; awaiting metabolic signals and vagal nerve stimulation [9] to be exocytosed from the cell into the circulation;however under pathological conditions i.e. elevated levels of intercellular acidity, reduced levels of essential minerals, alters the redox state and/or bioavailability and levels of transition metals. As a resultinsulin becomes less coiled and circulates as the monomer rather than as the more stable dimer or the hexamer.

It provides a mechanism whereby zinc availability and redox mechanism are linked. Zinc is transported by albumin and transferrin however transferrin also transports iron which reduces the absorption of zinc, and vice versa. Zinc and copper also have an antagonistic relationship. This is consistent with differing levels of intercellular acidity in which there is a biodynamic relationship between essential minerals and the transition minerals at pH 7.35. When intercellular pH decreases to pH of more typically 6.75 the levels of essential minerals such as zinc and magnesium decline whilst the levels of transition metals such as iron, aluminium, copper increase. It explains why most diabetic patients are magnesium and zinc deficient [10-12].

Moreover [13] insulin levels vary throughout the day, from <100pmol/l to >800pmol/l, and in particular (i) following a meal and (ii) in a 3-15 minute oscillating manner i.e. indicatively over a 3-6 minute period for those who are normally healthy and over a 6-15 minute period for the diabetic.Under acidic conditions insulin becomes less coiled and less reactive (the phenomena of ‘protein-resistance’ is common to insulin, leptin, ghrelin and perhaps also in the ‘folding’ of other proteins), the availability of zinc hexamer in the islets declines [14] under acidic conditions, and insulin is supplied over a longer period and/or in a less reactive form.

Pathological onset of DM under acidic conditions (in general, DM does not occur in patients with relatively neutral intercellular pH),is accompanied by the glycation of proteins [15,16] e.g. of insulin, albumin, LDL-Cholesterol, haemoglobin, fibrinogen, immunoglobulin(s), etc. This is indicative of free radical reactions which arise from increased acidity, increased levels of transition minerals [17], and a suitable substrate (glucose). It is confirmed by noting thatanti-oxidants [18] influence such oxidative processes and have a positive influence upon DM.

In addition the reaction of insulin with its receptor protein IRP2 is a magnesium dependent reaction and, as outlined, the supply of magnesium is dependent upon prevailing levels of intercellular pH.

7. That the regulation of intercellular pH is so immensely significant, if not obvious from the above, is further confirmed when considering the role of metformin which is eliminated from the body almost completely unmetabolised therefore its metabolic effect is not pharmacological. A closer examination of metformin’s chemical structure reveals that it exhibits the structure, and hence the function, of a biological buffer [19] which maintains intercellular pH at a level of indicatively 6.75-6.95.

Accordingly if applied to the diabetic patient it will have the effect of reducing intercellular pH in patients with a lower intercellular pH i.e. the severely diabetic and/or obese patient with intercellular pH of indicatively 6.25-6.75. This should have the effect of reducing the severity of their diabetic symptoms however it will not be a substitute for weight-reduction measures. For patients who are pre-diabetic, who have been prescribed metformin, it willlikely have the effect of lowering their intercellular pH and enhancing their diabetic symptoms.

8. The expression of insulin and the reaction of insulin with its receptor protein are sequential processes. If they were parallel processes there would be a selection of one of the two processes – the ‘either or’ scenario – but this is clearly not the case.  The genetic expression of a protein is followed by the reaction of the expressed protein with its reactive substrate. The two processes occur in sequence so type 1DM (genotype) and type 2DM (phenotype) are comorbidities in which there can be several different states e.g.

(i) low levels of type1DM and absence of type 2DM,

(ii) low levels of type 1DM and low levels of type 2DM (diagnosis: prediabetes),

(iii) low levels of type 1DM and high levels of type 2DM (type 2 diabetes),

(iv) high level of type 1DM and absence of type 2DM (diagnosis: type 1 diabetes),

(v) high level of type 1DM and low/moderate level of type 2DM (diagnosis: type 1DM)

(vi) high level of type 1DM and high level of type 2DM (diagnosis: type 1 and type 2DM)

It is not a case of whether the patient has either type 1DM or type 2DM. Both can and do occur as comorbidities as outlined in (ii)-(vi).

9. The GLUT-4 receptor which converts glucose into energy is located in the smooth muscle. Moreover this reaction is a chromium-dependent reaction in which the prevailing redox states of chromium are influenced by the prevailing intercellular pH i.e. the intercellular pH, in combination with the quality and quantity of smooth muscle (physical fitness) influences the ability to metabolise blood glucose.

Measuring Diabetes

The onset of pathological conditions, as outlined, leads to the production of mainly excessblood glucose and elevated levels of advanced glycation end-products, which are manifest as glycated proteins and other lipids, and which subsequently alter blood viscosity and thereby influence the function of the heart, kidneys, etc.  Nevertheless, and as outlined in 1.10 above, this hyperglycaemia which is characteristic of type 1DM, is only one aspect of diabetes.  Hypoglycaemia can be encountered due to suppression of the genetic expression of insulin.  Nevertheless the characteristics of diabetes, in particular of unstable levels of blood glucose, can occur due to pathological onset in other organs (mainly the endocrine glands) and physiological systems e.g. in the case of hysterectomy.

The glycated protein HbA1c is used as a measure of type 2 diabetes however the validity of the test is often questioned, perhaps with good reason [20]. The processes responsible for type 1 and type 2 occur simultaneously i.e. they are comorbidities;thereby explaining to some extent the misdiagnoses when using the HbA1c test [21,22], but the test only measures the glycation process.

The A1c form of glycated haemoglobin A was selected because it was considered to be the most prominent of the various forms of glycated haemoglobin however it is likely, perhaps inevitable, that altered reaction conditions will lead to increased/decreased levels of the different glycated haemoglobin isomers and a reduction/increase of HbA1c.

‘the measurement of HbA1C is likely not a comprehensive indicator of HbA glycation’ [23]

Also, it is assumed that the ratio of haemoglobin Avs other proteins does not vary and hence that the test would be an accurate measure of the glycation process however the level of haemoglobin varies widely [24]. Test outcomes are influenced by many variables including light, pH, levels of minerals, RBC and/or haemoglobin levels, and other factors; and finally haemoglobin A does not play a role in the etiology of diabetes!Accordingly, the scope for misdiagnosis is immense. The possibility of inaccurate test results is inevitable, especially so in cases of non-pancreatic diabetes in which the problems of blood glucose regulation are not caused by the aforementioned pathological processes which are commonly attributed to diabetes but instead to pathological emergence in other organs and physiological systems [25].

All chemical reactions are accompanied by the absorption and emission of energy

i.e., by the emission of biophotons which create the phenomena of auto fluorescenceand/or bioluminescence in blood [26]. The emission of biophotons [27,28], as proteins decay from their reactive state to their base state, is particularly evident in the retina of diabetics as it alters blue-yellow colour perception [29] and serves as a measure of type 1 and type 2 diabetes in a cognitive test.

This occurs because the eye responds to as little as 7*10^2 bio photons per second.  The retina focusses this bioluminescence which can be measured in a cognitive test and used as a precise, digital measure of pathological onset and progression in all medical conditions which are accompanied by changes of colour perception and brain function i.e. across the complete medical spectrum.The company Bio Astral [28], supported by significant UK government grants prior to its demise, was researching advances in space-science imaging technology i.e. to measure the release of bio photons from blood (quote: ‘Our STJ cryogenic detector is 1000 times more powerful at detecting fluorescence in biological assays than current technology, and is unique in giving the colours of photons detected without requiring filters, gratings or other techniques’).

Accordingly a technique which measures the intensity and colour of biophotons has significant potential as a measure of diabetes which is relatively free from side-effects, errors and misdiagnoses.

The Neurology of Type 2 Diabetes

There are two fundamental avenues which influence the autonomic nervous system: (i) via sensory intake (vision, hearing, smell, taste and touch) and (ii) via the visceral organs.

As outlined in this text, genetic and non-genetic (phenotype) changes lead to the onset of type 1 and type 2 diabetes. It is commonly considered that genetic changes occur due to the effect of gene-altering moieties e.g. as viruses; however this text illustrates that genetic changes occur due (i) to the influence of virus-like particles (vaccines) and (ii) increased levels of intercellular pH which accompany stress and generate ROS which have a degenerative effect upon the genetic profile.

Moreover stress (either as psychological stress or as psychophysiological stress i.e. excess weight), which is experienced via the sensory organs and brain, is an acidifying process which increases cortisol levels and influences appetite [30] thereby illustrating the link between molecular biology and sense perception – influencing perception of colour and appetite.

So type 2 Diabetes is a neurological condition which arises because the brain is unable to maintain the calorific balance between appetite, the intake of calories through food and drink, and the expenditure of energy.

The regulation of blood glucose exhibits the characteristics of a neurally regulated physiological system whereby blood glucose levels are maintained between higher and lower levels hence the use of the terms ‘hyper’-glycaemia and ‘hypo’-glycaemia.

The regulation of blood glucose is just one of the 13 physiological systems. The other systems, identified by Grakov IG, are: blood pressure, blood volume, blood cell content, respiration, the consumption of food and drink, the elimination of fluids, intercellular pH, body temperature, posture, osmotic pressure, sexual function and sleep. Each performs an indispensable physiological function which, in most cases, and if not sustained within specific limits, leads to our demise.Each physiological system involves the brain and the endocrine glands.

Moreover, and as outlined earlier, the regulation of blood glucose involves the vagus nerve [9] which stimulates the pulsed release of insulin [13] by the pancreas.

Accordingly pathological onset in organs within this physiological system (network of organs) or in adjacent physiological systems will influence blood glucose levels. It explains the phenomena of non-pancreatic diabetes in which the patient(s) have problems regulating their blood glucose and yet their pancreas’ functions [31] normally e.g. due to endocrine dysfunction, hysterectomy, etc.

The most significant physiological systems [31] which influence the regulation of blood glucose level are sleep, pH [32], what we consume and excrete, and body temperature.

Each physiological system can be neurally regulated.

It is a problem for biomedicine to explain, using a solely chemical mechanism, how the different organ networks act in an apparently coherent manner.  In 2013 the Human Brain Projectwas established to explore the issues. It was tasked by the EC to achieve three fundamental objectives: (i) to understand what the brain does and how it does it; (ii) to use this knowledge to develop a new generation of cognitive diagnostic test, and (iii) to understand and adapt with therapeutic effect the multi-level nature of brain function.  Specific emphasis was placed upon screening the complex pathological coordinates of Alzheimer ’s disease.

Ewing recognised that these fundamental objectives had been completed by Grakov in the period 1981/2-1997-2006 and were incorporated into the Strannik software.  Papers followed which compared the two different techniques [33,34]; identified fundamental limitations of the techniques being deployed to achieve such objectives [34,35], in particular the reliance upon ‘big data’; determined that the brain acts as a neuromodulator [36] of the autonomic nervous system; that Grakov had developed a screening test which can screen for the complex pathological correlates of diabetes and diabetic comorbidities including Alzheimer’s Disease [37-42]; and had understood how this led to an understanding of the multilevel nature of brain function in particular of the mechanism which regulated the stability of the autonomic nervous system and the coherent function of the physiological systems [43].

The specific origins of such a technique can be traced back for over 100 years however it is only in the last 10-20 years that significant progress is being made towards the development of the envisaged new generation of neuromodulation therapy [44-46] which has the potential to improve therapeutic outcomes in [47] a wide range of medical indications [48-55] including multiple sclerosis, Parkinsonism, Alzheimer’s Disease, Migraine, regulation of menstruation, etc.

Discussion

The evidence assembled in this short paper illustrates that type 1 and type 2 diabetes are comorbidities and that‘the regulation of blood glucose levels’exhibits the characteristics of a neurally regulated physiological system and involves the process of neuroregulation [56,57] i.e. the relationship between sense perception, brain function, the autonomic nervous system (the stress response) and physiological systems, and cellular and molecular biology (as genotype and phenotype).

Moreover the evidence for such a conclusion, and its relevance to how we screen or treat diabetes is already evident in various diabetes papers which illustrate that (i) changes of blue-yellow colour perception accompany the onset and progression of diabetes, (ii) that this phenomena is not unique to diabetes but can be used to screen for an extensive range of pathologies [38] including diabetic comorbidities, (iii) that the phenomena is associated with the emission of biophotons, (iv) that the vagus nerve is involved in diabetes etiology, (v) that insulin is released by the pancreas in a pulsatile manner which is indicative of ‘control circuitry’, and (vi) that knowledge of this ‘neuro-regulatory mechanism’ can be used to treat patients with a wide range of pathological indications [39] including type 1 and type 2 diabetes and related diabetic comorbidities e.g. by reducing exposure to stress [30,58].

The future development of neurological knowledge, in particular of how the brain works and what it does, is leading to the development of a new generation of diagnostic and therapeutic technologies as envisaged by the EC’s Human Brain Project although perhaps such technologies [59] have not emanated from Human Brain Project research.

References

  1. Bakay M, Pandey R, Hakonarson H (2013) Genes involved in type 1 diabetes: an update. Genes (Basel)4(3):499-521.[crossref]
  2. Ewing GW (2017) The Interpretation of Genetic Data – Considering the Effect of Changes to Gene Conformation — If the facts don’t support the theory, change the theory – how does this contribute to understanding Diabetes? J Genet DisorGenetRep 6:1-4.
  3. Amir R, Van den Veyver I, Wan M, Tran C, Francke U et al. (1999) Rett syndrome is caused by mutations in X-linked MECP2, encoding methyl-CpG-binding protein. Nat Genet. 23: 185-188.
  4. Bodhini D, Radha V, Ghosh S, Majumder PP, Mohan V (2011) Lack of association of PTPN1 gene polymorphisms with type 2 diabetes in south Indians. J Genet 90: 323-326. [crossref]
  5. Tuomilehto J, Rewers M, Reunanen A, Lounamaa P, Lounamaa R et al. (1991) Increasing Trend in type 1 (insulin-dependent) diabetes mellitus in childhood in Finland.Analysis of age, calendar time, and birth cohort effects during 1965-1984. Diabetologia 34: 282-287. [crossref]
  6. Gunther T (2010) The biochemical function of Mg2+ in insulin secretion, insulin signal transduction and insulin resistance. Magnesium Research 23: 5-18. [crossref]
  7. INS insulin [ Homo sapiens (human) ][crossref]
  8. Interpretation for 80908 Proinsulin, Plasma. www.mayomedicallaboratories.com. 2017-03-09.
  9. Meyers EE, Kronemberger A, Lira V, Rahmouni K, Stauss HM. (2016) Contrasting effects of afferent and efferent vagal nerve stimulation on insulin secretion and blood glucose regulation. Physiol.Rep 4: 12718.
  10. Maret W, Krezel A (2007) Cellular zinc and redox buffering capacity of metallothionein/thionein in health and disease. Mol Med 13: 371–375.
  11. Rink L, Gabriel P (2000) Zinc and the immune system. ProcNutrSoc 59: 541–552. [crossref]
  12. Brandão-Lima PN, Carvalho GB, Santos RKF, Santos BDC, Vasconcelos NLD et al. (2018) Intakes of Zinc, Potassium, Calcium, and Magnesium of Individuals with Type 2 Diabetes Mellitus and the Relationship with Glycemic Control. Nutrients 10: 1948.
  13. Hellman B, Gylfe E, Grapengiesser E, Dansk H, Salehi A (2007) Insulin oscillations—clinically important rhythm. Antidiabetics should increase the pulsative component of the insulin release. Läkartidningen 104: 2236-2239. [crossref]
  14. Wijesekara N, Chimienti F, Wheeler MB (2009) Zinc, a regulator of islet function and glucose homeostasis. Diabetes, Obesity and Metabolism 11: 202-214. [crossref]
  15. Singh VP, Bali A, Singh N, Jaggi AS (2014) Advanced Glycation End Products and Diabetic Complications. Korean J PhysiolPharmacol 18: 1–14. [crossref]
  16. Wolff SP (1993) Diabetes mellitus and free radicals: Free radicals, transition metals and oxidative stress in the aetiology of diabetes mellitus and complications. British Medical Bulletin 49: 642-652. [crossref]
  17. Aust SD, Morehouse LA, Thomas CE (1985) Role of metals in oxygen radical reactions. J Free RadicBiol Med 1: 3-25. [crossref]
  18. Maritim AC, Sanders RA, Watkinss JB 3rd (2003) Diabetes, oxidative stress, and antioxidants: a review. J BiochemMolToxicol 17: 24-38. [crossref]
  19. Ewing GW (2018) Is Metformin a Drug or a Buffer and Why is this Significant? Further evidence that the brain Regulates the Autonomic Nervous System, in particular prevailing levels of Intercellular pH.Endocrinology, Diabetes and Metabolism Journal 2: 1-9.
  20. McDonald TJ, Warren R (2014) Diagnostic confusion? Repeat HbA1c for the diagnosis of diabetes. Diabetes Care 37: 135-136.
  21. CheolBae J, Sunghwan S, Sang‐Man J, Se won K, KyuYeon H, et al. (2014) Hemoglobin A1c values are affected by haemoglobin level and gender in non‐anaemic Koreans. Journal of Diabetes Investigation 5: 60-65. [crossref]
  22. Hegde SN, Srikousthubha MS, Anupama YJ, Rathnakar R, et al. (2018) A case of undetectable glycated haemoglobin (HbA1c). QJM: An International Journal of Medicine 111: 567-568.
  23. Clark SLD, Santin AE, Bryant PA, Holman RW, Rodnick KJ (2013) The initial noncovalent binding of glucose to human haemoglobin in nonenzymaticglycation. Glycobiology 23: 1250-1259. [crossref]
  24. Ebben JP, Gilbertson DT, Foley RN, Collins AJ (2006) Haemoglobin level variability: Associations with comorbidity, intercurrent events, and hospitalizations. Clin J Am SocNephrol 1: 1205-1210. [crossref]
  25. Ewing GW, Ewing EN (2008) NeuroRegulation of the Physiological Systems by the Autonomic Nervous System – their relationship to Insulin Resistance and Metabolic Syndrome.  Biogenic Amines 22: 208-239.
  26. Ewing GW, Parvez SH, Grakov IG (2011) Further Observations on Visual Perception: the influence of pathologies upon the absorption of light and emission of bioluminescence. The Open Systems Biology Journal 4: 1-7.
  27. Ewing GW, Parvez SH, Grakov IG (2011) Further Observations on Visual Perception: the influence of pathologies upon the absorption of light and emission of bioluminescence. The Open Systems Biology Journal 4: 1-7.
  28. https://www.le.ac.uk/biology/phh4/bioastral/home.htm
  29. Radwan TM, Ghoneim EM, Ghobashy WA, Orma Ahmed A (2015) Assessment of Color Vision in Diabetic Patients. International Journal of Ophthalmic Research 1: 19-23.
  30. Razzoli M, Pearson C, Crow S, Bartolomucci A (2017) Stress, overeating, and obesity: Insights from human studies and preclinical models. NeurosciBiobehav Rev 76: 154-162. [crossref]
  31. Ewing GW (2013) The ‘Biology of Systems’ or the ‘Systems of Biology’: Looking at Diabetes from the Systemic Perspective. International Journal of Systems Biology 4: 45-56.
  32. Ewing GW (2012) The Regulation of pH is a Physiological System. Increased Acidity alters Protein Conformation and Cell Morphology and is a Significant Factor in the onset of Diabetes and other common pathologies. The Open Systems Biology Journal 5: 1-12.
  33. Ewing GW, Grakov IG (2015) A Comparison of the Aims and Objectives of the Human Brain Project with Grakov’s Mathematical Model of the Autonomic Nervous System (Strannik Technology). Enliven: Neurol. Neurotech 1: 002.
  34. Ewing GW (2015) Back to Basics: Limitations of Research influencing the Human Brain Project. Comput.Sci.Syst.Biol 8:6:322-326.
  35. Ewing GW (2017) The Limitations of Big Data. The Limitations of Big Data in Healthcare. MOJ Proteomics Bioinform 5: 00152.
  36. Ewing G (2016) What is the function of the Brain? What does it do and how does it do it? It functions as a Neuroregulator, which continuously regulates the Autonomic Nervous System and Physiological Systems, and enables us to Recognise that Sleep Exhibits the Characteristics of a Neurally Regulated Physiological System. J NeurolPsychol 4: 9.
  37. Ewing GW (2016) The Use of Strannik Virtual Scanning as a Modality for the Earliest Screening of the Pathological Correlates of Alzheimer’s Disease. Human Frontier Science Program (HFSP) Journal 10: 2-20.
  38. Ewing GW (2018) A Different Perspective on Diabetes & Obesity – what it is and how it can be measured. Case Reports in Clinical Medicine 7: 269-287.
  39. Ewing GW, Parvez SH (2019) Diabetes is a Complex Neurological, Multisystemic, Multipathological and Polygenomicdisorder : Use of Strannik Software as an Effective Modality to Illustrate its Complexity. J NeurolPsychol 7: 14.
  40. Ewing GW, Ewing EN (2009) Computer Diagnosis in Cardiology. N Am J Med Sci 1: 152-159.
  41. Ewing GW (2016) The Use of Strannik Virtual Scanning as a Modality for the Earliest Screening of the Pathological Correlates of Alzheimer’s Disease. Human Frontier Science Program (HFSP) Journal 10: 2-20.
  42. Ewing GW (2019) How Disruptive Solutions Could Improve the Prevailing Healthcare Paradigm. A Novel Perspective Regarding the Treatment of Mental Health Conditions: the Strannik Mathematical Model. J Clin Cases Rep 3: 89-114.
  43. Ewing GW (2010) A Theoretical Framework for Photosensitivity: Evidence of Systemic Regulation. Journal of Computer Science and System Biology 2: 287-297.
  44. Ewing GW (2010) There is a need for an Alternative or Modified Medical Paradigm involving an understanding of the nature and significance of the Physiological Systems. N Am J Med Sci 2: 1-6.
  45. Ewing GW (2013) Virtual Scanning: a New Medical Paradigm?  Journal of Computer Science and Systems Biology 6: 93-98.
  46. Ewing GW (2016) The Future of Medicine: Biomedicine or Neuroscience? Insights in Biomedicine 1: 14-17.
  47. Kelley R, Flouty O, Emmons EB, Youngcho Kim, JohnathanKingyonet al. (2017) A human prefrontal-subthalamic circuit for cognitive control. Brain141: 205-216. [crossref]
  48. Abboud H, Hill E, Siddiqui J, Alessandro Serra, Benjamin Walter (2018) Neuromodulation in multiple sclerosis. MultScler X23: 1663-1676. [crossref]
  49. Gaede G, Tiede M, Lorenz I (2018) Safety and preliminary efficacy of deep transcranial magnetic stimulation in MS-related fatigue. Neurology: Neuroimmunology&Neuroinflammation 5: 423.
  50. Lv Q, Du A, Wei W, Li Y, Liu G, Wang X-P (2018) Deep Brain Stimulation: A Potential Treatment for Dementia in Alzheimer’s Disease (AD) and Parkinson’s Disease Dementia (PDD). Front Neurosci12:360. [crossref]
  51. Martorell AJ, Paulson AL, Suk H-J, FatemaAbdurrob , Gabrielle T Drummondet al. (2019) Multi-sensory Gamma Stimulation Ameliorates Alzheimer’s-Associated Pathology and Improves Cognition. Cell 77: 256-271. [crossref]
  52. Iaccarino HF, Singer AC, Martorell AJ, et al. (2016) Gamma frequency entrainment attenuates amyloid load and modifies microglia. Nature 540: 230-235.
  53. Luijmes RE, Pouwels S, Boonman J (2016) The effectiveness of neurofeedback on cognitive functioning in patients with Alzheimer’s disease: Preliminary results. NeurophysiolClin 46:179-187. [crossref]
  54. Noton D (2000) Migraine and photic stimulation: report on a survey of migraineurs using flickering light therapy. Complement. TherNurs Midwifery 6: 138-142. [crossref]
  55. Anderson DJ, Legg NJ, Ridout DA (1997) Preliminary trial of photic stimulation for premenstrual syndrome. J ObstetGynaecol 17: 76-79. [crossref]
  56. Ewing GW, Parvez SH 2011 (2011) Mathematical Modeling the Systemic Regulation of Blood Glucose: ‘a top-down’ Systems Biology Approach. NeuroEndocrine Letters 32: 371-379. [crossref]
  57. Ewing GW (2015) A Framework for a Mathematical Model of the Autonomic Nervous System and Physiological Systems using the NeuroRegulation of Blood Glucose as an Example. J Comput.SciSystBiol 8: 59-73.
  58. Martin Cosgrove, Martin Cosgrove (2004) Do stressful life events cause type 1 diabetes? Occupational Medicine 54: 250-254.
  59. Grakov IG Strannik Diagnostic and Treatment System: a Virtual Scanner for the Health Service. Minutes of Meeting No. 11 of the Praesidium of the Siberian of the Academy of Medical Sciences of the USSR (AMN) held in Novosibirsk 4 December 1985.
Alveolar Macrophages in Influenza A Infection Guarding the Castle with Sleeping Dragons

DOI: 10.31038/IDT.2020114


Influenza A is a Worldwide Burden and Recurring Threat

Despite major advances in influenza vaccination and flu-prevention community awareness campaigns, Influenza A virus (IAV) remains a worldwide and recurring threat [1, 2]. Seasonal influenza causes 3-5 million cases of severe respiratory and systemic illness and upwards of 650,000 deaths annually, particularly among the elderly, very young, and chronically ill [3]. Countless hours of missed school and work have significant economic consequences [4, 5]. In pandemic years, morbidity and mortality soars, especially among the young [6, 7].

The Influenza A Viral Infection Cycle

In humans, influenza A targets epithelial cells of the respiratory tract via droplet inhalation. Viral Hemagglutinin (HA) protein binds to sialic acid receptors decorating the surface of polarized respiratory epithelial host cells. If the patient has repeated exposure to the same IAV strain, or one with similar HA antigenic structure, IAV-specific IgG and secretory IgA antibodies may neutralize and thereforeeliminate the virus.Circulating CD4+ helper T-cells directed against influenza proteins may hasten the effectors T cell response; as well as provide some direct antiviral function by targeted destruction of infected cells, limiting viral spread [8, 9]. Antigen-specific effector CD8+ T cells primed against internal viral antigens, when present, clear virus and destroy infected cells, thus limiting severity of disease [9, 10]. If the virus is not cleared by these mechanisms,or if the host response is impaired (as with smokers and other conditions), retrograde infection can proceed from the upper respiratory tract to the lower.Following virion uptake in the cell endosome and uncoating viral RNA is transported to the host cell nucleus, where the virus begins replication and transcription, utilizing host cell mRNA cap-stealing mechanisms to induce viral mRNA synthesis [11]. New viral RNAs are transcribed and viral proteins translated, and new virions are assembled in the infected host cell [12, 13]. This cellular hijacking turns the host into a virus-manufacturing machine, shutting down host cell protein synthesis while simultaneously inhibiting infection-induced apoptosis [14, 15]. Viral nucleic acids and proteins are, are transported to the cell surface, packaged into new virionswhich bud off the plasma membrane and released via the action of viral neuraminidase (NA) enzyme. Virions can retain host cell membrane sialic acid receptors for the HA,enabling virions to clump. These large viral clusters may spread more easily through the lower respiratory tract; NA cleaves these domains, allowing virions to disperse in the distal airway [13, 16].

Alveolar Macrophages:The Primary Defensive Line and Cleanup Crew of the Lower Respiratory Tract

Lung macrophages derive from multiple lineages, and play different roles in the lung. Alveolar macrophages (AMФ), thought to derive fromprogenitors present in fetal liver [17] move to the lung interstitium during development then migrate to the air-tissue interface after birth, where they maintain and repopulate locally through life. AMФ are tightly adherent to alveolar epithelial cells. This cell-cell contact plays a key role in homeostasis and function. Under the direction of GM-CSF, these macrophages primarily remove surfactant and cellular debris, preventing Pulmonary Alveolar Proteinosis (PAP). They are also responsible for phagocytosis of foreign pathogens that have overcome or bypassed the mechanical defenses and immune defenses of the upper airway [18]. AMФ regenerate locally, as demonstrated by long-term persistence of donor macrophages in patients who undergo lung transplant [19, 20]. If there is complete loss of alveolar macrophages, as in irradiation, AMФ will regenerate from circulating monocytes [21].

By contrast, interstitial pulmonary macrophages, which make up a smaller proportion of lung macrophages derive from bone marrow precursors, and play a different role in lung immune defense: namely antigen-presentation and modulation of tissue injury [22]. A third, smaller subset of primitive macrophages, derives from yolk sac progenitors, and resides in the mesothelium adjacent to the vasculature [19, 23]. AMФ play myriad roles in the lungs, including localized homeostasis, injury repair and remodeling, and innate defense. Perhaps their most remarkable feature is the capacity toselectively regulate induction of the adaptive immune response to foreign pathogenswhich invade the terminal airways at the air-tissue interface [24]. Under homeostatic conditions AMФ, like microglia, primarily exist in a resting state controlled by interaction between the OX-2 membrane glycoprotein CD200 and the CD200 receptor through TGFβ signaling [25]. In this state, AMФ downregulate expression of macrophage CD11b, a surfaceintegrin protein critical for phagocytosis [24, 26], thus phagocytic activity is suppressed. AMФ adhere tightly to alveolar type I and type II cells. In this quiescent state macrophages induce low localized levels of αvβ6 integrinin alveolar epithelial cells, which binds to the latency associated peptide (LAP) of TGFβto form latent-TGFβ on AMФ[27]. This complex suppresses AMФproduction of proinflammatory and cellular recruiting cytokines interleukin 1beta (IL-1β), tumor necrosis factor-alpha (TNF-α), interleukin-6 (IL-6) and interleukin-8 (IL-8) [28].Suppression of phagocytosis and inhibition of inflammatory cytokine release regulates activation of the adaptive immune response and mitigates unchecked inflammation and edema that might otherwise impair alveolar gas exchange [29].

Alveolar macrophages become activated when AMФ pattern recognition receptors (PRRs) interact with pathogen-associated molecular patterns (PAMPs) in the respiratory tract [30]. Activation induces conformational changes resulting in loss of contact with alveolar epithelial cells. Interruption of cellular contact abruptly halts αvβ6 integrin binding with LAP binding and results in loss of latent-TGFβ. Without latent-TGFβ production, the suppression of AMФ phagocytic activity and cytokine production is lost, priming AMФ to produce TNF-α and IL-6, becoming cell-recruitmentand phagocytic machines [31]. Activated macrophages recruit neutrophils and inflammatory monocytes to the airways (and interstitium) which replace resident alveolar macrophages over the course of several days [32, 33]. Once activated, these macrophages have astonishing phagocytic and pro-inflammatory activity. MacLean and Kradin’s in vivo rat model demonstrated that AMФare able to engulf greater than 109 intratracheally-injectedListeria organisms before macrophage spillover occurs [34]. Fine particulate activation of AMФ induces high levels of reactive oxygen species (ROS), 8-isoprostane, and Arachidonic Acid (AA) metabolites including prostaglandin E2 (PGE2), leukotriene B4 (LTB4) [35]. Within days of insult, T lymphocytes and natural killer cells are recruited to the site of injury, where they secrete interferon gamma (IFN- γ) [36]. IFN- γ stimulates matrix metalloproteinase (MMP-9) production by AMФ, which alternatively activates latent-TGFβ on macrophages. This induces macrophages to re-adhere to epithelium, restoring suppression of inflammation and phagocytosis, and returning AMФ to their homeostatic inflammation-suppressing state [24].

The Alveolar Macrophage Arsenal against Influenza A

AMФ employ several pattern recognition receptors against influenza. The primary pathogen-associated molecular patterns generated by influenza A are cytoplasmic viral RNAs produced during cellular viral replication [37, 38]and viral M2 protein.AMФ exposed to IAV have marked upregulation of type I interferons (especially α1, 4, 7, 8, 13, 17, and 21),chemokine CXC motif ligands 5, 9, 10, and 11; fibroblast activation protein α (FAP);TNF-α, and members of the IL-1 family [39]. As AMФ endocytose virions, viral membrane degradation releases viral ssRNA into the macrophage cytoplasm. Viral ssRNA is recognized as foreign by AMФ toll-like receptor 7 (TLR7), inducing the NF-κB inflammatory signaling pathway expression. AMФ phagocytose dying IAV-infected alveolar epithelial cells and cellular debris. As cells are degraded, viral dsRNA is recognized by TLR3 [40],further inducing NF-κB inflammatory signaling, and producing type I interferons (IFN-I) [38, 41], and inducing expression of monocyte-recruiting chemokines like CCL2 [42]. In Infected AMФviral RNA released in cytoplasm is recognized by retinoic acid-inducible gene I (RIG-I), which activates mitochondrial antiviral signaling protein (MAVS) [43]. The viral matrix ion channel protein M2 induces formation of the NOD-LRR-pyrin domain-containing inflammasome 3 (NLRP3), activating caspases, and releasing IL-1β [44].

Alveolar Macrophages Play a Unique Role in the Protection Against Influenza A Infection

Cardani and Braciale et al(2017) demonstrated that AMФ are critical in the protection of type I alveolar epithelial cells (AEC-I) against lethal influenza infection [45].The authors developed a novel mouse model in which there is a cellular deficiency of mature alveolar macrophages. AMФ-deficient mice infected with sublethal doses of intranasal IAV developed acute respiratory distress syndrome and death 8-12 days post-infection. In these mice, IAV spreads unchecked throughout the lower respiratory tract, resulting in massive inflammation upon effector T-cell elimination of infected cells. They further demonstrated that intranasal administration of AMФ up to 24 hours post-infection rescued these mice from lethal infection by limiting IAV spread, illustrating the time-dependent role of AMФ in IAV respiratory infection. The authors determined that AMФ suppress autocrine production of cysteinyl leukotriene D4 in AEC-I, and that protection against IAV by AMФ could be replicated with drugs targeting the same downstream metabolites of the arachidonic acid pathway inhibiting production of cysteinyl leukotrienes. These finding demonstrated a previously unappreciated, protective role of AMФ in Influenza A infection.

References

  1. Thompson WW, Moore MR, Weintraub E, Weintraub E, Cheng PY(2009)et al. Estimating influenza-associated deaths in the United States. Am J Pub Health99:225-230. [crossref]
  2. Morbidity and Mortality Weekly Report (MMWR). (n.d.). Retrieved from https://www.cdc.gov/mmwr/preview/mmwrhtml/mm5933a1.htm
  3. Influenza (Seasonal). (n.d.). Retrieved from https://www.who.int/en/news-room/fact-sheets/detail/influenza-(seasonal)
  4. Thompson WW, Shay DK, Weintraub E, Brammer L, Cox N et al. (2003) Mortality associated with influenza and respiratory syncytial virus in the United States. JAMA289:179-186.[crossref]
  5. Thompson WW, Shay DK, Weintraub E, Brammer L, Bridges CB et al. (2004) Influenza-associated hospitalizations in the United States. JAMA292:1333-1340.
  6. Comparing deaths from pandemic and seasonal influenza. (2015, June 21). Retrieved from https://www.who.int/csr/disease/swineflu/notes/briefing_20091222/en/
  7. Shrestha SS, Swerdlow DL, Borse RH, Prabhu VS, Finelli LEstimating the burden of 2009 pandemic influenza A (H1N1) in the United States (April 2009-April 2010).Clin Infect Dis1:  75-82. [crossref]
  8. Wilkinson TM, Li CK, Chui CS, Huang AK Y, Perkins M et al. (2012). Preexisting influenza-specific CD4 T cells correlate with disease protection against influenza challenge in humans. Nature Medicine18: 274-80.[crossref]
  9. Pizzolla A, Wakim LM (2019) Memory T Cell Dynamics in the Lung during Influenza Virus Infection. The Journal of Immunology 20: 374-381. [crossref]
  10. Wang, Z et al.(2015) Recovery from severe H7N9 disease is associated with diverse response mechanisms dominated by CD8+ T cells. Nat Commun. 6:6833.
  11. Martín-Benito J, Ortín J (2013) Influenza Virus Transcription and Replication. Advances in Virus Research 87: 113-137. [crossref]
  12. Treanor JJ. (2005) In: Principles and Practice of Infectious Disease. Influenza virus2060.
  13. Rello J, Pop-Vicas A (2009) Clinical review: Primary influenza viral pneumonia. Critical Care13: 235. [crossref]
  14. Bender BS, Small PA Jr (1992) Influenza: pathogenesis and host defense. Semin Respir Infect7:38-45.[crossref]
  15. Zhirnov OP, Klenk HD (2007) Control of apoptosis in influenza virus-infected cells by up-regulation of Akt and p53 signaling. Apoptosis12: 1419-1432. [crossref]
  16. Stiver G. (2003). The treatment of influenza with antiviral drugs. CMAJ168: 49-57. [crossref]
  17. Guilliams M, Kleer ID, Henri S, Post S, Vanhoutte L (2013) Alveolar macrophages develop from fetal monocytes that differentiate into long-lived cells in the first week of life via GM-CSF. The Journal of Experimental Medicine210: 1977-1992. [crossref]
  18. Epelman S, Lavine KJ, Randolph GJ (2014) Origin and Functions of Tissue Macrophages. Immunity41: 21-35. [crossref]
  19. Tan SY, Krasnow MA (2016) Developmental origin of lung macrophage diversity.Development143: 1318-1327. [crossref]
  20. Eguíluz-Gracia I, Schultz HHL, Sikkeland LIB, Danilova E, Holm AM et al. (2016) Long-term persistence of human donor alveolar macrophages in lung transplant recipients. Thorax71: 1006-1011.[crossref]
  21. Sibille Y, Reynolds HY (1990) Macrophages and Polymorphonuclear Neutrophils in Lung Defense and Injury. American Review of Respiratory Disease141: 471-501. [crossref]
  22. Schneberger D, Aharonson-Raz K, Singh B (2010) Monocyte and macrophage heterogeneity and Toll-like receptors in the lung. Cell and Tissue Research343: 97-106. [crossref]
  23. Takahashi K, Yamamura F, Naito M (1989) Differentiation, Maturation, and Proliferation of Macrophages in the Mouse Yolk Sac: A Light-Microscopic, Enzyme-Cytochemical, Immunohistochemical, and Ultrastructural Study. Journal of Leukocyte Biology45: 87-96. [crossref]
  24. Lambrecht BN (2006) Alveolar Macrophage in the Drivers Seat. Immunity24: 366-368. [crossref]
  25. Varol C, Mildner A, Jun S (2015) Macrophages: Development and Tissue Specialization. Annual Review of Immunology33: 643-675. [crossref]
  26. Fossati-Jimack L, Ling GS, Cortini A, Szajna M, Malik TH et al. (2013) Phagocytosis Is the Main CR3-Mediated Function Affected by the Lupus-Associated Variant of CD11b in Human Myeloid Cells. PLoS One 8(2).[crossref]
  27. Katsumoto TR, Violette SM, Sheppard D (2011) Blocking TGFβvia Inhibition of theαvβ6 Integrin: A Possible Therapy for Systemic Sclerosis Interstitial Lung Disease. International Journal of Rheumatology1-7.
  28. García JE, Rodríguez FM, Cabo MR, Salgado MJ, Losada JP et al. (1999) Evaluation of Inflammatory Cytokine Secretion by Human Alveolar Macrophages. Mediators of Inflammation, 8: 43-51.[crossref]
  29. Holt PG (1978). Inhibitory Activity of Unstimulated Alveolar Macrophages on T-Lymphocyte Blastogenic Response1. American Review of Respiratory Disease118: 791-793. [crossref]
  30. Ding X, Jin S, Tong Y, Jiang X, Chen Z (2017) TLR4 signaling induces TLR3 up-regulation in alveolar macrophages during acute lung injury. Scientific Reports 7: 34278.[crossref]
  31. Persoons JH, Schornagel K, Tilders FF, Vente JD, Berkenbosch F (1996) Alveolar macrophages autoregulate IL-1 and IL-6 production by endogenous nitric oxide. American Journal of Respiratory Cell and Molecular Biology 14: 272-278.[crossref]
  32. Maus UA, Janzen S, Wall G, Srivastava M, Blackwell TS et al. (2006) Resident Alveolar Macrophages Are Replaced by Recruited Monocytes in Response to Endotoxin-Induced Lung Inflammation. American Journal of Respiratory Cell and Molecular Biology, 35: 227-235.[crossref]
  33. Rubins JB (2003) Alveolar Macrophages. American Journal of Respiratory and Critical Care Medicine167: 103-104.
  34. MacLean JA, Xia W, Pinto CE, Zhao L, Liu HW et al. (1996) Sequestration of inhaled particulate antigens by lung phagocytes: a mechanism for the effective inhibition of pulmonary cell- mediated immunity. Am J Pathol148:657-666. [crossref]
  35. Beck-Speier I, Dayal N, Karg E, Maier KL, Schumann G (2005) Oxidative stress and lipid mediators induced in alveolar macrophages by ultrafine particles. Free Radical Biology and Medicine38: 1080-1092.[crossref]
  36. Fenton MJ, Vermeulen MW, Kim S, Burdick M, Strieter RM (1997) Induction of gamma interferon production in human alveolar macrophages by Mycobacterium tuberculosis. Infection and Immunity 65: 5149-5156. [crossref]
  37. Hale BG, Albrecht RA, García-Sastre A (2010) Innate immune evasion strategies of influenza viruses. Future Microbiology 5: 23-41. [crossref]
  38. Iwasaki A, Pillai PS (2014) Innate immunity to influenza virus infection. Nature Reviews Immunology14: 315-328. [crossref]
  39. Wang J, Nikrad MP, Travanty EA, Zhou B, Phang T (2012) Innate Immune Response of Human Alveolar Macrophages during Influenza A Infection. PLoS ONE 7: 29879.[crossref]
  40. Zhang J, Miao J, Hou J, Lu C (2015) The effects of H3N2 swine influenza virus infection on TLRs and RLRs signaling pathways in porcine alveolar macrophages. Virology Journal 12: 61. [crossref]
  41. Xu Y, Liu L (2017) Curcumin alleviates macrophage activation and lung inflammation induced by influenza virus infection through inhibiting the NF-κB signaling pathway. Influenza and Other Respiratory Viruses 11: 457-463. [crossref]
  42. Saelens X (2019) The Role of Matrix Protein 2 Ectodomain in the Development of Universal Influenza Vaccines. The Journal of Infectious Diseases219: 68-74.[crossref]
  43. Wang R, Zhu Y, Lin X, Ren C, Zhao J (2019) Influenza M2 protein regulates MAVS-mediated signaling pathway through interacting with MAVS and increasing ROS production. Autophagy 15: 1163-1181. [crossref]
  44. Ichinohe T, Pang IK, Iwasaki A (2010) Influenza virus activates inflammasomes via its intracellular M2 ion channel. Nature Immunology 11: 404-410.
  45. Cardani A, Boulton A, Kim TS, Braciale TJ (2017) Alveolar Macrophages Prevent Lethal Influenza Pneumonia By Inhibiting Infection Of Type-1 Alveolar Epithelial Cells. PLOS Pathogens 13. [crossref]

COVID-19 and Type 1 diabetes in Sweden

DOI: 10.31038/EDMJ.2020424

Abstract

COVID19 is regarded as a lifethreatening infection for most people, but especially certain risk-groups including diabetes, and has therefore caused lock-down of societies which may have deleterious consequences.  Many countries have taken steps to shut down schools, companies and businesses,  and entire countries have been isolated. These drastic measures will have seriousconsequences for economy, psychosocial situation and health. There is a risk that people with other diseases like diabetes do not get ordinary adequate care.

Sweden has as the only country chosen another policy with recommended isolation of the most vulnerable populations, mainly people older than 70 years of age, and volontaryisolation of others who have eg serious lung disease och extreme obesity. Forverybody physical distancing, increased hygiene, at home when symptoms of COVID19, crowds < 50 people etc Otherwise open shops, open restaruants, open schools.

In the care of children and adolscents with Type 1 diabetes has some ordinary visits to the diabetesteam been replaced vby telemedicine. Quality has remained the same as 2018 and 2019  with national mean HbA1c 53.8 mmol/mol ( 95% CI 53-5- 54.1) during  Jan 1- April 28, 2020 and the proportion of patients with HbA1c < 57 mmol/l was  67.3% ( 95% CI  66-68.6%). Type 1 diabetes has not been a risk factor for severe COVID19, and no children with T1D are among those who have needed Intensive Care or who have died.

Keywords

COVID19, public health, economic depression, vulnerable groups, isolation

Severe Acute Respiratory Syndrome Coronavirus-2 (SARS-CoV-2), the virus that causes coronavirus disease 2019 (COVID-19), is   a major threat. Many countries have taken steps to shut down schools, companies and businesses,  and entire countries have been isolated. These drastic measures will have serious consequences for economy, psychosocial situation and health.

Sweden has as the only country chosen another policy with recommended isolation of the most vulnerable populations, mainly people older than 70 years of age, and volontary isolation of others who have eg serious lung disease och extreme obesity. Otherwise open shops, open restaurants, open nursery and primary schools. In spite of this open policy and a high rate of infected people fatality rate has  remained in the middle range of  European countries.

Diabetes is regarded as one of the risk factors for COVID19 [1-4]. This seems especially true for Type 2 diabetes connected to metabolic syndrome with hypertension, cardio-vasculare disease, and obesity According to Yang et al., among 52 critically ill patients, diabetes was present in 17% of cases [5]. According to Guan et al., among 1099 patients, diabetes was present in 16.2% of cases and hypertension was present in 23.7% of cases [6] and  according to Zhang et al., among 140 hospitalized patients, diabete was present in 12% of cases and hypertension was present in 30% of cases [7]. In children < 18 years of age, COVID19 is usually a mild disease, which very seldom leads to any dangerous clinical manistestation [8]. For children with Type 1 diabetes ( T1D) the large scale lock-down of society might have verynegative impacts. There is a risk that patients who get symptoms of diabetes do not dare to seek care which could lead to more severe clinical manifestation at onset. Another risk of severe lock-down of society is that patients with diabetes do not get ordinary adequate care.

The aim of this study was to get a picture of  the need for care at Intensive Care Unit  in Sweden until now (April 28th 2020), the proportion of patients with diabetes and need for ICU in children and adolescents.  In addition the aim was to investigate how quality of care of children and adolescents with T1D in Sweden has been influenced by the ongoing pandemic.

Material and Methods

Sweden has next to Finland the highest incidence of T1D in children and adolescents in the world [9]. All patient visits are registered in a national data base, SWEDIABKIDS [10] with information about HbA1c, blood lipids etc. In what way the coronavirus epidemic has influenced care is described after regular contacts between diabetesteams at pediatric clinics. All patients needing intensive care are registered in the Swedish Register for Intensive Care, in which also all patients needing ICU because of COVID19 are registered [11].

Results

Some diabetes clinics have continued in the same way as before. Patients have come to the hospital for ordinary visits and met members of the diabetesteams. Other diabetes teams have during the corona epidemic started to use telemedicine as a complement, meaning that patients, and for children their parents, have been contacted via telephone and/or skype, and in addition blood glucose values have been uploaded from glucose sensors and evaluated using Diasend. National HbA1c has remained stable: For children < 18 year of age mean HbA1c for all Sweden was 2018 54.7 mmol/mol (95% confidence interval 54.4-55), for 2019 53.3 ( 53-53.6) and for 2020 ( jan 1- April 28) 53.8 ( 53-5- 54.1). The proportion of patients with HbA1c < 57 mmol/l was  2018 63.4% (  95% confidence interval 62.3-64.5%), 2019 68.3% (67.2-69.4%) and for 2020 ( Jan 1- April 28) 67.3% ( 66-68.6%). Kolesterolvalues are registered between age 10-18 years and proportion < 4.5 was 2018 69% ( 66.7- 71.3), 2019 69.9% ( 67.5-72.3) and 2020 so far 71.6% (684- 74.8). Looking at any other parameter in the quality register shows the same trend: No difference between 2020 so far (April 28th) and the previous two years.

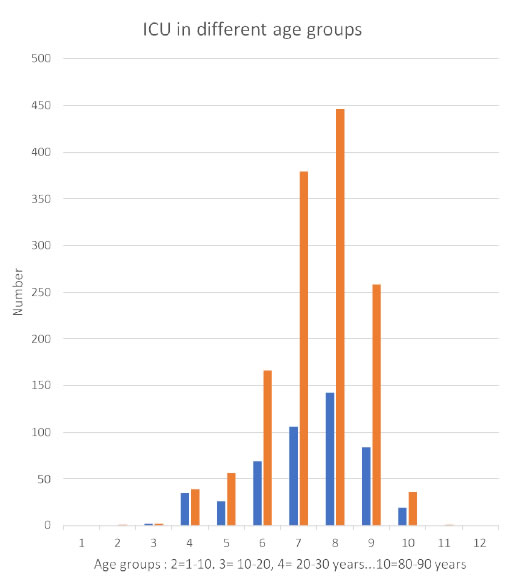
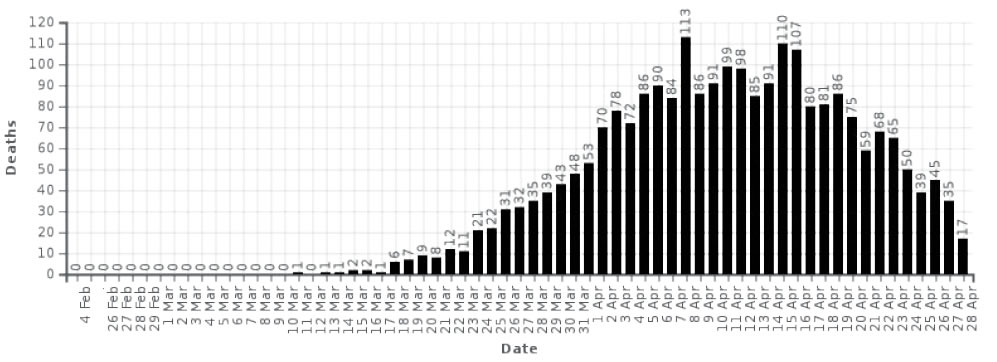
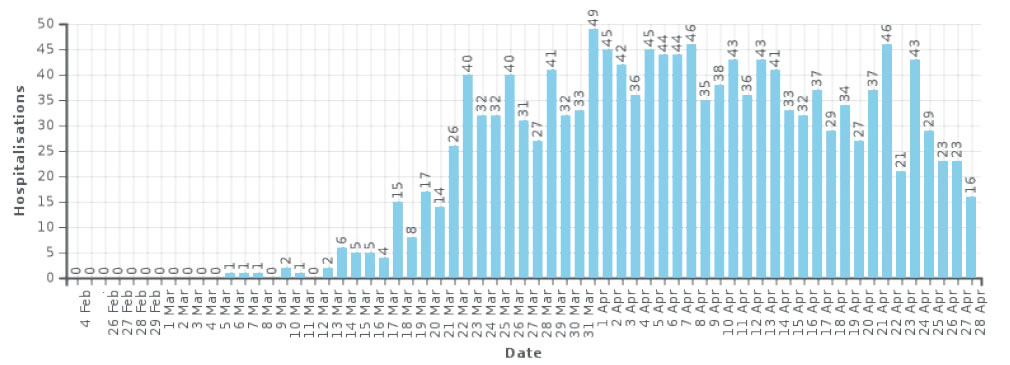
Regarding severity of COVID19  and the result of the Swedish approach in comparison with the lock-down of other European countries it is difficult to draw conclusions as the different countries have different degree proportions of  infected population. Sweden , with its rather open society has already a high proportion of infected people in the general population, with certain areas having passed 25% of the population, while some countries calculate with much lower proportions. Number of deaths in Sweden are shown in Figure 1. Mean age of  death people was 81 years. A large majority (93%) of the death persons belonged to at least one risk group, with chronic cardiovascular disease being the most prevalent, followed by diabetes, chronic respiratory disease and chronic renal failure  (Table 1). Number of patients at Intensive Care Unit (ICU) is shown in Figure 2 which illustrates that the numbers per day is kept rather stable.Fig 3 shows that males dominate and that there are almost no young individuals needing ICU except for rare cases with severe other underlying diseases, not Type 1 diabetes.

EDMJ-4-2-406-g001

Figure 1. Number of covid19-related deaths per day in Sweden

Table 1. Risk factors for patients who have needed Intensive Care becuase of COVID19 in Sweden until 28th April 2020

Riskgroup

Females (%)

(n)

Male(%)

(n)

Number of persons

>65 years of age

9,0

167

26,6

495

528

Child, several handicap

0,0

0

0,0

0

0

Pregnancy

1,2

22

0,0

0

15

Hypertension

8,4

156

28,2

524

544

Chronic heart-lung disease

5,6

104

16,0

298

340

Chronic heart disease

1,4

26

8,8

164

166

Chronic lung disease

4,5

84

8,6

159

204

Immune deficiency

1,7

31

3,0

55

76

Chronic liver/renal disease

0,7

13

2,8

52

60

Chronic liver insuff

0,2

4

0,4

7

11

Chronic renal insuff

0,5

10

2,5

46

51

Diabetes

5,4

100

18,2

339

349

Extreme obesity

2,3

43

3,8

71

96

Neuromuscular disease

0,3

5

0,7

13

17

Other disease

2,7

50

8,0

149

189

EDMJ-4-2-406-g002

Figure 2. Number of covid19-related deaths per day in Sweden

EDMJ-4-2-406-g003

Figure 3. ICU in different age groups. Blue: Females, Orange: Males.

Discussion

The Corona virus pandemic threathens ordinary health care, Many contries have  become paralysed and there is a risk that treatment of serious diseases like Type 1 diabetes in children and adolescents deteriorate, which may take long time to repair. With poor metabolic control we know that there is a increasing risk of vaculsar complications, and HbA1c has to be kept quite low to avoid long-term complications [12-14]. Sweden has a tradition of very active treatment of T1D with low mean HbA1c on a national level compared to many other contries [15]. In spite of this active treatment those who have got the diagnosis Type 1 diabetes in childhood have a much shorter expected length of life than a reference population [16]. Iy is therefore mandatory to try to keep quality of care also during the corona pandemic.

When society is closed because of the this pandemic telemedicine is an alternative to ordinary visits to the diabetes team [17]. This may become a valuable experience which in the future might improve care when used as a complement, but there will also be a risk that both diabetes teams and  patients/parents continue with this type of contacts instead of physical visits as it seems comfortable. Health care authorities may also become positive to this cheaper form av care. However, digital visits have certain advantages, but do not give the same type of contact as a physical meeting. This could lead to less motivation and deteriorating metabolic control .

During the corona pandemic Sweden has, unlike many other countries, not imposed any lockdown, with most measures being voluntary. The Swedish constitution prohibits ministerial rule and mandates that the relevant government body, in this case an expert agency, the Public Health Agency, must initiate all actions to prevent the virus, rendering the state epidemiologist a central figure in the crisis. The government can follow agency recommendations, as it has with legislation limiting freedom of assembly, temporarily banning gatherings of over 50 individuals, banning people from visiting nursing homes, as well as physically closing secondary schools and universities. Primary schools have remained open, in part to avoid healthcare workers staying home with their children.

The Public Health Agency and government have issued recommendations to: if possible, work from home; avoid unnecessary travel within the country; to engage in physical distancing; and for people above 70 to stay at home, as much as possible. Those with even minimal symptoms that could be caused by COVID-19 are recommended to stay home. The ‘karensdag‘ or initial day without paid sick-leave has been removed by the government and the length of time one can stay home with pay without a doctor’s note has been raised from 7 to 21 days.This approach has made it possible to keep the infection rate at such a level that the number of individuals needing intensive care because of COVID19 has remained at a steady state, and all the time there has been a reserve capacity of ca 20% of ICU beds.

Although a large proportion of the patients at ICU has had diabetes, most of them have had T2D, and no children or even young adults with T1D has needed ICU. T1D has not been regarded as a riskgroup in children andadolescents, and as society has been kept open the care and treatment of T1D has remained of good quality. There is so far no sign of deterioration of metabolic control, with HbA1c values which remain low compared to what is reported from other contries [15]. Ordinary visits at hospital has sometimes been replaced by virtual meetings with the use of internet. Thus, treatment of children and adolescents with Type 1 diabetes has worked well in spite of some lack of staff in the diabetes teams as some have been ill or stayed at home because of possible COVID19 symptoms, and also because some members of the diabetes teams have been ordered to be part of COVID19 teams.

The result of approach to fight the corona virus pandemic may have to differ between countries. One reason to different approaches in European countries is probably different political culture, where Sweden differs having strong independet expert authorities and a poluation with confidence in these authorities. Other countries may have more need for ”strong” political leaders making their own decisions, not always based on the basis of scientific evidence. The lock-down of societies evidently stop or at least delay the spread of corona virus, but only to some extent. The fatality rate has remained lower in some countries than in Sweden, but also much higher in several other European countries with strict lock-down. This lock-down approach  is not sustainable for an extended period due to its drastic and increasing economic and social consequences. Furthermore, even if successful, universal curfews would have to be implemented over many months or perhaps longer then so. The economic collapse with mass unemployment would have deterious effects on health including increasing mortality also in younger age groups. As an example the much less severe economic turbulence 2009 was calculated to cause the death of 260 000 individuals just by cancer [18] , and the negative effects on health in the developing countries was very large [19]. Another risk is the care of diabetes, as poor metabolic control may lead to long-term serious consequences for a large number of patients, with increased mortaliy many years later. In addition, long lock-down and economic collapse will, over time, destabilize society, not only through tremendous economic losses, but also through the risk of increasing social unrest and the psychological consequences of social isolation [20].

In conclusion, the corona pandemic may have great influence on the the care of Type 1 diabetes, which may have both actual and future effects. Type 1 diabetes is a lifethreatening disease. Too late diagnosis can lead to ketoacidosis and death. Poor metabolic control leads to serious complications and shorter life. The corona virus epidemic tends to paralyse societies and influence health care, which in the long run may ead to more serious effects on morbidity and mortality in young people than the corona virus per se. A more open approach based on isolation of vulnerable groups, mainly the elderly, but otherwise a functioning society is an alternative way to  both manage the pandemic and at the same time keep a high standard of diabetes care.

Acknowledgements

This study has been facilitated by the contacts created by SWEDIABNET ( The Swedish Pediatric Diabetes Trial network) supported by Vinnova and Barndiabetesfonden ( the Swedish Child Diabetes Foundation)

Disclosure

Johnny Ludvigsson has anything to disclose, and no conflict of interest.

References

  1. Clerkin KJ, Fried JA, Raikhelkar J, Sayer G, Griffin JM, et al. (2020) Coronavirus Disease 2019 (COVID-19) and Cardiovascular Disease. Circulation. [Crossref]
  2. Zhou F, Yu T, Du R, Fan G, Liu Y, et al. (2020) Clinical course and risk factors for mortality of adult inpatients with COVID-19 in Wuhan, China: a retrospective cohort study. The Lancet. [Crossref]
  3. Driggin E, Madhavan MV, Bikdeli B, Chuich T, Laracy J, et al. (2020) Cardiovascular Considerations for Patients, Health Care Workers, and Health Systems During the Coronavirus Disease 2019 (COVID-19) Pandemic. Journal of the American College of Cardiology27204. [Crossref]
  4. [The epidemiological characteristics of an outbreak of 2019 novel coronavirus diseases (COVID-19) in China] (2020) Zhonghualiuxingbingxuezazhi = Zhonghualiuxingbingxuezazhi 41: 145-51. [Crossref]
  5. Yang X, Yu Y, Xu J, Shu H, Xia J, et al. (2020) Clinical course and outcomes of critically ill patients with SARS-CoV-2 pneumonia in Wuhan, China: a single-centered, retrospective, observational study. [Published online ahead of print. Lancet Respir Med 8: 475-481. [Crossref]
  6. Guan WJ, Ni ZY, Hu Y, Liang WH, Ou CQ, et al.(2020) Clinical characteristics of coronavirus disease 2019 in China. [Published online ahead of print (February 28, 2020)]. N Engl J Med 80: 656-665. [Crossref]
  7. Zhang JJ, Dong X, Cao YY, Yuan YD, Yang YB, et al. (2020) Clinical characteristics of 140 patients infected with SARS-CoV-2 in Wuhan, China. [Published online ahead of print (February 19, 2020)]. Allergy. [Crossref]
  8. Ludvigsson JF (2020) Systematic review of COVID-19 in children show milder cases and a better prognosis than adults. ActaPaediatrica 109: 1088-1095. [Crossref]
  9. Ludvigsson J (2017) Increasing Incidence but Decreasing Awareness of Type 1 Diabetes in Sweden. Diabetes Care 40: e143-e144. [Crossref]
  10. Hanberger L, Samuelsson U, Lindblad B, Ludvigsson J, Swedish Childhood Diabetes Registry SWEDIABKIDS (2008) A1C in children and adolescents with diabetes in relation to certain clinical parameters: the Swedish Childhood Diabetes Registry SWEDIABKIDS. Diabetes Care 31: 927-929. [Crossref]
  11. The Swedish Intensive Care Registry (SIR) https://www.icuregswe.org/
  12. Nordwall M, Abrahamsson M, Dhir M, Fredrikson M, Ludvigsson J, et al. (2015) Impact of HbA1c, followed from onset of type 1 diabetes, on the development of severe retinopathy and nephropathy: the VISS Study (Vascular Diabetic Complications in Southeast Sweden). Diabetes Care 38: 308-315. [Crossref]
  13. Nordwall M, Fredriksson M, Ludvigsson J, Arnqvist HJ (2019) Impact of Age of Onset, Puberty, and Glycemic Control Followed From Diagnosis on Incidence of Retinopathy in Type 1 Diabetes: The VISS Study. Diabetes Care 42: 609-616. [Crossref]
  14. Lind M, Pivodic A, Svensson AM, Ólafsdóttir AF, Wedel H, et al. (2019) HbA1c level as a risk factor for retinopathy and nephropathy in children and adults with type 1 diabetes: Swedish population based cohort study. BMJ 366: l4894. [Crossref]
  15. Anderzén J, Hermann JM, Samuelsson U, Charalampopoulos D, Svensson J, et al. (2020) International benchmarking in type 1 diabetes: Large difference in childhood HbA1c between eight high-income countries but similar rise during adolescence-A quality registry study. Pediatr Diabetes 21: 621-627. [Crossref]
  16. Rawshani A, Sattar N, Franzén S, Rawshani A, Hattersley AT, et al. (2018) Excess mortality and cardiovascular disease in young adults with type 1 diabetes in relation to age at onset: a nationwide, register-based cohort study. Lancet 392: 477-486. [Crossref]
  17. Garg SK, Rodbard D, Hirsch IB, Forlenza GP (2020) Managing New-Onset Type 1 Diabetes During the COVID-19 Pandemic: Challenges and Opportunities. Diabetes TechnolTher22: 431-439. [Crossref]
  18. Maruthappu M, Watkins J, Noor AM, Williams C, Ali R, et al. (2016) Economic downturns, universal health coverage, and cancer mortality in high-income and middle-income countries, 1990-2010: a longitudinal analysis. Lancet 388:684-695. [Crossref]
  19. Friedman J, Schady N (2013) How many infants likely died in Africa as a result of the 2008-2009 global financial crisis? Health Economics 22:611-622.
  20. Armitage R, Nellums LB (2020) COVID-19 and the consequences of isolating the elderly. The Lancet Public Health 5: e256. [Crossref]

“Mastering” the Laboratory Sciences in Public Health Education

DOI: 10.31038/PEP.2020113

Abstract

Public health laboratories provide critical surveillance data to improve community health and environmental quality. Yet, the nation is facing a large shortfall in laboratory workers and leaders due to the number of those projected to retire and the increasing complexity of analyses and regulatory requirements. To help meet this demand, the Public Health Laboratory Sciences Master’s degree program at Southern Illinois University School of Medicine combines graduate-level classroom instruction with extensive research experience in a public health laboratory. Developed as a collaborative effort with the Illinois Department of Public Health, this graduate program is designed to produce scientists with applied  training  in  clinical,  environmental, and molecular testing protocols. The diverse training environment allows for immediate employment of graduates who require only minimal additional “on the job” training. This article will highlight the significance, curriculum, training, and success of this unique master’s degree dedicated to training the next generation of public health laboratory employees and leaders.

Keywords

Public Health, Laboratory, Education

Introduction

As the U.S. population continues to expand, so too has the demand for a highly-skilled public health workforce. However, the public health community faces current and future challenges to ensure that public health services are sustained for future generations. Many of these challenges have been discussed in length by the American Public Health Association (APHA) and include: i) budget cuts and lack of appropriate funds to support public health services, ii) significant reduction in the public health workforce (up to 50% was expected by 2012) due to retirement, iii) decrease in well qualified entry-level public health professionals to replace retirees and iv) increasing demand for more technical and analytical experts for current and future testing methodologies [1]. Despite a shrinking budget and workforce, public health agencies have been challenged to provide the same level and quality of services. The ideal ratio of public health professionals is based on the 1980 model of 220 public health professionals for every 100 000 U.S. citizens [2]. While the U.S. population has increased 27% since 1980, the public health workforce has decreased by around 55 000 to reflect today’s working capacity of ~500 000 employees [3-5]. In order to achieve the appropriate number of public health professionals for current U.S populations, the workforce would need to add ~750 000 public health professionals over the next 8 to 10 years. To address this demand, Southern Illinois University School of Medicine (SIU-SOM) in collaboration with the Illinois Department of Public Health (IDPH) developed a unique academic and laboratory training program to reinforce the ranks of the public health workforce.

Present and future deficiencies of the public health workforce

As defined by the Institute of Medicine, a public health professional is “a  person educated in public health or a related discipline who is employed to improve health through a population focus” [6]. Of the collective public health professionals about 16 000 (3.1%) are laboratorians. However, only 20% of individuals received formal training within their assigned laboratory occupation [7]. In addition, the number of personnel with advanced graduate degrees needed to successfully implement, conduct, and troubleshoot protocols performed within a modern laboratory are inadequate with only 33% of laboratorians holding a Master of Public Health (MPH) or equivalent advanced degree [8]. Classic examples outlining the responsibilities of properly educated and trained public health laboratory professionals include the identification of infectious pathogens during epidemic and pandemic outbreaks, newborn screening for heritable genetic diseases, environmental testing in support of the Safe Drinking Water Act, and screening of clinical samples to identify sexually transmitted diseases. In addition to an increasing U.S. population, modern medicine and preventative measures continue to decrease morbidity and mortality of acute and chronic disease which increases life expectancy. Despite advancements  in  the  quality  and  longevity  of  life,  resurgence of infectious pathogens leading to epidemic  and  pandemic  events  has resulted in increased demands on public health professionals. This demand requires rapid identification and response to limit the dissemination of these pathogens. One of the greatest problems facing today’s public health infrastructure is the greying workforce. In Illinois, for example, the average age of a State Health Agency worker was 48 years in 2007. As a result, ~50% of those workers were eligible for retirement in 2012 [4, 5, 9]. Nationwide, the average number of public health workers eligible for retirement in 2012 was estimated to be 150 000 reducing the current workforce of 500 000 employees by 30% [4, 5, 9]. As a result, laboratory workers, epidemiologists, and environmental health workers will become burdened by an increased work-load if the workforce cannot be replenished with properly trained personnel.

In 2001, the Center for Disease Control (CDC) put forth recommendations to the Appropriations Committee of the U.S. Senate outlining specific goals that needed to be attained by the  year 2010 to ensure a strong public health workforce with specific emphasis placed on epidemiologists, environmental health specialists, and laboratorians [7]. Despite these suggestions, the U.S. public health workforce has continued to decline as a consequence of: i) aging and retirement of public health workers, ii) workers opting into early retirement as a result of pension reform, and iii) general lack  of knowledge or interest of persons to pursue public health related employment. In addition, cutbacks, layoffs, and hiring freezes brought on by budget cuts to state and local public health departments have resulted in a smaller public health workforce struggling to serve an ever increasing population with rapidly evolving technically advanced procedures.

Development of the graduate degree in Public Health Laboratory Sciences (PHLS)

The CDC also recommended that by 2010, each public health laboratory have access to rapid and high quality testing procedures and the utilization of standards for specimen collection, transport, testing, and reporting.7 To meet these demands, modern public health laboratories are relinquishing traditional testing strategies in favor of molecular methods which can provide definitive results in a matter of  hours  instead  of days to weeks after receiving a clinical sample. The increasing demand for well-educated and trained professionals underscored the need to establish an advanced degree program.  In August  of 2005, SIU-SOM  in partnership with IDPH implemented the Public Health Laboratory Sciences (PHLS) degree program to address this need. The program is designed to expose students to advanced education in the basic sciences and public health. Didactic coursework is augmented with hands-on training in the IDPH laboratories where students receive bench-top experience with clinical, environmental, and biothreat samples during routine, epidemic, and pandemic events. In addition, PHLS graduate students meet Clinical Laboratory Improvement Amendments (CLIA) certification requirements. This in-depth training combined with a well- rounded academic curriculum ensures development of highly-qualified laboratorians who are well-versed in advanced biological disciplines. The academic and laboratory training experiences of the PHLS program are detailed below and summarized in Figure 1.

PEP-1-1-105-g001

Figure 1. The PHLS curriculum.
Schematic demonstrating the academic and laboratory training requirements to complete the non-thesis MS degree in PHLS. Total academic credits equal 46 hours (28 of didactic courses and 18 of laboratory training). Core science courses include Biochemistry I, Biochemistry II, Immunology, Bacterial Genetics and Student Seminar,and Public health program-specific courses include Introduction to the Public Health, Public Health Laboratory Disciplines, Environmental Chemistry, Clinical Microbiology and Research Methods. Hands-on training is received in the laboratory (Public Health Laboratory Training) throughout the program with rotations in the Carbondale and Chicago laboratories completed in the summer term between year 1 and year 2.

PHLS Curriculum

This non-thesis Master’s degree requires completion of 46 credit hours (28 credits of academic courses and 18 credits of laboratory- specific training) over 24 months. Each class consists of 3 to 4 students with undergraduate degrees in the physical, biological and clinical sciences including biology, chemistry, microbiology, medical technology, or public health and others. Core science courses are identical to those taken by all Master’s  and PhD graduate students  in the Microbiology, Biochemistry and Molecular Biology (MBMB) graduate program: Biochemistry I, Biochemistry II, Immunology, Bacterial Genetics and Student Seminar. The curriculum also includes program-specific courses: Introduction to the Public Health, Public Health Laboratory Disciplines, Environmental Chemistry, Clinical Microbiology and Research Methods. The majority of the coursework is completed during the first academic year. Hands-on training is completed in the public health laboratory where students are trained in diagnostic microbiology, environmental microbiology,  blood  lead analysis, and molecular diagnostics. By the end of the first year, students have completed 20 academic credits and have accumulated nearly 500 hours of hands-on training in the laboratory. During the summer term (May through August), students do not take academic courses and instead devote all of their time to laboratory training (~35 hours per week). This period focuses on practical application  of knowledge gained during the first year to support day-to-day laboratory work. Students also have opportunities to participate in field work with local health department staff. Activities include animal control, family case management, food sanitation, immunization clinics and senior home visits. This exposes them to the wider practices of public health. In addition, students travel to IDPH labs in Chicago and Carbondale to rotate through testing sections specific to those locations, such as newborn screening and sexually transmitted disease testing, respectively. These opportunities increase exposure to advanced testing procedures and personnel at these locations. During the second year, students complete the remaining academic requirements totaling 11 credit hours. Students spend substantially more time in the laboratory (25 hours per week versus 10 to 15 in the first year) where they further refine and expand their practical skill sets. By the end of the program, students have attained training in clinical, environmental and molecular testing protocols for infectious, sexually-transmitted and heritable disease as well as food, milk, water, blood lead testing, and the identification of bio-threats as part of    the Illinois Public Health Preparedness Center in collaboration with local and federal law enforcement agencies using state-of-the-art equipment (Table 1).

PEP-1-1-105-t001

Laboratory Training Opportunities and Objectives

Students have the opportunity to train in all three of the IDPH laboratories based in Springfield, Carbondale, and Chicago. These labs perform differing tests to support public health epidemiology programs by providing surveillance data with the goal of improving public health and environmental quality throughout Illinois. Each laboratory participates in numerous certification programs to ensure the accuracy of testing data. All three laboratories have a CLIA certificate and Select Agent certificate to ensure quality clinical laboratory testing and biological threat agent testing, respectively. The Chicago laboratory is accredited by the American Industrial Hygiene Association Laboratory Accreditation Programs (AIHA-LAP, LLC) to test paint, soil, dust wipes, and air filters to determine the level of lead in these samples. The Carbondale and Chicago laboratories are certified water microbiology and dairy labs. The Springfield laboratory is accredited by the U.S. Food and Drug Administration (FDA) and U.S. Environmental Protection Agency (EPA) for dairy and drinking water testing, respectively. As a result, students have an opportunity to gain broader knowledge in all medical and scientific disciplines by working with personnel who strive to ensure advanced laboratory capabilities at all three locations. The majority of the tenure is spent at the Springfield location. The IDPH Division of Laboratories in Springfield is composed of three primary sections: environmental microbiology, diagnostics/clinical microbiology, and blood lead screening. Students gain experience in laboratory testing procedures and become proficient using procedures and equipment which transcend many fields after graduation. In the environmental microbiology section, students learn procedures for water and dairy testing. Water testing  is performed for nitrate and nitrite  detection,  fluoride  detection, and pH determination. Dairy testing is performed for laboratory grade testing and for detection of elevated coliform counts. Students also have the opportunity to participate in the FDA milk splits proficiency testing program in accordance to the requirements of the Grade A Pasteurized Milk Ordinance. By successfully completing the proficiency test, students become certified milk analysts. In the diagnostics/clinical microbiology section, students become proficient in quantitative polymerase chain reaction (qPCR) and pulsed-field gel electrophoresis (PFGE). These methods are used to detect and characterize infections caused by typical enteric bacteria such as Salmonella, Shigella, and Escherichia coli. The experience gained with qPCR techniques extends to the detection of Mumps, Measles, Norovirus, and Influenza. Direct Fluorescent Antibody (DFA) testing procedures are learned for detection of Rabies virus. In the blood lead section, students learn to process samples and utilize procedures and equipment, such as inductively coupled plasma mass spectrometry (ICP-MS), to test for elevated lead levels in venous blood samples. In addition to these advanced techniques and skills, students learn and are expected to follow quality assurance and quality control procedures for record keeping, equipment maintenance, experimental and environmental controls in each laboratory section. Once appropriately trained, PHLS students have been utilized to enhance the effectiveness of the laboratories in performing public health services. The advanced biological, biochemical, and molecular knowledge of these students can be called upon to troubleshoot, identify, and establish new testing capabilities within IDPH laboratories in support of enhanced measures to identify infectious pathogens. For example, in 2009 the IDPH laboratory in Carbondale, IL used the molecular expertise of   a PHLS graduate student to develop a biosafety level (BSL)2/BSL3 molecular testing facility for the identification of pandemic Influenza, Norovirus, HIV, Shiga-toxin (STX)-producing microbial pathogens, and bio-terror select agents.

Comparison of the PHLS degree to traditional MPH programs

To illustrate the novelty of the PHLS program, we compared our graduate curriculum against the average of five well-established and accredited MPH graduate programs. This comparison was performed by dividing the core curriculum into three categories: i) biological science courses (Fig. 2A, B; blue), ii) didactic public health associated courses (Fig. 2A, B; grey), and iii) laboratory training and application and/or equivalent internship experience (Fig. 2A, B; orange). The model was applied to determine the relative emphasis (percentage) that each program dedicated to establishing an academic curriculum which would best meet the demands necessary to increase laboratory scientists in the public health workforce. Despite the presence of    all three core components in both the PHLS and MPH programs,   the distributions of those components vary  widely.  For  example, the primary focus of MPH academic programs is on public health administration and policy with courses such as: Justice and Resource Allocation, and Ethical Basis of the Practice of Public Health making up 68% of the curriculum (Fig. 2A) [10]. The remaining academic instruction covers the biological sciences (28%). Practical experience acquired in the laboratory or through an internship makes up less than 5% of MPH degree requirements (Fig. 2A). In contrast, the PHLS program provides a more even distribution among public health policy, biological sciences, and laboratory experience (Fig. 2B). Thus, PHLS graduates are well-versed in public health policy, trained to perform clinical and environmental testing, and knowledgeable of core biological sciences used to design, implement, an troubleshoot diagnostic assays utilized by modern public health facilities.

PEP-1-1-105-g002

Figure 2. Comparison of academic curriculum for a traditional MPH versus the PHLS program.
Core didactic courses in public health (grey), biological sciences (blue), and laboratory training or equivalent internship experience (orange) were identified within (A) the average of five well-established and accredited MPH programs, and compared against the same criteria for the (B) SIU-SOM PHLS program. Each colored section was defined as the cumulative percentage (%) of courses offered within each respective area as described in the course description from each institution [10-12].

Current success of the PHLS program

Despite the vacancies of available public health professionals, recent reports have indicated that there remains a lack of enthusiasm and interest in public health careers [4]. This may be due, in part, to a lack of available nationwide public health programs designed to motivate and instruct public health professionals to pursue careers in modern public health facilities. This may be an issue for some traditional MPH programs. MPH programs frequently lack clear direction for graduate students other than to encourage the graduates to pursue a position as a public health department administrator, public health program manager, or similarly titled  position.  This  problem  is  further  compounded by the fact that there is a nebulous boundary which separates public health occupations from similar health care occupations. However, public health disciplines are very focused on community health and population health at the local and national level, whereas health care occupations focus on the health of the individual. The PHLS program is designed to train graduate students in the varied aspects of public health policies and procedures while emphasizing and focusing on the accrual of in-depth scientific knowledge and laboratory training to be able to effectively analyze and diagnose threats to the health of the community/ population. To date, 22 students have completed the PHLS program. Over 50% of these students (14 of 22) were born and raised in Illinois with the remainder coming from the continental US or abroad. The majority of students have been females (18 of 22). The overall success of any program can be measured in terms of occupational  placement of students within the respective program following graduation. By these criteria, we evaluated the percentage of students that successfully completed the PHLS program by the occupational career fields in which they are currently employed. Fifteen (68%) are currently employed in clinical laboratory scientist positions in public health occupations, six (27%) have completed or are pursuing doctoral level education within public health related fields, and one (5%) is employed by a biotechnology company (Fig. 3). Thus, 100% of all PHLS graduates continue to use the knowledge and technical skills obtained through the PHLS program in their chosen careers.

Conclusion

The demand for well-trained and competent public health professionals will continue to increase to meet the demand of the ever-increasing U.S population and sophistication of public health laboratory testing methods. In collaboration with IDPH, the SIU- SOM has instituted a curriculum in Public Health Laboratory Sciences designed to instruct graduate students in public health and policy  and the biological sciences as well as technical laboratory training. We believe this combination of education and technical experience  is essential to produce public health professionals who are competent to conduct clinical testing, train personnel, and manage core public health facilities. We have found this program to be feasible utilizing existing resources and funding. In addition, the majority of core didactic course for the PHLS students are taken in conjunction with other MS and PhD graduate students in the MBMB program. This arrangement facilitates accrual of advanced analytical thinking skills and exposes PHLS students to unique ways of approaching problems. The benefits to the host laboratory are immediate. By the end of year 1, students are exposed to the clinical and environmental analyses performed in the public health laboratory. This is amazingly practical, as the scientific knowledge gleaned from the concurrent science courses is immediately integrated into the laboratory analyses that the students are required to experience “at the bench”. The contribution to the public health laboratory infrastructure is practically immediate, as the staff of the host laboratory orient and train the students to aid in daily conduct of tests. This has very practical utilization as the frequent spikes in test volumes (e.g. foodborne outbreak investigation, suspect bioterrorism samples, etc.) allow the staff to utilize the students-in- training to augment the laboratory’s capacity. Of perhaps far greater significance, this unique “labor pool” can be accessed without resorting to the very convoluted and extended timeframe hiring process this   is characteristic of most government public servant positions. We believe this program is an important and unique resource to meet public health workforce shortages. Furthermore, advances in the complexity of analyses and expanding regulatory requirements dictate that every discipline practiced in public health will demand a greater in-depth knowledge of that discipline at the outset. The end result is the development of a highly educated and experienced individual who can immediately assume lead worker duties in a modern public health laboratory, with no or very little additional laboratory training.

Implications for Policy & Practice

• The PHLS program addresses many of the challenges identified by the Public Health Workforce Interests and Needs Survey (PH WINS).

• The PHLS program provides a well-balanced curriculum in public health and policy and the biological sciences as well as technical laboratory training.

• PHLS students contribute to the public health laboratory infrastructure.

• The host public health laboratory receives immediate benefit as scientific knowledge gained from science courses is immediately integrated into the laboratory analyses that the students are required to experience “at the bench”.

• Creates a unique “labor pool” which can be accessed immediately during outbreaks or spikes in test volumes.

References

  1. Institute of Medicine (2003) Who Will Keep the Public Healthy? Educating Public Health Professionals for the 21st Century.
  2. State Public Health Employee Worker Shortage Report: A Civil Service Recruitment and Retention Crisis. Association of State and Territorial Health Officials. Published 2004. Accessed 31 March 2017.
  3. Draper DA, Hurley RE, Lauer JR (2008) Public health workforce shortages imperil nation’s health. Res Brief 4: 1-8. [crossref]
  4. Master of Public Health Program – Curriculum Guide (2012) In: Health HSoP. Boston.
  5. Master of Public Health Program – Curriculum Guide (2015) In: Health JHBSoP. Baltimore.
  6. Morrissey T (2006) The Affordable Care Act’s Public Health Workforce Provisions: Opportunities and Challenges. Washington DC.
  7. Perlino C (2006) The Public Health Workforce Shortage: Left Unchecked, Will We Be Protected? Washington, DC.
  8. Public Health Infrastructure. Centers for Disease Control and Prevention. https://www.cdc.gov/media/pressrel/fs020514.htm. Published 2001. Accessed March 30, 2017.
  9. Rosenstock L, Silver GB, Helsing K, Evashwick C, Katz R et al. (2008) On Linkages: Confronting the Public Health Workforce Crisis: ASPH Statement on the Public Health Workforce. Public Health Reports 123: 395-398. [crossref]
  10. Willard R. Local Health Department Job Losses and Program Cuts. National Association of County and City Health Officials. http://archived. naccho.org/topics/infrastructure/lhdbudget/upload/Job-Losses-and-Program- Cuts-5-10.pdf. Published May 2010. Accessed March 31, 2017.
  11. Toossi M (.2013) Labor force projections to 2022: the labor force participation rate continues to fall. Monthly Labor Review.
  12. 2-Year Master of Public Health (MPH) in Environmental Health Sciences (2015) In: University of California BSoPH. Baltimore.

Utility of Video Electroencephalography Monitoring for Diagnosis of Epilepsy and Nonepileptic Paroxysmal Events

DOI: 10.31038/AWHC.2020333

Abstract

Objective: Video electroencephalography monitoring (VEM) is an important tool for the diagnosis and classification of seizures and for the presurgical evaluation of patients with drug-resistant epilepsy. The aim of this study was to assess the utility of VEM in patients referred for differential diagnoses (epileptic events versus nonepileptic episodes) and/or improving diagnosis accuracy in epilepsy.

Methods: Three hundred and eight VEM studies were analyzed retrospectively over a period of 3 years. Only studies obtaining seizure classification and diagnostic clarification to determine the nature of paroxysmal events were included (n = 125). The clinical diagnoses before and after VEM were compared. VEM was useful if it changed the diagnosis and/or therapy or if it answered the clinical question raised by the referring physician.

Results: One hundred twenty-five patients were included (64% women) with a mean age of 43.0 ± 1.6. During VEM, 61 patients had typical clinical events; there were 21 seizures, 25 physiological events, and 18 psychogenic nonepileptic seizures (PNES). In the PNES group, we found that women and younger patients were more frequent. Epileptic patients had a shorter evolution time, and the physiological events group had an older age at event onset compared to the epilepsy group. The provisional diagnosis changed in 35% of the cases after VEM. The diagnostic usefulness of VEM was 89%. After VEM, treatment changed in 50% of patients.

Significance: VEM is an essential tool to differentiate seizure from nonepileptic paroxysmal events. It is imperative to achieve an accurate diagnosis to determine the most suitable therapeutic approach.

Key Point Box

• Misdiagnosis of nonepileptic paroxysmal events and epilepsy represents a problem with important therapeutic and social repercussions.

• Inpatient VEM has been demonstrated to be a useful tool for the diagnosis and classification of seizure events.

• VEM achieved an accurate diagnosis and accomplished the most suitable therapeutic approach in epileptic and nonepileptic patients.

Keywords

epileptic seizures, nonepileptic paroxysmal events, physiological events, psychogenic nonepileptic seizure, syncope

Introduction

An Epileptic Seizure (ES) is defined as a transient occurrence of behavioral alterations produced by abnormal, excessive, and hypersynchronous neuronal activity in the brain [1, 2]. However, since the symptoms are diverse, diagnosis of ES may be challenging given the differential diagnoses [3, 4]. Nonepileptic paroxysmal events of physiological and psychological origin, such as syncope, sleep disorders, migraines or psychogenic nonepileptic seizures (PNES), can also manifest as behavioral disturbance events or transient alterations of consciousness [3]. It is extremely important to achieve an accurate diagnosis in epilepsy, given its morbidity associated with undiagnosed and untreated seizures [2]. In the same way, misdiagnosed epilepsy can result in side effects from antiepileptic drugs, economic costs, and impact on quality of life.

Video electroencephalography monitoring (VEM) is the most useful diagnostic tool for the classification of ES, as well as being the current gold standard for distinguishing epileptic versus nonepileptic paroxysmal events [5]. The Internal League Against Epilepsy (ILAE) recommends VEM for i) differential diagnosis for epileptic seizures, ii) characterization and classification of seizures types and epilepsy syndrome, iii) quantifying seizures, iv) intensive care unit monitoring, and v) presurgical evaluation of drug-resistant epilepsy [6].

Long-term VEM (1–6 days) has been shown to improve diagnostic accuracy compared with standard EEG (20–30 minutes) [7]. VEM not only obtains more complete information regarding the EEG background and characterization of the interictal activity but also analyzes the clinical semiology with the electrophysiological phenomenology during clinical events [8]. Moreover, during preoperative evaluation of drug-resistant temporal lobe epilepsy patients, it has been shown that no other routine tests, including imaging studies, were as reliable as VEM in identifying and characterizing epilepsy seizures and defining the epileptogenic zone in patients evaluated for epilepsy surgery [9]. Nonetheless, VEM is an expensive tool that needs sophisticated equipment, highly qualified staff, and admission of patients to the hospital during variable periods.

A highly variable range of diagnostic usefulness for VEM has been described (19%–75%), which depends first on how utility is defined and on the selection of the patients evaluated [10]. However, another factor is also involved in this issue. There is no standard protocol for the duration of VEM. In fact, some units carry out 12-hour studies, while in other units, monitoring lasts several days.

In our unit, we systematically used two protocols of VEM: 24-hour VEM for the differential diagnosis and follow-up of epilepsy patients and a longer-lasting VEM (2–10 days) for the presurgical evaluation of drug-resistant epilepsy.

The purpose of this study was to assess the diagnostic utility of VEM for the classification and differential diagnosis of epilepsy and nonepileptic paroxysmal events in a national reference unit for refractory epilepsy. We define a VEM study as useful when either a tentative diagnosis was changed or confirmed or when patient management was modified as a result of the information obtained from VEM.

Methods

Patients

We retrospectively analyzed the clinical chart and VEM records of consecutive patients who underwent inpatient VEM at the video electroencephalography (VEEG) unit of the National Reference Unit for Refractory Epilepsy at Hospital Universitario de la Princesa, over a period of three years (n = 308). Only those patients who had been referred to i) differentiate between epileptic and nonepileptic events and/or ii) to classify the kind of seizure and epilepsy syndrome type were selected. Finally, the number of patients fulfilling these conditions was 125. Those patients with known medically refractory epilepsy undergoing presurgical evaluation were excluded.

Clinical charts, including age, sex, age at symptomatology onset, duration, provisional clinical diagnosis, antiepileptic drugs (AED), brain magnetic resonance imaging (MRI), and ambulatory standard EEG, were revised. In cases where patients had undergone an ambulatory EEG and neuroimaging at institutions other than our hospital, only the reports were available, and the studies themselves were not reviewed.

The provisional diagnosis of the physician who referred the patient to the VEEG unit (pre-VEM diagnosis) was compared with the final clinical diagnostic (post-VEM diagnosis), and both diagnoses were classified into the following categories: i) epilepsy, ii) PNES, and iii) nonepileptic paroxysmal events of physiological origin, including a cardiogenic or metabolic cause or event-related to other neurological diseases (e.g., sleep disorders, movement disorders, migraine, or cognitive disturbance).

Video electroencephalography monitoring

VEM was performed using a 64-channel digital VEEG system (EMU64, NeuroWorks. XLTEK®, Oakville, Canada) with 19 scalp stainless steel electrodes fixed with collodion according to the 10–20 international system; electrocardiography (ECG) and simultaneous video images were recorded continuously for 24 h. If needed, one or two electromyography channels (EMG) were added, too. Recordings were performed at a 512 Hz sampling rate with a 0.5–70 Hz bandwidth, 50 Hz notch on. EMG bandwidth was 1.5–200 Hz, notch on, and ECG bandwidth was 1.5–30 Hz, notch on. Impedances for EEG were under 25 kW.

Patients had partial sleep deprivation, but medication withdrawal was not undertaken. If considered, induction techniques involving suggestion and administration of placebo were used in some patients [4].

To avoid biases in the assessment of VEM utility, we considered three periods chronologically: i) t1defining the putative diagnosis and treatment considered as the basal line usually performed 1–2 months before, ii) VEM (performed at tVEM), and finally, iii) the period t2that includes the first clinical interview after VEM (usually 1–2 months later). No other complementary studies were undertaken between t1 and t2; thus, we were sure that changes either in diagnosis or treatment would be due to the VEM result.

The patient’s function state (p) is defined at time t, as a two-variables function, i.e., treatment (T) and diagnosis (d), stated as pt(T,d). In this definition, t is not a variable but a parameter. Therefore, we have different possibilities of changes at consecutive periods (Figure 1), depending on either T or d or both changing between t1 and t2. VEM was considered useful when variables T, d or both changed. However, in some cases where both T and d remained the same, the study can still be considered useful if it confirms a previously suspected but not well-established diagnosis, e.g., suspected PNES with no pharmacological treatment where, after VEM, a positive result confirms PNES. In such cases, the utility derived from confirmation is written as p1(T1,d1) → p2,conf (T1,d1). In other words, only when the VEM result did not change any variable or confirm a suspected previous diagnosis (p2,not (T1,d1)) was it considered to be not useful.

AWHC-3-3-315-g001

Figure 1. Scheme used to evaluate the utility of VEM.

Additional, clinical demographics and VEM bioelectrical features for each of the three clinical diagnostic categories were also analyzed.

Statistical analysis

Statistical comparisons between groups were performed using Student’s t-test or ANOVA for data with normal distribution. Normality was evaluated using the Kolmogorov–Smirnov test. The Mann–Whitney rank sum test or ANOVA on ranks was used when normality failed. In the last case, Dunn’s method was used for all pairwise post hoc comparisons of mean ranks of treatment groups. Chi-square test (χ2) was used to assess the differences between groups of patients.

The SigmaStat 3.5 software (SigmaStat, Point Richmond, CA, USA) was used for statistical analysis. The significance level was set at p < 0.05. The results are presented as the mean ± SEM, except where otherwise indicated.

Results

Patients

A total of 125 patients were included (64% women) with a mean age of 43.0 ± 1.6 years. The mean disease duration was 8.8 ± 1.0 years. A total of 82 (66%) patients received treatment with AED at the time of the study, and the mean number of AED was 1.3 ± 0.1. Brain magnetic resonance imaging (MRI) was available in 113 patients, with abnormal findings in 57 (50%) patients; of these, only 8 patients (14%) had epileptogenic lesions. Standard EEG was performed in 92 patients, 37% of which displayed epileptiform activity, 24% was reported as abnormal nonepileptic activity, and 39% was normal.

Regarding the provisional clinical diagnosis, ES was suspected in 67 patients (54%). Nonepileptic events of physiological origin were suspected in 45 patients, accounting for syncope (30 patients), movement disorders (7 patients), cognitive impairment (3 patients), sleep disorders (1 patient), and others (4 patient). A diagnosis of PNES was suspected in 10 patients, and in three of them, it was considered that it could also coincide with the diagnosis of epilepsy.

Video electroencephalography monitoring

During VEM, typical events, described as similar to accustomed, occurred in 61 patients (49%). Of these, 21 patients (36%) had ES, 25 patients (41%) hadnonepileptic paroxysmal events of physiological origin and in 13 cases (21%), the diagnosis was PNES. One of these latter patients had ES along with PNES.

Regarding patients who did not have typical events (n = 65), we found epileptiform activity in 36 patients (37.5%) and nonepileptiform abnormalities in 20 patients (21.5%). Table 1 shows the electroencephalographic findings in all patients.

Table 1. VEM findings in patients with and without typical events. Between brackets is shown percentage

Electroencephalographicdiagnosis

ES
(N=22) *

NEE
(N=39) *

No events
(N=65)

Epileptiformactivity

21 (95%)

15 (38%)

36 (55%)

Non-epileptiformabnormalities

1(5%)

9 (23%)

10 (15%)

Encephalopathy

1 (3%)

3 (4%)

Normal

14 (36%)

17 (26%)

*Onepatientpresentedseizure + PNES

The three diagnostic categories, before and after VEM, are shown in Table 2. Patients with the double diagnosis of epilepsy and PNES have been included. As we can observe from this table, the diagnosis of epilepsy was confirmed in 41% of patients, 24% less than the initial presumptive diagnosis. Additionally, the diagnosis of PNES increased by 80% after VEM. In five patients, diagnosis of both epilepsy and PNES was made.

Table 2. Diagnostic categories before and after vEEG.(n = 125)

Diagnosis

Before VEM

After VEM

Change

Epilepsy

67 (54%)

51 (41%)

-16 (24%)

Physiologicalevents

45 (36%)

50 (40%)

+5 (11.1%)

PNES

10 (8%)

18 (14.4%)

+8 (80%)

PNES + Epilepsy

3 (2.4 %)

5 (4%)

+2 (67%)

Change is defined as After_VEM(variable)-Before_VEM(variable)

We compared the demographic characteristics between patients with final clinical diagnosis of epilepsy, events of physiological origin, and PNES (Table 3). We found that in the PNES group, women were more frequent in comparison with the other two groups. Additionally, this group had the lowest average age compared to nonepileptic events of physiological origin group. This last group had the highest mean age of onset of symptoms compared to the other two groups. It also had the shorter evolution time compared with the epilepsy group.

Table 3. Demographics and clinical comparation between diagnosis groups.

Epilepticseizures (n=51) *

Physiologicalevents
(n=50)

PNES
(n=18)

P value (MW test)

ES vs PE

ES vs PNES

PE vs PNES

Female

35 (70%)

29 (58%)

15(88%)

2.000

<0.001

<0.001

Age (yrs)

40.6 ± 2.6

48 ± 2.4

36.3±3.0

0.072**

0.265**

0.010**

Age at onset (yrs)

26.2 ± 2.9

42.5 ± 2.5

30.6±3.6

<0.001

0.471

0.025

Duration (yrs)

14.4 ± 2.1

5.8 ± 1.0

5.9±2.1

0.008

0.090

0.618

Abnormal non-epilepticEEG

5 (13%)

11 (31%)

5 (35%)

2.000

1.000

2.000

Epileptic EEG

20 (53%)

7 (20%)

4 (28%)

<0.001

<0.001

1.000

Abnormalbrain MRI

31 (59.6%)

18 (41%)

7 (46.6%)

<0.001

<0.001

<0.001

MW: Mann-Whitney test.
* The patients with diagnosis of Epilepsy and PNES (5) were excluded.
** Student-t test.

On the other hand, epileptiform activity on standard EEG was associated with the occurrence of epilepsy diagnosis compared with physiological events and PNES. Moreover, patients with epilepsy (59.6%) were more likely to have an abnormal brain MRI scan.

We assessed the overall structure for all the three groups according to sex proportion, age, age at onset, and abnormal findings in EEG. Paired comparison by groups yielded highly significant differences for ES vs. physiological events (χ2= 40.65, p < 0.001), ES vs. PNES (χ2= 37.30, p < 0.001), and physiological events vs. PNES (χ2= 38.17, p < 0.001), with 5 degrees of freedom.

Utility

We considered that VEM was useful for the clinician when the results of the study led to a change in the previous diagnosis, in treatment or both or when a suspected but not well-defined diagnosis was reinforced by the study.

According to our classification, VEM was defined as useful in 112 patients (89.6%). Specifically, treatment was changed (p2(T2,d1)) in 32 cases, diagnosis was modified in 10 patients (p2(T1,d2)), both of them were modified in 35 patients (p2(T2,d2)), and the suspected diagnosis was confirmed in 35 patients (p2,con(T1,d1)). Therefore, after VEM, the treatment was modified in 67 patients (p2(T2,d1) + p2(T2,d2)) and diagnosis changed in 45 patients (p2(T1,d2) + p2(T2,d2)).

In 10.4% of cases, the VEM results were inconclusive and could not be termed as useful.

Regarding the group of patients with a final diagnosis of epilepsy (n = 51), 44 of the patients (86.3%) were on at least one AED at the time of admission. After VEM, change in therapy was reported in 33 patients (64.7%) of the total group, among whom a new AED was introduced or the dose was increased in 26 patients (78%) and the dose was reduced in 7 patients (21%).

With respect to the group of patients with physiological events (n = 50), 21 patients (42%) had been on at least one AED at the time of the study. After VEM, the treatment was modified in 18 patients (36%) with a discontinued or decreased treatment in 15 patients (71%). There were 12 patients diagnosed with PNES who had previous AED treatment. Discontinuation of therapy was seen in 3 patients.

Discussion

We have shown that VEM is an extremely helpful tool in the diagnosis and therapeutic management of patients with paroxysmal behavioral events. Misdiagnosis and misclassification of nonepileptic paroxysmal events and ES can lead to inappropriate treatment. High costs have been incurred annually on diagnostic evaluations, inappropriate antiepileptic drugs, and emergency unit utilization [11].

In many cases, clinical information alone can be incomplete or misleading due to descriptions made by untrained witnesses. Furthermore, the correct diagnosis may not be apparent during the short period of outpatient EEG. VEM helps to correlate electroencephalographic changes with clinical events and detect epileptiform activity in long-term records, which also include a sleep period [2, 12].

VEM provided a useful yield of recorded clinical events. We have found that the 24-h VEM is able to detect typical clinical events in a 49% of cases. ES represents 36% of the cases, which is comparable to other series [13]. Most of the recorded events corresponded to nonepileptic paroxysmal events (62%), although one-third (21%) were of psychogenic origin. Thus, an accurate correlation between electroclinical findings is essential to properly characterize different paroxysmal events [10, 14]. This finding was revealed in a meta-analysis of 135 published studies on VEEG, which describe that 59% of referrals were for diagnostic reasons [15].

In this sense, PNES has a special importance. VEM is an indispensable tool because it allows simultaneous analysis of both clinical and ictal EEG findings to make the most accurate differential diagnosis between seizure and PNES [4, 16]. The results of VEM between patients with epilepsy and PNES revealed a sustained decline in AED use from discharge to follow-up [17], suggesting that VEM may contribute to a beneficial elimination of unnecessary medications in the PNES group once a definitive diagnosis is made.

It has been previously shown that in those patients with a change in diagnosis, the most common change involves distinguishing epilepsy from physiological events (68.2%) [18]. In our work, we found that VEM reduced the previous diagnosis of epilepsy in 24% of the cases. The reference physicians are more likely to misdiagnose nonepileptic events as seizures than the opposite. This finding may be due to a diagnosis that was made based on clinical history and a routine EEG that can be deceptive. Physiological paroxysmal events were more frequently misdiagnosed as PNES.

A total of 35% of patients saw their previous diagnosis change. Other authors [19] described a change in the diagnosis in 58% of patients. The higher figure could possibly be observed because these researchers’ studies were longer (1–13 days) and included patients with refractory epilepsy and who were gradually tapering AED. However, recent studies indicate that the VEEG clarifies diagnosis in 56.3% of patients and changes the diagnosis in 35.6% of patients [15, 20]. We have shown that VEM was useful in establishing or shaping the diagnosis in 112 patients (89%). This technique helped to confirm the reference diagnosis with certainty, classify patients with ES, and select the best treatment according to each diagnosis of either epilepsy or nonepileptic events. The high diagnostic yield of VEM in adult patients with recurrent and unprovoked events has been confirmed previously [21-23]; however, the diagnostic usefulness is widely variable (19%–75%) due to a variation in the definition of utility [10].

We found in the PNES group that women were more frequent in comparison to the other two groups. They were also younger at the time of the study and had a younger age of onset of events compared to those experiencing physiological events. We found a longer disease duration in epilepsy patients, as has been previously described [24], showing a delay in diagnostic confirmation. On the other hand, physiological event patients were older at the onset of symptoms compared to the PNES group, which is probably related to the etiology [25]. It is quite interesting to observe that all three groups are really different. This fact can help to establish a predictive model based on electroclinical findings to help the clinician to classify a patient in daily practice.

We had a final diagnosis of event of physiological origin in 40% of our patients and of PNES in 14% of the cases (see table 3). It is important to highlight that in both these groups, we found epileptiform activity in 20% and 28% of cases, respectively, and in both, ≥30% of abnormal nonepileptic activity. There are some studies describing between 17% and 26% of patients eventually being diagnosed with nonepileptic events who had interictalepileptiform discharges (IEDs) recorded during VEEG [26, 27]. Similar findings were caused by overreading a standard EEG as abnormal [27-30]. In a study that analyzed the significance of epileptiform abnormalities in patients without epilepsy, the researchers found that of 521 patients with a follow-up of 230 person-years with no history of unprovoked seizures, 64 (12.3%) had IEDs on their EEG. These patients had associated structural neurological conditions (e.g., tumors and vascular disorders), which would explain the 20% of epileptiform abnormalities found in our patients with physiological events.

VEM also helped to determine the best treatment for the individual patient based on the type of witnessed events and the electrographic characteristics in VEM. This finding caused a treatment change in 50% of patients. Moreover, the largest change was seen in the group of patients diagnosed with epilepsy. This finding shows the value of VEM when it comes to influencing the overall care pathway of patients. Optimization of AED may result in avoiding drug adverse events, a better quality of life, and reduction in health costs [31]. In our results, the discontinuation of AED treatment in PNES was low for what we might have expected. The reasons can be different, but it is essential to mention that some clinical physicians often analyze VEM results in an imprecise way for the diagnosis of PNES [32], even though VEM is the gold standard for diagnosis of PNES [4].

Despite being considered an expensive technique with limited availability (a neurophysiologist is needed with healthcare staff and specialized technical equipment) [33], VEM has been demonstrated to be a useful test with robust therapeutic benefits. There are recent recommendations and algorithms based on high-level evidence for the use of VEM for the diagnosis and monitoring of patients with epilepsy [34]. Conversely, the financial and social cost of unclassifiable behavioral disturbances to the patient and the family is considerable, and poorly controlled ES has been associated with impaired psychosocial skills and an increased risk of death [35]. Therefore, in the absence of a study that compares the cost–benefit of VEM and the economic and social cost of chronic uncontrolled seizures (epileptic or nonepileptic), it seems logical to consider that VEM should be a mandatory tool in the differential diagnosis of ES.

Acknowledgement

This work was financed by a grant from the Ministerio de Sanidad FIS PI17/02193 and was partially supported by FEDER (FondsEuropeen de DeveloppementEconomiqueet Regional).

References

  1. Tatum WO, Rubboli G, Kaplan PW,Mirsatari SM, Radhakrishnan K et al. (2018) Clinical utility of EEG in diagnosing an monitoring epilepsy in adults. ClinNeurophysiol 129:1056-1082. [crossref]
  2. Fisher RS, Acevedo C, Arzimanoglou A, Bogacz A, Cross JH et al. (2014) ILAE official report: a practical clinical definition of epilepsy. Epilepsia 55:475-82. [crossref]
  3. Krumholz A (1999) Nonepileptic seizures: diagnosis and management. Neurology 53: 76-83.[crossref]
  4. Vega-Zelaya L, Alvarez M, Ezquiaga E, et al. (2014) Psychogenic Non-Epileptic Seizures in a Surgical Epilepsy Unit: Experience and a Comprehensive Review. Epilepsy Topics. Prof. Mark Holmes (Ed.)InTech.
  5. Cuthill FM, Espie CA (2005) Sensitivity and specificity of procedures for the differential diagnosis of epileptic and non-epileptic seizures: a systematic review. Seizure14:293-303.[crossref]
  6. Velis D, Plouin P, Gotman J, et al. (2007) Recommendations regarding the requirements and applications for long-term recordings in epilepsy. Epilepsia48:379-384.[crossref]
  7. Park KI, Lee SK, Chu K, Jung Ju Lee, Dong Wook Kimet al. (2009) The value of video-EEG monitoring to diagnose juvenile myoclonic epilepsy. Seizure18:94-99.[crossref]
  8. Delgado Nunes V, Sawyer L, Neilson J, GrammatiSarri, J Helen Crosset al. (2012) Diagnosis and management of the epilepsies in adults and children: summary of updated NICE guidelines. Br Med J 344: 281.[crossref]
  9. Pastor J, Ortega GJ, Herrera-Peco I,Marta Navas-García, Eduardo G Navarrete et al. (2010) Differential contribution of preoperatory studies to diagnosis in temporal lobe epilepsy surgery. Rev Neurol51:393-402.[crossref]
  10. Alving J, Beniczky S (2009) Diagnostic usefulness and duration of the inpatient long-term video-EEG monitoring: findings in patients extensively investigated before the monitoring. Seizure18:470-473.[crossref]
  11. Koblar, SA, Black, AB and Schapel, GJ (1992) Video-audio/EEG monitoring in epilepsy—The Queen Elizabeth Hospital Experience. Clinical and Experimental Neurology29:70-73. [crossref]
  12. Pastor J (2011) Vídeo-electroencefalografía de scalp. En: Neurocirugía Funcional y Estereotáxica. Eds: E.G. Navarrete y R. G. Sola. Viguera Editores Barcelona; pp: 109-120.
  13. McGonigal A, Russell AJC, Mallik AK, M Oto, R Duncanet al. (2004) Use of short term video EEG in the diagnosis of attack disorders.  J NeurolNeurosurg Psychiatry75:771-772.[crossref]
  14. Lawley A, Manfredonia F, Cavanna AE (2016) Video-ambulatory EEG in a secondary care center: A retrospective evaluation of utility in the diagnosis of epileptic and nonepileptic seizures. Epilepsy & Behavior57: 137-140.[crossref]
  15. Sauro KM, Wiebe N, Macrodimitris S, Wiebe S, Lukmanji S et al. (2016) Quality and safety in adult epilepsy monitoring units: A systematic review and meta-analysis. Epilepsia57:1754-1770.[crossref]
  16. Gallego I, Ezquiaga E, Betancor D, et al. (2011) Psychogenic non-epileptic seizures in an epilepsy surgery unit. Rev Neurol52:449-446.[crossref]
  17. Zhang YC, Bromfield EB, Hurwitz S, Aaron Nelson, Kristen Sylviaet al. (2009) Comparison of outcomes of video/EEG monitoring between patients with epileptic seizures and those with psychogenic nonepileptic seizures. Epilepsy Behav15:303-307.[crossref]
  18. Yogarajah M, Powell HWR, Heaney D, et al. (2009) Medium term monitoring in refractory epilepsy: the Gowers Unit experience. J NeurolNeurosurg Psychiatry80:305-311.
  19. Ghougassian DF, d’Souza W, Cook MJ, Terence J O’Brien(2004) Evaluating the utility of inpatient video-EEG monitoring. Epilepsia45:928-932.[crossref]
  20. Sauro KM, Macrodimitris S, Krassman C, et al. (2014) Epilepsy Monitoring Unit Quality Improvement Team. Quality indicators in an epilepsy monitoring unit. Epilepsy Behav33:7-11.
  21. Alsaadi TM, Thieman C, Shatzel A, Sarah Farias(2004) Video-EEG telemetry can be a crucial tool for neurologists experienced in epilepsy when diagnosing seizure disorders. Seizure13:32-34.[crossref]
  22. Lee Y, Lee M, Chen I, Yu-TaiTsai, Chung-Yang Sunget al. (2009) Long-term Video-EEG Monitoring for Paroxysmal Events. Chang Gung Med J32:305-312.[crossref]
  23. Mohan KK, Markand ON, Salanova V (1996) Diagnostic utility of video EEG monitoring in paroxysmal events. ActaNeurolScand94:320-325.[crossref]
  24. Foong M, Seneviratne U (2016) Optimal duration of video-electroencephalographic monitoring to capture seizures. J ClinNeurosci28:55-60. [crossref]
  25. Mari F, Di Bonaventura C, Vanacore N, JinaneFattouch, Anna ElisabettaVaudanoet al. (2006) Video-EEG study of psychogenic nonepileptic seizures: Differential characteristics in patients with and without epilepsy. Epilepsia5:64-67.[crossref]
  26. McBride AE, Shih TT, Hirsch LJ (2002) Video-EEG monitoring in the elderly: a review of 94 patients. Epilepsia43:165-169.[crossref]
  27. Friedman DE, Hirsch LJ (2009) How long does it take to make an accurate diagnosis in an epilepsy monitoring unit? J ClinNeurophysiol26:213-217.[crossref]
  28. Benbadis SR, Tatum WO (2003) Overintepretation of EEGs and misdiagnosis of epilepsy. J ClinNeurophysiol20:42-44. [crossref]
  29. Benbadis SR (2013) “Just like EKGs!” Should EEGs undergo a confirmatory interpretation by a clinical neurophysiologist? Neurology 80: 47-51.[crossref]
  30. Benbadis SR (2007) Errors in EEGs and the misdiagnosis of epilepsy: importance, causes, consequences, and proposed remedies. Epilepsy Behav11:257-2562.[crossref]
  31. Manfredonia F, Lawley A, Cavanna AE (2016) Impact of video-ambulatory electroencephalography on the medical management of epilepsy. J NeurolSci365:139-1342.[crossref]
  32. Harden CL, Burgut FT, Kanner AM (2003) The diagnostic significance of video-EEG monitoring findings on pseudoseizure patients differs between neurologists and psychiatrists. Epilepsia44:453-456.[crossref]
  33. Parnell KJ, Cascino GD, So EL, et al. (1999) Long-term EEG monitoring in patients with spells: clinical characteristics and predictive factors. Neurology 52: 371-372.
  34. Cho YW, Motamedi GK, Kim KT (2019) The clinical utility of non-invasive video-electroencephalographic monitoring has been diversifying. NeurolSci 40:2625-2631. [crossref]
  35. Morrel MJ, Pedley TA (2000) “The Scarlet E”: epilepsy is still a burden. Neurology54:1882-1883.[crossref]

Improved Piglet Performance and Reduced Antibiotic Use Following Oral Vaccination with a Live Avirulent Escherichia Coli F4 Vaccine against Post-Weaning Diarrhea

DOI: 10.31038/JCRM.2020321

Abstract

Background: Post-weaning diarrhea (PWD) in pigs is a worldwide economically important disease, which is frequently controlled using antibiotics. However, emergence of antimicrobial resistance in E. coli strains urges the need for alternative control measures, such as adapted feeding strategies, pre- and probiotics, organic acids, MCFAs or immunization. Different alternative control strategies such as active immunization of piglets against PWD with an E. coli F4 vaccine combined with different feeding strategies, addition of nutraceuticals (medium chain fatty acids (MCFAs), organic acids and additional fibers) or supplementation of ZnO were evaluated for their efficacy against PWD due to F4 enterotoxigenic Escherichia coli (F4-ETEC) under field conditions.

Results: ZnO-supplemented piglets had a lower overall end weight and lower average daily weight gain, as compared to E. coli vaccinated piglets   or piglets fed a diet with additional nutraceuticals. Piglets fed a ZnO-supplemented diet had optimal fecal and general clinical scores and the lowest number of individual antibiotic treatments. All E. coli vaccinated groups had intermediate clinical scores and a relatively low number of antibiotic treatments. However, clinical scores were much higher in the nutraceutical group, indicating more severe clinical diarrhea, which needed additional antibiotic intervention. Mortality was also significantly increased in the nutraceutical-supplemented group. The present study demonstrated the efficacy of an oral live non-pathogenic E. coli F4 vaccine (Coliprotec® F4; Elanco) for active immunization of piglets against PWD due to F4-ETEC under field conditions. Different feeding strategies (1-, 2-, and 3-phase feeding) had no significant effect on the clinical outcome and performance parameters of E. coli vaccinated piglets.

Conclusions: In many parameters, E. coli vaccination performed equal compared to the ZnO-supplemented group. In contrast, the alternative control strategy combining MCFAs, organic acids and additional fibers resulted in significant clinical diarrhea and mortality, requiring additional  antibiotic treatment to control, although many other performance parameters were very similar to E. coli vaccination or ZnO supplementation. Therefore, E. coli vaccination could be one of the future preventive options to protect piglets against PWD due to pathogenic E. coli.

Keywords

F4-ETEC, PWD, E. coli F4 vaccine, performance, antibiotic reduction

Introduction

Post-weaning diarrhea (PWD) in pigs is a worldwide economically important disease [1], characterized by increased mortality, weight loss, retarded growth, increased treatment costs, higher use of antibiotics and batch variation [2-8]. Enterotoxigenic E. coli (ETEC) is regarded the most important cause of PWD. The ETEC pathotype is typically characterized by the presence of fimbrial adhesins, which mediate attachment to porcine intestinal enterocytes, and enterotoxins, which disrupt fluid homeostasis in the small intestine.

This results in mild to severe diarrhea within a few days post-weaning, associated with clinical signs of dehydration, loss of body condition (= disappearance of muscle volume) and mortality [9]. The adhesive fimbriae most commonly occurring in ETEC from pigs with PWD are F4 (K88) and F18 [9]. Other fimbriae such as F5 (K99), F6 (987P) and F41 rarely occur in E. coli isolates from PWD [9-13]. The main enterotoxins associated with porcine ETEC are heat-labile toxin (LT), heat-stable toxin a (STa) and heat-stable toxin b (STb). In some cases, both enterotoxins and a Shiga toxin (Stx2e) are produced by the pathogenic stains [9].

The disease is currently controlled using antimicrobials, although the emergence of antimicrobial resistance in E. coli strains isolated from cases of PWD urges the need for alternative control measures [14-18].

Several alternative strategies have been explored to increase intestinal health and decrease incidence of PWD due to E. coli in post- weaned piglets [19-21]. Overall, inclusion of additional dietary fiber and reduction of crude protein levels in post-weaning diets seemed to be an effective nutritional strategy that may counteract the negative effects of protein fermentation in the pig gut [20, 22-24]. Although specific fermentable carbohydrates combined with reduced crude protein content altered  the  microflora  and  fermentation  patterns  in the gastro-intestinal tract of post-weaned piglets, these favorable effects did not necessarily result in increased growth performance [25]. Other feeding strategies were more focused on feed consistency, thereby feeding more coarsely ground meal to the post-weaned piglets [26]. Coarsely ground feed meals change the physico-chemical conditions in the stomach, thereby increasing concentrations of organic acids which lower the pH. This promoted growth of anaerobic lactic acid bacteria and reduces survival of E. coli during passage through the stomach [26]. Fermentation of undigested dietary protein and endogenous proteins in the large intestines yield putative toxic metabolites that can impair epithelial integrity and promote enteric disorders such as PWD [27]. Incidence and severity of PWD may also be influenced by addition of probiotics to the diet, which may change the fermentation profile and thus promote gut health [28]. Furthermore, medium chain fatty acids (MCFAs) can neutralize bacterial metabolites in the small intestine [29].

From the late 1980’s onwards, several studies on zinc supply to post-weaned piglets have been performed. Several nutritional studies demonstrated the effects of dietary zinc oxide (ZnO) in the prevention and healing of PWD [30]. Therefore, ZnO has been admitted in the prevention and control of PWD at levels up to 3,000 parts per million (ppm) through the feed for a maximum of 14 days post-weaning. However, Committee for Veterinary Medicinal Products (CVMP) has recently decided that the use of ZnO in post-weaning diets should be phased out the latest by 2022 throughout the EU [31].

Therefore, other preventive strategies have recently been explored [1,32]. For an E. coli vaccination against PWD due to F4- and F18- ETEC, the prerequisite is that active mucosal immunity against F4 and F18 is mounted. This implies the local production of F4- and/or F18- specific sIgA antibodies, which prevent pathogenic F4- and F18-ETEC to attach to the intestinal F4- and F18-receptors and thus reduce clinical signs of PWD [32]. Recently, vaccination with a live non-pathogenic E. coli F4 or E. coli F4 and F18 vaccine has demonstrated efficacy against PWD due to F4-ETEC and F4- and F18-ETEC [33,34]. Immunization against the F4- and F18-ETEC pathogens resulted in decreased severity and duration of PWD clinical signs and fecal shedding of F4- and F18- ETEC [33,34]. Moreover, increased weight gain was demonstrated in piglets vaccinated with E. coli F4 vaccine [33].

Here, we report results demonstrating the efficacy of an oral live non-pathogenic E. coli F4 vaccine (Coliprotec®  F4; Elanco; Greenfield, IN) for active immunization of piglets against PWD caused by F4-ETEC with different feeding strategies under field conditions. We also included a group using the current approach of 3,000 ppm ZnO during 14 days post-weaning and a group with addition of a nutraceutical concept containing MCFAs, organic acids and additional fibers.

Materials and Methods

Experimental farm description

The field trial was performed on a conventional farrow-to-finish pig farm with 600 DanBred sows in Flanders (Belgium). The farm was managed in a 4-week batch-management system (with alternately weaning) with 120 sows per production batch. This management approach has been shown to improve the health status for several respiratory pathogens [35]. Piglets were weaned at 23 days of age and housed in specifically equipped post-weaning facilities, where they were raised for 7 weeks (50 days post-weaning). The post-weaning facility was equipped with 40 pens, which could each house 16 post- weaned piglets. Dry feeders with two waterers, one on each side, were located at the pen division, thus feeding two pens with a total of 32 piglets. The pens were further equipped with fully slatted plastic floors and were heated with hot water tubes on the side walls near the air inlet. Ventilation was performed through 3 ventilation tubes and fresh air entered into the compartment directly from the outside.

ETEC diagnosis and characterization at experimental farm

The farm was selected following ETEC diagnostics during the post-weaning period. Therefore, untreated piglets (n = 10) with typical clinical signs of PWD, such as watery feces, thin belly and signs of dehydration, were sampled using rectal swabs (Sterile Transport Swab Amies with Charcoal medium; Copan Italia S.p.A., Brescia, Italy). All sampled piglets were between 3 and 5 days post-weaning. The diagnostic samples were sent to the laboratory (IZSLER, Brescia, Italy) under cooled conditions for further processing.

Specimen were processed using standard procedures for isolation and characterization of intestinal E. coli  [18].  Briefly,  samples  were plated on selective media and on tryptose soy agar medium supplemented with 5% of defibrinated ovine blood and incubated aerobically overnight at 37°C. Haemolytic activity was evaluated and single coliform colonies were further characterized.

DNA samples were prepared from one up to five haemolytic and/ or non-haemolytic E. coli colonies and used to perform a multiplex PCR for the detection of fimbrial and toxin genes, including those encoding for F4 (K88), F5 (K99), F6 (987P), F18, F41, LT, STa, STb
and Stx2e, but not discriminating between F4ab, F4ac and F4ad. The methodology used for the identification of these virulence genes has been described previously [36]. All collected samples were positive for F4 in combination with STa, STb and LT. No other virulence factors could be detected.

Vaccination with a live non-pathogenic E. coli F4 vaccine

In order to vaccinate piglets at least 7 days before the clinical signs to mount sufficient protective local immunity in the gut [33], piglets were vaccinated at 18 days of age (5 days prior to weaning), during the suckling period. The live non-pathogenic E. coli F4 vaccine has a rapid onset of immunity (7 days) and a duration of immunity of 21 days post-vaccination, which covers the most critical period of PWD [1]. An efficacy trial using an experimental E. coli F4 challenge at 3 days post-vaccination showed reduction of the severity and duration of PWD and reduction in fecal shedding of pathogenic F4-ETEC [33].  Sows  were  randomly  assigned  to  treatment  (Coliprotec®  F4; Elanco, Greenfield, IN) or control group based on their parity and sow number. Parities were equally distributed to both treatment groups. Piglets from sows assigned to the treatment group were vaccinated orally through drenching with 2 ml of a live non-pathogenic E. coli F4 vaccine (Coliprotec® F4; Elanco, Greenfield, IN). Piglets from sows in the control group were not treated nor vaccinated. No antibiotics were administered to piglets from 15 days of age onwards, in order to omit interference with development of protective local immunity by the E. coli F4 vaccine during the 7 days following vaccination.

Experimental design

At weaning, E. coli vaccinated piglets were randomly assigned  to three groups with a different feeding strategy. The unvaccinated control piglets were randomly assigned to two groups with different preventive measures supplemented to the feed against PWD due to E.  coli. Each treatment group consisted of 128 piglets divided over  8 pens with 16 piglets each. Sexes were distributed equally within and between different treatment groups. The treatment groups were randomly allocated to the different pens within the compartment in order to evenly distribute all treatments for potential interaction with specific climatic subzones within the compartment (outer walls, air inlet, central part). Details on the experimental design in relation to feeding strategies and preventive measures are given in Table 1. Piglets were weighed per pen (n = 16 piglets) at three different time-points: d0 (start), d21 (mid-term) and d50 (end). Average piglets weights were calculated based on pen weight and number of piglets present at the moment of weighing. Piglet treatment identification was blinded to both farmer and veterinarian involved in trial follow-up by letter codes (A, B, C, D, and E).

Table 1. Schematic description of experimental trial set-up including treatment groups and their short comprehensive description and the respective differences in feeding strategies (weaning starter, starter and grow starter; blocks in the same colour have identical compositions), addition of ZnO (3,000 ppm), supplementary nutraceuticals (MCFAs, organic acids and additional fibers) and vaccination with a live non-pathogenic E. coli F4 vaccine.

Treatment groups
A B C D E

Treatment description

1-phase / vaccine 2-phase / vaccine 3-phase / vaccine 3-phase / nutriceutical 3-phase + ZnO

Weaning starter

2 kg 5 kg 5 kg 5 kg

Starter

8 kg 8 kg 8 kg

Grow starter

ZnO (14d)

0 0 0 0 3,000 ppm

Nutraceuticals

0 0 0 2 kg / tonne 0

E. coli F4 vaccine

yes yes yes no no

Feeding strategies

Feeding strategies were based on practical field situations, where a limited number of different feeding phases can be fed to piglets during the post-weaning period. Therefore, we decided to test 1-phase, 2-phase and 3-phase feeding strategies in combination with E. coli F4 vaccination. Unvaccinated control group were also fed the 3-phase strategy. One unvaccinated group was designed to resemble the current field situation with addition of 3,000 ppm ZnO to the feed during the first 14 days post-weaning, whereas the other unvaccinated group was formulated with 2 kg of extra protective nutritional supplements, i.e. nutraceuticals, consisting of a combination of MCFAs, organic acids and additional fibers.

Treatment

No group treatments were performed during the entire study period. Individual piglets with severe clinical signs of PWD were treated with an injectable antimicrobial, i.e. lincomycine. Other disorders were treated by the farmer, following consultation of the veterinarian, with the appropriate antimicrobial where needed. All individual treatments were registered with date, pen, product type and reason for treatment.

Performance parameters

The following performance parameters were collected during the trial: piglet weight at d0, d21 and d50, feed intake during period 1 (0-  21 days), period 2 (22-50 days) and period 3 (0-50 days), individual treatments with specific reason for treatment, mortality with date of death (number of days in trial) and piglet weight. Average daily weight gain (ADWG) was calculated based on piglet weight and number of days in trial for period 1 (0-21 days), period 2 (22-50 days) and period 3 (0-50 days). Feed conversion rate (FCR), the amount of feed to add one kg of bodyweight, was calculated based on average daily weight gain and feed intake for period 1 (0-21 days), period 2 (22-50 days) and period 3 (0-50 days). Treatment incidence 50 (TI50) was calculated based on the number of individual injections per treatment for a total of 100 piglets over the
trial duration of 50 days.

Pen fecal clinical score and general clinical score

Piglet feces consistency was scored daily from d0 to d21 using pen fecal clinical score (FCS) as described in Table 2. FCS was performed by the same person throughout the entire duration of the trial observation (0-21 days). Piglets were also scored on general appearance using a general clinical score (GCS), ranging from 0 (= severe clinical condition) to 10 (= excellent clinical condition). For both pen FCS and GCS, one score per pen was attributed daily in the morning at 9 am. For analysis, area under the curve (AUC) and time to maximal score was calculated per pen for both pen FCS and GCS. Clinical assessment of piglets with diarrhea was performed based on appearance of fluid watery stools in the anal and perineal region. The number of piglets per pen with these clinical signs was counted daily from d0 to d21 and reported as total number of piglets with diarrhea per treatment group over the entire observation period (0-21 days).

Table 2. Comprehensive description of the pen fecal clinical score with its interpretation and the clinical aspect of the fecal clinical score.

Score

Interpretation

Clinical aspect

0

Normal

Normal fecal consistency

1

Pasty

Soft pasty consistenty

2

Mild

Presence of fluid, but more particles than fluid

3

Moderate

More fluid than particles

4

Severe

Fluid watery faeces

Statistical analysis

For the continuous data, effect of treatment was assessed using pairwise comparison using t-test with pooled standard deviations. For the ordinal outcomes, effect of treatment was assessed using pairwise comparison using Wilcoxon rank sum test. The P-values were adjusted with the Bonferroni method for multiple comparison. All tests were performed at the nominal level of 5%.

Results

Piglet weight and average daily weight gain

On d0, average individual piglet weight was not significantly different among treatment groups, indicating an equal starting weight in all groups. At the mid-point weighing (d21), group E (ZnO) had a significantly higher (P < 0.05) weight as compared to the other treatment groups. In contrast with its higher mid-point weight  at  d21, group  E (ZnO) had the lowest numerical average individual piglet weight at d50, although no significant differences (P > 0.05) were present between all treatment group (Figure 1).

JCRM-3-2-309-g001

Figure 1. Average individual piglet weight (expressed in kg; mean ± SEM) for piglets at d0 (start of trial), d21 (mid-point weighing) and d50 (end of trial). Different treatment groups differed in feeding strategy and vaccination status against E. coli F4. Groups A, B, and C were vaccinated with Coliprotec® F4 at 18 days of age and combined with a 1, 2, or 3-phase feeding strategy. Group D was fed a 3-phase feeding strategy combined with additional nutraceutical protection, and Group E was fed a 3-phase feeding strategy with supplementation of 3,000 ppm ZnO for the first 14 days post-weaning. Different superscript letters indicate statistically significant differences (P < 0.05).

For period 1 (0-21 days), group E (ZnO) had a significantly higher (P < 0.05) ADWG  as compared  to the other treatment  groups.  The piglets vaccinated with the E. coli F4 vaccine grew equally well, whereas group D (nutraceuticals) slightly, though not significantly, underperformed, as compared to the E. coli vaccinated groups A, B, and C. For period 2 (22-50 days), group E had a significantly lower (P < 0.05) ADWG of 283 g/day compared to all other treatment groups, whereas E. coli vaccinated piglets in group A, B, and C grew 363 to 372 g/day. During this period, group E also had a significantly lower (P < 0.05) ADWG as compared to group D. Overall ADWG (0-50 days) was not significantly different among the different treatment groups (Figure 2).

JCRM-3-2-309-g002

Figure 2. Average daily weight gain (ADWG; expressed in g/d; mean ± SEM) for piglets during period 1 (0-21 days post-weaning), period 2 (22-50 days post-weaning) and period 3 (0-50 days post-weaning). Different treatment groups differed in feeding strategy and vaccination status against E. coli F4. Group A, B, and C were vaccinated with Coliprotec® F4 at 18 days of age and combined with a 1, 2, or 3-phase feeding strategy, respectively. Group D was fed a 3-phase feeding strategy combined with additional nutraceutical protection, and Group E was fed a 3-phase feeding strategy with supplementation of 3,000 ppm ZnO for the first 14 days post-weaning. Different superscript letters indicate statistically significant differences (P < 0.05).

JCRM-3-2-309-g003

Figure 3. Feed conversion rate (FCR; expressed in kg of feed per kg of weight gain; mean ± SEM) for piglets during period 1 (0-21 days post-weaning), period 2 (22-50 days post- weaning) and period 3 (0-50 days post-weaning). Different treatment groups differed in feeding strategy and vaccination status against E. coli F4. Group A, B, and C were vaccinated with Coliprotec® F4 at 18 days of age and combined with a 1, 2, or 3-phase feeding strategy, respectively. Group D was fed a 3-phase feeding strategy combined with additional nutraceutical protection and Group E was fed a 3-phase feeding strategy with supplementation of 3,000 ppm ZnO for the first 14 days post-weaning. Different superscript letters indicate statistically significant differences (P < 0.05).

Feed conversion rate

For period 1 (0-21 days), group B (2-phase feeding) had a significantly higher (P < 0.05) FCR as compared to the other treatment groups. During period 2 (22-50 days), both group B (2-phase feeding) and group E  (ZnO)  had  a  significantly  higher (P < 0.05) FCR as compared to groups A, C, and D. Overall FCR (0-50 days) was significantly higher (P < 0.05) in group B (2-phase feeding) as compared to group C (3-phase feeding) and group D (nutraceuticals). None of the other groups was significantly different from each other.

Pen fecal clinical score and general clinical score

Pen FCS was collected daily for each individual pen from 0 to 21 days post-weaning. Pen FCS, expressed as AUC, was not significantly different (P > 0.05) among E. coli vaccinated groups (A, B and C). However, pen FCS of group E (ZnO) was significantly lower (P < 0.05) as compared to group D (nutraceuticals). Pen FCS of group E (ZnO) was significantly lower (P < 0.05) as compared to all E. coli vaccinated groups (Table 3). Although some numerical differences  in time to maximal FCS occurred among different treatment groups, no significant differences (P > 0.05) could be observed in the time to maximal FCS (Table 3).

Table 3. Area under the curve (AUC) of pen fecal clinical score and pen general clinical score (GCS), time to maximal FCS and GCS (mean ± SEM) for piglets during the first 21 days post-weaning and treatment incidence 50 (TI50; # individual treatment/100 piglets/50 days in trial; mean ± SEM). Pen FCS was scored daily on a score from 0 (= normal) to 4 (= watery diarrhea) and GCS was scored daily on a score from 0 (= very bad) to 10 (= excellent). Different treatment groups differed in feeding strategy and vaccination status against E. coli F4. Group A, B, and C were vaccinated with Coliprotec® F4 at 18 days of age and combined with a 1-2 or 3-phase feeding strategy, respectively. Group D was fed a 3-phase feeding strategy combined with additional nutraceutical protection and Group E was fed a 3-phase feeding strategy with supplementation of 3,000 ppm ZnO for the first 14 days post-weaning. Different superscript letters indicate statistically significant differences (P < 0.05).

Treatment group

A

B

C

D

E

Pen FCS

42.9 ± 2.97 a

41.6 ± 2.08 ac

43.1 ± 2.18 ad

52.6 ± 1.84 ad

15.8 ± 1.72 b

Time to maximal FCS

6.25 ± 0.59

6.50 ± 0.68

7.25 ± 0.56

6.62 ± 0.60

5.62 ± 0.65

Pen GCS

175 ± 3.96 a

187 ± 1.55 ac

176 ± 2.76 a

164 ± 3.04 ac

204 ± 1.79 bd

Time to maximal GCS

8.12 ± 0.61 a

6.12 ± 0.66 a

7.12 ± 0.61 a

7.62 ± 0.75 a

5.50 ± 0.38 a

# piglets with diarrhea (0-21 d)

76 a

73 a

105 a

315 b

11 c

TI50

1.21 ± 0.18 a

1.16 ± 0.14 ab

1.67 ± 0.30 ab

5.00 ± 1.05 c

0.17 ± 0.01 b

The number of piglets with clinical signs of diarrhea was significantly higher (n = 315; P < 0.05) in group D (nutraceuticals) as compared to the E. coli vaccinated groups. No significant differences were observed among the E. coli vaccinated groups (A, n = 76; B, n = 73; C, n = 105). Group E (ZnO) had a significantly lower number (n = 11; P < 0.05) of piglets with clinical diarrhea as compared to all E. coli vaccinated groups (A, B, and C) (Table 3).

Pen GCS was collected daily for each individual pen from 0 to 21 days post-weaning. AUC of pen GCS was significantly better (P < 0.05) in group E (ZnO) as compared to all other treatment groups. Group B (2-phase feeding) had a significantly better (< 0.05) pen GCS as compared to group A (1-phase feeding), C (3-phase feeding) and D (nutraceuticals) (Table 3). Although some numerical differences in time to maximal GCS occurred between the different treatment groups, no significant differences (P > 0.05) could be observed (Table 3).

Treatment incidence 50

TI50 was calculated as the total number of individual treatments per 100 piglets per group over 50 days of trial. In group D (nutraceuticals), TI50 was significantly higher (P < 0.05) as compared to the other treatment groups. Group E (ZnO)  had  the  lowest  TI50,  although the addition of 3,000 ppm ZnO was not taken into account in this calculation (Table 3). All E. coli vaccinated groups had equally low and non-significantly different (P > 0.05) TI50 values.

Mortality

Data related to mortality are given in Table 4. In summary, group D (nutraceuticals) had the highest percentage of overall mortality with 12.5%, which was nearly double the mortality percentage of group E (ZnO) and triple the mortality percentage in the vaccinated groups (A, B, and C). Moreover, piglets in group D (nutraceuticals) died early post-weaning (9.83 days post-weaning), mostly due to acute to subacute PWD. Mortality in group E (ZnO) occurred in period 2 (22- 50 d), after removal of 3,000 ppm ZnO from the diet at 14 days post- weaning. This was characterized by the highest mortality weight (11.56 kg) for period 2 (22-50 d). Mortality in the E. coli vaccinated groups (A, B, and C) was equally distributed among both periods and was very limited in numbers (n = 4-6 dead piglets per group) compared to both other groups (D and E).

Table 4. Mortality results per treatment group and study period with number of dead piglets per group (percentage of total piglets enrolled in the group), average weight of the dead piglets (kg;
± SEM), and average day of post-weaning mortality (d; ± SEM).

Study period

Period 1 (0-21 d post-weaning)

Period 2 (22-50 d post-weaning)

Treatment group

Mortality – number (%)

Average weight dead piglets (kg; avg ± SEM)

Average days post- weaning (d; avg ± SEM)

Mortality – number (%)

Average weight dead piglets (kg; avg ± SEM)

Average days post-weaning (d; avg ± SEM)

A

2 (1.56%)

6.00 ± 1.00

21.0 ± 0.0

4 (3.13%)

8.75 ± 1.11

35.2 ± 1.9

B

2 (1.56%)

4.50 ± 0.50

14.0 ± 5.0

3 (2.34%)

13.00 ± 5.00

40.7 ± 4.6

C

3 (2.34%)

4.00 ± 0.58

17.3 ± 2.7

1 (0.78%)

8.00 ± 0.00

25.0 ± 0.0

D

12 (6.67%)

4.17 ± 0.34

9.8 ± 1.6

4 (3.12%)

7.00 ± 3.67

30.4 ± 3.8

E

0 (0.00%)

N/A

N/A

9 (7.03%)

11.56 ± 1.32

39.8 ± 2.3

Discussion

From the current study, we can conclude that active immunization of piglets against PWD caused by F4-ETEC performed at an acceptable level as compared to the standard approach under field conditions with addition of 3,000 ppm ZnO during the first 14 days post-weaning. Although average individual piglet weight at 22 days post-weaning was significantly lower as compared to the ZnO-supplemented group (E), piglets vaccinated with the E. coli F4 vaccine were numerically heavier (1.0 to 1.4 kg extra) at the end of the nursery period (d50). Under field conditions, an extra kg of piglet weight during the nursery period is considered to result in at least 2-3 kg extra weight during the fattening period. This implies earlier slaughter at the same weight or heavier fattening pigs at the same slaughter age. Both scenarios mean economic benefit to the swine farmer. Average daily weight gain behaved in the same trend, although the ADWG for period 2 (22-50 d) was significantly lower in the ZnO-supplemented group (E). Under field conditions, most farmers only have access to start and end-point data related to post-weaning performances, therefore the significantly higher mid-term performance in the ZnO-supplemented group (E) is not considered relevant to practice. Nevertheless, the higher weight and better ADWG indicate that piglets supplemented with ZnO at 3,000 ppm for 14 days post-weaning might have a stable intestinal integrity and pathogenic E. coli bacteria have less impact on the performance of these piglets during the early post-weaning phase [30]. However, CVMP has recently decided that the use of ZnO in post-weaning diets should be phased out the latest by 2022 throughout the EU [31]. Therefore, alternative approaches to control PWD due to pathogenic E. coli should be explored. Several alternative strategies, such as adapted nutritional strategies (feed  consistency,  lower  crude protein, digestible fibers and other dietary fibers), prebiotics, probiotics, organic acids, MCFAs, specific IgA antibodies and oral vaccination have been explored [19-29,33,34,37-40].

In the current study, a nutraceutical approach, including a mixture of MCFAs, organic acids and additional fiber, was evaluated. Although performance parameters (weight, ADWG and FCR) were in line with the E. coli vaccinated groups and supplementation of ZnO, other parameters related to health (pen FCS, mortality and TI50) were significantly worse, indicating this approach did not provide as much
protection as ZnO supplementation or E. coli F4 vaccination. Indeed, intestinal pathogens have many different mechanisms to interact with the host, which makes complete inhibition of their pathogenesis through specific feed additives or a combination of these additives quite challenging [21,41].

Recently, vaccination with a live non-pathogenic E. coli F4 or E. coli F4 and F18 vaccine has demonstrated efficacy against PWD due to F4-ETEC, and F4- and F18-ETEC [33,34]. Immunization against the F4- and F18-ETEC pathogens resulted in decreased severity and duration of PWD clinical signs and fecal shedding of F4- and F18- ETEC [33,34]. Moreover, increased weight gain was demonstrated  in piglets vaccinated with E. coli F4 vaccine [33]. Our results are in line with these observations, indicating that feeding regime (1-, 2-  or 3-phase feeding strategy) had no impact on results induced by immunization with an E. coli F4 vaccine under field conditions. This implies that farms suffering from PWD due to F4-ETEC do not have to alter their specific feeding strategy. This is an advantage, since in most cases there are limitations in the number of available feed bins for the on-farm post-weaning facilities. From an economical point of view, however, 3-phase feeding strategies provide optimal performance parameters related to FCR.

As expected, supplementation of ZnO resulted in the lowest pen FCS and TI50 although time to maximal fecal clinical score did not differ among treatment groups. Nevertheless, from 14 days post-weaning onwards, at removal of the ZnO from the feed, pen FCS increased again, in contrast to the other groups, where pen FCS remained stable during that specific period. In practice, this phenomenon is referred to as ‘post-ZnO diarrhea’ and sometimes even needs antibiotic treatment to control. E. coli vaccinated piglets had similar pen FCS and GCS, which remain important evaluation parameters in practice, due to lack of many other directly available data for evaluation of preventive or clinical interventions to prevent or control PWD due to E. coli.

Another important evaluation parameter to assess the success of different intervention strategies in relation to PWD due to E. coli is mortality [33]. Mortality data were different among treatment groups, with acceptable levels (3.12 to 4.69%) in E. coli vaccinated piglets, and much higher levels of 7.03% to 12.5% in ZnO-supplemented and nutraceutical-supplemented groups, respectively. Analysis of mortality data per period showed early death in the nutraceutical- supplemented piglets, whereas ZnO-supplemented piglets died much later during the post-weaning period, i.e. after the removal of ZnO  at 14 days post-weaning. In the E. coli vaccinated piglets, mortality was more equally distributed throughout the entire study period and significantly lower as compared to both other alternative treatments (nutraceutical- and ZnO-supplementation).

In conclusion, the present study demonstrated the efficacy of an oral live non-pathogenic E. coli F4 vaccine (Coliprotec®   F4; Elanco) for active immunization of piglets against PWD due to F4-ETEC. Different feeding strategies had no significant impact on the clinical outcome and performance parameters of these vaccinated piglets. In many parameters, E. coli vaccination performed equally or better as compared to the ZnO- supplemented group. However, this approach is no longer future-proof due to EU-regulations on total ban of ZnO by 2022. Therefore, E. coli vaccination could be one of the preventive options to protect piglets against PWD due to E. coli in the near future. In contrast, the alternative strategy combining MCFAs, organic acids and additional fibers resulted in significant clinical diarrhea and mortality, requiring additional antibiotic treatment to control the disease. Nevertheless, in the nutraceutical-supplemented group, other performance parameters were similar to E. coli vaccination or ZnO supplementation.

Acknowledgements

The authors greatly acknowledge the technical staff of Innsolpigs (Aalter) for their assistance in randomization, weighing and data collection.

Declarations

Ethics approval and consent to participate: Field trial with Veterinary Medicinal Product approved for use in swine. No additional ethical approval needed. Consent to participate was obtained following full information of farmer on the protocol to be carried out.

Consent for publication: Not applicable.

Availability of data and material: The datasets analysed during the current study are available from the corresponding author on reasonable request.

Competing interests: The authors declare that they have no competing interests.

Author’s contributions: FV coordinated the entire study from study design to data collection and analysis to the manuscript. OT was involved in data analysis and manuscript preparation. All authors read and approved the final manuscript.

Acknowledgements: The author greatly acknowledges the swine farmer and his swine veterinarian participating in the study.

Author’s information: FV is currently a Sr. Technical Advisor Swine for Benelux / UK&ROI within Elanco Animal Health. He holds a DVM, a Master in Veterinary Public Health and Food Safety, a PhD in Veterinary Sciences and a PhD in Applied Biological Sciences, oxide and is a Diplomate in the European College of Porcine Health Management. He has a specific interest in swine intestinal health  and the specific approach to improve intestinal health through non- antibiotic solutions.

Abbreviations

AUC: area under the curve

CVMP: Committee for Veterinary Medicinal Products

ETEC: enterotoxigenic Escherichia coli

EU: European Union

FCS: fecal clinical score

GCS: general clinical score

LT: heat-labile toxin

MCFAs: medium chain fatty acids

ppm: parts per million

PWD: post-weaning diarrhea:

STa: heat-stabile toxin a

STb: heat-stabile toxin b

Stx2e: shiga-toxin 2e

ZnO: zinc oxide

References

  1. Fairbrother JM, Nadeau É, Gyles CL (2005) Escherichia coli in postweaning diarrhea in pigs: an update on bacterial types, pathogenesis, and prevention strategies. Anim Heal Res Rev 6:17-39. [crossref]
  2. Hoa NX, Kalhoro DH, Lu C (2013) Distribution of serogroups and virulence genes of E. coli strains isolated from porcine post weaning diarrhea in Thua Thien Hue province Vietnam. Tạp chí Công ngh Sinh học 11:665-672. [crossref]
  3. Lyutskanov M (2011) Epidemiological characteristics of post-weaning diarrhea associated with toxin-producing Escherichia coli in large intensive pig farms. Trakia J Sci 9:68-73.
  4. Svensmark B, Jorsal SE, Nielsen K, Willeberg P (1989) Epidemiological studies of piglet diarrhoea in intensively managed Danish sow herds. I. Pre-weaning diarrhoea. Acta Vet Scand 30:43-53. [crossref]
  5. Svensmark B, Nielsen K, Willeberg P, Jorsal SE (1989) Epidemiological studies of piglet diarrhea in intensively managed Danish sow herds. II. Post-weaning diarrhea. Acta Vet Scand 30:55-62. [crossref]
  6. Tubbs RC, Hurd HS, Dargatz D, Hill G (1993) Preweaning morbidity and mortality in the United States swine herd. Swine Heal Prod 1:21-28.
  7. USDA. Part II. Reference of Swine Health and Health Management in the United States, 2000. USDA:APHIS:VS, CEAH, National Animal Health Monitoring System, Fort Collins, CO. 2002;vol. #N355.0202.
  8. Zhang W, Zhao M, Ruesch L, Omot A, Francis D (2007) Prevalence of virulence genes in Escherichia coli strains recently isolated from young pigs with diarrhea in the US. Vet Microbiol 123:145-152. [crossref]
  9. Fairbrother JM, Gyles CL (2012) Chapter 53: Colibacillosis. In: Diseases of Swine. 10th Edition. Eds. Zimmerman JJ, Karriker LA, Ramirez A, Schwartz KJ, Stevenson GW. Wiley-Blackwell. p. 723-749.
  10. Chen X, Gao S, Jiao X, Liu XF (2004) Prevalence of serogroups and virulence factors of Escherichia coli strains isolated from pigs with postweaning diarrhoea in eastern China. Vet Microbiol 103:13-20. [crossref]
  11. Frydendahl K (2002) Prevalence of serogroups and virulence genes in Escherichia coli associated with postweaning diarrhoea and edema disease in pigs and a comparison of diagnostic approaches. Vet Microbiol 85:169-182. [crossref]
  12. Luppi A, Gibellini M., Gin T,  Vangroenweghe F,  Vandenbroucke  V,  Bauerfeind   R, Bonilauri P, Labarque G, Hidalgo Á (2016) Prevalence of virulence factors in enterotoxigenic Escherichia coli isolated from pigs with post-weaning diarrhea in Europe. Porcine Health Manag 2:20-25. [crossref]
  13. Vu-Khac H, Holoda E, Pilipcinec E, Blanco M, Blanco JE, Mora A, Dahbi G, Lopéz C, González EA, Blanco J (2006) Serotypes, virulence genes, and PFGE profiles of Escherichia coli isolated from pigs with postweaning diarrhoea in Slovakia. BMC Vet Res 2:13-20. [crossref]
  14. Abraham S, Trott DJ, Jordan D, Gordon DM, Groves MD, Fairbrother JM, Smith MG, Zhang R, Chapman TA (2014) Phylogenetic and molecular insights into the evolution of multidrug-resistant porcine enterotoxigenic Escherichia coli in Australia. Int J Antimicrob Agents 44:105–111. [crossref]
  15. Abraham S, Jordan D, Wong HS, Johnson JR, Toleman MA, Wakeham DL, Gorden DM, Turnidge JD, Mollinger JL, Gibson JS, Trott DJ (2015) First detection of extended-spectrum cephalosporin- and fluoroquinoloneresistant Escherichia coli in Australian food-producing animals. J Glob Antimicrob Resist 3:273-277.
  16. Boyen F, Vangroenweghe F, Butaye P, De Graef E, Castryck F, Heylen P, Vanrobaeys M, Haesebrouck F (2010) Disk prediffusion is a reliable method for testing colistin susceptibilitys in porcine E. coli strains. Vet Microbiol 144:359-362. [crossref]
  17. Jahanbakhsh S, Smith MG, Kohan-Ghadr HR, Letellier A, Abraham S, Trott DJ, Fairbrother JM (2016) Dynamics of extended-spectrum cephalosporin resistance   in pathogenic Escherichia coli isolated from diseased pigs in Quebec, Canada. Int J Antimicrob Agents 48:194-202. [crossref]
  18. Luppi A, Bonilauri P, Dottori M, Gherpelli Y, Biasi G, Merialdi G, Maioli G, Martelli P (2013) Antimicrobial resistance of F4+ Escherichia coli isolated from swine in Italy. Transbound Emerg Dis 62:67–71. [crossref]
  19. Jha R, Berrocoso JD (2015) Review: dietary fiber utilization and its effects on physiological functions and gut health of swine. Animal 9:1441-1452. [crossref]
  20. Jha R, Berrocoso JFD (2016) Dietary fiber and protein fermentation in the intestine of swine and their interactive effects on gut health and on the environment: a review. Anim Feed Sci Technol 212:18-26.
  21. Tran THT, Everaert N, Bindelle J (2018) Review on the effects of potential prebiotics on controlling intestinal enteropathogens Salmonella and Escherichia coli in pig production. J Anim Physiol Anim Nutr (Berl) 102:17-32. [crossref]
  22. Heo JM, Kim JC, Hansen CF, Mullan BP, Hampson DJ, Pluske JR (2009) Feeding  a diet with decreased protein content  reduces  indices  of  protein  fermentation  and the incidence of postweaning diarrhea in weand piglets challenged with an enterotoxigenic strain of Escherichia coli. J Anim Sci 87:2833-2843. [crossref]
  23. Hermes RG, Molist F, Ywazaki M, Nofrarias M, Gomes de Segura A, Gasa J, Pérez JF (2009) Effect of dietary level of protein and fiber on the productive performance and health status of piglets. J Anim Sci ;87:3569-3577. [crossref]
  24. Pieper R, Villodre Tudela C, Taciak M, Bindelle J, Pérez JF, Zentek J (2016) Health relevance of intestinal protein fermentation in young pigs. Anim Health Resh Rev 17:137-147. [crossref]
  25. Bikker P, Dirkzwager A, Fledderus J, Trevisi P, le Huërou-Luron I, Lallès JP, Awati A (2006) The effect of dietary protein and fermentable carbohydrates levels on growth performance and intestinal characteristics in newly weaned piglets. J Anim Sci 84:3337-3345. [crossref]
  26. Mikkelsen LL, Naughton PJ, Hedemann MS, Jensen BB (2004) Effects of physical properties of feed on microbial ecology and survival of Salmonella enterica Serovar Typhimurium in the pig gastro-intestinal tract. Appl Environ Microbiol 70:3485-3492. [crossref]
  27. Htoo JK, Araiza BA, Sauer WC, Rademacher M, Zhang Y, Cervantes M, Zijlstra RT (2007) Effect of dietary protein content on ileal amino acid digestibility, growth, performance, and formation of microbial metabolites in ileal and cecal digesta of early-weaning pigs. J Anim Sci 85:3303-3312. [crossref]
  28. Escobar Garcia K, Reis de Souza TC, Mariscal Landin G, Aguilera Barreyro A, Guadalupe Bernal Santos M, Guadalupe Gomez Soto J (2014) Microbial fermentation patterns, diarrhea incidence and performance in weaned piglets fed a low protein diet supplemented with probiotics. Food Nutr Sci 5:1776-1786.
  29. Zentek J, Buchheit-Renko S, Männer K, Pieper R, Vahjen W (2012) Intestinal concentrations of free and encapsulated dietary medium-chain fatty acids and effects on gastric microbial ecology and bacterial metabolic products in the digestive tract of piglets. Arch Anim Nutr 66:14-26. [crossref]
  30. Poulsen HD (1995) Zinc oxide for weanling pigs. Acta Agric Scand 45:159-165.
  31. European Medicinal Agency (2017) Questions and answers on veterinary medicinal products containing zinc oxide to be administered orally to food producing species. Outcome of a referral procedure under Article 35 of Directive 2001/82/EC (EMEA/ V/A/118). EMA/394961/2017.
  32. Melkebeek V, Goddeeris BM, Cox E (2013) ETEC vaccination in pigs. Vet Immunol Immunopathol 152:37-42. [crossref]
  33. Fairbrother JM, Nadeau E., Bélanger L, Tremblay C-L, Tremblay D, Brunelle M, Wolf R, Hellmann K, Hidalgo A (2017) Immunogenicity and protective efficacy of a single-dose live non-pathogenic Escherichia coli oral vaccine against F4-positive enterotoxigenic Escherichia coli challenge in pigs. Vaccine 35:353-360. [crossref]
  34. Nadeau E, Fairbrother JM, Zentek J, Bélanger L, Tremblay D, Tremblay C-L, Röhe I, Vahjen W, Brunelle M, Hellmann K, Cvejíc D, Brunner B, Schneider C, Bauer K, Wolf R, Hidalgo A (2017) Efficacy of a single oral dose of a live bivalent E. coli vaccine against post-weaning diarrhea due to F4 and F18-positive enterotoxigenic E. coli. Vet J 226:32-39. [crossref]
  35. Vangroenweghe F, Suls L, Van Driessche E, Maes D, De Graef E (2012) Health advantages of transition to batch management system in farrow-to-finish pig herds. Veterinarni Medicina, 57:83-91.
  36. Casey TA, Bosworth BT (2009) Design and evaluation of a multiplex polymerase chain reaction assay for the simultaneous identification of genes for nine different virulence factors associated with Escherichia coli that cause diarrhea and edema disease in swine. J Vet Diagn Invest 21:25–30. [crossref]
  37. Delisle B, Calinescu C, Mateescu MA, Fairbrother JM, Nadeau É (2012) Oral immunization with F4 fimbriae and CpG formulated with Carboxymethyl Starch enhances F4-specific mucosal immune response and modulates Th1 and Th2 cytokines in weaned pigs. J Pharm Pharm Sci 5:642-656. [crossref]
  38. Nguyen UV, Melkebeek V, Devriendt B, Goetstouwers T, Van Poucke M, Peelman L, Goddeeris BM, Cox E (2015) Maternal immunity enhances systemic recall immune responses upon oral immunization of piglets with F4 fimbriae. Vet Res 46:72-79. [crossref]
  39. Rutter JM, Jones GW (1973) Protection against enteric disease caused by Escherichia coli—a model for vaccination with a virulence determinant? Nature 242:531-532. [crossref]
  40. Virdi V, Palaci J, Laukens B, Ryckaert S, Cox E, Vanderbeke E, Depicker A, Callewaert N (2019) Yeast-secreted, dried and food-admixed monomeric IgA prevents gastrointestinal infection in a piglet model. Nat Biotechnol. 37:527–530. [crossref]
  41. Daudeling J-F, Lessard M, Beaudoin F, Nadeau E, Bissonnette N, Boutin Y, BrousseauJ-P, Lauzon K, Fairbrother JM (2011) Administration of probiotics influences F4 (K88)-positive enterotoxigenic Escherichia coli attachment and intestinal cytokine expression in weaned pigs. Vet Res 42:69-79. [crossref]

Operational and Clinical Implementation Plan for an Anesthesiologist-Led Coronavirus-2019 Hospital “SWAT” Team

DOI: 10.31038/IJAS.2020111

Abstract

One unique facet of the COVID 19 pandemic is the patient surges that deplete hospitals and hospital systems of critical resources such as equipment, medications, and personnel.Addressing such a surge in patients with coronavirus 2019 (COVID-19) has proven to be challenging in many countries, including in the United States.To prepare for the surge of COVID-19 infected patients in the hospital setting, complex operational preparation plans were enacted with the Kaiser Permanente Southern California Kaiser Health System.Critical care units and emergency departments were identified as venues needing the most assistance.Due to the anticipated cancellation of all elective surgeries, anesthesiologists were identified as an ideal available physician pool for redeployment to these patient care areas.Anesthesiologists have intensive care training in their residencies, and they have expertise performing procedures such as intubation, central line placement, and arterial line placement that are needed to monitor and treat COVID 19 patients.Accordingly, an anesthesiologist led team comprised of physicians and certified nurse anesthetists was developed and named “Special Weapons And Tactics” (SWAT) team.The COVID-19 SWAT response team provided multi-disciplinary clinical consultation, airway management and insertion of invasive catheters for COVID-19 patients in intensive care units, emergency departments, and/or other sectors. The utilization of SWAT teams is one way to maximize operations during a resource strapped event such as the current COVID-19 pandemic and serves as one model to deliver a highly synergistic care delivery for this dynamic and complex pandemic.

Keywords

COVID-19, Pandemic, Anesthesiologist, SWAT team, Surge planning

Introduction

The coronavirus 2019 (COVID-19) pandemic has impacted over 150 countries around the world and has resulted in a global health care crisis [1]. The United States has become one of the most impacted countries and based on most recent CDC data, 12% of COVID-19 patients require hospitalization and 7% require admission to intensive care unit (ICU) [2]. Once in the ICU, patients’ respiratory status can rapidly deteriorate requiring intubation [3]. The sheer number of COVID-19 patients arriving in the ICU has, in many cases, overwhelmed institutional resources, including those of critical care physician intensivists, nurses (RN) and specialist staff who are already working at maximal levels.

The original SWAT teams were created by Los Angeles Police Department inspector Daryl Gates; he first envisioned “SWAT” as an acronym for “Special Weapons Attack Team” in 1967, but later accepted “Special Weapons And Tactics” on the advice of his deputy chief, Edward M. Davis. Many governmental and health care officials have stated that the COVID-19 pandemic is a war against an invisible enemy being fought by our front-line health care providers. In an effort to provide coordinated assistance, an operational and clinical care plan was devised and implemented to facilitate an anesthesiologist-led “SWAT” team to deliver complex problem-solving capabilities, provide requisite airway management (i.e. intubation), as well as placement of invasive arterial and central venous access for COVID-19 patients in ICUs and Emergency Departments (ED). No subjects were utilized in this clinical innovation, and Institutional Review Board approval was not required.

Clinical Care Innovation

Delivery of coordinated services in multiple sectors for airway management and placement of invasive catheters by a physician-led anesthesiology SWAT team requires a vast amount of planning that must be facilitated by each respective medical center or temporary medical field hospital through complex infrastructure and logistical operations. Considerations included the pool of available anesthesiologists, nurse anesthetists and anesthesiology technologists per day who were not utilized in the operating room for emergent and urgent cases, the number of COVID 19 designated ICU beds in our hospital, and the number of patients undergoing care in the ED.Additionally, surge estimation projections were factored into the manpower and logistics models.Within the southern California Kaiser Permanente Health (KPH) system, every individual Kaiser Permanente hospital ascertained its needs for supplemental physician and healthcare providers based upon suspected or confirmed COVID-19 patient assessment.For our tertiary care hospital integrated in this medical system, the SWAT team was designated the best structure.

SWAT team structure: After a thorough review of the clinical needs in the ICU and ED, the department of anesthesia determined that the anesthesiologist-led SWAT team would be composed of three members: 1) a physician anesthesiologist (MDA) 2) a Certified Registered Nurse Anesthetist (CRNA) or another MDA and 3) an Anesthesiology Technologist (AT).A minimum of one SWAT team was assigned per day based on overall demand for services 24 hours-a-day/7 days-a-week; however, additional teams were added based on surge projection modeling and subsequent opening of more ICUs exclusively designated for the care of COVID-19 patients.In KPH system, the team was assigned to the entire hospital, but in other hospitals the team(s) could be assigned to a specific sector (i.e. ICU, ED), field hospital or temporary triage area) or work jointly in sequence covering areas as consultations are requested. In the KPH system, SWAT teams were designed as Alpha, Bravo, Charlie, Delta. Each team member was given a cell phone and beeper, and all beepers were synced to deploy simultaneously. Each SWAT team was assigned to one 12-hour shift per day allow for optimal performance without undue fatigue or burn-out of team members.

SWAT team work flow:A major tenet in the SWAT structure is to support each team member to optimize team performance and cohesion through open communication channels. Daily briefing and group “huddles” were coordinated at the beginning and end of every SWAT team shift (i.e. 0700, 1900) and occurred in the anesthesiology workroom. After the 0700 morning huddle, the SWAT team(s) would participate in clinical rounds with the entire ICU staff (physicians, nurses, respiratory therapists, other specialists) to determine which COVID-19 infected patients may likely require interventions, as well as to plan the timing of any necessary procedures by the SWAT team. The evening SWAT team would round with the ICU staff at 2300. For unplanned or emergency services, the ICU intensivist, hospitalist or ED physician would page the team for immediate response.

SWAT teams maintain constant communication to ensure availability, therefore, if one SWAT team is performing a procedure, the other team would be alerted to be readily available immediately to assist in the event of a critical event. Intubation and procedure kits were pre-assembled in “GO BAGS” for immediate “grab and go” functionality. When the SWAT team was called for intubation or procedures, the MDA would communicate directly with the ICU Medical Doctor (MD) to place sedation, ventilator, and restraint orders into Electronic Medical Record (EMR).The SWAT team would communicate with the primary nurse (RN) before starting any procedure(s) so that the RN could prepare sedation medications or perform additional tasks. The ICU RN should also be in the patient room assisting the SWAT team the entire time during procedural interventions. If time permits, a patient safety briefing (Table 1) with anesthesia SWAT team, RN, and RT was done prior to entering room. Donning and doffing protective equipment was performed with an established spotter – either the CRNA or AT. The spotter must pay close attention during entire procedure and act as a safety agent for both the provider(s) and patient to avoid any breaches in protocol. At the end of procedure(s), close loop with ICU MD, and inform the RN and MD of any issues, medications given or other notable events. At end of shift, get update from ICU MD and sign out to SWAT team MDA.

Table 1. “Time-Out” Safety Check Briefing Checklist.

If time permits, perform a pre-procedure time-out led by anesthesiologist.

• Introductions & Roles

• MD

• CRNA (or MD #2)

• Spotter (anesthesiology technologist) confirm easy visibility with monitor and team

• ICU nurse

• Respiratory therapist

• Confirm correct patient, procedure (s) to be done, necessary equipment inside of room for procedure (s), and orders placed in electronic medical record (if patient condition allows).

• Intubation

• Central venous catheter insertion (anticipated site)

• Arterial catheter

• Oral gastric tube

• Ventilator ready on standby

• Sedation ready on standby

• Patient review

• Code status

• Allergies

• Past Medical History (cardio-pulmonary status, renal function, pertinent labs)

• Potential airway issues

• Confirm functional intravenous access

• Hemodynamics and anticipated need for vasopressors

• Plan for airway management

• Confirm working bag-mask ventilation and suction readily available at head-of-bed.

• Primary intubation plan and backup plan(s); fiberoptic, bougies, etc.

• Induction drugs.

• Confirm pre-oxygenation.

• Designate repositioning help once induced.

• Location of nearest crash cart if necessary.

Table 2. SWAT Team Performance Enhancement Synergy.

OPEN LOOP COMMUNICATIONamong all SWAT teamsis key.

• Define and maintain specific roles prior to entering patient room to ensure optimal performance and maximize safety.

• Always work in groups of 3 anesthesia providers (2 inside room and 1 outside monitoring patient/administering medications)

• SWAT team(s) should attend rounds in each sector where services for COVID-19 patients will be needed (i.e. ICU, ED).

• Time procedures to ensure that ancillary support is available, as well as to coincide when patients are in supine position to facilitate procedures.

• Identify issues for patient care improvement during rounds (i.e. pressure ulcers, face protection, sedation protocols, safety issues) related to perioperative anesthesia expertise.

• Encourage multi-disciplinary problem solving with other knowledgeable providers (i.e. physician and nursing specialists) from any and all sectors.

• End each shift with debriefing and close communication channels to ensure planning for next SWAT team.

• Debriefing with stakeholders from other sectors.

• Identify any potential deficiencies or obstacles and notify appropriate executive channels for support.

Supply coordination: Due to the need for a wide variety of anesthesiology and procedural supplies, designated areas were partitioned in the various clinical sectors (i.e. ICU, ED). Set-up and inventory control is the responsibility of the anesthesiology technologist. Figure 1 demonstrates the supply set-up area with the necessary supplies.When providing direct care to COVID-19 patients, each team member was equipped with a purified air purifying respirator (PAPR) and full personal protective equipment (PPE). PAPRs were placed in locked orange tackles boxes and designed for each SWAT team member. Designated showers for decontamination at end of shift were also provided for all COVID-19 health care providers.

IJAS-1-1-101-g001

Figure 1. Designated secure area in intensive care unit and emergency department for anesthesia SWAT team supplies. (1) Cart: sterile towels, sterile gloves, central venous catheters (cordis, dialysis catheters); (2) Anesthesia portable cart with full array of medications, syringes, tubing, fluids;( 3) clean Mayo stand with clear waste bag; (4) Portable video laryngoscope screen (5) Ultrasound machine; (6) Black cart for clean products with “GO BAGS” underneath (7) Linens.

Discussion

The COVID-19 pandemic has created a major disruption in day-to-day care and necessitates emergency coordination of multidisciplinary teams to optimize patient outcome, minimize physician burnout, and improve operations.The use of SWAT teams in medicine have been widely employed to maximize clinical medical mission readiness and effectiveness during disasters [4-7]. The mission of combat/military SWAT is to save lives, and the primary focus of SWAT is to provide tactical solutions that increases the likelihood of de-escalation and safe resolution of high-risk incidents. In the medical setting, we organized our anesthesiologist-led SWAT team around three core concepts. The first was command control — an anesthesiologist led the team, fielded all consultations, ascertained medical history, ordered pertinent studies pre-procedure as needed, and performed procedures with help of a Certified Nurse Anesthetist (CRNA) and anesthesia technician.The second was containment of risk –the team employed a checklist to ensure appropriate and safe donning and doffing of protective patient equipment PPE with a spotter to ensure actions were performed without self-contamination.The third was rescue– for example, the resuscitation of the patient from respiratory distress via intubation. Therefore, SWAT concepts can be translated and adapted during a pandemic situation that requires multiple layers of operations, logistics and expertise for optimal management [8]. The various steps in the implementation and execution of an anesthesiologist led SWAT team.SWAT team protocols make use of checklists to ensure uniform standards, ensure 24/7 readiness, and maximize provider and patient safety. Additionally, the SWAT team structure can be expanded or tailored based upon a facility’s need, size or geographic footprint.

The implementation of an anesthesiologist-led SWAT team reduces the work burden for ICU personnel.As the course of critically ill COVID-19 requires relatively long-term care in the ICU, physician intensivists, nurses, and respiratory therapists may experience burn-out along with their own respective manpower shortages. The anesthesiologist-led SWAT team alleviates the strain of performing complex procedures on critically ill patients.Airway manipulation of patients infected with COVID-19 can be potentially hazardous to any healthcare providers and warrants a high degree of expertise and precautions [9-12]. As airway and invasive monitor experts, an anesthesiologist-led SWAT team employs the principles of in-depth knowledge, training, insight and preparation for duty in highly hazardous clinical settings. The utilization of a SWAT team is a manpower-efficient method of delivering care in resource constrained settings, especially given that a majority of anesthesia providers will have increased availability to due to mandatory cancellation of elective surgical procedures during the COVID-19 pandemic. Appropriate Personal Protective Equipment (PPE) should always follow up-to-date recommendations as set forth by the Centers for Disease Control and Prevention in conjunction with clinical guidelines issued jointly by the American Society of Anesthesiologists, Anesthesia Patient Safety Foundation and American Association of Nurse Anesthetists [2, 13-15].

The fiscal impact of anesthesiologist-led SWAT team implementation is variable and highly dependent upon the overall employment model utilized for anesthesia care providers. In non-salaried health care provider environments (i.e. private practice “fee-for-service’), the fiscal impact of SWAT team costs may be borne out by billing 3rd party payors for procedural relative value units, and/or through hospital stipends derived from state and federal subsidies provided to hospitals for management of COVID-19 patients during a national state of emergency. In academic practices or single- or multi-specialty salaried physician groups, the reallocation of health care providers to meaningful work assignments defrays the fixed costs of personnel who would otherwise not have any work to perform. Work performed in distressed situations beyond ordinary duty may possible quality for “hazard pay,” and state/federal laws govern this area. SWAT teams enable organized and coordinated provision of critical care services during distressed periods associated with rapidly arising scenario that may last a short or long-term period.

In conclusion, the utilization of an anesthesiologist-led SWAT team is a clinical innovation that is ideally suited to assist during the COVID-19 pandemic. The operational implementation plan described can be utilized in traditional tertiary care medical centers, temporary “field hospitals” or ambulatory surgery centers. In addition to the technical arsenal within our scope of practice, anesthesiologists, nurse anesthetists and anesthesiology technologists bring great insight and problem-solving capabilities to sectors that do not routinely interface with anesthesia providers. Multi-disciplinary teamwork allows a multitude of practitioners to use their expertise to handle a complex pandemic such as COVID-19.

References

  1. https://www.who.int/emergencies/diseases/novel-coronavirus-2019/situation-reports.
  2. https://www.cdc.gov/coronavirus/2019-ncov/index.html.
  3. Zhou F, Yu T, Du R, Fan G, Liu Y, et al. (2020) Clinical course and risk factors for mortality of adult inpatients with COVID-19 in Wuhan, China: a retrospective cohort study. The Lancet. [Crossref]
  4. Heiskell LE, Carmona RH (1994) Tactical emergency medical services: an emerging subspecialty of emergency medicine. Annals of Emergency Medicine 23:778-785.
  5. Jones JS, Reese K, Kenepp G, Krohmer J (1996) Into the fray: integration of emergency medical services and special weapons and tactics (SWAT) teams. Prehospital and Disaster Medicine 11:202-206. [Crossref]
  6. Yeskey KS, Llewellyn CH, Vayer JS (1996) Operational medicine in disasters. Emergency Medicine Clinics 14:429-438.
  7. McArdle DQ, Rasumoff D, Kolman J (1992) Integration of emergency medical services and special weapons and tactics (SWAT) teams: the emergence of the tactically trained medic. Prehospital and Disaster Medicine 7:285-288.
  8. https://post.ca.gov/Portals/0/post_docs/publications/SWAT-2019.pdf.
  9. Cheung JC-H, Ho LT, Cheng JV, Cham EYK, Lam KN (2020) Staff safety during emergency airway management for COVID-19 in Hong Kong. The Lancet Respiratory Medicine8. [Crossref]
  10. Brewster DJ, Chrimes NC, Do TB, Fraser K, Groombridge CJ, et al. (2020) Consensus statement: Safe Airway Society principles of airway management and tracheal intubation specific to the COVID-19 adult patient group. The Medical journal of Australia 212:1. [Crossref]
  11. Chen X, Shang Y, Yao S, Liu R, Liu H (2020) Perioperative care provider’s considerations in managing patients with the COVID-19 infections.TranslPerioper Pain Med7:216-223.
  12. Ng K, Poon BH, Puar THK, Quah JLS, Loh WJ, et al. (2020) COVID-19 and the risk to health care workers: a case report. Annals of Internal Medicine. [Crossref]
  13. https://www.asahq.org/in-the-spotlight/coronavirus-covid-19-information.
  14. https://www.apsf.org/covid-19-and-anesthesia-faq/.
  15. Learn A (2020) AANA, ASA, APSF and AAAA Issue Joint Statement on Use of Personal Protective EquipmentDuring COVID-19 Pandemic.

In Vitro and Intracellular Activities of Omadacycline against Staphylococcus aureus Isolates

DOI: 10.31038/IMROJ.2020524

Abstract

Purpose: Omadacycline is a once-daily Intravenous (IV) and oral aminomethylcycline antibiotic that exhibits in vitro activity against Gram-positive and Gram-negative aerobes, anaerobes and atypical bacteria including many drug-resistant strains. This study investigated the in vitro activity of omadacycline and comparators against 239 resistant Staphylococcus aureus strains.

Methods: The in vitro activity of omadacycline and comparators was tested against S. aureus strains including methicillin-resistant (mecA), macrolide-resistant (ermA, B or C) and ciprofloxacin-resistant (gyrA and parC) isolates. In addition, the intracellular human monocyte activity of omadacycline and comparators was determined against ATCC S. aureus strains.

Results: Against all resistant strains of S. aureus, the in vitro activity of omadacycline (MIC90 0.25 mg/L) was lower than that of other tested antibiotics. Bactericidal activity, defined as a mean growth reduction of ≥3 log10 CFU/mL (≥99.9%), was attained at 24 hours of antibiotic exposure with omadacycline, ceftaroline, levofloxacin, and moxifloxacin at extracellular MICs increasing from 1X MIC to 16X MIC against both Methicillin-Sensitive (MSSA) and Resistant (MRSA) strains of S. aureus. Mean intracellular growth reduction of ≥2 log10 CFU/mL (≥99%) was achieved at 24 hours by omadacycline, levofloxacin, and moxifloxacin at MICs increasing from 2X to 16X MIC against intracellular S. aureus strains (MSSA and MRSA).

Conclusion: Based on the results of this study, omadacycline exhibits potent extracellular and intracellular activity against S. aureus isolates including methicillin- and ciprofloxacin-resistant strains.

Keywords

Omadacycline, Staphylococcus aureus, MIC, Intracellular activity, Tetracycline

Introduction

Staphylococcus aureus is a frequent cause of serious bacterial infections worldwide [1,2]. Skin and skin structure infections have increased in recent years, and the most frequent bacteria were S. aureusor other Gram-positive bacteria [2,3]. Effective management of serious skin infections often is complicated by antibiotic resistance, in particular Methicillin-Resistant Staphylococcus Aureus (MRSA), which accounts for nearly half of all isolates from skin and skin structure infections in the United States [4]. Community-Acquired Pneumonia (CAP) is the most common infectious disease leading to hospitalization and mortality among all age groups, especially the elderly [5, 6]. While S. aureus only is isolated in approximately 2% of cases of CAP, identification of S. aureus as a cause of CAP is associated with poor outcomes and increased mortality [1] and has been reported to be the cause of co-infection in 39%-45% of patients hospitalized with influenza [7].

Infections due to S. aureus often are slow to respond to antibiotics with frequent recurrences and higher mortality [8]. While often thought of as an extracellular pathogen, with inherent problems of antibiotic resistance, new evidence indicates that S. aureus is a facultative intracellular pathogen [8,9], and the combination of antibiotic-resistance and intracellular activity can result in incomplete eradication of S. aureus even with recommended treatment. Intracellular antimicrobial activity may be markedly impaired compared to in vitro activity observed in broth or extracellular media. Thus, assessing both the intracellular and extracellular activity of antibiotics against S. aureus is essential to fully characterize its potential use to treat infections.

Omadacycline, a novel once-daily Intravenous (IV) and oral aminomethylcycline antibiotic, is a semisynthetic tetracycline derivative that exhibits in vitro activity against a range of Gram-positive and Gram-negative aerobes, anaerobes, and atypical bacteria [10,11]. In vitro and in vivo studies demonstrated that omadacycline circumvents the efflux and ribosomal protection mechanisms of tetracycline resistance and has activity against pathogens common in community-acquired infections, including MRSA [12-14]. In addition, evidence from healthy subjects showed that alveolar cell concentrations of omadacycline exceeded plasma concentrations [15].

This study investigated the in vitro activity of omadacycline and comparators against 239 resistant S. aureus including methicillin-resistant (mecA), macrolide-resistant (ermA, B or C) and ciprofloxacin-resistant (gyrA and parC) strains. In addition, the extracellular and intracellular human monocyte activity of omadacycline and comparators against a variety of ATCC S. aureus strains including drug-resistant isolates was determined.

Methods

Drugs

Standard antimicrobial reference powders were provided by the following sources: omadacycline (Lot #CA16-0193) from CarbogenAmcis AG, Bubendorf, Switzerland; ceftaroline from IRIX Pharmaceuticals, Durham, North Carolina; telithromycin from Sanofi Aventis, Montréal, Québec, Canada; doxycycline, tigecycline, linezolid, levofloxacin, moxifloxacin, azithromycin and erythromycin from Sigma Chemicals, Mississauga, Ontario, Canada.

Strains

The strain collection represents a phenotypically and genotypically well-characterized variety of resistant community and hospital-acquired S. aureus strains isolated from 1995 to 2016. Twenty of theses 239 (8%) strains were collected between 1995-2001 and the remainders have been more recently collected during the 2000s.

All strains were grown on Trypticase soy agar (with 5% sheep blood) to produce pure cultures. Genomic DNA was isolated as previously described [16] and multiplex polymerase chain reaction was performed with primers specific for mecA, ermA, ermB, ermC, and mefE [17] or for gyrA and parC [18]. Four ATCC S. aureus strains (two methicillin-sensitive S. aureus (MSSA) strains (ATCC 29213, ATCC 25923) and two methicillin-resistant (MRSA) strains (ATCC 33591, ATCC 43300)) were also used to assess the extracellular and intracellular activity.

In Vitro Activity

The in vitro activity of omadacycline was compared with that of doxycycline, tigecycline, linezolid, ceftaroline, levofloxacin, moxifloxacin, telithromycin, azithromycin, and erythromycin against a total of 239 resistant S. aureus by broth microdilution according to Clinical and Laboratory Standards Institute (CLSI) guidelines [19,20]. The tested strains included S. aureus that were methicillin-resistant (mecA [150]), macrolide-resistant (ermA, B or C [50]), and ciprofloxacin-resistant (gyrA and parC [39]).

Freshly cation-adjusted Mueller-Hinton broth (Becton Dickinson, Cockeysville, MD, USA) supplemented by 2% NaCl (MH) was used as broth medium against resistant S. aureus strains, ATCC S. aureus strains and Quality Control (QC) strain. MIC microplates, containing approximately 5±3 X 10⁵ CFU/mL in MH broth and drug dilutions were incubated at 35±2°C in aerobic conditions and were read after 20-24 hours of incubation. Exclusively to simulate the extracellular and phagolysosomal environments, MIC microplates of MH broth were prepared at pH 7.4±0.1 (original pH of medium) and 5.5±0.1 (modified pH of medium adjusted with 2 N HCl solution) and were tested only against S. aureus ATCC strains (ATCC 29213, ATCC 25923, ATCC 33591 and ATCC 43300)).

The minimum inhibitory concentration (MIC) was defined as the lowest concentration of drug that completely inhibited visible growth after incubation. S. aureus ATCC 29213 was included as a QC strain. For extracellular and intracellular activity, MICs obtained at pH 7.4±0.1 were considered for choosing the tested concentrations.

Determination of extracellular activity

Kill curve experiments against 4 ATCC S. aureus strains (ATCC 25923, ATCC 29213 and ATCC 33591, ATCC 43300) were performed in duplicate by broth microdilution methodology modified from CLSI procedure [21] using flat cell culture microplates. One hundred and fifty microliters of RPMI 1640 medium (with 10% fetal calf serum) with antimicrobial concentrations of 1 to 6 times their MIC was inoculated with log-phase culture of each ATCC S. aureus to final bacterial density of 5±1 X 10⁵ CFU/mL) into each well of culture microplates for a final volume of 300 µL. The bacterial cultures were maintained under stationary conditions for 24 hours at 37±2°C in 5% CO2 and 95% air. Counts of CFU/mL were perf¬ormed on all bacterial cultures at time 0, 2, 6, and 24 hours of incubation in triplicate using Brain Heart Infusion (BHI) agar.

Determination of intracellular human monocyte activity

The intracellular activity of omadacycline was compared against 4 ATCC S. aureus strains (ATCC 25923, ATCC 29213, ATCC 33591 and ATCC 43300). The in vitro method using mononuclear cells [22-24] was performed in duplicate using 48-flat cell well culture microplates using RPMI 1640 medium (with 10% fetal calf serum) and mononuclear cells (THP-1 (ATCC TIB-202) cell line; 2±1 X10⁶ cells/ mL). Logarithmic-phase culture in BHI broth pelleted down at 14000 r.p.m. for 4 min and opsonized by suspending pellets in RPMI 1640 supplemented with non-decomplemented 10% fresh human serum for 30 min at 37±2°C. Opsonized S. aureus were adjusted to 5±1 X10⁵ CFU/mL in RPMI 1640 and phagocytized at a 4:1 ratio of bacteria to THP-1 monocytes. After a 1 hour exposure at 37±2°C in a shaking incubator, the infected cultures were centrifuged (1300 rpm; 8 min) to eliminate non-phagocytized bacteria and were re-suspended in RPMI medium. One hundred and fifty microliters of RPMI with diluted antibiotics at 1, 2, 8 or 16 times the MIC of each ATCC S. aureus strain were added at time 0 into each well of infected culture microplates for a final volume of 300µL. Cultures were maintained under stationary conditions thereafter for 24 hours at 37±2°C in 5% CO2 and 95% air. Monocytes in a 20µl sample taken at each time point from each well were diluted by 10-fold dilutions and lysed with distilled water. Counts of CFU/mL at time 0, 2, 6, and 24 hours were performed on all bacterial cell cultures in triplicate using BHI agar.

Cytotoxicity

The cytotoxicity of omadacycline and comparators was assessed in THP-1 monocytes. After 24 h exposure to antibiotics, even the highest tested concentration (16XMIC) resulted in <1% cells being stained with tryptan blue. This observation suggested that all of the tested antibiotics were non-cytotoxic to THP-1 monocytes.

Results

In vitro Activity

Against all resistant strains of S. aureus, the activity of omadacycline (MIC90 0.25mg/L) was more potent than other tested antibiotics (Table 1). An MIC90 of 0.25mg/L was obtained against methicillin-resistant S. aureus (mecA genotype group) with omadacycline that was comparable to tigecycline (MIC90 0.5mg/L), and more potent than doxycycline (MIC90 1mg/L), ceftaroline (MIC90 1mg/L), linezolid (MIC90 2mg/L), and moxifloxacin(MIC90 4mg/L). An MIC90 of ≥16mg/L was observed with azithromycin, erythromycin, and levofloxacin against methicillin-resistant S. aureus (mecA genotype group). Against macrolide-resistant S. aureus (ermA, B, C genotype group) strains, omadacycline (MIC90 0.25 mg/L) was the most active agent and was more active than telithromycin, azithromycin, and erythromycin (MIC90 ≥4mg/L) or levofloxacin and moxifloxacin (MIC90 4mg/L). Against ciprofloxacin-resistant S. aureus (gyrA and parC genotype group), an MIC90 >16mg/L was observed with levofloxacin, moxifloxacin, azithromycin, and erythromycin. While, the MIC90 for omadacycline (0.25mg/L) remained lower than that of linezolid (MIC90 4mg/L), doxycycline (MIC90 1mg/L), and ceftaroline (MIC90 1mg/L), this was comparable to telithromycin (MIC90 0.25mg/L) and tigecycline (MIC90 0.5mg/L).

Table 1. Susceptibility of resistant S. aureus strains: methicillin-resistant (mecA), macrolide-resistant (ermA, B, C), and ciprofloxacin-resistant (gyrA and parC) strains using MH broth.

Organism (no. tested)

Antibiotic

MICa (mg/L)

Range

50%

90%

S. aureus
All resistant tested strains
(239)

Omadacycline

0.016-1

0.25

0.25

Doxycycline

0.06-≥16

0.5

1

Tigecycline

0.25-1

0.5

0.5

Linezolid

0.5-4

1

2

Ceftaroline

0.06-2

0.5

2

Levofloxacin

0.5-≥16

4

≥16

Moxifloxacin

0.25-≥16

4

≥16

Telithromycin

0.016-≥16

0.12

4

Azithromycin

0.016-≥16

2

≥16

Erythromycin

0.06-≥16

1

≥16

S. aureus
methicillin-resistant
mecAgenotype
(150)

Omadacycline

0.016-0.25

0.25

0.25

Doxycycline

0.06-≥16

0.5

1

Tigecycline

0.25-2

0.5

0.5

Linezolid

0.5-4

1

2

Ceftaroline

0.06-2

0.5

1

Levofloxacin

1-≥16

4

≥16

Moxifloxacin

0.25-≥16

2

4

Telithromycin

0.016-≥16

0.06

0.12

Azithromycin

1-≥16

2

≥16

Erythromycin

0.5-≥16

1

≥16

S. aureus
Macrolide-resistant
ermA, B & C genotype
(50)

Omadacycline

0.06-0.25

0.25

0.25

Doxycycline

0.25-1

1

1

Tigecycline

0.25-1

0.5

0.5

Linezolid

1-4

2

2

Ceftaroline

0.12-2

1

1

Levofloxacin

0.5-4

2

4

Moxifloxacin

0.25-4

1

4

Telithromycin

0.12-≥16

2

4

Azithromycin

4-≥16

≥16

≥16

Erythromycin

8-≥16

≥16

≥16

S. aureus
Ciprofloxacin- Resistant
gyrA&parC genotype
(39)

Omadacycline

0.06-0.25

0.25

0.25

Doxycycline

0.5-1

1

1

Tigecycline

0.25-0.5

0.5

0.5

Linezolid

1-4

2

4

Ceftaroline

0.06-1

0.5

1

Levofloxacin

8-≥16

≥16

≥16

Moxifloxacin

4-≥16

≥16

≥16

Telithromycin

0.016-4

0.06

0.25

Azithromycin

0.016-≥16

0.12

≥16

Erythromycin

0.12-≥16

1

≥16

a MICs determined by broth microdilution according to CLSI guidelines in antibiotic concentrations from 0.004 to 16 mg/L. Geometric mean value (mg/L) for MIC.
MIC: Minimal Inhibitory Concentration

At pH 7.4, the MICs obtained for omadacycline against ATCC S. aureus strains (ATCC 29213, ATCC 25923, ATCC 33591 and ATCC 43300) were from 0.25 to 0.5 mg/L (Table 2). Against the four tested ATCC S. aureus strains, the MICs of omadacycline were comparable to tigecycline (MIC range: 0.12 to 0.5 mg/L) and ceftaroline (MIC range: 0.12 to 2 mg/L). At a pH of 5.5 (phagolysosomal environments), omadacycline MICs were one to two 2-fold serial dilutions higher against ATCC S. aureus strains, which was less active than ceftaroline but comparable to tigecycline, linezolid, levofloxacin, and moxifloxacin.

Table 2. Susceptibility of S. aureus ATCC 25923 and ATCC 33591strains at pH 7.4 and pH 5.5 in MH broth.

Organism tested

pH

MICa (mg/L)

Omadacycline

Tigecycline

Linezolid

Ceftaroline

Levofloxacin

Moxifloxacin

Azithromycin

S. aureus ATCC 25923

7.4

0.5

0.12

2

0.12

0.25

0.06

0.5

5.5

2

0.5

4

0.12

1

0.25

>16

S. aureus ATCC 33591

7.4

0.25

0.25

2

0.5

8

2

>16

5.5

1

2

2

0.25

>16

4

>16

aMICs determined by broth microdilution according to CLSI guidelines in antibiotic concentrations from 0.004 to 16 mg/L. Geometric mean value (mg/L) for MIC.
Only data for strains, S. aureus ATCC 25923and ATCC 33591is shown due to similar data for strains S. aureus ATCC 29213 and ATCC 43300.

Extracellular and Intracellular Activity

Bactericidal activity, defined as mean growth reduction of ≥3 log10 CFU/mL (≥99.9%), was reached at 24 hours of antibiotic exposure with omadacycline, ceftaroline, levofloxacin, and moxifloxacin at increasing extracellular MIC concentrations from 1X to 16X MIC against both MSSA and MRSA ATCC strains (Figures 1-4). At 6 hours, growth reduction (≥2 log10 CFU/mL or ≥99%) of S. aureus (MSSA and MRSA) was detected at 1X to 16X MIC with omadacycline and moxifloxacin, at 1X to 8X (data not shown) MIC with ceftaroline, and at 8X (data not shown) to 16X MIC with linezolid. At 24 hours, growth reduction of S. aureus (MSSA and MRSA) was detected with linezolid at 2X to 16X MIC. Among the tested antibiotics, tigecycline and azithromycin only demonstrated a bacteriostatic activity (growth reduction <2 log10 CFU/mL or <99%) against tested MSSA and MRSA strains.

IMROJ-5-2-513-g001

Figure 1. In vitro extracellular (left) and intracellular (right) activity against S. aureus all tested strains: 2 MSSA (ATCC 29213 & 25923) and 2 MRSA (ATCC 33591 & 43300) with omadacycline (OMC) and comparators (tigecycline (TIG), linezolid (LIN), ceftaroline (CEF), levofloxacin (LEV), moxifloxacin (MOX), azithromycin (AZI)) at 1XMIC from 0-24 hours of incubation. Note that each point corresponds to the mean value of all tested strains determined by triplicate independent counts.

IMROJ-5-2-513-g002

Figure 2. In vitro extracellular (left) and intracellular (right) activity against S. aureus all tested strains: 2 MSSA (ATCC 29213 & 25923) and 2 MRSA (ATCC 33591 & 43300) with omadacycline (OMC) and comparators (tigecycline (TIG), linezolid (LIN), ceftaroline (CEF), levofloxacin (LEV), moxifloxacin (MOX), azithromycin (AZI)) at 2XMIC from 0-24 hours of incubation. Note that each point corresponds to the mean value of all tested strains determined by triplicate independent counts.

IMROJ-5-2-513-g003

Figure 3. In vitro extracellular (left) and intracellular (right) activity against S. aureus all tested strains: 2 MSSA (ATCC 29213 & 25923) and 2 MRSA (ATCC 33591 & 43300) with omadacycline (OMC) and comparators (tigecycline (TIG), linezolid (LIN), ceftaroline (CEF), levofloxacin (LEV), moxifloxacin (MOX), azithromycin (AZI)) at 16XMIC from 0-24 hours of incubation. Note that each point corresponds to the mean value of all tested strains determined by triplicate independent counts.

IMROJ-5-2-513-g004

Figure 4. In vitro extracellular activity (left) and intracellular activity (right) against 2 MRSA strains (ATCC 33591 & 43300) with omadacycline (OMC) at 1X to 16X MIC from 0-24 hours of incubation. Note that each point corresponds to the mean value of 2 MRSA strains determined by triplicate independent counts. Only data of strains MRSA ATCC 33591 and ATCC 43300 is shown due to similar data of strains MSSA ATCC 29213 and ATCC 25923.

Important intracellular activity, mean intracellular growth reduction of ≥2 log10 CFU/mL (≥99%), was achieved at 24 hours by omadacycline and levofloxacin, at increasing concentrations from 2X to 16X MIC against intracellular MSSA and MRSA (Figures 1-4). At 24 hours, intracellular activity, mean intracellular growth reduction of ≥1 log10 CFU/mL (≥90%) but <2 log10 CFU/mL (<99%), against intracellular MSSA and MRSA was detected with omadacycline at 1X MIC, levofloxacin at 1X MIC, moxifloxacin at 1X MIC and 2X MIC, tigecycline at 2X MIC or greater, and linezolid at 8X MIC or greater (data not shown). Unlike omadacycline, growth reduction of intracellular MSSA and MRSA was not modified by increasing concentrations of ceftaroline or azithromycin from 1X to 16X MIC.

Discussion

Results from this study showed that omadacycline exhibits in vitro activity against resistant strains of S. aureus. Omadacycline appeared to have more predominant activity than other older tetracyclines, ketolide, macrolides, quinolones, oxazolidinone or third generation cephalosporin’s against the most resistant isolates such as β-lactam-resistant, erythromycin-resistant or ciprofloxacin-resistant S. aureus. Further, these results revealed that omadacycline has potent extracellular and intracellular activity that was comparable to levofloxacin and moxifloxacin and was higher than tigecycline, linezolid, ceftaroline and azithromycin.

Previously, it was thought that S. aureus only infected the extracellular space, and treatment failure was caused by resistance mechanisms to many antibiotics that were inherent in S. aureus [8]. However, in recent years, S. aureus were discovered to exist in the intracellular space (phagolysosomes) in macrophages, monocytes, and other human cells as well as the extracellular space, which may provide a more complete explanation for failed antibiotic treatment of infections due to S. aureus [8,9,25]. Importantly, the results from this study showed that omadacycline demonstrated not only bactericidal extracellular activity (99.9% of growth reduction) but also produced an intracellular activity (99% of growth reduction) in human monocytes infected with resistant S. aureus. This finding supports the potential clinical activity of omadacycline against a broad variety of S. aureus isolates.

The pharmacokinetics of omadacycline has been studied extensively in healthy volunteers after IV and oral administration [15, 26-29].

Recent studies also provided evidence for the presence of omadacycline in alveolar macrophages of animals and humans [15, 25,30]. The pharmacokinetics of omadacycline and tigecycline were evaluated in plasma, epithelial lining, and alveolar cells of healthy subjects. Subjects received omadacycline 100 mg IV every 12 hours for 2 doses, then 100 mg IV every 24 hours for 3 doses, and concentrations were measured in pulmonary tissues during bronchopulmonarylavage [15]. At the time of bronchoscopy, a mean area under the concentration-time curve (AUC0-24) value of 17.23 mg • h /L and 302.42 mg • h /L was observed respectively in Epithelial Lining Fluid (ELF) or in alveolar cells (AC). Combining the observed mean MIC value (0.5mg/L) at 24 hours to obtain a mean intracellular growth reduction of ≥2 log10 CFU/mL, with the observed mean ELF and AC AUC0–24 values, the estimated AUC0–24/MIC ratio in ELF and AC would be ∼35 and ∼605 for tested ATCC strains of S. aureus, respectively. Results from these studies indicate potent intracellular omadacycline concentrations and confirm that omadacycline produces AUC0-24 in ELF or AC suggesting achievable level at infection site that far exceed the MICs or the potential intracellular activity for a broad variety of S. aureus including resistant isolates included in this study.

Based on the in vitro results of the study reported here, omadacycline exhibits potent extracellular and intracellular activity against MSSA or MRSA. These results combined with extensive in vitro susceptibility studies and pharmacokinetic studies demonstrating consistent systemic exposure after IV and oral dosing are consistent with results from Phase 3 studies. Omadacycline demonstrates consistent efficacy in patients hospitalized with serious infections due to acute Bacterial Skin and Skin Structure Infections (ABSSSI) and CAP caused by S. aureus and other causative pathogens [31,32].

Declarations

Acknowledgment

Editorial support in the form of development of the first draft of the manuscript was provided by Richard Perry, PharmD. Editorial support of the revised manuscript was provided by Theresa E. Singleton, PhD, of Innovative Strategic Communications.

Conflicts of Interest

The author, Jacques Dubois declare conflicts of interest relevant to this study. The authors, Maïtée Dubois, and Jean-François Martel declare no conflicts of interest relevant to this study.

Funding

This work was supported by Paratek Pharmaceuticals, Boston, MA.

Authors’ Contributions

Jacques Dubois, Maïtée Dubois, and Jean-François Martel contributed equally to this study, and to the review and revision of the manuscript. Author order was determined both alphabetically and in order of increasing seniority.

References

  1. Tong SY, Davis JS, Eichenberger E,Holland TL, Fowler VG (2015) Staphylococcus aureus infections: Epidemiology, pathophysiology, clinical manifestations, and management. ClinMicrobiol Rev 28: 603-661. [Crossref]
  2. Dryden M, Andrasevic AT, Bassetti M,Bouza E, Chastre J, et al. (2015) Managing skin and soft-tissue infection and nosocomial pneumonia caused by MRSA: a 2014 follow-up survey. Int J Antimicrob Agents 45 Suppl 1: S1-14. [Crossref]
  3. Moet GJ, Jones RN, Biedenbach DJ,Stilwell MG, Fritsche TR (2007) Contemporary causes of skin and soft tissue infections in North America, Latin America, and Europe: report from the SENTRY Antimicrobial Surveillance Program (1998-2004). DiagnMicrobiol Infect Dis 57: 7-13. [Crossref]
  4. Ray GT, Suaya JA, Baxter R (2013) Incidence, microbiology, and patient characteristics of skin and soft-tissue infections in a US. population: a retrospective population-based study. BMC Infect Dis13: 252. [Crossref]
  5. File TM Jr, Marrie TJ (2010) Burden of community-acquired pneumonia in North American adults. Postgrad Med122: 130-141.
  6. World Health Organization (2014) Antimicrobial Resistance. Global Report on Surveillance. [Crossref]
  7. Chertow DS, Memoli MJ (2013) Bacterial coinfection in influenza. JAMA 309: 275-282. [Crossref]
  8. Sandberg A, Jensen KS, Baudoux P, Bambeke FV, Tulkens PM, et al. (2010) Intra- and extracellular activities of dicloxacillin against Staphylococcus aureus in vivo and in vitro. Antimicrob Agents Chemother 54: 2391-2400. [Crossref]
  9. Sendi P, Proctor RA (2009) Staphylococcus aureus as an intracellular pathogen: the role of small colony variants. Trends Microbiol 17: 54-58.
  10. Pfaller MA, Huband MD, Rhomberg PR,Flamm RK (2017) Surveillance of omadacycline activity against clinical isolates from a global collection (North America, Europe, Latin America, Asia-Western Pacific), 2010-2011. Antimicrob Agents Chemother 61. pii: e00018-17. [Crossref]
  11. Pfaller MA, Rhomberg PR, Huband MD, Flamm RK (2017) Activities of omadacycline and comparator agents against Staphylococcus aureus Isolates from a surveillance program conducted in North America and Europe. Antimicrob Agents Chemother 61. pii: e02411-16. [Crossref]
  12. Draper MP, Weir S, Macone A,Donatelli J, Trieber CA, et al. (2014) Mechanism of action of the novel aminomethylcycline antibiotic omadacycline. Antimicrob Agents Chemother 58: 1279-1283. [Crossref]
  13. Macone AB, Caruso BK, Leahy RG,Donatelli J, Weir S, et al. (2014) In vitro and in vivo antibacterial activities of omadacycline, a novel aminomethylcycline. Antimicrob Agents Chemother 58: 1127-1135. [Crossref]
  14. Tanaka SK, Steenbergen J, Villano S (2016) Discovery, pharmacology, and clinical profile of omadacycline, a novel aminomethylcycline antibiotic. Bioorg Med Chem24: 6409-6419. [Crossref]
  15. Gotfried MH, Horn K, Garrity-Ryan L, Villano S, Tzanis E, et al (2017) Comparison of omadacycline and tigecycline pharmacokinetics in the plasma, epithelial lining fluid, and alveolar cells of healthy adult subjects. Antimicrob Agents Chemother61. pii: e01135-17. [Crossref]
  16. SmithAM, Klugman KP, Coffey TJ, Spratt BG (1993) Genetic diversity of penicillin-binding protein 2B and 2X genes from Streptococcus pneumoniae in South Africa. Antimicrob Agents Chemother37: 1938-1944. [Crossref]
  17. Sutcliffe J, Grebe T, Tait-Kamradt A, Wondrack L (1996) Detection of erythromycin-resistant determinants by PCR. Antimicrob Agents Chemother 40: 2562-2566. [Crossref]
  18. González I, Georgiou M, Alcaide F, Balas D, Linares J, et al. (1998)Fluoroquinolone resistance mutations in the parC, parE, and gyrA genes of clinical isolates of viridans group streptococci. Antimicrob Agents Chemother 42: 2792-2798. [Crossref]
  19. Clinical and Laboratory Standards Institute (CLSI) (2018) Methods for Dilution Antimicrobial Susceptibility Tests for Bacteria That Grow Aerobically; Approved Standard-Eleventh Edition. CLSI document M07-A11. Wayne, PA.
  20. Clinical and Laboratory Standards Institute (CLSI) (2019) Performance Standards for Antimicrobial Susceptibility Testing; Approved Standard – Twenty-ninth Edition. CLSI document M100-S29. Wayne, PA.
  21. CLSI (1999) Methods for Determining Bactericidal Activity of Antimicrobial Agents; Approved Guideline. CLSI document M26-A. Wayne, PA.
  22. Lemaire S, Van Bambeke F, Mingeot-Leclercq MP, Tulkens PM (2005) Activity of three {beta}-lactams (ertapenem, meropenem and ampicillin) against intraphagocytic Listeria monocytogenes and Staphylococcus aureus. J AntimicrobChemother 55: 897-904. [Crossref]
  23. Barcia-Macay M, Seral C, Mingeot-Leclercq MP,Tulkens PM, Bambeke FV (2006) Pharmacodynamic Evaluation of intracellular Activities of Antibiotics against Staphylococcus aureus in a model of THP-1 Macrophages. Antimicrob Agents Chemother 50: 841-851. [Crossref]
  24. Dubois J, Dubois M (2019) Levonadifloxacin (WCK 771) exerts potent intracellular activity against Staphylococcus aureus in THP-1 monocytes at clinically relevant concentrations. J Med Microbiol 68: 1-7. [Crossref]
  25. Lacoma A, Cano V, Moranta D, Regueiro V, Domínguez-Villanueva D, et al. (2017) Investigating intracellular persistence of Staphylococcus aureus within a murine alveolar macrophage cell line. Virulence 8: 1761-1775. [Crossref]
  26. Berg JK, Tzanis E, Garrity-Ryan L, Bai S, Chitra S, et al. (2018) Pharmacokinetics and safety of omadacycline in subjects with impaired renal function. Antimicrob Agents Chemother 62. pii: e02057-17. [Crossref]
  27. Bundrant LA, Tzanis E, Garrity-Ryan L, Bai S, Chitra S, et al (2018) Safety and pharmacokinetics of the aminomethylcycline antibiotic omadacycline administered to healthy subjects in oral multiple dose regimens. Antimicrob Agents Chemother62(2). pii: e01487-17. [Crossref]
  28. Sun H, Ting L, Machineni S, Praestgaard J, Kuemmell A, et al. (2016) Randomized, open-label study of the pharmacokinetics and safety of oral and intravenous administration of omadacycline to healthy subjects. Antimicrob Agents Chemother 60: 7431-7435. [Crossref]
  29. Tzanis E, Manley A, Villano S, Tanaka SK, Bai S, et al (2017) Effect of food on the bioavailability of omadacycline in healthy participants. J ClinPharmacol 57: 321-327. [Crossref]
  30. Lepak AJ, Zhao M, Marchillo K, VanHecker J, Andes DR(2020) In vivo Pharmacodynamic evaluation of omadacycline against Staphylococcus aureus in the neutropenic mouse pneumonia model. Antimicrob Agents Chemother 64. pii: e02058-19. [Crossref]
  31. Stets R, Popescu M, Gonong J et al (2017) A phase 3, randomized, double-blind, multi-center study to compare the safety and efficacy of IV to oral omadacycline to moxifloxacin for the treatment of adult patients with CABP (the OPTIC study). Abstr 1883, ID Week, San Diego, California, USA.
  32. O’Riordan WA, Green S, Overcash JS (2017) A phase 3 randomized, double-blind, multi-center study to compare the safety and efficacy of oral and IV omadacycline to linezolid for treating adult subjects with ABSSSI (the OASIS study). Abstr. 630. 27th European Congress of Clinical Microbiology and Infectious Diseases (ECCMID), Vienna, Austria.

A Correlational Model of Sadomasochistic Fantasies and Psychosocial Features among Male and Female Medical University Students

DOI: 10.31038/AWHC.2020332

Abstract

Background: Sadomasochistic fantasies are often stigmatized and not easily disclosed to friends and family members. Although the nature of these fantasies is still incompletely understood, more frequent unconventional sexual fantasies seem to be associated with male gender with non-heteronormative sexual orientation and with higher educational level.

Methods: This was a cross-sectional study in which subjects provided information through a self-reported questionnaire in a face-to-face interview. This tool included questions assessing sociodemographic characteristics, the Beck Depression Inventory, and the subscale “sadomasochistic fantasies” of the Wilson Sexual Fantasy Questionnaire. A total of 412 medical students aged 18 and over attending first through sixth year at a medical school were randomly selected and recruited to participate.

Results: Non-heteronormativity and illicit drug use were directly and positively correlated with higher scores on sadomasochistic sexual fantasies. In addition, non-heteronormativity was a mediator variable in the model between being male and having higher scores on sadomasochistic sexual fantasies.

Conclusion: It is possible that unconventional sexual fantasies are more frequent in certain social groups, such as non-heteronormative males with high educational level. Although the use of psychoactive substances was correlated with sadomasochistic sexual fantasies, there are scarce scientific data to support this finding.

Keywords: Sadomasochistic fantasies, University Students,Heteronormativity

Introduction

The deliberate act of mentally envisioning a sexual scenario involving a target and/or behavior is a normal part of human sexuality. The content of the mental imagery or sexual fantasy frequently reflects one’s sexual interest and is experienced as sexually arousing [1]. In fact, some studies have shown a positive correlation between the experience of arousing sexual fantasies and sexual satisfaction [2].

There are important reasons for studying the diversity of sexual fantasies. First, although sexual fantasies are universally experienced, they can affect sexual behavior; second, sexual fantasies can be influenced by what people have previously seen, read, or done; third, repetitive sexual fantasies can help to shape our sexual schema or script; fourth, as sexual fantasies are private, they may be more revealing than actual behavior [1]. In sum, sexual fantasies can reflect our sexual behavior, which in turn can reflect them.

Of the enormous variety of sexual fantasies, sadomasochistic fantasies are often stigmatized and not easily disclosed to friends and family members by the fantasizers [3,4]. In addition, individuals with ingrained sadomasochistic sexual fantasies might need to reshape their identity to cope with shame, guilt, self-labeling, and self-hatred, and might need to overcome phases of dissatisfaction and depression before assuming or even expressing these sexual fantasies [5].

In fact, sadism and masochism have also been stigmatized medically. It was only in the 1970s and 1980s that a growing body of studies from the social sciences took a non-pathological view of sadomasochistic fantasies, practices, and behaviors [6]. Studies of consensual sadomasochistic practices have shown the healthy aspects of this behavior, such as improvement of intimacy between practitioners and greater creative stimulation [7]. In addition, associations of sadomasochistic practices with mental instability, depression, anxiety, and antisocial or psychotic traits have not been supported [8, 9]. Thus, since the latest edition of the Diagnostic and Statistical Manual of Mental Disorders [10] the terms sexual sadism and sexual masochism were changed to sexual sadism disorder and sexual masochism disorder in order to draw a line between non-pathological and pathological sexual behavior. In truth, one of the most important distinctions between deviant and normal sadomasochistic behavior is the presence or lack of consent. This perspective is also assumed within sadomasochistic communities, where consensual play and sex are unbreakable principles [11]. Despite this, the nature of sadomasochism is still incompletely understood, even though many studies have applied a broad variety of qualitative and quantitative methods [12].

Despite the demedicalization of consensual sadomasochistic behaviors, we should nonetheless consider that certain psychosocial factors seem to be linked to a higher diversity of sexual fantasies and practices in general. Higher diversity of sexual practices is consistently found to be associated with male gender, non-heteronormative sexual orientation, and higher educational level [13-16]. Considering these findings, nonclinical clusters of people with more intense unconventional sexual fantasies could be grouped into certain socio-demographic profiles [17]. In a somewhat different way, some studies have suggested that, although men show more frequent sadomasochistic fantasies, there are a large number of women in sadomasochistic communities [18-20]. In addition, [21] contends that “those who are most attracted to masochism may be the women (…). The women turn to masochism to live out the humiliation, the submission that they no longer have to endure anywhere else, or to remind themselves of other realities.” Based on these contrasting assumptions, it is possible that there is a mediator variable between biological sex and sadomasochistic sexual fantasies.

Still considering differences between sadomasochistic fantasizers and non-fantasizers, drug use has been scarcely investigated. It is important to note that it is possible that some sexual fantasies or feelings may be related to urges or cravings for drugs. Many drug users become trapped in a “reciprocal relapse” pattern in which a sexual behavior precipitates relapse to drugs and vice-versa [22]. According to some sadomasochistic communities, “just as in the greater population, there are many people in these communities who identify as clean and sober, and there are many who do not” [23]. This statement demonstrates the heterogeneity of those that have sadomasochistic sexual fantasies in terms of drug use. Examining such heterogeneity, a study with 164 sadomasochistically oriented males showed that the use of psychoactive substances before or during sadomasochistic sessions is not negligible. About 26%, 17%, and 5% of the participants of this sample admitted to using alcohol, poppers, and marijuana, respectively [24]. It is important to note here that poppers (volatile nitrites) are forbidden for recreational use in Brazil by the Brazilian Health Regulatory Agency (volatile nitrites are approved for use only for industrial purposes).

Also in line with other studies linking psychological problems with unconventional sexual fantasies, an association of traumatic childhood with sadomasochism and intermittent depression has been suggested [25]. In truth, depression symptoms can consist of a phase that individuals with sadomasochistic fantasies have to overcome before accepting and expressing them. Although these mental problems, drug use and depressive symptoms, may be directly or indirectly associated with unconventional sexual fantasies and behaviors, there does not seem to be any causal nexus. That said, we understand that sexual science would benefit from more systematic assessments of sadomasochistic fantasies and behaviors in clinical and nonclinical samples.

This study aimed to investigate whether psychosocial aspects, such as male gender and non-heteronormative sexual orientation, are associated with more frequent sadomasochistic sexual fantasies. In addition, we evaluated whether drug use and depressive symptoms are correlated with these sexual fantasies in a nonclinical sample of university students.

Method

Procedure

Permission to use the Wilson Sexual Fantasy Questionnaire (WSFQ) was obtained from the instrument’s marketers (CymeonTM Research, Sydney, Australia). Prof. Glenn Wilson was also contacted by our staff, and he referred us to the CymeonTM Research team. The original version was translated using the standard processes of back translation [26]. The English version of the instrument was translated into Portuguese by a team including one professor, four psychiatrists, and two psychologists with experience in sexual disorders and competency in both English and Portuguese languages, and two independent bilingual native speakers. The staff worked collaboratively to ensure that the instrument had semantic equivalence across the languages and conceptual equivalence across cultures. The translation coordinator compared both versions and reconciled any differences. Finally, the team compiled the Portuguese version and chose the most appropriate wording for clarity and similarity to the original. The final Portuguese version was formalized after the team discussed culturally problematic issues.

The Portuguese version was then independently translated back to English by two separate translators, neither of whom had previously seen the original scale. The back-translated versions were also evaluated and discussed by the team. A pilot study was then performed on a small sample (N = 10) of healthy individuals from diverse educational levels to examine whether any items on the WSFQ were perceived as difficult. No problematic items requiring revision were found.

Subsequently, a cross-sectional study was conducted to investigate associations or correlations between some psychosocial variables, mainly among those potentially related to unconventional sexual fantasies, such as biological sex, sexual orientation, illicit drug use, and depression. The investigators were specially trained medical graduate and postgraduate students. This study was approved by the Ethics Committee of ABC Medical School, Santo André, São Paulo, Brazil.

Participants

Between November 2016 and August 2019, a total of 412 medical students aged 18 and over attending the first through sixth year at one medical school were randomly selected and recruited to participate in this study. They were assured that their participation was voluntary, that only the researchers would see the data, and that all data would be kept confidential. A financial reward was not provided because this is not allowed under Brazilian law.

Important participant outcomes were compared based on 11 variables: biological sex, age, race or ethnicity, marital status, lifetime alcohol use, lifetime illicit drug use (marijuana, poppers, and cocaine were grouped into just one group), family members with alcohol use problems, family members with illicit drug use problems, sexual orientation, scores on depression symptoms, and scores on sadomasochistic sexual fantasies. Sex was coded as male, female, and intersex. Monthly income was not coded because our participants follow a full-time course of study.

Measures

This was a cross-sectional study in which subjects provided information through a self-reported questionnaire. This tool included questions assessing sociodemographic characteristics and the following inventories: The Beck Depression Inventory and the subscale “sadomasochistic fantasies” of the Wilson Sexual Fantasy Questionnaire.

The Beck Depression Inventory (BDI)

This inventory measures behavioral responses related to depression among adults and adolescents. In this 21-item instrument, scores above 10 (score range: 0–63) indicate the presence of a depressive syndrome [27, 28]. A sensitivity of 100% and specificity of 0.83 are obtained with a cut-off score of 9/10.

The Wilson Sex Fantasy Questionnaire (WSFQ)

This questionnaire is a 40-item self-report measure of sexual fantasies comprising a range of sexual themes “from the normal to the deviant and potentially harmful” [29]. Each item is scored on a four-point scale ranging from Never (0) to Often (3) across five different contexts (e.g., Daytime fantasies, Fantasies during intercourse or masturbation, Dream while asleep, Have done in reality, and Would do in reality). When assessing the frequency of sexual fantasy use, it is considered advisable only to use responses for Daytime fantasies, since scores for the other four contexts are highly correlated with Daytime dreams [30, 31]. Four subscales are derived from this instrument, including intimate (e.g., kissing passionately, having intercourse with a loved partner, being masturbated to orgasm by a partner), impersonal (e.g., sex with strangers, watching others having sex, fetishism), exploratory (e.g., group sex, promiscuity, mate-swapping), and sadomasochistic sexual fantasies (e.g., whipping or spanking, being forced to have sex). Each subscale has 10 items and this 4-factors structure has demonstrated consistency across multiple assessments [32, 33]. In line with the aims of this study, we only used the sadomasochistic sexual fantasy subscale. The following question was constructed for the participants: How often do you fantasize about the theme below at various times?

Analysis

Univariate analyses were used to compare the sociodemographic and psychometric features between men and women and between heteronormative and non-heteronormative participants. Categorical variables were compared using the χ2 or Fisher’s exact tests, following the Monte Carlo method. Continuous variables were compared using Student’s t-test.

In order to develop a correlational model, we performed a Structural Equation Modelling (SEM). Maximum likelihood estimation was used to estimate the fit of the model. TheComparative Fit Index (CFI), Tucker-Lewis Index (TLI), Goodness of Fit Index (GFI), Adjusted GFI (AGFI), Root Mean Square Error of Approximation (RMSEA), and Standardized Root Mean Square Residual (SRMR) were used to evaluate model fit. Some standard recommendations regarding values for global model fit were followed. Specifically, CFI, TLI, GFI, and AGFI values greater than 0.90 and RMSEA and SRMR values lower than 0.08 were deemed indicative of acceptable model fit [34, 35]. As the chi-square value is dependent on the sample size, we calculated the ratio of chi-square to the degrees of freedom (c2/df), where a value of 2 or lower is an acceptable c2/df ratio [36].

Results

Of the questionnaires applied, 8 (1.94%) were discarded due to incomplete answers, leaving 402 participants. Of the participants, 200 (49.75%) were male and the mean age of the total sample was 21.45 (SD = 2.35) years old. Our sample had neither intersex nor transgender participants.

Descriptive analysis

As it is shown in Table 1, when biological male and female respondents were compared, male students showed more frequent non-heteronormative sexual orientation, and female students demonstrated higher mean scores on the BDI. There were no significant differences between the sexes in age, marital status, alcohol and illicit drug use, family members with alcohol and drug use problems, or mean scores on sadomasochistic sexual fantasies. As shown in Table 2, when heteronormative and non-heteronormative students were compared, those that admitted to non-heteronormativity demonstrated higher scores on the BDI and on sadomasochistic sexual fantasies, and more frequent family members with alcohol use problems. There were no statistically significant differences regarding the other psychosocial variables.

Table 1. Psychosocial and Psychometric features between male and female Medical University students.

Variables

Male
(n = 200)

Female
(n = 204)

Test

p

Age, mean (SD)

21.56 (2.54)

21.34 (2.16)

t = 0.90, 402df

0.90

Race, n (%)
White
Non-white

173 (86.50)
27 (13.50)

165 (80.88)
39 (19.12)

χ2 = 2.33, 1df

0.13

Marital status, n (%)
Single
Married /Common-law

198 (99)
2 (1)

200 (98.04)
4 (1.96)

χ2 = 0.64, 1df

0.43

Alcohol use, n (%)

163 (81.50)

176 (86.27)

χ2 = 1.71, 1df

0.19

Illicit drug use, n(%)

60 (30)

54 (26.47)

χ2 =0.62, 1df

0.43

Family members with alcohol use problems, n (%)

61 (30.50)

53 (25.98)

χ2 = 1.02, 1df

0.31

Family members with illicit drug use problems, n (%)

34 (17)

32 (15.69)

χ2 = 1.28, 1df

0.72

Sexual orientation, n (%)
Heteronormative
Non-heteronormative

180 (90)
20 (20)

195 (95.59)
9 (4.41)

χ2 = 4.73, 1df

0.03*

BDI, mean (SD)

5.78 (4.97)

8.36 (6.43)

t = -4.50, 402df

< 0.01**

Sadomasochistic fantasies, mean (SD)

4.01(4.01)

4.43 (3.36)

t = -1.13, 402df

0.26

Note: * p < 0.04; ** p < 0.01; BDI = Beck Depression Inventory

Table 2. Psychosocial and Psychometric features between Medical University students in accordance with the sexual orientation.

Variables

Heteronormative
(n = 375)

Non-Heteronormative
(n = 29)

Test

p

Age, mean (SD)

21.46 (2.38)

21.35 (1.97)

t = 0.25, 402df

0.81

Race, n (%)
White
Non-white

314(83.73)
61 (16.27)

24 (68.96)
5 (17.24)

χ2 = 0.19, 1df

0.80

Marital status, n (%)
Single
Married /Common-law

369 (98.40)
6 (1.60)

29 (100)
0 (0)

χ2 = 0.47, 1df

>0.99

Alcohol use, n (%)

314 (83.73)

25 (86.21)

χ2 = 0.12, 1df

0.73

Illicit drug use, n(%)

104 (27.33)

10 (34.48)

χ2 =0.61, 1df

0.44

Family members with alcohol use problems, n (%)

99 (26.40)

15 (51.72)

χ2 = 8.52, 1df

<0.01**

Family members with illicit drug use problems, n (%)

59 (15.73)

07 (24.14)

χ2 = 1.39, 1df

0.24

BDI, mean (SD)

6.89 (5.94)

9.59 (4.66)

t = -2.39, 402df

0.02*

Sadomasochistic fantasies, mean (SD)

4.11(3.58)

5.62 (4.81)

t = -2.13, 402df

0.03*

Note: * p < 0.04; ** p < 0.01; BDI = Beck Depression Inventory

SEM analysis

For the purposes of our SEM analysis, items were loaded uniquely on their respective factors and the factor loadings were fixed at 1.0. The sample was then evaluated using bootstrapping (800 bootstrap samples) with the Bollen-Stine Bootstrap statistic being calculated to verify absolute fit. As shown in Figure 1, the model fitted the data well, with c2/df= 0.69; CFI = 0.99; TLI = 0.99; GFI = 0.99; AGFI = 0.98; RMSEA = 0.012 [95% CI = 0.010-0.191]; SRMR = 0.02; and a Bollen-Stine statistic of p = 0.51.

AWHC-3-3-316-g001

Figure 1. Psychosocial and psychometric features correlated with sadomasochistic fantasies.

This model showed that non-heteronormativity and illicit drug use were directly and positively correlated with higher scores on sadomasochistic sexual fantasies. In addition, this model showed that non-heteronormativity was a mediator variable between having family members with alcohol problems and higher scores on sadomasochistic sexual fantasies. Furthermore, the variables of female sex and non-heteronormativity were directly and positively correlated with higher scores on depression. Non-heteronormativity also mediated the correlation between female sex and higher scores on depression.

Discussion

This study supports previous ones that have shown no correlation between depression symptoms and sadomasochistic fantasies, and that non-heteronormative persons have a higher frequency of these sexual fantasies. In addition, it found a correlation between illicit drug use and sadomasochistic fantasies.

Being male was not correlated with more frequent sadomasochistic sexual fantasies; however, being male was correlated with non-heteronormativity, which in turn was correlated with these unconventional sexual fantasies. We should consider that non-heteronormativity was a mediator variable between being male and having more frequent sadomasochistic fantasies in the correlational model. That said, it is possible that unconventional sexual fantasies are more frequent in certain social groups, such as non-heteronormative males with high educational level.

With regard to drug use, there is scarce evidence of an association with unconventional sexual fantasies. A few studies have investigated this use among sadomasochistically oriented people [24] and therefore it is necessary to devote greater attention to this theme, since our study shows a positive and direct correlation. It is possible that users of a variety of psychoactive substances experience strong aphrodisiac effects and disinhibition. This combination may result in obsessive pornography viewing, diverse sexual fantasies (including unconventional ones), and unsafe sexual practices [37]. Nonetheless, there is no definitive link between “kinky” sex and drug use to date.

Although comparisons between male and female and between heteronormative and non-heteronormative students in terms of depression symptoms were not the main goal of this study, the higher mean scores on depression in females than in males, mainly among young people [38-40] and in non-heteronormative persons [41-43] are widely supported in the scientific literature. Furthermore, studies have demonstrated that sexual minorities show a higher risk of having a family history of alcohol use problems than heterosexuals [44, 45]. Although the interpretation of this last association is politically sensitive [46] the fact is that this study does not show a causal relationship between sexual orientation and parental problems. It is possible to say here that non-heteronormative students may show higher self-reflection during the coming-out process or have a desire to endorse their own sexual orientation, leading them to reveal this fact more emphatically [47].

Although some authors have found significant associations between non-heteronormativity and alcohol and/or illicit drug use [48, 49] our study was not able to show this type of association. It is possible that given the notable and welcome reduction of the stigma, shame, and secrecy surrounding non-heteronormativity, the differences in the incidence of alcohol and drug use may be diminishing between heterosexuals and homosexuals/bisexuals. Also, the social context where people live can have a notable influence on the differences between heteronormative and non-heteronormative persons regarding alcohol and drug use [50] and this sample consisted of university students at a private institution.

In addition, the correlation between being male and non-heteronormative is not surprising. In Brazil, like in other diverse countries, the prevalence of homosexuals and bisexuals is higher in men, that is, almost 6% of males identify as gay and 2% identify as bisexual, while almost 3% of women identify as lesbian and 1% as bisexual [51].

This study showed that sadomasochistic fantasies in this sample of university students are more frequent in a group characterized by a non-heteronormative sexual orientation and reporting drug use. Although the first assertion has empirical support, the drug use among fantasizers needs further investigation.

There are several limitations in this study that need to be pointed out:

a) Response accuracy of research using self-response questionnaires may be less than fully satisfactory;

b) The university population is unrepresentative of the general population; and

c) The study’s cross-sectional design precludes drawing causal inferences and only provides information about population frequency and characteristics in a “snapshot” at a specific time.

References

  1. Leitenberg H, Henning K(1995) Sexual fantasy. Psychological Bulletim117: 469-496.
  2. Colon Vilar G, Concepcion E, Galynker I, Tanis T, Ardalan F, et al.(2016) Assessment of sexual fantasies in psychiatric inpatients with mood and psychotic disorders and comorbid personality disorder traits. The Journal of Sex Medicine 13:262-269.[Crossref]
  3. Bezreh T, Weinberg TS, Edgar T (2012) BDSM disclosure and stigma management: Identifying opportunities for sex education. American Journal of Sexuality Education7: 37-61.[Crossref]
  4. Wright, S. (2006). Discrimination of SM-identified individuals. Journal of Homosexuality, 50, 217-231.
  5. Kamel GWL (1983) The leather career: On becoming a sadomasochist. In T. K. Weinberg (Ed.), S and M: Studies in sadomasochism. Buffalo: Prometheus Books.
  6. Weinberg TS (2006) Sadomasochism and the social sciences: A review of the sociological and social psychological literature. Journal of Homosexuality 50: 17-40.[Crossref]
  7. Williams DJ (2009) Deviant leisure: Rethinking “the good, the bad, and the ugly”. Leisure Science31: 207-213.
  8. Connoly PH (2006) Psychological functioning of Bondage Domination Sado-Masochism (BDSM) practitioners. Journal of Psychology & Human Sexualitys 18: 79-120.
  9. Cross PA, Matheson K (2006) Understanding sadomasochism: An empirical examination of four perspectives. Journal of Homosexuality, 50: 133-166.[Crossref]
  10. American Psychiatric Association. (2013)Diagnostic and statistical manual of mental disorders (5th edn.). Washington: Author.
  11. Sagarin BJ, Cutler B, Cutler  N, Lawler-Sagarin KA, Matuszewich L (2009) Hormonal changes and couple bonding in consensual sadomasochistic activity. Archives of Sexual Behavior38: 186-200.[Crossref]
  12. Weierstall R, Giebel G (2017) The sadomasochism checklist: A tool for the assessment of sadomasochistic behavior. Archives of Sexual Behavior, 46: 735-745.[Crossref]
  13. Bhugra DRB,  Rahul B (2006) Sexual fantasy in gay men in India: A comparison with heterosexual men. Sexual and Relationship Therapy21: 197-207.
  14. Gagnon JH, Simon W (1987) The sexual scripting of oral genital contacts. Archives of Sexual Behavior16: 1-25.[Crossref]
  15. Moser C, LevittEE (1987) An exploratory-descriptive study of a sadomasochistically oriented sample. The Journal of Sex Research23: 322-337.
  16. Nordling N, Sandnabba NK, Santtila P, Alison L (2006) Differences and similarities between gay and straight individuals involved in the sadomasochistic subculture. Journal of Homosexuality50: 41-57.[Crossref]
  17. Joyal CC (2015) Defining “normophilic” and “paraphilic” sexual fantasies in a population-based sample: On the importance of considering subgroups. Sexual Medicine3: 321-330.[Crossref]
  18. Breslow N, Evans L, Langley J (1985) On the prevalence and roles of females in the sadomasochistic subculture: Report of an empirical study. Archives of Sexual Behavior 14: 303-317. [Crossref]
  19. Holvoet L, Huys W, Coppens V, Seeuws J, Goethals K, e (2017) Fifty shades of Belgian gray: The prevalence of BDSM-related fantasies and activities in the general population. The Journal of Sex Medicine14: 1152-1159.[Crossref]
  20. Rehor JE (2015) Sensual, erotic, and sexual behaviors of women from the “kink” community. Archives of Sexual Behavior44: 825-836.[Crossref]
  21. Phillips A (1998)A Defence of Masochism. London: Faber and Faber Ltda.
  22. Washton AM, Stone-Washton N (1993) Outpatient treatment of cocaine and crack addiction: A clinical perspective. Washington: National Institute on Drug Abuse (NIDA).
  23. Ortmann DM, Sprott RA (2013)Sexual outsiders: Understanding BDSM sexualities and communities.Toronto: Rowman & Littlefield Publishers.
  24. Sandnabba NK, Santilla P, Nordling N (1999) Sexual behavior and social adaptation among sadomasochistically-oriented males. Journal of Sex Research36: 273-282.
  25. Gabriel JBS (2007) Early trauma in the development of masochism and depression. International Forum of Psychoanalysis 6: 231-236.
  26. Guillemin F, BombardierC, Beaton D (1993) Cross-cultural adaptation of health-related quality of life measures: Literature review and proposed guidelines. Journal of Clinical Epidemiology46: 1417-1432.[Crossref]
  27. Beck AT, Rial WY, Rickels K (1974) Short form of depression inventory: Cross-validation. Psychological Reports 34: 1184-1186. [Crossref]
  28. Furlanetto LM, Mendlowicz MV, Romildo Bueno J (2005) The validity of the Beck Depression Inventory-Short Form as a screening and diagnostic instrument for moderate and severe depression in medical inpatients. Journal of Affective Disorder86: 87-91. [Crossre]
  29. Wilson G (1988) Measurement of sex fantasy. Sex and Marital Therapy3: 45-55.
  30. Bartels RM, Lehmann RJB, Thornton D (2019) Validating the utility of the Wilson Sex Fantasy Questionnaire with men who have sexually offended against children. Frontiers in Psychiatry10: 206. [Crossref]
  31. Wilson G (1978)The Secrets of Sexual Fantasy.Toronto: JM Dent & Sons Ltda.
  32. Plaud JJ, Bigwood SJ (1997) A multivariate analysis of the sexual fantasy themes of college men. Journal of Sex & Marital Therapy23: 221-230.[Crossref]
  33. Sierra JC, Ortega V, Zubeidat I (2006) Confirmatory factor analysis of a Spanish version of the sex fantasy questionnaire: Assessing gender differences. Journal of Sex & Marital Therapy32: 137-159.
  34. Gilson KM, Bryant C, Bei B, Komiti A, Jackson H, et al., (2013) Validation of the Drinking Motives Questionnaire (DMQ) in older adults. Addictive Behaviors38: 2196-2202.[Crossref]
  35. Hu L, Bentler PM (1999) Cutoff criteria for fit indexes in covariance structure analysis: Conventional criteria versus new alternatives. Structural Equation Modeling6: 1-55.
  36. Tabachnick BG, Fidell LS (2007)Using Multivariate Statistics.Boston: Pearson Education.
  37. Slavin MN,  Kraus SW, Ecker A, Sartor C, Blycker GR, et al., (2017) Marijuana use, marijuana expectancies, and hypersexuality among college students. Sexual Addiction & Compulsivity24: 248-256.[Crossref]
  38. lbert PR (2015) Why is depression more prevalent in women? [Editorial]. Journal of Psychiatry Neurosciences40:219-221.[Crossref]
  39. Cyranowski JM, Frank E, Young E,  Shear MK (2000) Adolescent onset of the gender difference in lifetime rates of major depression: A theoretical model. Archives of General Psychiatry57: 21-27. [Crossref]
  40. Ford DE, Erlinger TP (2004)Depression and C-reactive protein in US adults: Data from the Third National Health and Nutrition Examination Survey. Archives of Internal Medicine164: 1010-1014.[Crossref]
  41. King M, Semlyen J, Tai SS, Killaspy H, Osborn D, et al., (2008) A systematic review of mental disorder, suicide, and deliberate self harm in lesbian, gay and bisexual people. BMC Psychiatry8: 70.[Crossref]
  42. Lee C, Oliffe JL, Kelly MT, Ferlatte O (2017) Depression and suicidality in gay men: Implications for health care providers. American Journal of Men`s Health11: 910-919.[Crossref]
  43. Pompili M, Lester D, Forte A, Seretti ME, Erbuto D, et al., (2014) Bisexuality and suicide: A systematic review of the current literature. The Journal of Sexual Medicine11: 1903-1913.[Crossref]
  44. McCabe SE, West BT, Hughes TL, Boyd CJ (2013) Sexual orientation and substance abuse treatment utilization in the United States: Results from a national survey. Journal of Substance Abuse Treatment44: 4-12.[Crossref]
  45. McCabe SE, West BT, Hughes TL, Boyd CJ (2013) Sexual orientation and substance abuse treatment utilization in the United States: Results from a national survey. Journal of Substance Abuse Treatment44: 4-12.[Crossref]
  46. Roberts AL, Glymour MM, Koenen KC (2013) Does maltreatment in childhood affect sexual orientation in adulthood? Archives of Sexual Behavior42: 161-171.[Crossref]
  47. Corliss HL, Cochran SD,  Mays VM (2002) Reports of parental maltreatment during childhood in a United States population-based survey of homosexual, bisexual, and heterosexual adults. Child Abuse & Neglect 26: 1165-1178.[Crossref]
  48. Green KE,  Feinstein BA (2012) Substance use in lesbian, gay, and bisexual populations: An update on empirical research and implications for treatment. Psychology of Addictive Behaviors26:265-278.[Crossref]
  49. Hughes T, McCabe SE, Wilsnack SC, West BT, Boyd CJ (2010) Victimization and substance use disorders in a national sample of heterosexual and sexual minority women and men. Addiction105: 2130-2140.[Crossref]
  50. Duncan DT, Hatzenbuehler ML, Johnson RM (2014) Neighborhood-level LGBT hate crimes and current illicit drug use among sexual minority youth. Drug and Alcohol Dependence135: 65-70.[Crossref]
  51. Abdo C (2004)Estudo da vida sexual do brasileiro (Study on the Sexual Life of Brazilians) (1st edn.). São Paulo: Bregantini.