Monthly Archives: April 2019

The Mind Assesses Aggression – Russia vs the Ukraine: A Mind Genomics Exploration

DOI: 10.31038/ASMHS.2019315

Abstract

We introduce a system to rapidly explore a topic, focusing both on the direct conscious judgment of information (cognition), and on the time it takes the mind to process the same information (neuroprocessing.) The system begins with the experimental design of easily constructed mixtures of messages. With human respondents, the system measures the cognitive response to these mixtures (ratings), and at the same time, the processing rate of these same mixtures (response-time to assign a rating.) The system is affordable and scalable, working with as few as 10 respondents to as many as several thousand. The outcome data reveal what messages are important, and the response-time to process these same messages. The analysis is virtually automatic, providing a simple, readily used new tool to study decision making. All the tools are standard, easily used by professionals and novices alike, with the results immediately presented in the format of data tables and a PowerPoint® report ready for distribution.

Introduction – the conflict between ‘objective’ and ‘subjective’ in experimental psychology

During the past seventy years, since the auspicious days of the 1950’s shortly after World War II, the field of experimental psychology has been deeply involved in the measurement of subjective experience. During the previous generations it was thought that people could not be accurate instruments to assess the magnitude of external stimuli, although they could react in ways which had desired effects on their life and on their environment. Many professionals believed that people could not act as valid measuring instruments, despite the fact that people could engineer their environment to exacting tolerances. Rather than focusing on the cognitive reactions to stimuli, many experimental psychologists felt that the more appropriate measures were non-cognitive, but rather autonomic nervous system reactions. These were assumed to be more ‘truthful.’ At the very simplest level were measures such as GSR (galvanic skin response), pupil dilation, and heart rate. The feeling was that these measures were more ‘objective indicators’ of one’s reactions to external stimuli, perhaps even better than attitudinal measures. Over time, however, researchers began to recognize that they needed people to respond to the world, using scales, in order to measure the private subjective experience that could otherwise not be measured. During the period, beginning in the 1920’s but accelerating dramatically after World War II, researchers created many different standardized scales in order to measure innate feelings and proclivities. These scales range from political conservatism to fear of new foods, just to give a sense of the range.

The nature of the ‘test stimulus’ – cognitively poor vs cognitively rich

One of the ongoing issues of these experiments is the artificial nature of the stimulus, and the limits of what can be learned. In most studied focusing on what can be learned by ‘objective measures.’ The respondents are presented with test stimuli, either of a meaningless nature in terms of cognition (e.g., lights), or of a modestly meaningful nature in terms of cognitions (e.g., pictures without a context.) It is vital to do so because the typical approach of the scientific method in virtually all fields requires that the researcher isolate the variable to as pure as possible and compare the response of the organism when the variable is present versus when the variable is absent. In this manner, the difference is ascribed to the variable being studied. In such manner one begins to understand the dynamics of the so-called objective measure.

In sum, then, the reactions of the subjects in task involving those cognitively poor stimuli are analyzed to uncover patterns, which help understand how people process information. It must be emphasized here that the knowledge gleaned is from the patterns, the regularities in the response, and not from the response to the individual test stimuli, which, in the real-world, are without any real meaning. It is the opinion of the authors that a new science of the Mind is needed, one which combines the rigor of scientific interventions with test stimuli having meaning. As we will see in the study reported here, quite a bit can be learned about the way people process meaningful information, using direct judgments to understand the process of conscious judging, and using measures of response-time to understand some of the underlying neurophysiological processes.

Mind Genomics – Learning from the reactions to cognitively rich test stimuli

Author HRM was educated as a sensory psychophysicist in the middle 1960’s, with experiments involving the sense of taste. The test stimuli were aqueous mixtures of water with a taste stimulus (e.g., sugar solutions of different concentration), or aqueous mixtures of water with two taste stimuli (e.g. sugar and salt, both dissolved in the same solution.) Sensory psychophysics showed the scientific community that one could learn a great about subjective sensory perceptions. In some extensions of the sensory work, Eugene Galanter pioneered the work in scaling the utility of money [1], and Stevens himself, father of modern psychophysics inspired the use of psychophysical scaling to measure the seriousness of crimes [2].

More relevant insights into the way we think emerged when the researchers began studying responses to combinations of ideas. The combinations of ideas, i.e., mixtures of message, constitute ideal stimuli, simple and inexpensive to create and to test with people. The mixture, in the words of psychologist William James, present a ‘blooming, buzzing confusion.’ The respondent must extract the relevant information quickly from the mixture, and assign a rating to that mixture. The underlying experimental design allows the researcher to estimate the contribution of each element in the mixture. These early studies suggested responses to combinations of messages, created by experimental design, could teach us a great deal about decision-making [3].

Once researchers recognized that they could learn about the respondent’s mind from deconstructing responses to compound mixtures, it was almost a natural step to create a science of decision-making. The science of Mind Genomics was born. Mind Genomics uses the analysis of responses to mixtures of ideas in order to understand the mind of consumers to all sorts of ideas, ranging from the law to religion, to products, and so forth [4, 5] When we combine cognitive measures such as conscious judgments about these mixtures of ideas with measures that reflect neurophysiological processing of information, an easy one being response-time (RT), we may well be able to glean new insights about the way we think. When the stimuli are cognitively rich, e.g., dealing with a meaningful and possibly interesting topic, and when the measures are both conscious ratings and so-called objective physical measures, there is the greater opportunity for patterns to emerge, patterns which would never appear when the stimuli are simplistic, boring, and relatively meaningless. The world of neurophysiological studies for consumer research is beginning to grow dramatically. This paper is part of that trend [6, 7].

Comparing judgments with the time needed to make those judgments

This paper compares the content of judgments with the time needed to make the judgments. The approach uses Mind Genomics, measuring both the response to the test combinations (vignettes), and the time needed to assign the response. The experiment goes deeper, in two ways. First, the analysis separately deconstructs the response (rating), and then the response-time, into the part-worth contribution of the elements, to determine how each element or messages ‘drives’ the responses. Second, the analysis creates two Mind-Sets for the respondents based on how the elements drive the ratings (clustering on cognitive judgments), and then a separate set of two Mind-Sets for the same respondents, this time based on how the elements drive the response-time (clustering on neurophysiological data.)

We present our approach, using a small, web-based experiment with 25 respondents, set up, executed, automatically analyzed, and automatically reported in a matter of 45 minutes. We deliberately keep the study small to see how much information and insight can be extracted from a simple, cost-effective effort. Our long-term objective is to lay the foundation to easy-to-do studies, combining cognitively meaningful stimuli, judged with relevant scales by ordinary people, with the co-variate of response-time measured at the same time. We attempt to demonstrate that Mind Genomics can make researchers out of almost anyone (scalability of use), can do so inexpensively, and can investigate almost any topic where the ‘mind is king.’

The steps for the process appear in Table 1, along with the rationale for each step

Table 1. The research process combining Mind Genomics and measures of response-time.

Step

Action

Explication

1

The three goals

Relevance: The topic is relevant to people. The topic is the 2018 conflict between the Russians and the Ukrainians. The study does not look for patterns using essentially meaningless test stimuli.

Cognitively Meaningful: The topic is structured so that the individual test stimuli, the elements, are meaningful in and of themselves. The messages are stand-alone ideas.

Controls: There is one ‘ringer,’ a stimulus message which reads like an element, but has no cognitive meaning. This element is A1: Russia declares Aaron the Ukraine

2

Choose the topic

The Russian – Ukrainian conflict of 2018. This is an interesting topic, involving the potential of a strong emotion from the anticipation of a possible war

3

Choose the silos (questions)

The silos or questions should ‘tell a story.’ The silos will not be presented to the respondents, but rather used to elicit different answers, the elements. It will be the elements that will be presented in the experiment.

4

Choose the elements (answers)

Select elements which make sense, but which need not have happened, but could have happened in the past, or could happen in the future. Couch every element as a ‘fact’ using a simple declarative statement.

5

Specify the combinations (vignettes)

The elements are combined by an experimental design. The design ensures that the 16 elements are represented equally, that they are statistically independent, and that each vignette comprises at most one element or answer from each silo.

Each respondent evaluates a unique set of 24 vignettes, different from the 24 vignettes evaluated by other respondent. The uniqueness of each experimental design is guaranteed by a permutation strategy, which maintains the underlying mathematical structure, but changes the actual combinations.

6

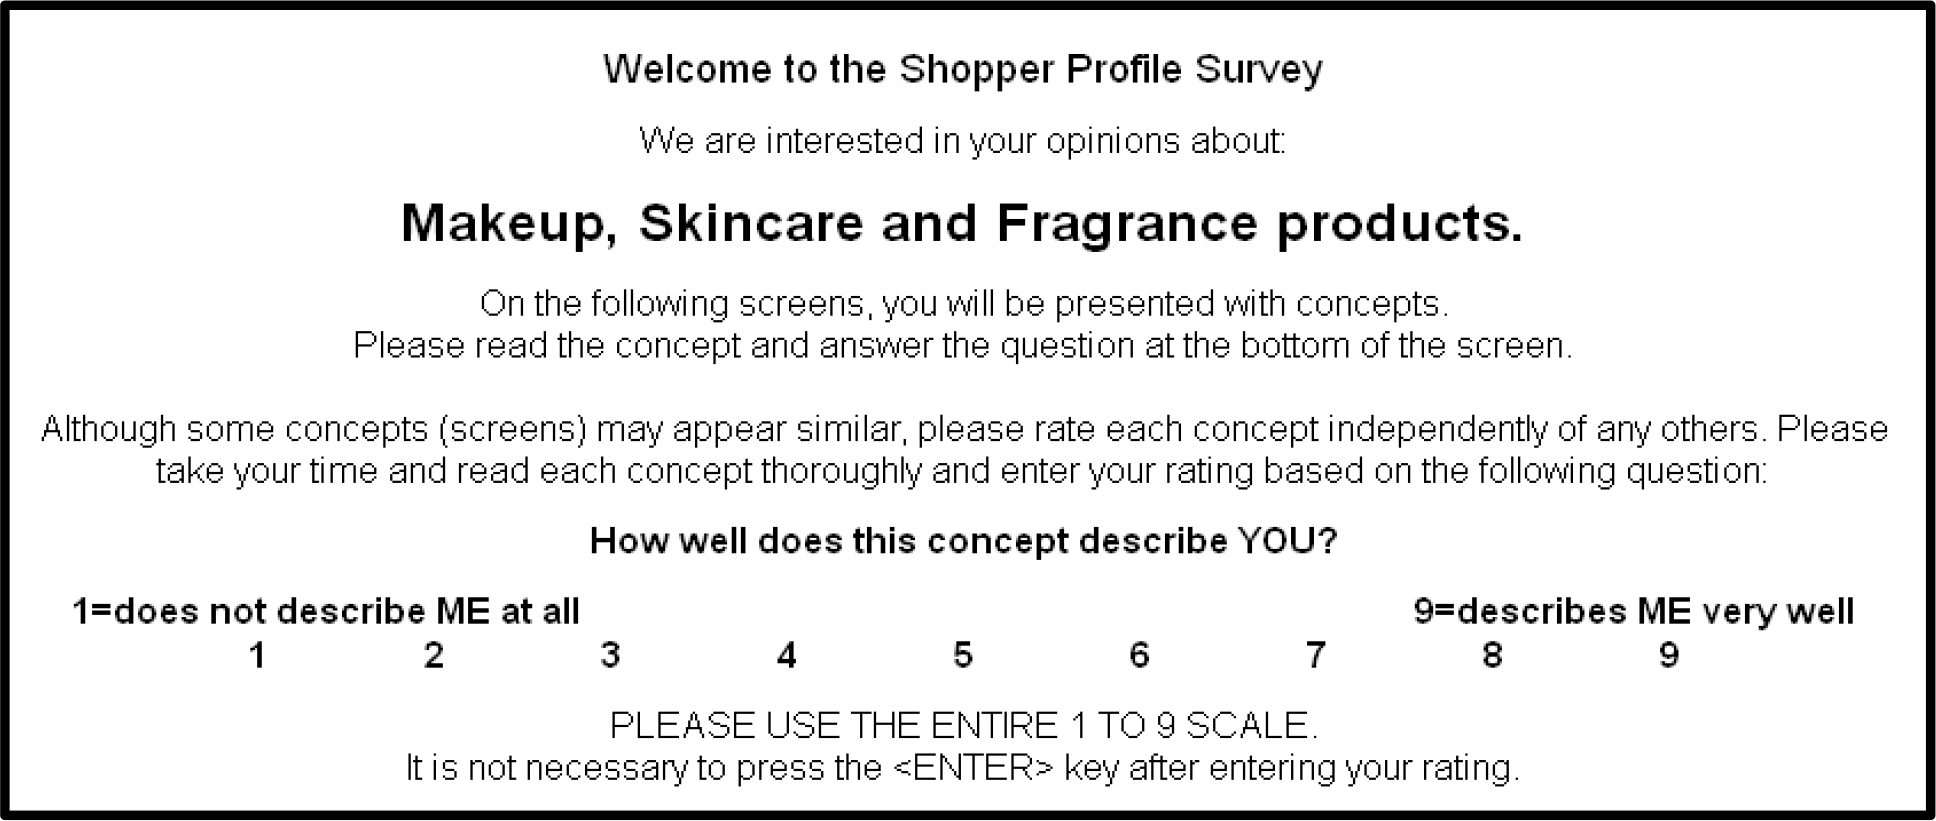
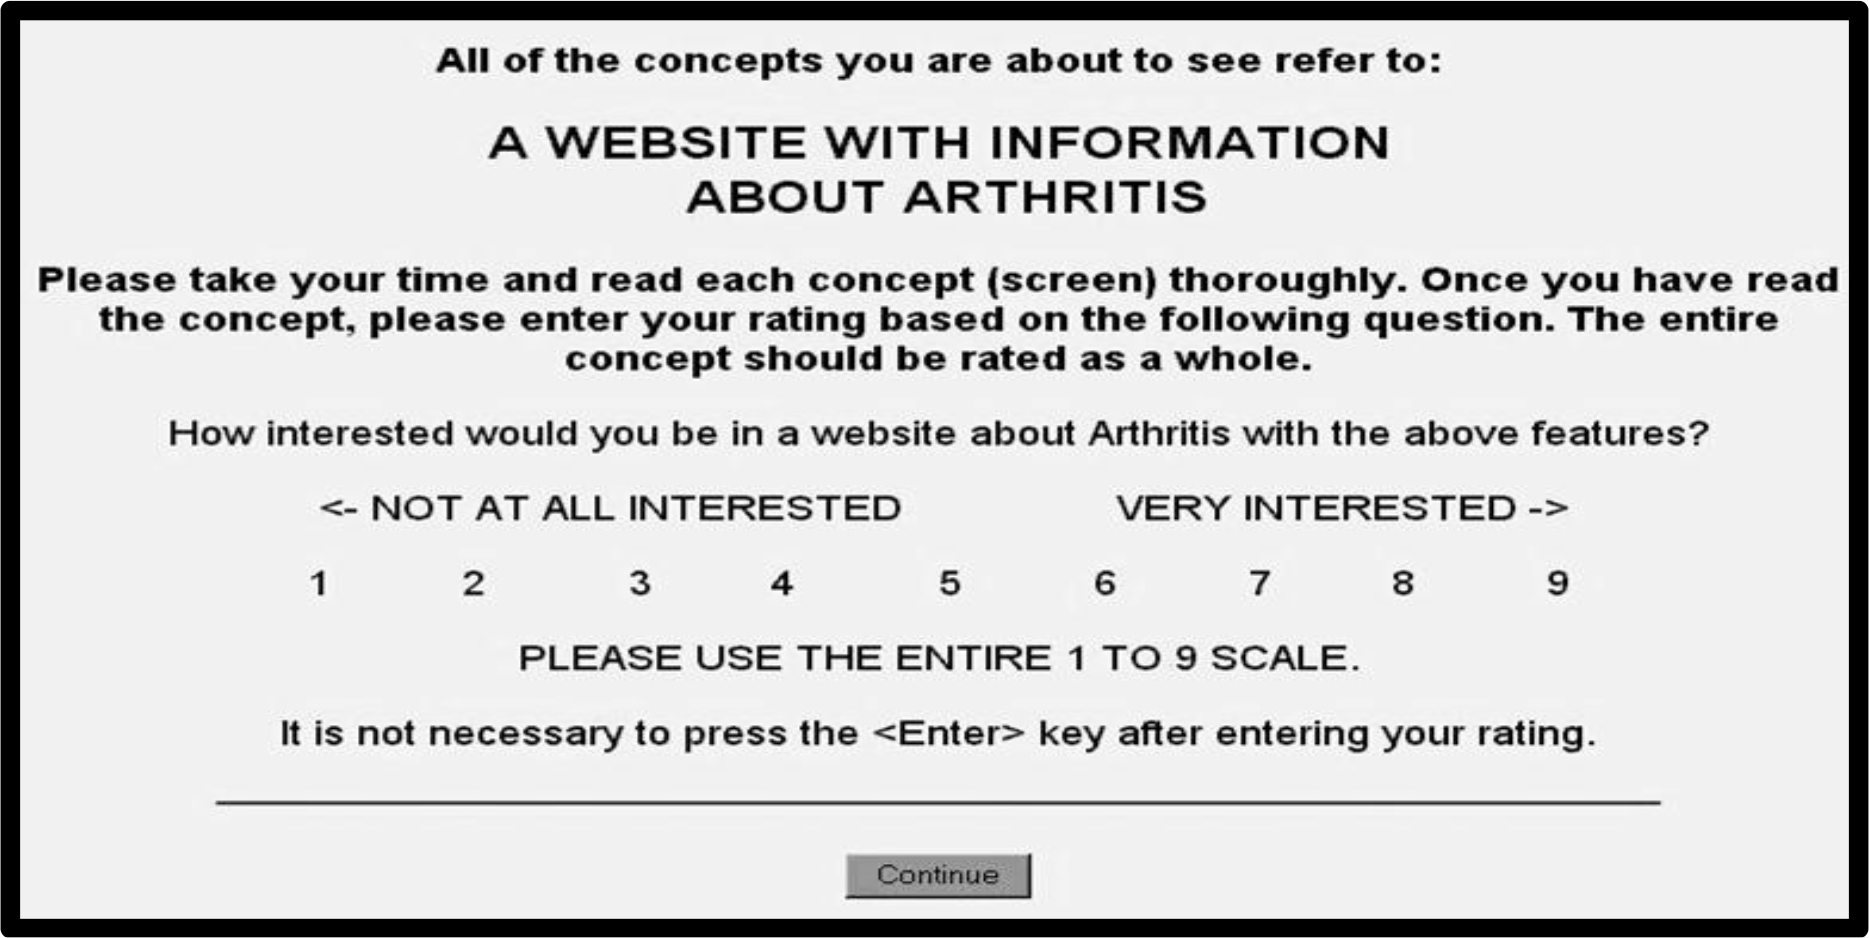
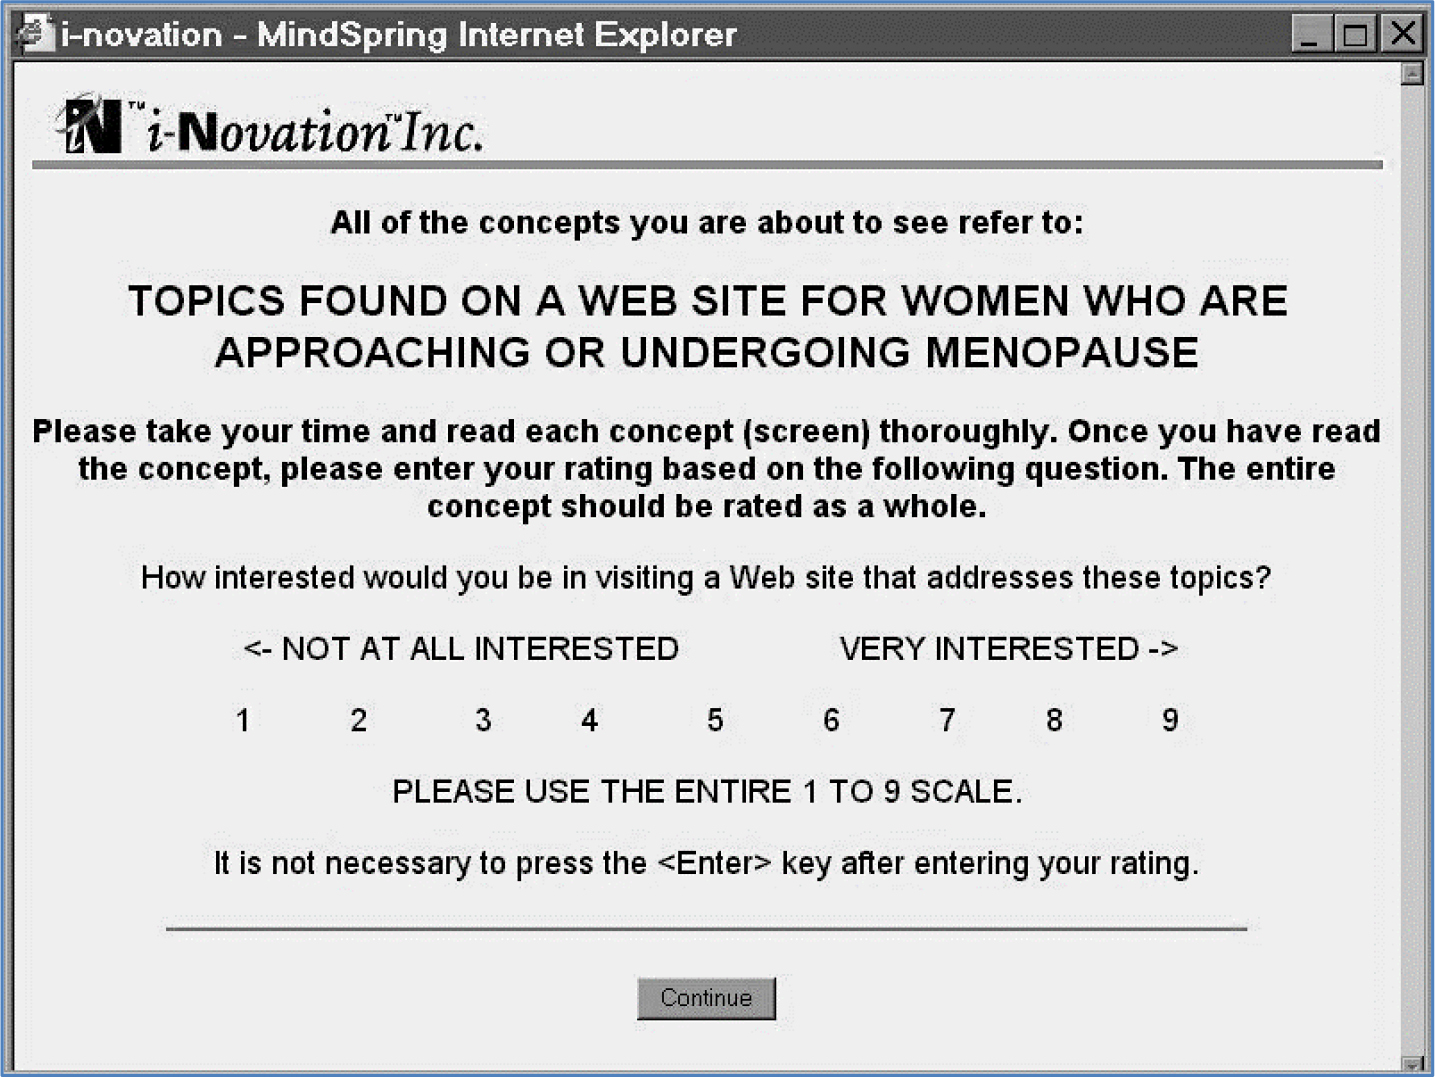
Choose an orientation page

The orientation page tells the respondents relatively little. It presents the topic in one sentence, tells the respondents they will evaluate a set of vignettes, and instructs them to consider all the elements in a vignette as part of one idea.

7

Choose the rating scale

The rating scale is typically bipolar, comprising nine points, with the lowest and highest scale points anchored with descriptor terms.

8

Invite the respondents

Use a small, affordable base of respondents, obtained from a commercial company (e.g., Luc.id, Inc.), specializing in so-called e-panels. Use a sufficient number to obtain meaningful results, but a small enough number to afford many studies. The study here involves 25 respondents, sufficient to reveal patterns, both in direct judgment of what is read, and in response-time to make the judgment.

9

Orient the respondents

Respondents do not know what to do. The orientation page presents the name of the project, and instructions to read the entire vignette or combination as a single idea.

10

Present 24 vignettes in a form easy to read

The layout of the vignette is such that no effort is made to connect the different ideas.

The design enables the respondent to ‘graze’ comfortably, rather than be encumbered by a set of connectives to be disentangled during the course of reading and comprehending.

We are interested in presenting the respondent with a set of ideas which must battle among themselves to drive the respondent’s rating. We are not interested in adding an additional complexity to the already compound stimulus.

11

Acquire ratings, measure response-time

Rating scale:    1=Tension goes away … 9= War likely to break out

12

Convert the ratings to binary

Managers don’t understand the Likert rating scale. They respond to binary (no/yes). The scale is bifurcated. Ratings of 1–6 are converted to 0 to denote ‘no war likely’. Rates of 7–9 are converted to 100 to denote ‘war likely.’

A small random number (<10–5) is added to every binary value to ensure that the regression model can be estimated, even when a respondent confines the ratings, respectively, either to 1–6 (all transformed to 0), or to 7–9 (all transformed to 100.)

13

Truncate the RT

All response-times greater than 30 are brought to 30.  These represent response-times which signal that the respondent interrupted the experiment to do something else.

14

Build models (equations) using regression analysis

Use OLS (ordinary least squares) regression to relate the presence/absence of the 16 elements to either the binary transformed ratings, or to the response-time, respectively.

15

Segment respondents into two groups, Mind-Sets, doing so twice.

On an individual-by-individual basis, relate the presence/absence of the elements to the binary transformed ratings or response-time, respectively. The modeling creates 16 coefficients for the binary transformed ratings, and another 16 coefficients for the   response-time, respectively.

Then, either for the binary transformed models or for the response-time models, cluster the respondents into two, complementary, non-overlapping groups, or mind-sets.

The foregoing represents two clustering efforts, based first on the coefficients for the ratings, then based second on the coefficients for response-time.

16

Assess the Mind-Sets

Do the Mind-Sets ‘make sense’

17

Plot response-time versus rating

Using the 16 coefficients, plot the coefficient for response-time (ordinate) against the coefficient for rating (binary, on the abscissa). Look for a relation between ‘meaning’ and response-time

The study

The Russian- Ukrainian conflict of 2018, began some years back [8, 9]. The topic, a geo-political conflict, is meaningful in terms of everyday life, but not widely understood. Even when the respondents are not familiar with the topic, the test stimulus (vignette) presents sufficient information for the respondent to make judgments based upon what is presented, and based upon their own understanding of current events, whether deep or only superficial. Thus, the messages can talk about peace and war, as realistic, but rather ‘remote’ topics. Our comparison of cognitive measures (ratings) and neurophysiological measures, will make sense in terms of dealing with ‘real world’ issues.

Table 2 shows the set of four questions, and the four answers to each question. (Table 2) also shows the number of ‘key words’ (information) in each element.

Table 2. The four questions and the four answers to each question. The topic is the Russian Ukrainian conflict in 2018.

Questions and Answers

Question A: What does Russia do?

A1

Russia declares Aaron the Ukraine

A2

Russia block the strait between Crimea and rest of Ukraine

A3

Russia imposes economic sanctions on Ukraine

A4

Russia show muscle in surrounding areas

Question B: What do the Ukraine do?

B1

Ukraine seeks help from NATO

B2

Ukraine seeks help from the United States

B3

Ukraine confiscates Russian property

B4

Ukraine seeks military help from NATO

Question C: What does the US do?

C1

United States provides military help to Ukraine

C2

United States block access of Russia to money

C3

United States militarizes countries surrounding Russia

C4

United States through President Trump makes its displeasure public

Question D: What does NATO do?

D1

NATO provides military forces

D2

United Nations provides military force

D3

United Nations brings Russia to the international court

D4

NATO grants membership to countries surrounding Russia

One of the key features of Mind Genomics is that it enables the researcher to use relatively few respondents for exploratory studies, such as the one reported here, or many respondents to define a topic area with a large, representative sample of respondents. The power of Mind Genomics, and its ability to work with few respondents, comes from the use of ‘permutable’ experimental designs, with each respondent presented with a full experimental design, different in combinations from the experimental design of the same material presented to another respondent [10] Thus, even with as few as 25 respondents, one can cover a wide space of 600 alternative combinations of messages, far more than most conjoint studies ever attempt to explore [11].

The respondent’s experience

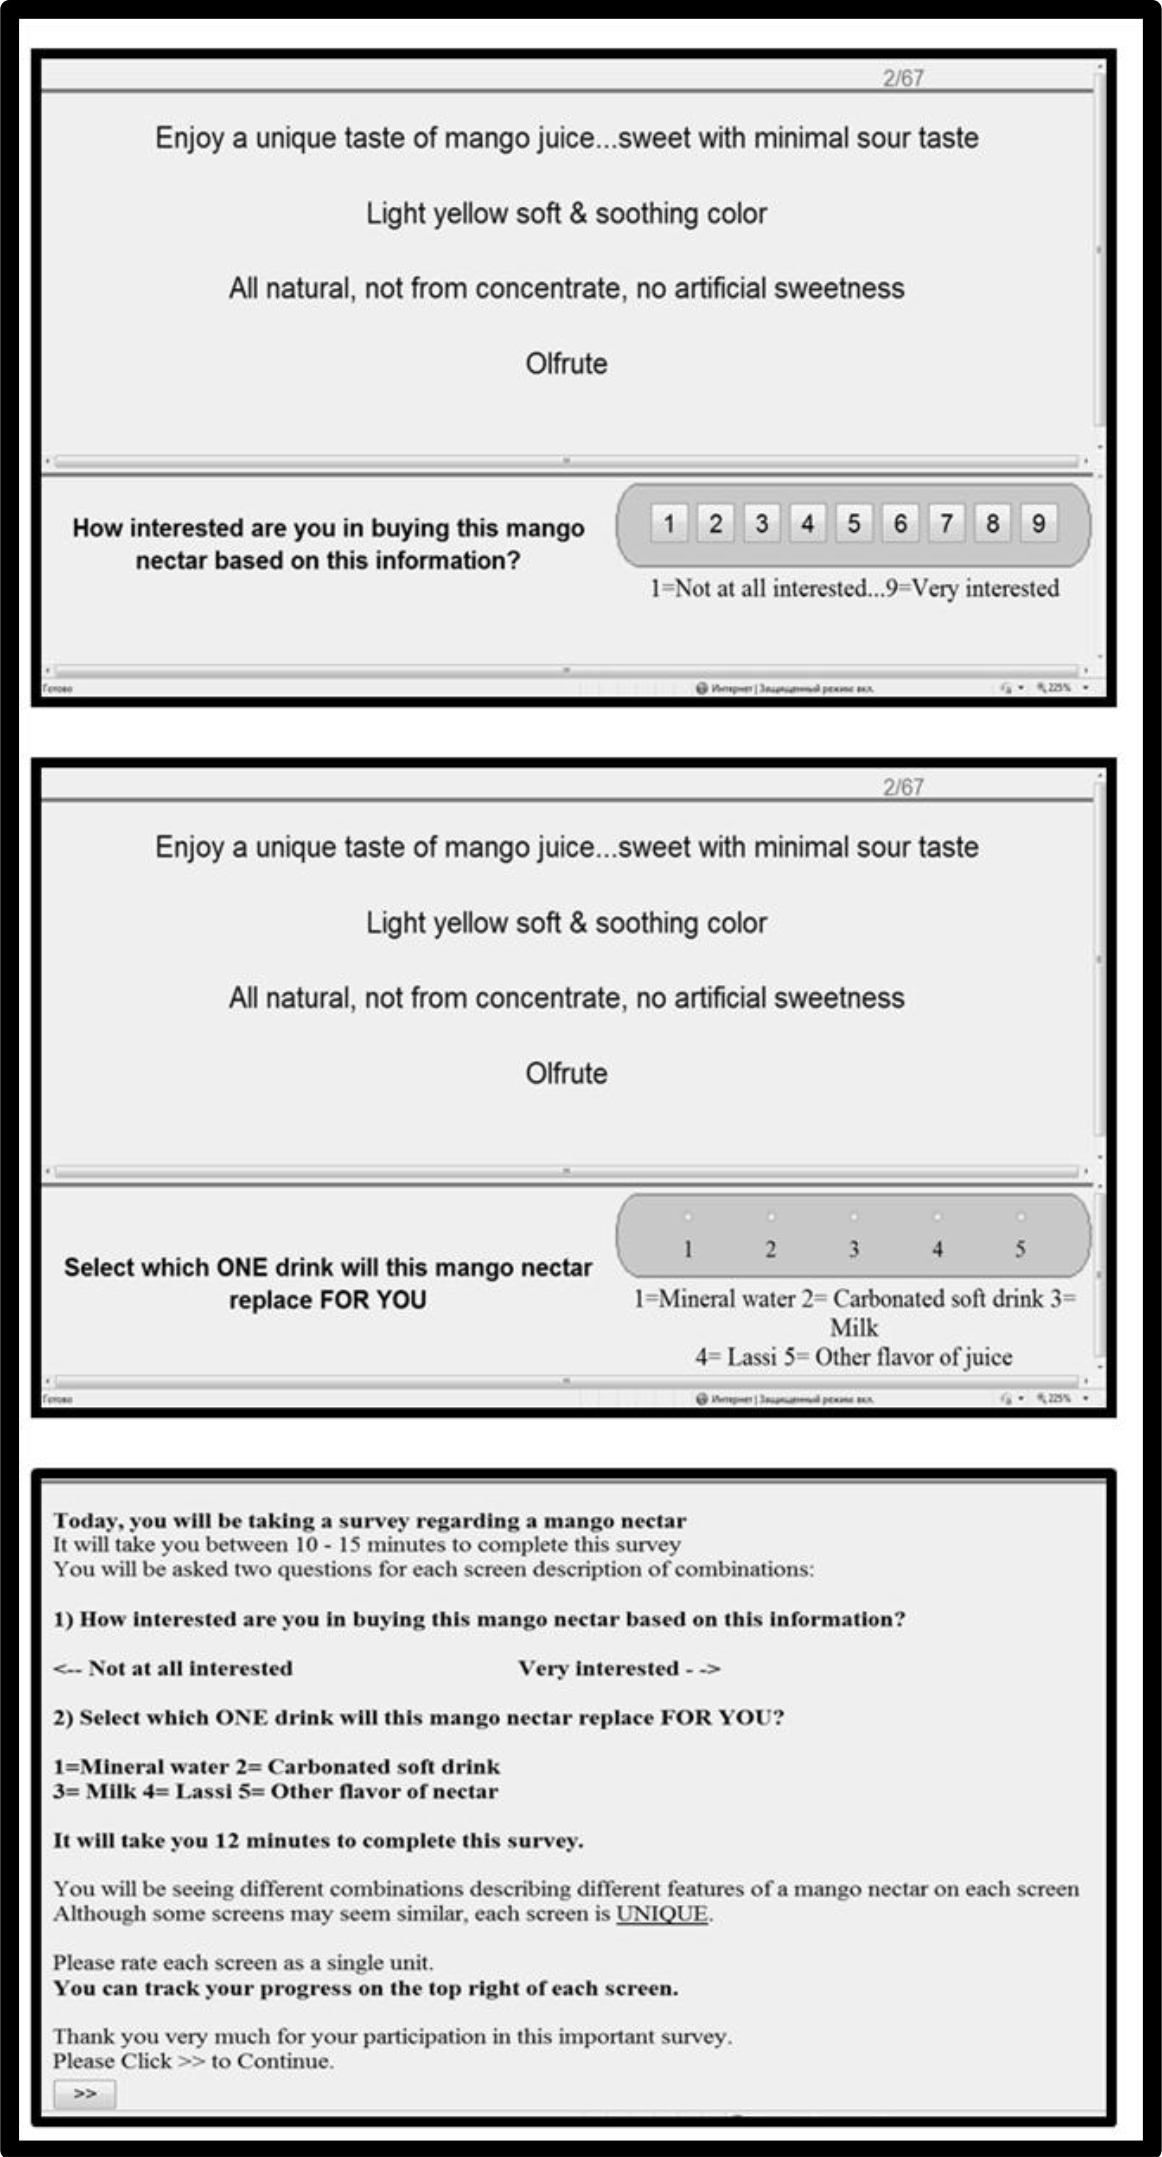
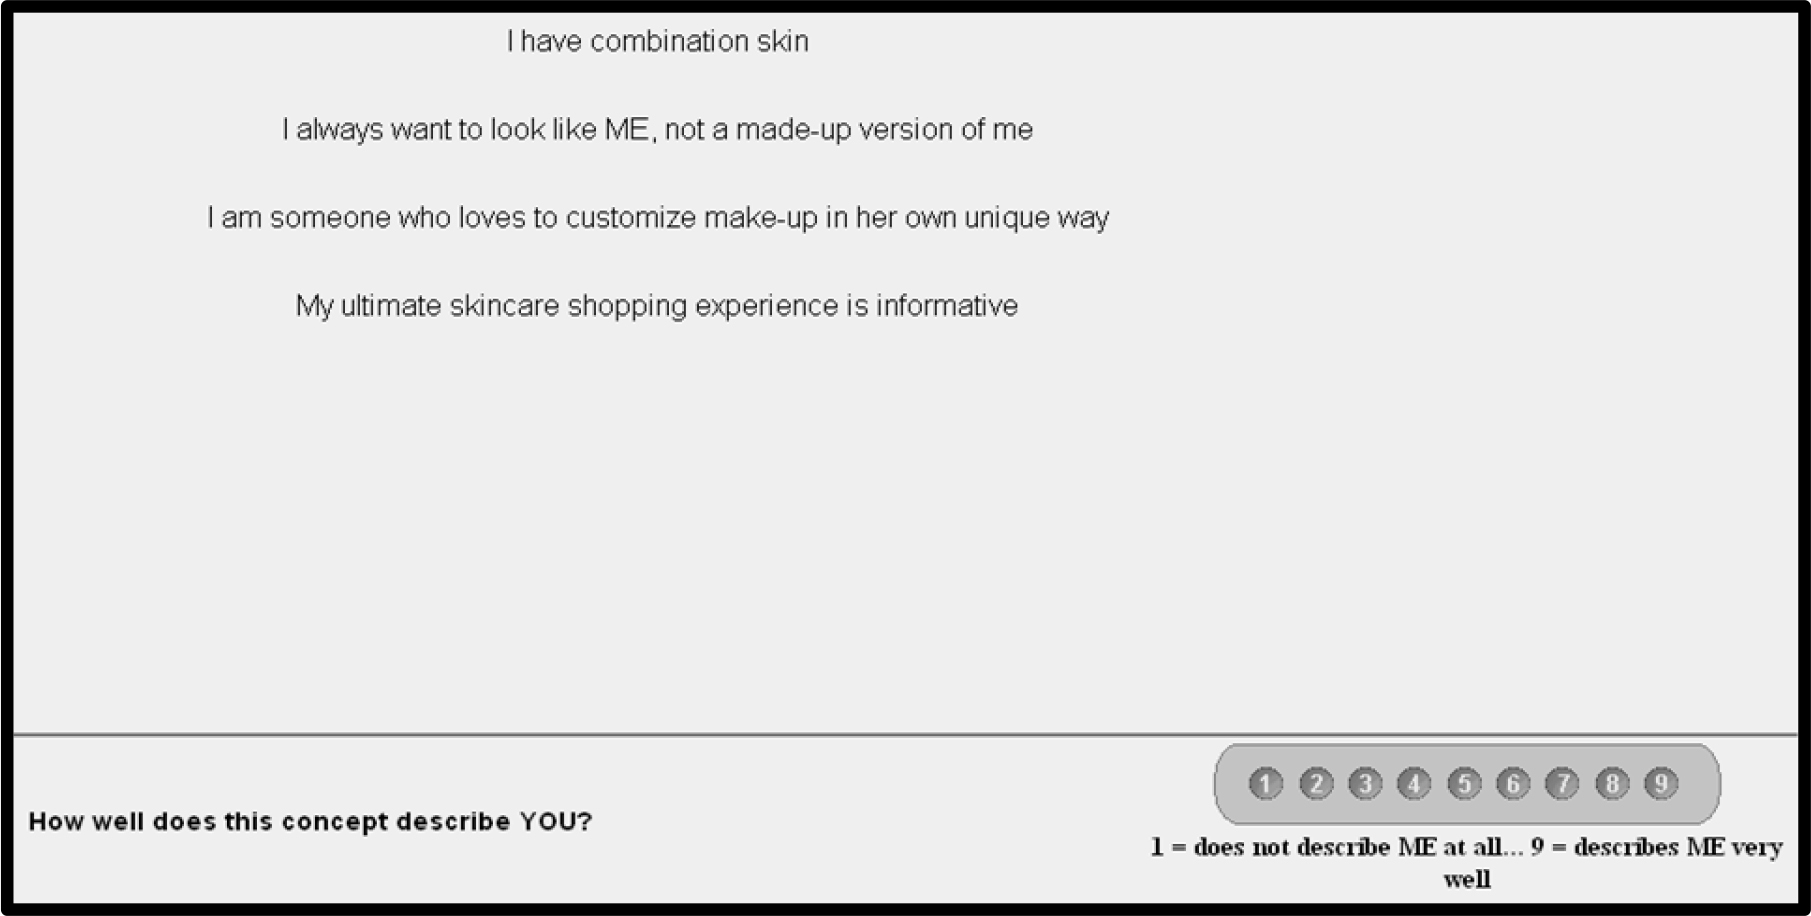
The respondent reads each of the 24 vignettes, rating each vignette as a totality. The Mind Genomics APP (BimiLeap) records the rating and the response-time. (Figure 1) shows an example of the layout of the study on smartphone. The respondent can also participate with a personal computer or a tablet. There are biases in surveys. One of these biases is the desire of the respondent to please the researcher or the interviewer, by giving politically appropriate, non-confrontational answers to questions. This tendency to please the interviewer is promoted both by a personal interview, and by having questions on the interview which allow a person to slant her or his answers in the appropriate way. In contrast to the foregoing, Mind Genomics experiments are virtually impossible to ‘game.’ Mind Genomics experiments are done in the privacy of one’s home, on a computer, away from other people, so there is no interviewer bias. More importantly, however, Mind Genomics studies are impervious to the desire to be ‘politically correct.’ Test stimuli continually change, with ever-changing combinations appearing one after another.

Mind Genomics-013 - ASMHS Journal_F1

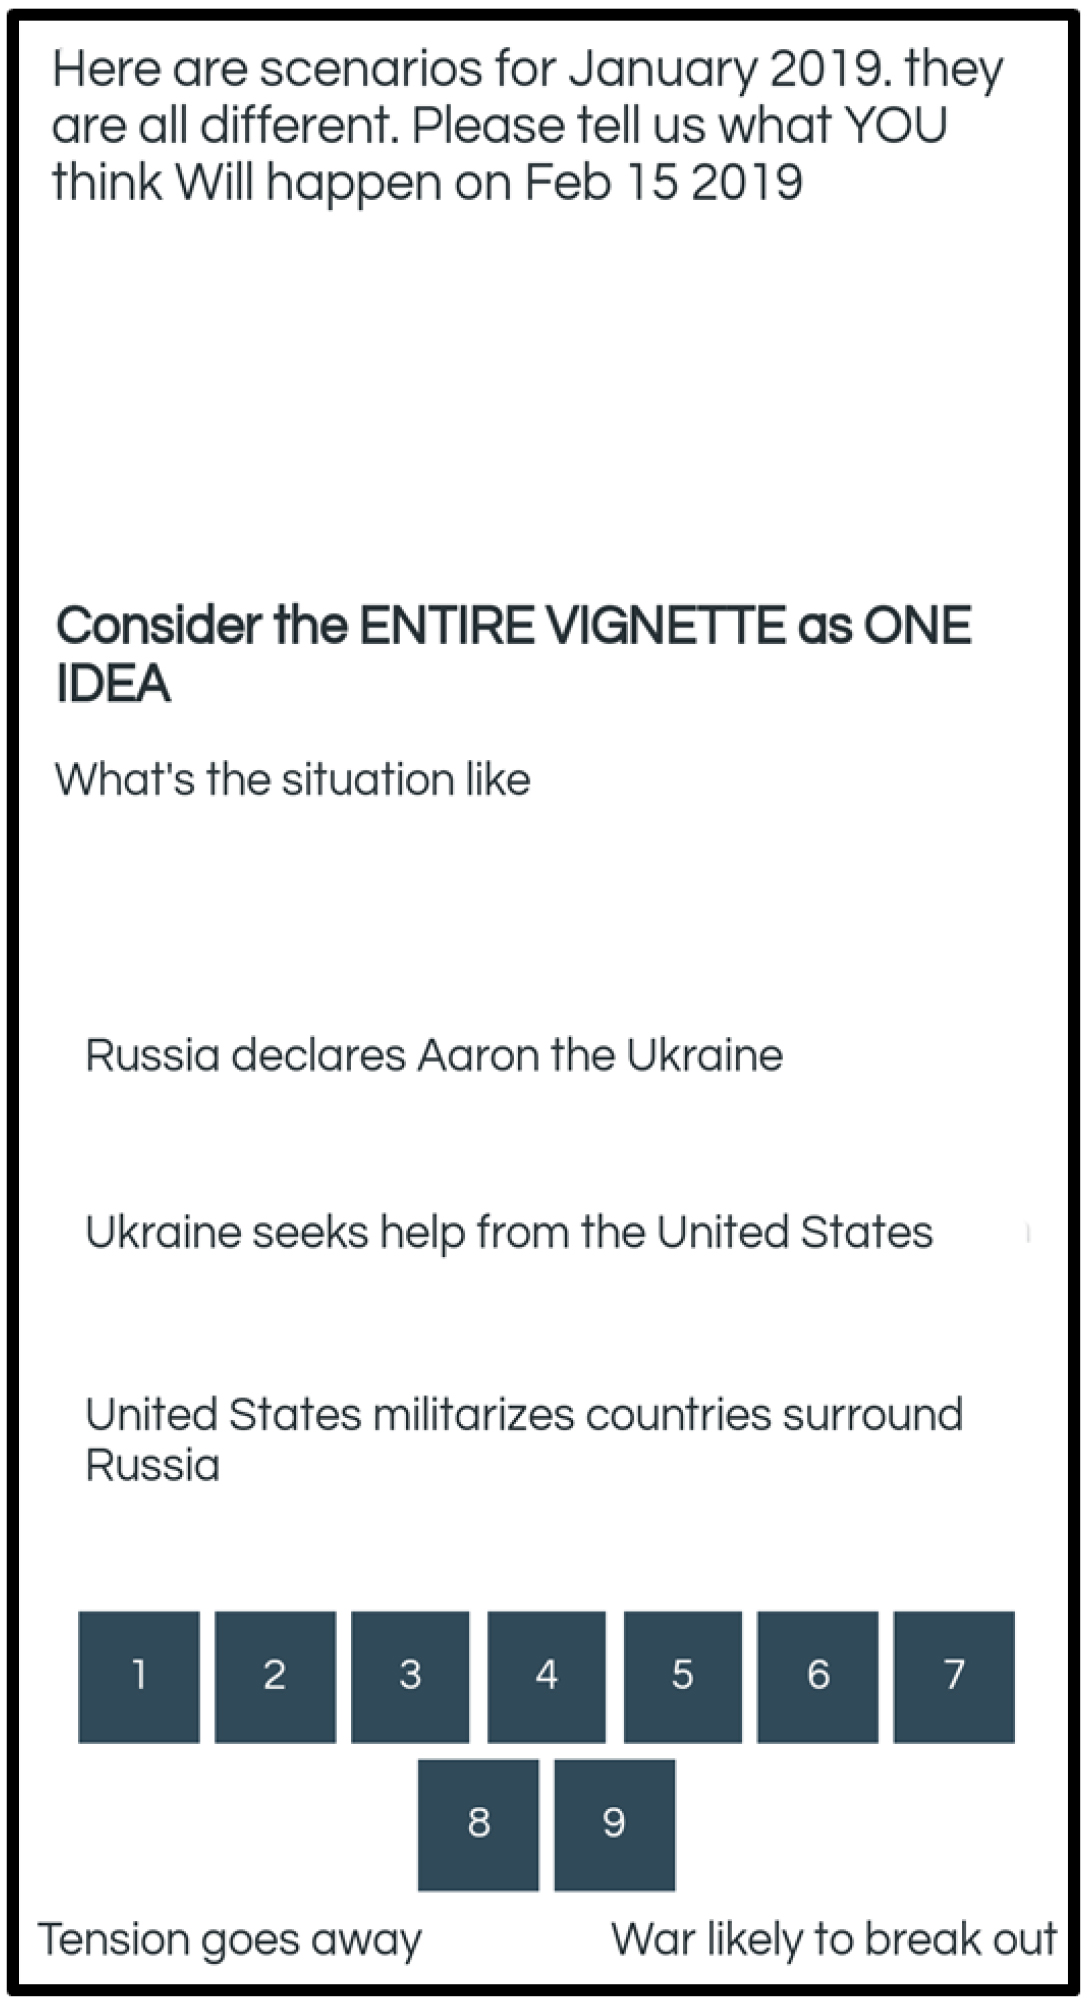
Figure 1. Example of the respondent experience. The figure shows the presentation of a vignette on a respondent’s smartphone. The Mind Genomics study can be done using any device which can show websites, such as smartphones, personal computers, and tablets, respectively.

Results

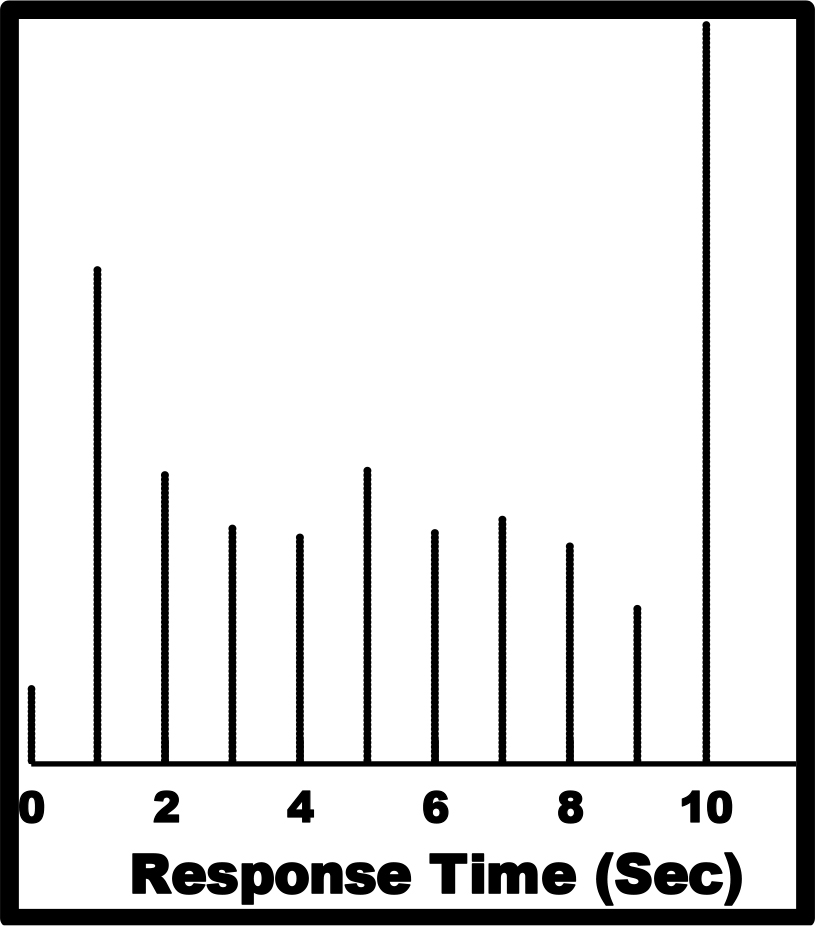
A very simple first analysis computes the average rating, and the average response-time, respectively, for each of the 24 positions. Every respondent evaluated 24 unique vignettes. It is not the vignette itself which interests us, but rather whether there is a position effect. Figures 2A-2C show that there is no clear position effect for the average 9-point rating by position (Figure 2, left panel), nor for the average binary-transformed value by position (Figure 2, middle panel.) There is a clear position effect for the response-time, RT. The first position shows a higher average response-time, perhaps because the respondent is discovering what to do (Figure 2, right panel.) The strong position effect means that it will be more judicious to consider, where appropriate, the data without taking into account the first test vignette, i.e., the vignette in position #1.

Mind Genomics-013 - ASMHS Journal_F2

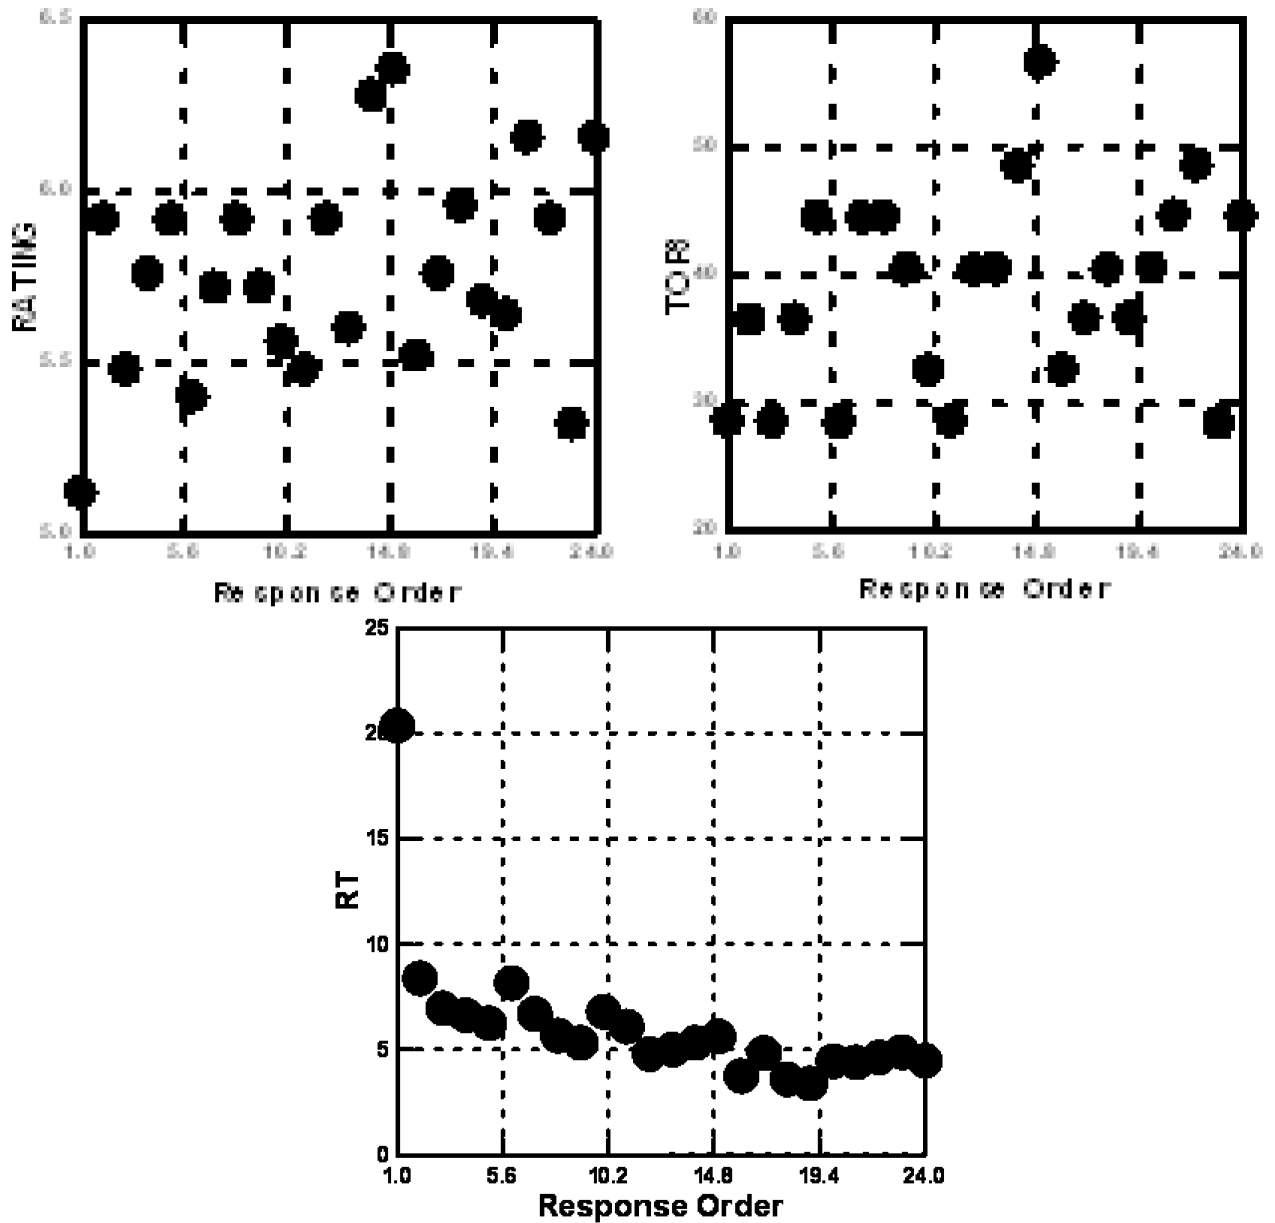
Figure 2. The covariation with response order of ratings of the 9-point scale (left panel), the binary transformed scale (middle panel), and the response-time (right panel.)

The deconstruction of the responses is done by OLS, ordinary least-squares. The independent variables are the presence/absence of the 16 elements or answers to the four questions. They take on the value ‘1’ when present in a vignette, or ‘0’ when absent. The dependent variables are either the binary values (0/100) after transformation of the original 9-point ratings, or the response-time in seconds, from the time the vignette appeared to the time that the respondent assigned a rating.

Clustering respondents on the basis of ratings of the elements

Clustering is a well-accepted method in statistics to divide objects by their patterns. The software is readily available [12]. The r clustering method is a matter of choice. The clustering used here computes a measure of ‘distance’ between each pair of respondents based upon the Pearson correlation between their corresponding 16 coefficients, one per element. The distance is expressed as (1-Pearson R.) When two respondents show a perfect linear relation, the Pearson R is +1 and the distance is 0. When two respondents show a perfect inverse relation, the Pearson R is -1 and the distance is 2.

Table 3 shows the results for the deconstruction of the binary values, for the total panel and for three mind-set segments emerging from clustering the respondents based on the set of 16 coefficients generated from the individual models. The dependent variable was always the respondent’s rating, either 0/100.

Table 3. Parameters of models relating the presence/absence of the 16 elements in vignettes to both the binary-transformed ratings (also called Top3), and to the response-time (RT). The table shows the results from the total panel and from two Mind-Sets (segments) emerging from clustering. The clustering was done based upon the coefficients for the ratings (binary transformed, Top3) of the 16 elements, from the 25 respondents.


Segment by Cognitive Response

(Binary Transformed =Top3 Rating for ‘War’)


From Grand Model w/o Test Order #1

Top 3 – Total

Top 3 – MS1

Top 3 – MS2

RT – Total

RT – MS1

RT – MS2


 Additive Constant

25

27

21

Top3Mind-Set 1:

 War if direct military action

C2

United States blocks access of Russia to money

9

19

0

1.2

1.8

0.7

B1

Ukraine seeks help from NATO

8

17

2

1.4

1.0

1.8

A4

Russia show muscle in surrounding areas

3

11

-5

1.5

1.3

1.5

B3

Ukraine confiscates Russian property

-2

9

-11

2.1

1.1

3.0

A2

Russia block the strait between Crimea and rest of Ukraine

2

9

-5

2.2

1.8

2.6

Top3 Mind-Set 2:

War if military build-up

C3

United States militarizes countries surround Russia

8

1

15

1.1

1.8

0.6

C1

United States provides military help to Ukraine

8

3

14

0.9

1.4

0.5

D1

NATO provides military forces

8

4

13

1.1

1.1

1.0

D4

NATO grants membership to countries surrounding Russia

7

3

13

1.3

1.0

1.5

D2

United Nations provides military force

7

0

12

2.0

2.0

2.1

C4

United States through President Trump makes its displeasure public

3

0

9

1.0

2.1

0.2

No clear perception of potential war

D3

United Nations brings Russia to the international court

5

5

5

1.4

1.5

1.3

B2

Ukraine seeks help from the United States

3

6

-1

2.3

1.7

2.7

A3

Russia imposes economic sanctions on Ukraine

-1

-1

-1

1.8

1.6

1.8

A1

Russia declares Aaron the Ukraine

-3

-4

-1

2.7

1.4

3.6

B4

Ukraine seeks military help from NATO

2

8

-2

1.8

1.0

2.5

After clustering to reveal the two pairs of Mind-Sets, each respondent was assigned to the appropriate Mind-Set for the binary rating, and the appropriate Mind-Set for Response Time. For all models, the data from the first vignette (Response Order 1) was discarded. Then, the first vignette tested by each respondent was eliminated from the data set, and OLS regression was run on all the data from all the respondents in the particular Mind-Set. This is the so-called Grand Model. The analysis thus generated four Grand Models.

Table 3 shows the parameters of the Grand Models created from the group data (Total Panel, Respondents in MS1, and Respondents in MS2). The first three columns of data show the coefficients from the binary models (called Top3). The second three columns of data show the coefficients from the response-time (RT) models for the same respondents, segmented using their ratings of the vignettes.

It is clear that there are two Mind-Sets, based on clustering respondents according to their ratings of perceived likelihood of war. Mind-Set 1 feels that war will break out if there is direct military action. Mind-Set 2 feels that war will break out if there is an arms build-up.

Associated with each of these elements is also a response-time measure. Those response times of two seconds or longer are shown in bold and shaded. These are elements which ‘stop’ the respondent, engaging the respondent. We do not know whether the respondent could verbalize that these particular elements are engaging, but the regression analysis deconstructs the response time into the contribution of these elements (Table 3).

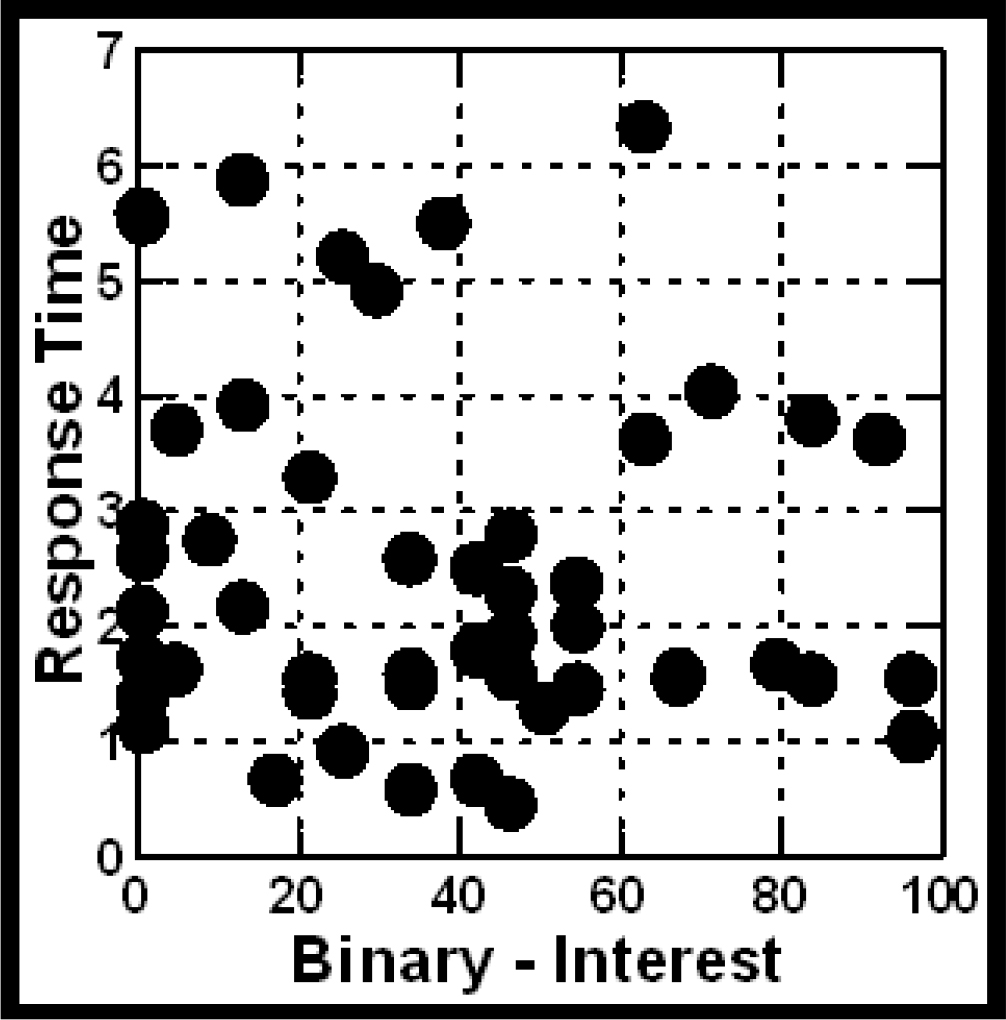
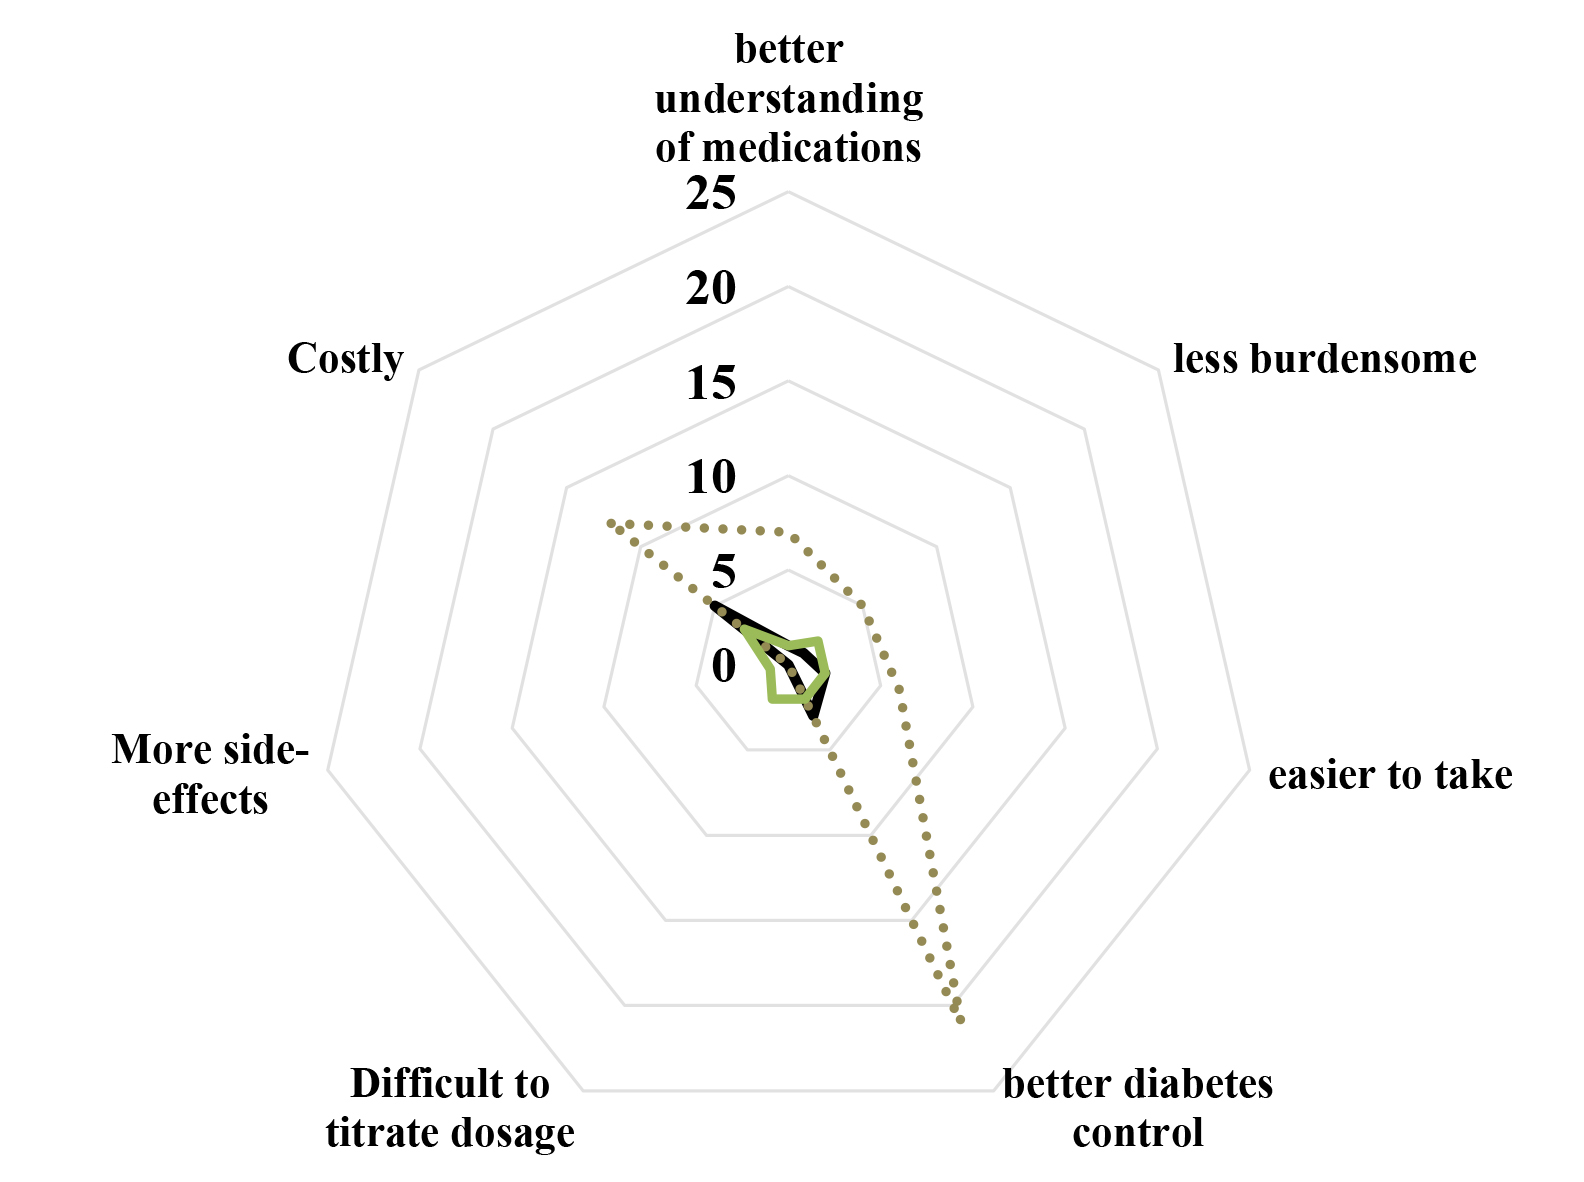
The response-time data become more interesting when the response-time coefficient is plotted against the binary-transformed or Top3 coefficient, either for the total panel, or for the Mind-Sets. (Figure 3) shows a clear pattern for total panel, as well as for the two Mind-Sets. As the perception of ‘likelihood of war’ increases (abscissa) the response-time of the element diminishes. For this cognitively relevant task, evaluation of the likelihood of war, we see a definite pattern relating a neurophysiological-based measure, response-time, to a judgment criterion, likelihood of war. The more likely the sense of ‘war’ breaking out, the faster the response time, when the plot is at the level of the 16 individual elements. In other experiments by author HRM, dealing not with critical events but with ordinary products, like yogurt, this straightforward pattern does not emerge (see appendix to this paper).

Mind Genomics-013 - ASMHS Journal_F3

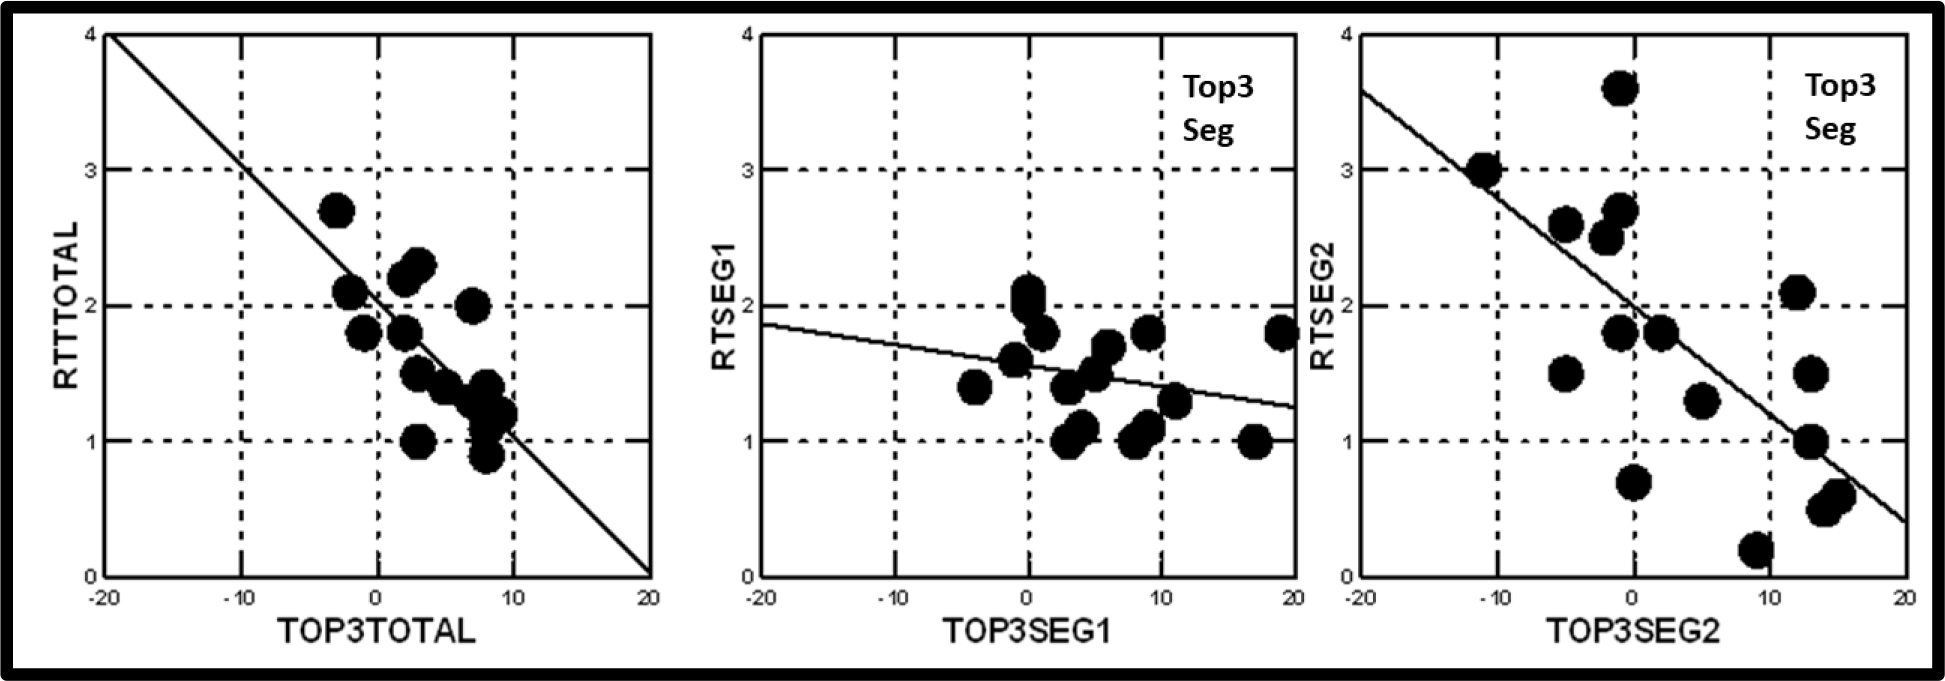
Figure 3. The relation between the coefficient for response-time (RT) for the element (ordinate) and the coefficient of the same element from the model for ‘likelihood of war’ (abscissa.) The Mind-Set segments, MS1 and MS2 were obtained by segmenting the 25 respondents based upon the coefficient for Top3, the binary-transformed response of the rating scale.

Does segmentation on the basis of response-time produce meaningful patterns?

Just as one may cluster the respondents based on their judgments of what they perceived to drive the likelihood of war, so one may cluster the same respondents on the pattern of what drives response-times. The mechanics of clustering remain the same. The only differences are the nature of the models, and the interpretation of the meaning of the segmentation.

The clustering process begins by building a model for each respondent, using all 24 vignettes, despite the bias encountered with the first vignette. There is no other option. Each respondent generates a pattern of 16 coefficients, which can be divided into two (or more) clusters. Table 4 shows the parameters of the models for the 16 elements, for models using as the dependent measure response-time (first three data columns), and the binary transformed rating (Top 3, second three data columns.)

Table 4. Parameters of models relating the presence/absence of the 16 elements in vignettes to both the binary-transformed ratings (also called Top3), and to the response-time (RT). The table shows the results from the total panel and from two Mind-Sets (segments) emerging from clustering. The clustering was done based upon the coefficients for response-time of the 16 elements, from the 25 respondents.

Segmented by Response-time


From Grand Model w/o Vignettes in Test Order #1

RT Total

RT MS1

RT MS1

Top3 Total

Top3 MS1

Top3 MS2


Additive constant –

NA

NA

NA

25

35

15

RT Mind Set 1 – Engaged the image of third forces coming into the fray

D2

United Nations provides military force

4.1

7.7

1.2

7

0

13

A1

Russia declares Aaron the Ukraine

5.0

6.9

2.6

-3

-16

8

B2

Ukraine seeks help from the United States

4.6

6.3

3.3

3

-8

14

RT Mind Set 2 – Engaged by reading about description of actions

A2

Russia block the strait between Crimea and rest of Ukraine

3.0

2.2

3.5

2

-14

14

B3

Ukraine confiscates Russian property

2.3

2.0

2.6

-2

-14

9

C2

United States block access of Russia to money

-0.7

-4.4

2.6

9

14

6

C4

United States through President Trump makes its displeasure public

-0.9

-4.9

2.5

3

-3

5

C3

United States militarizes countries surround Russia

-0.6

-3.8

2.4

8

3

11

B4

Ukraine seeks military help from NATO

1.9

1.5

2.2

2

-7

10

A4

Russia show muscle in surrounding areas

1.9

1.7

2.0

3

-11

15

Not strongly engaging

A3

Russia imposes economic sanctions on Ukraine

2.2

2.3

1.9

-1

-11

10

B1

Ukraine seeks help from NATO

1.5

1.1

1.5

8

1

15

D4

NATO grants membership to countries surrounding Russia

1.4

1.8

1.4

7

2

14

D1

NATO provides military forces

1.4

1.7

1.3

8

5

12

D3

United Nations brings Russia to the international court

1.5

1.4

1.2

5

-5

12

C1

United States provides military help to Ukraine

-1.1

-3.7

1.2

8

14

1

In order to assess the ‘meaningfulness’ of the segmentation based on response-time, it is necessary to look at the nature of the clusters in terms of what is responded to most rapidly. It appears that the words ‘United States’ drive the fastest response for Mind-Set1, and the words’ United Nations’ and ‘NATO;’ drive the fastest response for Mind-Set2.

It might well be that the segmentation and clustering on the basis of cognitive responses identify group differences due to ‘ideas’, whereas segmentation and clustering on the basis of response-time identify group differences due to specific ‘words.’ Finally, Figure 4 shows the relation between the coefficient for response-time for the element (ordinate) and the coefficient from the model for ‘likelihood of war.’ This time the Mind-Set segments MS1 and MS2 come from the segmentation by response-time. Mind-Set 1 in (Figure 4), focusing on the search for words, shows a clear relation between response-time and belief that war will break out. Mind-Set 2 in Figure 2 shows no such relation (Table 4).

Mind Genomics-013 - ASMHS Journal_F4

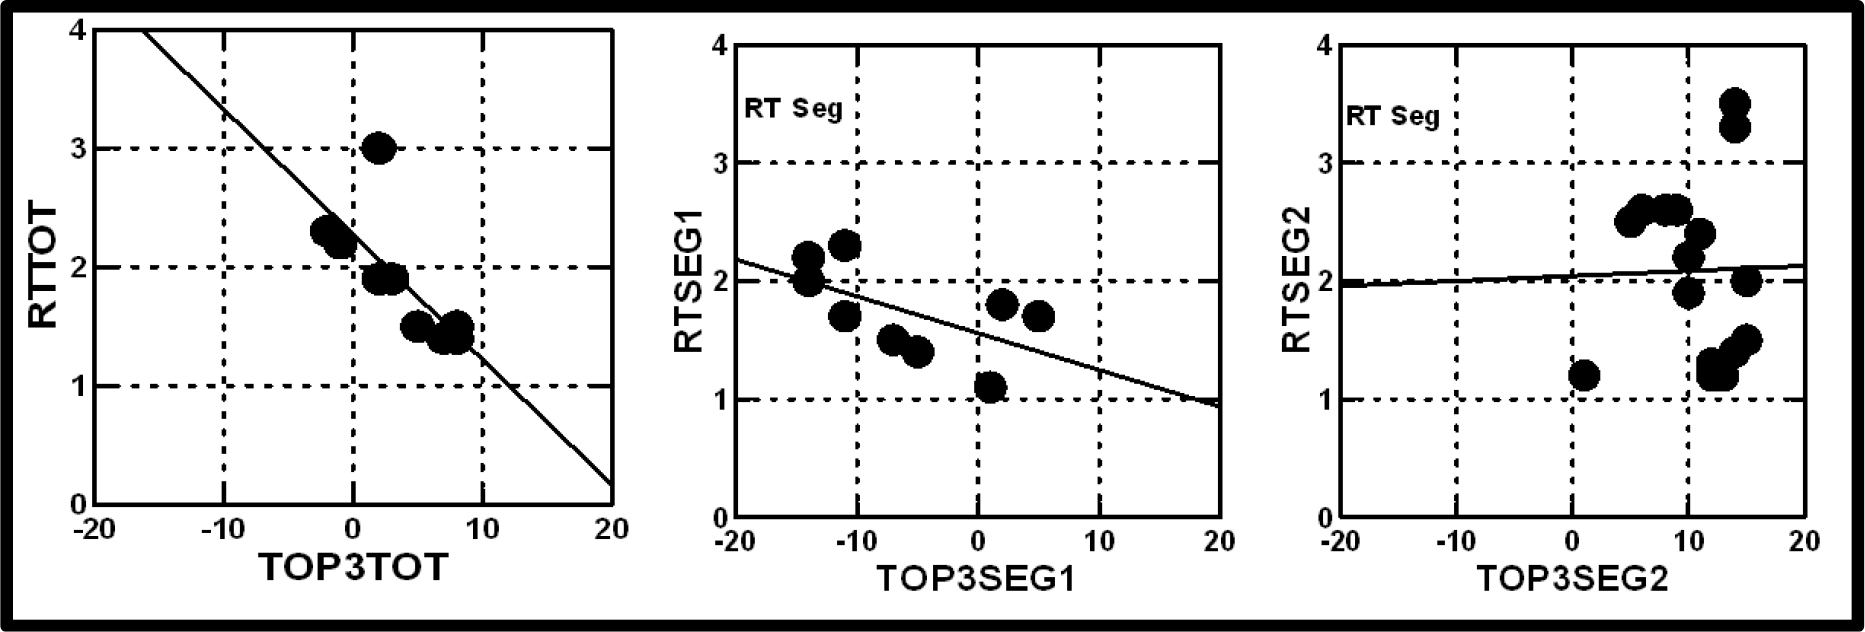
Figure 4. The relation between the coefficient for response-time (RT) for the element (ordinate) and the coefficient of the same element from the model for ‘likelihood of war’ (ordinate.) The Mind-Set segments, MS1 and MS2 were obtained by segmenting the 25 respondents based upon the coefficients for Response-Time.

Applying the approach – assigning a new person to a mind-set

Our small study here identified a potential pair of mind-sets in the population, those who believe that the path to war occurs by direct action (Mind-Set 1) versus occurs by military build-up (Mind-Set 2.) We used only 25 respondents, but we were able to uncover two mind-sets when we clustered on the basis the coefficients derived from the ratings. The analogy here is the discovery of basic colors, the red, yellow and blue, with a small set of test stimuli. Mind Genomics allows us to identify these basic mind-sets even with a small group of respondents.

The next level of effort is to use this discovery of two mind-sets to understand the world. Examples of such understanding and fundamental problems to be addressed in light of our small discovery are:

How do these two mind-sets distribute around the world, by age, by gender, by government, by personal history?

Over time, does a person remain in the same mind-set? Are these two mind-sets fixed, or can a person first be a member of one mind-set, but through life experience change into the other mind-set?

Is there a relation between membership in a mind-set and education?

If one can do many of these studies on the political world, then can one extract other mind-sets for other topics, such as negotiation, and study the membership pattern of a single individual across many mind-sets?

Does membership in the mind-set co-vary with any exogenous, measured behavior, such as political activism?

And perhaps, most controversial, is there a relation between the genetics of an individual (e.g., revealed by chromosomal mapping) and membership in a mind-set?

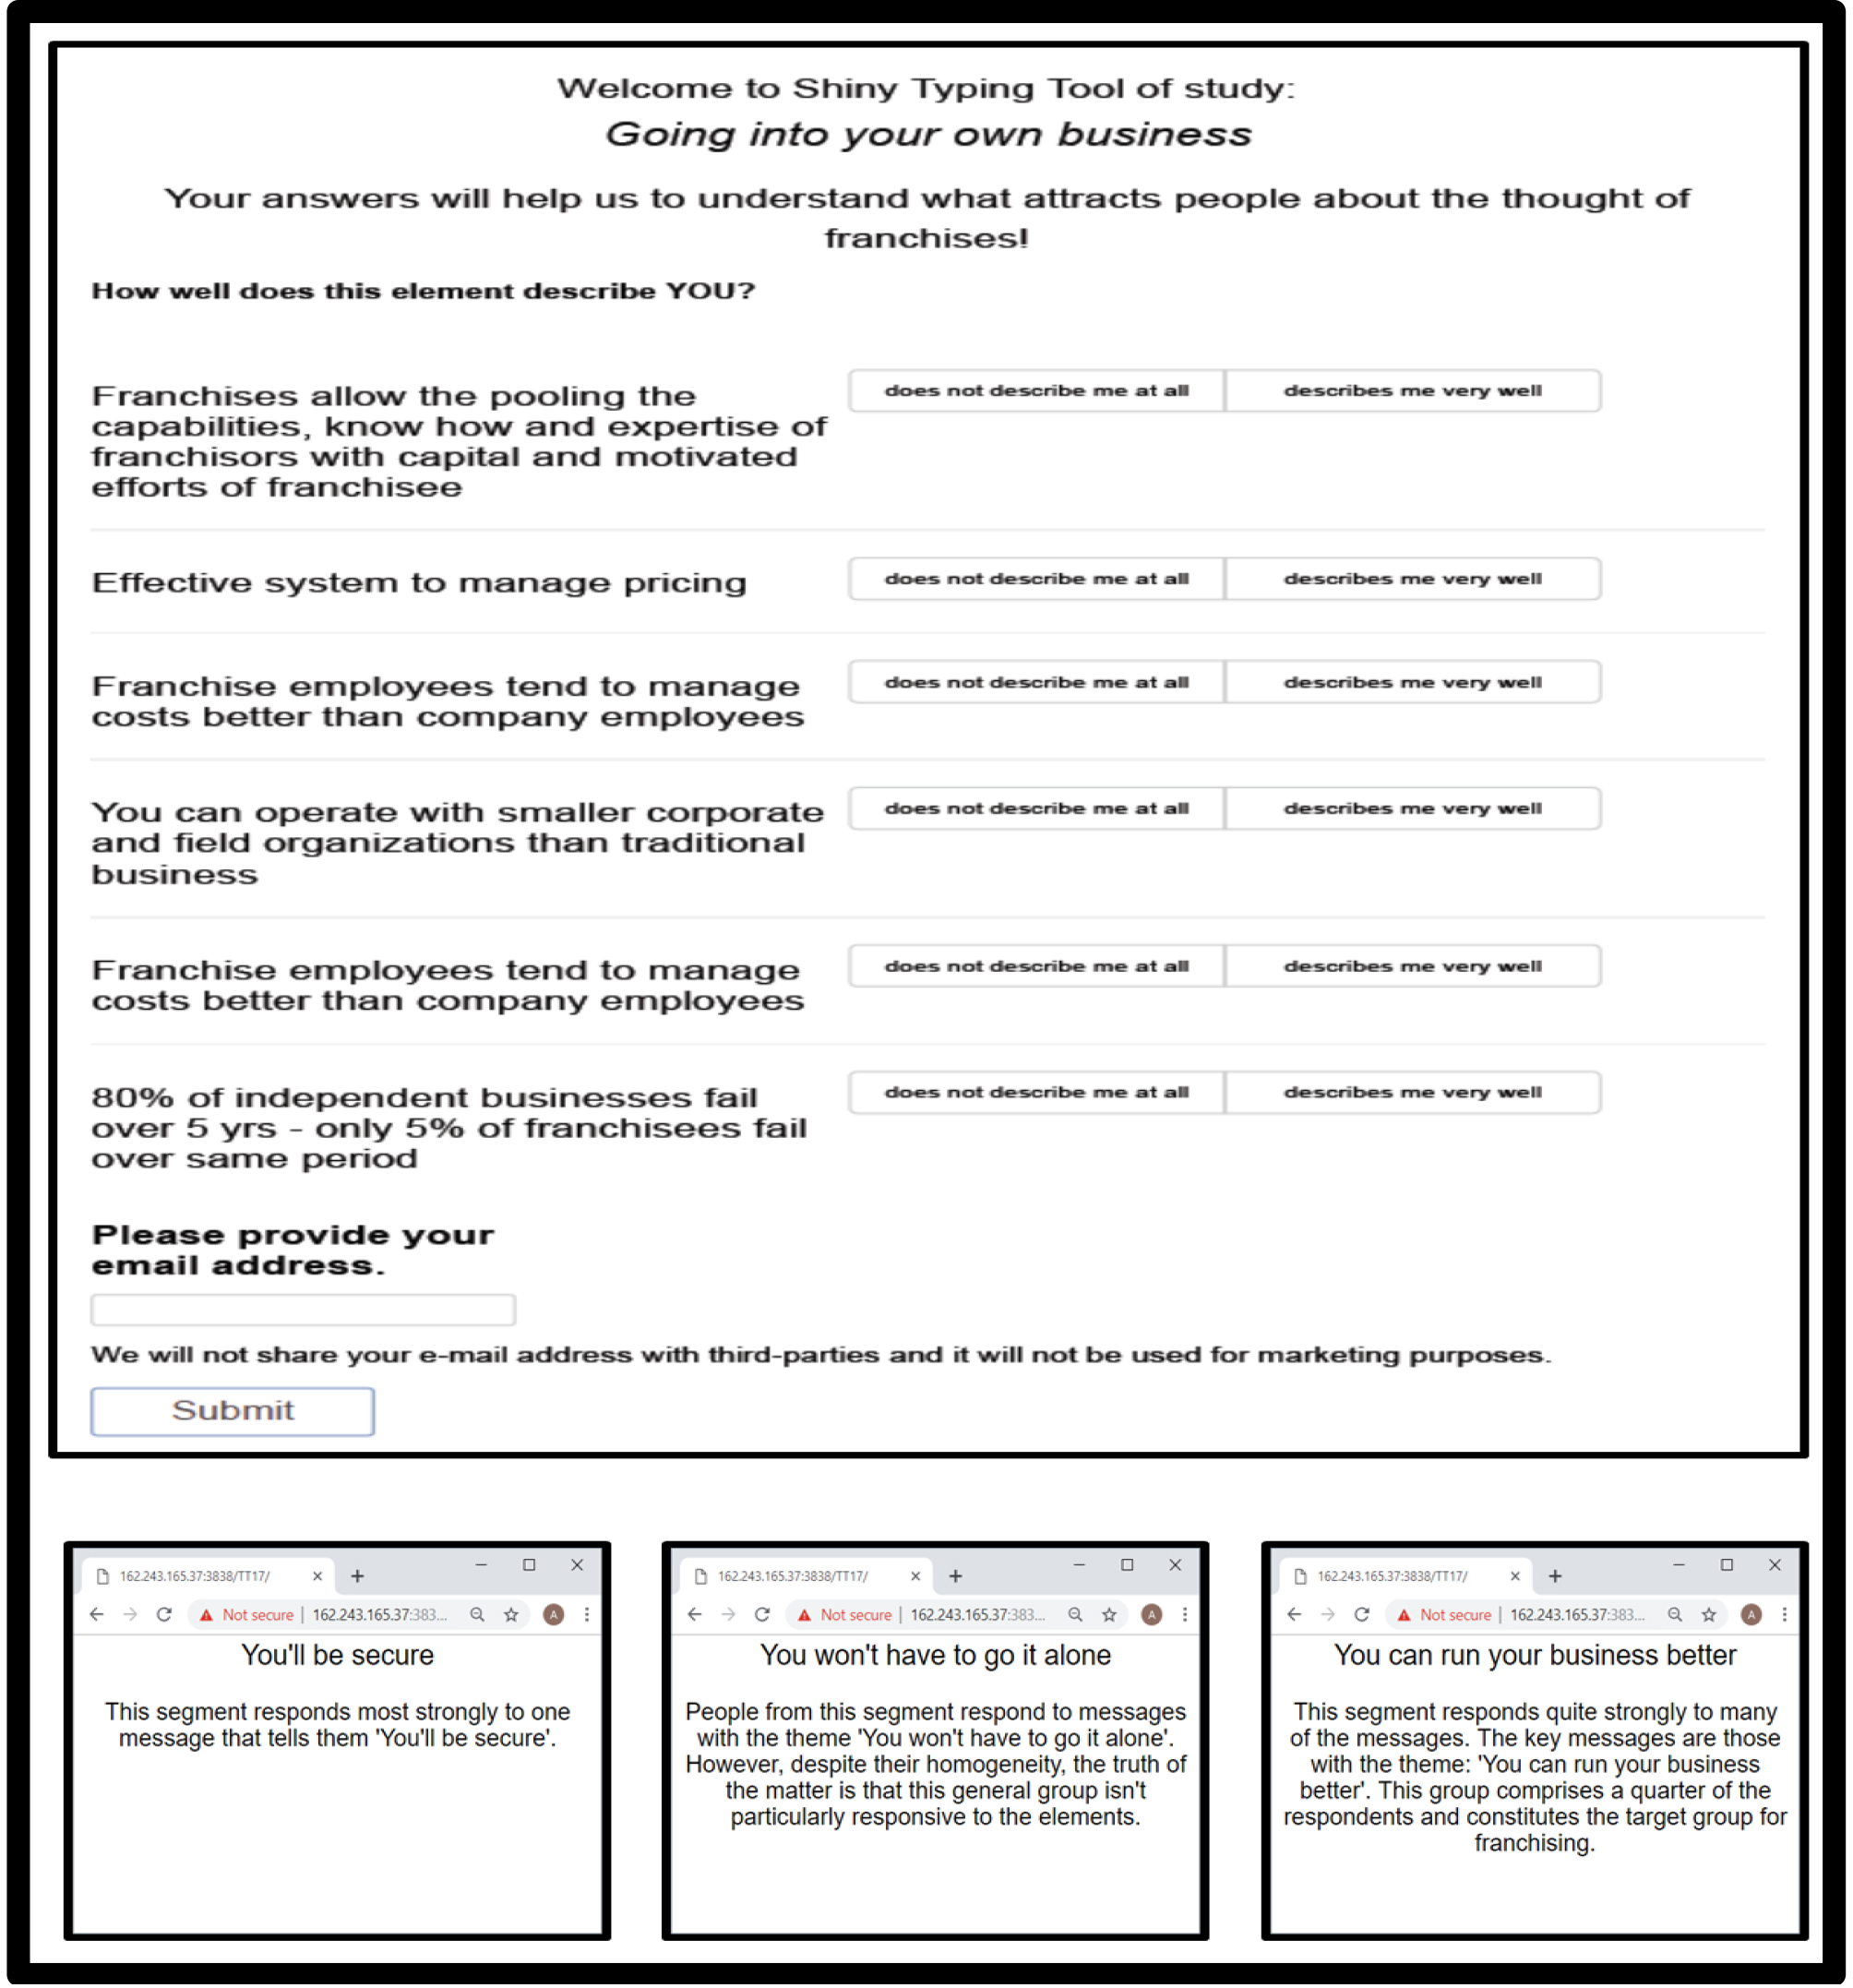
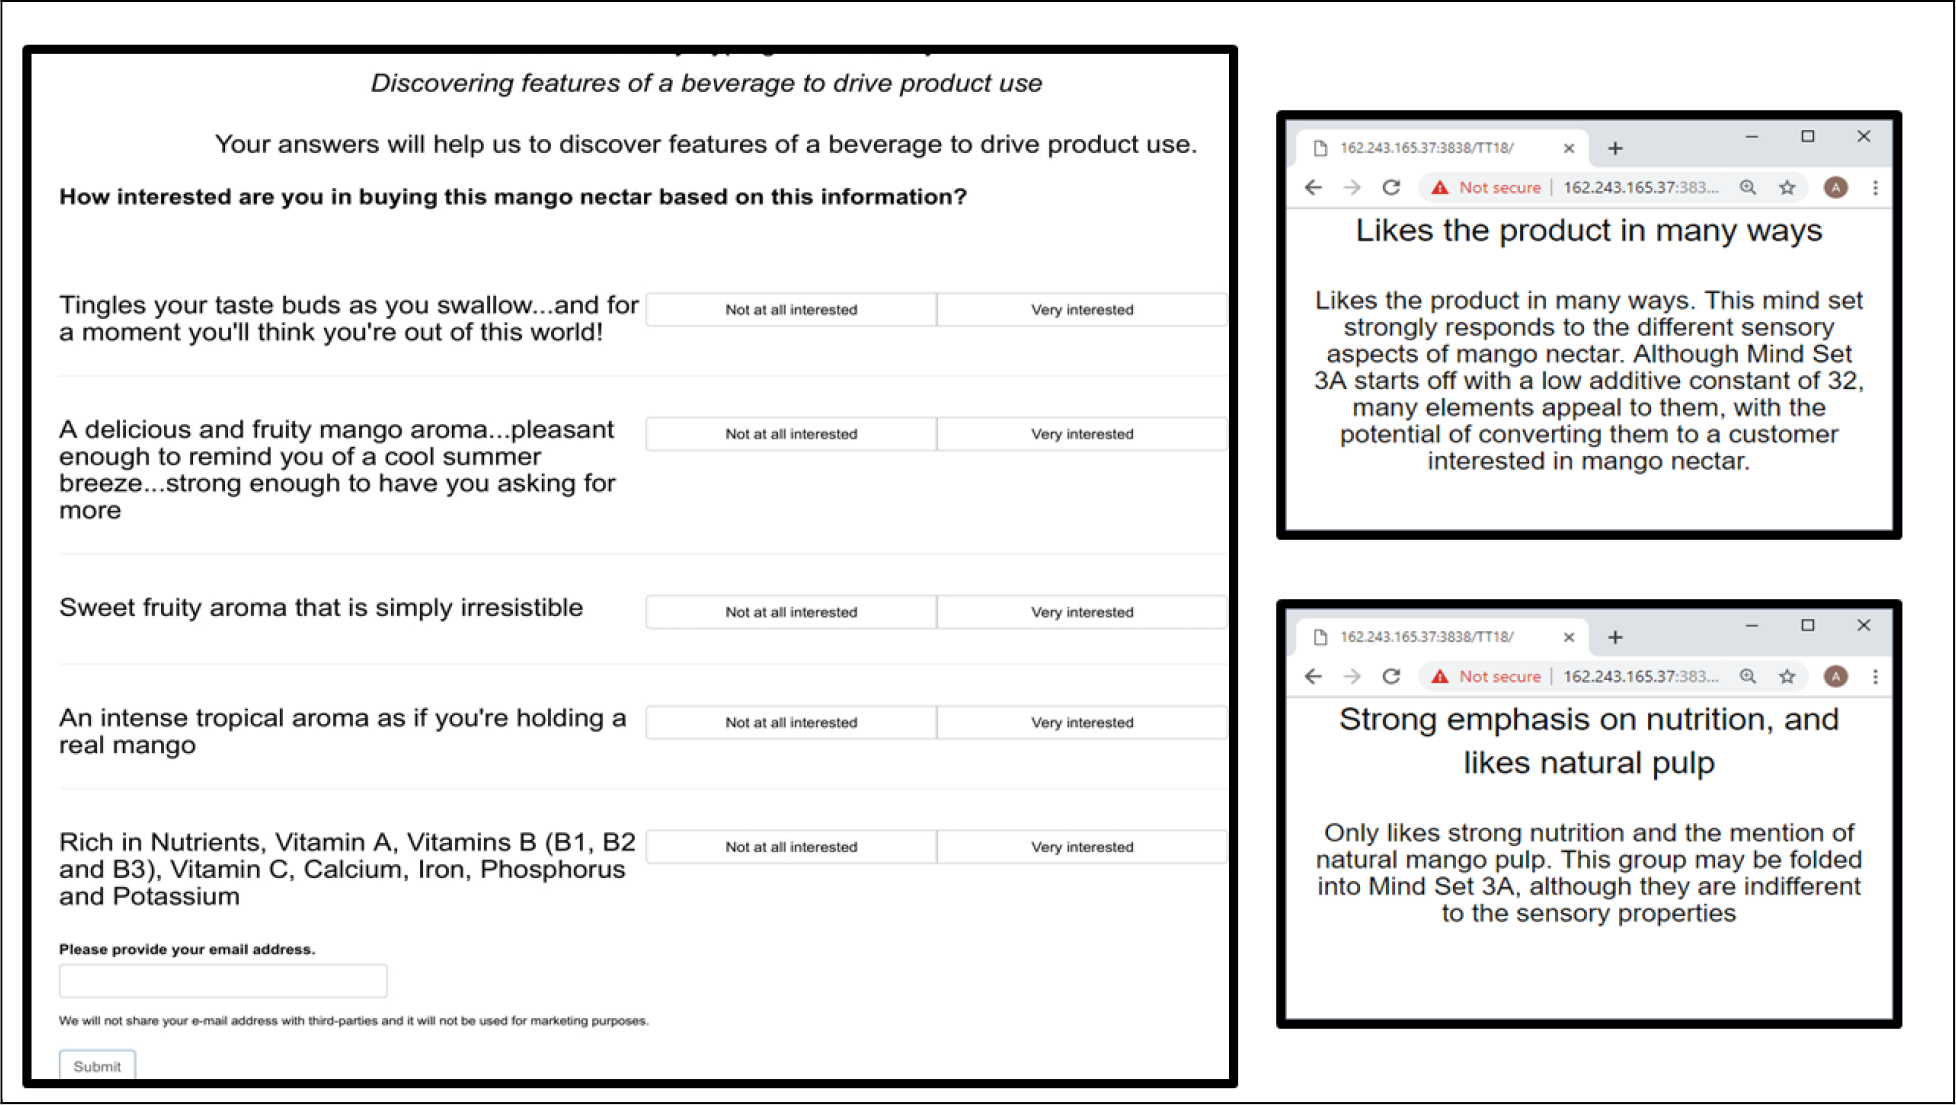
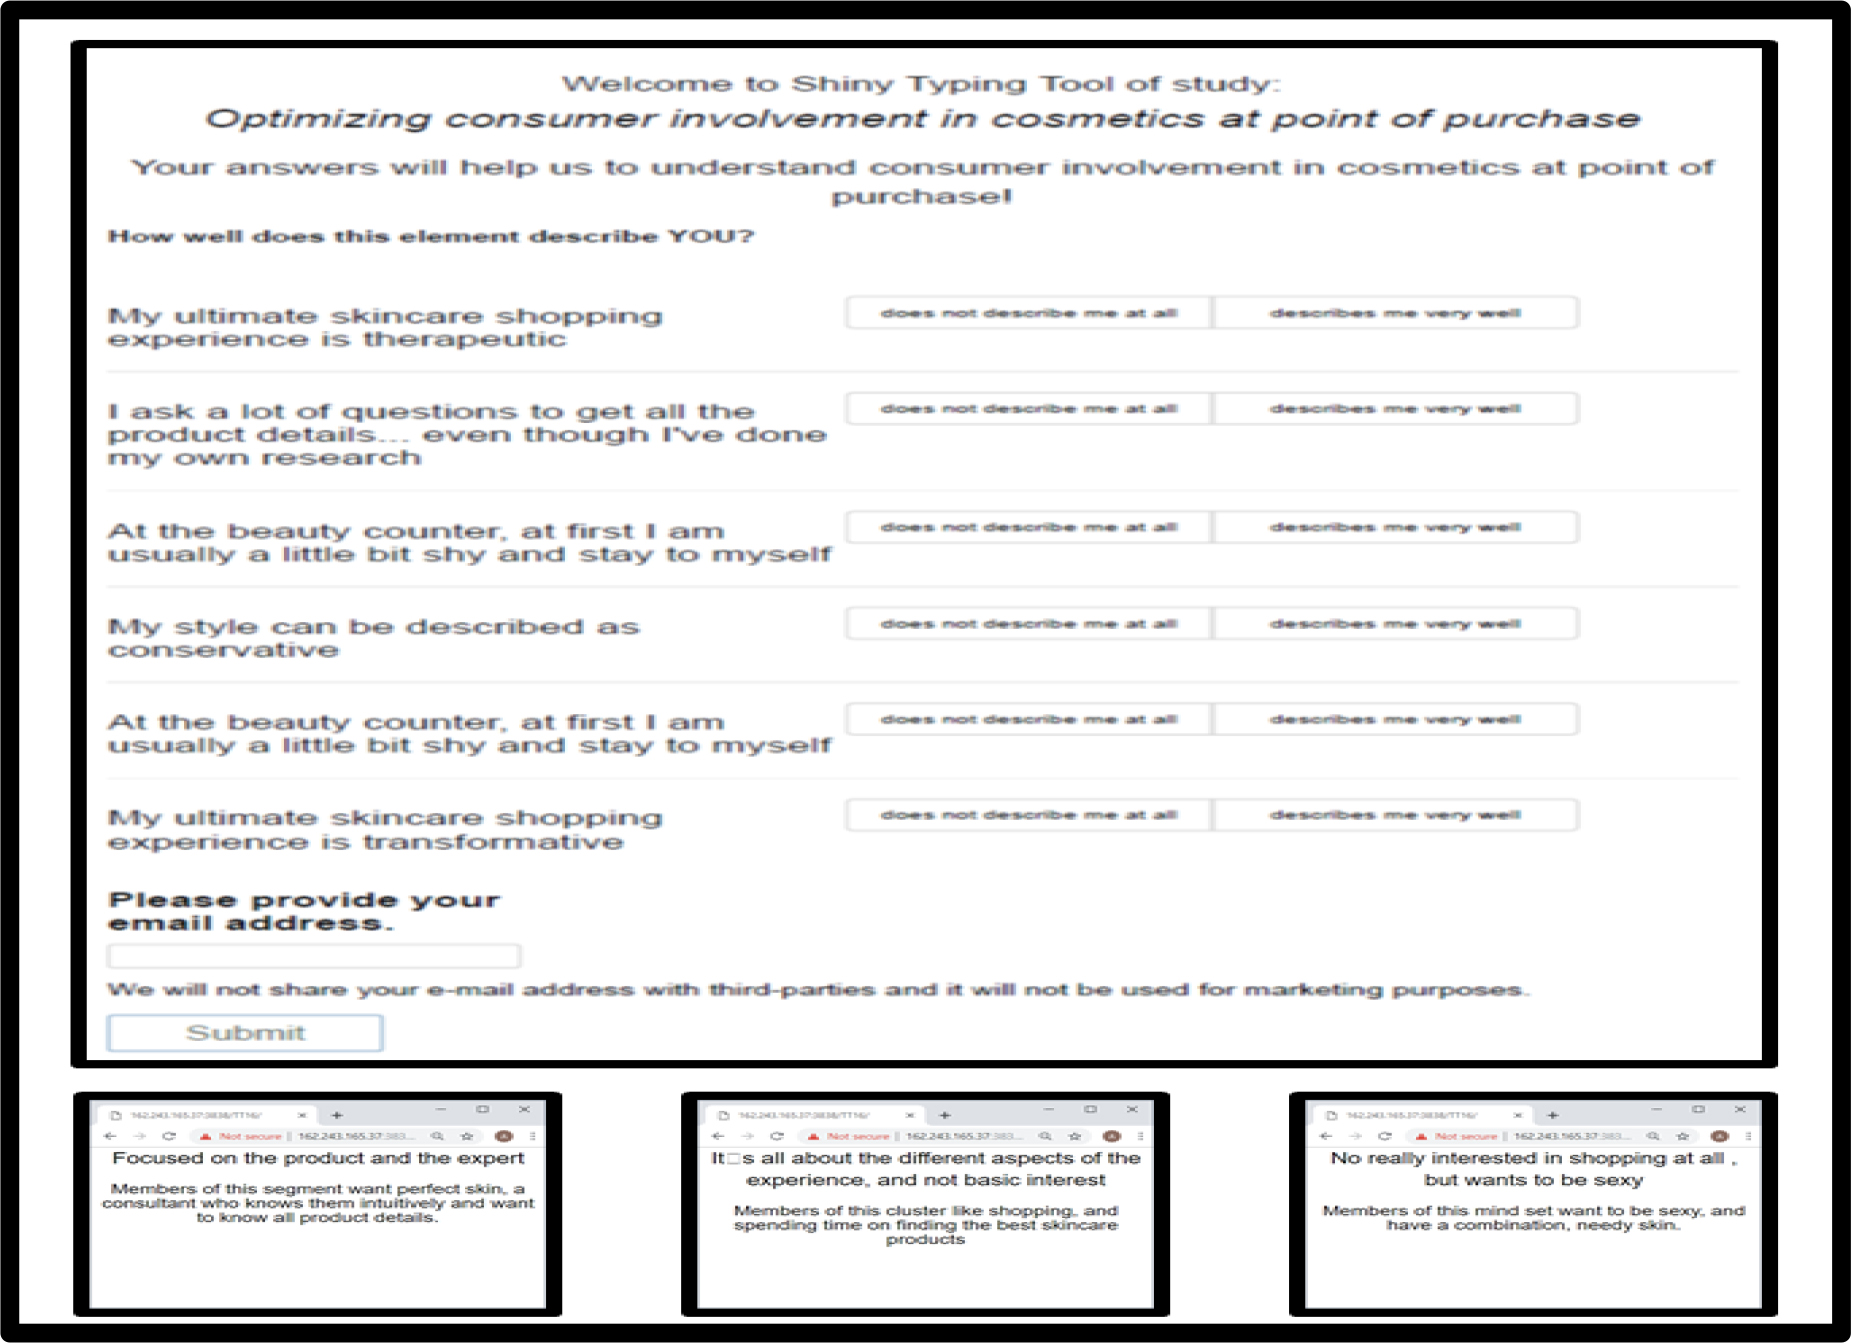
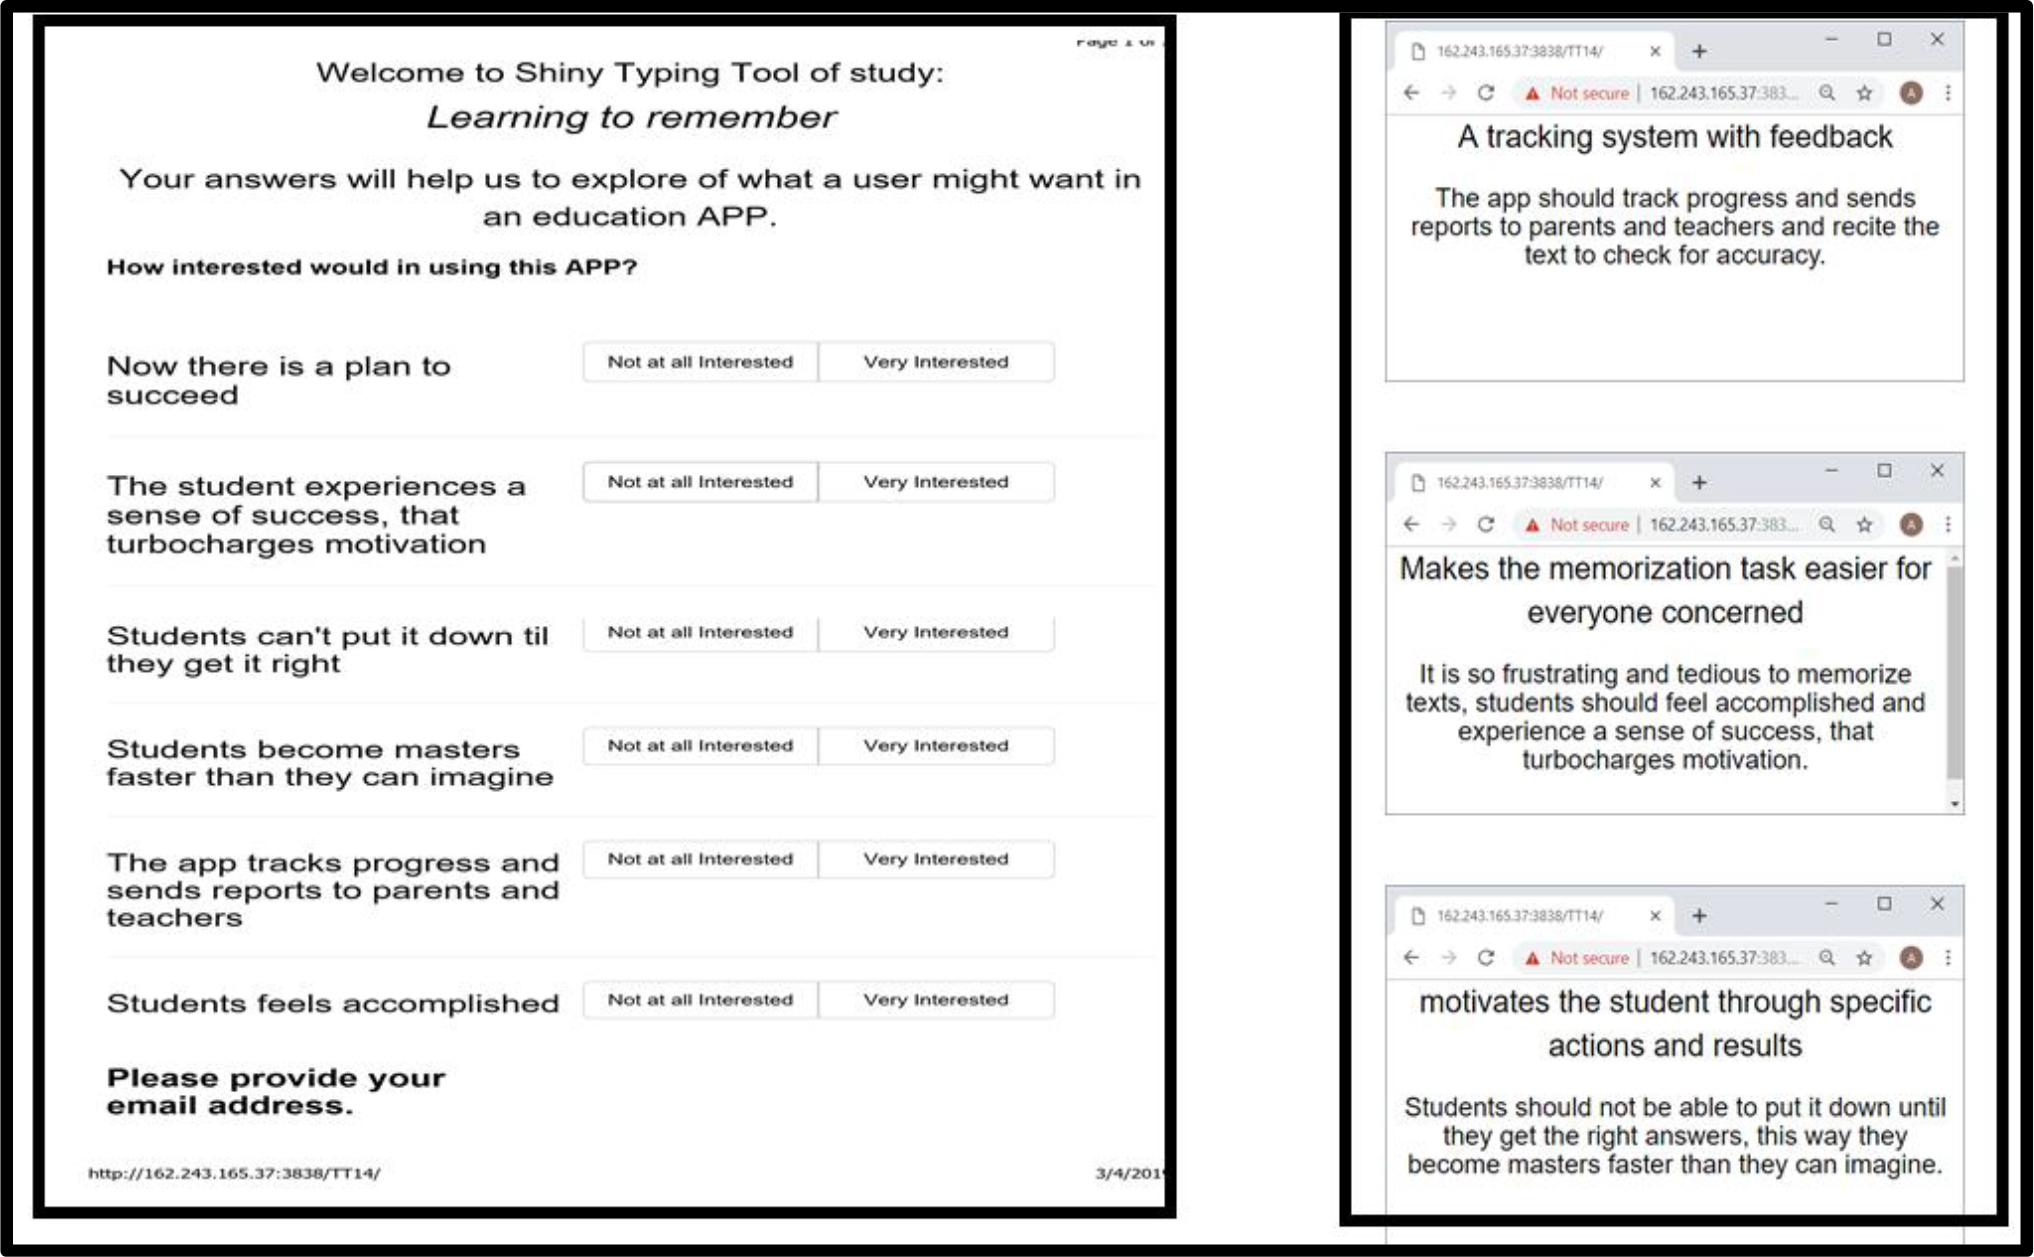
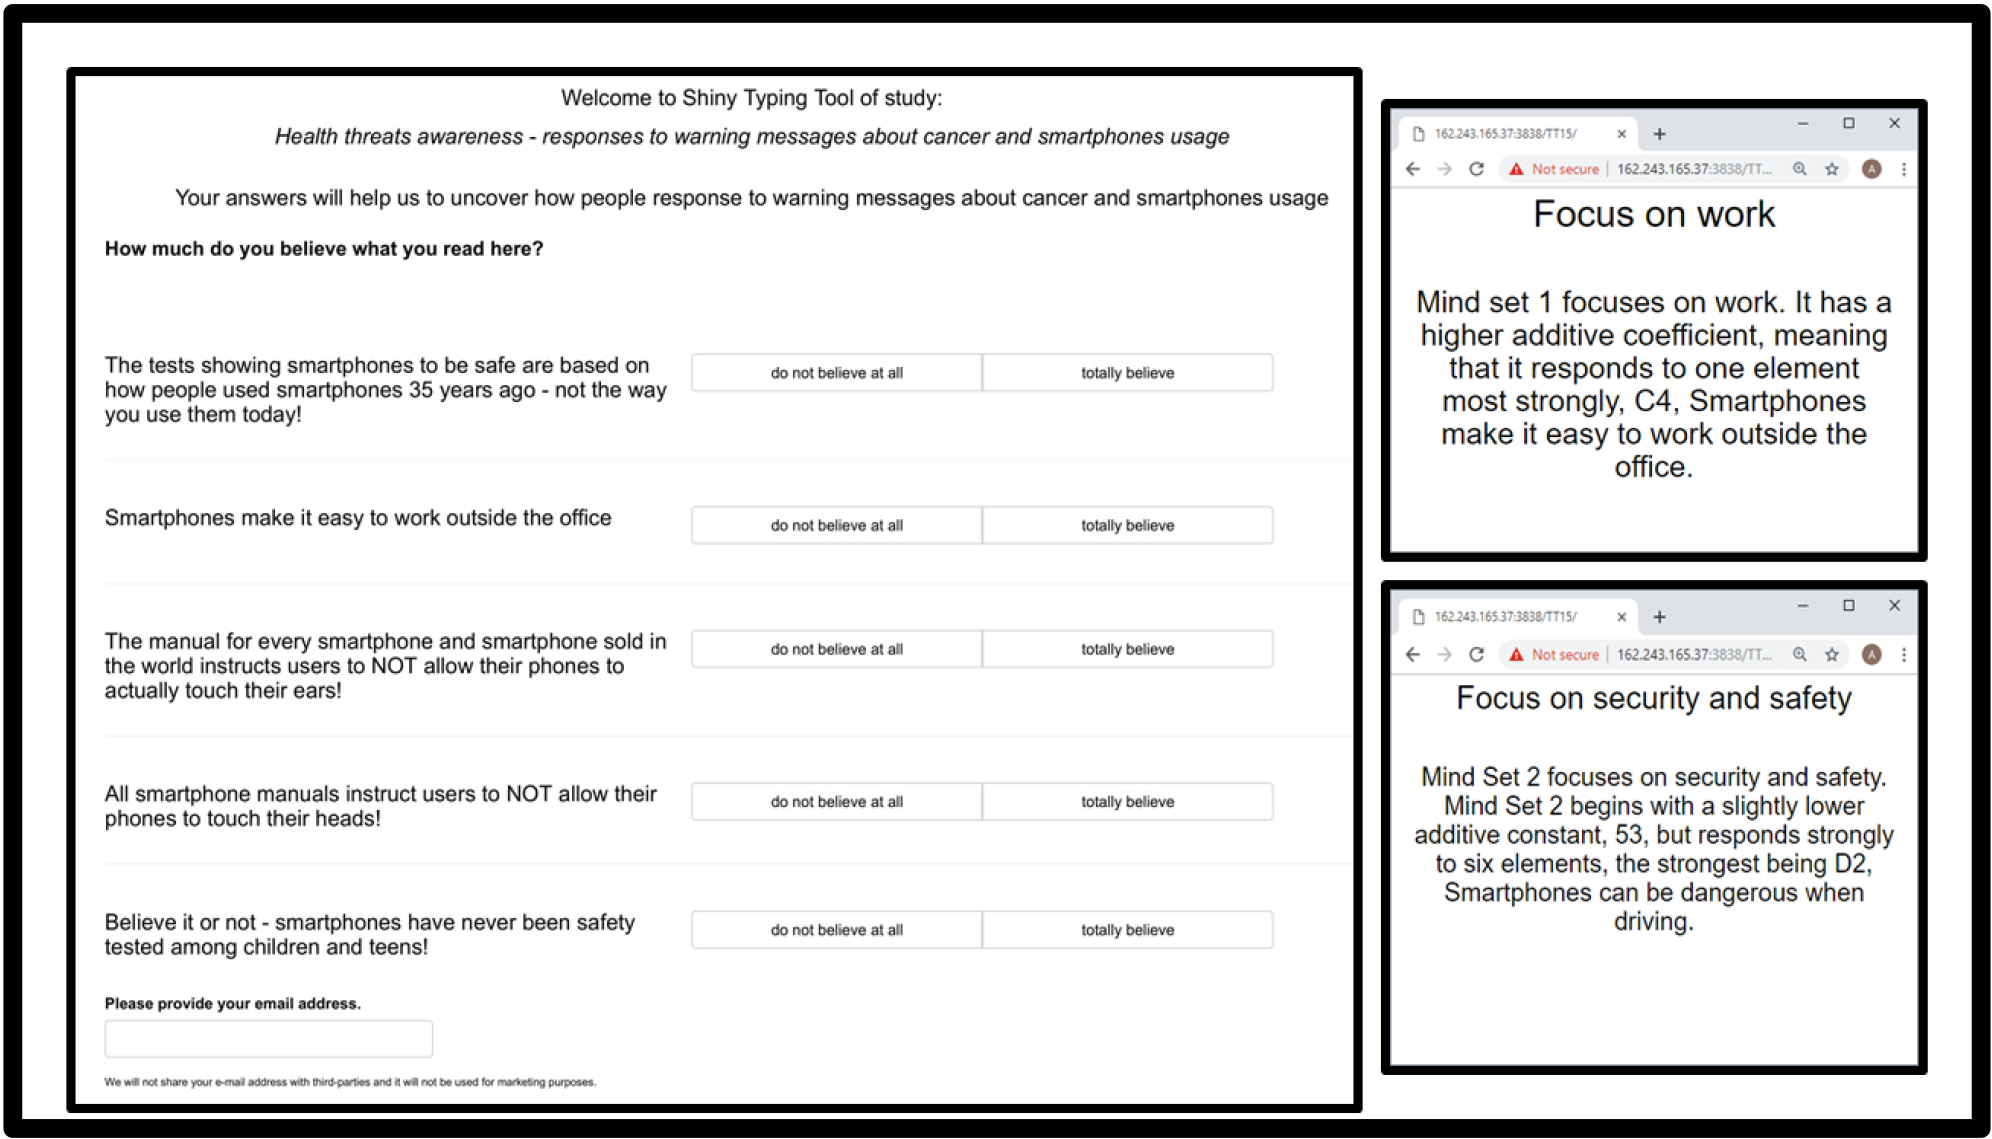
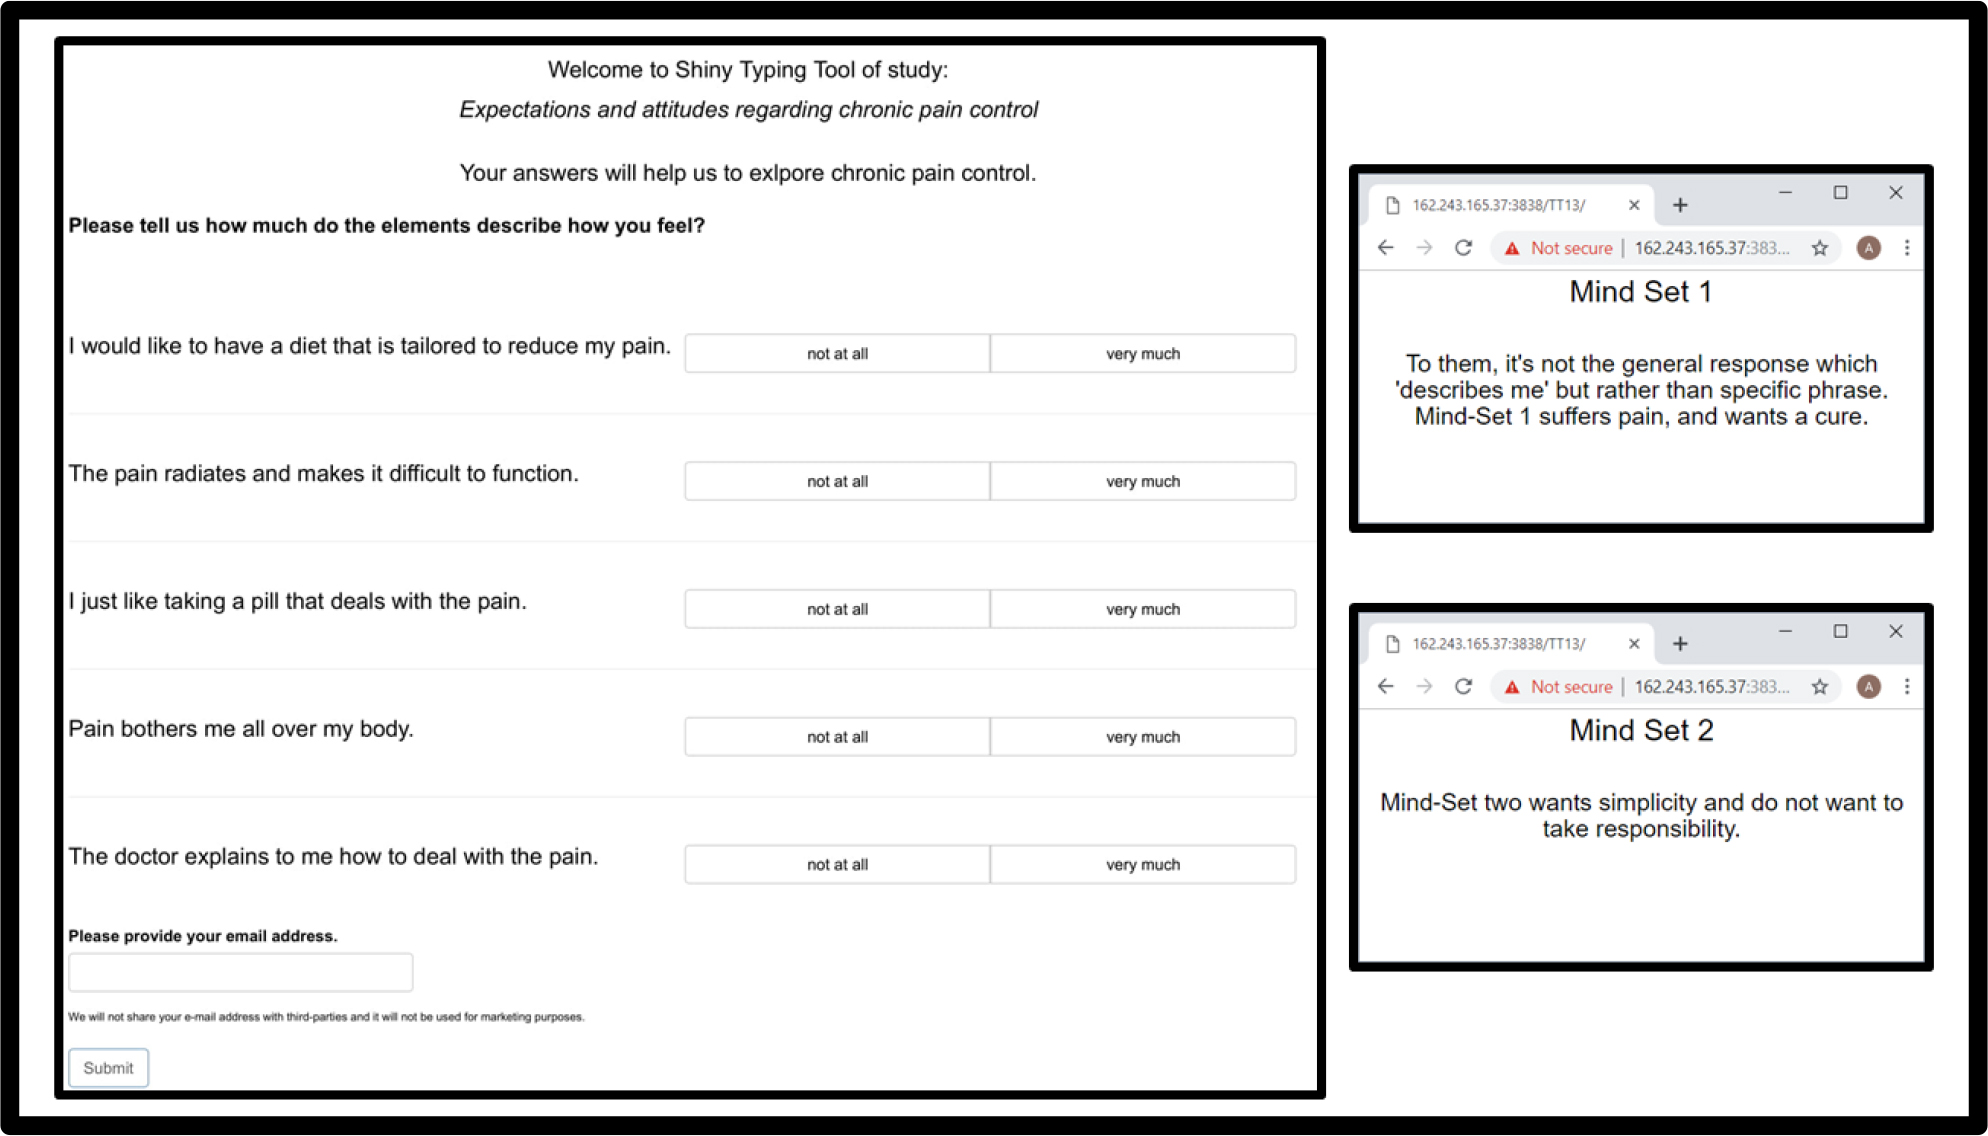
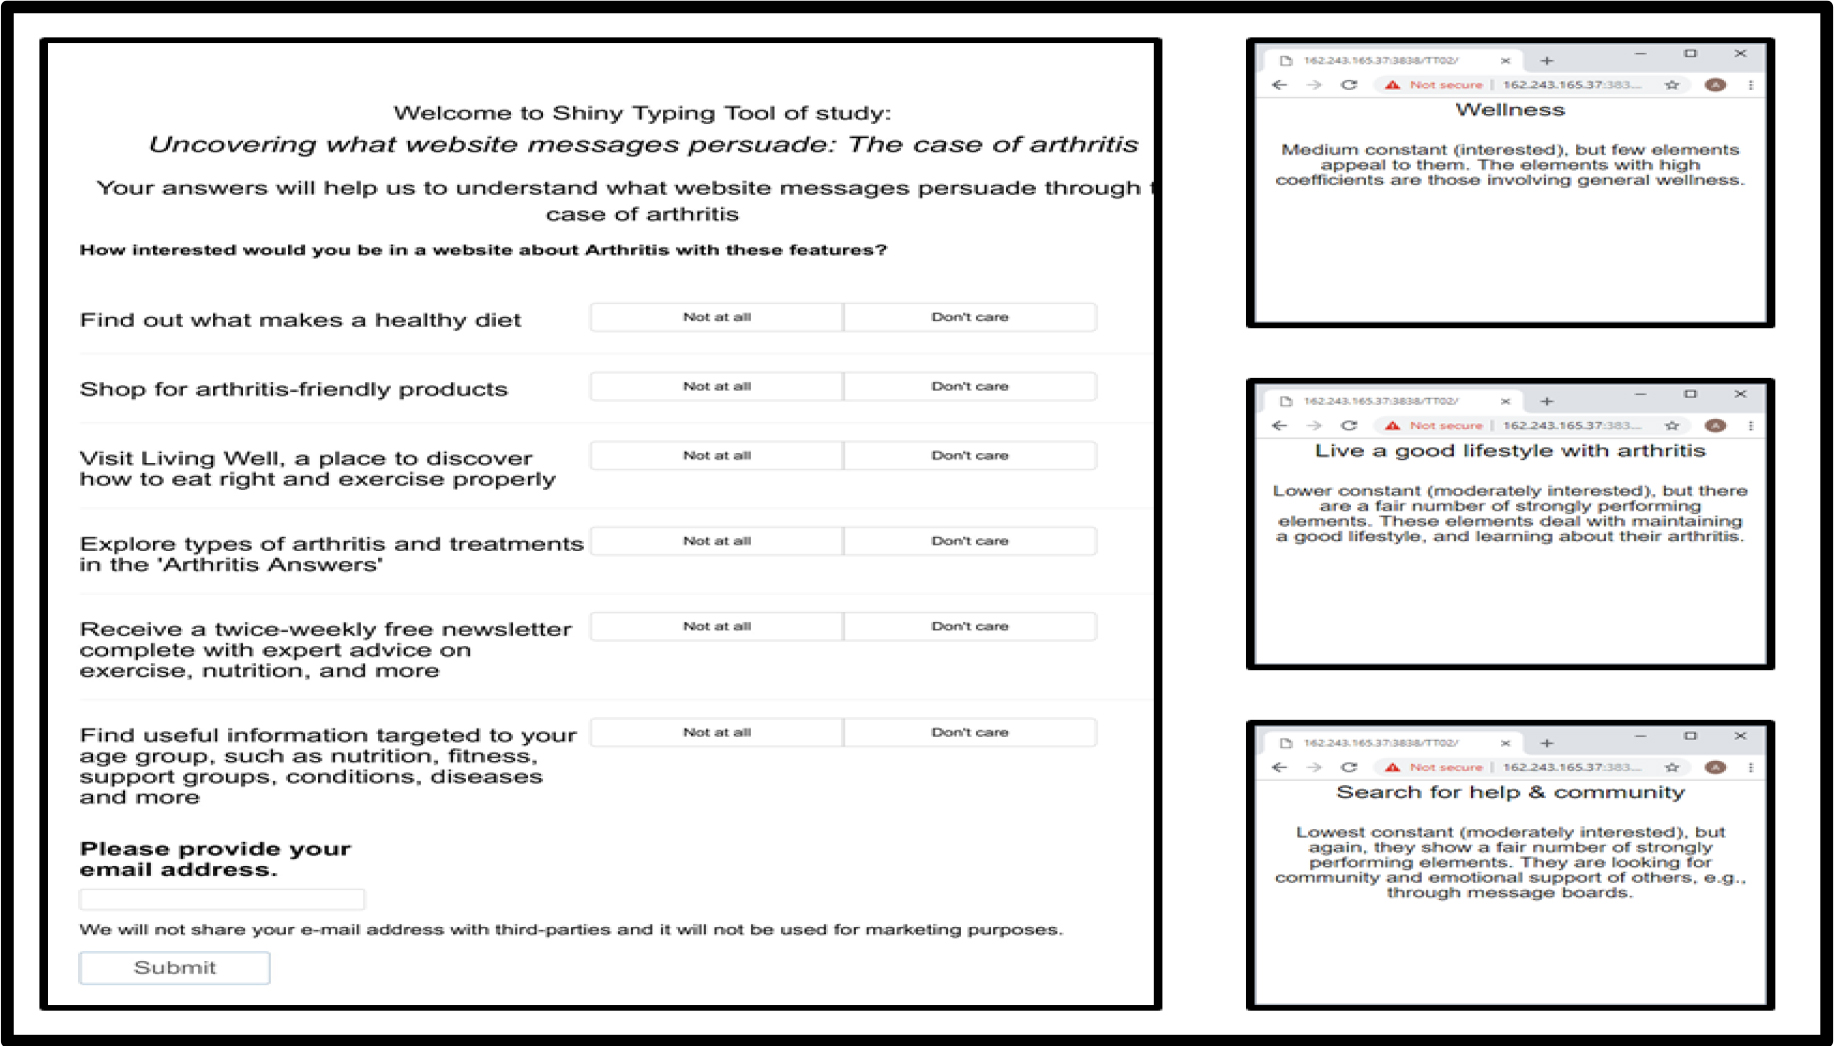
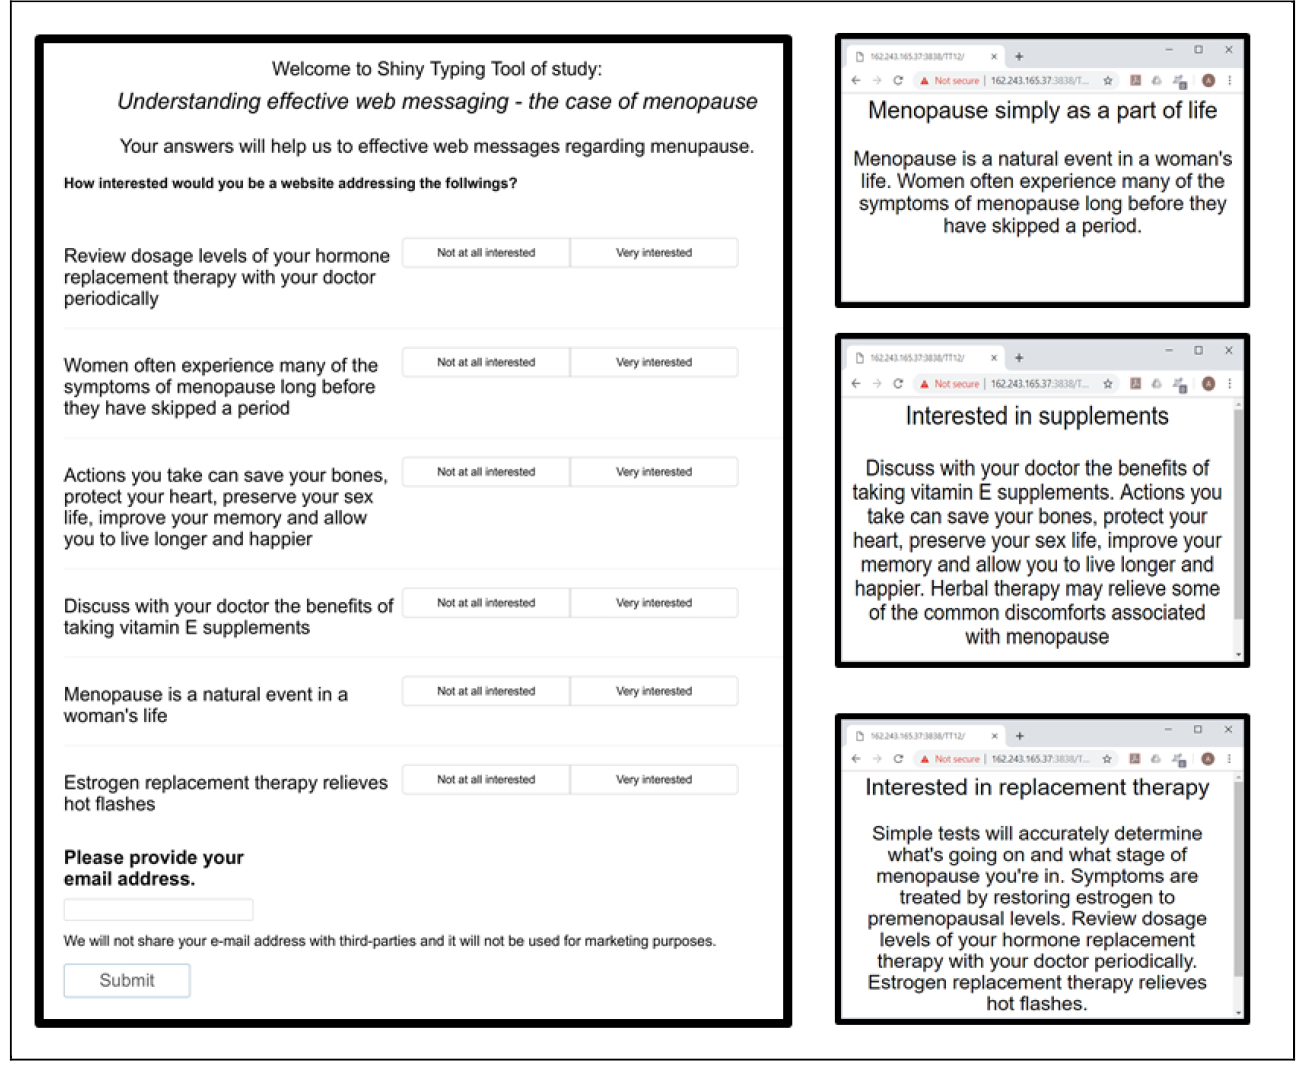
One approach to predicting mind-set membership looks at the pattern of coefficients for the mind-sets (Table 3), and selects elements showing the greatest differentiating power, i.e., the biggest difference for the average panelist. Each selected element is then edited to become a question, to be answered NO or YES, or some other appropriate pair of responses for the same type of binary decision. The questions are incorporated into a short questionnaire (Figure 5, left panel.) The pattern of responses shows which mind-set is the likely mind-set of the respondent (Figure 5, right panel.) The approach is simple, quick, and works on summary data. The important thing to keep in mind is that the objective is to have the respondent rate single elements that are most discriminating between two mind-sets or among three mind-sets. It will be the pattern of ratings which will end up being most appropriate for a person in a specific mind-set. The algorithm will then assign the new person to the mind-set segment most likely to generate the pattern just obtained from the new respondent, the person waiting to be assigned.

Mind Genomics-013 - ASMHS Journal_F5

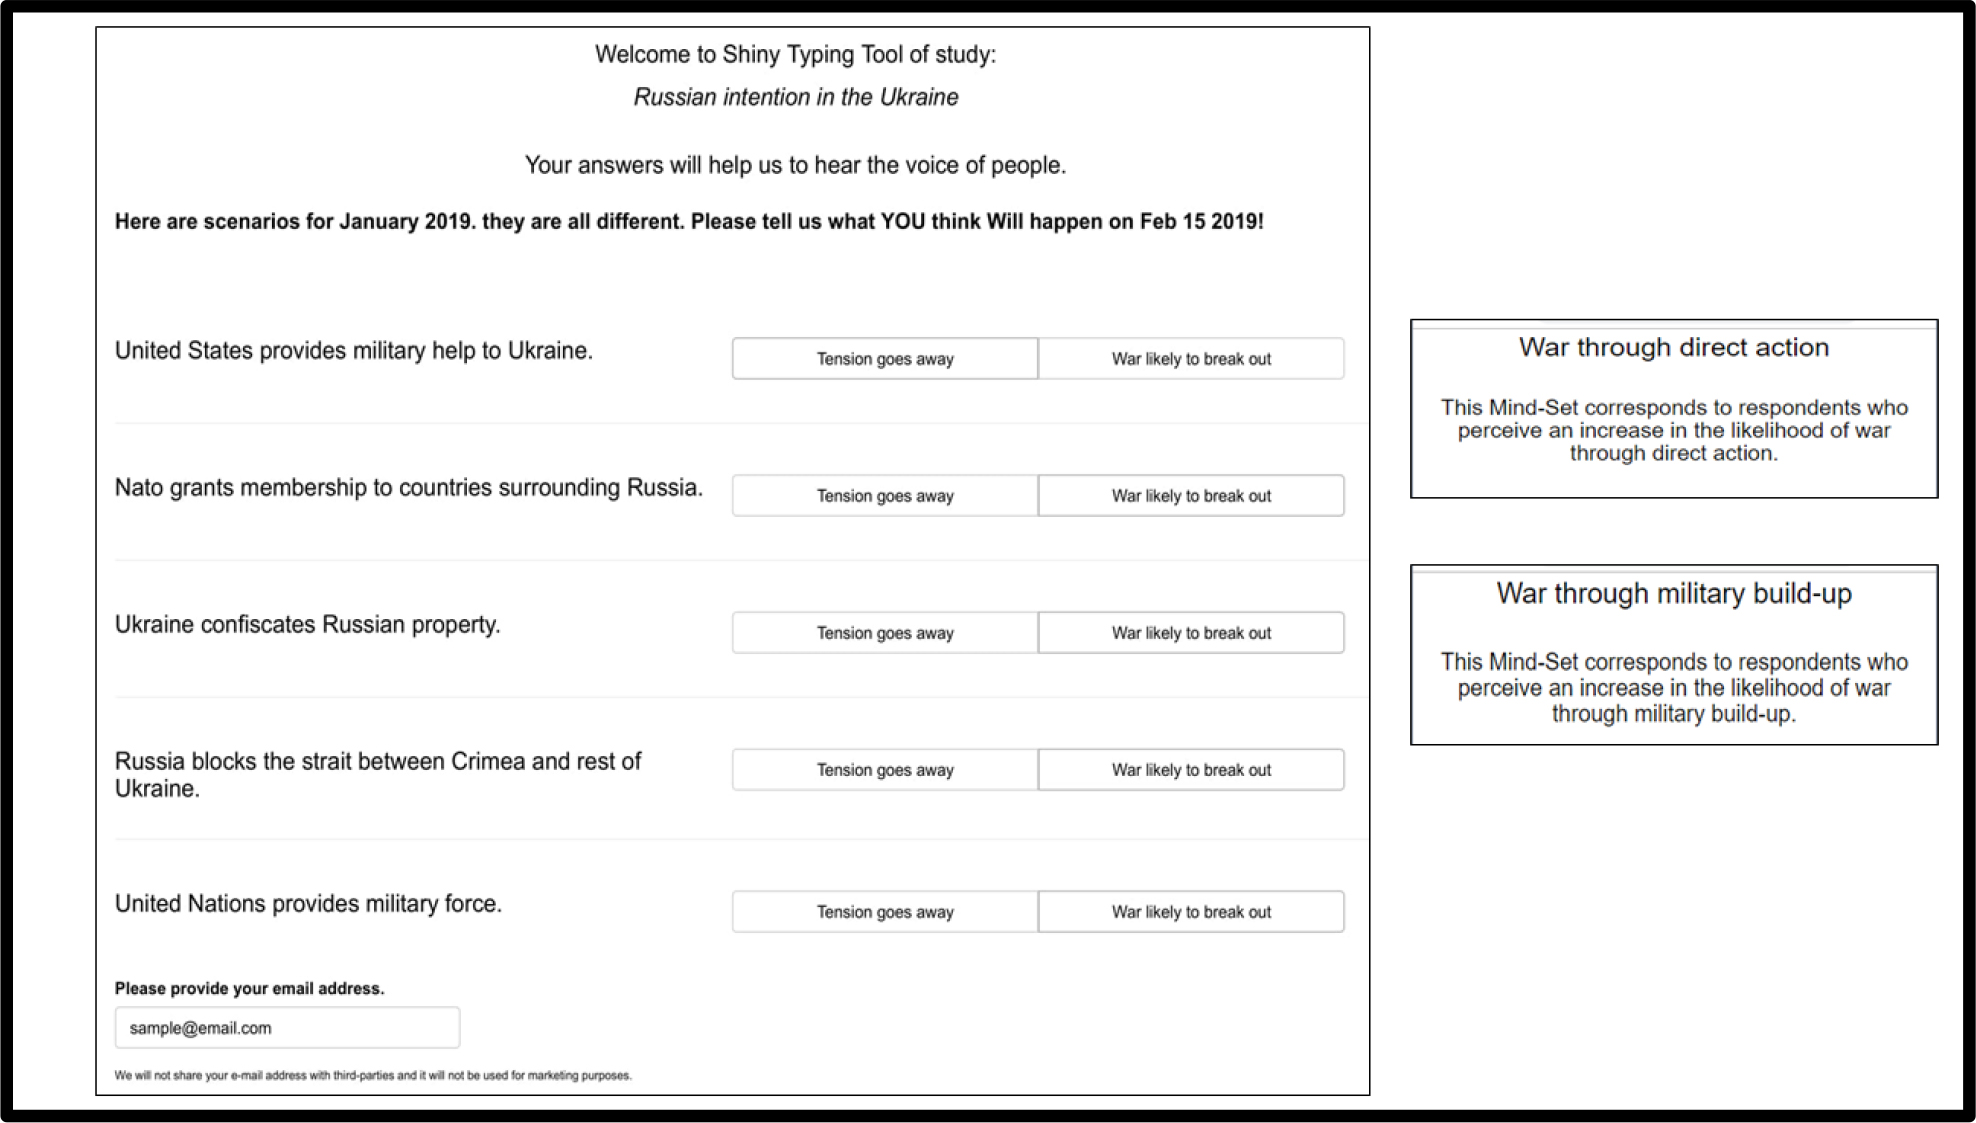
Figure 5. The PVI, the personal viewpoint identifier, showing the questions and simple answers, used to assign a new person to one of the two mind-sets. The platform independent, online-based personal viewpoint identifier of the study is currently available directly through the following link: http://162.243.165.37:3838/TT03/.

Discussion and conclusions

During the past decades scientific inquiries have grown more expensive, longer, often harder to implement, and with results limited to a specific topic, almost ‘filling a hole in the literature.’ Mind Genomics, as we have presented it here, is evolving in an independent direction. Mind Genomics takes a ‘snapshot of reality’ in terms of the reactions of people to cognitively meaningful messages or ideas about a single topic of experience, relevant to the person’s life. The ideas in this paper are issues which are best put into the world of ‘current events’ but the ideas can range from moral issues to economic issues, education, and so forth.

The positive news from the study is that is appears quite possible to use small, inexpensive, easy-to-run studies to quantify how people respond to the world around them, and at the same time prevent the system from being ‘gamed.’ The further positive news is that, even with the low base size, it is often quite easy and affordable to uncover emergent mind-sets, putting the potential of discovery in the hands of experimenters without the concomitant cost. Thus, Mind Genomics in the current format, the BimiLeap APP, democratizes research, putting research and discovery into the hands of everyone. The negative news is that Mind Genomics cannot uncover a general clear relation between response-time, a physiological measure, and the response to elements, a cognitive measure. The two mind-sets created according to response-times emerge, as they must from clustering, but they make only modest intuitive sense. Although we can easily see differences in response pattern to elements after segmenting the pattern of coefficients for ratings, we see no correspondingly clear differences between two mind-sets emerging from the pattern of coefficients for response-times. Our first effort, using the physiological measure of response-time to understand mental processing, must be considered only modestly successful. We emphasize here that the only difference in the two clustering efforts, the first based on coefficients for ratings, the second based on coefficients for response-time, is the nature of the measure, cognitive versus so-called neuro or physiological. It may be that response-time in this form has to be further analyzed, incorporating other variables besides the element itself. The predictor variables might be the element and some morphological features of the elements as well. That effort is left to future research [13–15].

References

  1. Galanter E, Pliner, P (1974) Cross-modality matching of money against other continua. In Sensation and measurement, Reidel Pg No: 65–76.
  2. Stevens SS (1975) Psychophysics: Introduction to its perceptual, neural and social prospects. New York, John Wiley.
  3. Box GEP, Hunter WP, Hunter JS (1978) Statistics for experimenters, New York, John Wiley.
  4. Moskowitz HR (2012) ‘Mind genomics’: The experimental, inductive science of the ordinary, and its application to aspects of food and feeding. Physiology & behavior 107: 606–613.
  5. Moskowitz HR, Gofman A, Beckley J, Ashman H (2006) Founding a new science: Mind genomics. Journal of sensory studies 21: 266–307.
  6. Fugate DL (2007) Neuromarketing: a layman’s look at neuroscience and its potential application to marketing practice. Journal of Consumer Marketing 24: 385–394.
  7. Genco SJ, Pohlmann AP, Steidl P (2013) Neuromarketing for dummies. John Wiley & Sons.
  8. Charap S, Colton TJ (2018) Everyone loses: The Ukraine crisis and the ruinous contest for post-Soviet Eurasia. Routledge.
  9. Russell W (2018) Russian Relations with the “Near Abroad”. In Russian Foreign Policy Since 1990 (pp. 53–70). Routledge.
  10. Gofman A, Moskowitz H (2010) Isomorphic permuted experimental designs and their application in conjoint analysis. Journal of Sensory Studies 25: 127–145.
  11. Moskowitz HR, Silcher M (2006) The applications of conjoint analysis and their possible uses in Sensometrics. Food quality and preference 17: 45–165.
  12. De Hoon MJ, Imoto S, Nolan J, Miyano S (2004) Open source clustering software. Bioinformatics 20: 1453–1454. [crossref]
  13. Bercík, Jakub, Elena Horská, Wang WY, Ying-Chun Chen (2015) How can food retailing benefit from neuromarketing research: a case of various parameters of store illumination and consumer response. In 143rd Joint EAAE/AAEA Seminar, March 25–27, 2015, Naples, Italy, no. 202714. European Association of Agricultural Economists.
  14. Lee N, Broderick AJ, Chamberlain L (2007) What is ‘neuromarketing’? A discussion and agenda for future research. International journal of psychophysiology 63: 199–204.
  15. Stipp H (2015) The Evolution of Neuromarketing Research: From Novelty to Mainstream: How Neuro Research Tools Improve Our Knowledge about Advertising. Journal of Advertising Research 55: 120–122.
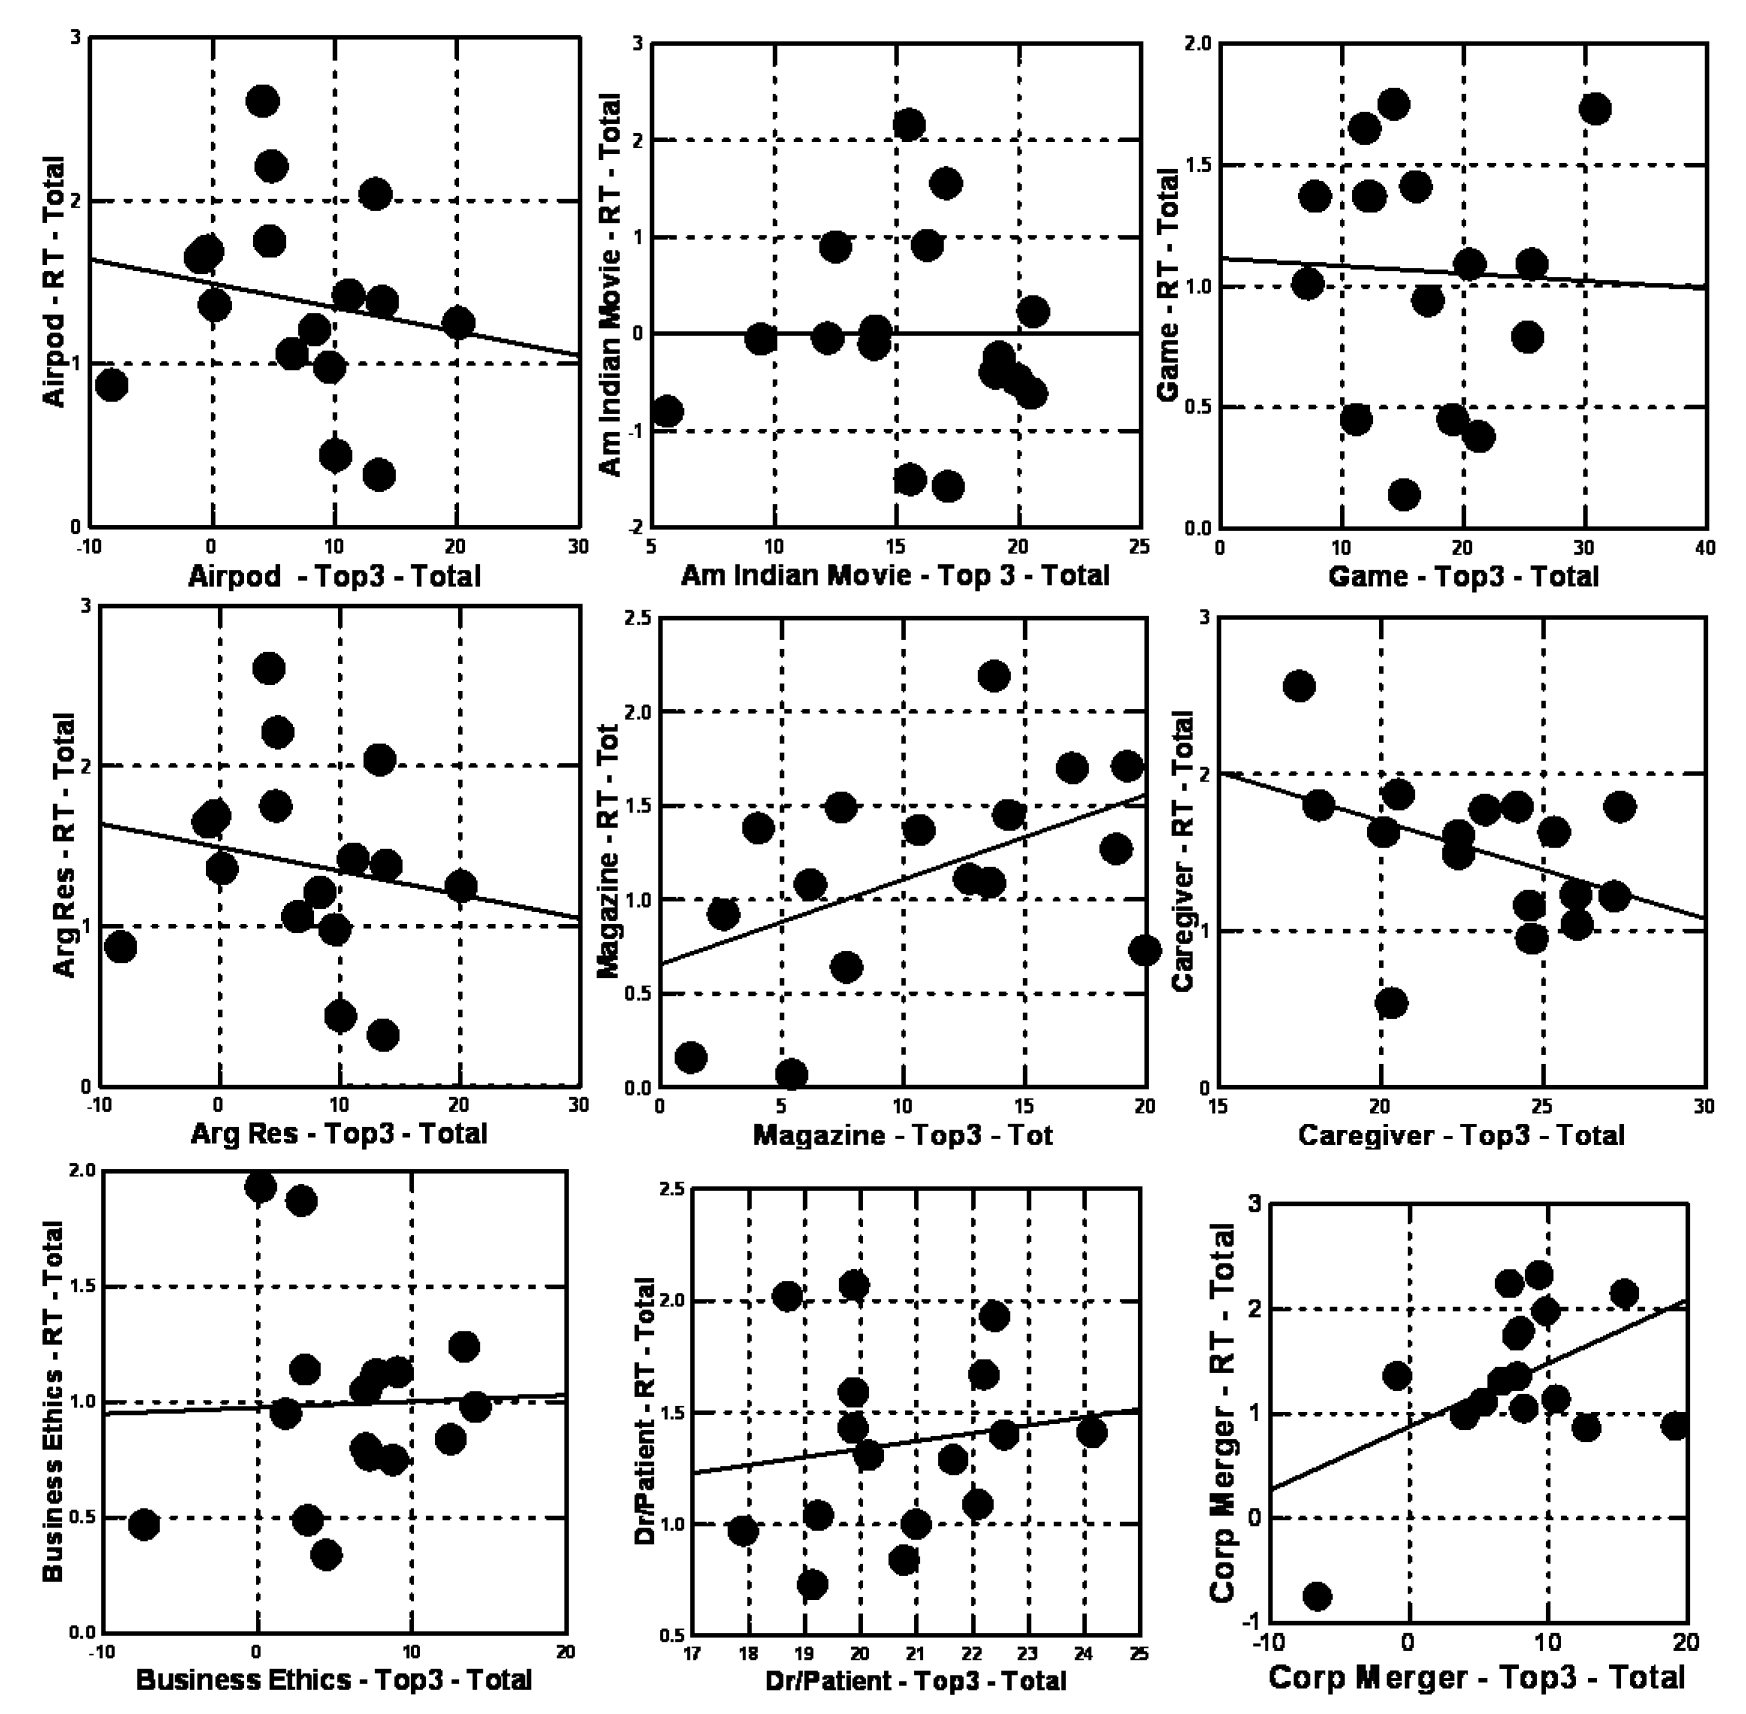
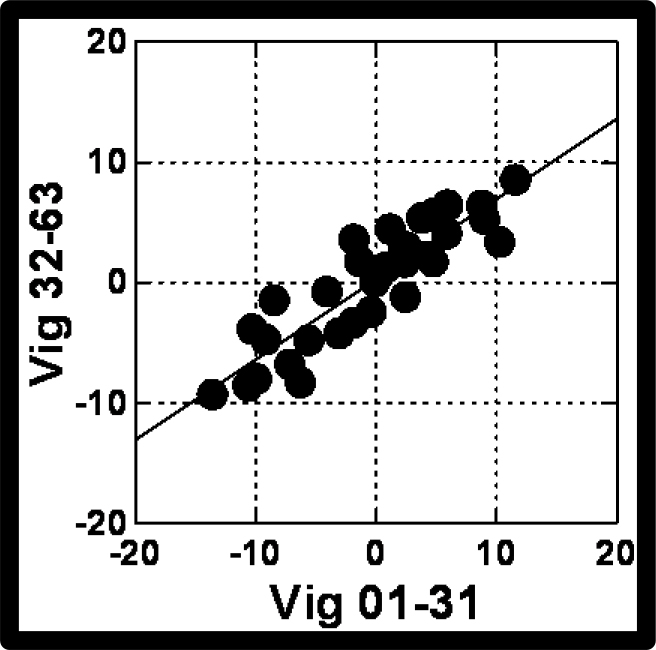
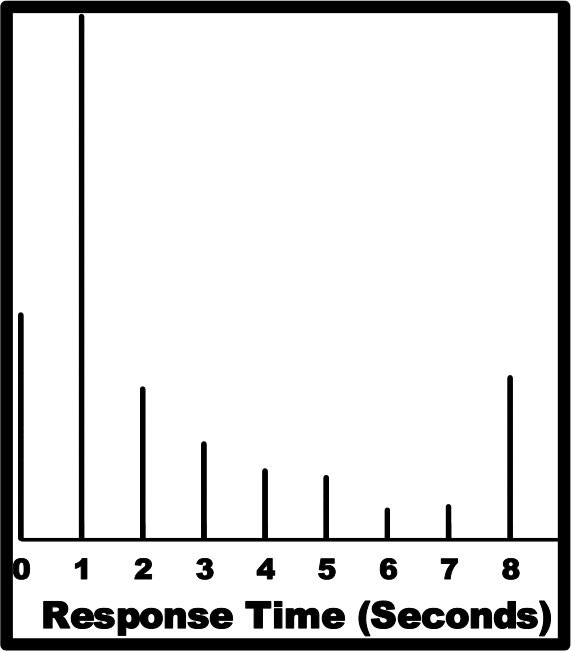
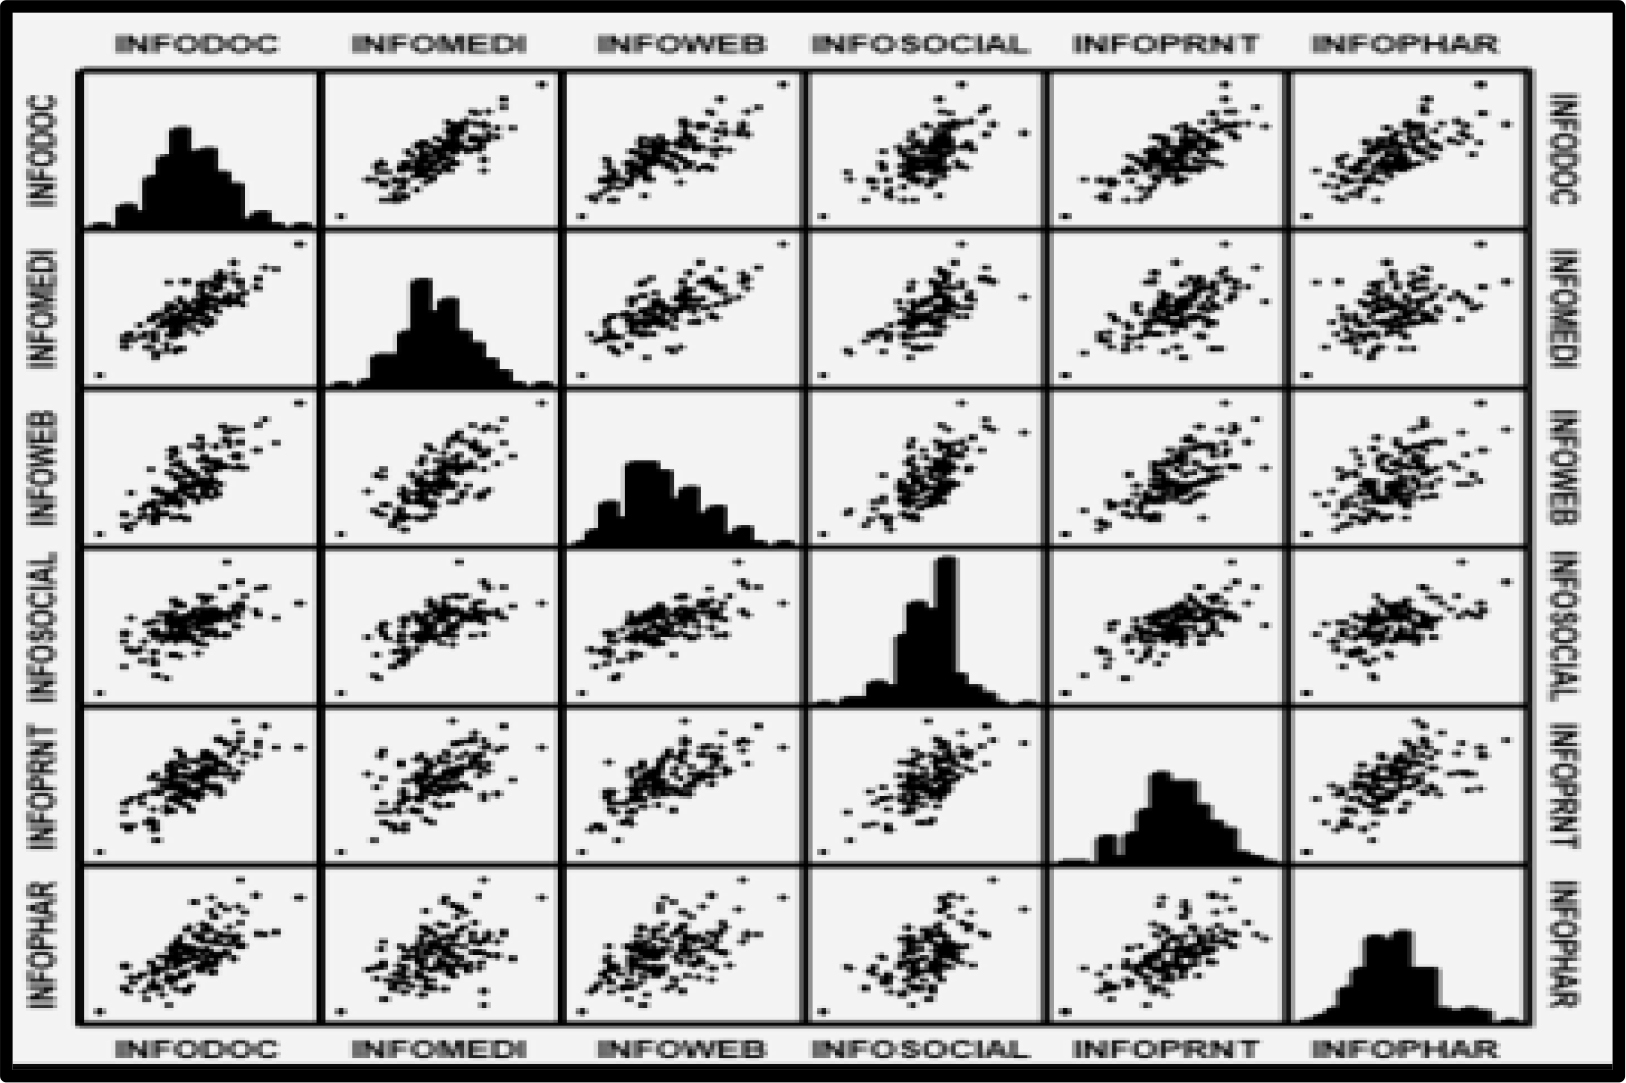
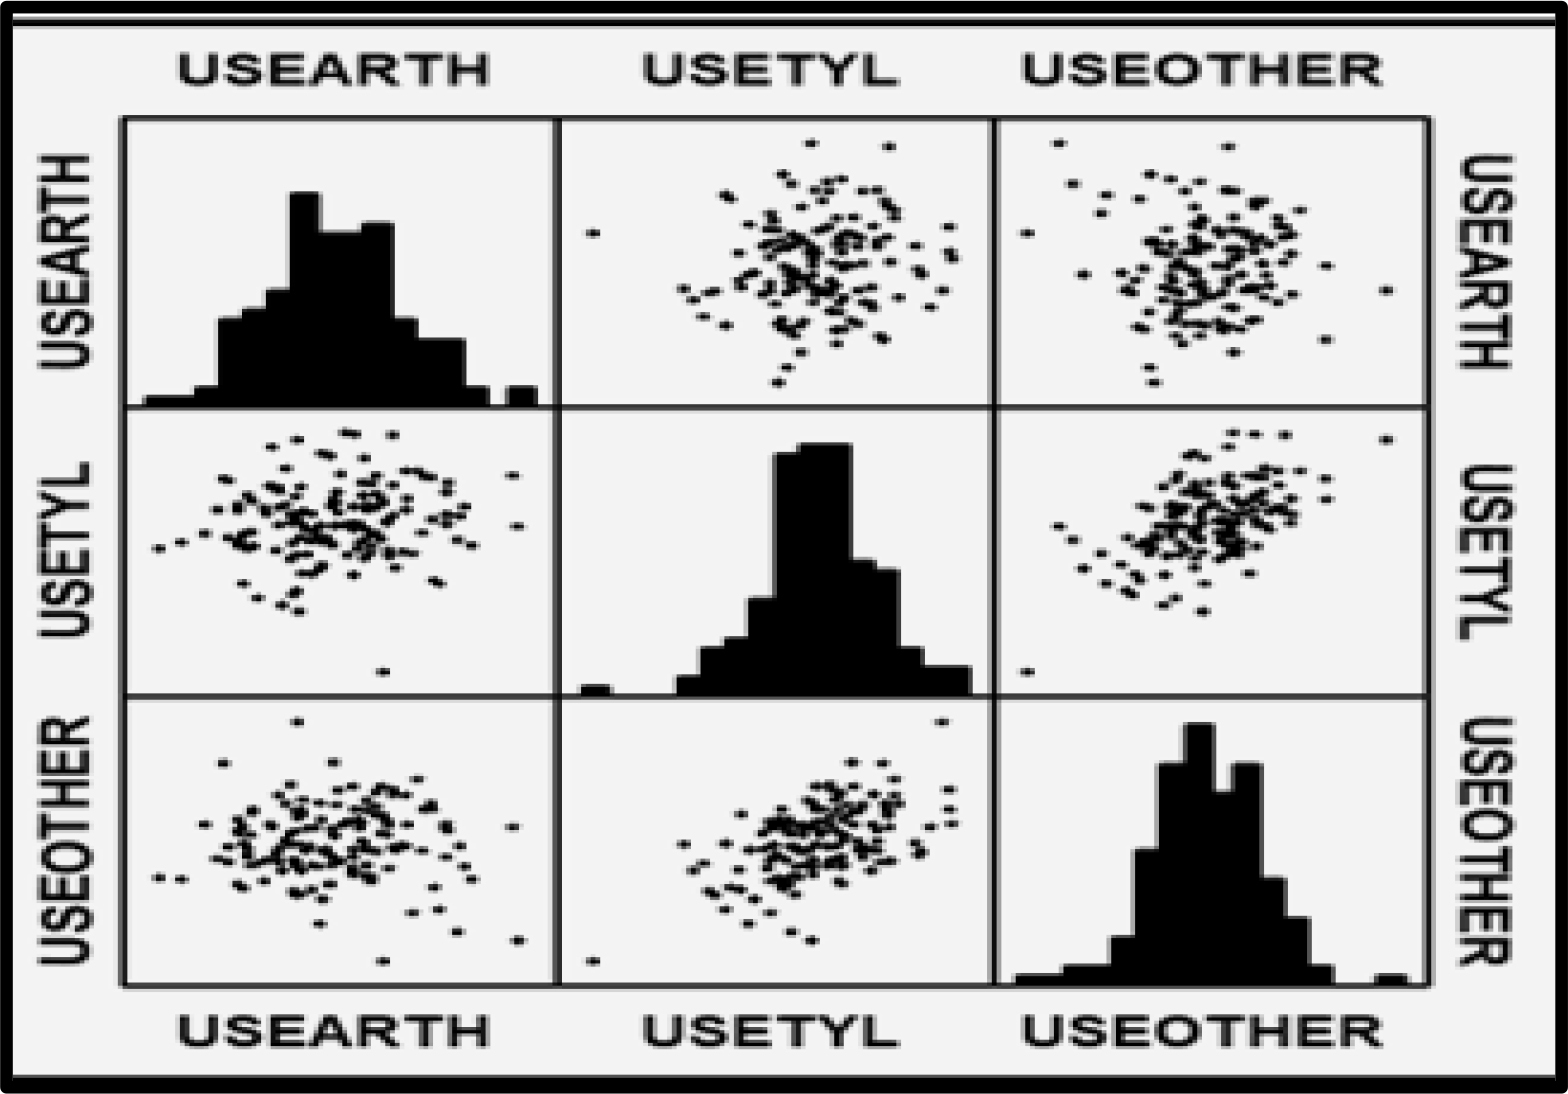
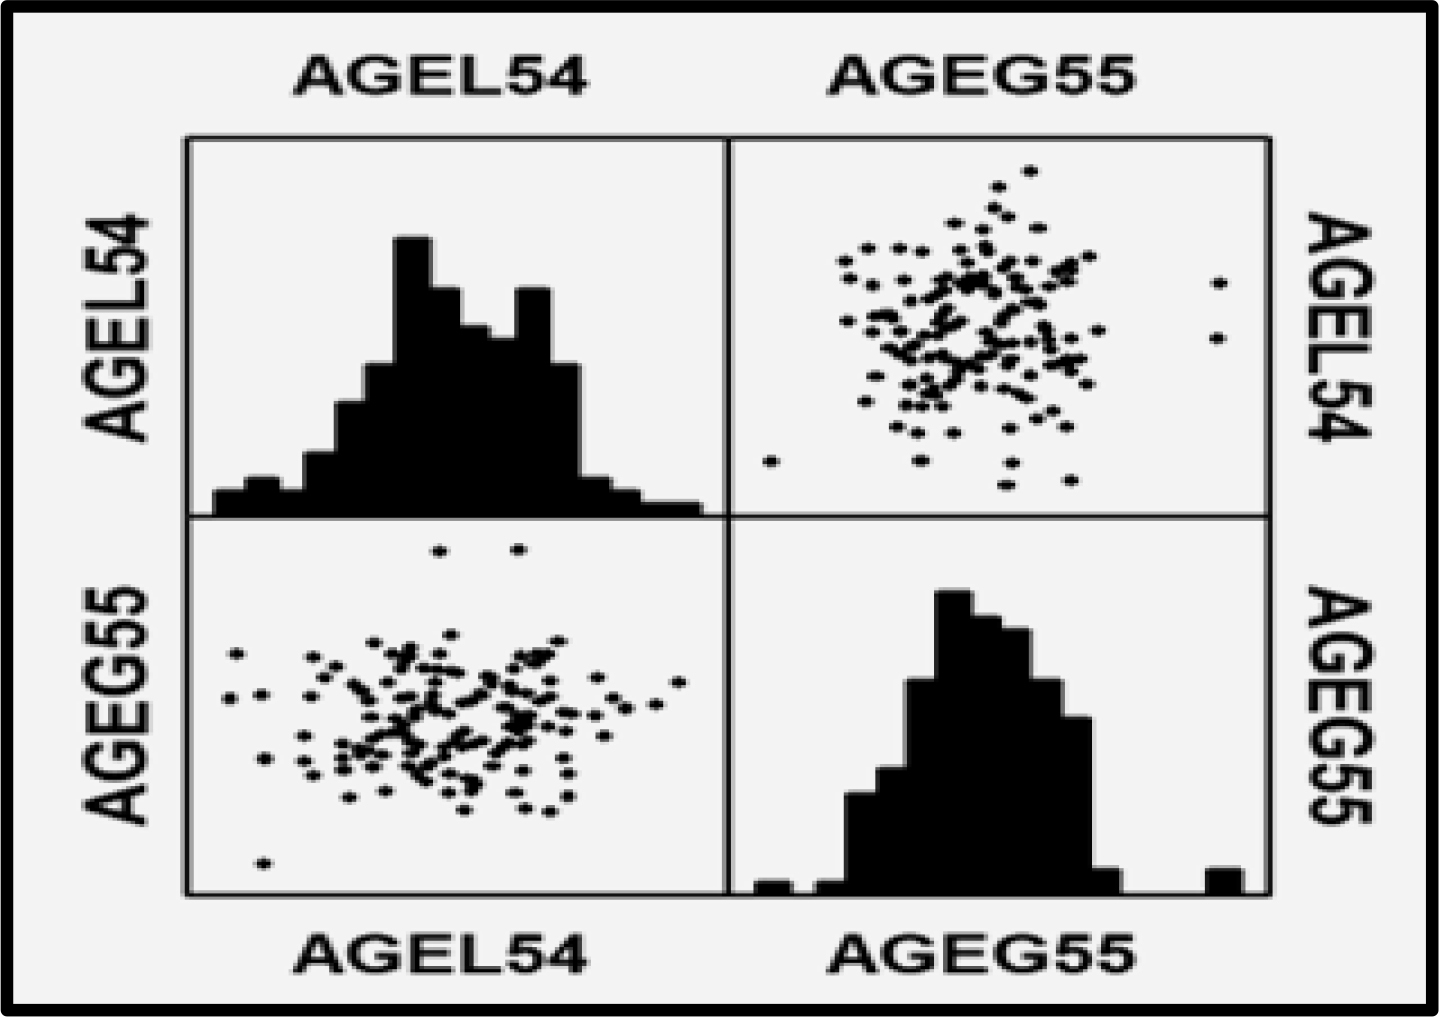
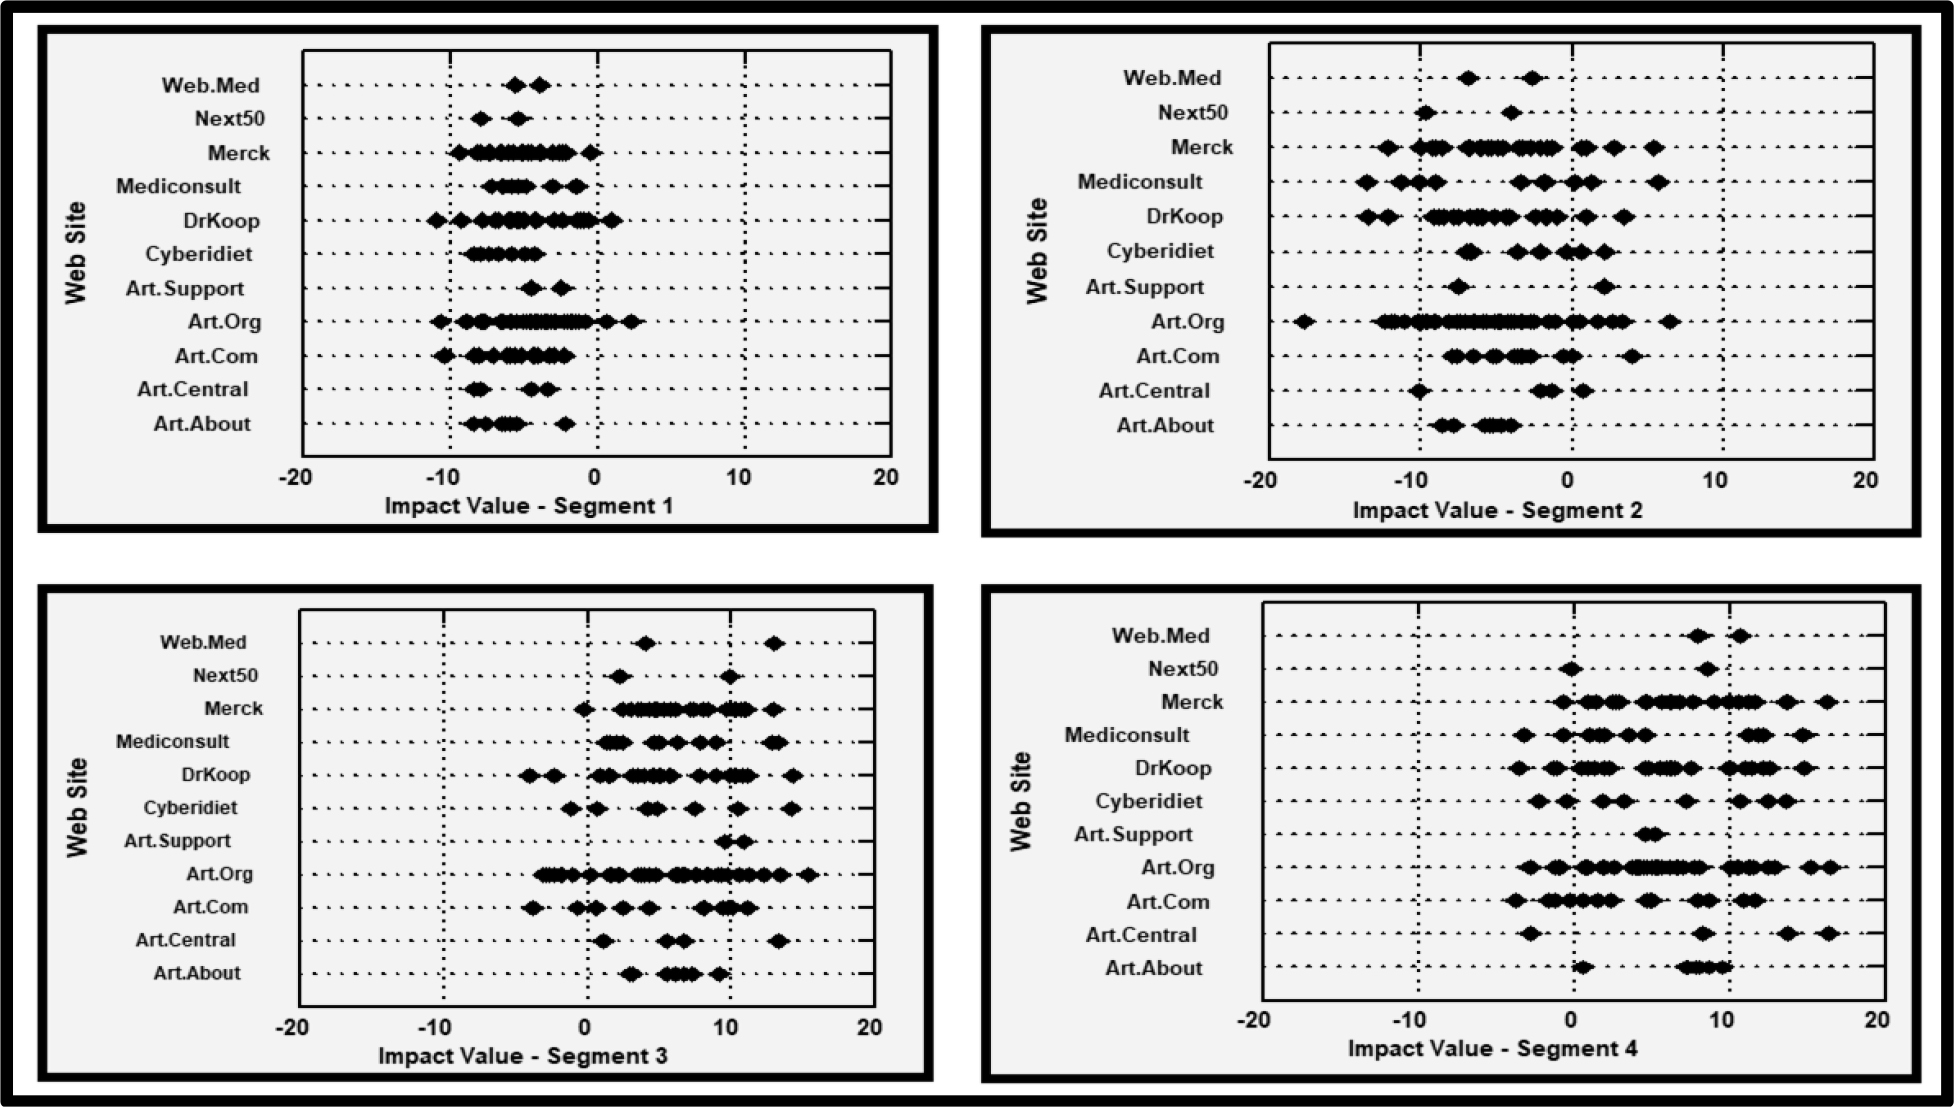
Appendix

Nine recent studies with base sizes of 25-50 respondents, conducted in the same way as the current study. The graphs show the relation for the total panel, between the coefficient of response-time (ordinate) and the coefficient for interest (binary transformed, abscissa). The models were created from the ‘total panel data’ after the data in the first position was eliminated from the data set, leaving only 23 vignettes evaluated by each respondent.

Mind Genomics-013 - ASMHS Journal_F6

Going into Your Own Franchise Business: A Mind Genomics Exploration

DOI: 10.31038/PSYJ.2019111

Abstract

Some years back, the authors were introduced to the International Franchise Association (IFA). The issue was raised as to how the emerging science of Mind Genomics might help the IFA to better understand the mind of the person contemplating involvement with a franchise. In response, we did a study to investigate the drawing power to franchises of elements. Our target population comprised people who were not currently franchisees, but who might be with the right messages. Mind Genomics deconstructed the current messages of franchises, and then recombined these by experimental design, tested among these non-franchisee prospects, only to reveal that many of the commercially uses messages do not motivate. Mind Genomics revealed that the appeal of franchise ideas could not be optimized for the total population as a single cohort, but only for the different mind-set segments ready to accept certain types of messages. The first mind-set could be characterized as You won’t have to go it alone respond to messages with this theme. The second mind-set segment could be characterized as You’ll be secure responds most strongly to one message that promises that. The third mind-set segment t responds to messages with the theme: You can run your business better. This group comprises a quarter of the respondents and constitutes the target group for franchising.

Introduction

Have you ever been at a franchise like Dunkin Donuts, a Mavis Tires or the Tru Value Hardware store? Chances are that you have, and either eaten there or bought something or had something repaired. The likelihood is that one of these stores is just like any another, but that the proprietor, if you were lucky enough to meet him, was a proud owner of this commercial enterprise which looked like hundreds, perhaps thousands of its fellow stores.

A franchise is a business which uses a parent company’s name to sell a product while maintaining a degree of independence from the parent. The parent company is called the franchisor, and the person opening one of these satellite firms is the franchisee. They latter buys the franchise, the right to use the name, the right to sell the products offered to the franchisees as long as they fulfill certain requirements, like buying their raw materials or decorate the store in a specific way, and so forth [1].

The ultimate decision whether to franchise a product or service concept rests with the franchisor. Resarch into the motivation underlying the creation of a franchise relationship has focused almost entirely on the franchisor. An impressive amount of theoretical and empirical economic research has been conducted to explain why firms choose to distribute their products or service offerings through franchise channels [2].

The reasons why individuals join franchise systems and the characteristics that predict which individuals are likely to be interested in becoming franchisees have received little attention [2–4]. In the economic literature, the decision of the franchisee to purchase a franchise has been assumed to be a rational response to an attractive investment opportunity [2].

Researchers have sought the most important perceived advantage(s) of franchising among various groups. For example, in one study British franchisees identified national affiliation (affiliation with a nationally known trademark) as the most important [5]. Knight [6] found known trade name to be most important to a group of Canadian franchisees. We all know that franchisors spend freely on national advertising and marketing for their product line. The purpose of this advertising is to promote sales for the entire franchise chain, and the franchisee benefits from this publicity. Withane [7] found proven business format to be the most important feature to another sample of Canadian franchisees. In a study of U.S. franchisees, Peterson & Dant [3] found that people with no self-employment history ranked training as very important. Franchisors offer technical assistance to franchisees. This type of assistance includes the training of a franchisee in effective management techniques, linking the franchisee with suppliers of materials or resources that are needed in production, and so on. Another important factor was greater independence [3]. Many prospective franchisees are driven by frustration in jobs where they didn’t have enough control to influence results in the way they wanted. Maybe they had a micro-managing boss, a parent corporation that wouldn’t listen, or something similar. Whatever the details, they’re drawn to the idea of being their own boss, having the last say in business decisions and knowing – for better or worse – that they’re responsible.

A key business benefit is that franchises are fairly easy to organize. Like other businesses, the franchisee must abide by local zoning rules. The franchisee’s creditworthiness typically gets a boost from being associated with a major franchise chain such as McDonald’s, Radio Shack, or H&R Block. The franchisor may even help finance the start-up costs for your business. This is important because the range of start-up costs runs from thousands of dollars to hundreds of thousands of dollars [8].

To summarize, franchising is a popular way to start an entrepreneurial business. Franchising is a wonderful way to run a business, offering the freedom and control running one’s own establishment, while at the same time capitalizing on demand created because the business has been in existence many years, and has a loyal following.

Origin of the Mind Genomics Study on the Mind of a Person Thinking about Franchising

The authors were introduced to the International Franchise Association (IFA), headquartered in a meeting in Washington, D.C. Through discussions the issue was raised as to how might Mind Genomics help the IFA better understand the mind of the person thinking about franchising. One could go to the website to learn about franchising, but it wasn’t clear what elements were ‘hot buttons’ to prospects. And so, this study was run, as part of the outcome of that discussion.

Exploring the full world of franchising in one study is an impossible task. There are thousands of franchises of different types just in the United States alone. We decided to study factors that would interest people who aren’t necessarily franchisees at the moment but might be interested. We had no idea about what the ‘hot buttons’ would be.

We began the study by developing the elements. Some of the elements appear in Table 1. The task of developing elements in a new topic area can be made very easy by ‘research.’ Research in this case consists of going to different websites that deal with franchising and specific franchises, downloading the text, and abstracting key phrases [9].

Table 1. Some of the elements from the franchise study.

Silo A – Support to the franchisee

Up to date operations manuals are provided to all franchisees

Silo B – Problems (business, social, individual) that the franchise helps to solve

80% of independent businesses fail over 5 yrs – only 5% of franchisees fail over same period

Silo C: Financial benefits of owning a franchise

Delivers consistent brand promise and customer service

Silo D: Managing the different financial aspects of the operation

Effective system to deal with brand management

Silo E: The type of business

A great idea if you want to open a product-based business

Silo F: Positives about franchise employees

Franchise employees tend to manage costs better than company employees

Silo G: Additional benefits from franchising

Franchisees help drive the major innovations – not always from HQ

The research effort was productive. In fact, going through more than a dozen websites we ended up with 128 different elements or simple phrases. The real question then is how to deal with this richness. We discovered different topics, some topics more diffuse and going in many directions, others quite focused with elements that could be easily substituted for each other.

For the franchise study, we sorted the elements into silos. There are no standard rules which dictate what the silos should be. That decision is left to the investigator. The only requirement is that the structure of the element follows one of the pre-designed templates. The template ensures that each silo comprises a limited number of elements, and that each silo comprises the same number of elements. In this study we developed seven silos with five elements each.

How the Mind Genomics Experiment Proceeds on the Internet

The research ‘protocol’ or steps in the experiment is straightforward when one does Mind Genomics experiments on the Internet. Only the venue changes, from an interview on a computer in a central location to a computer in the privacy of one’s home, used when it is convenient. The respondent receives an e-mail invitation. The respondent ‘clicks’ on the embedded link in the invitation and is taken to the Mind Genomics interview.

We see the introductory screen in Figure 1. There is nothing special about this screen. It simply tells the respondents what the study is about (i.e., franchise programs), a bit about the topic, and then the rating question. Very little is said about the topic, other than a general introduction. The objective is to set the scene, with the elements themselves driving the response.

Mind Genomics-012 PSYJ Journal_F1

Figure 1. The orientation page.

The interview continues with the different test vignettes, an example of which appears in Figure 2. The Mind Genomics experiment is straightforward. It mixes and matches the elements to create small, easy to read combinations of elements, the franchise vignettes. Mind Genomics creates different vignettes for each respondent. Each respondent rates 63 unique combinations. Elements in the combinations appeared independently of each other, as free agents, directed by an underlying experimental design. The design ensured that each element appeared equally often, and that only one element or no elements from a silo appeared in the test vignette. The size of the vignettes varied from 2–4 elements, so that no vignette could be considered complete. In the language of research design the vignette is a so-called ‘partial profile.’

Mind Genomics-012 PSYJ Journal_F2

Figure 2. The PVI, personal viewpoint identifier and three feedback screens, one for each mind set to which a person might be assigned.

These types of vignettes are easy to read. The elements are placed one atop the other, in centered format, without any connectives. The respondents can quickly examine the vignette and react. Such formats for Mind Genomics allow the respondent to evaluate many dozens of vignettes without becoming fatigued. There is no need to ‘search through’ the vignette to find the relevant information.

Each respondent evaluated a unique set of 63 vignettes. The underlying experimental design was maintained throughout, but the specific combinations varied from respondent to respondent [10]. It was strategically more effectively to sample more combinations with less precision than just a few combinations with greater precision. The latter, fewer stimuli but greater precision, typifies the current thinking about research, but has the implicit requirement that these few combinations truly represent the underlying space of alternatives. In contrast, Mind Genomics assumes no knowledge, and covers a wide spectrum of different combinations, in what might be metaphorically called an ‘MRI of one’s thoughts about a topic.’

Converting the Ratings from a 9-Point Scale to a Binary Scale

Consumer researchers are the ‘intellectual children’ of sociologists. They’re not the real children of course, but the thinking of a consumer researcher comes from sociology. Sociology focuses on people in groups, not on the microcosm of a person’s head. So, when a sociologist or consumer researcher looks at the 9-point scale, the real question is whether a person is interested or not interested. That is, to what group does the respondent belong? The notion of ‘belonging’ does not have to apply to the respondent as a person, but rather can apply to the particular response to a question. Continuing along that line of thought, when a respondent rates a vignette 1–6, we say that the respondent belongs to the group who is not interested that vignette. When the respondent rates a vignette 7–9, we say that the respondent belongs to the group who is interested that vignette. We also add a very small random number (<10–5) to the transformed number, the 0 or 100, respectively. The small random number ensures that there is at least a little bit of variation in the binary transformed number, even when the respondent confines his or her ratings either to the low end of the scale (1–6) or to the high end of the scale (7–9). With the addition of the small random there is guaranteed variation in dependent variable, and the analysis will run, without problems.

Now that we have moved to a binary system, ratings of 1–6 are to be considered as ‘not interested,’ and so we will re-code as 0 and ratings of 7–9 are to be considered as ‘interested,’ and we will re-coded as 100, we can do our analysis, using OLS (Ordinary Least-Squares) regression. The independent variables are the 35 elements for franchising. They take on the value 0 when they are absent from a vignette, and the value 1 when they are present in a vignette.

Creating the Models Relating the Franchising Elements to the Responses

Experimental designs are important in Mind Genomics. Because of the systematic arrangement we can develop a descriptive model. The model, an equation, shows how many rating points is contributed by each element, in the opinion of each respondent. We deduce the contribution of each element by looking at the pattern of responses, and how that pattern co-varies with the different elements in the shown vignettes. It can be readily analyzed by the statistical method of ordinary least squares [11]. OLS is one of a class of methods called curve-fitting. OLS finds the relation between the ‘independent variables’ – the appearance of an element within a vignette – and the dependent variable, the 9-point rating.

OLS uses statistical procedures to create an equation of the form:

Concept Rating = k0 + k1(Element A1) + k2(Element A2) … k35(Element G5)

The foregoing equation summarizes the relation between the variables, A1 – G5, and the rating. Each element either appears in a vignette, in which case the element is coded ‘1’, or the element does not appear in a vignette, in which the element is coded ‘0’. This is called ‘dummy coding.’ The term is based upon the fact that the independent variable is either absent (0) or present (1). The rating is the 9-point rating, assigned by the respondent.

Each respondent generates 35 coefficients, one for each tested element as well as an additive constant. The additive constant is defined as the expected score in the absence of any elements. Obviously, no one simply rated franchising without something to rate. However, when we do curve fitting, as OLS does, we use a linear equation of the form Y = mx + B. Our additive constant is B. The additive constant is a purely estimated parameter.

Let’s now look at the results of the modeling. We create the model for each one of our 102 respondents. Recall that each respondent evaluated a totally unique set of combinations, albeit created with the same 35 elements. When we run the OLS regression to create the model, we do this regression 102 times. Modern statistical programs can estimate the additive constant and the 35 coefficients in a matter of seconds. The average additive constant and coefficients for the 35 elements appear in Table 3. We created the 102 Interest Models, and simply averaged the corresponding parameters across the 102 respondents.

We begin with the additive constant. The additive constant tells us the conditional probability (in %) of respondents who would have rated the vignette 7–9 in the absence of any elements. The constant is 22. By design, all vignettes comprised 3–4 elements, so the additive constant is an estimated parameter. Yet the additive constant has informational value. It is a baseline, telling us the basic interest or predilection to be interested in franchising. It’s not high, only one person in five. That means, the elements must do most of the work to convince, at least for the total panel. We’ll see other results in a moment that are more promising, but just starting with total panel tells us we have to get the right messaging, or we have what’s colloquially called a ‘non-starter.’

We sorted the elements from highest to lowest. That stratagem allows us to discover the range of coefficient values, and in turn whether or not we have any coefficient values which really stand out. Statistical analysis as well as observations from many thousands of these Mind Genomics studies suggest that we’re likely to see significant and meaningful effects when the coefficient value for an element is +10 or higher or -5 or lower.

The most important thing to strike our note in Table 2 is the very narrow range of coefficient values. The highest coefficients are +4, and are quite discouraging. Nothing seems to excite respondents. The elements come from different silos, and do not show any consistent patterns. The lowest coefficients are -3

Table 2. Coefficients for the 35 elements from the franchise study. The numbers come from the total panel, and from the Interest Model. The elements are sorted from highest coefficient to lowest coefficient.

Mind Genomics study on responses to franchise definitions and benefits

Total Sample

Base size

102

Additive constant

22

A1

Up to date operations manuals are provided to all franchisees

4

A3

Franchises receive store design courses to create the optimal settings

4

A4

Continuing systems support -available at all times

4

C3

A franchise creates successful distributions systems with benefits to business and customers

4

C5

Allows people to open more locations quickly with less capital

4

E4

A great idea if you want to open a home-based business

4

G4

You can operate with smaller corporate and field organizations than traditional business

4

G5

When you are a franchisee you are backed by a stabilizing force

4

A2

You will receive helpful site selection support to maximize visibility

3

A5

Franchises are automatically part of a network of other franchisees… share tips to succeed

3

B1

80% of independent businesses fail over 5 yrs – only 5% of franchisees fail over same period

3

B2

Franchisors help franchisees minimize mistakes based on their development and learning of that franchise

3

B3

A franchise has enforceable standards to protect franchise system and brand

3

C1

Delivers consistent brand promise and customer service

3

C2

You will get high returns on your invested capital

3

G2

You can experience rapid market penetration

3

B4

A franchise helps transfer business technology to emerging markets

2

C4

A franchise gives you the ability to replicate your franchise in other locations inexpensively

2

E1

A great idea if you want to open a product-based business

2

E2

A great idea if you want to open a service driven business

2

F1

Franchise employees tend to manage costs better than company employees

2

D2

Effective system to manage pricing

1

E5

A great idea if you want to open a mail-based business

1

G1

Franchisees help drive the major innovations – not always from HQ

1

D3

Effective system to manage national accounts

0

D5

Effective system to manage IT systems, such as point of sale innovations, accounting, centralized billing and collections

0

F2

Franchise employees tend to reduce spoilage and shrinkage

0

F4

Franchise employees are usually better focused when making hiring decisions

0

F5

Franchise employees are usually better at controlling wages and benefits

0

G3

Franchises allow the pooling the capabilities, know-how and expertise of franchisors with capital and motivated efforts of franchisee

0

E3

A great idea if you want to open a hi-tech business

-1

F3

Franchise employees tend to manage labor costs better

-1

B5

Can be used to solve critical issues like malaria, clean water etc.

-2

D1

Effective system to deal with brand management

-2

D4

Effective system to manage inventory purchasing

-3

Table 3. Coefficient values for strongest and weakest elements from the franchise study. The numbers from the three mind-set segments

Mind-Set

1

2

3

Base size

55

22

25

Additive constant

21

26

22

Mind-Set 1 – You won’t have to go it alone

Up to date operations manuals are provided to all franchisees

8

-4

4

Allows people to open more locations quickly with less capital

7

-5

5

Franchises receive store design courses to create the optimal settings

7

-4

3

Continuing systems support -available at all times

7

0

3

Can be used to solve critical issues like malaria, clean water etc.

-6

6

1

Mind-Set2 – You’ll be secure

80% of independent businesses fail over 5 yrs – only 5% of franchisees fail over same period

-4

13

11

Delivers consistent brand promise and customer service

6

-7

5

Franchise employees tend to manage costs better than company employees

3

-7

7

Mind-Set 3 – You can run your business better

You can operate with smaller corporate and field organizations than traditional business

-2

4

15

Effective system to manage pricing

-4

-4

14

When you are a franchisee you are backed by a stabilizing force

0

3

12

80% of independent businesses fail over 5 yrs – only 5% of franchisees fail over same period

-4

13

11

Franchises allow the pooling the capabilities, know how and expertise of franchisors with capital and motivated efforts of franchisee

-4

-3

10

You can experience rapid market penetration

1

2

9

A franchise helps transfer business technology to emerging markets

-1

-1

9

Franchisors help franchisees minimize mistakes based on their development and learning of that franchise

-1

6

8

A franchise creates successful distributions systems with benefits to business and customers

6

-4

8

A great idea if you want to open a hi-tech business

1

-2

-4

What do we conclude from these coefficients? They certainly are low, both in basic interest and in the drawing power of the individual elements. On reflecting about the results, we should not be particularly surprised. We are talking here to a general population, not to individuals who are ready to buy into a franchise. Perhaps, then, the answer lies in subgroups, which it does, as we will see in the next section.

Three Mind-Sets Regarding Franchising

Mind-set segmentation has proven to be a very strong outcome in the world of Mind Genomics, and continues to do so, as we will see from these data. We cluster the 102 respondents on the basis of their individual coefficients [12]. Through our experiments using Mind Genomics we find that segmentation reveals groups of related elements which score strongly among a specific group of people.

Whereas most segmentation divides people and then hopes to find ideas moving in tandem with that division, we are doing the exact opposite. We identify the ideas, find the different basic groups of ideas, and then assign a respond to a group based on his behavior specific to the topic.

Although we went into the franchise study not knowing much except what was presented at the website, the respondents appear to know more than we might believe. We say this because our initial foray into the results suggested that nothing worked, nothing ‘popped,’ and that the entire exercise could be classified as simply one big yawn. And we would be correct. We could ascribe it to the fact that we didn’t have the correct elements, or that we didn’t poll the correct respondents, or that we didn’t ask the correct questions.

Now let’s look at what happens when we have an almost self-organizing system, without our conscious intervention, and without any knowledge ahead of time. Our inputs comprise the stimuli, the raw material from the websites on franchising, and respondents, the minds of regular, ordinary, run-of-the-mill respondents who may or may not be interested in franchising. What happens when we cluster these people, dividing them into groups with similar patterns of coefficients?

We end up with three segments. The clustering is a simple, almost mechanical procedure, searching for patterns in data. The patterns must be statistically valid, which is ensured by the clustering algorithm (k-means.) The clustering must be conceptually valid, meaning that the clusters or mind-sets emerging from the clustering effort must make sense in two ways:

  1. The clusters must be parsimonious. Fewer clusters or mind-sets are better than many clusters.
  2. The clusters must ‘tell a story’. The strongest performing elements in each cluster must combine in a way to send a harmonious message, rather than ‘fighting with each other and going in different directions.’ This coherence is subjective, left to the researcher.

Table 3 shows the highlights from the clustering, which emerged with three segments or mind-sets about franchising. All three mind-sets segments begin with low additive constants, meaning that the respondents in the mind-set are not fundamentally interested in franchising. It will be the elements which do the work to convince. The mind-sets suggest to us that there will be three patterns of elements which convince, and that a person will be more likely to be convinced by one of the three patterns, and less likely to be convinced by the other two patterns.

  1. Mind-Set 1: People from this segment respond to messages with the theme You won’t have to go it alone. However, despite their homogeneity, the truth of the matter is that this general group isn’t particularly responsive to the elements.
  2. Mind-Set 2: This segment responds most strongly to one message that tells them You’ll be secure.
  3. Mind-Set 3: Although they begin with a low additive constant (22), they respond quite strongly to many of the messages. The key messages are those with the theme: You can run your business better. This group comprises a quarter of the respondents and constitutes the target group for franchising.

It is clear, therefore, that the big opportunity for franchising is both identifying the key messaging, and then sending those messages to the correct person. By segmenting the respondents according to the type of message to which they respond, we see that we can take what might otherwise be a bland set of messages from a website, and both discover ‘what works, and with whom.’

We are missing only one thing; how do we find these segments in the population. And strategies for finding them will be our next and last section in this chapter.

Finding the Segments in the Population

When we look at the segmentation results from Table 3, we should be struck by the fact that there is really only one group of respondents who comprise our target. These individuals are the respondents in Mind-Set 3. Ordinarily we might look for individuals who fall into this mind-set. That makes a great deal of sense. Mind-Sets 1 and 2 do not comprise people who respond particularly strongly to ideas about franchising. Indeed, the truth of the matter is that the basic idea of franchising is not appealing, with a low additive constant (25 or less). It’s the elements which must do the ‘heavy lifting’ to convince, and the elements only work among Segment 3.

In order to type a person, we apply an approach used by today’s doctors. Rather than relying on family history, still a valuable source of information, we can use short interventions. Physicians do this all the time. The beginning of most medical exams comprises a blood test, or an electrocardiogram, and so forth. These are interventions, small tests that interact with the respondent, measure a response, and then compare that response to a set of norms and diagnostics.

Recently, author Gere has developed an algorithm to assign a new person to one of the mind-sets. The approach has been used to assign new people to a mind set in a variety of different applications, ranging from medicine to food. The approach has been made deliberately simple to make it applicable with data collected in previous studies.

The sequence below describes the process, first for two mind sets, and then noting how to extend the approach to three minds.

  1. First, we subtract the two vectors (element by element) and compute their absolute difference (e.g. abs(x-y))
  2. Then look for the five highest differences e.g. we look for the elements that are the farther from each other in terms of the response of the two mind sets.
  3. Open up a new worksheet, and list all the elements and their absolute difference
  4. Each chosen element (the five in step 2) receives one vote.
  5. Add random noise to the two vectors of elements and repeat steps 1–4.
  6. Repeat steps 1–4 a total of 1,000 times. This is called a Monte Carlo simulation with bootstrapping
  7. At the we look at the table created in step 4 and chose those five elements which were chosen as most discriminating the most times.
  8. In the case of three segments we do the same but in the first step we create three additional variables (S1-S2, S1-S3 and S2-S3) instead of one variable (S1-S2) and choose 6 elements not five.
  9. Steps 1–8 produce the necessary information to create a basic PVI, personal viewpoint identifier, which uses the five or six elements, in the form of questions, and assigns a new person to one of the two (or three) mind sets.
  10. Create an interface which accepts the input data from a new person, and returns with the assignment, as well as storing other information about the respondent. For this project, the PVI is, of this writing (March, 2019), located at: http://162.243.165.37:3838/TT17/

Figure 2 shows an example of the PVI for this study, and the three feedback screens which emerge after a new person is assigned to one of the three mind-sets. The screens can be adjusted to accord with he the requirements of the project, may be sent to the candidate doing the typing, or to an interviewer who is ‘vetting’ the candidate for a franchise, or even attached to a person’s data record for further use by other parties interested in working with the candidate.

Summing Up

Franchising is growing our economy because it provides certain benefits of a big company, while at the same time letting a person be his own ‘boss.’ Yet, as our Mind Genomics exercise shows, the messages that are offered on commercial franchise websites are not particularly motivating.

Our exercise suggested that a great deal motivation might emerge from segmenting the respondents in terms of their mindsets. The Mind Genomics exercise suggests at least three mind-set segments, although there might be more. Two mind-set segments did not suffice. The problem, however, is to identify the mind-set segment to which a person belongs.

We introduced the notion of an intervention by mind-typing. The respondent rates a set of elements, namely those coming from the original Mind Genomics exercise, and then using the ratings, assign the person to the appropriate mind-set segment. The results of the exercise are likely to provide better fits of people and franchises, as well as providing a new avenue for the application of Mind Genomics to the issues dealt with in applied psychology.

Acknowledgement

Attila Gere thanks the support of the Premium Postdoctoral Research Program of the Hungarian Academy of Sciences.

Reference

  1. Lafontaine F, Kaufmann PJ (1994) The evolution of ownership patterns in franchise systems, Journal of Retailing 70: 97–113.
  2. Kaufmann PJ, Stanworth J (2002) The decision to purchase a franchise: A study of prospective franchisees. Journal of Small Business Management 33: 22.
  3. Peterson A, Dant R (1990) Perceived advantages of the franchise option from the franchisee perspective: Empirical insights from a service franchise, Journal of Small Business Management 28: 46–61.
  4. Stanworth J, Purdy D (1994) The Blenheim / University of Westminster Franchise Survey No. 1. London, England: International Franchise Research Centre, University of Westminster.
  5. Stanworth J (1977) A Study of Franchising in Britain. London, England: University of Westminster.
  6. Knight RM (1986) Franchising from the franchisor and franchisee points of view, Journal of Small Business Management 25: 8–15.
  7. Withane S (1991) Franchising and Franchisee Behavior: An Examination of Opinions, Personal Characteristics, and Motives of Canadian Franchisee Entrepreneurs, Journal of Small Business Management 29: 22–29.
  8. O’Connor DE, Faile C (2000) Basic Economic Principles: A Guide for Students. Publisher: Greenwood Press, Westport, CT.
  9. Moskowitz HR, Gofman A (2007) Selling Blue Elephants: How to Make Great Products that People Want Before They Even Know They Want Them. Pearson, New York.
  10. Box GE, Hunter JS, Hunter WG (2005) Statistics for experimenters: design, innovation, and discovery (Vol. 2). New York: Wiley-Interscience.
  11. Cohen GJ, Cohen P (1983) Applied Multiple Regression/Correlation Analysis for the Behavioral Sciences Lawrence Erlbaum Associates, Publishers. Hillsdale, New Jersey London.
  12. Keren C, Lewis G ED (1993) A Handbook for Data Analysis In The Behavioral Sciences: LAWRENCE ERLBAUM ASSOCIATES, Lawrence Erlbaum Associates, Publishers. Hillsdale, New Jersey London.

Discovering Features of a Beverage to Increase Product Use: Pakistan, Mind Genomics, and Mango Nectar

DOI: 10.31038/NRFSJ.2019212

Abstract

We present the results of a case history experiment for the introduction of a traditional product, mango nectar, to Pakistan, which has several juice and beverage brands. The objective was to determine whether one could discover the convincing messages for this new product, the brand, and the correct product price, and in turn the product that the mango nectar would replace. The data revealed a clear hierarchy of messages, which were primarily brand and price as the strongest motivators of interest in the mango nectar, and only far below did product features emerge, and below those features emerged other brands and higher prices as the least motivating. A more coherent picture emerged from expected substitution of the nectar for other beverages, with three mind-sets emerging. In order of size these were substitution for juice, for carbonated soft drink, and for lassi, respectively. The segmentation by substitution also revealed that for each substitution mind-set different product features emerged driving interest in the mango nectar.

Introduction

Marketers entering a crowded category often attempt to sell their product by better messaging, once the product is developed.  Often, the process of entering the category is a mix of reasoned economic analysis about the local and market and product, and a guess about just what to say to entice consumers to try the product.  Even the most experienced marketers who are familiar with product marketing are ‘stumped’ when it comes to the question of ‘just exactly what do we say to sell THIS particular product?’

The problem of what to create in a product, and what in turn, to present to the public in advertising and promotion, remains one of the most vexing problems. An entire industry of consumer research has grown up with metrics measuring the response of consumers to features that the product has or delivers (promise testing, concept design), and well as the response of consumers to the specific messages designed to communicate (message testing, concept evaluation.)

During the past 35 years, author Moskowitz and collaborators have worked on the problem of ‘how to discover the mind of the consumer’ by methods which are rapid, inexpensive, scientifically validated, and knowledge-creating, respectively. Rather than achieving the former by evaluating a limited number of test stimuli with many consumers, hoping thus to be precise, the approach used by Moskowitz works in a different direction. The strategy is to test many different aspects of a product or service, these aspects incorporated into many different ‘vignettes,’ or ‘test concepts,’ these vignettes in turn created by experimental design. The analogy is the MRI, which takes many snapshots of tissue, and puts the snapshots together by computer to create a three-dimensional model of the tissue. With the strategy adapted for concepts, and labelled ‘Mind Genomics,’ the approach produces a model of the idea, looking at the response to many different aspects of the idea.

We apply this approach in Pakistan to a well-known product in search of greater distribution. The product is mango nectar.  This study presents the results of the marketing study, looking for the appropriate words to use which interest prospective consumers in this beverage. There is a great deal published on mangoes, some on mango nectar, but most of the publications appear to focus on the technical aspects of mangoes and mango nectar, not on the marketing of, and communication about mangoes. The reason for the focus on the technical rather than on the marketing is simply one of evolution. Marketing studies focus on bigger problems than the study of how to promote one specific product, although there is some literature dealing with the marketing of mango pulp [1,2]. In contrast, technical studies focus on the product itself, because the technical issues can produce a ‘neat and tidy’ scientific experiment. Good examples of the sensory and consumer work about mangoes can be found in a variety of representative publications [3–5].

Rather than the conventional focus group which tests ‘complete’ concepts, or even a quantitative study to evaluate the response to a concept among hundreds of respondents, we used experimental design of ideas, conjoint measurement, applied to a well-known product, mango nectar, but in a new population, Pakistani consumers.  The study was part of an effort to introduce the new science of Mind Genomics to the Pakistani business world, using as a proof point the results with a well-known type of product.

Method

We used the emerging science of Mind Genomics [6,7], based on conjoint measurement [8]. Briefly, Mind Genomics is founded on the key point of view that the most appropriate way to understand people’s responses to specific products and situations is from the ‘bottom-up,’ in a style that can be best described by the analogy to the artistic painting style known as pointillism.

Pointillism is a way of painting in which small separate dots of pure color are used to form images. The artist paints the picture with hundreds of tiny dots, mainly of red, yellow, blue and green, with white. The eye and mind of the viewer mix the colours to make different shades of these colours, as well as orange, purple, pink, and brown depending on the way the dots of colour are arranged. (https://simple.wikipedia.org/wiki/Pointillism)

Mind Genomics builds up an understanding of the world by doing many small studies on specific topics. When the topics are related, and the researcher stands back and looks at the main findings across these small studies with specific topics, an emergent picture of the world comes into view. Unlike pointillism in art, however, each dot, or each small experiment, provides valuable information, in and of itself.

The study here represents one of those dots, a study on the response to the idea of mango nectar, among Pakistani respondents, who are accustomed to the product.

Mind Genomics follows a series of well-choreographed steps, which, when combined, constitute a cartographic study of a particular topic. In other words, the Mind Genomics study ‘maps out’ the response to different aspects of the topic. For our study on mango nectar, these different aspects.

  1. Select the raw materials, namely questions and answers (silos and elements.) Mind Genomics begins by asking a series of questions (silos), which tell a story, and then requiring six different answers to each question (elements.)  This first step is usually the hardest, requiring the researcher to think in a new, more disciplined fashion.  Most researchers have trouble formulating the questions to tell a story. Once, however, the questions are formulated, it is quite easy to come up with six answers. The issue is usually one of reducing the number of answers. Table 1 shows the six questions, and the six answers per questions. The important thing to note is that each answer is presented as a short declarative statement, easy to read.
  2. Test vignettes comprising mixtures of these answers, constructed by an underlying experimental design. The typical approach by researchers asks the respondent to evaluate each answer (element), one answer at a time. This is the so-called questionnaire approach, which requires the respondent to introspect about the element. With such an approach, one can get a rating of each of the 36 elements. The problem with questionnaire data is that the stimulus is one-dimensional, allowing the respondent to answer in a way that is presumed to be most appropriate, and presumably reflects the way in which the respondent would like to be seen. This ‘mental editor’ leading to possibly biased answers can be eliminated by presenting the respondent with a combination of different elements, i.e., a vignette, and then by instructing the respondent to evaluate the entire vignette as one entity. This latter approach is an experiment, because we deduce the response to the single element by deconstructing the response to the vignette into the component contributions of the different elements.
  3. Select the Experimental Design: For each respondent, create a set of 48 vignettes, each vignette comprising either three elements (12 of the 48 vignettes), or four elements (36 of the 48.) Each of the 36 elements appears exactly five times across the 48 vignettes, and absent 43 times. Furthermore, the vignette comprises at most one element (answer) from each silo (question.) Thus, the vignettes are incomplete, which does not hinder the respondent from assigning an answer. Finally, each respondent evaluates a unique set of 48 vignettes, covering a large proportion of the possible vignettes [9].
  4. Dynamically Create Vignettes and Present them to Respondents: Each respondent rated the individualized set of 48 vignettes on two rating scales (shown in Table 2).  Figure 1 shows an example of a single vignette with the two rating questions. The strategy to make the experiment less onerous is to present the 3–4 elements as simple phrases, one atop the other, in double spacing. The spacing and the structure of single phrases presented without any connectives make it easy for the respondent to ‘graze’ for the relevant information.  The first rating question is an example of a category or Likert scale, showing different levels of interest. The second rating question is an example of a nominal scale, in which the scale points do not have numerical value, but rather are placeholders for different or alternative phrases. The respondent’s task when answering this second question is to select the ONE end use.   At the top of both figures is a pair if numbers, 2/67 denoting the second ‘logical’ screen out of a total of 67 such screens. The sequence number (2/67) does not change when the vignette is the same but the rating question changes from purchase intent to selection of a product that the mango nectar will ‘replace.’  The experiment lasts approximately 15 minutes and moves along quickly. Every effort is made to keep the task simple, and to promote rapid evaluations, rather than considered, effortful evaluations. The former has become popularly called ‘System 1 thinking,’ an intuitive, so-called ‘gut reaction,’ typical of how people react to the stimuli of their daily lives [10].
  5. Run the Experiment: The study was run in Pakistan, using a local panel provider. The study was in English, and thus was limited to respondents who could read and write English. The respondents were member of the panel, accustomed to participating in studies run on the Internet. The respondent received an email invitation. To participate, the respondent was instructed to click on an embedded link. The respondent was led to the research site.
  6. Orient the Respondents: The experiment began with the orientation page shown at the bottom of Figure 1. Note that the orientation page presented the experiment as a survey, rather than as an experiment, primarily because the word ‘experiment’ may frighten the respondent. The word ‘survey’ is far less frightening. The orientation page does not tell the respondent much about the study at all, other than the study concerns a mango nectar. The remainder of the information about the mango nectar was left to the influence of the 36 elements shown in Table 1.

Table 1. The six questions, each with six answers for the mango nectar product.

Question A – What is the benefit to the person who drinks the mango nectar?

A1

Enjoy a unique taste of mango juice…sweet with minimal sour taste

A2

A delicious nectar that will pick you up when you are tired

A3

Tingles your taste buds as you swallow… and for a moment you’ll think you’re out of this world!

A4

A perfect balance…sweetness of honey and tanginess of an orange

A5

Sweet & heavenly blend of mango pulp sensuously melting in your mouth

A6

Smooth and thick…leaves a wonderfully lingering aftertaste

Question B – What are the sensory perceptions of   and emotional responses to the mango nectar?

B1

Energizing, delightful aroma…as if you just entered the gardens of heaven

B2

A delicious and fruity mango aroma…pleasant enough to remind you of a cool summer breeze…strong enough to have you asking for more

B3

Sweet fruity aroma that is simply irresistible

B4

An intense tropical aroma as if you’re holding a real mango

B5

It smells like a fresh tropical fruit exciting your taste-buds

B6

You can never mix-up this distinctive rich, sweet smell with anything else

Question C – What does the mango nectar look like?

C1

Bright, yellow color of this drink is so mouthwatering

C2

Orangish-yellow color is very energizing

C3

Light yellow soft & soothing color

C4

Deep golden colors of the king of fruits

C5

Dark golden color of sun-kissed mangoes

C6

Made from ripe mangoes, which makes its color intensely tempting

Question D – What are some product ingredients and health-promoting ingredients?

D1

Contains natural mango pulp

D2

Delicious mango nectar from concentrate, enriched with vitamins A, B, C

D3

Mango Nectar: 30% juice, no saturated fat, trans fat or cholesterol

D4

All natural, not from concentrate, no artificial sweetness

D5

Vitamin C, mango pulp, no sugar added

D6

Rich in Nutrients, Vitamin A, Vitamins B (B1, B2 and B3), Vitamin C, Calcium, Iron, Phosphorus and Potassium

Question E – What is the price?

E1

Rs. 145 Per Liter

E2

Rs. 130 Per Liter

E3

Rs. 115 Per Liter

E4

Rs. 100 Per Liter

E5

Rs. 85 Per Liter

E6

Rs. 70 Per Liter

Question F – What is the brand name?

F1

Nestle

F2

Olfrute

F3

All Pure

F4

Nurpur

F5

Shezan

F6

Benz

Table 2. The two rating questions

1. How interested are you in buying this mango nectar based on this information?

1 = Not at all interested…9 = Very interested

2. Select which ONE drink will this mango nectar replace FOR YOU

1 = Mineral water   2 = Carbonated soft drink 3 = Milk  4 = Lassi  5 = Other flavor of juice

Table 2. Model and statistics for the relation between interest after binary transformation (dependent variable) and the presence/absence of each of the 36 elements (independent variable.)


Coeff

t Stat

p Value

Additive constant

40.29

5.11

0.00

E6

Rs. 70 Per Liter

19.31

8.33

0.00

F1

Nestle

17.36

7.29

0.00

E5

Rs. 85 Per Liter

13.29

5.77

0.00

D6

Rich in Nutrients, Vitamin A, Vitamins B (B1, B2 and B3), Vitamin C, Calcium, Iron, Phosphorus and Potassium

5.91

2.50

0.01

A2

A delicious nectar that will pick you up when you are tired

5.35

2.25

0.03

A1

Enjoy a unique taste of mango juice…sweet with minimal sour taste

4.07

1.69

0.09

B5

It smells like a fresh tropical fruit exciting your taste-buds

3.97

1.66

0.10

D2

Delicious mango nectar from concentrate, enriched with vitamins A, B, C

3.90

1.65

0.10

D4

All natural, not from concentrate, no artificial sweetness

3.76

1.60

0.11

E4

Rs. 100 Per Liter

3.68

1.57

0.12

C1

Bright, yellow color of this drink is so mouthwatering

3.33

1.41

0.16

D1

Contains natural mango pulp

2.84

1.21

0.23

C2

Orangish-yellow color is very energizing

2.73

1.16

0.25

A6

Smooth and thick…leaves a wonderfully lingering aftertaste

2.46

1.04

0.30

C6

Made from ripe mangoes, which makes its color intensely tempting

2.10

0.89

0.37

B2

A delicious and fruity mango aroma…pleasant enough to remind you of a cool summer breeze…strong enough to have you asking for more

1.81

0.76

0.45

A3

Tingles your taste buds as you swallow… and for a moment you’ll think you’re out of this world!

1.74

0.72

0.47

F2

Olfrute

1.49

0.62

0.54

A5

Sweet & heavenly blend of mango pulp sensuously melting in your mouth

1.46

0.61

0.55

D3

Mango Nectar: 30% juice, no saturated fat, trans fat or cholesterol

1.26

0.53

0.59

B3

Sweet fruity aroma that is simply irresistible

1.21

0.51

0.61

B4

An intense tropical aroma as if you’re holding a real mango

1.04

0.44

0.66

C3

Light yellow soft & soothing color

0.62

0.26

0.80

D5

Vitamin C, mango pulp, no sugar added

0.18

0.08

0.94

F3

All Pure

0.13

0.06

0.96

B1

Energizing, delightful aroma…as if you just entered the gardens of heaven

0.11

0.05

0.96

B6

You can never mix-up this distinctive rich, sweet smell with anything else

-0.04

-0.02

0.99

A4

A perfect balance…sweetness of honey and tanginess of an orange

-0.05

-0.02

0.98

C5

Dark golden color of sun-kissed mangoes

-0.90

-0.38

0.70

C4

Deep golden colors of the king of fruits

-2.80

-1.20

0.23

F5

Shezan

-6.12

-2.56

0.01

E2

Rs. 130 Per Liter

-6.97

-2.99

0.00

E3

Rs. 115 Per Liter

-7.35

-3.19

0.00

F6

Benz

-7.91

-3.33

0.00

F4

Nurpur

-9.49

-3.94

0.00

E1

Rs. 145 Per Liter

-12.05

-5.20

0.00

Mind Genomics-014 NRFSJ Journal_F1

Figure 1. The orientation page.

The role of the orientation page is to tell the respondent about what they will see, and what they are to do. The orientation page also tells the respondent information about how long the survey will last (about 12 minutes), and that the vignettes (called combinations) are all unique, i.e., all different from each other. The reason for this seeming ‘additional information’ is that previous studies often received comments from respondents that they were evaluating the ‘same’ vignettes several times. To the respondent it might seem as though the vignettes are repeated because the elements repeat, but the underlying experimental design driving the combination of elements ensures that every vignette is different.

Analysis

The analysis of Mind Genomics data follows a specified sequence, comprising data transformation, modeling by OLS (ordinary least-squares) regression, creating individual-level and group models relating the independent variables to both the rated and substitution, and finally using cluster analysis to identify similar respondents, ‘similar’ defined by the pattern of responses, and not by WHO the respondents are.

Preparing the Responses for Modeling

The two ratings scales, for interest and for the selection of substitution, require different preparations of the data. We begin with the first rating scale, the nine-point scale for interest, our category or Likert scale. The data are already in a form that can be analyzed by OLS (ordinary least-squares) regression, either at the level of the individual respondent or at the group level, pooling together the data from all the respondents.  Previous experience with Mind Genomics studies using rating scales continued to reveal that most users of the data did not understand how to interpret the rating scale. Most asked ‘what does a 4 or a 7 mean?’  A better approach divides the 9-point scale into two regions, the low region corresponding to ‘not interested’ (ratings 1–6), and the high region corresponding to ‘interested’ (ratings 7–9.) The division of the scale between ratings of 6 and 7 has been thus done for 30 years before analyzing the results.  A rating of 1–6 is replaced by the value ‘0’ plus a small random number (<10–5), whereas a rating of 7–9 is replaced by the value ‘100’, again plus a small random number. This stratagem ensures that the data can be analyzed by OLS regression, whether at the individual respondent level or at the group level, respectively.

Modeling the interest rating to discover what drives interest (Question 1)

The first model relates the presence/absence of the 36 elements to the binary rating, 0 or 100. Recall from the previous section that the first rating question was a category or Likert scale, whose scale values could be transformed. The transformation loses some of the granular information but allows the researcher to interpret the results. The model emerging from the first rating scale is calculated at the level of the individual respondent, and can be represented by the simple linear equation:

Binary Rating = k0 + k1(A1) + k2(A2) … k36(F6)

The underlying experimental design allows us to estimate the 36 coefficients and the additive constant for each respondent, or to combine all the data from the full set of respondents into a single model, called the grand model. For this study, we focused on the parameters emerging from the grand model.

We begin with the additive constant k0, is the estimate value of the binary rating in the absence of elements. Each of the 48 vignettes comprised either three or four elements from the set of 36, so the additive constant is a purely calculated parameter. Nonetheless, it provides a good estimate of the likely interest in purchasing the mango nectar in the absence of other information. In other words, the additive constant plays the role of a baseline. The additive constant shown in the results (Table 2) comes from the grand model estimated from the pooled set of 48 ratings from each respondent.

To estimate the percent of respondents who would rate a vignette 7–9, we begin with the additive constant, our ‘baseline,’ and add to the values of the coefficients, whether positive or negative. Looking at the column labelled Q1 (question, interest, after binary transformation), we see that the additive constant is 40.29, or 40 for the purposes of discussion. We interpret that to mean that in the absence of any elements, the basic interest in mango nectar is 40, or that 40% the respondents would rate the beverage as 7–9.  It is the elements which must do the work.

Each of the elements has associated with it a coefficient, again with the 36 coefficients shown in Table 2, again estimated from the grand model We interpret the coefficient to be the additive conditional probability of a person saying ‘I’m interested in the mango nectar’ when the element appears in the vignette. Thus, an additive constant of +8 means that when the element is insert into the vignette an additional 8% of the respondents are likely to rate the vignette 7–9. Respondents are not asked to estimate the coefficient. Rather, the coefficient emerges from the pattern of the response.

We present the elements in Table 2 in descending order, without the silos or questions from which the elements arose. The OLS regression does not know about the bookkeeping strategy, but rather treats all 36 elements as statistically independent predictors, which in fact they are.

The two highest scoring elements have nothing to do with the product at all. They are the lowest price (Rs 70 per liter, with a coefficient of 19.31 or 19, and brand Nestle (coefficient = 17). In fact, the two lowest prices, 70, and 95 Rs per liter are among the four highest scoring elements. Furthermore, the remaining elements score low, or even negative, with the lowest scoring elements being higher prices and other brands.

When we look at the results of the regression, we not only want to see the magnitude of the coefficient, but for scientific ‘due diligence,’ we want to ensure that the results we see do not represent an aberration that might readily occur when we deal with small numbers of cases. We compute the t statistic, which can be likened to a measure of signal to noise. High t statistics, and low p values (probabilities of observing this t statistic by chance when the coefficient is really 0) suggest that we are observing a real phenomenon with a coefficient whose value is certainly greater than 0.

Does everyone think about mango nectar in the same way?

One of the premises of the emerging science of Mind Genomics is that for every topic area, there exists a group of different ways of looking at the topic. Thus, for our specific study on mango nectar, we may discover that there are different minds of people, minds which focus on completely or partly different aspects of the same product as the product is communicated through the vignette.  These mind-sets are not really different types of people as much as they are different ways of looking at a topic. Each person is likely to fall into one of these mind-sets.

The mind-sets can be discovered by running the study as we have done, with a reasonable number of people. We are interested in ideas which ‘move together,’ with the people in the study comprising the ‘protoplasm which contains the brain which does the thinking.’ The latter is another way of saying that we are not so much interested in people as in sets of ideas, which people hold.

To uncover mind-sets we do cluster analysis on the ratings, after the ratings have been transformed to the binary scale, so that ratings of 1–6 transform to 0, and ratings of 7–9 transform to 100. The cluster analysis, so-called k-means clustering, considers the pattern of 36 coefficients from each of the respondents. The analysis computes the following ‘distance’ between each pair of respondents, based upon their 36 coefficients:  Distance = (1-Pearson R). The Pearson R, the correlation coefficient, shows how linearly related are two sets of numbers, which we translate to how similar is the pattern of coefficients from every pair of respondents. The distance starts from a low of 0 when the Pearson R or correlation is 1.0, which means that the two patterns are perfectly related. The distance starts from a high of 2 when the Pearson R is -1, which means that the two patterns are perfect inversely related.

Clustering programs are sets of mathematical routines which divide the people based upon the pattern of their coefficients (without the additive constant.) The clustering method does not ‘understand’ the meaning of the clusters, nor even whether the clustering seems natural or whether the cluster comprises elements seemingly thrown together randomly.

Clustering properly done requires the intervention of a human being for interpretation. The ideal for a cluster solution is that there should be as few clusters as possible. One cluster, of course, is best. The second criterion is that the cluster makes intuitive sense. Such intuitive sense is gauged by the degree to which the clusters tell a story. That is, when we look at the strongest performing elements in a cluster, do these elements seem to tell a story which ‘hangs together,’ or does the clustering produce clusters seemingly irrational and in correct.

For our mango nectar data, forcing the respondents into the two-cluster solution did not make intuitive sense. There were too many disparate, almost conflicting elements in the cluster, as if the solution, being fixed at two segments tried to do the best possible. The solution is, in fact, the ‘best’ in a mathematical sense, but it makes no intuitive sense. The three-cluster solution, shown in Table 3, makes intuitive sense.

Table 3. Strong performing elements for the three mind-set clusters.

Mind-Set

3A

3B

3C

Additive constant

32

35

52

Elements which appeal to all mind-sets

,

F1

Nestle

20

14

17

E6

Rs. 70 Per Liter

15

34

11

E5

Rs. 85 Per Liter

11

25

6

Mind-Set 3A – Likes the product in many ways

A3

Tingles your taste buds as you swallow… and for a moment you’ll think you’re out of this world!

10

-3

-2

D4

All natural, not from concentrate, no artificial sweetness

10

-1

1

B3

Sweet fruity aroma that is simply irresistible

10

-1

-4

A2

A delicious nectar that will pick you up when you are tired

10

-1

6

B5

It smells like a fresh tropical fruit exciting your taste-buds

10

5

-2

B2

A delicious and fruity mango aroma…pleasant enough to remind you of a cool summer breeze…strong enough to have you asking for more

9

-3

-1

A1

Enjoy a unique taste of mango juice…sweet with minimal sour taste

9

-1

6

B4

An intense tropical aroma as if you’re holding a real mango

9

-4

-2

C1

Bright, yellow color of this drink is so mouthwatering

8

-1

3

D2

Delicious mango nectar from concentrate, enriched with vitamins A, B, C

8

1

3

D6

Rich in Nutrients, Vitamin A, Vitamins B (B1, B2 and B3), Vitamin C, Calcium, Iron, Phosphorus and Potassium

8

10

1

B1

Energizing, delightful aroma…as if you just entered the gardens of heaven

8

-3

-2

A5

Sweet & heavenly blend of mango pulp sensuously melting in your mouth

8

-4

1

Mind-Set 3B – Strong emphasis on nutrition, and likes natural pulp

D6

Rich in Nutrients, Vitamin A, Vitamins B (B1, B2 and B3), Vitamin C, Calcium, Iron, Phosphorus and Potassium

8

10

1

D1

Contains natural mango pulp

7

8

-6

Mind-Set 3C – Nothing

Based upon the highest scoring elements in Table 3, we can label the mind-sets as follows:

All three mind-sets like the lowest price of Rs 70 per liter, and like the brand name Nestle. These two elements are not relevant for mind-set segmentation.  We can also include the second lowest price, Rs 85 per liter.  We begin the analysis of the mind-sets after excluding those three strong performing elements.

Mind-Set 3A and Mind-Set 3B begin with a low additive constant, in the low to mid 30’s. The low additive constant suggests that the acceptance must be driven by the description of the product. As we shall see, only Mind-Set 3A is our potential target.

Mind-Set 3A – Likes the product in many ways. This mind-set strongly responds to the different sensory aspects of mango nectar.  Although Mind-Set 3A starts off with a low additive constant of 32, many elements appeal to them, with the potential of converting them to a customer interested in mango nectar.

Mind-Set 3B – Only likes strong nutrition and the mention of natural mango pulp. This group may be folded into Mind-Set 3A, although they are indifferent to the sensory properties

Mind-Set 3C – Although they like the product, they really don’t care very much

The mind-set segmentation suggests that we might fold together Mind-Sets 3A and 3B into one mind-set. The mind-sets might be labelled

3A – Interested in the sensory and health properties of the mango nectar,

3BC – Not the target.

Finding these mind sets in the population

Our first question is of a strategic nature.  Which mind sets should be the target for any future efforts? Certainly, we want to find individuals in Mind-Set 3A. They strongly respond to the product features and descriptions. We don’t really care about individuals in Mind-Set 3C, because they are only interested in a low price. Finally, we probably don’t care about individuals in Mind-Set 3B, because the only thing which appeals to them is mango pulp. Interesting, author Moskowitz was involved with just such a mind-set segment in the 1990’s, but one responding to the pulp of oranges in orange juice [11]. That product effort eventuated in Tropicana brand Grovestand Orange Juice®.

An alternative way develops a PVI, a personal viewpoint identifier (Gere, reference.)  The PVI identifies the elements which most simply differentiate among the mind sets, in our case Mind-Set 3A and the combination of Mind-Sets 3B and 3C, respectively. We end up with two mind sets, and the PVI shown in Figure 2.

Mind Genomics-014 NRFSJ Journal_F2

Figure 2. The PVI, personal viewpoint identifier and three feedback screens, one for each mind set to which a person might be assigned.

Modeling the linkage between the elements and the substitutions

The second rating question is not really what we would call a scale with numerical values, but a so-called nominal scale. The five numbers have nothing to do with intensity or order of magnitude but are simply placeholders. When answering the second answer, the respondent simply chose which of the five beverages would be replaced by the mango nectar described in the vignette. Marketers often use this question to see where the new product may possible ‘source its usage.’ That is, marketers often below that the new product will grow in part by ‘stealing away’ the users of other products. Mind Genomics provides the marketer with an opportunity determine the pattern of such ‘stealing’ (or product switching, in more nuanced marketing parlance.)

If we simply look at the frequency of times that a respondent feels that the vignette will replace one of five drinks, we get a sense from Table 4 that the new mango nectar is thought to substitute for both carbonated soft drinks and for other juices (besides mango.) On the other hand, we do not know the linkage between the specific elements of mango nectar that can be used to ‘attack’ the so-called franchise of a target, such as the users of carbonated soft drinks, versus the uses of lassi. We will use regression analysis to uncover that linkage.

Table 4. Frequency table showing the frequency of times the mango nectar will substitute for each of five beverages.

Substitute

Frequency of selection across all respondents and vignettes

Percent

Carbonated soft drink

2243

32%

Juice – other than mango

2667

38%

Mineral water

731

11%

Lassi

679

10%

Milk

640

9%

Total

6960

100%

Linking the elements to the substitutions

In order to link the elements to the selection of a substitution, we must prepare the data to be analyzed by OLS regression, just as we did for the first rating question, interest.  That, is, the five scale points by themselves do not mean anything for the substitution. Each scale point is simply a placeholder.

To prepare the data, we create five new dependent variables, one dependent variable for each substitution. That is, fruit juice becomes a variable; carbonated SD becomes a variable, and so forth. With five substitutions we create five new independent variables.

At the outset, each of the five newly-created dependent variables is assigned the value of 0 and a small random number, around 10–5. This is the same strategy that we did before. Then, for each vignette, we identify the substitution that is selected, and for the corresponding dependent variable we recode the 0 as 100, and the remaining four, unselected substitutions remain with the recoded ‘0.’

Our data are now ready for analysis by OLS regression. We run five regression analyses, one for each dependent variable. We do not estimate the additive constant, the rationale being that in the absence of elements one does not know the beverage to be replaced by the mango nectar.

The results of the five regressions appear in Table 5. The order of the five beverages to be replaced by mango nectar has changed, with the most popular beverage in line for replacement, fruit juice, first, and the least popular beverage in line for replacement, mineral water, last. We divide the table into two main sections. The first section shows those elements strongly linked with a replacement of fruit juice. The second section shows elements strongly linked with a replacement of carbonated SD. There is one element at the bottom linking with the replacement of milk.

Mind-sets based on the product for which mango nectar would substitute

Each respondent was given 48 opportunities to select a beverage that would be substituted by mango nectar. We can compute the percent of times a each of the five beverages would be substituted. That pattern suggests that mango nectar would substitute most frequently for fruit juice, and for carbonated SD (carbonated soft drink).

Individuals differ, however, and it may well be that the design of the mango nectar product, and its price (as well as brand) might be a function of that beverage that the individual respondent would most likely choose as the one being substituted.  To identify these mind-sets, i.e., people choosing different patterns of substitution, we created a single vector of five numbers for each respondent, showing the number of times out of 48, that that respondent would substitute mango nectar for fruit juice, carbonated so, milk, lassi and mineral water, respectively.  We then clustered our 145 respondents into three groups, showing clearly different substitution patterns.

Our results from the clustering appear in Table 6 for the three mind—sets, defined by the key beverage to be replaced by mango nectar. The only elements which appear in each table are those which show a linkage with the substituted beverage of +15 or higher (strong likelihood of replacing the beverage), and an interest value of +5 or higher (drives interest in mango nectar.)

Table 6 shows clearly the differences by mind-set among the candidate descriptive elements of mango nectar. Thus, for purposes of marketing, the opportunity is not only defined by the product, but also by the nature of the product for which mango nectar will substitute.  This approach of looking at the product features, defined by the respondent mind-set, comprises the key scientific and business advantage of Mind Genomics to understand both the product and the person, at a deeper level. For example, we see that when we deal with those who feel that they would replace lassi, we deal with people who focus much more on the product features, whereas when we deal with those who would replace fruit juice or carbonated soft drinks, we have people who do not focus very much on the product features.

Table 5. Linkage between each attribute and the beverage that is likely to replace. Look for strong linkages of 10 or more, and slightly weaker linkages of 8–10. Linkages below 8 are irrelevant, at least based upon the results from the total panel

Fruit Juice

Carb SD

Lassi

Milk

Min Wat

Elements driving replacement of fruit juice

F1

Nestle

17

4

1

2

2

B5

It smells like a fresh tropical fruit exciting your taste-buds

13

8

2

2

3

E1

Rs. 145 Per Liter

13

7

2

2

2

F5

Shezan

13

7

2

3

3

A1

Enjoy a unique taste of mango juice…sweet with minimal sour taste

12

7

4

2

4

A5

Sweet & heavenly blend of mango pulp sensuously melting in your mouth

12

5

5

2

4

B3

Sweet fruity aroma that is simply irresistible

12

7

3

3

2

B6

You can never mix-up this distinctive rich, sweet smell with anything else

12

7

2

2

4

C6

Made from ripe mangoes, which makes its color intensely tempting

12

6

4

1

3

F2

Olfrute

12

8

2

4

2

F3

All Pure

12

9

2

2

3

A3

Tingles your taste buds as you swallow… and for a moment you’ll think you’re out of this world!

11

8

4

3

3

A4

A perfect balance…sweetness of honey and tanginess of an orange

11

8

3

2

4

E2

Rs. 130 Per Liter

11

11

1

2

0

F6

Benz

11

8

3

2

3

A6

Smooth and thick…leaves a wonderfully lingering aftertaste

10

8

1

4

3

D4

All natural, not from concentrate, no artificial sweetness

10

9

4

1

2

E3

Rs. 115 Per Liter

10

9

2

0

2

E4

Rs. 100 Per Liter

10

10

1

3

1

Elements driving replacement of carbonated SD

E6

Rs. 70 Per Liter

8

13

2

0

2

D1

Contains natural mango pulp

9

11

3

0

2

F4

Nurpur

6

11

4

3

3

C3

Light yellow soft & soothing color

9

10

3

2

3

C4

Deep golden colors of the king of fruits

9

10

2

1

4

E5

Rs. 85 Per Liter

9

10

1

2

2

C2

Orangish-yellow color is very energizing

8

10

3

3

2

D3

Mango Nectar: 30% juice, no saturated fat, trans fat or cholesterol

8

10

3

1

3

D5

Vitamin C, mango pulp, no sugar added

6

10

5

3

3

A2

A delicious nectar that will pick you up when you are tired

9

9

3

2

4

B2

A delicious and fruity mango aroma…pleasant enough to remind you of a cool summer breeze…strong enough to have you asking for more

9

9

2

3

4

D2

Delicious mango nectar from concentrate, enriched with vitamins A, B, C

7

9

2

5

2

B1

Energizing, delightful aroma…as if you just entered the gardens of heaven

9

8

3

3

3

B4

An intense tropical aroma as if you’re holding a real mango

9

8

4

2

3

C1

Bright, yellow color of this drink is so mouthwatering

8

8

3

4

4

C5

Dark golden color of sun-kissed mangoes

8

8

4

3

3

Elements driving replacement of milk

D6

Rich in Nutrients, Vitamin A, Vitamins B (B1, B2 and B3), Vitamin C, Calcium, Iron, Phosphorus and Potassium

8

5

1

8

3

Table 6. Candidate elements which drive replacement of a target beverage, and the interest in the elements. The table divides into three parts, based upon the three mind-set segments, defined by the pattern of the beverages they feel mango nectar would replace.

Mind-Set 1- Replaces fruit juice (n=73)

Int

Fruit Juice

Carb SD

Milk

Lassi

Min Wat

Additive constant for interest

49

NA

NA

NA

NA

NA

E6

Rs. 70 Per Liter

22

12

11

0

1

0

F1

Nestle

20

26

1

1

1

-1

E5

Rs. 85 Per Liter

14

15

6

2

1

0

E4

Rs. 100 Per Liter

8

16

7

2

1

-1

A2

A delicious nectar that will pick you up when you are tired

4

17

6

0

2

4

F2

Olfrute

3

21

4

1

2

0

C1

Bright, yellow color of this drink is so mouthwatering

3

13

5

4

2

3

B5

It smells like a fresh tropical fruit exciting your taste-buds

2

20

3

3

0

1

A1

Enjoy a unique taste of mango juice…sweet with minimal sour taste

2

19

5

1

2

2

Mind-Set 2: Replaces Carbonated SD (N = 57)

Carb SD

Min Wat

Fruit Juice

Milk

Lassi

Additive constant for interest

30

E6

Rs. 70 Per Liter

21

18

5

5

-3

-1

E5

Rs. 85 Per Liter

16

17

5

3

-1

0

D4

All natural, not from concentrate, no artificial sweetness

7

18

5

2

0

2

D1

Contains natural mango pulp

7

17

4

1

0

2

A6

Smooth and thick…leaves a wonderfully lingering aftertaste

5

16

5

3

3

-1

Mind-Set: 3 Replaces Lassi  (N15)

Lassi

Milk

Carb SD

Fruit Juice

Min Wat

Additive constant for interest

40

D2

Delicious mango nectar from concentrate, enriched with vitamins A, B, C

16

18

5

1

1

3

D6

Rich in Nutrients, Vitamin A, Vitamins B (B1, B2 and B3), Vitamin C, Calcium, Iron, Phosphorus and Potassium

14

17

8

4

1

-1

D1

Contains natural mango pulp

11

21

-2

3

4

4

D5

Vitamin C, mango pulp, no sugar added

10

27

-1

4

-4

1

D4

All natural, not from concentrate, no artificial sweetness

6

21

4

-2

5

-1

A2

A delicious nectar that will pick you up when you are tired

6

16

11

3

-4

1

C2

Orangish-yellow color is very energizing

5

18

4

-5

2

4

Replace fruit juice:

A delicious nectar that will pick you up when you are tired  (note – not really a product feature)

Bright, yellow color of this drink is so mouthwatering

Replace carbonated soft drink:

All natural, not from concentrate, no artificial sweetness

Contains natural mango pulp

Smooth and thick…leaves a wonderfully lingering aftertaste

Replace lassi:

Delicious mango nectar from concentrate, enriched with vitamins A, B, C

Rich in Nutrients, Vitamin A, Vitamins B (B1, B2 and B3), Vitamin C, Calcium, Iron, Phosphorus and Potassium

Contains natural mango pulp

Vitamin C, mango pulp, no sugar added

All natural, not from concentrate, no artificial sweetness

A delicious nectar that will pick you up when you are tired (note – not really a product feature)

Orangish-yellow color is very energizing

Discussion and conclusions

Understanding what to say about a beverage is important both in science and in commerce. The scientific understanding about communication gives the researcher a sense of how people in a given country respond to different ‘ideas’ about a beverage. There may be dramatically different groups of people, some responding to the sensory properties of the product, another group responding to the messages about nutrition, and a third group responding to brand and/or price.   This finding suggests that the consumer is responsive to the different product features. Our study of mind-sets involving mango nectar suggest that the difference is much simpler. All mind-sets like low price and brand Nestle. Only one mind-set of the three responds to messages about the product, however.  The reason for differences among products in terms of the nature of the messages to which one responds represents an entirely new area of investigation of the human mind, and human cultural differences.

From the point of view of business, knowing what to feature in a product guides the product developer in terms of what to create as a beverage (e.g., a product with pulp), as well as what to communicate in advertising. Furthermore, the sensitivity of respondents to price, or in our case the apparent lack of dramatic sensitivity, gives the marketer guidance about how the respondent is expected to respond to price information about the product.

Acknowledgment

Attila Gere thanks the support of the Premium Postdoctoral Researcher Program of the Hungarian Academy of Sciences

References

  1. Muralidhar, G, Radhika, P. &  Bhave, M.H.V., 2012. Efficiency of Marketing Channels for Mango in Mahabubnagar District of Andhra Pradesh. IUP Journal of Management Research, 11(2).
  2. Shukla, R., Chaudhari, B., Joshi, G., Leua, A.K. & Thakkar, R.G., 2014. An analysis of marketing mix of various mango pulp brands in South Gujarat. Asian J. Dairy & Food Res, 33, 209–214.
  3. Avena, R.J. & Luh, B.S., 1983. Sweetened mango purees preserved by canning and freezing. Journal of food Science, 48,406–410.
  4. Kalra, S.K. and Tandon, D.K., 1995. Mango. In Handbook of Fruit Science and Technology, 139–186). CRC Press.
  5. Maneenpun, S. & Yunchalad, M., 2002, Developing processed mango products for international markets. In VII International Mango Symposium, 93–105.
  6. Moskowitz, H.R., Gofman, A., Beckley, J. & Ashman, H., 2006. Founding a new science: Mind genomics. Journal of sensory studies, 21, 266–307.
  7. Moskowitz, H.R. & Gofman, A., 2007. Selling blue elephants: How to make great products that people want before they even know they want them. Pearson Education.
  8. Green, P.E., Krieger, A.M. & Wind, Y., 2001. Thirty years of conjoint analysis: Reflections and prospects. Interfaces, 31(3_supplement), S56-S73.
  9. Gofman, A. and Moskowitz, H., 2010. Isomorphic permuted experimental designs and their application in conjoint analysis. Journal of Sensory Studies, 25, 127–145.
  10. Kahneman, D. & Egan, P., 2011. Thinking, fast and slow. New York: Farrar, Straus and Giroux.
  11. Moskowitz, H. & Kieger, B., 1998. International product optimization: a case history. Food Quality and Preference, 9, 443–454.
  12. Cadena, R.S. & Bolini, H.M.A., 2012. Ideal and relative sweetness of high intensity sweeteners in mango nectar. International Journal of Food Science & Technology, 47, 991–996.

Optimizing Consumer Involvement in Cosmetics at Point of Purchase: A Mind Genomics Exploration

DOI: 10.31038/AWHC.2019223

Abstract

We present a novel approach to understand what women want when they go to a high-end store to buy beauty products. We embed a survey into an experiment, presenting systematically varied vignettes about shopping for beauty products. Different messages are combined in a systematic way, with the respondent required to assign a rating to the entire combination. A deconstruction of the responses to the contribution of elements reveals different points of view held by those who respond. These four segments are Focus on self-confidence; Focus on the product/expert; Focus on the experience; and Focus on nothing specific. These four mind-sets can be identified by a short interaction with the salesperson, or with a computer tablet, smartphone, and appropriate, sales-driving message given to the shopper.

Introduction

During the past two or three decades a swell of interest in the shopping experienced has swept over the world of consumer package goods. Whereas in the 1960’s to 1980’s it sufficed to know what consumers liked and wanted to hear, and what packages would appeal to them, attention in the late 1980’s and onwards has turned to the experience of shopping. By experience we do not mean just the perception of packages on the shelf, but rather on the experience, such as the interaction of the shopper with the store, and with the people who work there.

Our focus here is the experience of the department store, and specifically the make-up counter found in high end department stores where specialists, individuals paid by the cosmetics manufacturers, sell their expensive make-up products to women shoppers. One need simply visit any high-end department store around the world to see these make up professionals competing for the shopper’s attention, often gifts, expertise, or just an easy way to purchase.

The question motivating this research was quite simple. It was ‘just what does it take to make a shopper interested in purchasing from a specific vendor, with a stand at the store?’  In more concrete terms, what does the shopper want, and what specifically must one say to the shopper to drive purchase at the vendor’s stand.

The approach is this study is motivated by the emerging science of Mind Genomics, focusing on the relation between messaging given to consumers/customers, and choice. The objective of Mind Genomics is to uncover the persona of an individual for a given experience, such as shopping for cosmetics. Often the unspoken hope is that somehow by minding terabytes of purchase data, one might figure out exactly what to say to a specific individual about a specific product.  The result is an explosion of methods using pattern recognition and artificial but rarely the simple prescription of what exactly to say to a specific person who presents herself at the cosmetic counter and will only 30 seconds of her time before moving on.

By uncovering the mind-set of a shopper at the time of shopping in the store, the salesperson or company representative can use the proper language to drive interest and a sale. In a sense, Mind Genomics identifies the mind-set of a shopper for a topic, and prescribes what to say, following the way an experienced salesperson ‘sizes up’ a customer and knows what are the word which might sway the customer.

Mind Genomics is based upon the approach in mathematical known as Conjoint Measurement [1,2] and Information Integration Theory [3]. Many of the traditional uses have been methodological in nature, showing the power and application of new variations of the technique.  It is only in the past three decades that conjoint measurement, in the form of Mind Genomics has been used to create banks of knowledge, rather than one-off exercises in method. Mind Genomics has been used for more than three decades in the consumer products world [4–6], as well as finding use in the world of health to communicate the right messages with patients [7], along with efforts in car sales and insurance sales (unpublished data from author HRM.)  The application of Mind Genomics is thus appropriate.

The objective of this study is to determine whether a woman accustomed to shopping in a high-end store for cosmetics could be understood in terms of the messages to which she respondents, and whether, in fact, is there more than just one mind-set for shoppers. Discovering a shopper’s mind-set in almost an instantaneous way (15–30 seconds) might well help to increase the sales. Furthermore, the interaction would go a long way towards removing the fear of being ‘followed’ on the web through cookies, and having intrusive advertising pushed as one traverses the internet, either for shopping or for information.

In today’s world, where information is overflowing, there is no dearth of information about a person. There is, however, a massive lack of actionable data for specific situations encountered every day. Moreover, there is an absence of methods which quickly ‘understand’ the mind of a consumer in virtually any area, methods based on experimentation.  Mind Genomics provides one way to generate that data. The ingoing premise of Mind Genomics is that for virtually any situation that can be dimensionalized, one can uncover the relevant personas or mind-sets which co-exist in a population of consumers, mind-sets. One needs to do small experiments to uncover these mind-sets. These mind-sets cannot easily, readily, quickly and inexpensively be uncovered simply by KNOWING WHO A PERSON IS.  That is, KNOWING WHAT A PERSON THINKS is different, and often elusive, not easily captured by today’s technologies such as Big Data.  The research, in spirit, is based in part on the breakthrough ideas of Nobelist Daniel Kahneman, who talked about the two modes of thinking, the rational thought, System 2, and the more typical mode in shopping, System 1, where impulse leads [8].

Method

Mind Genomics begins by identifying the topic, then asking a set of questions, and for each question providing a set of six answers. For this case of Mind Genomics, we proceed with the creation of six questions, each of which is given six answers. The questions and answers are shown in Table 1. There are no fixed questions and answer, but there is the stipulation that the questions should ‘tell a story,’ in the same way that a reporter uses the ‘what, how, where, why, and who’ to tell a story. The questions are never shown to the respondents, but only used to develop answers. It is the answers or really the systematic combination of answers that are shown to the respondent.

Table 1. The questions (silos) and answers (elements) for the cosmetic shopper study.

Question A: Why do you shop for cosmetics?

A1

I want perfect skin

A2

I have combination skin

A3

My skin is needy

A4

My skin is unpredictable, always changing

A5

For me it’s about staying sexy

Question B: What do you do, or want to achieve, when you put on cosmetics?

B1

I always put make-up on before I go out

B2

I always want to look like ME, not a made-up version of me

B3

I totally believe in inner beauty!

B4

I believe my face and body are a medium for self-expression

B5

I need a make-up that taps into my flirty and sensual side

Question C: How do you want to look, or feel when you put on makeup?

C1

I like a glamorous make-up look

C2

My style can be described as conservative

C3

At the beauty counter, at first, I’m usually a little bit shy and stay to myself

C4

At the beauty counter, I can appear rushed, mistrusting, non-committal

C5

My style… revealing, sexy, with bare, nude, natural make-up

Question D: How do feel about new products that you see in the store?

D1

I like products that make me feel confident about myself

D2

When buying a new skincare product… I find it hard to trust the skin-care consultants

D3

At times I feel too nervous to ask questions from beauty consultants

D4

I can feel bored and lose interest quickly… unless some product captures my imagination

D5

I’m a more visual shopper… I love touching, smelling and seeing all the products

Question E: How do you feel when you shop and have a  beauty consultant at the store?

E1

My challenge is finding the perfect skincare product

E2

I ask a lot of questions to get all the product details… even though I’ve done my own research

E3

I want the beauty consultant to hold my hand, and show me exactly how to use the products

E4

I am someone who loves to customize make-up in her own unique way

E5

I like brightness, colors, fragrance, soft music; variety… I only go into beauty stores that exude those qualities

Question F:  What would you like beauty consultant to know about you  so that she can help?

F1

I need the beauty consultant to show me the ultimate, top of the line skin-care range… everything else is a waste of my time

F2

I want the beauty consultant to use an educational approach, using facts, to support their claims

F3

I want a “Go To” consultant who knows me intuitively, and can make my experience more personal each time I return

F4

In an ideal world I’d be left completely alone to look at, touch and try things, before I am helped

F5

When I am purchasing makeup, skincare products or fragrances, I like the staff to be playful, spontaneous and funny

Question G: Describe your ultimate skincare shopping experience in one word

G1

My ultimate skincare shopping experience is pleasurable

G2

My ultimate skincare shopping experience is informative

G3

My ultimate skincare shopping experience is glamorizing

G4

My ultimate skincare shopping experience is therapeutic

G5

My ultimate skincare shopping experience is transformative

As Table 1 shows, the questions and answers do not rigidly fit into a framework. The real reason for the format is ‘bookkeeping.’ When two answers or elements are put into the same silo or answer the same question, they never will appear together in a vignette. The bookkeeping system is totally transparent to the analysis, which ends up looking at the 35 answers or elements as completely independent ideas.

Mind Genomics combines the answers in Table 1 into short, easy-to-read vignettes, using an experimental design [9,10]. The experimental design stipulates the specific combinations to be tested. Each respondent evaluated 63 unique combinations, the vignettes. The design is structured as follows:

  1. Each question contributes an answer from its five answers 30 times in the 63 vignettes, and absent from 33 vignettes.
  2. Each answer appears 6 times in the 63 vignettes, and absent from 57 vignettes.
  3. The vignettes are of unequal sizes. The underlying experimental design calls for 31 vignettes comprising four answers, 22 vignettes three answers, and 10 vignettes comprising two answers.
  4. Each respondent evaluated a unique set of combinations. That is, the experimental design was fixed mathematically, ensuring that all 35 answers or elements were statistically independent of each other. However, each of the 251 respondents evaluated a unique set of 63 vignettes, enabling the experimental design to cover a great deal of the so-called design space of possible combinations.

Running the Study

The 251 respondents who participated were selected to be beauty product shoppers. The study used a commercial e-panel provider, specializing in these types of on-line studies. The respondents had already signed up to participate in various studies and were incentivized by the panel company. No one from the researcher group ‘knew’ the identity of the panelists, who could only be identified by their answers, and by an extensive, self-profiling questionnaire administered AFTER the evaluation of the 63 test vignettes.

Figure 1 shows the orientation page. The page provides very little data about the purpose of the study, and the nature of the test stimuli. The reason for the paucity of information is that we want the respondent to be free of any expectations, so that the answers reflect her attitudes alone.  The only information of any relevance beyond the topic is the fact that the orientation page reinforces the fact that all vignettes differed from each other. Although this might seem a bit excessive, the reality of the Mind Genomics studies is that the same elements repeat in different vignettes. Some respondents are upset, feeling that they have ‘already evaluated that vignette.’ The orientation page dispels that worry.

Figure 2 presents an example of a four-element vignette. No effort is made to connect the rows of text. The objective is not to present a densely worded paragraph containing all the information, but rather to throw the different ideas at the respondent, and let the respondent evaluate the combination. The respondent often does so in an intuitive manner, rather than in a considered, intellectual manner, precisely in the manner desired. The objective of Mind Genomics is to pierce the intellectual veneer and move to the emotionally-driven aspects.

Quite often respondents complain that they feel they are doing this task in a random fashion, and that they are not able to give their full attention to the task. They feel that somehow their answers are random.

In order to test the robustness of our data, we divided the data set into two halves, the data from the first 31 vignettes, and the data from the second 32 vignettes. We ran the regression analyses twice, one for each data set.  Figure 3 shows that the pattern of coefficients (scores, see below for expectation), obtained by analysis of responses to the first 31 vignettes is virtually identical to the pattern of responses to the second 32 vignettes. Furthermore, the coefficients for the 35 elements or answers differ from each other. In other words, the respondents differentiate among the different answers or elements, doing so in a repeatable manner.  Thus, the complaint that ‘it’s impossible to keep track’ may be valid for the respondent who wants to be intellectually consistent in assigning the ratings, but it seems to make little difference. Respondents accurately differentiated among the elements, doing so in a reliable fashion, despite what they ‘say’ or ‘complain.’

Mind Genomics-011-AWHC Journal_F1

Figure 1. The orientation page for the beauty shopper experiment.

Mind Genomics-011-AWHC Journal_F2

Figure 2. An example of a four-element vignette.

Mind Genomics-011-AWHC Journal_F3

Figure 3. Scattergram showing the 35 coefficients estimates from the ratings of vignettes 01 to 31, and from vignettes 32 to 63. The two sets of coefficients are very strongly related to each other, suggesting discrimination across coefficients, and reliability across the first and second halves of the experiment.

What Describes the Cosmetic Shopper?

With 251 respondents participating, each seeing a set of 63 different vignettes, we create a single equation showing how each of the 35 elements, the answers to the questions, ‘drives’ the response.  The analysis proceeds first by transforming the ratings, so that ratings of 1–6 are recoded to 0, and ratings of 7–9 are recoded to 100. To each recoded value we add a small random number (<10–5.) The rationale is that, when we deal with individual respondent data in segmentation and clustering, we want to ensure that across the set of 63 ratings for a given respondent there is a minimal level of variation in the response. Otherwise, for situations where the respondent rates all vignettes between 1 and 6, or rates all vignettes between 7 and 9, respectively, the transformed ratings would be all 0 or 100, respectively, causing the regression analysis to fail.

We use the method of OLS (Ordinary Least-Squares) regression, to relate the presence/absence of the 35 elements or answers to the binary, transformed rating. OLS regression deconstructs the rating into the contribution of each component (answer, element) as well as estimates the likely response for the zero condition, i.e., a vignette with no elements.

Table 2 shows the deconstruction of the vignettes into the contributions of the individual elements.  The deconstruction is made on the full set of 251 (respondents) x 63 (vignettes per respondent), or 15,813 observations.

Table 2. Performance of the 35 elements for the beauty shopping experience. The dependent variable is ‘fits me,’ with 0 = does not fit me, or fits modestly, 100 = fits me)

Beauty Shopper – Total Panel – ‘Describes ME’

Coeff

t

p-Value

Additive Constant

48

26.48

0.00

D1

I like products that make me feel confident about myself

10

7.13

0.00

B2

I always want to look like ME, not a made-up version of me

8

5.54

0.00

A1

I want perfect skin

7

5.18

0.00

D5

I’m a more visual shopper… I love touching, smelling and seeing all the products

7

4.95

0.00

B3

I totally believe in inner beauty!

6

4.36

0.00

E1

My challenge is finding the perfect skincare product

5

3.45

0.00

G1

My ultimate skincare shopping experience is pleasurable

5

3.69

0.00

B4

I believe my face and body are a medium for self-expression

4

3.13

0.00

B1

I always put make-up on before I go out

3

2.30

0.02

B5

I need a make-up that taps into my flirty and sensual side

3

1.98

0.05

E2

I ask a lot of questions to get all the product details… even though I’ve done my own research

3

1.86

0.06

E4

I am someone who loves to customize make-up in her own unique way

3

1.85

0.06

F2

I want the beauty consultant to use an educational approach, using facts, to support their claims

3

2.34

0.02

G2

My ultimate skincare shopping experience is informative

2

1.36

0.17

A2

I have combination skin

1

0.36

0.72

C5

My style… revealing, sexy, with bare, nude, natural make-up

1

0.58

0.57

F3

I want a “Go To” consultant who knows me intuitively, and can make my experience more personal each time I return

1

0.88

0.38

F5

When I am purchasing makeup, skincare products or fragrances, I like the staff to be playful, spontaneous and funny

1

0.74

0.46

E5

I like brightness, colors, fragrance, soft music; variety… I only go into beauty stores that exude those qualities

0

0.11

0.92

G4

My ultimate skincare shopping experience is therapeutic

0

0.13

0.90

F4

In an ideal world I’d be left completely alone to look at, touch and try things, before I am helped

-1

-0.44

0.66

G5

My ultimate skincare shopping experience is transformative

-1

-0.98

0.33

E3

I want the beauty consultant to hold my hand, and show me exactly how to use the products

-2

-1.62

0.11

A5

For me it’s about staying sexy

-3

-1.87

0.06

G3

My ultimate skincare shopping experience is glamorizing

-4

-2.65

0.01

C1

I like a glamorous make-up look

-5

-3.54

0.00

C3

At the beauty counter, at first I’m usually a little bit shy and stay to myself

-5

-3.57

0.00

A3

My skin is needy

-7

-5.05

0.00

A4

My skin is unpredictable, always changing

-7

-4.89

0.00

C2

My style can be described as conservative

-7

-4.81

0.00

D4

I can feel bored and lose interest quickly… unless some product captures my imagination

-7

-4.89

0.00

D2

When buying a new skincare product… I find it hard to trust the skin-care consultants

-9

-6.39

0.00

D3

At times I feel too nervous to ask questions from beauty consultants

-10

-6.83

0.00

C4

At the beauty counter, I can appear rushed, mistrusting, non-committal

-12

-8.31

0.00

F1

I need the beauty consultant to show me the ultimate, top of the line skin-care range… everything else is a waste of my time

-12

-8.22

0.00

  1. The additive constant tells us the proportion or conditional probability of a woman saying that the vignette describes her, even without vignette having any elements. Of course, all vignettes had elements, as prescribed by the underlying experimental design. The additive constant should thus be considered as a baseline. Our additive constant in 48, meaning that we begin with half of the respondent say ‘it describes me;’
  2. We look for high scoring elements. Previous studies suggest that elements with coefficients above 7–8 are meaningful. By meaningful we do not mean statistically significant in the sense of inferential statistics. Rather, by meaningful we mean that the message covaries with relevant external behaviors.
  3. The four strong performing elements appear to tap a variety of wants and descriptions, ranging from confidence (I like products that make me feel confident about myself), to performance (I want perfect skin) to experience (I’m a more visual shopper … I love touching, smelling, and seeing all the products.’)
  4. Surprisingly, the respondents do not feel any warmth towards the beauty consultants, and indeed even feel nervous. These are the elements with high negatives, suggesting that they do not describe the respondent. They suggest warning flags for the beauty counter, and company employing such beauty consultants.

    When buying a new skincare product… I find it hard to trust the skin-care consultants

    At times I feel too nervous to ask questions from beauty consultants

    At the beauty counter, I can appear rushed, mistrusting, non-committal

    I need the beauty consultant to show me the ultimate, top of the line skin-care range… everything else is a waste of my time

  5. The t statistic and the probability values suggest that coefficients beyond +/- 3 are ‘statistically significant.’ They are significant because of the large base size. As noted above, we should focus on elements with a coefficient of +7 or higher as meaningful.

Comparing the strongest elements which drive ‘similar to me’ and which drive ‘different from me’

We can turn our scale around, focusing on the votes of respondents who rated the vignette as being ‘different from me.’  That is, we can recode the scale as 1–3 (most different) as ‘100’, and 4–9 (less different) as ‘0’.   The analytic exercise may seem tautologous, but we want to make sure that we are not dealing with a few positive elements, with the remaining elements settling somewhere in the middle. We may or may not be looking at two types of elements. Table 3 suggests, however, that at least for the total panel, the scale is truly unipolar. Furthermore, and most important from a substantive point of view is the feeling that the interaction with a beauty consultant simply does not describe them.

Table 3. Comparison of elements which are strongest when the scale is looked at from the top down ‘similar to me’ versus when the scale is looked from the bottom up, ‘different from me.’  The results suggest that for the total panel, the scale describes a single continuum, similar to different.


Similar Top 3

Different Bottom 3

Additive constant

48

19

Elements which drive ‘similar to me’

D1

I like products that make me feel confident about myself

10

-6

B2

I always want to look like ME, not a made-up version of me

8

-5

A1

I want perfect skin

7

-4

D5

I’m a more visual shopper… I love touching, smelling and seeing all the products

7

-5

B3

I totally believe in inner beauty!

6

-5

G1

My ultimate skincare shopping experience is pleasurable

5

-4

E1

My challenge is finding the perfect skincare product

5

-3

Element which drive ‘different from me’

D2

When buying a new skincare product… I find it hard to trust the skin-care consultants

-9

5

D3

At times I feel too nervous to ask questions from beauty consultants

-10

8

F1

I need the beauty consultant to show me the ultimate, top of the line skin-care range… everything else is a waste of my time

-12

9

C4

At the beauty counter, I can appear rushed, mistrusting, non-committal

-12

8

What do you say to support a reason for beauty shopping?

When we talk about a reason for shopping, say ‘information,’ are there any elements or answers which become extremely important? We have control over the messaging and decide to look at those messages which synergize with the message ‘My ultimate skincare shopping experience is informative.’  Conversely, when we talk about shopping for pleasure, ‘My ultimate skincare shopping experience is pleasurable’ are the same elements important as we saw when we talked about shopping for information?  In other words, are there synergisms between elements, so that we can produce more powerful communications to attract the shopper?

We can answer this question by sorting our data into seven strata. Each stratum is defined by holding constant one of the reasons in the stratum. That is, we can sort our data into all those vignettes which have ‘I shop for pleasure.’ Every other silo and element, question and answer, varies except the reason, which is ‘My ultimate skincare shopping experience is pleasurable.’  All the vignettes analyzed have this one reason, one element, in common.

When we do this sorting, and then run our OLS regression on all elements as predictors, EXCEPT elements for question G, the reason, which is constant in the vignette, we find some remarkable synergisms.

  1. Some elements perform spectacularly when paired with one description of the ultimate shopping experience yet perform poorly when paired with another description. Consider these two elements, which synergize dramatically with the element ‘My ultimate skin care shopping experience is therapeutic.’ They have coefficients of 22 and 20, respectively, for the total panel.

    I always want to look like ME, not a made-up version of me

    I like products that make me feel confident about myself

    These elements may either score moderately well, or be irrelevant, when paired with another description. They certainly do not score the 22 and 20 that they do when paired with the ultimate experience being therapeutic.

  2. The foregoing approach is called scenario analysis. The data are sorted into strata, based upon the different elements in one silo or question.
  3. We see the strongest performing synergisms in Table 4.  An element or answer can perform moderately, unless paired with an element with which it synergizes.

Table 4. Strongest performing elements for the total panel when the description of the ultimate skincare shopping experience is defined in different ways.

.

Pleasure: My ultimate skincare shopping experience is pleasurable
(Additive Constant = 58)

B3

I totally believe in inner beauty!

7

E4

I am someone who loves to customize make-up in her own unique way

7

Informational: My ultimate skincare shopping experience is informative
 (Additive Constant = 53)

B4

I believe my face and body are a medium for self-expression

14

D1

I like products that make me feel confident about myself

12

B2

I always want to look like ME, not a made-up version of me

11

None
 (Additive Constant = 50)

D1

I like products that make me feel confident about myself

10

Therapeutic: My ultimate skincare shopping experience is therapeutic
 (Additive Constant = 42)

B2

I always want to look like ME, not a made-up version of me

22

D1

I like products that make me feel confident about myself

20

F5

When I am purchasing makeup, skincare products or fragrances, I like the staff to be playful, spontaneous and funny

12

B3

I totally believe in inner beauty!

11

B4

I believe my face and body are a medium for self-expression

10

F2

I want the beauty consultant to use an educational approach, using facts, to support their claims

10

A1

I want perfect skin

8

Transformative: My ultimate skincare shopping experience is transformative
Additive Constant = 40

B3

I totally believe in inner beauty!

15

A1

I want perfect skin

15

D5

I’m a more visual shopper… I love touching, smelling and seeing all the products

11

B5

I need a make-up that taps into my flirty and sensual side

10

Glamorize: My ultimate skincare shopping experience is glamorizing
Additive Constant = 36

E2

I ask a lot of questions to get all the product details… even though I’ve done my own research

13

F5

When I am purchasing makeup, skincare products or fragrances, I like the staff to be playful, spontaneous and funny

12

D1

I like products that make me feel confident about myself

11

B2

I always want to look like ME, not a made-up version of me

11

E4

I am someone who loves to customize make-up in her own unique way

10

The Four Mind-Sets for Beauty Shopping

A key tenet of Mind Genomics is that for any specific, describable experience or topics of thought that can be dimensionalized into aspects, people differ from each other in terms of which of the aspects are important.  These differences are not in the people, but rather differences in sets of ideas which ‘travel together.’  A good analogy of this is basic colors.  Although there are many colors, underneath the myriad of colors that we perceive are three primary colors, red, yellow, and blue respectively. A similar metaphor applies to the many different aspects of a specific topic, such as the shopping experience. Beneath the many different descriptions of a specific type of shopping experience, such as shopping for beauty items, there exist a limited number of basic groups, so-called ‘mind-sets’ in the language of Mind Genomics.

The metaphor of primaries is meant as just that, a metaphor. Nonetheless, by clustering together people based upon the patterns of what they deem to be important (or here, what describes them), we can identify a limited set of different groups of respondents, differing dramatically in what they feel to be important. We are not interested in fine differences, only in large, dramatic differences.

We identify these clusters, called mind-sets, through a simple statistical procedure, clustering. Each of our 251 respondents generates 35 coefficients about importance, showing the degree to which each of the 35 elements drives the binary response emerging from the scale ‘describes me.’ We want to identify two, three, or at most four or so groups differing dramatically from each other in the patterns of elements which describe them.

Our clustering defines the distance between each pair of respondents, using a simple statistic (1-R), where R is the Pearson correlation coefficient. The Pearson R is a measure of the degree to which two sets of measures, our coefficients, co-vary. When R = 1, then the covariation is perfect. Changes in one person’s coefficients exactly track changes in another person’s coefficient. Their distance is 0 (1-R, 1–1 = 0.) They are identical patterns and belong to the same mind set. In contrast, when R=-1, the covariation is opposite. Increases in the value of one person’s coefficient are matches by the same, albeit opposite change, i.e., decrease in the value of the other person’s coefficient. The distance is 2 (1-R, 1- -1 = 2.). They belong in different mind-sets.

Following the foregoing approach, we cluster our 251 respondents, extracting as few clusters or mind-sets as possible (parsimony), while at the same time ensuring that the clusters or mind-sets are interpretable, i.e., ‘tell a story.’

Table 5 shows the four mind-sets for beauty shopping, emerging from the clustering. When we look at the four emergent mind sets from this study we are struck by several findings:

Table 5. Strongest performing elements for four mind-sets for the shopping experience.

Mind Set

A

D

C

B

Base Size

79

72

51

49

Additive Constant

83

67

37

-20

Mind Set A – About self confidence

I like products that make me feel confident about myself

9

0

14

22

Mind Set D – Focused on the product and the expert

I want perfect skin

-12

14

20

15

I want a “Go To” consultant who knows me intuitively, and can make my experience more personal each time I return

-8

12

-8

16

I ask a lot of questions to get all the product details… even though I’ve done my own research

-13

11

-20

28

Mind Set D – No really interested in shopping at all , but wants to be sexy

I have combination skin

-24

-2

22

10

I want perfect skin

-12

14

20

15

My skin is needy

-31

-8

20

-5

My skin is unpredictable, always changing

-34

-4

17

-1

For me it’s about staying sexy

-25

1

17

2

My style… revealing, sexy, with bare, nude, natural make-up

-1

-15

14

14

I like products that make me feel confident about myself

9

0

14

22

Mind Set B – It’s all about the different aspects of the experience, and not basic interest .. can be very excited with the right message

I want the beauty consultant to use an educational approach, using facts, to support their claims

-2

3

-1

29

My ultimate skincare shopping experience is pleasurable

-2

-1

-7

29

I ask a lot of questions to get all the product details… even though I’ve done my own research

-13

11

-20

28

I am someone who loves to customize make-up in her own unique way

-15

9

-7

28

My challenge is finding the perfect skincare product

-12

8

-8

28

I totally believe in inner beauty!

6

1

8

25

I always want to look like ME, not a made-up version of me

7

0

11

25

My ultimate skincare shopping experience is therapeutic

-5

-7

-17

25

My ultimate skincare shopping experience is informative

-4

-6

-15

24

My ultimate skincare shopping experience is transformative

-6

-10

-18

24

I need a make up that taps into my flirty and sensual side

-4

-3

1

24

I like products that make me feel confident about myself

9

0

14

22

I’m a more visual shopper… I love touching, smelling and seeing all the products

3

3

8

21

I believe my face and body are a medium for self-expression

4

-2

4

20

I always put make-up on before I go out

1

1

2

20

I want the beauty consultant to hold my hand, and show me exactly how to use the products

-20

7

-21

20

I like brightness, colors, fragrance, soft music; variety… I only go into beauty stores that exude those qualities

-18

6

-17

19

At the beauty counter, at first I’m usually a little bit shy and stay to myself

-8

-23

8

19

When I am purchasing makeup, skincare products or fragrances, I like the staff to be playful, spontaneous and funny

-5

3

-9

19

  1. The mind sets are significantly but not equally sized. There are no two large and two tiny mind-sets, but rather four substantially-sized mind-sets.
  2. The larger mind-sets (A, D) show high additive constants, meaning that they are basically interested in shopping. The elements add a moderate amount. There are only a few of these elements, of a more focused nature.
  3. The smaller mind-sets (C, B) show much lower constants, meaning that the respondents in these mind-sets are only moderately or not interested in shopping, unless there are specific elements which describe the experience. Fortunately, there are a fair number of important elements for Mind Set C, and many stronger performing elements for Mind Set B.
  4. We can give names to the mind-sets, based upon the strongest performing elements, but these mind-sets tend not to be unidimensional, except perhaps Mind Set A.
  5. The clustering generating fewer numbers of mind-sets (two and three) mind-sets are almost impossible to understand. By the time we get to four mind-sets, the data start to tell to tell a clearer story. That is, the strongest performing elements come from a variety of different topics and questions.
  6. We could create an even deeper segmentation, with many more segments, but then we are violating the spirit of segmentation by sacrificing parsimony to interpretability and simplicity

Finding these Mind-Sets in the Population

When we began this study, we assumed that the recruitment of women who regularly shop for cosmetics in high-end department stores would generate a reasonably homogeneous group of women in terms of their attitudes towards cosmetics, although varying in age, income, residence, education, and so forth. What emerged as most surprising is the radical differences among the respondents in terms of the kinds of messages to which they responded. There was no simple co-variation between WHO THE RESPONDENTS ARE and TO WHAT THE RESPONDENT REACTS POSITIVELY. That is, the conventional methods of segmentation would say that these respondents would be more similar in their mind-sets than the experiment revealed them to be. Most of the reported literature talked about behavior, but not about specific words [11].

The nature of the mind-sets revealed in this and other Mind Genomics experiments suggest that it will be impossible to assign new people to mind-sets based upon general behavior.  The assignment can only be very approximate because each situation comprises aspects unique to it, aspects that could never be captured by any sort of detailed knowledge other than detailed knowledge of the topic alone.  In other words, one of the emerging findings of Mind Genomics is that there exist these mind-sets, but the mind-sets are intimately related to the nature of the experience itself, and the language used to describe it, as well, of course, the proclivities of the respondent.

Another way to find these mind-sets in the population works with the very elements, the very language used to establish the mind-sets in the first place. The approach uses the data from the mind-sets, looking for the elements or phrases which best differentiate between two mind-sets, or among three mind-sets.

Figure 4, left panel, shows the six question ‘PVI,’ the personal-viewpoint identifier. The patterns of responses to the six questions drive the assignment of the respondent to one of the three mind-sets. In turn, the right panel of Figure 4 shows the of feedback screens emerging when the respondent completes the ratings to the six questions. Each respondent or each salesperson receives the appropriate information. For the respondent the feedback is ‘fun,’ because it’s ‘ABOUT ME.’ For the salesperson the feedback is important because in a very short time the salesperson gets a sense of what to say to this person to improve the likelihood of a positive and productive interaction. In the evolving world of digital commerce, the customer presented with this type of questionnaire, either at the point or earlier, can be ‘tagged’ so that when the customer appears as a shopper, the customer can be sent to the correct website, one particularized to the mind-set.  This individualization is NOT based upon the increasingly frowned-upon method of tracking a respondent, but rather asking the respondent to participate in helping the sales process.

Mind Genomics-011-AWHC Journal_F4

Figure 4. The PVI, personal viewpoint identifier, constructed for this particular project. The link to the website as of this writing (2019) is: http://162.243.165.37:3838/TT16/

Discussion and Conclusion

The academic literature in marketing has presented the business community with a variety of methods by which to increase sales. It is now well recognized that the traditional ways of dividing people, by WHO THEY ARE, are insufficient. Methods used to assign respondents to like-minded groups may work better. These groups are so-called psychographic segments. The weakness is that these segments are too general, created from large-scale studies, combined when necessary, with behavioral observation.

There are problems with the traditional methods, problems which are insuperable given the myriad of products and services that one can offer. One insuperable problem is that the psychographic analysis is simply too general, talking about general lifestyles. Even Claritas’ segmentation into more than five dozen segments is not granular enough, as well as defying application in ‘real time’ [12]. The second insuperable problem is that observation is only on behavior, not on thinking. Finally, the most insuperable problem of all, the most important, is that even with successful segmentation through attitudes, lifestyles and behavior, one rarely knows the PRECISE WORDS which appeal to a given individual for a given issue at a given moment.  Mind Genomics, whether applied to things or experiences, or even ideas such as ‘justice’ and ‘ethics’ holds the promise of providing that actionable, database insight which can also become the raw material for a new science of the mind [13,14].

Acknowledgment

Attila Gere thanks the support of the Premium Postdoctoral Researcher Program of the Hungarian Academy of Sciences.

References

  1. Green PE, Rao VR (1971) Conjoint measurement for quantifying judgmental data. Journal of marketing research 8: 355–363.
  2. Green PE, Srinivasan V (1990) Conjoint analysis in marketing: new developments with implications for research and practice. The journal of marketing 54: 3–19.
  3. Anderson NH (1981) Information integration theory. Academic Press.
  4. Gere A, Shelke K, Batalvi B, Zemel R, Sciacca A, et al. (2019) Messaging Food and Inner Beauty Together… an Experiment in Cognitive Economics 2: 1–14.
  5. Gere A, Zemel R, Papajorgji P, Sciacca A, Kaminskaia J, et al. (2018) Customer Requirements for Natural Food Stores – The Mind of the Shopper. Nutrition Research and Food Science Journal 1: 1–12.
  6. Zemel R, Gere A, Papajorgji P, Zemel G, Moskowitz HR (2018) Uncovering Consumer Mindsets Regarding Raw Beverages, Food and Nutrition Sciences Pub. Date: March 30, 2018.
  7. Gabay G, Zemel G, Gere A, Zemel R, Papajorgji P, et al. (2018) On the Threshold: What Concerns Healthy People about the Prospect of Cancer? Cancer Studies and Therapeutics Journal 3: 1–10.
  8. Kahneman D, Egan P (2011) Thinking, fast and slow. New York: Farrar, Straus and Giroux.
  9. Leardi R (2009) Experimental design in chemistry: A tutorial. Anal Chim Acta 652: 161–172. [crossref]
  10. Moskowitz H, Gofman A (2003) I novation Inc, 2003. System and method for content optimization. U.S. Patent 6,662,215.
  11. Yousaf U, Zulfiqar R, Aslam M, Altaf M (2012) Studying brand loyalty in the cosmetics fforum. http:STUDYING BRAND LOYALTY IN THE COSMETICS INDUSTRY. LogForum, 8(4).
  12. Weinstein A, Cahill DJ (2014) Lifestyle market segmentation. Routledge.
  13. Moskowitz HR, Gofman A (2007) Selling blue elephants: How to make great products that people want before they even know they want them. Pearson Education.
  14. Moskowitz HR, Gofman A, Beckley J, Ashman H (2006) Founding a new science: Mind genomics. Journal of sensory studies 21: 266–307.

Learning to Remember: Early Stage Exploration of user Requirements in an Education APP

DOI: 10.31038/ASMHS.2019314

Abstract

We present a new approach, Mind Genomics, to understanding the needs of prospective users with respect to a teaching APP designed to promote improved memorization of important texts. Using small-scale experiments, using the systematically varied messages in the form of stories or vignettes, Mind Genomics uncovers the customer-requirements of the APP. These vignettes are combinations of ideas about the product, its use, and the benefits to be obtained. The pattern of reactions to these vignettes reveals which specific features and benefits ‘drive interest.’ Mind Genomics does not require the respondent to intellectualize the need, an intellectualization which introduces response biases, and perhaps demand an answer that the respondent may not know. Rather, the deconstruction of the pattern of the immediate responses assigned almost automatically and without deep thinking, clearly reveals the underlying needs. The results from this small-scale study suggest three radically different mind-set segments. Mind Genomics, finds application where the respondent’s job is to make decisions, and where one would like to reduce the biases due to what the respondent expects the appropriate answer to be. We show how Mind Genomics can become an early-stage, rapid, affordable, and scalable system for deep understanding of human judgments.

Introduction

The Psychology of Memory and its Position in the 21st Century Information World

Studies of memory lie at the historical foundation of experimental psychology. Among the earliest reported publications is Hermann Ebbinghaus’ book on Uber die Gedachtnisse, Memory, reporting in detail his extensive work with memory drums and rote learning [1]. Memory and its association with learning has not lost its allure for researchers, and has become increasingly important once again, almost two centuries after Ebbinghaus excited a waiting world with his experiments. This new excitement does not deal with the academic studies of memory and the myriad effects of the stimulus and the person as influences. Rather, this new excitement about memory revolves around the realization that in this new world of instant information, critical thinking, not rote memory, is important

As technology continues to improve, educators focus increasingly on technological aids to education, called in some circles ‘Ed-Tech.’ Computers promise to accelerate the development of thinking. For some areas such as information retrieval, computers have now, at least in the minds of some people, supplanted human memory as a key for one’s learning. As if to say: One need not ‘remember’ anything. Google®, Google Scholar® and other technologies can store and recall more in a moment than a person could remember in a lifetime. Indeed, as this 21st century progresses, we see education in a maelstrom, as the new technologies conflict with old ways of learning.

One of the victims of this accelerated change in the way education is practiced comes from the loss of memorized information which comprised a person’s basic storehouse of knowledge. We no longer read very much, and our attention span is coming under suspicion as weakening. We are not disciplined in what we read, what we learn, since it is clear that computer-savvy young person, even as young as 8–10 years old, can extract enough information from web-sources that she or he can write a paper based on that “research”. Of course, their thinking won’t be as good as someone who has processed the information by thinking about it, but nonetheless the information will be there. Despite the plethora of information easily available, there is still the need for knowledge, memorized, processed, and incorporated into one’s mind, readily available for use in coping with the everyday [2, 3].

The foregoing is the negative part of today’s evolution, the loss of one’s store-house of information. Joshua Foer, who was the 2006 Memory Champion of the USA [4], co-founded a site, “Sefaria”, a storehouse of Jewish classic texts, searchable and clearly presented to any learner. When asked: “Why does anyone need to memorize nowadays, we have Google and Sefaria!”, Foer is said to have replied “Our memory is not like a passive bank account, in which the more you put into your account, the more you have to withdraw. Rather, our memory is like a lens, through which we see the world. What we remember actively guides our thinking, deepening our understanding. The more we remember – the better we think.” [5]

There is a positive part to the computer revolution as well. With the aid of machines, we can learn faster. Machines which provide feedback can become coaches, indeed tireless ones. A properly programmed machine can become a valuable ‘coach, when it can take the stimulus input, present it, acquires feedback on the subject’s reactions, and continue to do so, tireless, efficiently, hour after hour after hour.’

Psychology of Performance versus Psychology of Communication

Experimental psychologists are accustomed to studying processes, such as how we learn, the variables which drive the rate of learning and forgetting, and so forth. The focus of experimental psychology is on the person as a ‘machine, ’ with the goal to understand how this machine operates. The scientific literature of experimental psychology thus deals with well-contrived experiments, constructed to isolate, understand, and quantify aspects of behavior, such as learning and memory.

Less attention is given to what people ‘want’ in their lives. When we talk about a learning aid, we talk about what it does. The design of the machine, the so-called ‘customer requirements’ are left either to studies of human factors or studies of marketing, whether basic or applied. The discipline of Human factors studies the changes in behavior at the nexus of man-and-machine. Marketing studies what people want, with the goal of applying that knowledge to solve a specific, practical problem.

The study presented here incorporates aspects of experimental psychology, human factors, and marketing. The study here is an experiment, to explore how statements about features of a machine drive consumer’s responses. The experiment here was done in the spirit of human factors, to understand the aspects of the man-machine interaction. Additionally, the experiment was done in the spirit of marketing, to understand the types of mind-sets which may want different things, and the nature of the communications appealing to each mind-set.

Solving the Problem Using Experimental Design of Ideas (Mind Genomics)

Traditional methods to understand consumer requirements use a variety of different methods, ranging from an observation of what is being currently to (field observation), to focus groups which discuss needs, to questionnaires which require the respondent to identify what is important from a list of alternatives, and down to so-called A/B tests where the respondents experience alternative instantiations of a product, and the researcher observes which instantiation performs better, makes the changes, and commissions another A/B test.

Although a great deal of consumer research assumes that people ‘know’ what they want, the reality is that they do not. Kahneman & Egan [6] suggest that we operate with at least two systems of decision-making, the ‘Fast’ and the ‘Slow’, respectively, called ‘System 1’ and ‘System 2.’ In our regular lives we are presented with compound situations containing many different cues, situations to which we must respond quickly. We have no time to weigh alternatives in a considered fashion. The rate at which these compound situations come at us can be numbing when we stop to count them. Consider, for example, driving quickly, and the many decisions that must be made, especially when maneuvering in traffic.

The complexity of decision making, the involvement of Systems 1 and 2, respectively, in this emotionally tinged topic of learning to remember makes it imperative that we move away from simplistic methods of ‘asking people what they want, ’ and, instead, do an experiment in which what people want emerges from the pattern of responses, without any intellectualization on the part of the individual.

Mind Genomics eliminates the problems encountered with many of the approaches which require the respondent to intellectualize what may be impossible to intellectualize, much less to communicate. The objective of Mind Genomics is to identify the importance of alternative features of an offering by presenting many descriptions of the offering, instructing respondents to consider each description as a possible product, and then to rate the description. The respondent is not instructed to reveal the reasons for accepting or reject each specific alternative, but rather, almost in a non-analytical way, rapidly evaluate the offering quickly, almost automatically, as one does with small purchases. The pattern of reactions to the different offerings reveals what features of the offering are important, and what features are irrelevant, or even off-putting.

The Contribution of Experimental Design

The experiments in Mind Genomics are patterned after the way nature presents its complexity to us, but in a more structured format. Mind Genomics studies combine individual pieces of information, ‘messages’ or ‘ideas, ’ doing so by experimental design [7]. The combinations, vignettes, are presented to the respondent who is encouraged to make a decision, doing so rapidly, e.g., rate the vignette on an attribute. The experiment comprises the presentation of a set of these vignettes, here 24 in total, to each respondent, who reacts to the vignette, rates, and moves automatically to the next vignette, repeating the process. The experimental design, in turn, enables the researcher to deconstruct the rating into the contribution of the individual elements, the messages. To the respondent, the array of alternative vignettes evaluated in the space of five minutes or so might seem to be a numbing set of randomly combined ideas, but nothing can be further from the truth.

As will emerge from the analysis of responses to a description of a new APP, Shanen-Li, designed to help memory, consumer demands emerge quite clearly from the descriptions. Consumers are asked simply to be participants to evaluate ideas. They are not asked to be experts, nor even to proffer their opinion, but simply to give their immediate, so-called ‘gut’ reaction to each vignette or test combination.

The Mind Genomics Process – Setup

The first step in Mind Genomics asks four questions, and for each question, requires four simple answers, or a total of 16 questions. The questions are never presented to the respondent. Only the answers are presented in combinations, as we will see below. The questions provide a structure to generate the answers. It is the answers which provide the necessary information about the Shanen-Li APP.

A parenthetical note is appropriate here. When one begins the process of creating a Mind Genomics experiment, the notion of question and answer is easy to comprehend. The questions which, in sequence, tell a story, are themselves difficult to create, at least for the first two or three studies. The answers themselves are easy to create once the questions are formulated. Over time, and with repeated experience, the novice begins to think in this more orderly fashion of telling stories through questions and providing the substance of those stories through the answers. In a sense, the Mind Genomics process may somehow ‘train’ the user to think in a new, structured way, one which forces a discipline where there may not previously have been discipline.

One of the key features of Mind Genomics is that one need not know the ‘right answers’ at the start of the process, a requirement which is often the case for more conventional studies. Rather, Mind Genomics system is designed to be iterative, inexpensive, and rapid. That is, one can do a study in a matter of a few hours, identify the important messages or elements, discard the rest, and, in turn, incorporate new elements to the next iteration. Within the space of a day it is possible to do 3–4 iterations, and by the end of the four iterations one should have come upon the strongest messages. In this paper we present the first iteration in order to demonstrate the nature of the process and the type of learning which emerges.

Assembling the Raw Materials to Tell ‘Stories’

The first step in a Mind Genomics study consists of asking a set of questions which ‘tell a story.’ As noted above, this first step may seem easy, but it is not as simple as one might think. The objective is to summarize the nature of the stimulus through questions. Table 1 shows the four questions for the first study. These questions give a sense of a story. The rationale for these questions beyond ‘telling the story’ is to evoke answers, or elements, the messages containing the actual information which will appear in the test vignettes. The questions never appear in the study. They are only an aid to structure the vignette, and to stimulate the researcher to provide the meaningful elements which convey information, in this case information about the APP.

Table 1. The four questions and the four answers to each question.

Question A: What are the key pain factors with reading and recitation?

A1

It is so frustrating and tedious to memorize texts

A2

It is a pain to supervise someone memorizing texts

A3

It is expensive to hire tutors to supervise students memorize texts

A4

There is no way to plan and track progress

Question B: What are the benefits of overcoming the pain?

B1

Using an APP reduces the costs of educating a student

B2

Students feels accomplished

B3

The student experiences a sense of success, that turbocharges motivation

B4

Self-directed learning, at student’s own pace increases motivation

Question C: What are the key descriptions of how it works?

C1

Use the APP to listen to any text at will

C2

Recite the text and the APP checks for accuracy

C3

The level of accuracy is reported, and the student is prompted to self-correct

C4

The APP tracks progress and sends reports to parents and teachers

Question D: What are the wow factors?

D1

Students become masters faster than they can imagine

D2

Students can’t put it down ‘til they get it right

D3

Now there is a plan to succeed

D4

The student can see their accomplishments and are motivated to keep going

Each question, in turn, requires four answers to the question. As Table 1 shows, the questions are simple, and the answers are equally simple. Every effort is made to avoid conditional statements, and statements which require a great deal of thinking. Furthermore, the answers are phrased in every-day language, in words that a person might use to describe the APP or the experience of memorization.

When doing these types of studies, one often feels ‘lost’ at the start of the process. Our educational system is not set up to promote critical thinking of a Socratic nature, the type of thinking required by Mind Genomics. The notion of telling a story through questions is strange, as if the notion of providing alternative answers which may be ‘what is, ’ and ‘what could be.’ Nonetheless, with practice the exercise soon becomes easier, although it is not quite clear at this writing (2019) whether this Socratic approach can replace the traditional thinking, or whether the approach can be practiced more easily with repeated efforts.

Creating Stories by Experimental Design (Systematic Combinations)

People often respond based upon what they think the right answer either ‘IS’, or what they believe the appropriate answer to be. Questionnaire-based research is especially prone to mental editing, response biases, based on belief, or based on the covert, often un-sensed desire to please the interviewer. Computer-administered questionnaires may compensate for the latter, because there is no interviewer, but rather a machine. It may be difficult for the respondent even to respond to machines when the topic is emotionally tinged.

Mind Genomics moves in a different direction, using experiments to understand the mind of the respondent. In a Mind Genomics experiment, the respondent is presented with combinations of messages, one message atop the other, such as that shown in Figure 1. The respondent’s job is simply to rate the combination on a scale, without having to explain WHY the rating was assigned. It is hard at first for a respondent to evaluate this type of mix of messages because people have been taught to deconstruct compound stimuli, and then to evaluate each part of the compound stimulus. The notion of rating an artificially combined set of messages moving in different directions is at first strange, but then becomes very easy by the time the respondent rates the second or third vignette.

Mind Genomics-010-ASMHS Journal_F1

Figure 1. Example of a vignette and a rating scale for the APP.

Although the vignette in Figure 1 appears to have been designed by randomly throwing together different combinations, the truth is the opposite. The 24 vignettes for a respondent are carefully crafted so that the 16 elements, the independent variables, are statistical independent of each other, and that each element appears an equal number of times.

Table 2 shows schematics for the first eight vignettes for respondent #1. The vignettes are first presented in the original design format (top section), and then shown in a binary expansion (middle section). The regression program cannot work with the original design, expressed in terms of the questions and answers in each vignette. It is necessary to recode the design so that there are 16 independent variables, which, for any vignette, take on the value 0 when absent from the vignette, and take on the value 1 when present in the vignette.

Table 2. Part of the actual experimental design..  The table shows the first eight vignettes of 24 for the first respondent.

Test Order

Vig1

Vig2

Vig3

Vig4

Vig5

Vig6

Vig7

Vig8

Question

A

3

4

3

2

2

1

0

1

B

3

3

1

3

4

2

1

0

C

3

0

2

2

4

1

2

2

D

2

4

1

0

1

0

2

2

Binary Transformation

A1

0

0

0

0

0

1

0

1

A2

0

0

0

1

1

0

0

0

A3

1

0

1

0

0

0

0

0

A4

0

1

0

0

0

0

0

0

B1

0

0

1

0

0

0

1

0

B2

0

0

0

0

0

1

0

0

B3

1

1

0

1

0

0

0

0

B4

0

0

0

0

1

0

0

0

C1

0

0

0

0

0

1

0

0

C2

0

0

1

1

0

0

1

1

C3

1

0

0

0

0

0

0

0

C4

0

0

0

0

1

0

0

0

D1

0

0

1

0

1

0

0

0

D2

1

0

0

0

0

0

1

1

D3

0

0

0

0

0

0

0

0

D4

0

1

0

0

0

0

0

0

Rating

1

9

1

9

1

9

1

9

Binary Transformation

0

100

0

100

1

100

1

100

Response Time

5

8

5

1

0

0

1

1

The bottom of Table 2 shows the two ratings and the response time. The first rating is the number on the anchored 9-point scale. The second number is the transformed rating. The transformation is done so that ratings of 1–6 are transformed to 0 and ratings of 7–9 are transformed to 100. Afterwards, a very small random number (<10–5) is added to the binary transformed ratings to ensure that the OLS (ordinary least-squares) regression will work, no matter whether the respondent uses the entire 9-point scale, or limits the ratings to the low part of the range (1–6), or limits the ratings to the high part of the range (7–9), respectively The transformation makes it easy for researchers and managers to understand the meaning of the numbers. Researchers and managers want to learn whether a specific variable, in our case a message, drives the answer ‘no’ (not interested) or yes (interested).

Each of the respondents is assigned a different experimental design, created by permuting the elements [8] the same mathematical structure and robustness of design is maintained, but the specific combinations change. This strategy differs from the typical research approach which ‘replicates’ the same test stimuli across many respondents in order to obtain a ‘tighter’ estimate of the central tendency. With more respondents, the standard error drops, and the researcher can be more certain of the repeatability of the result. This statistical strength is achieved by repeating the experiment with a limited number of test stimuli, chosen to represent the wide range of alternative combinations. Mind Genomics works in a totally different way, covering a lot more of the space, albeit with fewer estimates of any single combination of elements, i.e., fewer replicates of the same vignette. Often there is only one estimate of the vignette. The rationale is that it is better to cover a wide range of alternative stimuli with ‘error’ than a narrow and perhaps unrepresentative range of stimulus with ‘precision.’

Individual Differences: Average Liking of the Vignette versus Average Response

Do individuals who like the ideas about the Shanen-Li APP respond any faster (or slower) than individuals who don’t like the ideas? In other words, is there a discernible pattern at the level of the individual respondent, so that those who like an idea (on average) respond faster or slower than those who don’t like an idea?

Figure 2 shows a plot of the average rating of liking (average binary response) versus the average number of seconds (average response time). Each filled circle corresponds to one of the 50 respondents. It is clear from Figure 2 that, at the level of the individual respondent, there is no clear relation between how much a person ‘likes’ an idea presented by the vignette and how rapidly the person responds to the vignette. Those who, on average, don’t like the idea of the APP respond quickly or respond slowly as those who, on average like the idea.

Mind Genomics-010-ASMHS Journal_F2

Figure 2. Relation between response time (ordinate) and liking of the idea (abscissa). Each filled circle corresponds to one respondent, whose ratings and response times, respectively, were averaged across the 24 vignettes.

Modeling

A deeper understanding of the dynamics of decision making emerges when we deconstruct the ratings (here the binary transformation) into the contribution of the individual elements. The experimental design ensures that the 16 elements are statistically independent of each other at the level of the individual respondent. Combining the data from the 50 experimental designs into one grand data set comprising 1200 observations, 24 for each of 50 respondents, allows us to run one grand analysis using OLS (ordinary least-squares) regression. OLS will deconstruct the data into the part-worth contribution of each of the 16 elements,

Table 3 shows the results of the first analysis, wherein the dependent variable is the binary transformed data (ratings of 1–6=0; ratings of 7–9=0), and wherein the independent variables are the 16 elements. The elements take on the value 1 when present in a vignette, and the value 0 when absent from a vignette.

Table 3. Coefficients of the model relating the presence/absence of the 16 elements to the binary transformed model for ‘like using this APP.’


Coeff

T Stat

P-Val

Additive constant

44.41

5.75

0.00

B3

The student experiences a sense of success, that turbocharges motivation

1.66

0.35

0.73

C2

Recite the text and the APP checks for accuracy

1.63

0.35

0.73

C4

The APP tracks progress and sends reports to parents and teachers

1.61

0.34

0.73

A1

It is so frustrating and tedious to memorize texts

1.50

0.32

0.75

A2

It is a pain to supervise someone memorizing texts

-0.65

-0.14

0.89

B4

Self-directed learning, at my own pace increases motivation

-1.34

-0.28

0.78

C3

The level of accuracy is reported, and the student is promoted to self-correct

-1.88

-0.40

0.69

D4

The student can see their accomplishments and are motivated to keep going

-1.88

-0.40

0.69

C1

Use the APP to listen to any text at will

-2.07

-0.44

0.66

B2

Students feels accomplished

-2.29

-0.48

0.63

B1

Using an APP reduces the costs of educating a student

-2.71

-0.57

0.57

D2

Students can’t put it down til they get it right

-3.42

-0.73

0.47

A3

It is expensive to hire tutors to supervise students memorize texts

-3.47

-0.74

0.46

A4

No way to plan and track progress

-3.51

-0.75

0.46

D3

Now there is a plan to succeed

-5.21

-1.12

0.26

D1

Students become masters faster than they can imagine

-5.60

-1.19

0.24

The equation estimated by OLS regression is expressed as: Binary Rating = k0 + k1(A1) + k2(A2) … k16(D4)

The additive constant is the expected percent of times that the binary value will be 100, in the absence of elements. All vignettes comprised at least two and at most four elements, so the additive constant is a purely estimated parameter. Nonetheless, the additive constant can be thought of as a ‘baseline’ value, namely the likelihood of a positive response towards the APP in general.

The additive constant is 44.41, meaning that in the absence of specific information; we are likely to see almost half the responses being strongly positive. The value 44.41 is a bit shy of 50. The T-statistics tells us the ratio of the additive constant to the standard error of the additive constant. The T-statistic can be thought of as a measure of signal to noise, of the value of the additive constant to the variability of the additive constant. The ratio is 5.71, quite high, with the probability of seeing such a high ratio being virtually 0 if the ‘true’ additive constant were really 0.

When we look at the individual elements for the total panel, we find that the coefficients are quite low, with the highest coefficient being 1.66. The coefficient tells us the expect increase or decrease in the percent of respondents who say that they would be interested in the APP if the element were to be included in the vignette. We begin with the additive constant (44.41) and add the individual coefficients of the elements.

What is remarkable is the low value of the coefficients for the total panel. The highest performing element is B3, ‘The student experiences a sense of success, that turbocharges motivation.’ The coefficient is only 1.66, i.e., about 2. The T statistic is 0.35, meaning that it’s quite likely that the real coefficient is 0.

There are some elements which, in fact, are negative, pushing respondents away.

Now there is a plan to succeed
Students become masters faster than they can imagine

Looking at Key Subgroups

We now move to an analysis of subgroups, specifically gender, age, and then mind-set segments. The respondent gender and age are obtained directly from the experiment. Respondents are instructed to give their gender (only male versus female), and to select the year of their birth.

For mind-set segments, we use the well-accepted method of cluster analysis [9] to discover complementary groups of respondents which respondent differently and meaningfully to the 16 elements. The experimental design allowed us to create an individual-level model relating the presence/absence of the elements to the binary-transformed ratings. Each respondent generates a unique pattern of 16 coefficients. We combine respondents into complementary groups with the property that the patterns of coefficients in a group (mind-set segment) are similar to each other, and differ from the average patterns for the other groups. The actual segmentation uses a measure of distance between respondents defined as (1-Pearson Correlation). When two patterns perfectly correlate (Pearson Correlation = 1), the distance is 0. When two patterns perfectly inversely correlate (Pearson Correlation = -1), the distance is 2.0.

Table 4 shows the additive constants and the strong performing elements for each defined subgroup. What should become immediately apparent is that:

Table 4. Strong performing elements by subgroups.

Total

Males

Females

Age71–20

Age21–25

Age26+

Mind-Set C1

Mind-Set C2

Mind-Set C3

Base size

50

23

27

25

19

6

12

22

16


Additive constant

44

48

41

49

27

80

41

39

48


Gender


Males


Females

A1

It is so frustrating and tedious to memorize texts

2

-5

7

1

5

-12

-6

15

-10


Age


Age17–20


Age21–25

C4

The APP tracks progress and sends reports to parents and teachers

2

3

0

-5

9

14

19

-1

-6

A4

No way to plan and track progress

-4

-12

4

-7

8

-29

2

4

-14


Age26+

C4

The APP tracks progress and sends reports to parents and teachers

2

3

0

-5

9

14

19

-1

-6


Mind-Set Segments


Mind-Set C1 -A tracking system with feedback

C4

The APP tracks progress and sends reports to parents and teachers

2

3

0

-5

9

14

19

-1

-6

C2

Recite the text and the APP checks for accuracy

2

5

1

-2

6

3

12

-3

0


Mind-Set C2 – makes the memorization task easier for everyone concerned

A1

It is so frustrating and tedious to memorize texts

2

-5

7

1

5

-12

-6

15

-10

B2

Students feels accomplished

-2

-8

3

3

-5

-13

-20

13

-9

B1

Using an APP reduces the costs of educating a student

-3

-3

-2

5

-6

-23

-21

10

-6

A2

It is a pain to supervise someone memorizing texts

-1

-2

0

3

2

-25

-4

9

-9


Mind-Set 3C – motivates the student through specific actions and results


D2

Students can’t put it down til they get it right

-3

-8

0

-4

0

-16

0

-14

13

D1

Students become masters faster than they can imagine

-6

-9

-4

-5

-2

-17

-20

-11

12

D3

Now there is a plan to succeed

-5

-9

-3

-7

1

-13

-5

-18

11

B3

The student experiences a sense of success, that turbocharges motivation

2

6

-2

2

2

-2

-25

12

7

  1. The additive constant is modest, except for the respondents who are age 26+ (a small group). The respondents accept the ideas of a tutoring APP of this sort, but it will be the elements which must do the hard work.
  2. The strong-performing elements really occur among the mind-sets. That is, the opportunities do not lie among the respondents based on gender or age, but based on mind-sets.
  3. We do not know the mind-sets ahead of time. The mind-sets must be extracted through analysis of patterns, only after the experiment has been run.
  4. The key to success for this product is the array of mind-sets emerging from the segmentation. Even with the mind-sets, only a few elements drive interest, but when they do, they do strongly
  5. At the end of the paper, we present an approach to discover these mind-sets in the population.

The Speed of Comprehension and Decision Making

Before the respondent rates a vignette, we assume that the respondent has read and comprehended the material in the vignette. Although the responses occur very rapidly, suggesting very quickly reading and decision making, we can still uncover the relation, if any, between the element and the speed at which that element is comprehended. Figure 3 shows that many of the vignettes are responded to within a second or two.

Mind Genomics-010-ASMHS Journal_F3

Figure 3. Distribution of response times for the 1200 vignettes. Response times of faster than 8 seconds were truncated to be 8 seconds, under the assumption that the respondent was otherwise engaged when participating in the experiment, at least when reading the vignette.

The response time it does not tell us much. We do not understand the dynamics of response time, specifically in this experiment, why some vignettes took longer times, some took shorter times. One way to discover the answer deconstructs the vignette into the contribution of the different elements to response time, in the same way that we deconstructed the contributions of the elements to the binary transform. The only difference is that we write the equation without an additive constant. The equation, written below, expresses the ingoing assumption that without elements in a vignette, the response time is essentially 0.

Table 5 presents the same type of table as presented by Table 3, namely a full statistical analysis of the elements, showing their coefficient, the t statistics (a measure of signal to noise), and the p value for the coefficient. The difference between Tables 3 and 5 is that for the binary rating, the model contains an additive constant because the ingoing assumption is that there is a predisposition towards the topic of a memory-training APP, but there is no predisposition in the case of response

Table 5. Coefficients of the model relating the presence/absence of the 16 elements to the binary transformed model for ‘response time.’ All response times of 8 seconds or more for vignette were transformed to 8 seconds.


Coefficient

T Stat

p-Value

Elements responded to most slowly, i.e., ‘maintain attention’

A4

No way to plan and track progress

1.08

4.77

0.00

C3

The level of accuracy is reported, and the student is promoted to self-correct

0.53

2.37

0.02

C4

The APP tracks progress and sends reports to parents and teachers

0.53

2.35

0.02

C1

Use the APP to listen to any text at will

0.61

2.72

0.01

D1

Students become masters faster than they can imagine

0.61

2.70

0.01

A1

It is so frustrating and tedious to memorize texts

0.65

2.89

0.00

C2

Recite the text and the APP checks for accuracy

0.65

2.87

0.00

B4

Self-directed learning, at my own pace increases motivation

0.70

3.14

0.00

A3

It is expensive to hire tutors to supervise students memorize texts

0.74

3.25

0.00

B1

Using an APP reduces the costs of educating a student

0.75

3.44

0.00

B2

Students feels accomplished

0.75

3.41

0.00

D4

The student can see their accomplishments and are motivated to keep going

0.80

3.54

0.00

A2

It is a pain to supervise someone memorizing texts

0.81

3.59

0.00

B3

The student experiences a sense of success, that turbocharges motivation

0.82

3.69

0.00

D2

Students can’t put it down til they get it right

0.82

3.58

0.00

D3

Now there is a plan to succeed

0.87

3.79

0.00

Elements responded to most quickly

It is clear from Table 5 that most of the elements are reacted to quickly, as suggested by the coefficient, which is a measure of the number of seconds. The fastest elements are those which paint a word picture of an activity, and which may be visualized. The slowest elements are those which talk about less concrete topics, such as motivation and feelings.

Subgroups – Do They Respond at Different Speeds to the Elements

When looking at the deconstructed response times in Table 4 we see that virtually all response times range between one-half second and one second, respectively. There is no sense of any large differences between elements. A one-half second difference is still quite rapid. The story is quite different, however, when we look at subgroups defined by gender, by age, and then by mind-set segment. Table 6 shows those elements which catch the respondent’s attention, operationally defined as taking more than 1.15 seconds for the element to be ‘processed. Combining a high scoring element for interest with a high scoring element for response times means bringing together an interesting element which maintains the respondent’s attention during the stage of ‘grazing for information.’

Table 6. Elements showing slow response times, suggesting that they ‘catch’ the respondent’s attention.

Total

Males

Females

Age17–20

Age21–25

Age26+

SegB1

SegB2

SegC1

SegC2

SegC3

A2

It is a pain to supervise someone memorizing texts

0.8

1.0

0.6

0.8

0.9

0.4

0.7

0.9

-0.1

1.0

1.2

A3

It is expensive to hire tutors to supervise students memorize texts

0.7

0.7

0.7

0.7

0.6

1.4

0.8

0.7

0.3

0.8

1.0

A4

No way to plan and track progress

1.1

1.2

1.0

0.9

1.3

1.5

1.1

1.0

1.0

1.1

1.2

B1

Using an APP reduces the costs of educating a student

0.8

0.6

0.9

0.6

1.2

-0.1

1.1

0.4

0.4

0.5

1.4

B3

The student experiences a sense of success, that turbo charges motivation

0.8

0.8

0.9

0.4

1.3

0.9

0.9

0.7

0.8

0.8

0.9

B4

Self-directed learning, at my own pace increases motivation

0.7

0.6

0.8

0.7

1.0

-0.1

1.0

0.5

0.7

0.4

1.2

Discovering the Mindsets in the Population

Mind-sets distribute through the population. The traditional approach to produce development and marketing often believed that ‘you will need or believe based upon WHO YOU ARE.’ The notion of ‘WHO YOU ARE’ may be a result of the person’s socio-economic situation or may be a result of a person’s general psychographic profile [10]. The premise of Mind Genomics is that people fall into different groups, Mind-Sets, not necessarily based on who they are, nor on what general things they believe. Table 7 shows that even for this small base of respondents, the three Mind-Sets distribute in almost similar ways across interests, gender, and age. A different method is needed to identify Mind-Sets emerging from these focused studies. It is unlikely that the Mind-Sets for this new-to-the-world division into Mind-Sets for this APP can be found in the analysis of so-called Big Data. A different method is need, the PVI, Personal Viewpoint Identifier, described below.

Table 7. Distribution of the 50 respondents in the three Mind-Sets, by interest for memorizing, by gender, and by age

 Mind Set C1

Mind Set C2 

Mind Set C3 

 Total

Total

12

22

16

50

Why are interested in memorizing

Songs

6

12

12

30

History

3

4

0

7

NA

0

4

1

5

Quotes

2

0

3

5

Lines

1

2

0

3

Gender


Male

6

10

7

23

Female

6

12

9

27

Age Group


A17t25x

4

12

9

25

A21to25x

6

8

5

19

A26+

2

2

2

6

Conventional data mining is simply unlikely to identify Mind-Sets relevant to this specific topic of what appeals to a prospective buyer of this particular APP. The possibility, of course, is that through some ‘fluke’ there may be correlations between the nature of what people want in this APP and some information that is available about the person. The likelihood of the latter happening is virtually zero. Furthermore, even if the researcher finds an effective ‘predictor’ of mind-sets for this particular topic is no guarantee that the next particular topic will be as fortunate, leaving in its wake a variety of correlations. What is need is a system to assess, with some reduced error, the likely membership of an individual in a Mind-Set.

One way to create the system for assigning people to mind-sets consists of looking at the elements or answers which most strongly differentiate among the mind-sets. These elements can be structured as questions. The important thing is that they come from precisely the same source, at the same time, and with the same people which and who, in turn, defined the particular array of mind-sets. There is no need to match or balance samples. The pattern of responses points to the likely membership of a person in one of the three mind-sets.

Figure 4 presents the PVI, the personal viewpoint identifier, created specifically for this study. The left panel shows the questions. The right panel shows the three answer panels, which can go to the person, to the nurse, to the doctor, or become part of the person’s electronic health records, so that in the future the medical professional can know how to work with the patient to deal with the patient’s pain. The website as of this writing to ‘try’ this PVI is: http://162.243.165.37:3838/TT14/

Mind Genomics-010-ASMHS Journal_F4

Figure 4. The PVI (personal viewpoint identifier) to assign a new person to one of the three mind-sets for the memorization APP.

Discussion and Conclusion

In the modern-day quest to introduce students to the new world of critical thinking, there is an increasing danger that we are going to eliminate the need for disciplined memorization. The notion that all the information one needs is ‘always available’ through a Google® or like system which is, in turn, ‘Always On’ produces the potential false sense that we need live only in the here and now as processors that which is immediate. There is no realization that we must create within ourselves a repository of knowledge, not just of unstructured experiences to which we respond, willy-nilly, as the spirit strikes.

The data from this exploratory study suggest that people are not aware of the need to memorize. When asked why they would want to memorize, 30 out of the 50 said ‘songs.’ It is clear that in today’s world, there may be a substantial loss of the value of remembering, even perhaps remembering history and literature, the essence of a cultured person. Our data suggest a severe problem developing in its early stages. We are becoming a culture of ‘just don’t know.’

Structured memorization and the increase in the human potential by combining this memorization to build a foundation of knowledge with the readily accessed corpus of knowledge which is ‘Always On’ may become the best of both worlds. Helping the student learn gives the student confidence. Helping the student think critically gives the student a capability. Helping the student create a bank of knowledge makes the student into a fully rounded individual who can reflect on what he or she knows, has learned. A person cannot be ‘cultured’ or ‘educated’ with knowing. Knowing means learning and retaining, memorizing. It is in that spirit that the Shanen-Li APP has been developed.

Acknowledgment

Attila Gere thanks the support of the Premium Postdoctoral Researcher Program of the Hungarian Academy of Sciences.

References

  1. Herrmann D, Chaffin R (2012) (eds.) Memory in historical perspective: The literature before Ebbinghaus. Springer Science & Business Media, 2012.
  2. Knowles MS, Holton E, Swanson R (1998) The adult learner: The definitive classic in adult education and human resource development (5th). Houston, TX: Gulf Publishing Company.
  3. Renshaw CE, Taylor HA (2000) The educational effectiveness of computer-based instruction. Computers & Geosciences 26: 677–682.
  4. Foer J (2019) https://en.wikipedia.org/wiki/Joshua_Foer .
  5. Foer J (2018) Personal communication with Rabbi E. Dordek, January 2018.
  6. Kahneman D, Egan P (2011) Thinking, fast and slow. New York: Farrar, Straus and Giroux.
  7. Leardi R (2009) Experimental design in chemistry: A tutorial. Anal Chim Acta 652: 161–172. [crossref]
  8. Gofman A, Moskowitz H (2010) Isomorphic permuted experimental designs and their application in conjoint analysis. Journal of Sensory Studies 25: 127–145.
  9. Steinley D (2006) K-means clustering: a half-century synthesis. British Journal of Mathematical and Statistical Psychology 59: 1–34.
  10. Wells WD (1975) Psychographics: A critical review. Journal of marketing research 12: 196–213.

Health Threats Awareness – Responses to Warning Messages about Cancer and Smartphone Usage

DOI: 10.31038/CST.2019415

Abstract

The dramatic worldwide increase in use of smartphones has prompted concerns regarding potential carcinogenic effects of exposure to RFM-EF (Radiofrequency-Modulated Electromagnetic Fields). Previous studies indicated epidemiologic evidence for many risks arising from exposure to smartphones. Despite this growing evidence, the exposure to smartphones is rising across age groups. This study identified communication messaging which increases awareness of risks, and convinces the respondent of the seriousness of these risks. We revealed two mind-set segments (Focus on Work; Focus on Safety) illustrated how to use our viewpoint identifier tool to assign the belonging of a people in the population into mind-set segments.

Introduction-what we know about health risks and smartphones?

The evolving capabilities of cell phones have extended beyond their initial purpose turning them into vital and indispensable communication tool with increasing features mimicking other technologies [1]. The dramatic worldwide increase in use of cellular telephones has prompted concerns regarding potential harmful effects of exposure to radiofrequency-modulated electromagnetic fields, particularly a concern about potential carcinogenic effects from the RF-EMF emissions of cell phones [2].

Certain electromagnetic fields at low frequency have been recognized as possibly carcinogenic by the International Agency for Research on Cancer [3]. Since 1992, our world has become suffused with cellphones facilitating social interactions. Use of cell-phones for communication seems to rule our daily lives, at school [4], while driving [1,5], at work, and around the dinner table. This widespread use is growing into a common point of discussion generating concerns about potential risk hazards.

Cancer has been suggested as an outcome of exposure to mobile telephones by some scientific reports leading the WHO to address key issues [6]. A study that evaluated the link between the use of smartphones and the development of types of cancer tumors on the head (gliomas, meningiomas and neuromas of cranial nerves) in 13 countries suggested a general tendency for an increased risk of glioma among the heaviest users: long-term users, heavy users, users with the largest numbers of telephones [3]. Text messaging using smartphones after one year among 7092 people ages 20–24 was reported to increase symptoms in neck and upper extremities [7]. In healthy participants and compared with no exposure, 50-minute cell phone exposure was associated with increased brain glucose metabolism in the region closest to the antenna [8].

Another study that compared among areas of exposure to cell-phone transmitter stations indicated a significant increase in incidents of cancer for those living in proximity to the stations [9]. Moreover, a report based on an international research and public policy aimed at an overview of what is known regarding biological effects of low-intensity electromagnetic exposure shows that this exposure is associated with a wide array of problems. Following is a list of some of the more common problems: childhood leukemia, brain tumors, genotoxic effects, neurological effects and neurodegenerative diseases, immune system deregulation, allergic and inflammatory responses, breast cancer, miscarriage and some cardiovascular effects concluding that a prolonged exposure carries a reasonable risk [10].

Smartphone usage has also been associated with psychological health effects. Heavy use was associated with high anxiety and insomnia [11]. Among young adults prolonged use of smartphones has been reported to increase stress, sleep disturbances, and symptoms of depression [12]. Also, in a study testing the effect of smartphone use on adolescents’ well-being a pattern of heavy use was reported to negatively affect mental health (i.e., aggressive behavior, biased gender roles, disturbances in body image, obesity, and even substance use) [13].

As the debate regarding health risks of low-intensity electromagnetic radiation from smartphones, has been reignited, a meta-analysis reviewed the existence of an epidemiologic evidence for the association between long-term usage of smartphones and the risk of developing a brain tumor [14]. Their results indicated that there is adequate epidemiologic evidence. Usage of a smartphone for ≥10 years approximately doubles the risk of being diagnosed with a brain tumor on the same side of the head as the side preferred for smartphone use.

Another heath risk is related to the smartphone surface as contaminated. A study that tested smartphone as a source for bacterial contamination on the smartphones of physicians at hospitals and found that 83% of surgeons had a high rate of pathogenic bacteria and organic material contamination [15].

The focus of this paper is the identification of communication messaging regarding dangers in extensive use of smart phones. What messaging communicates the dangers involved in the user behavior of smartphones? Launching this research project and reading the literature, led to the realization that there are two dimensions, quite different from each other. The first dimension is BELIEVABLE. Is the message one that can be believed, or is it disregarded? The second dimension is BAD. Does the information convey a fact which is perceived to be associated with damage, specifically damage to health?

The answer our question regarding the representative messaging to communicate the danger might seem simple, but as we will see, it is not. A respondent might either feel that the message is not as bad as one thinks, or worse, that the message talks about something bad, but the message is simply not true [16].

Method

We used the emerging science of Mind Genomics to quantify the perceived believability and the perceived ‘badness’ of messages about cellphone use and what it does to people. We began with a series of six questions shown in Table 1. For each of the six questions, we created six fact-based answers, culled from various sources. Whether the facts culled from the sources could themselves be demonstrated to be real or simply exaggeration was not of interest. We focus here on aspects of argumentation, on what is perceived to be believable, and what is perceived to be ‘bad,’ rather than establishing the validity of statements in a nation-wide validation of the messages.

Table 1. The six questions, and the six answers to each question about cell phones

Question 1: What are the uses of cellphones?

A1

Cell phones let you stay in touch with your loved ones at all times

A2

Cell phones let you stay connected to work

A3

Cell phones keep you in touch with your email wherever you go

A4

Cell phones let you text each other whenever you want

A5

Cell phones let you stay in touch with your child(ren) at all times

A6

Cell phones give you a personal sense of security

Question 2: How do cellphones help you with your family?

B1

Cell phones let you to know where your kids are at all times

B2

Cell phones give your family ability to reach you at any time

B3

Cell phones give your kids the ability to reach you whenever they need you

B4

Cell phones make it easier to pick up your kids from school and school events

B5

Cell phones make travel easier

B6

Cell phones make it easy to pick up people at the airport

Question 3: How do cell phones let you work anywhere, and be anywhere?

C1

Cell phones let you reach anyone anytime you want

C2

Cell phones make it easy to work at home

C3

Cell phones make it easy to work outside the office

C4

Cell phones give you the ability to reach anyone in an emergency

C5

Cell phones allow you to be reached by friends or family in an emergency

C6

Cell phones are so versatile that they have become indispensable

Question 4: What negative health effects come from using cellphones?

D1

Cell phones emit radiation whenever they’re turned on

D2

Cell phones can be dangerous when driving

D3

Cell phones are so light and portable so you can take them anywhere

D4

Cell phone radiation is a suspected cause in neurological impairments in children including autism

D5

People with higher peak exposures to cell phone radiation have an 80 percent increase in the risk of miscarriage

D6

Brain cancer is directly linked to the exponential increases in cell phone use and other wireless devices

Question 5: How has cellphone use changed over the years?

E1

The manual for every cell phone and smartphone sold in the world instructs users to NOT allow their phones to actually touch their ears!

E2

All cell phone manuals instruct users to NOT allow their phones to touch their heads!

E3

The tests showing cell phones to be safe are based on how people used cell phones 35 years ago–not the way you use them today!

E4

Believe it or not–cell phones have never been safety tested among children and teens

E5

Today you use your cell phones far more frequently than you did in the 1980’s when they were safety tested

E6

People using cell phones for 2000 hours have 240% greater risk for malignant brain tumors

Question 6: What are other diseases and negative effects of cellphones?

F1

Cell phone radiation has been shown to cause short term memory loss as well as Alzheimer’s

F2

A comprehensive study in Sweden indicates that children and teens are 5 times more likely to get brain cancer if they use cell phones

F3

Cell phone radiation has been linked to sterility in males who keep their phones in their front pants pockets

F4

Cell phone radiation has been linked to breast cancer in women who carry their phones in their brassieres

F5

People have twice the risk of developing the cancer known as “Glioma”, if they use their cell phones for half an hour a day for more than a decade

F6

Over the past two years there’s been a 4-fold increase in malignant tumors of the parotid gland on the same side of the face that cell phone users hold their phone

The strategy of asking questions and providing several answers to each question comes from the world of rhetoric and argumentation [17]. The rationale for the approach is that the questions tell a story, creating a framework by which on can provide different answers which can be substituted for each other.

The answers or answers within a single question may or may not contradict each other. The answers to different questions (i.e., the elements in different silos) may contradict each other in reality, but do not contradict each other logically. In some cases, an element is put into a category which might seem to be inappropriate (e.g., D3 Cell phones are so light and portable so you can take them anywhere), made into an answer for Question 4: What negative health effects come from using cellphones?) The rationale is that the element was important, but there was no place in the most proper silo, and so the element was placed in another, some-related silo.

It is important to recognize that the questions and answers, silos and elements, are simply a device for bookkeeping. When it comes to modeling, there is no recognition of silos at all. All 36 elements are independent predictor variables. It makes no difference to the modeling about the question or silo with which the answer or element is associated

The premise of Mind Genomics is that we learn a great deal about the responses to the elements by presenting combinations of the elements (answers) in short, easy-to-read test concepts called vignettes. In this study, we used six questions, six answers per question, calling for 48 vignettes. Each vignette is incomplete, comprising either four answers (one answer from each of four questions), and comprising three questions (one answer from each of three vignettes.).

The combinations are not created in a random fashion, although to many respondents evaluating the set of 48 combinations it must seem that the combinations are simply created by throwing the elements together. Nothing can be further from the truth. The experimental design underlying the combinations is created so that each respondent evaluates exactly 48 unique combinations, and that the 36 elements are statistically independent of each other. The specific combinations of vignettes vary from respondent to respondent by a simple permutation system which maintains the underlying structure but changes the composition of each vignette [18] This systematic permutation enables the researcher to test many different combinations of the full set of possible combinations. Without a systematic permutation, the researcher would be left with one set of 48 combinations to represent the many thousands of possible combinations. The limited choice would probably generate far more errors because one would have to be quite knowledgeable to know what combinations to test before the experiment begins, were one limited to a single set of predetermined combination. In effect, the traditional approach of testing mixtures requires that the answer be somewhat ‘known’ before the experiment, in order to select the ‘right combinations.’ In contrast, Mind Genomics needs no such knowledge, because across the set of respondents and with 48 vignettes per respondent, the experiment tests many of the possible combinations, at least once.

The rating scale

The vignettes present the information, but they do not focus the respondent’s mind on specifically what should be the judgment criterion. The rating scales, presented at the bottom page of each vignette, focus the respondent’s mind. The first scale instructs the respondent to rate ‘believability.’ The second scale instructs the respondent to rate ‘badness.’ We see the scales laid out in Table 2. The scales are so-called Likert scale, anchored at the lowest, e and highest scale points for ‘believable’, and at the lowest, middle, and highest scale point for ‘bad.’

Table 2. The two ratings scales

How much do you believe what you read here?

1 = do not believe at all…..9 = totally believe

Overall how much good to bad do you see in this combination?

1 = all good…… 5 = about half good/half bad…… 9 = all bad

Running the study

The study was run through a company specializing in on-line recruiting of respondents. During the past two decades running studies on-line has become the preferred, cost-effective way of acquiring data of the type acquired here. The study can be considered as an on-line experiment, with respondents invited to participate. The respondents are incentivized by a point system, with the points given for participation.

The respondents were invited to participate. The respondent who agreed simply clicked on a link embedded in the email which solicited participation. The respondent was presented with an orientation page, shown in Table 3. The respondent read the orientation page, which described the topic, and presented the scales. The respondent then evaluated a unique set of 48 vignettes, rating each vignette first on ‘believability’ and then second on ‘good to bad’. The respondent finished by completing a short, self-profiling questionnaire, dealing with gender, age, education, income, the nature of how the respondent uses cell phones, and how often. The first part of the study, the evaluation of the 48 vignettes, comprises the ‘experiment.’ The second part of the study, the self-profiling classification, comprises the more traditional questionnaire used in consumer research.

Table 3. The orientation page

Cell phones have been around for 40 years. The cell phone provides many conveniences in our life. Up to 2013 cell phones were considered safe. During the past two years a number of studies have shown links to various issues worldwide associated with cell phones. We want to how YOU feel about some of these benefits and these issues. You will be reading short ‚press releases,‘ comprising several elements. Think of this press release as a totality, as one complete message that you might read somewhere. For each ‚press release‘ please rate the combination on two aspects:

How much do you believe what you read here?

1 = not at all…..9 = totally believe

Overall how much good or bad do you see in this combination?

1 = all good….. 5 = about half good/half bad…..9 = all bad

Table 3. How the 36 elements drive believability (Q#1) & perception of ‘bad for you’ (Q#2)

 Total Panel (n=304 respondents)

Believe

Bad

Additive constant

59

56

Elements that are believed

D2

Cell phones can be dangerous when driving

12

-2

C2

Cell phones let you reach anyone anytime you want

11

-16

D3

Cell phones are so light and portable so you can take them anywhere

9

-11

C6

Cell phones allow you to be reached by friends or family in an emergency

8

-17

Elements that are perceived to be bad for you

E6

People using cell phones for 2000 hours have 240% greater risk for malignant brain tumors

-13

8

D6

Brain cancer is directly linked to the exponential increases in cell phone use and other wireless devices

-14

7

F2

A comprehensive study in Sweden indicates that children and teens are 5 times more likely to get brain cancer if they use cell phones

-25

7

Neither believed nor bad

D5

People with higher peak exposures to cell phone radiation have an 80 percent increase in the risk of miscarriage

-19

6

F5

People have twice the risk of developing the cancer known as “Glioma”, if they use their cell phones for half an hour a day for more than a decade

-24

6

F1

Cell phone radiation has been shown to cause short term memory loss as well as Alzheimer’s

-25

6

D4

Cell phone radiation is a suspected cause in neurological impairments in children including autism

-14

3

F4

Cell phone radiation has been linked to breast cancer in women who carry their phones in their brassieres

-23

3

F6

Over the past two years there’s been a 4-fold increase in malignant tumors of the parotid gland on the same side of the face that cell phone users hold their phone

-24

2

D1

Cell phones emit radiation whenever they’re turned on

-5

1

E1

The manual for every cell phone and smartphone sold in the world instructs users to NOT allow their phones to actually touch their ears!

-13

1

F3

Cell phone radiation has been linked to sterility in males who keep their phones in their front pants pockets

-21

1

E2

All cell phone manuals instruct users to NOT allow their phones to touch their heads!

-11

0

E4

Believe it or not–cell phones have never been safety tested among children and teens

-6

-1

E3

The tests showing cell phones to be safe are based on how people used cell phones 35 years ago–not the way you use them today!

-3

-2

E5

Today you use your cell phones far more frequently than you did in the 1980’s when they were safety tested

5

-4

C5

Cell phones give you the ability to reach anyone in an emergency

2

-10

C7

Cell phones are so versatile that they have become indispensable

6

-12

C3

Cell phones make it easy to work at home

0

-13

B3

Cell phones give your family ability to reach you at any time

-1

-15

C4

Cell phones make it easy to work outside the office

3

-16

A3

Cell phones keep you in touch with your email wherever you go

6

-17

A5

Cell phones let you stay in touch with your child(ren) at all times

2

-18

A2

Cell phones let you stay connected to work

4

-19

B1

Cell phones give you a personal sense of security

4

-19

A4

Cell phones let you text each other whenever you want

3

-19

A1

Cell phones let you stay in touch with your loved ones at all times

2

-19

B5

Cell phones make it easier to pick up your kids from school and school events

1

-19

B2

Cell phones let you to know where your kids are at all times

-1

-19

B4

Cell phones give your kids the ability to reach you whenever they need you

-1

-19

B6

Cell phones make travel easier

-1

-19

C1

Cell phones make it easy to pick up people at the airport

-5

-21

The ratings for each respondent were transformed to a binary scale, with ratings of 1–6 transformed to 0 to denote either not believable, or not bad, and ratings of 7–9 transformed to 100, to denote believable or bad. The transformations are based upon author HRM’s experience with the interpretation of the data. Users of the data, whether scientists, researchers, or managers, report no problem understand NO/YES data, but often experience and report problems with understanding exactly what does the scale ‘mean.’ SS Stevens, Professor of Psychophysics at Harvard University, often stated that ‘understanding the mean of the scales was often difficult …. the most important thing was to divide the scale so that the numbers could be understood without too much explanation’ [19] (Stevens, personal communication to HR Moskowitz, 1968.)

For each respondent, we run an OLS (ordinary least-squares) regression relating the presence/absence of the 36 elements (coded 0/1) to the binary responses (coded 0/100). Before the regression analysis was run, we added a very small random number to each binary response, whether coded 0 or 100, respectively. The small number was less than 10–5. The stratagem of adding a small positive random number ensures that the OLS regression would run, without any problem, but the size of the random number means that it had no virtually no effect on the results.

The OLS regression emerged with an additive constant, k0, and 36 coefficients, one coefficient corresponding to each element for each respondent. The experimental design enables the creation of individual-level models.

The additive constant shows the expected proportion of respondents who, in the absence of any elements in the vignette, would rate the vignette as ‘believable’ (question 1, rating 7–9) or ‘bad’ (question 2, rating 7–9.) The additive constant is a purely estimated parameter, estimated from the pattern of the ratings, but of course a parameter that could never be directly measured. The reason for the appellation of ‘theoretical’ or ‘purely estimated’ is that all vignettes comprised three-four elements, by virtue of the underlying experimental design.

Results

Mind Genomics generates a mass of data, interesting both in terms of the general patterns emerging, but also interesting by virtue of incorporating 36 messages, each of which conveys relevant information. We create an exceptionally large data set in these studies. We look at the mass of data, 36 messages, two response scales (believability, badness), and 304 respondents who can be placed into different subgroups, depending upon how they profile themselves. The analysis considers the highlights of these results.

Total Panel

We begin the analysis by looking at the summary data from out 304 respondents in Table 3. We average the corresponding coefficients from all respondents. The additive constant both for Question #1 (believe) and Question #2 (bad for you) are high, 59 for believable and 56 for bad. Thus, even before we add elements or answers to the vignette, our respondents are telling us that the base level is high for both believe and bad. The issue is whether any of the elements increase believability or increase the perception of bad.

The strongest elements increasing believability are those which are obvious, talking about either fact, or in the case of driving, the outcome of coordinated advertising over a decade or so. The elements increasing the perception of ‘bad’ are those which talk about issues, buttressed by numbers, presented either in numerical form (E6 -2000 hours; F2 – 5 times), or in text form but still numerical (D6 – exponential.)

What is remarkable about these results is the massive range of coefficients for believability, primarily in the negative direction.

The MOST BELIEVABLE elements are obvious, and part of the culture of ‘talking about cellphone.’ They do not talk about the medical issues involved.

  1. Cell phones let you reach anyone anytime you want
  2. Cell phones can be dangerous when driving

The LEAST BELIEVABLE elements talk about what is presented as scientific fact, some with numbers to quantify the assertion.

  1. A comprehensive study in Sweden indicates that children and teens are 5 times more likely to get brain cancer if they use cell phones
  2. Cell phone radiation has been shown to cause short term memory loss as well as Alzheimer’s
  3. People have twice the risk of developing the cancer known as “Glioma”, if they use their cell phones for half an hour a day for more than a decade
  4. Over the past two years there’s been a 4-fold increase in malignant tumors of the parotid gland on the same side of the face that cell phone users hold their phone
  5. Cell phone radiation has been linked to breast cancer in women who carry their phones in their brassieres
  6. Cell phone radiation has been linked to sterility in males who keep their phones in their front pants pockets

The LEAST BAD elements were the obvious ones, namely statements about the cell phone helps daily living.

The MOST BAD elements were those about the implication of the cell phone in causing disease, elements that at the same time were considered least believable. A comprehensive study in Sweden indicates that children and teens are 5 times more likely to get brain cancer if they use cell phones

  1. Brain cancer is directly linked to the exponential increases in cell phone use and other wireless devices
  2. People using cell phones for 2000 hours have 240% greater risk for malignant brain tumors

Respondents clearly differentiate between believability and the badness of the effect.

Gender differences

There are differences between males and females. Table 4 compares the coefficients for the genders.

Table 4. Gender. How the strongest performing elements drive believability (Q#1) and bad (Q#2)

Male

Fem

Base size

159

145

Additive constant – Believable

58

59

D3

Cell phones are so light and portable so you can take them anywhere

12

6

D2

Cell phones can be dangerous when driving

10

14

C6

Cell phones allow you to be reached by friends or family in an emergency

10

5

C2

Cell phones let you reach anyone anytime you want

9

12

A2

Cell phones let you stay connected to work

1

8

Additive constant – Bad

57

55

E6

People using cell phones for 2000 hours have 240% greater risk for malignant brain tumors

11

4

D6

Brain cancer is directly linked to the exponential increases in cell phone use and other wireless devices

10

5

F1

Cell phone radiation has been shown to cause short term memory loss as well as Alzheimer’s

8

3

F2

A comprehensive study in Sweden indicates that children and teens are 5 times more likely to get brain cancer if they use cell phones

5

8

D5

People with higher peak exposures to cell phone radiation have an 80 percent increase in the risk of miscarriage

5

8

Table 5. Age. How the strongest performing elements drive believability (Q#1) and bad (Q#2)

Age 25–34

Age 45–54

Base Size

142

33

Additive Constant – Believable

50

77

D3

Cell phones are so light and portable so you can take them anywhere

12

-2

C6

Cell phones allow you to be reached by friends or family in an emergency

11

7

D2

Cell phones can be dangerous when driving

11

5

C2

Cell phones let you reach anyone anytime you want

10

15

A3

Cell phones keep you in touch with your email wherever you go

10

8

A2

Cell phones let you stay connected to work

3

9

B1

Cell phones give you a personal sense of security

5

8

Additive Constant – Bad

54

49

D6

Brain cancer is directly linked to the exponential increases in cell phone use and other wireless devices

10

17

E6

People using cell phones for 2000 hours have 240% greater risk for malignant brain tumors

9

3

F1

Cell phone radiation has been shown to cause short term memory loss as well as Alzheimer’s

4

15

Table 6. Use Pattern. How the strongest performing elements drive believability (Q#1) and bad (Q#2)

Believe – Call versus Play for 1–2 hours

Call

Play

Base

43

64

Additive

68

45

A2

Cell phones let you stay connected to work

8

11

B5

Cell phones make it easier to pick up your kids from school and school events

8

1

C2

Cell phones let you reach anyone anytime you want

4

16

D2

Cell phones can be dangerous when driving

7

13

E5

Today you use your cell phones far more frequently than you did in the 1980’s when they were safety tested

7

13

D3

Cell phones are so light and portable so you can take them anywhere

1

12

C6

Cell phones allow you to be reached by friends or family in an emergency

1

11

A4

Cell phones let you text each other whenever you want

1

10

A3

Cell phones keep you in touch with your email wherever you go

5

9

A1

Cell phones let you stay in touch with your loved ones at all times

1

8

Believe – Call versus Play for 1–2 hours

Call

Play

Base

43

64

Additive constant

46

24

F1

Cell phone radiation has been shown to cause short term memory loss as well as Alzheimer’s

12

16

D2

Cell phones can be dangerous when driving

11

9

D4

Cell phone radiation is a suspected cause in neurological impairments in children including autism

10

15

F2

A comprehensive study in Sweden indicates that children and teens are 5 times more likely to get brain cancer if they use cell phones

9

21

E6

People using cell phones for 2000 hours have 240% greater risk for malignant brain tumors

9

24

D6

Brain cancer is directly linked to the exponential increases in cell phone use and other wireless devices

6

17

F6

Over the past two years there’s been a 4-fold increase in malignant tumors of the parotid gland on the same side of the face that cell phone users hold their phone

6

16

F3

Cell phone radiation has been linked to sterility in males who keep their phones in their front pants pockets

-1

13

D5

People with higher peak exposures to cell phone radiation have an 80 percent increase in the risk of miscarriage

6

13

E1

The manual for every cell phone and smartphone sold in the world instructs users to NOT allow their phones to actually touch their ears!

1

10

D1

Cell phones emit radiation whenever they’re turned on

0

9

F5

People have twice the risk of developing the cancer known as “Glioma”, if they use their cell phones for half an hour a day for more than a decade

7

9

F4

Cell phone radiation has been linked to breast cancer in women who carry their phones in their brassieres

2

9

E3

The tests showing cell phones to be safe are based on how people used cell phones 35 years ago–not the way you use them today!

1

8

E4

Believe it or not–cell phones have never been safety tested among children and teens

7

8

Regarding BELIEVE

  1. Both show virtually the same additive constant for believable (58–59)
  2. Both believe the message about cell phones being dangerous while driving
  3. Males believe messages which communicate the functionality of the phone
  4. Females believe messages communicating about staying in touch
  5. However, the groups do not differ dramatically in what they perceived to be very believable. It’s a matter of degree

Regarding BAD

  1. Males respond more strongly in terms of ‘BAD’ for messages about the link between cell phones and brain cancer.
  2. Females respond more strongly in terms of ‘BAD’ for messages about miscarriages, and problems that children and teens may encounter.

Age Differences

We compare two different age groups, the larger younger group (ages 25–34) and the smaller older group (age 45–54). Neither of these groups is near retirement.

Regarding BELIEVE

  1. There are radical differences between the ages. The younger respondents are fundamentally more skeptical than the older respondents. The additive constant for the younger respondents is 50, the additive constant for the older respondents is 77. This is not due to base size, but rather to fundamental differences in the way that the groups respond to information.
  2. The younger respondents show greater differentiation in what they believe. We see this from the wide spread of the coefficients, wider for the younger respondents, narrower for the older respondents.
  3. Younger respondents believe strongly in statements about the general portability and usefulness of phones.
  4. Older respondents feel that the phone lets them ‘stay in touch’ with work

Regarding BAD

  1. The additive constants are approximately equal for the younger and the older respondents.
  2. Younger respondents feel that the messages about brain tumors are especially bad
  3. Older respondents feel that memory loss is bad, a more reasonable fear as a person gets older, because memory loss is common among older people.

Patterns of use – calling versus playing, 1–2 hours / week

Regarding BELIEVE

  1. Those who identify themselves as calling for 1–2 hours/week show a higher additive constant than those who identify themselves as playing for 1–2 hours/week. These are not mutually exclusive groups. We might conclude that those who use the cell phone for playing tend to ‘deny’ more, i.e., ‘believe’ less
  2. Those who use the cell phone for calling respond most strongly as the way to keep in contact.
  3. Those who use the cell phone for calling do not believe, quite as much, that cell phones can be dangerous when driving.
  4. Those who use the cell phone for play believe strongly in the phone letting them stay connected to work, and believe far more strongly that the cell phone simply lets them stay in touch.

Regarding BAD

  1. Those who use the cell phone for calling feel more strongly, at a base level, that the cell phone has bad aspects (additive constant = 46 for those who call, versus additive constant = 24 for those who play.)
  2. Both groups respond strongly to these five elements which are BAD

    Cell phone radiation has been shown to cause short term memory loss as well as Alzheimer’s

    Cell phones can be dangerous when driving

    Cell phone radiation is a suspected cause in neurological impairments in children including autism

    A comprehensive study in Sweden indicates that children and teens are 5 times more likely to get brain cancer if they use cell phones

    People using cell phones for 2000 hours have 240% greater risk for malignant brain tumors

The two mind-sets based upon the coefficients for ‘believe’

One of the major underlying premises of this emerging science of Mind Genomics is that within any topic involving subjective judgment, people will differ from each other. We see such differences in the previous data tables, which clearly revealed that there are substantial differences in the messages that people believe, and the messages that they think are ‘bad.’ Inter-individuals appear to be random, however. There are some patterns, but often we have to ‘strain’ to discern the reason for the differences between mutually exhaustive, complementary groups, such as genders, the pattern of responses of males versus the pattern of responses versus females.

For Mind Genomics, the objective is to create a set of complementary, exhaustive groups, which show different patterns, these patterns in turn telling clearly different ‘stories.’ These groups are called Mind-Sets, or mental genomes. They are created through the class of statistical methods know as cluster analysis.

In simple terms, we follow these straightforward steps, to uncover the underlying Mind-Sets. The objective is to uncover a small number of such clusters or Mind-Sets, with the property that the pattern the coefficients ‘tell a story.’ The ideal is to end up with one mind-set, meaning everyone thinks alike, but that is almost unknown, except for one instance, an unpublished study by author HRM and colleagues on the response to ‘murder’ as a crime. The typical result is two or three mind-sets, few enough to be considered parsimonious. These mind-sets respond in ways that are clearly different, and which do seem to tell a simple story.

The steps to uncover the Mind-Sets follow this sequence:

  1. Create an individual model for each respondent relating the presence/absence of the 36 elements to the responses. In our case, the response is the binary transformation of Question #1, Believable, with ratings of 1–6 transformed to 0, and ratings of 7–9 transformed to 100. The underlying experimental design, used to create the 48 vignettes for each respondent, allow us to create the individual-level model, especially since we ensure that the OLS regression works by adding a very small random number to each transposed value, 0 or 100, respectively.
  2. Cluster the respondents using the pattern of their 36 coefficients for the first question, ‘BELIEVE.’ We could have just as easily clustered using the coefficients for the second question, ‘BAD.’ Clustering is a well-accepted statistical procedure, comprises a suite of different methods, all of which are really ‘heuristics,’ to uncover new patterns in the data. No one clustering method is ‘better’ than another in a mathematical sense. For this study, we used the method of k-means clustering.
  3. We extracted two clusters, really mind-sets, comprising two patterns. The patterns ‘make intuitive sense.’

Table 7 shows the strongest performing elements for the two Mind-Set segments, based on BELIEVE.

Table 7. Mind-Sets. How the strongest performing elements drive believability (Q#1)

Segmentation based upon responses to Question #1: Believe

Mind-Set 1

Mind-Set 2

Base

119

185

Additive constant

68

53

Both mind-sets – believe that cell phones make like easier

C2

Cell phones let you reach anyone anytime you want

12

10

Mind-Set 1 – Focus on work

C4

Cell phones make it easy to work outside the office

8

0

Mind-Set 2 – Focus on security and safety

D2

Cell phones can be dangerous when driving

4

17

E5

Today you use your cell phones far more frequently than you did in the 1980’s when they were safety tested

-9

14

D3

Cell phones are so light and portable so you can take them anywhere

5

12

B1

Cell phones give you a personal sense of security

-5

10

A3

Cell phones keep you in touch with your email wherever you go

1

10

C6

Cell phones allow you to be reached by friends or family in an emergency

7

8

  1. The two mind-sets differ both in the additive constant and in the patterns of the strong performing elements.
  2. Both Mind-Sets believe strongly on one very obviously element, C2, Cell phones let you reach anyone anytime you want
  3. Mind-Set 1 focuses on work. Mind-Set 1 has a higher additive coefficient, 68, meaning that it responds to one element most strongly, C4, Cell phones make it easy to work outside the office.
  4. Mind-Set 2 focuses on security and safety. Mind-Set 2 begins with a slightly lower additive constant, 53, but responds strongly to six elements, the strongest being D2, Cell phones can be dangerous when driving. Surprisingly, for Mind-Set 1, this element, so well-drilled into people’s minds by the traffic authorities, is not particularly believable, with an additive constant of 4. The reason might be because Mind-Set 1 already believes a lot, with an additive constant of 68, so this is just another element on top of a basically high proclivity to believe.
  5. The strongest messaging to create awareness of risk among people in the Mind-Set 1 is that smartphones usage is directly linked to brain tumors. The strongest messaging to create awareness among people in Mind-Set 2 is that the use of smartphones increases the risk for brain tumors in children and teens by five times, that 2000 hours of exposure to smartphones increases the risk for malignant brain tumors by 240% , and the risk for miscarriage by 80 percent.

Discovering these Mind-Sets in the population

In the world of advertising, most advertisers buy advertising on the basis of WHO THE CUSTOMER IS. Marketers have come to the realization that it is not a question of WHO, but rather a question of WHAT the customer thinks. Unfortunately, for most research there is no easy, affordable, scalable allowing advertisers to know exactly the message which will resonate with the members of the audience.

In the world of commerce the failure to know the ‘hot buttons’ or persuasive messages resonating with an individual consumer is simply an endemic, well-accepted cost of doing business. Knowing that a person may or may note resonate to a particular message about a car, a toothbrush, a candy is simply a ‘given’, and not something which worries economists and those tasked with the welfare of a nation. On the other hand, when the issue comes to matters of health, and especially with widespread products such as smartphones, this lack of knowledge is problematic.

The answer to knowing the mind of a person can be operationally redefined as assigning a ‘new person’ as a member of a mind-set segment. This ability to assign a new person to a mind-set allows the health authorities and others with feelings of social responsibility to send the ‘right message to the right person.’ Sadly, however, membership in the mind-set is not a simple function of WHO A PERSON IS.

An alternative is the PVI, the personal viewpoint identifier. The experiment presented in this study provides the necessary messages to differentiate the two mind-sets. What is necessary is a set of questions, emerging from the study, which best differentiate people in the mind-sets. That is, the ideal is to provide a person with a set of, say, six questions, as shown in Figure 1. These are the questions which best differentiate between the segments. The pattern of responses to the six questions on the 2-point scale assigns the new person to one of the two mind-sets. Figure 1 shows the actual questionnaire, and an example of the feedback. The respondent completes the PVI, provides an email, and the information returns, either to the respondent who is being typed, and/or to the group doing the messaging. The PVI is set up to request additional information, so one can use the PVI to understand the distribution of the mind-sets in the populations.

Mind Genomics-009 CST Journal_f1

Figure 1. The PVI (personal viewpoint identifier) to assign a new person to one of the two specific mind-sets uncovered in this study. The web link as of this writing (2019) is http: //162.243.165.37: 3838/TT15/

Discussion and Conclusion

In this study we identified communication messaging aimed at creating awareness to health risks in usage of smartphones. We revealed two mind-set segments and illustrated how to use our viewpoint identifier tool to easily learn the belonging of a person in the population to one of the mind-set segments.

All respondents believed the use of smartphones is essential for communication. People belonging to the first mind-set segment believe smartphones should serve only for work purposes. The strongest message regarding risk was that smartphones usage is directly linked to brain tumors. People belonging to the second mind-set segment perceive smartphones as dangerous when driving but increase one’s sense of security outside of driving. Strong messages regarding risks of smartphone usage are that it holds a five times greater risk of brain cancer for children and teens; it exposed the user to a 240 percent higher risk for malignant brain tumors upon usage of 2000 hours; and for females higher peak exposures to smartphone radiation, will increase the risk of miscarriage by 80 percent.

The epidemic of cancer and rising expenditures of healthcare by governments and individuals calls for the use of insights of our study, and to extend this study to other aspects involved in the wide-use of smartphones. Messages on risks of smartphone usage may be adopted by social movements which promote a “no cellphone day” campaigns, encouraging people to detach from their smartphones for a certain time period. Health prevention programs may also integrate this messaging with their additional efforts. The Mind Genomics efforts are quick, iterative, knowledge-producing, and scalable, as well as providing follow-on application using the PVI.

Acknowledgement

Attila Gere thanks the support of the Premium Postdoctoral Research Program of the Hungarian Academy of Sciences.

References

  1. Ali AI, Papakie MR, McDevitt T (2012) Dealing with the distractions of cell phone misuse/use in the classroom-a case example. In Competition Forum. American Society for Competitiveness 1: 220.
  2. Dubey RB, Hanmandlu M, Gupta SK (2010) Risk of brain tumors from wireless phone use. J Comput Assist Tomogr 34: 799–807. [crossref]
  3. Hours M, Bernard M, Montestrucq L, Arslan M, Bergeret A, et al. (2007) Smartphones and Risk of brain and acoustic nerve tumours: the French INTERPHONE case-control study. Revue d’Epidemiologie et de Sante Publique 55: 321–332.
  4. Obringer SJ, Coffey K (2007) Cell phones in American high schools: A national survey. Journal of Technology Studies 33: 41–47.
  5. Horrey WJ, Wickens CD (2006) Examining the impact of cell phone conversations on driving using meta-analytic techniques. Human Factors 48: 196–205.
  6. Repacholi MH (2001) Health risks from the use of mobile phones. Toxicol Lett 120: 323–331. [crossref]
  7. Gustafsson E, Thomée S, Grimby-Ekman A, Hagberg M (2017) Texting on mobile phones and musculoskeletal disorders in young adults: a five-year cohort study. Applied Ergonomics 58: 208–214.
  8. Volkow ND, Tomasi D, Wang GJ, Vaska, P, Fowler JS, et al. (2011) Effects of smartphone radiofrequency signal exposure on brain glucose metabolism. Journal of the American Medical Association 305: 808–813.
  9. Wolf R, Wolf D (2004) Increased incidence of cancer near a cell-phone transmitter station. International Journal of Cancer 1: 123–128.
  10. Hardell L, Sage C (2008) Biological effects from electromagnetic field exposure and public exposure standards. Biomedicine & Pharmacotherapy 62: 104–109.
  11. Jenaro C, Flores N, Gómez-Vela M, González-Gil F, Caballo C (2007) Problematic internet and cell-phone use: Psychological, behavioral, and health correlates. Addiction Research & Theory 15: 309–320.
  12. Thomée S, Härenstam A, Hagberg M (2011) Mobile phone use and stress, sleep disturbances, and symptoms of depression among young adults-a prospective cohort study. BMC Public Health 11: 66.
  13. Brown JD, Bobkowski PS (2011) Older and newer media: Patterns of use and effects on adolescents’ health and well-being. Journal of Research on Adolescence 21: 95–113.
  14. Khurana VG, Teo C, Kundi M, Hardell L, Carlberg M (2009) Cell phones and brain tumors: a review including the long-term epidemiologic data. Surg Neurol 72: 205–214. [crossref]
  15. Shakir IA, Patel NH, Chamberland RR, Kaar SG (2015) Investigation of smartphones as a potential source of bacterial contamination in the operating room. Journal of Bone and Joint Surgery 97: 225–231.
  16. Grazioli S, Carrell R (2002) Exploding phones and dangerous bananas: perceived precision and believability of deceptive messages found on the internet. AMCIS 2002 Proceedings, 271.
  17. Zarefsky D, Bizzarri N, Rodriguez S (2005) Argumentation: The study of effective reasoning. Teaching Company.
  18. Gofman A, Moskowitz H (2010) Isomorphic permuted experimental designs and their application in conjoint analysis. Journal of Sensory Studies 25: 127–145.
  19. Stevens TH, Barrett C, Willis CE (1997) Conjoint analysis of groundwater protection programs. Agricultural and Resource Economics Review 26: 229–236.

Expectations and Attitudes Regarding Chronic Pain Control: An Exploration Using Mind Genomics

DOI: 10.31038/IMROJ.2019412

Abstract

We present the emerging science of Mind Genomics, to understand people’s responses to health-related issues, specifically pain. Mind Genomics emerge out of short, affordable, scalable, east-to-run experiments. The topic, here pain, is deconstructed into four questions, each with four separate answers (elements.) The answers are combined into vignettes, presented to respondents, who rate the entire vignette. Emerging from the study are the ratings and the response times to the vignettes, both of which are deconstructed into the contributions of the different underlying elements which the vignettes comprise. The answers cannot be gamed, and the data quickly reveal what is important to the individual, as well as revealing the existence of new-to-the-world mind-sets which differ in the pattern of elements that they find important. Mind Genomics  provides the opportunity to understand the person’s needs and wants for specific health as well as other experiential situations where human judgment is relevant.

Introduction

Pain is an inevitable companion in our life’s journey. Pain is defined through its association with actual or potential tissue damage, denoting it as a necessary characteristic of the experience, but also recognizing that events other than tissue damage can serve as determinants, consistent with a bio psychosocial model of pain [1,2]. This definition of pain denotes multiple causal factors underlying pain, beyond the issue pathology.

There is no dearth of studies on pain, whether these studies are report of pain from one’s everyday life [3], a topic dealt with in medicine [4], and a topic of scientific investigation [5]. When we talk about pain, can we probe into the mind of the person beyond simply the report, beyond a simplistic scale? Can we move beyond simple indicators, approaching a more detailed description of one’s pain but yet not forcing the respondent to become a scientist?

Pain, a highly subjective phenomenon, often refers to a sensory experience resulting from actual damage to the body or from non-bodily damage [6]. Pain may be influenced by psychological mechanisms such as: attention, emotion, beliefs and expectations [7].

In general, there are two different classifications of physical pain, visceral and somatic. Visceral pain originates in the internal organs whereas somatic pain stems from skin, muscle, soft tissue, and bone. There are many types of pain which fall under these categories. A person’s pain can also be classified as acute or chronic. Pain can be described as nerve pain, psychogenic pain, muscle pain, abdominal pain, back pain, pelvic pain, etc.

Subjective pain is influenced by its intensity and by interventions to treat the pain. Expectations and attitudes towards pain, may stem from psychological processes that are fundamental to learning across various sensory experiences and affect. Understanding expectations and attitudes towards pain may help us form communication messaging to help individuals deal more effectively with their chronic pain.

The subjective nature of pain makes it difficult to test the actual nature of perceived pain across populations, within a country, and in different countries. There are accepted methods of testing the actual perception of pain, specifically pain thresholds and pain tolerance, as well as psychophysical scaling of pain. One example is measuring the time one can submerge a limb in an ice bath, to test the ability of subjects to tolerate pain under varying conditions, most notable with the testing of analgesics of anesthetics. These methods give a measure of the all-or-none response to pain, and even the qualitative nature of the pain, but do not give a sense of the mind of the person who is undergoing the pain.

Increase in pain accompanies one’s beliefs that a certain treatment will cause pain or increase one’s symptoms overtime [7]. Negative beliefs regarding pain and its effects may occur in some types of chronic pains. To test whether expectations affect pain, studies tested the extent to which expectations influenced physiological responses among individuals. Placebo treatments truly reduced pain intensity [8–12]. These studies also indicated that short-term expectations varied and strongly affected perceptions of pain and pain-evoked responses [13].

Other studies linked differences in expectations regarding pain to the magnitude of responses to pain treatments [14]. Research on the relationship between expectations and pain experiences, showed that expectations about treatments and painful stimuli profoundly influenced behavioral markers of pain perception [7].

Pain treatments also bring positive changes in negative emotions [15]. Expectations affect pain through attention, executive functioning, value learning, anxiety and negative emotions [16]. Attitudes towards pain such as anxiety raised subjective pain. Pain is, thus a complex experience, involving sensory, motivational, and cognitive components. Affect any one of these components may change one’s attitudes towards pain [7].

Whereas studies indicate that beliefs influenced pain experience, it is unclear to what extent psychological processes such as attention, anxiety and emotions affect choice of treatments and what communication messages may mediate the effects of these psychological processes. This study tests communication messaging that affect emotion, attitudes towards pain and choice of treatment for pain.

In his book, Pain: The Gift Nobody Wants, author Paul Brand, MD describes his observations across cultures. Growing up as the child of missionaries in India and then moving to the US, Brand noted the difference in pain and suffering that existed in the East versus the West. He noted that, “as a society gained the ability to limit suffering, it lost the ability to cope with what suffering remains”. He stated that he believed that Easterners have learned to control pain at the level of the mind and spirit whereas, Westerners tend to view pain and suffering as an injustice or failure and an infringement on their right to happiness [17].

In the newly developing science of Mind Genomics we attempt to demonstrate a richer understanding of one’s inner life by presenting the respondent (or ill/healthy pain sufferer, here) with vignettes describing the inner experience, instructing the respondent to rate the fit of the vignettes, one at a time, and then estimating the degree to which each of the elements of the vignette ‘fits’ the respondent.

Method

Mind Genomics as an emerging science has been previously presented [18]. Mind Genomics works by presenting respondents with vignettes, combinations of statements which together tell a story. The respondent is instructed to judge the vignette, rating the vignette as a totality. The rating scale for this study is simply ‘How well does this describe you?’

The statements, elements in the language of Mind Genomics, present simple ideas. The approach requires the construction of four questions which ‘tell a story.’ For each question, the researcher is required to provide four answers, all expressed in simple language.  Table 1 presents the four questions, and the four answers to each question. Ideally, the questions and answers should deal with the topic, here pain, but need not mention pain directly. Rather, the questions and answers should be relevant to the topic.

Table 1. The four questions and the four answers to each question.

Question A: how would you describe the nature of pain you are feeling?

Pain bothers me all over my body

The pain is localized but intolerable

The pain radiates and makes it difficult to function

The pain is minor but frequent and annoying

Question B: Describe a situation that would make you feel more comfortable

The doctor explains to me how to deal with the pain

I try to deal with the pain to work through it

I’m happy when I can use a device that delivers therapeutic solution

I just like taking a pill that deals with the pain.

Question C: Describe how would you like to to avoid future pain

I would like to have a diet that is tailored to reduce my pain

I would like exercises and stretches that reduce pain

I would like regular therapy sessions to reduce my pain

I would like a prescription that gives me the medication I need to feel better

Question D: Describe what you would like the doctor to do

The doctor should give me advice

The doctor should give me a shot that delivers long term relief

The doctor should set me up with a system for me to follow

The doctor should give me a regular schedule of visits to treat my pain

The answers in Table 1 are combined by experimental design into a set of 24 vignettes, with each vignette comprising 2–4 elements. Table 2 shows an example of the first six vignettes. The elements appear an equal number of times. Each of the 16 elements is, by design, statistically independent of every other element.

Table 2. The first seven vignettes for the first respondent, created by the experimental design. The table shows the combinations, then the combinations transformed into binary, and then the ratings.

Vig1

Vig2

Vig3

Vig4

Vig5

Vig6

Vig7

A

4

0

4

3

1

0

0

B

3

2

1

2

1

1

3

C

4

2

0

0

4

4

3

D

2

3

4

0

3

1

4

Binary

A1

0

0

0

0

1

0

0

A2

0

0

0

0

0

0

0

A3

0

0

0

1

0

0

0

A4

1

0

1

0

0

0

0

B1

0

0

1

0

1

1

0

B2

0

1

0

1

0

0

0

B3

1

0

0

0

0

0

1

B4

0

0

0

0

0

0

0

C1

0

0

0

0

0

0

0

C2

0

1

0

0

0

0

0

C3

0

0

0

0

0

0

1

C4

1

0

0

0

1

1

0

D1

0

0

0

0

0

1

0

D2

1

0

0

0

0

0

0

D3

0

1

0

0

1

0

0

D4

0

0

1

0

0

0

1

Rating

7

8

4

7

9

7

9

Binary

100

100

0

100

100

100

100

RT (response time) in seconds

10

6

9

6

10

8

7

Each respondent evaluates a unique set of 24 vignettes. The underlying mathematical structure of the experimental design is maintained, but the specific combinations are changed, in a permutation scheme which preserves the mathematical properties of the design [19]. The permutation covers many more combinations of elements compared to the standard approach of creating one experimental design and presenting that design to many respondents.  The Mind Genomics achieves stability by testing many combinations, each a single time, but the expanded coverage ensures that a great of the ‘space of combinations’ is covered. It is difficult to be very ‘wrong’ with a Mind Genomics study because the scope. In contrast, traditional research works with a very small experimental design, e.g., equivalent to the combinations tested by one person, but the combinations are tested by many respondents in order to obtain a stable estimate of the value for each combination.

Mind Genomics and traditional statistics are on opposite sides in terms of what generates valid data. Is valid data obtained by sampling a few of the many possible combinations, albeit with stability for each point (traditional), or by sampling a great many of the combinations, albeit with less stability at any point. A good analogy to Mind Genomics is, metaphorically, the MRI, which discovers the configuration of tissue by taking different ‘snapshots’ and integrating them into one picture.  With the permuted experimental one need not ‘be sure’ that the limited number of combinations is the correct set to represent the total set of possible alternatives. With as few as 25 respondents, the number of respondents participating, generating a total of 720 different combinations has covered the space quite well.

Running the Mind Genomics experiment

The experiment is run on the web, typically with respondents from a specific population who have agreed to participate (e.g., those being treated for a condition), or more typically with respondents recruited from the general population, when the objective is a quick ‘scan’ of what is important.  The base sizes of these studies range from 25 for an exploration to 500 for a massive deconstruction of the population into different mind-sets.  The more typical base size of 25–50 respondents reveals quite a bit about the nature of people’s minds with regard to a particular issue.  This study shows the type of learning emerging from this small base size of respondents from the general population, and can be followed with many different studies to follow up on various interesting aspects.

The elements, answers to the questions, are created by experimental design [20]. The 16 elements are combined into 24 combinations or vignettes, similar in structure to the vignettes shown schematically in Table 2. The vignette can be presented on smartphones, tablets, or PC’s.

Although the respondent might feel that the vignettes are created in a random fashion, the reality is just the opposite. The vignettes are created within the framework of the design, which prescribe the exact combinations. The elements are placed one atop the other, centered, without any connectives, making the respondent’s task easier as the respondent ‘grazes for information’.

The experimental design ensures that the elements are statistically independent; appear several times against different backgrounds provided by the other elements in the vignette. Each respondent evaluates a unique set of 24 vignettes, permuted as noted above, so that the design structure is maintained but the specific combinations are new. The permutation system allows a great deal of the design space, or combinations, to be tested, and allows the information to emerge even when the researcher has absolutely no idea what will be important and what won’t. In other words, Mind Genomics is a discovery system, and not a confirmation system. One can learn quickly from a base of zero knowledge, simply by doing 1–4 easy studies of different facets of a topic.

The respondents who participated were US residents, members of a 10+ million world-wide panel of Luc.id Inc., who had previously agreed to participate in these studies for a reward administered by the panel provider. All respondents participated anonymously. The only information about the respondent was age, gender, and the answer to the third question about what type of pain they had.  There were five answers to the third question, three dealing with chronic pain of various sorts, and two saying either ‘no pain,’ or ‘not applicable.’  All respondents were classified by gender, age, and by either pain/yes versus pain/no.

Preparing the data for analysis

The respondent assigns a rating to assess ‘How much does this describe how you feel’. The low anchor, 1, is ‘not at all.’ The high anchor, 9, is ‘very much.’ The Mind Genomics program bifurcates the scale, dividing it into the lower part, ratings of 1–6, transformed to 0, plus a very small random number (<10–5), and a high part, ratings of 7–9, transformed to 100, plus a very small random number. The bifurcation comes from the decades of experience which suggest that managers and scientists alike do not ‘understand’ the meaning or use of the Likert or category scale, but they easily understand the meaning of a no/yes, binary scale.  The choice of where to bifurcate is left to the researcher. Thirty-five years of experiments suggest that a 2/3 vs 1/3 division seems to work well.  The small random number added to the binary transformed data ensures that when it is time to run the OLS (ordinary least-squares) regression on the data at the level of the individual respondent, there will not be a ‘crash’ of the regression program when the respondent confined the ratings to either the low range (1–6) or to the high range (7–9.) Either of those two cases produces all 0’s or all 1’s, crashing the regression. The small random number ensures that there is variability in the dependent variable, the binary transformed data.

How the different elements drive the binary transformed rating

Table 3 shows the parameters and relevant statistics for the additive model created from the ratings of the total panel, after transformation to a binary scale. The model itself is a simple linear equation of the form: Binary Rating = k0 + k1(A1) + k2(A2) … K16(D4). The experimental design allows us to create the model either at the level of the individual respondent or at the grand level, combining all of the data from the ‘relevant’ respondents, with relevant being

Table 3. Parameters of the model for ‘Fits Me’ after binary transformation. The data come from the Total Panel (720 observations, 24 tested vignettes from each of 30 respondents.) The table is sorted in descending order of coefficient for ‘describes me.’ At the right is the associated coefficient for response time.


Coeff Desc.

T-stat

P-Value

Coeff RT

Additive constant

46

4.68

0.00

C2

I would like exercises and stretches that reduce pain

6

0.95

0.34

0.9

D3

The doctor should set me up with a system for me to follow

2

0.39

0.69

2.1

B2

I try to deal with the pain to work through it

2

0.39

0.70

1.9

A1

Pain bothers me all over my body

1

0.23

0.82

1.3

A3

The pain radiates and makes it difficult to function

0

0.05

0.96

1.6

C3

I would like regular therapy sessions to reduce my pain

-2

-0.28

0.78

1.7

D2

The doctor should give me a shot that delivers long term relief

-3

-0.53

0.59

1.8

D4

The doctor should give me a regular schedule of visits to treat my pain

-3

-0.58

0.56

1.7

B3

I’m happy when I can use a device that delivers therapeutic solution

-4

-0.65

0.52

2.1

D1

The doctor should give me advice

-4

-0.69

0.49

1.5

B1

The doctor explains to me how to deal with the pain

-4

-0.73

0.47

1.8

A4

The pain is minor but frequent and annoying

-5

-0.90

0.37

2.1

A2

The pain is localized but intolerable

-6

-0.95

0.34

1.2

C4

I would like a prescription that gives me the medication I need to feel better

-7

-1.19

0.24

1.4

C1

I would like to have a diet that is tailored to reduce my pain

-7

-1.22

0.22

1.4

B4

I just like taking a pill that deals with the pain.

-8

-1.35

0.18

1.6

The analysis suggests the following:

  1. Additive constant, the expected binary value in the absence of elements: Without any elements, the likely response that the vignette will ‘describe me’ is about 46%. By design, all vignettes comprised 2–4 elements, so the additive constant is an estimated parameter.  Thus, the value of 46 for additive constant says that half the time respondents will answer that whatever appears will describe them. It is the elements which must do the work to move beyond this almost 50% agreement rate. It is worthwhile commenting here that this baseline of 46% is modest. When the topic is credit cards and the rating is ‘interested in acquiring this credit card,’ the additive constant plummets to about 10–15. When the topic is pizza and the rating is ‘interested in eating this pizza,’ the additive constant skyrockets to 60–70.
  2. There are no very strong elements for the total panel: That is, no element drives the description of ‘me.’ This weakness can either be the result of choosing the wrong elements, or the result of dealing with two or perhaps even three or more different populations, who describe their impressions by different terms, and who may live in quite different worlds of pain.
  3. The highest scoring element is C2, I would like exercises and stretches that reduce pain. This element generates a coefficient of only 6, and has a t-statistic of 0.95, with a probability of 0.34 that it came from a distribution with a true mean of 0. That is, it’s quite likely that were we to do this study again, we would come up with a coefficient much lower than 6, probably 0 or thereabouts.
  4. The remaining elements do not ‘fit’ the respondent:  It may well be that the elements are simply incorrect and others will fit the respondent better, or more likely that we are dealing with a segmented population of individuals, some of whom feel that an element ‘fits them,’ whereas others feel that the same element ‘does not fit them.’ In such a situation the responses cancel each other, and we are left with a coefficient around 0, denoting ‘no fit.’

Key subgroups

We know three additional things about the respondent based upon the self-profiling questions completed during the study. The first is gender, the second is age, and the third is whether or not they suffer pain on a regular basis. In this computerized application, the respondent is required to select one of two genders (male/female), and required to put in the year of birth, which provides age.  The third question is left to the discretion of the researcher. In this study is the selection of pain, with five options. Two options are defined as ‘no pain’ (actual selection of ‘no pain’ as an answer, selection of not applicable). The remaining three options as pain (i.e. pain in the limbs, back, etc.).  We will look at gender, age, and self-reported pain as the three self-defined subgroups. We will also explore two new subgroups, mind-sets inherent in the population but revealed by understanding patterns of responses, behavioral patterns, rather than self-classification.

The focus of interest in Mind Genomics studies is on the additive constant as the ‘baseline,’ and then on the ‘story’ told by the winning elements.  These elements are operationally defined as having a value of +6.51 or higher, which becomes 7 when rounded to the nearest whole number.

Gender

  1. Males show a higher additive constant than do females (57 vs 38). In the absence of elements, men are more likely to say that a vignette ‘describes ME.’  Women are less likely to say that, and require more specification.
  2. We get a good sense of what is important by looking at the elements which are most positive (most like me), and most negative (least like me)
  3. For men, the single phrase which most describes them is

    C2: I would like exercises and stretches that reduce pain

  4. For men, the single phrase which least describes them is

    C1: I would like to have a diet that is tailored to reduce my pain

  5. For women, the two phrases phrase which most describe them are

    B2: I try to deal with the pain to work through it,

    A1: Pain bothers me all over my body. The degree of fit is less, however, for these elements than the corresponding best fits for males.

  6. For women, the phrase which least describes them is

    B4: I just like taking a pill that deals with the pain.

Age: Under 50 versus 50+

Respondents provided the year of their birth. One respondent did not provide the year and was eliminated from this particular analysis by age.

  1. Surprisingly, the additive constant is much higher for the younger respondents versus the for the older respondents (48 vs 31.)
  2. For the younger respondents, there are no strong elements which fit them. The two elements which most describe them are those which suggest control over the pain:

    C2: I would like exercises and stretches that reduce pain

    D3: The doctor should set me up with a system for me to follow

  3. For the younger respondents, the two elements which least describe them are those which suggest passivity, and no control over the pain.

    B1: The doctor explains to me how to deal with the pain

    B4: I just like taking a pill that deals with the pain.

  4. For the older respondents, the two elements which most describe them are actual experience to reduce the pain, as well as a description of the experience.

    A3: The pain radiates and makes it difficult to function

    C2: I would like exercises and stretches that reduce pain

  5. For the older respondents, the three elements which least describe them is passivity

    D1: The doctor should give me advice

    C4: I would like a prescription that gives me the medication I need to feel better

    C1: I would like to have a diet that is tailored to reduce my pain

No pain versus pain

As part of the self-profiling classification, the respondents selected the type of pain, if any, afflicting them. The respondents who check any of the three types of pain assigned to the group saying YES. The remaining respondents were assigned to the group saying NO.

  1. The additive constant is virtually the same, 46 vs 48, meaning that in the absence of elements in the vignette; a little fewer than 50% of the responses will be ‘describes me.’
  2. For those with pain, the phrase which most describes them is

    C2:  I would like exercises and stretches that reduce pain.

  3. For those with pain, the element which least describes

    C1:  I would like to have a diet that is tailored to reduce my pain

  4. For those with no pain, virtually no element most describes them
  5. For those with no pain, many elements least describe. The strong element which least describes is

    C4: I would like a prescription that gives me the medication I need to feel better

Mind-Sets: Dividing respondents by the patterns of their coefficients for a specific topic

We have just seen that there are some differences in terms of ‘describes me’ across genders, and across those who define themselves as having pain versus no pain. These are ways that people describe themselves. People may differ in ways that the researcher cannot describe in simple terms, or even in way that they themselves don’t understand.

A major tenet of Mind Genomics is that within any topic area, such as the description of pain presented here, there are fundamental differences across people, differences that are obvious once demonstrated, but differences limited to a single topic area.  This is the case of the data here. Even within the small sample of 30 respondents we can extract two, possibly three different mind-sets. The method for extracting mind-sets has been previously described [21]. Quite simply, the technique is a matter of clustering the respondents into two or three groups based upon the pattern of their 16 coefficients. The statistical method of clustering is well accepted [22] All that remains is the clustering, extracting the small groups with the property that these mutually exclusive groups represent different ways of thinking about the topic.

Table 4 shows the results for the two mind-set segments emerging from the clustering of the 30 respondents. A base size of 25–30 suffices to reveal the nature of these different mind-sets, especially because the segments are so obviously different and interpretable.

Table 4. Coefficients for the binary-transformed scale ‘Describes me’ across gender, age, pain, and mind-set, respectively. Coefficients of +7 or more are presented in bold, and shaded.


Male

Female

Age<50

Age 50+

Pain Yes

Pain No

Mind Set 1: Wants a cure

Mind Set 2: Simplicity through the doctor

Additive constant

57

38

58

31

46

48

37

54

A1

Pain bothers me all over my body

1

4

-1

3

6

-9

10

-9

A2

The pain is localized but intolerable

-4

-4

-9

0

-3

-11

-2

-9

A3

The pain radiates and makes it difficult to function

1

1

-7

9

2

-4

10

-11

A4

The pain is minor but frequent and annoying

-11

2

-5

-2

-2

-12

-3

-8

B1

The doctor explains to me how to deal with the pain

-8

-1

-11

2

-7

1

3

-12

B2

I try to deal with the pain to work through it

-2

4

-1

4

4

-2

8

-3

B3

I’m happy when I can use a device that delivers therapeutic solution

-6

-3

-7

-1

-4

-2

1

-9

B4

I just like taking a pill that deals with the pain.

-9

-8

-12

-5

-7

-11

-16

1

C1

I would like to have a diet that is tailored to reduce my pain

-15

0

-5

-10

-10

-3

2

-17

C2

I would like exercises and stretches that reduce pain

13

-3

5

7

10

-5

9

3

C3

I would like regular therapy sessions to reduce my pain

-1

-3

-3

1

-2

-2

3

-7

C4

I would like a prescription that gives me   the medication I need to feel better

-11

-4

-4

-9

-5

-14

-9

-5

D1

The doctor should give me advice

-7

-5

-1

-9

-4

-3

-2

-4

D2

The doctor should give me a shot that delivers long term relief

-9

0

-1

-5

-3

-3

-6

3

D3

The doctor should set me up with a system for me to follow

-1

2

5

-1

4

-2

-4

10

D4

The doctor should give me a regular schedule of visits to treat my pain

-10

1

0

-5

-2

-6

-8

4

  1. Mind-Set 1 (wants a cure) begins with a low additive constant, 37. To them, it’s not the general response which ‘describes me’ but rather the specific phrase. Mind-Set 1 suffers pain, and wants a cure. Here are the elements which Mind-Set 1 feels best describes them:

    A1: Pain bothers me all over my body

    A3: The pain radiates and makes it difficult to function

    C2: I would like exercises and stretches that reduce the pain

  2. Mind-Set 1 do not want simple medical treatment which will alleviate their pain. Here is the element which is they feel least describes them:

    B4: I just like taking a pill that deals with the pain.

  3. Mind Set 2 (simplicity through the doctor) shows a higher additive constant, 54. Mind-Set 2 is less discriminating among elements. Mind-Set 2 wants simplicity. Here is the one element that they feel best describes them:

    D3: The doctor should set me up with a system for me to follow

  4. Mind Set 2 does not want to take responsibility. Here are the elements that they feel least describe them:

    C1: I would like to have a diet that is tailored to reduce my pain

    B1: The doctor explains to me how to deal with the pain

    A3: The pain radiates and makes it difficult to function

Response times as a measure of cognitive processing of information

At the same time that the respondents were reading the vignettes, the response time was being measured. Response time is operationally defined as the time between the appearance of the vignette and the assignment of the rating. The experiment was executed on the internet.

 The respondent was unaware of response time being measured, being instructed simply read the vignette and assign a ‘gut-level’ judgment. Occasionally, in about 10% of the cases, the response time was longer than 10 seconds, suggesting that the respondent was doing something as well, so-called multi-tasking. Those response times of 10 seconds or longer were recoded as 10 seconds. Figure 1 shows the distribution of the 720 response times (30 respondents, each evaluating 24 vignettes)

Mind Genomics-008 IMROJ Journal_F1

Figure 1. Distribution of response times for the total panel of 30 respondents, each rating 24 unique vignettes.

Response time patterns for different subgroups

The measurement of response times as a key feature of Mind Genomics began during the summer of 2019. In the studies run since that introduction, the response time data suggests that when the topic deals with an important health issue, the respondents spend a long time reading the vignette, and thus their response times are long, often 1.0 seconds or longer. When the topic deals with something commercial or ‘fun’ the response times are very short, around 0.2 – 0.7 seconds.

Table 5 presents the response time coefficients for the key subgroups. The model for response time is written in the same way as the model for the binary transformed rating, with the key difference being that that the model for response time does not have an additive constant. The ingoing assumption is that the response time is 0 when there are no elements in the vignette.

Table 5. The coefficients for the response time models. The models do not feature an additive constant.


Male

Female

Age <50

Age 50+

Pain YES

Pain NO

Mind-Set 1: Wants a cure

Mind-Set 2: Simplicity through the doctor

A1

Pain bothers me all over my body

1.3

1.1

1.0

1.6

1.0

2.0

1.3

1.3

A2

The pain is localized but intolerable

1.0

1.2

1.3

1.1

1.1

1.5

1.0

1.4

A3

The pain radiates and makes it difficult to function

1.7

1.5

1.8

1.4

1.8

1.2

1.6

1.7

A4

The pain is minor but frequent and annoying

2.5

1.7

1.9

2.5

1.9

2.7

1.8

2.6

B1

The doctor explains to me how to deal with the pain

1.8

1.9

1.2

2.6

1.9

1.6

1.8

1.7

B2

I try to deal with the pain to work through it

2.3

1.6

1.6

2.1

2.1

1.5

2.1

1.7

B3

I’m happy when I can use a device that delivers therapeutic solution

2.1

2.3

1.8

2.7

2.3

1.8

2.0

2.2

B4

I just like taking a pill that deals with the pain.

2.0

1.0

1.1

2.2

1.9

0.8

1.4

1.8

C1

I would like to have a diet that is tailored to reduce my pain

1.6

1.0

1.5

1.5

1.7

0.5

1.3

1.4

C2

I would like exercises and stretches that reduce pain

1.2

0.6

1.2

0.8

1.3

-0.1

0.9

1.0

C3

I would like regular therapy sessions to reduce my pain

1.9

1.5

1.7

1.9

2.0

0.9

1.4

1.9

C4

I would like a prescription that gives me the medication I need to feel better

2.1

0.6

1.7

1.6

2.0

0.0

1.2

1.7

D1

The doctor should give me advice

1.5

1.5

1.4

1.5

1.5

1.3

1.4

1.6

D2

The doctor should give me a shot that delivers long term relief

1.5

2.1

1.6

2.0

1.9

1.5

1.7

1.9

D3

The doctor should set me up with a system for me to follow

1.7

2.7

2.0

2.2

2.0

2.2

2.4

1.8

D4

The doctor should give me a regular schedule of visits to treat my pain

1.7

1.8

1.4

2.0

1.8

1.4

1.3

2.1

In Table, coefficients of 2.0 or higher are shaded and shown in bold. These are the elements to which the respondent pays attention.  There are some simple patterns which emerge from visual inspection of these elements that are processed ‘more slowly.’

  1. For gender, males focus on the description of symptoms.

    A4  The pain is minor but frequent and annoying

    B2   I try to deal with the pain to work through it

    B3   I’m happy when I can use a device that delivers therapeutic solution

    C4  I would like a prescription that gives me the medication I need to feel better

    B4   I just like taking a pill that deals with the pain.

  2. For gender, females want a relationship, or at least someone/something external to them.

    D3  The doctor should set me up with a system for me to follow

    B3   I’m happy when I can use a device that delivers therapeutic solution

    D2  The doctor should give me a shot that delivers long term relief

  3. For age, those under 50 focus on only one element:

    D3  The doctor should set me up with a system for me to follow

  4. For age, those 50+ focus on a number of phrases, most dealing with methods to assure pain reduction

    B3   I’m happy when I can use a device that delivers therapeutic solution

    B1   The doctor explains to me how to deal with the pain

    A4  The pain is minor but frequent and annoying

    B4   I just like taking a pill that deals with the pain.

    D3  The doctor should set me up with a system for me to follow

    B2   I try to deal with the pain to work through it

    D4  The doctor should give me a regular schedule of visits to treat my pain

    D2  The doctor should give me a shot that delivers long term relief

  5. For pain, those with PAIN YES, i.e., who say they suffer from one or another pain, the focus is on what stops the pain, i.e., assure pain reduction

    B3   I ‘m happy when I can use a device that delivers therapeutic solution

    B2   I try to deal with the pain to work through it

    D3  The doctor should set me up with a system for me to follow

    C3  I would like regular therapy sessions to reduce my pain

    C4  I would like a prescription that gives me the medication I need to feel better

  6. For pain, those with PAIN NO, i.e., who say that they do not suffer from pain, the focus is on descriptions of pain

    A4  The pain is minor but frequent and annoying

    D3  The doctor should set me up with a system for me to follow

    A1  Pain bothers me all over my body

  7. For Mind-Sets, Mind-Set 1 (Wants a cure)

    D3  The doctor should set me up with a system for me to follow

    B2   I try to deal with the pain to work through it

    B3   I’m happy when I can use a device that delivers therapeutic solution

  8. For Mind-Sets, Mind-Set 2 (Simplicity through the doctor)

    A4  The pain is minor but frequent and annoying

    B3   I’m happy when I can use a device that delivers therapeutic solution

    D4  The doctor should give me a regular schedule of visits to treat my pain

Finding the mind-sets in the population using a PVI (Personal Viewpoint Identifier)

The mind-sets reveal different ways of perceiving the nature of pain.  The mind-sets represent a way to divide what is likely a continuum of feelings and points of view into at least two distinct groups, a division which may provide further understanding, and certain a division that can be used to deal with patients in different, and possibly more appropriate fashion.

Table 6 shows, however, that it’s unlikely to identify mind-sets by their age and gender. It is also quite possible that there are no direct classifications of who a person ‘is’ or what a person ‘experiences’ which can easily assign a person to one of these two mind-sets.

Table 6. How the two emergent mind-sets for pain distribute on the self-profiling classification in terms of age, sex, and experience of pain.


Mind-Set1 Wants a cure

Mind-Set2 Simplicity through the doctor

Total

Male

6

10

16

Female

9

5

14

Total

15

15

30

Under 50

7

9

16

50+

7

6

13

Total

14

15

29

NOPAIN

6

3

9

YESPAIN

9

12

21

Total

15

15

30

An alternative way to assign new individuals to mind-set has been developed by author Gere. It is called the PVI, the personal viewpoint identifier. The PVI comprises a set of six questions, answered with one of two answers, no or yes.  The pattern of the answers to the six questions assigns the respondent to one of the two mind-sets.  Figure 2 shows the PVI questionnaire at the left, and the response emerging, given either to the physician and/or to the patient/client.  The questions themselves are taken from the actual study. These are the answers or elements, now turned into questions.

The PVI can be deployed along with additional information obtained during the questions. Thus, Figure 2 shows that the respondent, a new person not part of the previous study establishing the PVI, is asked for his or her email. Other questions can be asked, to relate mind-set membership to external variables, whether of a medical/health nature, or of a life-style nature.

Discussion & Conclusions

Since pain is a complex sensation involving sensory, motivational, and cognitive components, and affecting any one of these may change one’s attitudes towards pain [7]; we tested the effect of communication messaging, across mind-set segments towards pain. We tested how each min-set segment we identified emotionally responds to chronic pain, and which treatment choices are preferred by attitudinal mind-sets towards pain.

People who belong to the first mind-set segment feel the pain as radiating and challenging their daily functioning. The pain is very bothersome, but they choose to alleviate it by exercises and stretching. They chose to avoid medical treatment to simply deal with the pain and its ramifications.  People belonging to the second mind-set segment also view their chronic pain as radiating and challenging their daily functioning.  They, however, choose to simply take pain medication their doctor will prescribe.  They expect their doctor to also set them up with a system to follow.  In addition, they do not want to take responsibility for self-managing the illness which causes their pain. They prefer to avoid a diet that is tailored to reduce their pain.

Mind Genomics-008 IMROJ Journal_F2

Figure 2. The PVI created for the pain study. The link for the PVI as of this writing (Feb. 2019) is: http://162.243.165.37:3838/TT13/

This study also illustrated how a medical professional may easily identify the mind-set segment to which a patient belongs and accord communication messaging to patient choices and values. Identification of the mind-set to which a patient belongs may assist in building patient-physician trust resulting in higher patient adherence and better implementation of patient-centered care [21].

Mind Genomics provides the ability to segment out populations that share a common mind type and thereby help identify the possibility of determining the types of pain that a person is most likely to experience. It may help answer the question of why people with the same disease experience pain in profoundly different ways. By mind-typing patients who share ailments, Mind Genomics may aid in helping tailor a treatment plan best suited to that individual lying within a disease spectrum.

In light of the current opioid epidemic, it more important, now more than ever, to address how to customize pain treatments to individuals. There are many modalities to treat pain. In the West, pain medications are the first line of treatment. These medications include narcotics/opiates, Non-Steroidal Anti-Inflammatory Drugs (NSAIDs), acetaminophen, certain antidepressants, muscle relaxants, anticonvulsants, corticosteroids, local anesthetics, and most recently medical marijuana. Other modalities such as Transcutaneous Nerve Stimulation (TENS), implantable spinal cord stimulators, meditation and biofeedback are also used to help combat pain. Health care professionals who specialize in pain management use experience and training to try and help tailor treatment regimens to the individual patient. But a tool like Mind Genomics may help the practitioner go beyond the current protocols and prejudices of current practice. Mind Genomics may provide a “cheat sheet” to the patient’s mind and help provide a short cut to success by focusing on pathways that will more likely work for a given patient and eliminating the pathways that will waste time and resources.

References

  1. Hadjistavropoulos T, Craig KD, Duck S, Cano A, Goubert, L, et al. (2011) A biopsychosocial formulation of pain communication. Psychological bulletin 137: 9.
  2. Williams AC, Craig KD (2016) Updating the definition of pain. Pain 157: 2420– 2423. [crossref]
  3. Baker KS, Gibson S, Georgiou-Karistianis N, Roth RM, Giummarra MJ (2016) Everyday executive functioning in chronic pain: specific deficits in working memory and emotion control, predicted by mood, medications, and pain interference. The Clinical Journal of Pain 32: 673–680.
  4. Morrison RS, Maroney-Galin C, Kralovec PD, Meier (2005) The growth of palliative care programs in United States hospitals. Journal of Palliative Medicine 8: 1127–1134.
  5. Schug SA, Palmer GM, Scott DA, Halliwell R, Trinca J (2016) Acute pain management: scientific evidence, 2015. Medical Journal of Australia 204: 315–317.
  6. Loeser JD, Treede RD (2008) The Kyoto protocol of IASP Basic Pain Terminology. Pain 137: 473–477. [crossref]
  7. Atlas LY, Wager TD (2012) How expectations shape pain. Neurosci Lett 520:140–148. [crossref]
  8. Goffaux P, de Souza JB, Potvin S, Marchand S (2009) Pain relief through expectation supersedes descending inhibitory deficits in fibromyalgia patients. Pain 145: 18–23.
  9. Goffaux P, Redmond WJ, Rainville P, Marchand S (2007) Descending analgesia–when the spine echoes what the brain expects. Pain 130: 137–143. [crossref]
  10. Matre D, Casey KL, Knardahl S (2006) Placebo-induced changes in spinal cord pain processing. Journal of Neuroscience 26: 559–563.
  11. Price DD, Craggs J, Verne GN, Perlstein WM, Robinson ME (2007) Placebo analgesia is accompanied by large reductions in pain-related brain activity in irritable bowel syndrome patients. Pain 127: 63–72.
  12. Alkes L. Price, Arti Tandon, Nick Patterson, Kathleen C. Barnes, Nicholas Rafaels, et al (2009) Sensitive Detection of Chromosomal Segments of Distinct Ancestry in Admixed Populations. PLoS Genet 5: 1000519.
  13. Atlas LY, Bolger N, Lindquist MA, Wager TD (2010) Brain mediators of predictive cue effects on perceived pain. J Neurosci 30: 12964–12977. [crossref]
  14. Watson A, El-Deredy W, Iannetti GD, Lloyd D, Tracey I, et al. (2009) Placebo conditioning and placebo analgesia modulate a common brain network during pain anticipation and perception. PAIN 145: 24–30.
  15. Wager TD, Atlas LY, Leotti LA, Rilling JK (2011) Predicting individual differences in placebo analgesia: contributions of brain activity during anticipation and pain experience. Journal of Neuroscience 31: 439–452.
  16. Flaten MA, Aslaksen PM, Lyby PS, Bjørkedal E (2011) The relation of emotions to placebo responses. Philosophical Transactions of the Royal Society B: Biological Sciences 366: 1818–1827.
  17. Brand PW, Yancey P (1993) Pain: the gift nobody wants. New York, HarperCollins Publishers.
  18. Moskowitz HR, Gofman A, Beckley J, Ashman H (2006) Founding a new science: Mind genomics. Journal of sensory studies 21: 266–307.
  19. Gofman A, Moskowitz HR (2010) Isomorphic permuted experimental designs and their application in conjoint analysis. Journal of Sensory Studies 25: 127–145.
  20. Box GE, Hunter JS, Hunter WG (2005) Statistics for experimenters: design, innovation, and discovery (Vol. 2). New York: Wiley-Interscience.
  21. Gabay G, Moskowitz HR, Silcher M, Galanter E (2017) The New Novum Organum: Policies, Perceptions and Emotions in Health. Pardes-Ann Harbor Publishing.
  22. Moskowitz HR, Martin DM (1993) How computer aided design and presentation of concepts speeds up the product development process. Paper presented at the ESOMAR Congress, September, 1993, Copenhagen.
  23. Eippert F, Finsterbusch J, Bingel U, Büchel C (2009) Direct evidence for spinal cord involvement in placebo analgesia. Science 326: 404. [crossref]
  24. Moskowitz, HR (2012) ‘Mind genomics’: The experimental, inductive science of the ordinary, and its application to aspects of food and feeding. Physiology & behavior 107: 606–613.

Uncovering Communication Messages for Health Promotion: The Case of Arthritis

DOI: 10.31038/IJOT.2019215

Abstract

We introduce the science of Mind Genomics to the study of large sets of messages, specifically those found on the Internet and dealing with arthritis. Through experimental design, we create small sets of 25 test combinations, comprising 20 messages in different combinations of 2–5 elements. We use the experimental design to estimate the contribution of each message to interest. We then extend the estimated contributions to elements that were untested. This approach enables us to assess how 170 different messages about arthritis appeal to the general public, and reveals four new emergent mind-sets, responding to different types of messages. We then introduce a tool, the Person Viewpoint Identifier (PVI), allowing a medical professional to assign a new person to the appropriate mind-set, setting up a knowledge base for more effective messaging for health-promotion, and more person-compatible treatment.

Introduction

Arthritis causes persistent pain, distress, and disability [1, 2]. The symptoms of pain, disability, and depression appear to increase with age, and their prevalence may be underestimated [3]. Arthritis patients of all ages complain of five physical symptoms comprising pain, stiffness, fatigue, joint cracking, and swelling, respectively. These symptoms negatively affecting their decisions about performing functional routine activities, their mood and their well-being [4]. Arthritis is becoming more prevalent among the young as well. Younger arthritis patients complained about physical “slowing down” and cognitive and emotional changes [5]. Arthritis patients report psychological challenges such as depression, helplessness, and anxiety, conditions which significantly impacting their life quality [5, 6].

The power of arthritis, a long-term condition, affecting patients’ physical health status, patients’ mental well-being, and increasing public and private healthcare expenditures, makes it important to improve self-management of arthritis [7]. Yet, self-management is complex, requiring both medical knowledge and patient-centered knowledge [8]. Self-management of one’s illness requires patient trust in physicians [9]. What is emerging is the need for the patient to understand himself or herself at a deeper emotional and intellectual level. This knowledge will reveal what is important. The knowledge should create an empowered patient who is a partner together with the doctor through an ongoing process, effectively maintaining the mental and physical welfare of the individual [10].

Arthritis patients reported that physicians attributed their symptoms to age, and all-too-often made no recommendations to manage symptoms, actions which lead to patient frustration, uncertainty, and loss of trust in the physicians [4]. Loss of trust leads to lack of adherence [11]. Reports suggests that quite often, patients are not given the relevant and necessary information on support, resources, and ‘tips’ about how to self-manage their illness [5, 12]. Moreover, patient experiences, perceptions, and expectations in arthritis are not understandable [4, 13]. Insights from patients’ perspective is required but has been neglected [14].

The complicated nature of arthritis means that the patient must be ‘taught’ a variety of different types of information. Some of the factors in self-management of chronic illness may be related to lifestyle (e.g., diet, sleep). Other information may be related to activities, exercise programs, occupational therapy, and so forth. A literature search indicates that patients were unaware of advice on exercise or weight control, and did not access the available services in a productive manner [15, 16]. Furthermore, only half of the patients received physiotherapy, although many expected such physiotherapy to be easily available [17]. None of the patients were aware of occupational therapy and expected their care to be proactive rather than reactive [17].

Arthritis patients perceived arthritis as a low priority of health care systems and complained about the scarcity of specialists dealing with arthritis. They also expressed a need to talk for a longer time with physicians [16, 17]. Finally, patients expressed anxiety because they perceived a lack of good and understandable information by which they could make judgments [17]. Patients claimed that they need more information to allow them higher control resulting in self-management of their arthritis [9]. Patients wanted tailored information about the disease, advantages, disadvantages of treatment and medication without having to specifically request it [18–21]. This lack of information confirms findings of previous studies [22–24].

The Internet presents the largest publicly available source of messaging to arthritis sufferers. Our study tests what messages arthritis suffers find most compelling, and how to drive the right communication to the arthritis sufferer, based on mind-set. Appropriate messages, correctly targeted, may promote well-being and trust in physicians leading to higher self-management of illness.

This paper focuses on perceptions and expectations of arthritis patients, based upon reactions to messages about arthritis ‘scraped from the Internet. Understanding patient perception and expectations is imperative for health services. Such information promoted better communication messages and services. The result is that the patient receives the necessary information, and the health-care system empowers the patient to participate in the self-management of arthritis [17].

Asking Versus Experimenting

Asking questions of respondents about their preferences and beliefs has been a tradition in research since the field began in earnest in the 1950’s. A great deal of our knowledge of what people want in fast-moving goods and services including in health services and in medicine, has emerged from the analysis of often agonizing-detailed studies. Indeed, one might use the metaphor of ‘warehouses filled with data, ’ and not be very off the mark.

Two newer approaches have emerged to understand the rules of choice. The former, tracking behavior, is an increasingly large proportion of consumer research as of this writing (2019), with the field replete with good data, but also replete with consumer and legal reactions against the suggested invasion of privacy. Indeed, tracking people’s behavior and the ownership of such data is an increasingly contentious area world-wide, leading to many lawsuits, and in the case of Europe, leading to regulations about privacy.

The second new approach is experimentation, made very easy on the Internet. The notion is that one can understand the structure of consumer expectations and preferences through experiments. These experiments, motivated in part by the growth of the field called behavioral economics, suggests that we can learn a great deal by giving respondents concepts or vignettes and asking them to react to these concepts. By systematically varying the concepts (the test stimuli), and measuring the responses, it becomes possible to generate patterns, relating the responses to the antecedent stimuli.

Dealing with large numbers of messages through modeling and data imputation

One of the key issues for studying a large category of messaging, such as arthritis, is the richness of the information available. As electronic communication increases through the web, there emerges an extraordinarily large number of websites devoted to topics of general concern, and within those websites many messages. How does one run an experiment to understand which messages accord and which messages do not accord and finally when there can be upwards of 100 messages?

One simple way presents single messages to respondents, instructing them to rate the message, and of course rotating the order of the messages in order to reduce the fatigue and the boredom. The respondent may be instructed to rate only a subset of the messages.

The aforementioned approach, presenting single items, works when the messages tell a story, paint a word picture, and have ecological validity. In other words, testing single items, single ideas, works best when the messages make sense. The messages must comprise short stories within them. This requirement is met by many messages, but not met by messages which may be tag lines or messages which may be pictures support the general story but in themselves not relevant.

Moskowitz & Martin [25] presented the original science of Mind Genomics in a paper, where they introduced the notion of presenting a respondent with a set of systematically varied concepts, estimating the coefficients from models created after relating the elements or messages in the concept to the response, and then, most important, estimating the coefficients of elements untested by that respondent. In other words, the approach enabled the researcher to estimate the impact of a message, and use a form of numerical analysis, data imputation, to estimate the value or coefficient of untested elements. The reader is referred to that paper for full details. Below is a simplified explanation:

  1. Each of the test elements is profiled on a set of three non-evaluative bipolar scales (semantic differential scales)
  2. Each test element has a set of eight closest neighbors, defined by the Euclidean distance between the pairs of elements. The Euclidean distance is defined in the normal way, using the scales on which the elements were profiled
  3. Each respondent evaluates two sets of 20 elements, combined into 50 vignettes, according to an underlying experimental design.
  4. The ratings are transformed, so that a rating of 1–6 is transformed to 0, and a rating of 7–9 is transformed to 100. A small random number (<10–5) is added to the rating. This small number does not affect the results, but ensures that the regression analysis below ‘runs, ’ even in those situations where a respondent confines all ratings to 1–6 (transformed to 0), or the respondent confines all ratings to 7–9 (transformed 100.) The small random number ensures variation in the dependent variable, necessary for the regression not to ‘crash.’
  5. The ratings are deconstructed into the part-worth contribution of the 40 elements using OLS (ordinary least-squares) regression. The regression generates coefficients.
  6. At this first step, those elements not tested are assigned a value of 0. When an element was tested, its value is the coefficient estimated in Step 5.
  7. Starting from the first element to the element (including text and visual elements), the algorithm goes through the set of elements. The algorithm looks at each element, one element at a time. When the element had been tested by the respondent, then the element coefficient is unchanged. When the element had not been tested by the respondent, the element coefficient (starting with 0 at the beginning) is replaced by the average coefficient of the eight nearest elements defined in Step 2, above.
  8. The algorithm goes through the respondent’s data until it reaches a point when the coefficient of untested elements no longer materially changes (<.001 change). The process stops when all untested elements stop changing, and the coefficients have stabilized to their estimated values.
  9. The coefficients are then averaged.
  10. For each respondent, the process provides a conservative estimate of the coefficients of the elements, tested and untested.

The Arthritis Study

The objective of this study was to understand what specific messages from a set of 170, taken from web-pages, were most appealing to respondents in the general population of those defining themselves as suffering from arthritis. The messages were ‘scraped’ from sites featuring discussions of arthritis. The messages were taken from then-current websites, during the early years of the 21st century. The fact that the elements are more than a decade old is irrelevant to the study because the focus is on the types of messages which interest consumers. The web-sites are simply sources of messages, with such messages crafted by those who are involved with arthritis. The websites are transient, changed often, and thus simply a momentary embodiment of messages and pictures which the website owner believes will educate, convince, and even on occasion ‘sell’ a product.

Table 1 show 10 of the 11 websites that were ‘scraped’ to provide the set of 151 text elements and 19 visual elements. (The 11th website was simply text, and from a user-group.) The messages were slightly edited to make them shorter, and easier to read. Every effort was made to keep the original sense of the message

Table 1. The ten websites and a representative element from each website after the slight text editing

Website

Example of message ‘scraped’

1

http://www.arthritis.about.com/health/arthritis/

Contains a Glossary of terms used in rheumatic diseases

2

http://www.arthritis.com/

The path to a healthy lifestyle

3

http://www.arthritis.org

Ask our fitness and nutrition expert any questions you may have

4

http://www.arthritiscentral.com/

Ask our experts any question at the oldest & largest free Q&A service on the Internet

5

http://www.arthritissupport.com

Contains information about diagnosis and treatments

6

http://www.mediconsult.com

These guides will help you find information fast

7

http://www.mediconsult.com

Order free brochures or buy an exercise tape in the Arthritis Store

8

http://wwmerck.com/health/

We recommend that before you start any exercise program, it is important that your physician examines you to see which types of exercise would be best for you

9

www.drkoop.com

Arthritis Advocacy Priorities – Read about the issues

10

www.webmed.com

Browse through the latest books and newsletters

In order to estimate the coefficients of elements untested by each respondent, a small group of five respondents, none of whom would participate in the large study, profiled each of the 170 elements, text and pictures on eight bipolar scales. This exercise allowed us to identify the eight closest neighbors of each element, using the eight bipolar scales (profiling) as dimensions. The use of eight bipolar scales and the eight closest neighbors is simply happenstance, and not a deliberate conjunction of scales and distance.

Table 2 shows an example of pairs of elements which are most separated on three of the eight scales. For example, for the bipolar scale ‘beginner versus experienced, ’ the lowest rating on the bipolar scale (3.8) is ‘Your personalized program can help you learn how to make informed decisions about your treatment options.’ In contrast, on the same scale, the highest rating is 6.8. ‘We recommend that before you start any exercise program, it is important that your physician examines you to see which types of exercise would be best for you.’

Table 2. The highest and lowest text elements on three of the eight bipolar semantic scales. Each element was profiled on all eight scales.

1-Beginner Vs 9-Experienced

Your personalized program can help you learn how to make informed decisions about your treatment options

3.8

We recommend that before you start any exercise program, it is important that your physician examines you to see which types of exercise would be best for you

6.8

1-Less Vs 9-More Active


Find information on your daily calcium need to keep your bones healthy

3.7

Read our Questions and Answers about arthritis pain

7.8

1-Occasional Versus 9-Chronic

Print out your meal plan and follow it to a new you…recipes and a shopping list are included

4.2

Learn your pain medicine risk profile

7.8

Although the up-front semantic profiling was done as a preparatory step to estimate the coefficients of untested elements, a second use of the semantic profiling quickly emerged. One could get a ‘sense’ of the nature of the various websites by plotting the distribution of scores for each website, on each bipolar scale. Figure 1 gives a sense of how the various websites focus on one tonality (beginner vs experienced) in their messaging.

Mind Genomics-007 IJOT Journal_F1

Figure 1. How the text elements score on the semantic differential scale of ‘for beginner vs for experienced’. Each website presents a variety of different messages

Measures

Silos, Elements and Experimentally Designed Vignettes

The elements were classified into silos, or groups of related elements. By related we mean that the elements in a group shared something in common, and if put together could contradict each other. The structure of silo and element is a bookkeeping tool, one which facilitates critical thinking. The act of putting elements into silos based upon meaning forces the researcher to think more deeply about the structure of the information that is being communicated. Table 3 presents two examples from each silo. The actual sorting of elements into silo is a subjective matter. From a statistical point of view, the assignment of elements to silos has only a minimal effect on the analysis of the results later, through OLS (ordinary least-squares) regression.

Table 3. The 10 silos, and examples of two elements from each silo

AD – Organization

AD01

A portion of all proceeds will benefit the Arthritis Foundation

AD – Organization

AD09

Fight for more research funding, insurance coverage for medications and the rights of people with arthritis

CM Communication

CM01

Read ‘A Day in My Life’…stories are submitted by Community Members, and are first-person accounts of what it is like to live with a disease or condition

CM Communication

CM22

The message board is a great way for you to exchange ideas, thoughts, and express yourself

EB

Self-manage

EB01

Manage your arthritis and improve your life

EB

Self-manage

EB11

Learn ways to prevent injury-related arthritis … prompt treatment can avert serious damage

EX

Experts

EX01

Ask our experts any question at the oldest & largest free Q&A service on the Internet

EX Experts

EX09

A site produced and supervised by Board Certified Rheumatologists, your specialists in Arthritis and Osteoporosis

GI General information

GI01

View our online checklist on how to monitor medication use for seniors

GI General

Information

GI27

Up to date research on the aches and pains of arthritis and the effective homeopathic medicines

NE

Nutrition

NE01

Eating a healthy, balanced diet is important for everyone, but particularly for people with arthritis

NE

Nutrition

NE17

Find information on your daily calcium need to keep your bones healthy

PR Privacy

PR01

Learn more about the new ‘Speaking of Pain’ program, and find out how you can request a free brochure

PR Privacy

PR12

We will never share your personal information with any external organization without your consent

RS Resource Info

RS01

Click here for comprehensive information about your health

RS Resource Info

RS17

The Manual of Medical Information transforms the language of the professionals’ version into commonly used English

SH ShoppingHH

SH01

Buy all your arthritis-care products here in the online store. Just click on a product link to browse hundreds of items

SH Shopping

SH06

Refill your prescriptions, find drug information and check drug interactions at the online pharmacy

WF Wellness Fitness

WF01

Take three or more health quizzes and enter to win a free tee-shirt

WF Wellness Fitness

WF18

Your personalized program can help you learn how to start and maintain a fitness program

Each respondent evaluated two sets of 25 vignettes each, with each set comprising 20 elements combined into the 25 vignettes. A vignette comprised 2–5 elements, combined according to an experimental design (see Table 4 for a schematic for one respondent, and concepts or vignettes 1–6 of 25 vignettes created by design for that respondent.)

Table 4. Schematic of concepts (vignettes) for a respondent. The vignettes are created from a randomized four silos out of the full set of silos and elements. A ‘0’ means that the silo is absent from the vignette. A 1–4 means that one of four elements from the silo is present in the vignette.

Category

A

B

C

D

Concept

1

0

3

1

3

Concept

2

4

0

3

1

Concept

3

1

4

0

3

Concept

4

1

1

4

0

Concept

5

2

1

1

4

Concept

6

1

2

1

1

We can think of the design as a ‘menu’ which ensures that only one element from a silo could appear in a single vignette. The 20 different elements per set come to at most 40 different elements seen by a respondent. By design, within a vignette the elements are statistically independent of each other. Generally, when two or more designs are combined, as in the current study, the respondent sees a set of elements which end up being statistically independent. Statistical independence will enable the ratings to be related to the presence/absence of the underlying elements forming the vignette. In turn, the numerical analysis, imputation of the value of missing elements, will be made possible by the computational algorithm specified above, specifically Steps 5–10.

Two examples of vignette appear, respectively, in Figure 2 (all text), and in Figure 3 (one visual, the remaining elements are text.) The vignette is constructed ‘dynamically’ on the respondent’s computer, a process which makes the interview flow quickly, and is not onerous. The respondent need not wait for the transfer of screens from a host computer to the respondent’s computer.

Mind Genomics-007 IJOT Journal_F2

Figure 2. An example of a vignette comprising text only, with the rating scale at the bottom.

Mind Genomics-007 IJOT Journal_F3

Figure 3. Example of a vignette, comprising picture, text, with the rating question at the bottom.

Procedure

Running the arthritis study on the Web

A great deal of consumer research has migrated to the Web, especially studies which do not involve the evaluation of several products in a short, sequential format, such as so-called ‘taste-testing.’ The Mind Genomics approach set up for this and related studies are perfectly adapted for the Web. Respondents who agree to participate first see an introductory screen (Figure 4), which tells them a little about the study, and what is expected of them. The less that one says about the purpose of the study, the better the study results, because it will be the elements, the specific messages, which drive the ratings.

Mind Genomics-007 IJOT Journal_F4

Figure 4. The orientation page for the arthritis study

Sample

The panel comprised 144 individuals who reported that they have arthritis, or arthritis-type pain. The respondents were recruited by a Canadian panel provider, Open Venue, Ltd., which specialized in the recruitment of respondents for these studies, and especially the recruitment of respondents who satisfied specific screening. Table 5 shows the distribution of the 144 respondents falling into the self-defined classification groupings.

Table 5. The distribution of the 144 respondents falling into self-defined classification groupings.


Total

Arthritis Med

Tylenol

Other Pain Reliever

Base size

144

26

63

83

Base – Column percent 

%

%

%

%

Health Status re Arthritis

Has Arthritis

80

96

79

76

Gender

Males

78

85

76

78

Females

22

15

24

22

Age

Under 35–54

52

50

60

54

55 and older

48

50

40

46

Usage

Arthritis Medication Users

18

100

17

17

Tylenol® Users

44

42

100

40

Other Pain Reliever Users

58

54

52

100

Information Source about arthritis

Doctor

89

96

86

89

Media

60

65

51

65

Web

51

38

44

54

Social Network

44

35

43

47

Print

56

54

48

53

Drugstore/Pharmacy

56

54

54

58

Results

How the elements ‘drive’ the response – the Mind Genomics model

Each respondent evaluated two independently created sets of 25 vignettes, or 50 vignettes in total. Each set of 25 vignettes comprised a unique set of combinations, structured so that the elements appeared an equal number of times against different backgrounds, and were by statistically independent of each other. The two foregoing features of Mind Genomics enables the data to be analyzed using standard, off-the-shelf statistical procedures, such as OLS (ordinary least-squares) regression.

The data matrix comprised 50 rows or cases. The independent variables were the eight elements, coded 0 when absent from a case, and coded 1 when present in a case. The dependent variable was the transformed rating, which took on the value 0 when the original rating was 1–6, and, in turn, took on the value 100 when the original rating was 7–9. The small random number added to the dependent variable ensured that the OLS regression would not crash.

The analysis generated an additive constant and eight coefficients, one for each element that the respondent tested. The values of the remaining coefficients, for elements not tested by the respondent, were estimated by the algorithm explicated above. The result was a ‘complete’ model for each respondent, comprising an additive constant, actual coefficients for tested elements, and estimated coefficients for untested elements. The coefficients emerging from the algorithm are conservative estimates of the true coefficients that would be obtained when the elements are directly tested. Thus, the results reported here can be considered as conservative. Any messages which score well, i.e., have very high positive coefficients, in fact, may be even more powerful messages than one might conclude from the data.

Table 6 suggests disappointing news. When we look at the data from the total panel of 144 respondents, we see an additive constant of 48, but very low coefficients. Respondents with arthritis are moderately interested in the messaging in general, but no message strongly drives interest. The answer may be in the subgroups that we can extract from knowing how the respondents describe themselves, but as we will see, the answer really emerges from the way the respondents think about the messages.

Table 6. Winning elements about arthritis from the total panel who are recruited to be arthritis sufferers.


Total Panel

(144)

Additive constant

48

NE14

We recommend that before you start any exercise program, it is important that your physician examines you to see which types of exercise would be best for you

5

GI11

Explore types of arthritis and treatments in the ‘Arthritis Answers’

4

NE11

We have great, healthy recipes, as well as information about vitamins, diet and medical conditions

4

The strongest performing element, across key groups of respondents

Table 7 shows the relevant parameters needed to interpret the results for total panel, key subgroups, and to-be-uncovered mind-sets. Even when looking at the self-defined subgroups, Table 7 shows that the strongest performing element for total panel does not perform particularly well when we look at the typical subgroups.

Table 7. How subgroups respond to the strongest performing element from the total panel (in bold italics). The table shows the subgroup, the base size, the additive constant from the model, and the estimated coefficient for the element (We recommend that…)

We recommend that before you start any exercise program, it is important that your physician examines you to see which types of exercise would be best for you http://www.merck.com/health/

Respondent subgroup

Base Size

Additive Constant

Element Coefficient

Total Sample

144

48

5

Gender – Males

112

51

6

Gander – Females

32

36

1

Age – 35–54

75

53

1

Age – 55 and older

69

42

9

Use – Arthritis Medication

26

50

0

Use – Tylenol®

63

49

4

Use – Other Pain Relievers

83

47

8

Information from – Doctor

128

49

6

Information from – Media

87

46

7

Information from – Web

74

53

7

Information from – Social Network

64

48

4

Information from – Print

80

50

3

Information from – Drugstore/Pharmacy

80

52

5

Condition – Has Arthritis

115

54

6

Mind-Set 1

41

69

-4

Mind-Set 2

32

53

-4

Mind-Set 3

25

39

10

Mind-Set 4

46

30

16

Base Size – Number of respondents falling into the group. At the end of the experiment, the respondent completed a short classification questionnaire, providing gender, age, and so forth. It is from this self-profiling classification that we obtain the subgroups. The mind-set segments emerge from the analysis, reflecting groups of individuals who respond similarly to the messages. Their results will be presented below. Some of the groupings are mutually exclusive, like gender, age, Mind-Sets. Others are not, such as the source of one’s information about arthritis.

Additive Constant The model can be expressed as: Binary Rating = k0 + k1(Element 1) + k2(Element 2) … k170(Element 170). The additive constant, k0, is the estimated value that a vignette would receive on a 0–100-point scale without any elements present in the vignette. Of course, all vignettes comprised 2–5 elements, so the additive constant is a computed value. We can consider the additive constant as a baseline, showing up the likelihood of being interested in the arthritis website in the absence of specific messaging.

We can interpret the constant as follows in terms of interest in the arthritis website:

Constant > 70 = very high interest, elements don’t have to do any work to drive interest
Constant > 40–70 = medium to high basic interest
Constant 30–40 = moderate basic interest
Constant 20–30 = low basic interest
Constant < 20 = virtually no basic interest, elements drive interest

Coefficient

The coefficient tells us the added expected incremental or decremental probability or proportion of respondents who would change their vote on the website from an original 1–6 (not interested) to the higher values 7–9 (interested.) The highest coefficient is +5, which should not necessarily surprise it when we look at the results from the total panel. People are different in what they like and dislike. The results from subgroups suggest some increased interest when we look at certain groups, such as those 55 and older. The real differences emergence when we divide the respondents by how they THINK, not by WHO they are. These differences manifest themselves in the Mind-Sets, especially Mind-Set 4. Below we will explain one way to discover these mind-sets.

We can interpret the coefficient as follows in terms of interest in the arthritis website:

Coefficient > 15 = Extremely strong driver of interest
Coefficient 10 to 15 = Very strong driver of interest
Coefficient 5 to 10 = oderate driver of interest
Coefficient 5 to –3 = Not relevant as a driver of interest
Coefficient -3 or lower = Begins to reduce interest, and should be avoided

Exploring user groups

The study with 151 text elements and 19 pictures (all scraped from websites), and the self-profiling classification generates an extraordinary amount of data. What becomes both interesting and frustrating is that the individual data points, comprising the respondent, the element, and the coefficient, are each interesting in and of themselves. That is, the data generated by Mind Genomics is cognitively ‘rich.’ It is not only the pattern of data points which is of interest, showing a generality of nature, but rather the performance of each data point, since that data point is a meaningful message.

In recognition of the need to simplify the ‘story’, the analysis here will show only a few highlights, but then move to the essence of the findings, newly emerging mind-sets.

When we plot the coefficients text elements using a scatterplot, we find that the patterns are quite similar when the groups are defined by the source of information (Figure 5), a little more diverse when we plot the data by the type of product one uses (Figure 6), and quite unrelated when we plot the data by the two age groups (under 55 versus 55 and older, Figure 7).

Mind Genomics-007 IJOT Journal_F5

Figure 5. Coefficients of the text elements. The scatterplot shows the plot of the corresponding elements for each pair of subgroups, defined by the source of information used by the respondent. The scatterplots suggest linear relations between the sources of information, using the individual 170 coefficients as the data points.

Mind Genomics-007 IJOT Journal_F6

Figure 6. Coefficients of the text elements. The scatterplot shows the plot of the corresponding elements for each pair of subgroups, defined by the pain medicine used by the respondent. The pattern is noisy.

Mind Genomics-007 IJOT Journal_F7

Figure 7. Coefficients of the text elements. The scatterplot shows the plot of the corresponding elements for each pair of subgroups, defined by the age of the respondent. There appears to be no relation between the patterns of coefficients generated by the younger respondents (age 54 or younger) versus the pattern generated by the older respondents (age 55 or older.)

The actual coefficients reveal that most elements are irrelevant in the mind of the respondents. That is, one can assemble dozens, even hundreds of elements, and assume that they all are effective because they appear in public on the Internet. Yet, the data suggest that they are not. Table 8 shows how one group, those who use arthritis medicines, are the ones who most strongly react to the messages. The respondents profiled themselves in terms of the medicines they took. The additive constants are virtually identical. When it comes to the coefficients, the only group of the three to show any real interest are those who take arthritis medicine. Furthermore, only six messages break through. The last line of Table 8 shows the one element appealing to other respondents. This element appeals only to uses of other medicines, besides arthritis medicine and Tylenol®, respectively. No messages appeal strongly to users of Tylenol®.

Table 8. Strong performing elements emerging from the division of respondents into the types of medicines they say they use for pain.

Elem

Text

Source

Arthritis Med

Use Tylenol®

Use Other

Additive constant

50

49

47

Use Arthritis Medicine

GI27

Up to date research on the aches and pains of arthritis and the effective homeopathic medicines

Art.About

14

-1

-5

AD2

Arthritis Advocacy Priorities – Read about the issues

DrKoop

14

2

2

AD6

Contact Congress – Quickly locate your legislators and send them a message

DrKoop

11

-2

-2

GI17

Living with arthritis – Coping strategies, hot and cold treatments, assistive devices, and more

Art.Com

11

0

-1

AD9

Fight for more research funding, insurance coverage for medications and the rights of people with arthritis

DrKoop

10

0

0

GI12

Find all your health and medical information here

Art.Com

10

-1

-5

Use Tylenol®

NE14

We recommend that before you start any exercise program, it is important that your physician examines you to see which types of exercise would be best for you

Merck

0

4

8

These results are startling. They suggest that most of the messages used in the websites simply do not communicate, or at least do not persuade, despite the effort expended to create a meaningful, effective website.

The four mind-sets defined by how they respond to messaging

Our foray into the analysis of data by subgroups suggest that there is at least one group of respondents who react strongly to some elements. These are the users of arthritis medicine, in Table 8. The results from the total, and the results from a detailed analysis of coefficients from other subgroups (not reported) suggest that the conventional breakouts of respondents, based on who they ARE, and what they DO, do not reveal many strong-performing elements.

Mind Genomics studies often reveal the hard-to-believe finding that for the total panel relatively few elements perform well. A more productive way to discover strong-performing elements emerges when we consider the population as comprising a set of mutually exclusive ‘mind-sets, ’ viz., ideas which travel together. A mind-set can be considered an allele of a gene.

The mind-sets are obtained by computation, specifically clustering the coefficients of the 144 respondents so that the clusters comprise groups of respondents with similar patterns of coefficients for the 151 text coefficients. The specific mechanics of the clustering comprise the well-accepted method of k-means clustering. The coefficients comprise a small number of groups (parsimony), whose pattern of strong performing coefficients tell a story (interpretability.) It is important to keep in mind that the clustering and the discovery of mind-sets begins with objective statistical criteria based on the clustering algorithm. The subject step in clustering comprises the selection of the number of clusters after viewing the data, and the naming of the clusters.

The clustering emerged with four different mind-sets.

Mind Set 1 – High additive constant (great basic interest), but no element really shows a high coefficient

Mind Set 2 – Medium constant (interested), but few elements appeal to them. The elements with high coefficients are those involving ‘general wellness.’

Mind Set 3 – Lower constant (moderately interested), but there are a fair number of strongly performing elements. These elements deal with maintaining a good lifestyle, and learning about their arthritis

Mind Set 4 – Lowest constant (moderately interested), but again, they show a fair number of strongly performing elements. They are looking for community and emotional support of others, e.g., through message boards.

Figure 8 shows the coefficients laid out for each mind-set segment, giving a sense of the appeal of the elements in each website to the respondents in each of the four mind-set segments. The messages provided by the websites appeal to respondents in Mind-Sets 3 and 4, respectively.

Mind Genomics-007 IJOT Journal_F8

Figure 8. How the mind-set segments respondents to the messages from the different websites. Impact value = coefficient.

Table 9 shows the strongest performing elements for each mind-set, as well as the corresponding performance of the same element among the total panel, which includes the mind-set as one of four contributing groups. It is clear from Table 9 that for the Total Panel, virtually no element performs well, as we saw above in Table 7.

Mind Genomics-007 IJOT Journal_F9

Figure 9. The PVI (Personal Viewpoint Identifier) for arthritis. The left section of the PVI shows the six questions and the two-point scale. The right section of the PVI shows the three feedback screens, corresponding to the three mind-sets (Mind-Set 1 & 2, Mind-Set 3, Mind-Set 4.)

Table 9. Strongest performing elements for the four mind-set segments

Text

Source

Total

Mind Set


Additive Constant


Mind-Set 1 – Not responsive (Additive Constant=69)


 48

69

PR01

Learn more about the new ‘Speaking of Pain’ program, and find out how you can request a free brochure

Art.Org

3

2


Mind-Set 2 – Wellness (Additive Constant=53)


 48

 53

EX03

Disease Center – Check here when you have questions about a medical condition

Art.Org

1

6

NE08

Visit Living Well, a place to discover how to eat right and exercise properly

Mediconsult

1

6

NE06

Find out what makes a healthy diet

Merck

3

5


Mind-Set 3 – Live a good lifestyle with arthritis
(Additive Constant=39)


48

39

GI14

Find useful information targeted to your age group, such as nutrition, fitness, support groups, conditions, diseases and more

Art.Org

3

15

CM11

Receive a twice-weekly free newsletter complete with expert advice on exercise, nutrition, and more

DrKoop

1

14

RS04

Search the Internet and our database for healthcare websites, hospitals and support

Cyberidiet

1

14

PR04

Our site follows the On-line Privacy Guidelines and the Guidelines on ‘Ethical Business Practice’

Art.Org

0

13

EX07

Our disease topics have expanded information about living with diseases, finding support, the latest news and more

Art.Central

0

13

EX04

Read medical minutes and ask questions about your health

Mediconsult

2

13

GI23

Read about the types of arthritis and treatments in the ‘Arthritis Answers’

Web.Med

3

13

NE06

Find out what makes a healthy diet

Merck

3

13

PR10

We have very strict policies and procedures designed to protect the privacy of our visitors

Mediconsult

0

13

GI21

Read about different types of arthritis and treatments

Art.Org

2

12

EB03

Visit Living Well…a place to discover how to strengthen your emotional health while living with a chronic condition

Art.Org

2

12

GI25

Tips for managing arthritis…bite-sized chunks of information with links to longer articles

Art.Org

2

11

NE11

We have great, healthy recipes, as well as information about vitamins, diet and medical conditions

Art.Org

4

11

RS13

Our new Caregiver Center can help with information and support for both givers and receivers of care

DrKoop

1

11

PR08

We have established practices and procedures to ensure that our privacy policies are effectively implemented

Art.Com

-1

11

PR09

We have engaged outside independent audits of our policies and practices

Art.Com

1

11

RS01

Click here for comprehensive information about your health

Merck

1

11

GI13

Find out how to protect yourself from bone loss

Merck

1

11

GI06

An archive of feature articles about all aspects of arthritis

Art.Support

0

11

AD09

Fight for more research funding, insurance coverage for medications and the rights of people with arthritis

DrKoop

2

11

NE12

Staying active is important for people with arthritis

Merck

0

11

PR07

We do not sell any personal information about our visitors, including e-mail addresses

Art.Org

0

11


Mind-Set 4 – Search for help & community
(Additive Constant = 30)


48

30

SH03

Shop for arthritis-friendly products

Art.Org

1

16

GI11

Explore types of arthritis and treatments in the ‘Arthritis Answers’

Art.Central

4

16

NE14

We recommend that before you start any exercise program, it is important that your physician examines you to see which types of exercise would be best for you

Merck

5

16

CM22

The message board is a great way for you to exchange ideas, thoughts, and express yourself

Art.Org

-2

15

GI01

View our online checklist on how to monitor medication use for seniors

DrKoop

-2

15

WF10

These guides will help you find information fast

Mediconsult

1

15

RS17

The Manual of Medical Information transforms the language of the professionals’ version into commonly used English

Merck

3

14

EB04

Welcome to the message boards – a place for you to connect with others, where new relationships and ideas can be formed and shared

Art.Central

0

14

SH01

Buy all your arthritis-care products here in the online store. Just click on a product link to browse hundreds of items

Cyberidiet

1

14

WF07

Give us your feedback about our site

Merck

2

14

CM20

The discussion group message board is moderated daily by a professional

Art.Org

3

13

WF18

Your personalized program can help you learn how to start and maintain a fitness program

DrKoop

1

13

WF13

Your personalized program can help you learn how to eat healthier foods

Cyberidiet

1

12

GI08

Read about arthritis lifestyle information – aquatics programs, exercise programs and other movement ideas

Art.Org

-1

12

EB01

Manage your arthritis and improve your life

Art.Org

1

12

SH06

Refill your prescriptions, find drug information and check drug interactions at the online pharmacy

DrKoop

0

12

GI04

A nationwide network of more than 2,000 diagnostic, surgical, and rehabilitation centers for the most up-to-date arthritis treatments

Mediconsult

0

12

SH04

You can fill prescriptions online

Mediconsult

0

12

EB06

The path to a healthy lifestyle

Art.Com

1

12

NE05

Print out your meal plan and follow it to a new you…recipes and a shopping list are included

Merck

1

12

WF12

Services for you…helpful tools and contact information

Merck

-1

12

CM18

Stop by the message boards and find others who share your interests and concerns

Art.Org

1

11

AD08

Enter a race or walk to raise funds needed for programs and research

DrKoop

0

11

EX02

Ask our fitness and nutrition expert any questions you may have

Art.Org

0

11

SH02

Order free brochures or buy an exercise tape in the Arthritis Store

Mediconsult

3

11

WF01

Take three or more health quizzes and enter to win a free tee-shirt

Merck

2

11

RS08

Sort through our Health Library Index – See a complete list of all arthritis articles

Art.Org

0

11

CM07

Be a smart reader! Anyone can visit and post messages on our boards

DrKoop

1

11

EX06

Minor Medical Directory – Click here for information about everyday health concerns

Art.Com

1

11

WF15

Your personalized program can help you learn how to make informed decisions about your treatment options

Cyberidiet

2

11

GI23

Read about the types of arthritis and treatments in the ‘Arthritis Answers’

Web.Med

3

11

GI18

Looking for something specific or just want to browse? See the list of all articles in the Health Library

Art.Org

2

11

GI03

Taking Safety Measures…If you are at risk for osteoporosis, learn how to prevent falls and back injury

Merck

1

11

The strong performance of the elements is mirrored in the strong performance of some of the visuals. Table 10 lists the strong performing visuals. Only Mind-Set 3 and 4 respond strongly to the visuals, responding to different visuals. What appeals to one mind-set may be irrelevant to the other mind-set, and certainly irrelevant to Mind-Sets 1 and 2.

Table 10. Response of the four mind-sets to strongly visuals. The table shows only those elements whose coefficients were 10 or higher, denoting a strong positive response to the visual.

Total

Mind-Set1

Mind-Set2

Mind-Set3

Mind-Set4

Mind-Set 1 – Not responsive

Mind-Set 2 – Wellness

Mind-Set 3 – Live a good lifestyle with arthritis

Women wrapped in towel, holding pills

-1

-7

1

11

-2

Four women exercising on mats

0

-6

-6

11

4

Grandparents, with grandchild in middle

0

-6

-8

10

5

Two doctors standing reviewing X rays

1

-8

4

10

4

Mind-Set 4 – Search for help & community

X rays of hands, showing ‘hot spots’

-1

-12

-14

2

15

Two hands holding each other

-1

-7

-15

0

13

Two doctors seated, reviewing X rays

1

-6

-9

2

12

Back of women with spinal cord highlighted

-1

-7

-12

0

11

Mature couple, wife looking at husband

1

-8

-8

8

10

Table 11 shows the composition of the four mind-sets, which are not quite equally distributed. It should become clear that to discover these mind-sets in the population will not be easy. The mind-sets appear to be distributed so that the four mind-sets are distributed approximately equally in each self-defined subgroup.

Table 11. Composition of the four mind-sets


Total

Mind-Set 1

Mind-Set2

Mind-Set3

Mind-Set4

Base size:

144

41

32

25

46


%

%

%

%

%

Total sample

100

100

100

100

100

Gender-Males

78

76

75

76

72

Gender-Females

22

24

25

24

28

Age-35–54

52

56

56

60

41

Age-55 and older

48

44

44

40

59

Use-Other Pain Reliever

58

59

47

64

61

Use-Tylenol

44

37

66

36

39

Arthritis Medication

18

5

13

40

22

Information from Doctor

89

85

81

88

98

Information from Media

60

71

53

60

57

Information from Print

56

56

50

68

52

Information from Drugstore/Pharmacy

56

46

69

56

54

Information from Web

51

66

47

44

46

Information from Social Network

44

46

41

48

43

Has Arthritis

80

85

69

80

83

Merging Mind-Sets 1 & 2, and finding the mind-sets in the general population for health promotion

This final section of the analysis focuses on the creation of a system to assign ‘new individuals’ to one of the mind-sets. As a preliminary step, we will combine Mind-Sets 1 and 2 into one mind-set, because neither mind-set seems to respond strongly to elements. This action, combining mind-sets, leaves us with Mind-Set (1 + 2), Mind-Set 3, and Mind-Set 4.

The messages and their corresponding coefficients work at this moment on the obtained data. In order to expand this knowledge on a wider population, modelling is needed in which we use the existing data (e.g. the coefficients of each element along with the segment membership) and create an ‘assignment model, ’ which we call the PVI (personal viewpoint analyzer.) The PVI can later be used to assign segment membership to new individuals.

Our first job is to make the assignment model easy to administer and analyze. Easy means making the assignment model, the PVI, short. In order to make the study shorter, we need to decrease the number of questions. The decrease in the number of questions is accomplished by selecting the most discriminating elements, e.g. those which show the highest deviation between the segments. This process identifies six text elements out of the 151 tested. These six elements end us as the base of the online personal viewpoint identification tool (PVI). As noted above, during the PVI development we merged the first two mind-sets in order to filter out respondents with low interest towards the elements.

The PVI instructs the to-be-typed participants to read the elements and rate each of them based on two-point scale. The six rating-questions and scale endpoints are similar to those used in the main study in order to keep consistency as much as possible. Participants are instructed to provide their e-mail address, which simply serves as an example in this case. Any other identification data can be used depending on the needs of the group authorizing the typing. The typing immediately leads to a web-site with the proper message for the respondent who is typing, based upon the respondent’s assigned mind-set.

As soon as the participants answered all questions and indicated their e-mail addresses, the PVI computes the most probable segment membership of the given respondent. The PVI stores the answers and e-mail address, which are suitable to get an overview of the participants or the ratio of the segments in the population. Participants are thanked for their participation by a thank you message which also presents their most probable segment membership. The thank you screen indicates the name of the segment the given participant belongs to along with a short description of the segment in order to give detailed information about the segment. By clicking on the refresh button of the browser, a new PVI test starts. Figure 9 shows the PVI tool for arthritis. The PVI is available on the following link: http://162.243.165.37:3838/TT02/

Discussion and Conclusion

This study revealed the patient perspective regarding effective communication messaging in arthritis. The communication messaging to promote self-management of arthritis suggest either three or four mindset-segments, depending upon how one considers mind-sets which do not ‘tell a clear story.’ This study illustrated how a medical professional may rapidly assign a person showing up in the clinic into the most likely, appropriate mind-set segment, and in turn know ahead-of-time the type of messages and treatment to which this specific new patient will respond.

People in the first mindset are not responsive to any communication. People in the second mind-set positively respond to communication messaging that target higher general wellness. These two mind-sets can be combined because there is little to strongly attract them. People in the third mind-set segment positively respond to communication messaging which emphasize a good lifestyle allowing time with family and becoming more health literate regarding Arthritis. People in the fourth mind-set segment respond positively to messaging which focus on relationships, emotional support and community.

 The ability of a medical professional to easily tailor communication messaging to an individual by mind-set segment, echoes advanced health policies of personalized medicine. Tailored communication may make a vast difference in creating patient-physician collaboration, higher health literacy, higher engagement, and better choices in a shorter process to self-management of Arthritis [26].

References

  1. Hawker GA, Stewart L, French MR, Cibere J, Jordan JM, et al. (2008) Understanding the pain experience in hip and knee osteoarthritis—an OARSI/OMERACT initiative. Osteoarthritis Cartilage 16: 415–422. [crossref]
  2. Woolhead G, Gooberman-Hill R, Dieppe P, Hawker G (2010) Night pain in hip and knee osteoarthritis: a focus group study. Arthritis Care Res (Hoboken) 62: 944–949. [crossref]
  3. Rosemann T, Wensing M, Joest K, Backenstrass M, Mahler C, et al. (2006) Problems and needs for improving primary care of osteoarthritis patients; the views of patients, general practitioners and practice nurses. BMC Musculoskelet Disord 7: 48.
  4. Gignac MA, Davis AM, Hawker G, Wright JG, Mahomed N, et al. (2006) “What do you expect? You’re just getting older”: a comparison of perceived osteoarthritis-related and aging-related health experiences in middle- and older-age adults. Arthritis Rheum 55: 905–912.
  5. Zuidema RM, Repping-Wuts H, Evers AWM, Van Gaal BGI, Van Achterberg T, et al. (2015) What do we know about rheumatoid arthritis patients’ support needs for self-management? A scoping review. International journal of nursing studies 52: 1617–1624.
  6. Boers M, Dijkmans B, Gabriel S, Maradit-Kremers H, O’Dell J, et al. (2004) Making an impact on mortality in rheumatoid arthritis: targeting cardiovascular comorbidity. Arthritis Rheum 50: 1734–1739.
  7. Kennedy A, Rogers A, Bower P (2007) Support for self care for patients with chronic disease. British Medical Journal 335: 968–970.
  8. van Houtum L, Rijken M, Heijmans M, Groenewegen P (2013) Self-management support needs of patients with chronic illness: do needs for support differ according to the course of illness? Patient Educ Couns 93: 626–632.
  9. Gabay G (2015) Perceived control over health, communication and patient–physician trust. Patient education and counseling 98: 1550–1557.
  10. Gabay G, Moskowitz HR, Silcher M, Galanter E (2017) The New Novum Organum: Policy, Perceptions and Emotions in Healthcare. Pardes-Ann Harbor Academic Publishing.
  11. Gabay G (2016) Exploring perceived control and self-rated health in re-admissions among younger adults: A retrospective study. Patient education and counseling 99: 800–806.
  12. Wilcox S, Der Ananian C, Abbott J, Vrazel J, Ramsey C, et al. (2006) Perceived exercise barriers, enablers, and benefits among exercising and non-exercising adults with arthritis: results from a qualitative study. Arthritis Rheum 55: 616–627.
  13. Parsons GE, Godfrey H, Jester RF (2009) Living with severe osteoarthritis while awaiting hip and knee joint surgery. Musculoskelet Care 7: 121–135.
  14. Browne K, Roseman D, Shaller D, Edgman-Levitan S (2010) Analysis and Commentary: Measuring patient experience as a strategy for improving primary care. Health Affairs 29: 921–925.
  15. Law RJ, Breslin A, Oliver EJ, Mawn L, Markland DA, et al. (2010) Perceptions of the effects of exercise on joint health in rheumatoid arthritis patients. Rheumatology (Oxford) 49: 2444–2451.
  16. John H, Hale ED, Treharne GJ, Carroll D, Kitas GD (2009) ‘Extra information a bit further down the line’: rheumatoid arthritis patients’ perceptions of developing educational material about the cardiovascular disease risk. Musculoskelet Care 7: 272–287.
  17. Mann C, Gooberman-Hill R (2011) Health care provision for osteoarthritis: concordance between what patients would like and what health professionals think they should have. Arthritis care & research, 63: 963–972.
  18. Ahlmen, M, Nordenskiold U, Archenholtz B, Thyberg I, Ronnqvist R, et al. (2005) Rheumatology outcomes: the patient’s perspective. A multicentre focus group interview study of Swedish rheumatoid arthritis patients. Rheumatology (Oxford) 44: 105–110.
  19. Makelainen P, Vehvila¨inen-Julkunen K, Pietila¨ A (2009) Rheumatoid arthritis patient education: RA patients’ experience. Journal of Clinical Nursing 18: 2058–2065.
  20. Kristiansen TM, Primdahl J, Antoft R, Horslev-Petersen K (2012) Everyday life with rheumatoid arthritis and implications for patient education and clinical practice: a focus group study. Musculoskelet Care 10: 29–38.
  21. Ward V, Hill J, Hale C, Bird H, Quinn H, et al. (2007) Patient priorities of care in rheumatology outpatient clinics: a qualitative study. Musculoskelet Care 5: 216–228.
  22. Pier CS, Shandley KA, Fischer JL, Burstein F, Nelson MR, et al. (2008) Identifying the health and mental health information needs of people with coronary heart disease, with and without depression. Med J Aust 188: 142–144.
  23. Reed M, Harrington R, Duggan A, Wood VA (2010) Meeting stroke survivors’ perceived needs: a qualitative study of a community-based exercise and education scheme. Clinical Rehabilitation 24: 16–25.
  24. Taylor DM, Cameron JI, Walsh L, McEwen S, Kagan A, et al. (2009) Exploring the feasibility of videoconference delivery of a self-management program to rural participants with stroke. Telemed. e-Health 15: 646–654.
  25. Moskowitz HR, Martin D (1993) How computer aided design and presentation of concepts speeds up the product development process. In Esomar Marketing Research Congress: 405.
  26. Chilton F, Collett RA (2008) Treatment choices, preferences and decision-making by patients with rheumatoid arthritis. Musculoskelet Care 6: 1–14.
  27. Ryan S, Hassell A, Dawes P, Kendall S (2003) Perceptions of control in patients with rheumatoid arthritis. Nurs Times 99: 36–38. [crossref]
  28. Kennedy A, Rogers A, Bowen R, Lee V, Blakeman T, et al. (2014) Implementing, embedding and integrating self-management support tools for people with long-term conditions in primary care nursing: a qualitative study. International Journal of Nursing Studies 51: 1103–1113.

Understanding Effective Web Messaging – The Case of Menopause

DOI: 10.31038/IGOJ.2019222

Abstract

We present a study of messages ‘scraped’ from websites dealing with the topic of menopause. Through Mind Genomics it becomes straightforward to identify how each element drives interest. We show how to estimate the impact of untested elements. We finish with the demonstration that there are at least three dramatically different mind-sets, responding to different messages, along with a very large group of people who are indifferent to most messages. The different mind-sets can be identified by an easy-to-use and short Personal Viewpoint Identifier (PVI). The PVI provides the communicator with the opportunity to tailor the messages so that the correct message can be sent to each woman.

Keywords

Communication; Menopause; Messaging; Mindset-segmentation; Health-Marketing; Well-Being

Introduction

At the time of this writing, menopause remains a fact of life for women age 40 or older. The concern is not medical, but rather involves medical concerns. The focus of society on staying young and fit, coupled with the inevitable body changes which occur before and during menopause, causes, in its wake, a great deal of anxiety. The anxiety is manifested by the proliferation of websites dealing with menopause.

Attitudes towards menopause and health promotion

Menopause manifests itself in many ways. Symptoms of menopause include cardiac trouble, lack of drive, urological symptoms, sexual disturbances, vaginal dryness, joint and muscle symptoms, drop in performance, hot flashes, depression and agitation [1]. Some symptoms of menopause have been reported to be extremely common. Hot flushes and night sweats affect about 70% of European and American women and are the most common symptoms reported during menopause. These are not the only symptoms, and indeed the manifesting symptoms vary. Differences in symptoms are attributed to diet, body mass index, exercise and mood, as well as to attitudes towards menopause [2, 3].

 There is more to menopause than the physical symptoms. There is the way the woman responds to the entire gestalt, including aging and the virtually impossible to ‘cure’ menopause. An attitude towards menopause is one’s opinion or general feelings about the menopause’ [4, 5]. The reported literature does not present a clear picture of how attitudes co-vary with, and drive responses to menopause. One’s menopause may be perceived as a medical condition or as a natural phenomenon with positive or negative social changes attributed to this transition [6].

Previous studies reported significant associations between attitudes and symptoms of menopause [4, 7]. The data suggested that the negativity of one’s attitude, the higher the symptoms frequency (i.e., such as irritability, sleeplessness, and headaches; [4]). A few cross-sectional studies reported no significant relationship between menopausal attitude and the severity of symptoms [8]. Furthermore, women with more negative attitudes prior to menopause report a higher frequency of hot flush reporting later on [4].Younger women and pre-menopausal women reported the most negative attitudes towards menopause.

Interventions to change cognitions regarding menopause may improve attitudes, and significantly reduce the perceived severity of physiological, psychological and social symptoms. Social support and education are associated with more positive attitudes. In contrast, depression is associated with both negative attitudes and menopausal symptoms [4]. The most frequent and bothersome symptoms reported are psychological and physical symptoms such as irritability, tiredness, depressed feelings, memory problems and aches and pains [4].

Understanding the specific attitudes towards pre-menopause and menopause might enable clinicians to affect the person’s cognition of the entire trajectory of menopause, and if properly done, perhaps reduce the person’s negative attitudes towards menopause.  Reducing negative attitudes may reduce the perceived frequency and severity of symptoms, with the benefit to promote health and quality of life during menopause. This study focuses on attitudes towards menopause within the English-speaking culture, and specifically on the responses to messages about menopause that are found on the Internet, on web pages. This study, in English, represents a first attempt to understand the response to web-based messages. Researchers have recognized that a full understanding of menopause must encompass data from several culture, so one can consider this project a first step, albeit a wide-ranging first step [1, 4, 9].

From other research both in consumer groups and across medical issues, there continues to emerge the realization that people are not alike. Marketers, of course, have known this for a half century or more, and have offered different products in the same category to satisfy these different groups, so-called consumer segments.

How then does the marketer uncover the messages which attract people when they read websites? The marketers know that they must have a clear ‘call to action, ’ but how does one move the reader to take action? Marketers believe that people in so-called segments respond to the same messages, and therefore the holy grail of marketing is to discover those segments. Methods such as geo-demographic analysis (WHO the person IS), or behavior analysis (WHAT does the person SEARCH for) are today’s favorites. The former is known as psychographic analysis, assuming that people who have the same attitudes towards a topic will, of course, react to the same messages. The latter is known as behavioral segmentation. Behavioral segmentation has become increasing popular as the Internet has grown. The Internet, allowing the marketer to understand the topics for which a person searches, the websites that the person reaches, and the path of navigating through the website and onwards to other websites. In other words, to the marketer, the answer ‘must be in there, ’ simply because the website seems to encapsulate wants, actions, and thus should yield motives through deeper analysis. Whether or not the deeper analyses actually provide a sense of ‘motives’ remains a question.

About three decades ago, author Moskowitz suggested a different approach, indeed one pre-dating the behavioral segmentation. The ingoing assumption of the approach, later to be named Mind Genomics [10, 11] was that the understanding of motivation might be more rapidly achieved through small experiments. These experiments present the respondent with combinations of messages of different types, all from the same topic area (e.g., menopause for the current paper.) The respondent’s task is to rate the combination as a single offering. There is no way that the respondent can understand the underlying structure by which the messages or elements are combined. Thus, the respondent must react at almost an intuitive, ‘gut level.’ The statistical procedures within Mind Genomics deconstruct the response to these tested combinations, the vignettes, showing the contribution of each element or message to driving the response.

Mind Genomics applied to the problem of messaging in websites, has the potential to easily and quickly reveal messages which motivate the total panel, as well as the nature new, unexpected groups of ideas, mind-sets, and the groups of people to whom these groups of ideas appeal, as well as groups of people to whom the ideas fail to appeal, and may even repel. These mind-sets allow the marketer to better understand the respondent, and to improve the cogency of the message in the website. In this study we focus on messaging for menopause.

Method

The basic steps in our study of menopause using Mind Genomics begin with an analysis of what is being featured by ‘scraping’ the websites and end up with segmentation results to shown different mind-sets.

  1. Create raw materials: The elements comprise both text phrases ‘scraped’ from websites dealing with menopause, as well as relevant pictures from the same set of websites. The websites are over a decade old; none of the specific material can be considered current. The fact that the material is not current is not relevant. As we will see, it is the nature of the messages which teach us a lot, as well as the discovery that most of the messages do not drive interest in the website, despite that the messages are about the topic, menopause. No, everything works, as we will soon demonstrate.
  2. Select a workable number of elements, and, when necessary for clarity, edit the elements but keep their tonality: The elements include text elements as well as visual elements. In most cases the elements require a slight amount of editing to make sure that they can ‘stand alone, ’ or be combined in messages with other elements.
  3. Classify the elements: Mind Genomics requires that we place the elements into mutually compatible groups, and assign each element or message to one of the groups (silos.) The silos will be irrelevant for the analysis but will ensure that mutually contradictory elements never appear together. In a sense we can consider the classification task as akin to ‘bookkeeping.’ Table 1 presents the different elements, classified into silos.
  4. Dimensionalize the elements: The objective here is to locate each element in a set of five dimensions, these dimensions being relevant to the elements. A small group of six individuals profiled each element on every one of the five dimensions. From the five-dimensional profile of each element, the Mind Genomics algorithm calculated the eight ‘nearest neighbors’ in the five-dimensional space. The distance between each pair of elements was defined as the Euclidean distance computed in five dimensions.
  5. Invite panelists to participate, working with a company which specializes in internet-based studies: There are many of these panel providers world-wide. The respondents for this study were members of a panel provider specializing in internet-based studies (Open View, Inc. in Toronto, CA.) The panel provider sent out invitations which told the female respondents about a study, and the chance to win a sweepstakes prize. Those respondents who were members of the Open View panel and agreed to participate were led to the welcome page, shown in Figure 1.
  6. Create the test vignettes (combinations of elements.): A test vignette comprised 25 combinations of elements. The Mind Genomics algorithm selected five silos, and four elements from each silo. The elements were combined into 25 vignettes, with the property that each vignette contained 2–4 elements, with a vignette comprising no more than one element from a silo, but often no element from the silo. The frequency of selection of each element was equal across all the respondents, although each respondent sampled only a small set (20 elements) of the much larger total. The Mind Genomics system ensured that the 20 elements in a design end up as statistically independent of each other, allowing later analysis by OLS (ordinary least-squares) regression. Figure 2 shows an example of a vignette
  7. Design of the vignettes: Each experimental design selected a set of five silos, and a random four elements from each silo. From the selection of the 20 elements, the experimental design constructed 25 combinations with the property that the elements were statistically independent of each other. This was done twice, so each respondent ended up evaluating up to 40 different elements, arranged in a total of 50 combinations. Figure 2 shows an example of one of the combinations created by the design.
  8. Respondent instruction: The respondent was instructed to read the vignette, who participated evaluated two sets of 25 vignettes each (50 vignettes in total), created according to a basic experimental design which was permuted [12]. Each respondent thus evaluated two unique sets of 25 vignettes each with the vignettes randomized.
  9. Self-profiling classification: At the end of the experiment, approximately 15 minutes after the start, the respondent completed an additional classification questionnaire, which generated information about WHO the respondent is (age, market), MENOPAUSE-RELATED information, and other relevant information. Figure 3 shows one of the screens, which obtains information on the treatments that the respondent is using to treat menopause symptoms.
  10. Transform the ratings to a binary scale to prepare for regression: One of the foundations of Mind Genomics is the creation of equations relating the presence/absence of the elements in the vignettes to the rating. The respondents assigned each of 50 vignettes a rating from 1 (not interested) to 9 (interested.) Most managers have a difficult time understanding the meaning of a 9-Point Likert Scale. Some managers want the scale to be labelled at every point to understand the scale. A more productive way to ensure understanding bifurcates the scale, so that ratings of 1–6 are assigned the value ‘0’ and the ratings of 7–9 are assigned the value of ‘100.’ The final preparatory action is to add a small random number (<10–5) to each transformed value, so that the new dependent variables are not exactly 0 or 100, but slight variations. The small random number does not materially affect the regression analysis but ensures that the regression model ‘works.’
  11. Create the model by regression: The underlying experimental design ensures that the 40 elements combined into the set of 50 vignettes are statistically independent of each other. The statistical independence allows the researcher to apply OLS (ordinary least squares regression). The equation is:

    Binary Rating = k0 + k1(Element A1) + k2(Element A2) …. K50(Element J4)

    The equation shows that the binary rating can be expressed as an additive constant (k0) and the weight contribution of the 40 elements, with sets of four drawn from a single silo or category. The Mind Genomics algorithm ensures that each element in the study appears an equal number of times. The vignettes comprise a minimum of two elements, and a maximum of five elements.

  12. Estimate the coefficient of each untested elements for each respondent: In many of these studies, the desire is to create a complete model for respondent. The realities of times, however, especially with internet-based interviews, militates against large number of respondents spending as much as an hour or two on the internet. A more efficient way is to estimate the coefficients of untested elements. The approach is to profile each of the elements on a set of five semantic scales. The semantic scales allow us to define the distance between every pair of elements, using the standard Euclidean distance measure, albeit in five dimensions. Following this line of thought, we define the eight closest neighbors of every element, based on the Euclidean distances. For each respondent, we have those elements that we tested, and have coefficients. We put these into an order which is defined by their code number (the silo and the element in the silo.) We then proceed to estimate the coefficients of untested elements. We never change the coefficients of tested elements for a respondent. For the untested elements, we put in the starting value 0. We then begin from the first element. When the first element had been tested, we skip to the next element, the second element. When that element was not tested, we replace its value (starting with 0) with the average coefficient of the eight ‘closest neighbors.’ We proceed to the third element, and so forth. We continue this process, going back to the first element. We stop when the value of each untested coefficient stops changing. ‘Stops changing’ is defined as the magnitude of change being less than 0.01 in either direction when it comes time for the coefficient of the untested element to be re-estimated. The process is fast, and quite conservative. It underestimates the coefficients of untested elements, but still shows differences among the elements.

Mind Genomics-006_IGOJ Journal_F1

Figure 1. Welcome page for the menopause study.

Mind Genomics-006_IGOJ Journal_F2

Figure 2. Example of a vignette created by the Mind Genomics system.

Mind Genomics-006_IGOJ Journal_F3

Figure 3. One of the screens for the self-profiling questionnaire, completed after the respondent completed the evaluation of the 50 experimentally varied vignettes. This screen deals with the treatments that the respondent is using to treat symptoms of menopause.

Table 1. The elements classified into silos

Silo FA – Facts about menopause

FA01

Menopause is a natural event in a woman’s life

FA02

Smokers go through menopause two to three years earlier than their non-smoking peers

FA03

Menopause is established when menses have not occurred for a year

FA04

A hot flash lasts from 30 seconds to 5 minutes and may be followed by chills

FA05

Every woman is different

Silo GI – General Information

GI01

Sunburn will aggravate your hot flashes because burnt skin cannot regulate heat as effectively

GI02

Learn more about the effects of menopause on your health

GI03

Symptoms may last from a couple of years to eight years or more

GI04

Devoted to providing women with updated information

GI05

Several excellent reference books are for sale online

GI06

Early physical symptoms include hot flashes, night sweats and sleeplessness

GI07

Emotional problems at menopause include mood swings, crying spells and irritability

GI08

The average age at which menopause occurs is about 50 years

GI09

Estrogen replacement therapy can help prevent osteoporosis

GI10

Estrogen replacement therapy can help prevent atherosclerosis and coronary artery disease

GI11

Side effects of estrogen replacement therapy include nausea, breast discomfort, headache, and mood changes

GI12

Menopause may be natural, artificial, or premature

GI13

Estrogen replacement therapy…may prevent atherosclerosis and coronary artery disease

GI14

Estrogen may be given as a tablet or as a skin patch (transdermal estrogen)

GI15

Simple tests will accurately determine what’s going on and what stage of menopause you’re in

GI16

Progesterone is taken with estrogen to reduce the risk of endometrial cancer

GI17

Commonly, estrogen and progesterone are taken everyday

GI18

Don’t expect changes overnight

GI19

Hooking up with women in a menopause support group can really help

GI20

Women often experience many of the symptoms of menopause long before they have skipped a period

GI21

Experiencing hot flashes or insomnia can occur ten years before the last menstrual period

GI22

Menopause support groups can help

GI23

Mood swings can often accompany menopause

GI24

Share your experience with other women

Silo LC – Life changes to ameliorate symptoms and to feel healthier

LC01

If you smoke, cut down or quit

LC02

Avoid “trigger” foods such as caffeine, alcohol, spicy food, and sugar

LC03

Substitute coffee or regular tea for herbal teas

LC04

Exercise to improve your circulation

LC05

Reduce your exposure to the sun

LC06

Avoiding caffeine and alcohol can ease menopausal symptoms

LC07

Eating more fruits, vegetable and grain products while avoiding red meat and fat is even more important during menopause

LC08

Monitoring intake of fat, calcium, and vitamins can help treat problems associated with menopause

LC09

Dietary changes such as the supplement of soy foods may also help increase levels of estrogen

LC10

Actions you take can save your bones, protect your heart, preserve your sex life, improve your memory and allow you to live longer and happier

LC11

Getting enough calcium is important

LC12

A healthier lifestyle has to become a lifelong habit

LC13

Avoid spicy foods, alcohol and caffeine

LC14

With proper care and attention, we can all reach what Margaret Mead called a state of “post menopausal zest”

LC15

Menopause is a time for reassessment of our lives and health habits

LC16

Make as many healthy lifestyle changes as you can

LC17

Tell your friends and family what’s going on

Silo MP – Medical practice considerations

MP01

Discuss with your doctor the benefits of taking vitamin E supplements

MP02

Visit your gynecologist annually or semiannually

MP03

Ask questions and express your concerns

MP04

Review your health status with your doctor regularly

MP05

Discuss treatment side effects with your doctor

MP06

Prevent osteoporosis after menopause

MP07

Always consult your own doctor about any opinions or recommendations

MP08

Talk to your doctor to see what is right for you

MP09

Learning about all of the options will help you and your doctor make the best decisions for your care

MP10

Talk with your doctor about other methods or dosages

MP11

Inform your doctor of any personal and family medical changes

MP12

Have an annual physical examination, along with a pelvic exam, Pap smear and breast exam

MP13

Receive a yearly mammogram (breast x-ray)

MP14

Perform a breast self-exam each month

MP15

Report any abnormal vaginal bleeding

MP16

Have a yearly endometrial biopsy

MP17

Check blood pressure as often as your doctor suggests

MP18

Check your cholesterol before you start therapy

MP19

Ask for the lowest dose of estrogen to control symptoms

MP20

Review dosage levels of your hormone replacement therapy with your doctor periodically

MP21

Talk with your doctor about the risks and benefits of each type of treatment

MP22

Weigh the risks and benefits of hormone replacement therapy carefully with your doctor

MP23

Estrogen supplements are best known for preventing and treating osteoporosis

MP24

It’s important to have a complete medical history and physical examination taken

MP25

Never be afraid to ask your doctor questions!

Silo NR – Natural products and practices

NR01

Soy products contain high levels of plant estrogens (phytoestrogens)

NR02

Natural hormones are produced from plants and come in cream or pill form

NR03

Learn about natural therapies and hormone preparations

NR04

Naturopathic medicine uses herbs

NR05

Naturopathic medicine uses acupuncture

NR06

Many natural treatments are available

NR07

Homeopathic medicines can be helpful

NR08

Only very low doses of a natural estrogen are needed to prevent hot flashes and osteoporosis

NR09

Soy supplements are being marketed to women as hot flash cure-alls

NR10

Trying herbs on your own can be risky

NR11

Many women find natural and herbal remedies to be helpful

NR12

The most popular remedy to relieve symptoms associated with menopause is soy supplementation

NR13

Many remedies are available for hot flashes

Silo SR – Alleviating symptoms by specific products

SR01

Reduce the undesirable symptoms of menopause

SR02

Menopause symptoms can be treated by hormone replacement therapy

SR03

Know how to manage the symptoms…have a plan to stay healthy in the years ahead

SR04

Herbs can help some of the symptoms of menopause

SR05

Vitamins in higher than usual doses can help some of the symptoms of menopause

SR06

Herbal therapy may relieve some of the common discomforts associated with menopause

SR07

Herbs can alleviate some of the symptoms in some women

SR08

Soy isoflavones may help alleviate the symptoms of menopause

SR09

Regular physical exercise will help prevent or relieve many of the common discomforts of menopause

SR10

Symptoms are treated by restoring estrogen to premenopausal levels

SR11

The primary goals of estrogen replacement therapy are: relief of symptoms such as hot flashes, vaginal dryness, and urinary problems

SR12

Estrogen replacement therapy relieves hot flashes

SR13

Exercise can be beneficial for symptom relief

Silo TT – Hormonal, herbal, nutritional remedies

TT01

Talk to your doctor about whether you should receive postmenopausal hormone therapy

TT02

Consider taking a combination therapy that uses estrogen and progestin

TT03

Be alert for side effects from any treatment, including hormone therapy

TT04

Hormone therapy lowers cholesterol

TT05

Women are seeking herbal and nutritional therapies to ease hot flashes and other symptoms of menopause

TT06

Many herbal remedies may help ease some discomforts

TT07

Doctors feel comfortable recommending herbal or nutritional therapies for symptoms of menopause

TT08

Hormone replacement therapy has significant benefits in reducing the rapid bone loss that accompanies menopause

TT09

Hormone replacement therapy can help a woman reduce her risk for osteoporosis

TT10

Talk to your doctor about all the available options…decide which is best for you

TT11

Hormone replacement therapy helps preserve bone health

TT12

Traditional treatments…hormone replacement therapy…it all depends on YOU

TT13

A woman and her doctor must weigh the benefits against the risks before deciding whether to use estrogen replacement therapy

TT14

Find the right hormone combination for you

TT15

Estrogen replacement therapy may be appropriate for you

TT16

Many women feel better with estrogen treatment

TT17

Reassess your estrogen replacement therapy periodically

Silo VI – Visual

VI01

mindbody.gif

VI02

woman on the move.jpg

VI03

woman eating salad.jpg

VI04

woman with daughters.jpg

VI05

couple walking in woods.jpg

VI06

women jogging.jpg

VI07

woman at breakfast table.jpg

VI08

woman outdoors.jpg

The 552 respondents who participated generated results shown in Table 2. The table shows only a portion of the elements, those which generated a coefficient of 6 or higher, or a negative coefficient. The additive constant for interest in the web is 56, meaning that the conditional probability is over 50% that this targeted audience will be interested in the website on menopause. The surprise, however, is that only a few of the elements perform well, and none perform with a coefficient of 8 or higher. We conclude from Table 2 that either the “typical respondent” is scarcely interested, or that we have different groups of respondents, and that there is no single element which performs very well across all subgroups of respondents. It is a tribute to the web developers that no element ended up with a strongly negative coefficient, however.

Mind-Sets – the clue to more effective messaging

The foregoing results for Total Panel (Table 2) and for relevant subgroups (Table 3) suggest that the conventional way of dividing respondents does not uncover very strong messages, with ‘very strong’ operationally defined here as a coefficient higher than 10.51 (rounding up to 11) or higher. There are NO elements which score 11 or higher, either for total panel or for the self-defined subgroups based upon the self-profiling classification.

Table 2 . The strong performing elements, defined as having a coefficient above 6. The results come from the Total Panel of 552 respondents.

Additive constant for the total panel of 552 respondents

56

MP1

Discuss with your doctor the benefits of taking vitamin E supplements

7

GI15

Simple tests will accurately determine what’s going on and what stage of menopause you’re in

7

LC10

Actions you take can save your bones, protect your heart, preserve your sex life, improve your memory and allow you to live longer and happier

7

NR11

Many women find natural and herbal remedies to be helpful

6

GI6

Early physical symptoms include hot flashes, night sweats and sleeplessness

6

TT5

Women are seeking herbal and nutritional therapies to ease hot flashes and other symptoms of menopause

6

SR6

Herbal therapy may relieve some of the common discomforts associated with menopause

6

TT10

Talk to your doctor about all the available options…decide which is best for you

6

GI4

Devoted to providing women with updated information

6

NR10

Trying herbs on your own can be risky

6

GI19

Hooking up with women in a menopause support group can really help

–1

Strong performing elements by key subgroup
We can sort the data into the different groups based on a variety of characteristics. Table 3 shows the strong performing elements for the different ages, self-reported progress toward menopause, and respondents who have various symptoms. Only elements performing well in at least one subgroup are shown. To avoid a ‘wall of numbers’ we have operationally defined the value of 8 as the low value of the coefficient that we will accept.

Table 3. Strong performing elements for different subgroups, defined by age, stage of menopause, and symptoms reported

Mind Genomics-006_IGOJ Journal_F5

The answer to strong performing elements may lie in another way of thinking about respondents, not so much as people, but as a storage bin for a mind-set. In turn, a mind-set comprises a group of related ideas. The respondent is merely a protoplasmic-vehicle which holds these related ideas, and through testing allows these mind-sets to emerge. It is not the people, but the set of ideas which is the real essence of the mind-set: The foregoing distinction between the ideas and the people who hold these ideas, two different entities, emblemizes the difference between the way one thinks in general (measure the people, count the different opinions, tabulate), and the way one thinks with Mind Genomics (identify the mind-sets, and determine the distribution of these mind-sets in different populations.)

Uncovering mind-sets occurs through the statistical procedure of clustering. Each respondent generates a set of coefficients, one coefficient for each element, along with an additive constant. The set of coefficients emerge from measuring the coefficients of elements tested by the respondent, and then imputing the values for elements untested by the respondent. The imputation was described above in the section on estimating the coefficients of untested elements.

Clustering attempts to separate the elements, i.e., the respondents, into different, non-overlapping groups. The mathematics is based upon the minimization of distances between respondents within a cluster, and then maximizing the differences between the centroids of different clusters. Each respondent generated one coefficient per element, whether that coefficient was from an actually-tested element, or whose value was imputed for the respondent because the respondent did not actually test the element since the element never appeared in any of the respondent’s 50 vignettes.

The actual clustering algorithm is called k-means clustering. The clustering program used by Mind Genomics can be considered as a heuristic to divide a population of objects (here people) in a smaller, non-overlapping set of groups, segments, or in our terminology, ‘mind-sets.’

The specific algorithm is one of a family of related algorithms. We define the distance between two people as the value (1-Pearson R, Pearson Correlation.) We compute the Pearson correlation between the coefficients of two people, and then define the distance between those people as the value 1-R. When the Pearson correlation is 1.0, the distance is 0 (1 – 1 = 0.) A Pearson correlation of +1.0 means that the two sets of coefficients are perfectly aligned. It makes sense that the distance should be 0. In contrast, when the Pearson correlation is -1, the distance is 2.0 (1 – – 1 =2.) The negative correlation means that the two sets of coefficients travel in opposite directions. The respondents are most different from each other, and thus are separated by the greatest distance.

When we cluster the respondents to uncover mind-sets, we do so with at least two objectives:

  1. Parsimony. The fewer the number of mind-sets emerging from the study, the better the segmentation in terms of mathematical ‘elegance.’ Furthermore, it is important to minimize the number of segments in order to make the application easier. The fewer the number of segments or mind-sets, the easier it will be to create separate strategies to communicate with these mind-sets.
  2. Interpretability. Opposing the objective of parsimony is the objective is having the mind-sets very focused, very single-minded. The greater the number of mind-sets, the more likely it will be that the emergent mind-sets will be single-minded, albeit of smaller size.

The analysis of these data suggests that four segments, four emergent mind-sets, represent a good compromise. Table 4 shows the strongest performing elements from each segment. By strong performing we operationally define coefficients of 11 or higher as ‘strong’ performing. There is no hard and fast rule about what is ‘strong, ’ but when we work with large numbers of elements with imputation of values for untested elements, the likelihood of having elements of 11 or higher from the total panel is low. We can feel comfortable with this value of 11 as a signal of a relevant element.

Table 4. The four mind-sets for menopause. The elements are those which perform strongly for each mind-set. The number on the right is the coefficient.

Strong performing elements for each mind-set

Coeff

Mind-Set 1, n=153, Additive constant =74, Highly interested in a menopause- oriented website, but no elements move them beyond their basic high interest

Mind-Set 2, n=141, Additive constant = 53, Menopause simply as a part of life

FA1

Menopause is a natural event in a woman’s life

11

VI7

woman at breakfast table.jpg

11

GI20

Women often experience many of the symptoms of menopause long before they have skipped a period

11

Mind-Set 3, n=141, Additive constant = 45, Takes supplements

MP1

Discuss with your doctor the benefits of taking vitamin E supplements

15

LC10

Actions you take can save your bones, protect your heart, preserve your sex life, improve your memory and allow you to live longer and happier

15

SR6

Herbal therapy may relieve some of the common discomforts associated with menopause

14

NR10

Trying herbs on your own can be risky

13

NR1

Soy products contain high levels of plant estrogens (phytoestrogens)

13

GI4

Devoted to providing women with updated information

12

SR4

Herbs can help some of the symptoms of menopause

12

NR12

The most popular remedy to relieve symptoms associated with menopause is soy supplementation

12

GI15

Simple tests will accurately determine what’s going on and what stage of menopause you’re in

12

MP7

Always consult your own doctor about any opinions or recommendations

12

MP8

Talk to your doctor to see what is right for you

12

SR3

Know how to manage the symptoms…have a plan to stay healthy in the years ahead

12

MP9

Learning about all of the options will help you and your doctor make the best decisions for your care

12

SR13

Exercise can be beneficial for symptom relief

12

MP10

Talk with your doctor about other methods or dosages

12

TT5

Women are seeking herbal and nutritional therapies to ease hot flashes and other symptoms of menopause

11

TT10

Talk to your doctor about all the available options…decide which is best for you

11

TT7

Doctors feel comfortable recommending herbal or nutritional therapies for symptoms of menopause

11

GI2

Learn more about the effects of menopause on your health

11

TT12

Traditional treatments…hormone replacement therapy…it all depends on YOU

11

Mind-Set 4, n=117, Additive constant = 48, Takes replacement therapy

GI15

Simple tests will accurately determine what’s going on and what stage of menopause you’re in

20

SR10

Symptoms are treated by restoring estrogen to premenopausal levels

19

MP20

Review dosage levels of your hormone replacement therapy with your doctor periodically

19

SR12

Estrogen replacement therapy relieves hot flashes

19

TT16

Many women feel better with estrogen treatment

18

SR2

Menopause symptoms can be treated by hormone replacement therapy

18

MP19

Ask for the lowest dose of estrogen to control symptoms

18

SR11

The primary goals of estrogen replacement therapy are: relief of symptoms such as hot flashes, vaginal dryness, and urinary problems

18

TT2

Consider taking a combination therapy that uses estrogen and progestin

18

TT1

Talk to your doctor about whether you should receive postmenopausal hormone therapy

18

MP24

It’s important to have a complete medical history and physical examination taken

17

MP22

Weigh the risks and benefits of hormone replacement therapy carefully with your doctor

17

TT3

Be alert for side effects from any treatment, including hormone therapy

17

LC8

Monitoring intake of fat, calcium, and vitamins can help treat problems associated with menopause

17

TT17

Reassess your estrogen replacement therapy periodically

17

TT9

Hormone replacement therapy can help a woman reduce her risk for osteoporosis

17

SR1

Reduce the undesirable symptoms of menopause

16

MP23

Estrogen supplements are best known for preventing and treating osteoporosis

16

GI13

Estrogen replacement therapy…may prevent atherosclerosis and coronary artery disease

16

MP6

Prevent osteoporosis after menopause

16

TT15

Estrogen replacement therapy may be appropriate for you

16

TT8

Hormone replacement therapy has significant benefits in reducing the rapid bone loss that accompanies menopause

16

MP5

Discuss treatment side effects with your doctor

15

MP13

Receive a yearly mammogram (breast x-ray)

15

LC6

Avoiding caffeine and alcohol can ease menopausal symptoms

15

GI17

Commonly, estrogen and progesterone are taken everyday

15

GI11

Side effects of estrogen replacement therapy include nausea, breast discomfort, headache, and mood changes

14

LC10

Actions you take can save your bones, protect your heart, preserve your sex life, improve your memory and allow you to live longer and happier

13

MP10

Talk with your doctor about other methods or dosages

13

TT14

Find the right hormone combination for you

13

GI14

Estrogen may be given as a tablet or as a skin patch (transdermal estrogen)

13

SR13

Exercise can be beneficial for symptom relief

12

NR13

Many remedies are available for hot flashes

12

LC7

Eating more fruits, vegetable and grain products while avoiding red meat and fat is even more important during menopause

12

LC11

Getting enough calcium is important

12

TT11

Hormone replacement therapy helps preserve bone health

12

GI10

Estrogen replacement therapy can help prevent atherosclerosis and coronary artery disease

12

MP16

Have a yearly endometrial biopsy

12

MP1

Discuss with your doctor the benefits of taking vitamin E supplements

11

NR1

Soy products contain high levels of plant estrogens (phytoestrogens)

11

SR3

Know how to manage the symptoms…have a plan to stay healthy in the years ahead

11

LC9

Dietary changes such as the supplement of soy foods may also help increase levels of estrogen

11

MP21

Talk with your doctor about the risks and benefits of each type of treatment

11

MP12

Have an annual physical examination, along with a pelvic exam, Pap smear and breast exam

11

MP15

Report any abnormal vaginal bleeding

11

MP18

Check your cholesterol before you start therapy

11

MP14

Perform a breast self-exam each month

11

GI16

Progesterone is taken with estrogen to reduce the risk of endometrial cancer

11

The four segments are:

  1. Mind-Set 1, n=153, Additive constant =74, No elements are strong
  2. Mind-Set 2, n=141, Additive constant = 53, Menopause simply as a part of life
  3. Mind-Set 3, n=141, Additive constant = 45, Takes supplements
  4. Mind-Set 4, n=117, Additive constant = 48, Takes replacement therapy

Quite often in these studies there are mind-sets which do not respondent strongly to any individual elements. That does not mean that the mind-set is indifferent. For our 552 respondents, the first emergent mind-set comprises 153 individuals who at a basic level are very interested in a menopause website (additive constant = 74), but no element strongly moves their basic interest beyond that very

Finding these segments in the population

It is clear from the results in Table 4 that the respondents in the mind-sets are far more likely to have a positive feeling to messages tuned to their particular mind-set. The world of modest-only performance is not a condemnation of those who create content, but rather a reflection of a bland world of messaging which conceals within it treasures. Although Mind-Set 1 has no elements to which it responds strongly, and although Mind-Set 2 has only three elements to which it responds strongly, Mind-Sets 3 and 4, respectively, respond in a remarkably strong way to selected messages, and indeed to quite a number of these messages. It will be those mind-sets who will respond to the appropriate messages.

The next questions which naturally arises is how does one discover these mind-sets in the population at large? We cannot force respondents to participate in a 30-minute test to determine the pattern of their responses. Rather, we must search for better ways. One might look at the other patterns of behavior and attitude self-reported by the respondents, shown in the Appendix to this paper. The patterns are quite similar across respondents in the four mind-sets, suggesting that any attempt to isolate the respondents by their self-reported responses, especially WHO THEY ARE, and WHAT THEY DO, is likely to fail.

A separate approach, pioneered by author Gere creates a small set of questions, based upon the patterns of coefficients the three mind-sets (Mind-Set 1&2 combined, Mind-Set 3, Mind-Set 4, respectively.) The coefficients are selected so that their patterns maximally differentiate among pairs of mind-set segments. The result is an efficient set of six elements, based upon the elements, the elements phrased as questions to be answer by either NO or YES, or some similar binary response. A respondent is presented with the six questions. The pattern of responses dictates the assignment to the segment membership. The output can be either a short report to the respondent doing the typing, a record for one’s medical record, or even the re-direction of the respondent to the appropriate web-site. Figure 4 shows the PVI (personal viewpoint identifier), and the three different response screens, the appropriate response screen either given back to the respondent and/or placed into the respondent’s medical records. The linking to the typing tool is the following (as of February, 2019.) http://162.243.165.37:3838/TT12/

Mind Genomics-006_IGOJ Journal_F4

Figure 4. Personal Viewpoint Identifier (Left Panel), and the feedback screens (Right Panel)

Discussion and Conclusion

This study examines attitudes towards menopause within one culture. Attitudes towards menopause change by mindset-segment we uncovered in this study. Women in one major mindset-segment perceive menopause as part of life (original mind-sets 1 and 2). Women in the second major mindset-segment (original mind-set 3) perceive menopause as uncomfortable and take supplements to ease symptoms while reducing risk of taking hormone replacements. Women in the third mindset-segment (original mind-set 4) perceive menopause as a sign of old age and although they are aware of risks associates with hormone replacement, they take those to overcome the symptoms.

Echoing previous studies, menopause is indeed perceived sometimes as a medical condition and other times as a natural phenomenon with positive or negative physical and subsequent social changes attributed to this biological transition [6]. Our mindset-segments suggest a major mindset-segment of people who are aware of risks and take supplements rather than hormone therapy. Our psychographic mindset-segmentation contradicts previous findings that there exists a strong link between attitudes towards menopause and geode-demographic variables such as age, education, and social support [4]. The linkage is better conceptualized as mind-sets. It’s more likely related to knowing HOW A PERSON THINKS ABOUT THE SPECIFIC TOPIC OF MENOPAUSE. Knowing mind-sets and tailoring messages to mind-sets (revealed for the individual through the PVI (personal viewpoint identifier) should dramatically increase the effectiveness of messages, and increase well-being and quality of life during menopause.

Acknowledgement

Attila Gere thanks the support of Premium Postdoctoral Researcher Program of Hungarian Academy of Sciences.

Appendix – Distribution of the four mind-sets of for menopause

Merged in the PVI

Total

Mind-Set 1

Mind- Set 2

Mind- Set 3

Mind- Set 4

High Interest

Menopause Ordinary

Takes Supplements

Estrogen Therapy

Base size

552

153

141

141

117

Percent

%

%

%

%

%

Which of the following best describes your age?

Under 40

3

3

2

3

5

40–44

35

39

33

33

33

45–49

36

34

35

35

39

50–55

26

24

29

30

22

Over 55

0

0

0

0

0

Which of the following best describes the stage of menopause that you are in?

Pre-menopause – the time of life before menopause

24

25

23

30

16

Peri-menopause- the 6 years or so prior to menopause when one begins to experience the effects of approaching menopause

41

41

45

35

43

Menopause- the end point after 12 consecutive months without a menstrual period

17

18

16

14

23

Post-menopause- the period of time after menopause

18

16

16

21

18

Which of the following menopausal symptoms have you experienced? (ALL THAT APPLY)

Hot flashes

66

68

68

57

70

Night sweats or insomnia

66

61

70

65

70

Anxiety/nervousness

61

61

59

61

62

Sudden changes of mood

59

57

63

56

62

Depression

56

51

59

58

56

Decreased sex drive

52

48

55

47

58

Vaginal dryness or itching

45

48

48

41

43

Urinary symptoms including increased frequency

41

39

43

36

46

Irregular bleeding

36

33

35

42

35

Painful intercourse

18

18

18

18

21

So far I have not experienced any menopausal symptoms

9

11

5

12

6

Other

5

2

6

8

6

Which ONE of the following menopausal symptoms have you experienced MOST often

Hot flashes

19

18

20

16

23

Night sweats or insomnia

19

22

16

21

18

Irregular periods

13

11

12

10

18

Decreased sex drive

10

10

16

6

9

So far I have not experienced any menopausal symptoms

9

12

4

13

6

Anxiety/nervousness

7

5

10

5

7

Depression

7

5

7

11

7

Sudden changes of mood

7

7

6

9

5

Vaginal dryness or itching

5

6

5

6

4

Urinary symptoms including increased frequency

4

6

4

3

2

Painful intercourse

1

1

1

1

2

Other

0

0

0

1

0

Which of the following issues associated with menopause are you concerned about? (T ALL THAT APPLY)

Osteoporosis or thinning of the bones

59

55

59

60

65

Weight gain

58

63

57

57

55

Getting enough calcium

49

56

49

45

44

Risks associated with hormone replacement therapy

48

53

45

48

46

Hormone replacement therapy

47

53

38

48

46

Atherosclerosis and coronary artery disease

45

50

35

46

48

Natural or alternative therapies

44

45

49

43

38

Cancer

42

47

34

44

44

Diet

24

27

23

25

18

Which ONE of the following issues associated with menopause are you MOST concerned about?

Osteoporosis or thinning of the bones

21

22

21

21

20

Weight gain

16

13

17

18

15

Cancer

15

17

11

14

17

Risks associated with hormone replacement therapy

14

10

16

14

16

Atherosclerosis and coronary artery disease

12

12

8

12

15

Natural or alternative therapies

12

9

18

11

8

Hormone replacement therapy

6

10

2

6

6

Getting enough Calcium

5

7

6

4

3

Diet

1

0

1

0

1

Which of the following treatments are you currently taking? (ALL THAT APPLY)

I am not currently taking any treatment for symptoms related to menopause

67

66

72

65

67

Synthetic hormone therapy prescribed by a doctor

20

20

18

18

23

Other medication prescribed by your doctor used to treat specific problems resulting from menopause (drugs especially for bone loss, cholesterol-lowering drugs)

7

7

5

10

7

Phytoestrogen-based supplements including herbal and soy supplementation

6

7

4

10

3

Natural hormone therapy prescribed by a doctor

3

3

2

3

4

Eating a phytoestrogen-based diet rich in soy, flax seed, and some beans

3

1

2

5

3

Other

3

2

3

4

1

From which of the following sources do you obtain health related information? (ALL THAT APPLY)

Doctor

77

78

78

69

84

Web sites/Internet

73

70

77

74

70

Magazines

52

55

50

52

50

Books

47

46

38

58

47

Friends/Relatives

43

40

48

43

44

Drug store/pharmacy

37

37

37

30

47

TV

35

33

32

41

35

Newspapers

23

25

23

23

20

Other

7

5

6

9

9

References

  1. Kowalcek I, Rotte D, Banz C, Diedrich K (2005) Women’s attitude and perceptions towards menopause in different cultures. Cross-cultural and intra-cultural comparison of pre-menopausal and post-menopausal women in Germany and in Papua New Guinea. Maturitas 51: 227–235. [crossref]
  2. Green R, Santoro N (2009) Menopausal symptoms and ethnicity: the Study of Women’s Health Across the Nation. Womens Health (Lond) 5: 127–133. [crossref]
  3. Santoro NF, Green R (2009) Menopausal symptoms and ethnicity: lessons from the Study of Women’s Health Across the Nation. Menopausal Med 17: 6–8.
  4. Ayers B, Forshaw M, Hunter MS (2010) The impact of attitudes towards the menopause on women’s symptom experience: a systematic review. Maturitas 65: 28–36. [crossref]
  5. Andrikoula M, Prelevic G (2009) Menopausal hot flushes revisited. Climacteric 12: 3–15. [crossref]
  6. Avis NE, Crawford S (2008) Cultural differences in symptoms and attitudes toward menopause. Menopause Manage 17: 8–13.
  7. Hunter MS, Gupta P, Papitsch-Clarke A, Sturdee D (2009) Mid-aged Health in Women from the Indian Subcontinent (MAHWIS): a quantitative and qualitative stud of experience of menopause in UK Asian women, compared to UK Caucasians and women living in Delhi. Climacteric 12: 26–37.
  8. Akkuzu G, Orsal O, Kecialan R (2009) Women’s attitudes towards menopause and influencing factors. Turkiya klinikleri J Med Sci 66–74.
  9. Melby MK, Lock M, Kaufert P (2005) Culture and symptom reporting at menopause. Hum Reprod Update 11: 495–512. [crossref]
  10. Moskowitz HR (2012) ‘Mind genomics’: the experimental, inductive science of the ordinary, and its application to aspects of food and feeding. Physiol Behav 107: 606–613. [crossref]
  11. Moskowitz HR, Gofman A, Beckley J, Ashman H (2006) Founding a new science: Mind genomics. Journal of sensory studies 21: 266–307.
  12. Gofman A, Moskowitz H (2010) Isomorphic permuted experimental designs and their application in conjoint analysis. Journal of Sensory Studies 25: 127–145.
  13. Gabay G, Moskowitz HR, Silcher M, Galanter E (2017) New Novum Organum: Policy, perceptions and emotions in health, Pardes-Ann Harbor Academic Press.

The Need for Fixed Dose Combination (FDC) for the Management of Type 2 Diabetes in Mauritius

DOI: 10.31038/EDMJ.2019331

Abstract

The State health services of Mauritius are provided free to all 1.27 million inhabitants of the island. Despite so, successive surveys by the Ministry of Health and Quality of Life have shown that diabetes remains a major public health threat to Mauritians. With 24% of the adult population affected by (type 2 diabetes) T2D, our island is ranked amongst those countries with highest diabetes-related mortality, which emphasizes the need for educating the population proper self-management of the disease. It is also evident that poor treatment adherence looms large. Patients with T2D under conventional treatment often require multiple medications to achieve glycaemic control. This induces a significant pill burden when coupled with co-morbid conditions associated to diabetes and deters adherence to treatment. Public health institutions in Mauritius support the usage of loose pills for diabetes treatment as opposed to private institutions who promote the adoption of Fixed Dose Combination (FDC) therapy as a means to improve treatment efficacy. A scaled-study was conducted to explore the efficiency and patients’ perspectives on FDC in the management of T2D. 65 patients from the Diabetes and Vascular Health Centre were grouped according to their treatment regimen: FDC from start; switched to FDC from loose pills; reverted to loose pills after trying FDC and loose pills treatment. Patients were interviewed and their clinical parameters recorded. Results showed that 67.7 % of patients were taking more than 7 pills a day to achieve glycaemic control, with only 30.8 % being made aware of possible FDC options by their healthcare practitioner. 96.3% patients who were on loose pills expressed their willingness to shift to FDC if made available in public institutions. Overall glycaemic control was better managed among the FDC group. Our findings concluded that the loose pill regime was indeed problematic for diabetics to achieve optimal glycaemic control. FDC could be pivotal in improving their health outcomes, barriers such as communication of treatment availabilities, financial constraints, shared decision-making and self-management training also need to be addressed.

Keywords

Fixed dose combination (FDC), type 2 diabetes mellitus (T2DM), glycaemic control, diabetes management, conventional treatment, pill burden

Introduction

Diabetes is one of many leading chronic diseases plaguing countries around the world. Commonly considered as a complex heterogenous disease that is associated to the onset of a number of life-threatening secondary complications such as cataract, chronic renal failure, cardiovascular diseases and neurovascular-related amputations- this disease has catastrophic impacts on the quality of life of individuals with uncontrolled diabetes [1]. According to the International Diabetes Federation (IDF), 425 million people suffer from diabetes worldwide. The island of Mauritius is ranked highest in the region of South East Asia with an estimated 1 in every 4 Mauritian adults diagnosed with diabetes, representing a staggering prevalence rate of 24% [2]. Despite being preventable, type 2 diabetes mellitus (T2DM) accounts for the vast majority of cases. The numerous pathways altered by the onset of T2DM partly justifies the multiple therapeutic agents required over time for to achieve glycaemic control. Indicators such as Fasting Blood Sugar (FBS) levels capped at 7.8mmol/L and glycosylated haemoglobin levels (HbA1C) of less than 7.0% are representative of effective treatment and proper glycaemic control [3]. The natural history of T2DM, being a progressive condition, precipitates a shift towards an intensification of medications with time to alleviate the pancreatic stress induced to sustain a normal glycaemic index; as well as other co-morbidities leading to the initiation of polytherapy thereby increasing the complexity of medication [4]. Multifactorial medications for diabetes and related co-morbid conditions can involve up to 10 tablets or more per day, ultimately leading to pill burden over time [5].

Despite T2DM being a progressive disease, patients can still live long, high quality lives by properly managing the disease. At the root, core management of T2DM includes healthy diet, exercise regimen and correct use of medications as prescribed by a physician. However, extent of adherence to treatment has a profound effect on glycaemic control. Behaviours related to treatment adherence and compliance are essential recommendations, where adherence can be measured as the proportion of patients taking ≥80% of their prescribed medications [6]. It is also agreed to be elemental in lowering the risks of microvascular and macrovascular complications and mitigating or delaying at most the onset of polypharmacy [7].

Poor adherence is reflected in various ways including non-initiation of therapy, self-reduction of prescribed medication dosage, non-completion of the medication course among others [8]. On a global scale, poor adherence is shown to impact more than 50% patients, translating to increased morbidity rates, financial burdens and polypharmacy [9, 10]. This can be further supported by systemic reviews which report significant declines in the mean dose-taking compliance when number of daily doses increase [11, 12]. Aside from the profound effect of complexity of treatment on adherence, there do exist several other factors that act as co-determinant in the precipitation of poor adherence. Psychological factors inclusive of poor social support and mental health, health literacy status and general attitude towards effectiveness of treatments based on past experiences from other therapeutic interventions may act as mediators of poor adherence [13]. Those factors related to the healthcare system, such as consultation timing limitations, patient-physician interaction and provision of care by multiple physicians among others should not be dismissed [14].

The impacts of poor adherence are extensive, such as medical readmissions [15] and the onset of clinical inertia; a detrimental behavioural characteristic exhibited by a proportion of healthcare professionals, which is also prevalent in T2DM patients with poor adherence [16, 17, 18]. It should be fair to mention that patients with suboptimal health literacy and less engaged towards treatment practices are affected by delays in treatment escalation, consequential effect of physician-mediated clinical inertia [19]. The most obvious and effective remedial actions to address poor adherence primarily revolve around decreasing polypharmacy to simplify medication regimen and pill burden [11]. As such, the development of dual therapies in the form of loose-pill combination therapy or fixed-dose combination (FDC) therapy has proved to be quite effective in promoting adherence in T2DM patients. Patients who either switched from co-administered dual therapy to FDC or from glyburide or metformin monotherapy to FDC were more adherent to [20, 21]. This therapeutic alternative has also showed promising results in helping newly diagnosed T2DM patients in achieving optimal HbA1c glycaemic targets of < 7.0%, which would not be feasible with a single oral agent [22, 23]. Practitioners unanimously agree that the current treatment regimen of loose pills is scant of achieving good blood sugar control to ward off secondary health complications. The advantages of FDC as reviewed by Vijayakumar et al. [20] are found to be multi-tiered, ranging from better tolerability and bio-availability, to decreased medical expenditure and less discomfort associated with swallowing multiple tablets over single ones. However, in the real-world setting, the percentage of patients adopting FDC is actually quite low. In Mauritius, the public health sector remains one of the major sources for the supply of diabetes medication, but FDC is currently not offered as part of the ‘free treatment’ plan, so overall diabetes management is still observed to be ‘moderately poor’ amongst adults diagnosed with T2DM [24]. The present study aims at exploring patients’ perspectives on FDC therapy in the management of T2DM and to understand the gap in treatment practice within the public health care setting which seems to be limiting the progressive decline of uncontrolled glycaemic control across the T2DM population in Mauritius.

Materials and Methods

Study settings

A total of 65 patients attending the Diabetes and Vascular Health Centre were earmarked to participate in this study. Medical records, i.e. case-sheets of patients who are on fixed-dose combination therapy and standard medication, were accessed. Inclusion criteria was: patients clinically diagnosed with T2DM, 18 years old and above, on at least two classes of oral hypoglycaemic agents or on fixed-dose combination tablets. Patients who either suffered from type 1 diabetes mellitus or gestational diabetes, as well as those on insulin therapy or less than two classes of oral hypoglycaemic agents as separate pills were automatically excluded. The participants were segmented into four groups according to their current and previous treatments: Group A – on FDC since start of treatment; Group B – switched from separate pills to FDC during treatment; Group C – on separate pills since start of treatment; and Group D – on FDC for a short time before reverting to separate pills (Figure 1). A non-probabilistic sampling strategy was used for Group A, B, and D, while participants from group C were chosen based on their adherence to clinical appointments and willingness to participate.

EDMJ 2019-112 - Meera Jhoti Mauritius_F1

Figure 1. Grouping of participants based on previous and on-going diabetic treatment plan.

Data Collection & Analysis

Using a mixed-method strategy, a pre-tested, self-designed questionnaire consisting of five sections inclusive of the patient’s biodata, medical history and clinical parameters, compliance to diabetes management, attitudes towards medications, knowledge and attitudes to fixed-dose combination therapy was administered individually. A focus group was conducted to probe into potential existing issues with the current treatments and fixed dose combination tablets. Data was analysed using SPSS (v 23.0) using Pearson’s chi-squared test and Mann-Whitney U-test to measure group-based differences for non-parametric values. The level of significance was set at P < 0.05.

Reliability

Reliability within each dimension was tested factoring subjectivity and masked responses given that the data was collected by the healthcare professionals involved in their treatment. The following values were recorded: Compliance, α = 0.496; Attitude to medication, α = 0.410; and knowledge and attitude to FDC, α = 0.577. The mean inter-item correlation per dimension was calculated and found to be within the range of 0.2–0.4 deemed to produce an optimal level of homogeneity [25].

Ethics

Ethical clearance for this study was granted by the Ministry of Health and Quality of Life (#MHC/CT/NETH/OZM).

Results

Population demographics and current health status

The sample population consisted of a higher percentage of male patients (male vs female: 52.3% vs 47.7%) from all the 4 groups. An exception was noted for Group B, i.e. patients who shifted from loose pills to FDC, as a higher number of female patients were more willing to transition to a new therapeutic method compared to males (female vs male: 59.3% vs 40.7%). A low employment status (33%) and high literacy rate (83.3%) was observed in Group A as opposed to Group B whereby 55.5% were actively employed and contrastingly were from a basic educational background (63% at a primary level) (Table 1). Findings also reported a shift towards FDC occurring towards the later stages of life, with 77.7% patients above the age of 50 years under such treatment. Clinical parameters showed some common traits across groups such as Body Mass Index (BMI) of approximately 40–67% patients categorized as overweight. Patients who were on FDC since the start of treatment or shifted to FDC mid treatment had a better blood pressure profile with 63–68% achieving a ratio of less than 140/90 mmHg, as opposed to those still on separate pills therapy (Table 2). These findings were further supported by the strong association (Cramer’s V = 0.322) between treatment type and the blood pressure profile (X2(6) = 13.52, p < 0.05); and the clear difference between patients on or who shifted to FDC versus patients on separate pills (Group A vs Group C, 56.00 vs 505.00, U = 35.00, p = 0.02; Group B vs Group C, 565.00 vs 920.00, U = 187.00, p = 0.001); results confirming a higher blood pressure profile among patients on conventional treatment, i.e. separate pills. Other clinical parameters such as serum cholesterol and creatinine were not affected by the treatment methods given the relatively similar levels across the groups.

Table 1. Demographic profile of study participants (N = 65).

Gender

Group A

Group B

Group C

Group D

Male

66.7%

40.7%

55.6%

80%

Female

33.3%

59.3%

44.4%

20%

Age

 < 40 years

7.4%

40–49 years

14.8%

14.8%

50–59 years

50%

29.6%

25.9%

60%

≥60 years

50%

48.1%

59.3%

40%

Occupation

Employed

33.3%

18.5%

29.6%

40%

Self-employed

14.8%

25.9%

40%

Housewife

16.7%

22.2%

18.5%

Retired

33.3%

29.6%

25.9%

Not employed

16.7%

14.8%

20%

Education level

None

16.7%

7.4%

18.5%

Primary

37%

63%

40%

Secondary

33.3%

40.7%

18.5%

20%

Tertiary

50%

14.8%

40%

Group Aon FDC since start of treatment; Group Bswitched from separate pills to FDC during treatment; Group Con separate pills since start of treatment; and Group Don FDC for a short time before reverting to separate pills

Table 2. Health Status of study participants (N = 65)

Clinical Parameters

Group A

Group B

Group C

Group D

BMI (Kg/m2)

Normal

16.7%

44.4%

18.5%

20%

Overweight

66.7%

40.7%

40.7%

60%

Obese

16.7%

14.8%

40.7%

20%

Blood Pressure (mmHg)

 < 140/90

66.7%

63%

22.2%

40%

140–159/90–99

33.3%

29.6%

40.7%

40%

160–179/100–109

7.4%

37%

20%

≥ 180/110

Serum Total Cholesterol (mmol/L)

 < 4.5

66.7%

66.7%

63%

60%

≥ 4.5

33.3%

33.3%

37%

40%

Serum Creatinine (umol/L)

 < 124

100%

96.3%

96.3%

100%

≥ 124

3.7%

3.7%

Group Aon FDC since start of treatment; Group Bswitched from separate pills to FDC during treatment; Group Con separate pills since start of treatment; and Group Don FDC for a short time before reverting to separate pills

Glycaemic index across and within treatment groups

44.6% of the patients had a long history of diabetes, i.e. more than 10 years. Analysis of their current glycemic parameters revealed a potentially higher proportion of patients from Group A and B with fasting blood sugar (FBS) levels of less than 7 mmol/L, however, no concrete association was distinguished between the treatment group and their immediate glycemic index which could be accounted by 66 -78% patients having an FBS level of less than 8.4 mmol/L across the different groups (Figure 2A). The glycemic index within group B showed a strong association (Cramer’s V = 0.451) with respect to FBS levels and treatment stage, i.e. prior to and after switching to FDC (X2(3) = 10.991, P < 0.05). Non-parametric paired Wilcoxon Signed Ranks test showed improved FBS levels post-FDC treatment switch with 17 patients scoring better after resorting to FDC therapy (Z = -3.570, P < 0.001) (Figure 2A). Although similar associations were not drawn for HbA1c levels (P = 0.093), related findings were observed when comparing the HbA1c levels pre and post FDC treatment switch (Z = -3.441, P = 0.001) advocating the efficiency of FDC treatment on the net amelioration of glycemic parameters (Figure 2B).

EDMJ 2019-112 - Meera Jhoti Mauritius_F2

Figure 2. (A) Fasting blood sugar (FBS) levels (B) HbA1c levels recorded in patients who shifted to fixed dose combination (FDC) from separate pills. (Solid line – current levels recorded, Dotted lines – levels measured prior to FDC switch)

Pill burden, complexity of treatment and adherence to medication

As detailed in Table 3, 67.7% of patients were taking more than 7 pills a day, while 24.6 % were on both oral hypoglycemic agents and insulin therapy. The majority patients from group C had a higher daily pill intake for diabetes and associated diseases (85.2%) as compared to group A (33.3%) and B (51.9%) supporting the association between treatment group and total number of prescribed medications (X2(6) = 18.229, p < 0.001) (Table 3). Patients from Group A reported to have never missed their diabetic medication compared to group B (85.5%) and group C (77.8%) who admitted to have missed their diabetes medications more than 3 times.. The data strongly supported the association between increasing treatment complexity across the groups and number of pills remaining (X2(9) = 19.048, P < 0.05); with higher number of pills remaining for group C versus B patients (918.50 vs 566.50; U = 188.50, P < 0.01). Prime cause was confusion due to increased number of pills to be taken (Figure 3). Other listed justifications such as forgetting to take pills, need help at home to take pills, taking pills over time become more difficult, feel taking too many medications, feeling anxious when having to take pills, deliberately omitting pills, portioning or taking extra medication did not seem to differ much in terms of behavioral attitudes across groups. However, in terms of monthly pill renewal, no marked discrepancies were found between the 4 groups (X2(3) = 3.08, P > 0.05), as all patients from were regular on their medication renewal. Moreover, since 92.3 % of patients also suffered from other associated diseases (50 patients with co-existing hypertension and 39 patients suffering from dyslipidemia), the ability to distinguish and map the different classes of medication to the treating disease was assessed. Results showed a near significant association between those two dimensions (X2(2) = 5.32, P = 0.07) with group C having a handicap in terms of medication mapping as compared to group B (820.50 vs 664.50; U = 286.50, P < 0.05). This supports the claim that FDC indeed decreases complexity of treatment in general.

EDMJ 2019-112 - Meera Jhoti Mauritius_F3

Figure 3. Perception of pill burden across treatment groups

N, never; R, rarely; S, sometimes; and A, always. P<0.05. Group Aon FDC since start of treatment; Group Bswitched from separate pills to FDC during treatment; Group Con separate pills since start of treatment; and Group Don FDC for a short time before reverting to separate pills

Table 3. Diabetes and associated diseases’ medication profile.

Classes of oral diabetes medications

Group A

Group B

Group C

Group D

2 classes

50%

59.3%

100%

80%

3 classes

50%

40.7%

4 classes

20%

Number of diabetes pills/day

1–3 pills

66.7%

55.6%

7.4%

20%

4–6 pills

33.3%

33.3

29.6%

80%

7–9 pills

11.1

63%

10–12 pills

Total number of pills/ day

1–3 pills

33.3%

7.4%

4–6 pills

33.3%

40.7%

14.8%

≥ 7 pills

33.3%

51.9%

85.2%

100%

Group Aon FDC since start of treatment; Group Bswitched from separate pills to FDC during treatment; Group Con separate pills since start of treatment; and Group Don FDC for a short time before reverting to separate pills

Adherence to general diabetes recommendations

44% of patients from group B acquired their diabetes medication both from private and public medical facilities. However, the public sector remains one of the major sources for diabetes medication supply in Mauritius. 90.8% of patients stated that they had received counselling and explanation on how and when to take their medications. 40% of patients from groups C and D also admitted to having missed their appointment with the healthcare practitioner. Of concern, 66.7% from group C did not have access to a glucometer to monitor their glucose levels at regular intervals, thus heavily depended on public health services (Table 4). With respect to lifestyle choices 40–70% of patients indulged in unhealthy eating behavior, which reflects a lack of stringency with respect to their dieting habits.

Table 4. Lifestyle and health check status among diabetes patients under different treatment.

Group A

Group B

Group C

Group D

Practising Exercise

66.7%

81.5%

70.4%

60%

Intake of unhealthy foodstuffs

44.4%

44.4%

45.7%

66.70%

Patients compliant to medication intake instructions

100%

88.9%

74.1%

80%

Patients missing/delaying their appointment with HCP

0%

11.1%

18.5%

40%

Patients renewing their medications on time

100%

96.3%

96.3%

80%

Patients attending for diabetic retinopathy screening

83.3%

100%

77.8%

100%

Patients attending for diabetic foot screening

66.7%

85.2%

70.4%

80%

Patients using a glucometer

100%

85.2%

33.3%

60%

Group A – on FDC since start of treatment; Group Bswitched from separate pills to FDC during treatment; Group Con separate pills since start of treatment; and Group Don FDC for a short time before reverting to separate pills

Attitude and barriers towards adoption of FDC

Only 30.8 % of patients were aware that 2 or more active medication ingredients may be present in a single pill, whereas only 54.6% were aware that FDC therapy consisted of two active diabetes medications. 84.6 % of patients agreed that FDC was important to decrease pill burden, with patients from group C and D expressing their willingness to move to FDC if made available in the public health care sector (96.3 and 80% respectively). Cost, on the other hand, was believed to be the most common drawback for using FDC (Figure 4).

Discussion

Impact of treatment type on systemic clinical parameters

While no association was depicted among clinical parameters such as BMI, serum creatinine and serum total cholesterol, across the treatment groups, blood pressure (BP) control significantly differed for patients who were on FDC versus those on separate pills, aligning with studies which have demonstrated a better blood pressure control in T2DM patients under anti-hypertensive and anti-diabetic FDC treatment [26]. 77.7% of patients on loose pills in our study were affected by high BP, which would warrant the use of FDC therapy targeting both their diabetic and hypertensive pathologies to ameliorate their health status as recommended by the American Diabetes Association [27]. Pathology-specific FDC treatment appears to play a vital role in managing T2DM to reach the ultimate target of achieving a blood pressure of < 140/90 mmHg among those patients. Among other health status determinants, a closer examination of BMI across groups revealed an obesity index of 40% vs. 14.8% among participants on separate pills and FDC respectively. Majority of patients (92.3%) had associated conditions, mainly hypertension and dyslipidemia, reflecting the long years, i.e. more than 10 years with a diabetic condition and supporting the notion of augmented risk of developing comorbid conditions with increased disease duration [28]. Interestingly, BMI adds to the equation whereby increase in BMI heightens the prevalence rate of hypertension, diabetes, and dyslipidemia [29, 30], validating the measures of those clinical parameters in the assessment of T2DM and treatment strategies. Restoring normal BMI through exercise and diet has been proved to positively contribute to the control of glycaemic index and lipid profile [31, 32]. The present study did not overlook the eating and exercising habits of the participants. Overall, a week prior to the study, 44.6 % participants used sugar, 60 % took some forms of sweet and 35.4 % had soft drinks, which shows the poor compliance in to dietary recommendations in accordance with other studies [33] and which may attributed to the perception of diet as a burden [34]. Therefore, modifying behavioural attitude towards clinically recommended lifestyle habits and treatment options may prove to enhance diabetic control.

EDMJ 2019-112 - Meera Jhoti Mauritius_F4

Figure 4. Attitudes and barriers towards adoption of fixed dose therapy amongst participants (N = 65)

FDC as a measure to improve glycaemic index in T2DM patients

No significant differences were recorded with respect to glycaemic index across the groups However; probing further into group B (patients who shifted from separate pills to FDC) a major improvement was depicted in their FBS and HbA1c levels, which is in line with findings of Thayer et al. [35] who a reported decrease in HbA1c levels following a swap from mono-therapeutic agents to a rosiglitazone/glimepiride FDC treatment. Similarly, Raskin et al. [36] demonstrated the ability of coupling repaglinide/metformin as an FDC regimen to induce a more rapid decrease in HbA1c levels, as opposed to monotherapy. The present findings are in support of such clinical studies which claim that lower doses of 2 agents in fixed combinations may offer greater efficacy in combination, at the same time reducing the risk of adverse events that may occur with higher doses of monotherapy [37].

Conventional therapies and failure to adhere to medication and general recommendations

Medication adherence is closely related to the drug regimen of the patients. The progressive nature of T2DM and its potent role in the generation of non-communicable diseases [38], increases by default the treatment spectrum to encompass the associated complications. A staggering 70% of patients in the present study were on more than 7 pills for diabetes and comorbid disease regulation. Pill burden is a major thorn in keeping T2DM treatment on track. A 5-year study on the change in medication profile after onset of diabetes, revealed an increase in pills targeting the cardinal comorbidities such as hypertension and dyslipidemia. Comparative analysis of the 4 treatment groups identified the following drawbacks whilst on loose pill therapy: difficulty in preparing doses, extended time taken to medicate, accidental mixing tablets/doses, as well as the overall cost of medication [39, 40, 41, 8], compared to those of FDC, the latter who were more rigid on their treatment schedule and pills intake. Moreover, compared to groups A and D, a significantly proportion of patients from group C had pills remaining when at the time of their next appointment, implying the notion of pill burden and non-compliance majorly associated to conventional therapies. Studies by up-titration, a core process in monotherapy, is streamlined or reduced in FDC, positively impacting the effects of pill burden as well as decreasing the adverse effects prevailing from high up-titrated doses of anti-diabetic agents [42].

Lifestyle factors play a critical role in the pre-disposition and management of T2DM. Considering the recommendations of the American Diabetes Association [27], a diet consisting of food with low glycaemic load and reduced sugar levels achieves better FBS control. Additionally, diet plans inclusive of high–unsaturated/low–saturated fat diet [43], low–glycaemic index diet [44], and low-carbohydrate ketogenic diets [45] have proved to be effective in normalizing the glycaemic index of T2DM patients. Physical activity routines including high-intensity progressive resistance training, and its modified version with coupled high-protein diet have been found to be effective in weight loss and improvements in glycaemic parameters [46, 47]. Our study showed that majority participants across all treatment groups were non-compliant with the recommendations as indicated by a meagre 26% engaged in physical activity for more than 3 times a week; and 50% with poor dieting habits. This could potentially be attributed to the lack of self-management know-how and unstimulated interests in self-care strategies, warranting better educational frameworks to be implemented in Mauritius to help improve lifestyle decisions amongst diabetics [48].

Knowledge, benefits and barriers to FDC: Patients’ perspective

Health literacy has a great impact on adherence and severity of illness perception such that low and moderate literacy among patients augments the perception of diabetes or co-morbid illnesses as ‘threatening’ which impairs medical adherence. The present data does not significantly point to perceptions of similar nature, but, 30–40% of patients from group B and C were in agreement of the stated perception. Therefore, the suggested role of health literacy as a protective factor in terms of medical adherence may be dependent on socio-economic status of the patients. A study by Powell et al. [49] explored and demonstrated the detrimental impacts of poor health literacy on declining glycaemic control. Our data showed similar results in terms of knowledge of FDC amongst group C patients, where only 7% aware of the existence of FDC. Modality of drug functions were not well spread among patients given that only 55% of patients on FDC were aware of its mechanism of action with a combination of two active ingredients. Poor knowledge of FDC could be attributed to a lack of knowledge about diabetes, public policies and availability of medication in public institutions; and clinical inertia [50, 51, 52]. In Mauritius, FDC is not part of the welfare programme, hence it cannot be prescribed by public health care professionals to T2DM patients. Such public policy matters are also of concern in countries such as Canada [53]. Clinical inertia, on the other hand, has developed into a prominent issue in the regulation of glycaemic index among T2DM patients and justifications for such stagnancy in treatment have been tossed between the patient and clinician. A fundamental approach towards reducing clinical inertia revolves around the education and continuous training of clinicians to be up-to-date with modern pharmaceutical agents and treatment strategies available for the betterment of the T2DM patients [54, 55].

A pertinent finding from this study was the impact FDC on the quality of life (QOL) of patients, specifically with respect to mental health. Patients from group A were not anxious during medication time as opposed to patients from group C, reports which corroborate data from Heckbert et al. [56] highlighting the association between patients with uncontrolled HbA1c levels and depression. Identification of psychosocial determinants which may exacerbate poor glycaemic control and adherence is important during the early stages of diabetes diagnosis as progression of disease and its associated treatment intensification may lead to a perception of failure in the day-to-day management of diabetes further demotivating the patient [57]. Treating mental health irregularities may also prove to be beneficial in strengthening the sustenance of healthy lifestyle habits in T2DM [58], hence the decrease in anxiety which is mediated by FDC appears to be a good indicator of the functionality of this therapeutic method on patients’ QoL.

FDC – cost implication of lifelong treatment

In the present study, cost was cited as being the prime justification for reverting back to separate pills therapy in group D patients. This was further supported by the fact that 25% of patients were complementing medications received in the public sector with medications bought from private pharmacies leading to drug wastage and mediated by the inability of the welfare programme and insurance policies to cover the FDC pills. T2DM patients have high medical costs, averaging $14, 000 as a result of the direct and indirect costs associated to the treatment of diabetes and its co-morbid conditions [59]. Similarly, Indian patients on loose pills therapy spend a monthly average of 216 rupees which roughly amounts to the cost of one FDC pill [60]- a situation which is replicated in Mauritius given that this type of treatment is not covered by the healthcare welfare; further endorsing an in-depth situational analysis and revamping of the medical coverage and treatment availability in the public sector. The call for a review of the anti-diabetic medication dispensing programme is further warranted given that FDC-associated costs are reported to be the inverse to what is claimed by the National Institute for Health and Clinical Excellence, with a yearly expenditure of approximately $1600 on FDC vs. $1900 on separate pills [61, 62]. Interestingly, many FCD respondents who mentioned that the pill strength was too high, which is relevant given the inflexibility of FDC and tailoring of dosage to individual characteristics inclusive of demographics and pharmacogenetics [63].

Conclusion

Our findings contribute to the scarcity of information pertaining to the patients’ outlook on T2DM treatment with emphasis on fixed dose combination therapy in Mauritius. Although being a welfare state which provides health care services free of charge, our findings have highlighted the consensus that medications from the public hospitals in the form of loose pills are burdensome, resulting in ineffective diabetes and co-morbidity management. Moreover, the relevance of patient empowerment in doctor-patient consultations should not be overlooked when challenged with finding solutions to reduce global incidence of hyperglycemia and adverse effects in dual therapy with individual components.

Contribution

MYO: study design and data collection; MP and JSB: study design, statistical analysis, manuscript editing and writing. All authors read and approved the final manuscript.

Acknowledgement

Authors would like to acknowledge the Ministry of Health and Quality of Life for granting access to relevant medical records, and the staff at Diabetes and Vascular Health Centre, Souillac for their support.

References

  1. Trikkalinou A, Papazafiropoulou AK, Melidonis A (2017) Type 2 diabetes and quality of life. World J Diabetes 8: 120–129. [crossref]
  2. International Diabetes Federation. IDF Diabetes Atlas 8th edition. Brussels, Belgium: International Diabetes Federation, 2017. Available: http: //www.diabetesatlas.org
  3. International Diabetes Federation. Recommendations For Managing Type 2 Diabetes In Primary Care, 2017. Available: www.idf.org/managing-type2-diabetes
  4. Druss BG, Marcus SC, Olfson M, Tanielian T, Elinson L, Pincus HA (2001) Comparing the national economic burden of five chronic conditions. Health Aff (Millwood) 20: 233–241
  5. Blüher M, Kurz I, Dannenmaier S, Dworak M (2015) Pill Burden in Patients With Type 2 Diabetes in Germany: Subanalysis From the Prospective, Noninterventional PROVIL Study. Clin Diabetes 33: 55–61. [crossref]
  6. Feldman BS, Cohen-Stavi CJ, Leibowitz M, Hoshen MB, Singer SR, et al. (2014) Defining the role of medication adherence in poor glycemic control among a general adult population with diabetes. PLoS One 9: 108145. [crossref]
  7. Chawla A, Chawla R, Jaggi S (2016) Microvasular and macrovascular complications in diabetes mellitus: Distinct or continuum? Indian J Endocrinol Metab 20: 546–551. [crossref]
  8. García-Pérez LE, Alvarez M, Dilla T, Gil-Guillén V, Orozco-Beltrán D (2013) Adherence to therapies in patients with type 2 diabetes. Diabetes Ther 4: 175–194. [crossref]
  9. Bailey CJ, Kodack M (2011) Patient adherence to medication requirements for therapy of type 2 diabetes. Int J Clin Pract 65: 314–322
  10. Rozenfeld Y, Hunt JS, Plauschinat C, et al (2008) Oral antidiabetic medication adherence and glycemic control in managed care. Am J Manag Care 14: 71–75
  11. Pantuzza LL, Ceccato MGB, Silveira MR, Junqueira LMR, Rei AMM (2017) Association between medication regimen complexity and pharmacotherapy adherence: a systematic review. Eur J Clin Pharmacol 73: 1475–1489
  12. Claxton AJ, Cramer J, Pierce C (2001) A systematic review of the associations between dose regimens and medication compliance. Clin Ther 23: 1296–1310
  13. Gonzalez JS, Tanenbaum ML, Commissariat PV (2016) Psychosocial Factors in Medication Adherence and Diabetes Self-Management: Implications for Research and Practice. Am Psychol 71: 539–551
  14. Brown MT, Bussell JK (2011) Medication adherence: WHO cares? Mayo Clin Proc 86: 304–314. [crossref]
  15. Abughosh SM, Wang X, Serna O, et al (2016) A pharmacist telephone intervention to identify adherence barriers and improve adherence among nonadherent patients with comorbid hypertension and diabetes in a medicare advantage plan. J Manag Care Spec Pharm 22: 63–73
  16. Triplitt C (2010) Improving treatment success rates for type 2 diabetes: recommendations for a changing environment. Am J Manag Care 16: S195–S200
  17. Grant R, Adams AS, Trinacty CM, Zhang F, Kleinman K, Soumerai SB, Meigs JB, Ross-Degnan D (2007) Relationship between patient medication adherence and subsequent clinical inertia in type 2 diabetes glycemic management. Diabetes Care 30: 807–812
  18. Reach G, Pechtner V, Gentilella R, Corcos A, Ceriello, A (2017) Clinical inertia and its impact on treatment intensification in people with type 2 diabetes mellitus. Diabetes & Metabolism 43: 501–511
  19. Pantalone KM, Misra-Hebert AD, Hobbs TM, Ji X, et al. (2018) Clinical Inertia in Type 2 Diabetes Management: Evidence From a Large, Real-World Data Set. Diabetes Care 41: 113–113e114. [crossref]
  20. Vijayakumar TM, Jayram J1, Meghana Cheekireddy V1, Himaja D1, Dharma Teja Y1, et al. (2017) Safety, Efficacy, and Bioavailability of Fixed-Dose Combinations in Type 2 Diabetes Mellitus: A Systematic Updated Review. Curr Ther Res Clin Exp 84: 4–9. [crossref]
  21. Cheong C, Barner JC, Lawson KA, Johnsrud MT (2008) Patient adherence and reimbursement amount for antidiabetic fixed-dose combination products compared with dual therapy among Texas Medicaid recipients. Clin Ther 30: 1893–1907
  22. Defronzo RA, Eldor R, Abdul-Ghani M (2013) Pathophysiologic Approach to Therapy in Patients With Newly Diagnosed Type 2 Diabetes. Diabetes Care 36: S127-S138
  23. Han S, Iglay K, Davies MJ, Zhang Q, Radican L (2012) Glycemic effectiveness and medication adherence with fixed-dose combination or coadministered dual therapy of antihyperglycemic regimens: a meta-analysis. Curr Med Res Opin 28: 969–977
  24. Mauritius Non-Communicable Diseases (NCD) survey report. The Trends in Diabetes and Cardiovascular Disease Risk in Mauritius 2015. Available: http: //health.govmu.org/English/Statistics/Pages/NCD-Survey-Reports.aspx
  25. Briggs SR, Cheek JM (1986) The role of factor analysis in the development and evaluation of personality scales. J Pers 54: 106–148
  26. Weber MA, Bakris GL, Jamerson K, Weir M, Kjeldsen SE, et al. (2010) Cardiovascular events during differing hypertension therapies in patients with diabetes. J Am Coll Cardiol 56: 77–85. [crossref]
  27. American Diabetes Association (2017) Standards of medical care in diabetes. Diabetes care 40: S11–24
  28. Lopez Stewart G, Tambascia M, Rosas Guzmán J, Etchegoyen F, Ortega Carrión J, et al. (2007) Control of type 2 diabetes mellitus among general practitioners in private practice in nine countries of Latin America. Rev Panam Salud Publica 22: 12–20. [crossref]
  29. Nguyen NT, Magno CP, Lane KT, Hinojosa MW, Lane JS (2008) Association of Hypertension, Diabetes, Dyslipidemia, and Metabolic Syndrome with Obesity: Findings from the National Health and Nutrition Examination Survey, 1999 to 2004. J Am Coll Surg 207: 928–934
  30. Cercato C, Mancini MC, Arguello AM, Passos VQ, Villares SM, Halpern A (2004) Systemic hypertension, diabetes mellitus, and dyslipidemia in relation to body mass index: evaluation of a Brazilian population. Rev Hosp Clin Fac Med Sao Paulo 59: 113–118
  31. Boulé NG, Haddad E, Kenny GP, Wells GA, Sigal RJ (2001) Effects of Exercise on Glycemic Control and Body Mass in Type 2 Diabetes MellitusA Meta-analysis of Controlled Clinical Trials. JAMA 286: 1218–1227
  32. Halle M, Berg A, Garwers U, Baumstark MW, Knisel W, et al. (1999) Influence of 4 weeks’ intervention by exercise and diet on low-density lipoprotein subfractions in obese men with type 2 diabetes. Metabolism. 48: 641–664
  33.  Nelson KM, Reiber G, Boyko EJ; NHANES III (2002) Diet and exercise among adults with type 2 diabetes: findings from the third national health and nutrition examination survey (NHANES III). Diabetes Care 25: 1722–1728. [crossref]
  34.  Vijan S, Stuart NS, Fitzgerald JT, Ronis DL, Hayward RA, et al. (2005) Barriers to following dietary recommendations in Type 2 diabetes. Diabet Med 22: 32–38. [crossref]
  35. Thayer S, Arondekar B, Harley C, Darkow TE (2010) Adherence to a Fixed-Dose Combination of Rosiglitazone/Glimepiride in Subjects Switching from Monotherapy or Dual Therapy with a Thiazolidinedione and/or a Sulfonylurea. Ann Pharmacothr 44: 791–799
  36. Raskin P, Lewin A, Reinhardt R, Lyness W (2009) Repaglinide/Metformin Fixed-Dose Combination Study Group. Twice-daily dosing of a repaglinide/metformin fixed-dose combination tablet provides glycaemic control comparable to rosiglitazone/metformin tablet. Diabetes Obes Metab 11: 865–873
  37. Abdulsalim S, Peringadi Vayalil M, Miraj SS (2016) New fixed dose chemical combinations: the way forward for better diabetes type II management? Expert Opin Pharmacother 17: 2207–2214. [crossref]
  38. Chaudhury A, Duvoor C, Reddy Dendi VS, Kraleti S, Chada A, et al. (2017) Clinical Review of Antidiabetic Drugs: Implications for Type 2 Diabetes Mellitus Management. Front Endocrinol (Lausanne) 8: 6. [crossref]
  39. Saundankar V, Peng X, Fu H, Ascher-Svanum H, Rodriguez A, et al. (2016) Predictors of Change in Adherence Status from 1 Year to the Next Among Patients with Type 2 Diabetes Mellitus on Oral Antidiabetes Drugs. JMPC 22: 467–482
  40.  Black JA, Simmons RK, Boothby CE, Davies MJ, Webb D, et al. (2015) Medication burden in the first 5 years following diagnosis of type 2 diabetes: findings from the ADDITION-UK trial cohort. BMJ Open Diabetes Res Care 3: 000075. [crossref]
  41. Farrell B, French Merkley V, Ingar N (2013) Reducing pill burden and helping with medication awareness to improve adherence. Can Pharm J (Ott) 146: 262–269. [crossref]
  42. Lavernia F, Adkins SE. Shubrook JH (2015) Use of oral combination therapy for type 2 diabetes in primary care: Meeting individualized patient goals. Postgraduate Medicine127: 808–817
  43. Tay J, Luscombe-Marsh ND, Thompson CH, Noakes M, Buckley JD, et al. (2014) A very low-carbohydrate, low-saturated fat diet for type 2 diabetes management: a randomized trial. Diabetes Care 37: 2909–2918. [crossref]
  44. Jenkins DJA, Kendall CWC, Mckeown-Eyssen G, Josse RG, Silverberg J, Booth GL, et al. (2008) Effect of a Low–Glycemic Index or a High–Cereal Fiber Diet on Type 2 Diabetes: A Randomized Trial. JAMA 300: 2742–2753
  45. Yancy WS Jr1, Foy M, Chalecki AM, Vernon MC, Westman EC (2005) A low-carbohydrate, ketogenic diet to treat type 2 diabetes. Nutr Metab (Lond) 2: 34. [crossref]
  46. Dunstan DW, Daly RM, Owen N, Jolley D, De Courten M, et al. (2002) High-intensity resistance training improves glycemic control in older patients with type 2 diabetes. Diabetes Care 25: 1729–1736. [crossref]
  47. Wycherley TP, Noakes M, Clifton PM, Cleanthous X, Keogh JB, et al. (2010) A high-protein diet with resistance exercise training improves weight loss and body composition in overweight and obese patients with type 2 diabetes. Diabetes Care 33: 969–976. [crossref]
  48. Davies MJ, Heller S, Skinner TC, Campbell MJ, Carey ME, et al. (2008) Effectiveness of the diabetes education and self-management for ongoing and newly diagnosed (DESMOND) programme for people with newly diagnosed type 2 diabetes: cluster randomised controlled trial. BMJ 336: 491–495. [crossref]
  49. Powell CK, Hill EG Clancy DE (2007) The Relationship between Health Literacy and Diabetes Knowledge and Readiness to Take Health Actions. Diabetes Educ 33: 144–151
  50. Abbasi YF, See OG, Ping NY, Balasubramanian GP, Hoon YC, et al. (2018) Diabetes knowledge, attitude, and practice among type 2 diabetes mellitus patients in Kuala Muda District, Malaysia – A cross-sectional study. Diabetes Metab Syndr 12: 1057–1063. [crossref]
  51. Kueh YC, Morris T Ismail AAS (2017) The effect of diabetes knowledge and attitudes on self-management and quality of life among people with type 2 diabetes. J Health Psychol 22: 138–144
  52. Pashaki MS, Eghbali T, Niksima SH, Albatineh AN Gheshlagh RG (2019) Health literacy among Iranian patients with type 2 diabetes: A systematic review and meta-analysis. Diabetes Metab Syndr 13: 1341–1345
  53. Canadian Diabetes Association (2019)Diabetes Canada’s Position on Government Efforts to Control Drug Costs. Available: https: //www.diabetes.ca/about-cda/public-policy-position-statements/government-efforts-to-control-drug-costs
  54. Shera AS, Jawad F Basit A (2002) Diabetes related knowledge, attitude and practices of family physicians in Pakistan. J Pak Med Assoc 52: 465–470
  55. Goswami N, Gandhi A, Patel P, Dikshit R (2013) An evaluation of knowledge, attitude and practices about prescribing fixed dose combinations among resident doctors. Perspect Clin Res 4: 130–125
  56. Heckbert SR, Rutter CM, Oliver M, Williams LH, Ciechanowski P, et al. (2010) Depression in relation to long-term control of glycemia, blood pressure, and lipids in patients with diabetes. J Gen Intern Med 25: 524–529. [crossref]
  57.  Ross SA (2013) Breaking down patient and physician barriers to optimize glycemic control in type 2 diabetes. Am J Med 126: S38–48. [crossref]
  58. Petrak, F, Baumeister H, Skinner TC, Brown A Holt RIG (2015) Depression and diabetes: treatment and health-care delivery. Lancet Diabetes Endocrinol 3: 472–485
  59. Zhuo X, Zhang P, Barker L, Albright A, Thompson TJ, et al. (2014) The lifetime cost of diabetes and its implications for diabetes prevention. Diabetes Care 37: 2557–2564. [crossref]
  60. Kannan S, Mahadevan S, Ramakrishnan A (2015) Fixed dose combinations for type 2 diabetes. Lancet Diabetes Endocrinol 3: 408. [crossref]
  61.  Clarke PM1, Avery AB2 (2014) Evaluating the costs and benefits of using combination therapies. Med J Aust 200: 518–520. [crossref]
  62. Hutchins V, Zhang B, Fleurence R L, Krishnarajah G, Graham J (2011) A systematic review of adherence, treatment satisfaction and costs, in fixed-dose combination regimens in type 2 diabetes. Curr Med Res Opin 27: 1157–1168
  63. Seedat YK (2008) Fixed drug combination in hypertension and hyperlipidaemia in the developing world. Cardiovasc J Afr 19: 124–126. [crossref]