DOI: 10.31038/CST.2017264
Abstract
A detailed description of the clinical case of multivisceral resection in advanced gastric cancer is presented. The surgery included total gastrectomy, pancreatoduonenectomy, extended right colectomy, D2+ lymphadenectomy. After discharge from the hospital, the patient continues specific treatment in the form of adjuvant chemotherapy. During the nine months of follow-up, the patient did not find any recurrence of the disease. A brief review of the literature on the problem of multivisceral resections in advanced gastric cancer is presented.
Introduction
The necessity and possibility of multivisceral resections in locally advanced forms of malignant neoplasms in abdominal oncosurgery has been the subject of permanent discussion for several decades. At the same time, not only and not so much technical nuances of performing large-scale and super-large-scale surgical interventions as well as real patient tolerance of these operations and their expediency from the point of view of long-term results are discussed. At the same time, if multivisceral resections for malignant neoplasms of the large intestine and pelvic organs are currently considered as a standard version of the surgical manual, the extension of operations with locally advanced gastric tumors still raises a number of questions. This, in turn, is associated both with the characteristics of malignant neoplasms of the stomach (rapid local progression of the tumor process and its generalization, questionable efficacy of neoadjuvant and adjuvant therapy), and with topographic and anatomical features of the location of the stomach itself, determining the possibility of tumor invasion of the liver, pancreas, duodenum, colon, major vessels of the upper floor of the abdominal cavity. These circumstances, which in themselves dictate the necessity of performing multivisceral resections (of course with regional lymphadenectomy > D2) with very often occurring locally advanced gastric cancer, are certainly very important for deciding whether to perform this particular patient surgery with the radicality R0. On the other hand, factors that limit the possibility of carrying out operations in volumes equal to or exceeding gastrectomy with pancreatoduodenectomy are obvious: adequate anesthesia and resuscitation allowance for high risk of intra- and postoperative complications, technology of bloodless surgery and replacement of acute blood loss. At the same time, the integral indicator of the patient’s overall status in combination with these factors objectively determines an extremely high degree of operational and anesthetic risk and in the overwhelming majority of cases is today a reasoned basis for refusing a radical operation. Similarly, a very limited amount of observations of long-term results after multivisceral resections, which are an integral part of gastrectomy, do not allow most authors to make unequivocal judgments about the appropriateness of these interventions in terms of increasing the three- and five-year survival of patients.
Xin-Bao Wang et al. [1] report 17 cases of total gastrectomy with PDR performed in a group of 53 patients with synchronous tumor lesions of the stomach and pancreatoduodenal complex over a 9-year period. 3- and 5-year survival after multivisceral resection was 77 and 34%, respectively, in 59% of cases; local progression of the process was noted. The authors indicate that the predictors of satisfactory long-term results are the high degree of differentiation of adenocarcinoma and the radicality of the performed operation R0.
P. Roberts et al. [2] after analyzing Medline, EMBASE and Cochrane database, report a total of 27 total gastrectomies performed in combination with pancreatoduodenectomy for the period from 1985 to 2009. In the overwhelming majority of cases, surgical interventions were performed in patients with the T-test T3 and T4. In this case, the pre-operative or intraoperative IV stage of the oncology process was not the reason for refusing multivisceral resection. The indication for pancreatoduodenectomy (PDE) in stomach cancer was the spread of the tumor distal to the pylorus, the invasion of the tumor into the head of the pancreas, metastatic damage of the lymph nodes in the head of the pancreas. Neoadjuvant chemotherapy and radiation therapy was conducted in a limited number of observations, was not systematic and its results could not be subjected to statistical analysis. The authors indicate that the combination of gastrectomy with PDR significantly increases the number of postoperative complications (23.1 – 73.9%) compared to gastrectomy in a monovariant (3.2 – 31.9%). However, the authors do not report any fatal outcome after multivisceral resection. Analyzing the long-term results of surgical interventions, the authors point out that although there are no significant differences in 5-year survival in some reports, there is still a trend in the increase in 3- and 5-year survival in patients after multivisceral resections compared to only gastrectomy due to an apparently smaller number of R1 resection in patients of the first group.
O.I. Kit, et al. [3] provide data on 22 total gastrectomies combined with PDE for the period from 1983 to 2010. Multivisceral resections were accompanied by the development of complications of the early postoperative period in 73.3% of patients and 2 deaths. Subsequently, 5 patients required deferred reconstructive surgery. The authors indicate that PDE in combination with gastrectomy performed for common stomach cancer, increase the radicalism of the operation, which is reflected in an increase in 3-year survival in these patients. The authors emphasize that at the present stage of development of the PDD technique its combination with gastrectomy in the hands of an experienced oncologist, with adequate anesthesia and postoperative rehabilitation, is an acceptable method of treating patients with locally advanced gastric cancer without metastases to regional lymph nodes.
In the monograph “Combined operations for stomach cancer”, published in 2005 under the editorship of prof. V.F. Kasatkin [4], the reasons for really single observations of a combination of gastrectomy with PDE are indicated: significant operational trauma, duration of surgery and anesthesia, removal of an extensive drug with the formation of a “tissue volume deficit” in the abdominal cavity, lack of a large epiploon as plastic material and a “biological” tampon, two dangerous in terms of development of insolvency of the anastomosis (pancreatic and esophageal). These circumstances are a natural cause of the complicated course of the postoperative period in almost 80% of patients. The authors provide information on two cases of expansion of the multivisceral resection volume to a combination of gastrectomy and PDE with right-sided hemicolectomy. The same authors give data on the operation of A.F. Chernousov (2000) combined gastrectomy, PDE and resection of the transverse colon. At the same time, the authors of the monograph argue reasonably enough about the feasibility of performing such operations: “Aware of the high risk of death, they relied on the idea of improving the patient’s condition and the illusory hope of recovery. The support was the fact that most of the operated ones were brought to their full desperation by their ailment, and realizing that the only real chance for prolonging life is surgery, literally demanding surgical intervention “[5-7].
Performing surgical interventions for stomach cancer in our Hospital, we very often face the need to expand the volume of surgery to a combination of subtotal resection or gastrectomy with distal or subtotal distal resection of the pancreas, resection of the colon, atypical or anatomical resection of the liver. However, with the need to perform multispecial resection in the amount of gastrectomy, PDE and extended right colectomy, we first encountered. Considering the aforementioned small number of observations of operations of this volume available in the literature, we considered it possible to describe this clinical case.
Clinical case
Patient N., 39 years old female, mother of three children, applied for consulting assistance to the Department of Abdominal Surgery of the Clinical Hospital 1 (Volynskaya) of the Hospital 1 Office of the President of the Russian Federation on 07.12.2016 with complaints about the inability to eat solid food, almost constant feeling of overflow in epigastria, regurgitation and periodic vomiting of food eaten. These symptoms were first noted by the patient in July 2016. In case of an out-patient examination in September 2016, during the esophagogastroduodenoscopy, “deformation and cicatricial-ulcerative stenosis of the pylorobulbar zone” was detected, a biopsy was taken. The histological examination of the biopsy specimen turned out to be uninformative. Due to increasing phenomena of gastric emptying, the patient again applied for an outpatient care to a gastroenterologist in November 2016. The patient received an outpatient X-ray of the stomach with contrast, at which the subcompensated stenosis of the pylorobulbar zone was diagnosed without specifying its etiology. From the end of November 2016, the patient noted the appearance of weakness, stool retention for 2 to 4 days, periodically the appearance of melena. The patient indicated the fact of the total mass loss for 4 months per 10 kg. In the history of the patient, there are three caesarean sections, the latter with a ligation of the fallopian tubes.
Upon examination, the patient’s condition was regarded as moderate. Patient was of normostenic physique, BMI 22.9. Clinically significant violations of the overall status, including peripheral lymphadenopathy, were not identified. Attention was drawn to the presence of palpable, limitedly displaced, painless volume formation in the epigastric region. In the rectal finger examination, traces of feces of black color were detected.
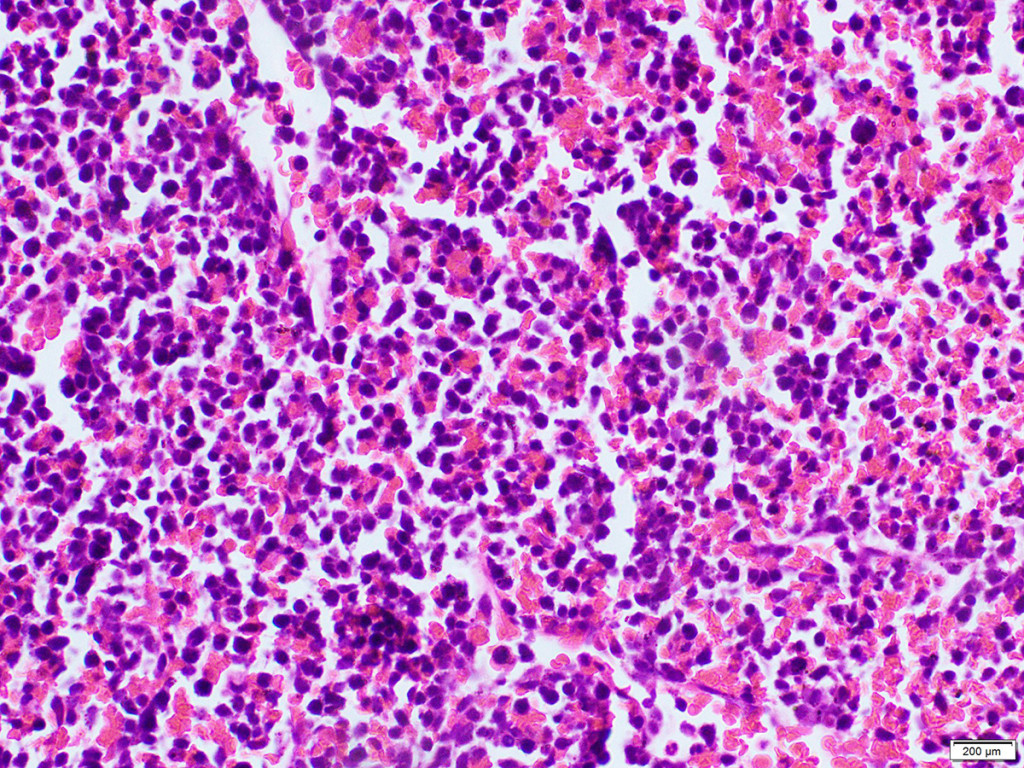
In case of esophagogastroduodenoscopy (Figure 1) circular tumor infiltration of the antral part was detected with proximal propagation along the small curvature 2 cm above the angle of the stomach, distally on the bulb of the duodenum and postbulbar region, with ulceration in the antrum 2 × 2.5 cm, in the bottom of which the plaque of hydrochloric acid hematin; multifocus biopsy was performed. Histological examination of the endoscopic biopsy specimen: a low-grade adenocarcinoma with the presence of signet-ring cells.
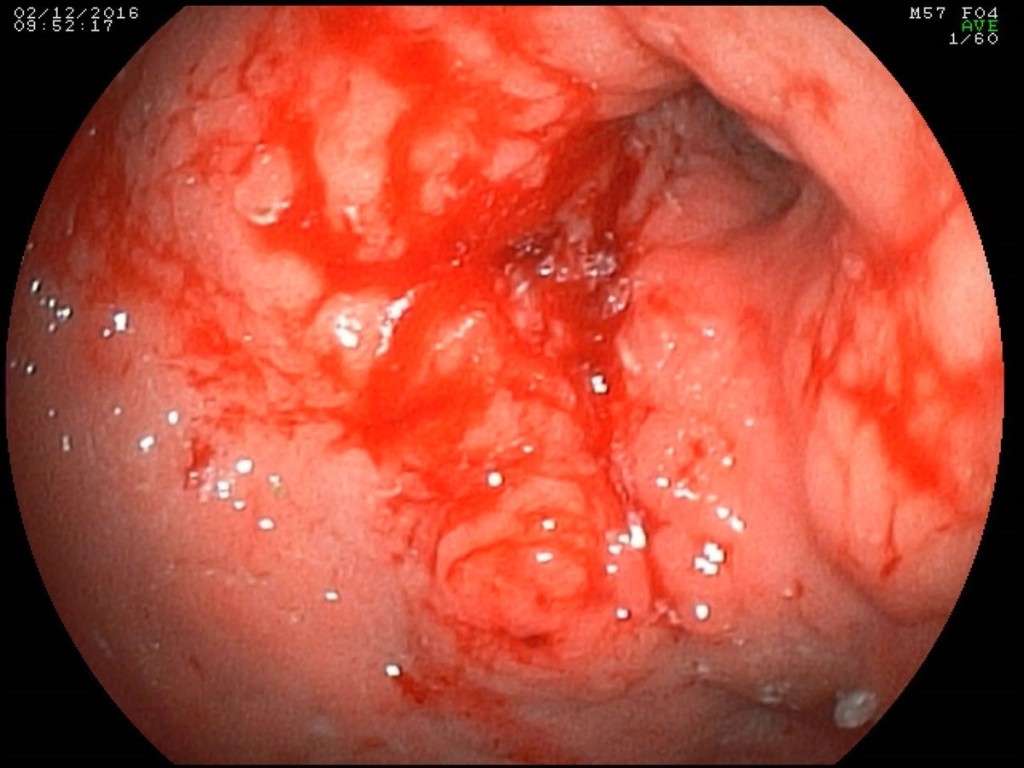
Figure 1. Endoscopic picture of a circular infiltrative tumor of the antral and stomach body with ulceration.
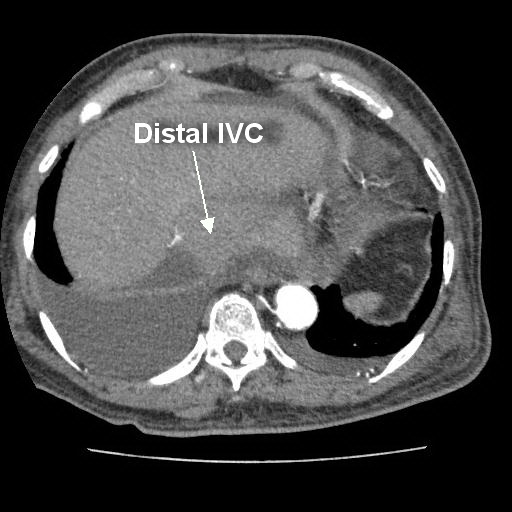
The patient was hospitalized in the Department of Abdominal Surgery of the Clinical Hospital 1 (Volynskaya) of the Hospital 1 Office of the President of the Russian Federation on 08.12.2016. At the time of hospitalization, laboratory indicators were within the physiological norm (including Hb 128 g/l, WBC 7.6, total protein 66 g/l). When multispiral computed tomography (MSCT) was performed with bolus contrasting, it was revealed (Figure 2): the upper part of the stomach was stretched with contents, in which a hyper-sensitive suspension was detected (probably, barium residues); the walls of the antrum are thickened to 15 mm, around the antrum there are quantitatively enlarged lymph nodes 9-12 mm in size, the pyloric department merges with the bulb of the duodenum without clear boundaries, the lumen in it is not traced; thickness of the walls of bulb and postbulbar part of the duodenum up to 7mm, the rest of the intestinal wall is not thickened; the walls of the stomach and the duodenum adjacent to the head of the pancreas without convincing signs of tumor’s invasion; the spleen is not enlarged, homogeneous; pancreas with clear contours, not enlarged, homogeneous structure; pancreatic duct is not enlarged; sites of pathological accumulation of contrast substance parenchyma of the gland is not revealed; liver is not enlarged, homogeneous structure; intra- and extrahepatic bile ducts are not dilated, gallbladder is in usual size, thin-walled, in the lumen – homogeneous liquid contents; there were signs of stenosis in low third of the right ureter with pronounced uretero-pylo-calicoectasia on the right; there is no fluid in the abdominal cavity. At the MSCT of the thorax no pathological changes were detected. At laboratory inspection of oncomarkers: CA 72-4 31,2 IU, CA 19-9 151,3 IU
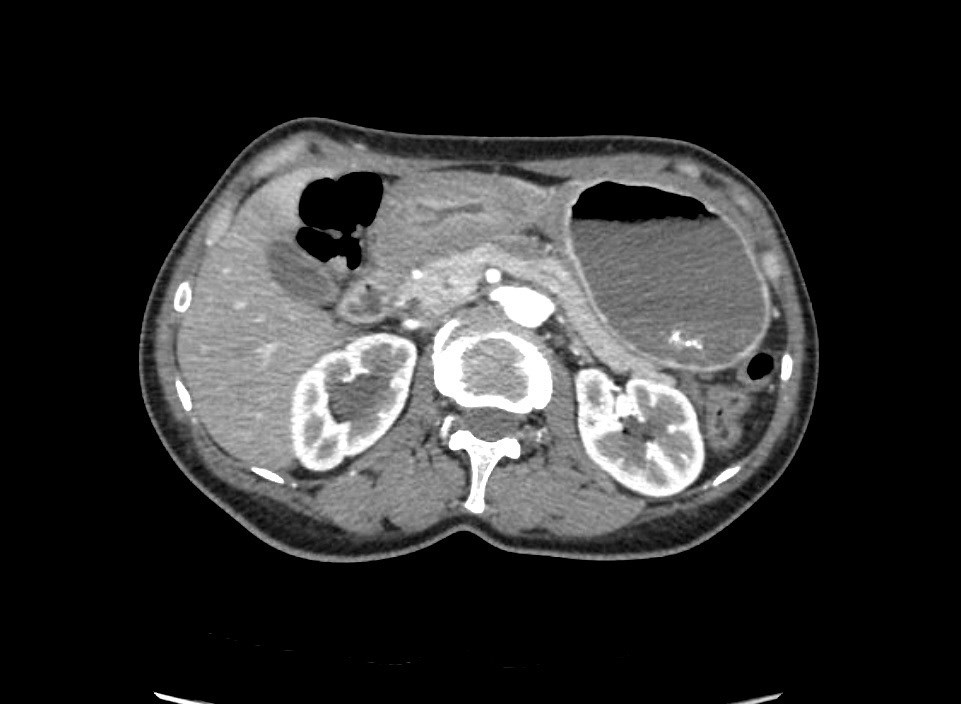
Figure 2. MSCT: antrum tumor extends to the bulb of the duodenum.
The clinical diagnosis was formulated as follows: C16.8, cancer of the antrum and body of the stomach, infiltrative-ulcerative form, with spread to the duodenum (type III Borrmann) cT4N1Mx. Taking into account the verified histological tumor lesion of the stomach complicated by decompensated stenosis and recurrent bleeding, in the absence of signs of systemic dissemination of the tumor process and signs of tumor unresectability, a decision was made to conduct an operative intervention in the volume of distal subtotal resection of the stomach with pancreatoduodenectomy according to vital indications.
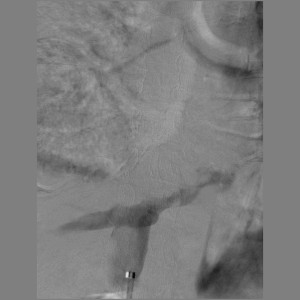
Within 4 days, the patient underwent preoperative preparation, including parenteral administration of 3-Chamber bags mixtures and sipping with official nutritional mixtures with a total calorie content up to 3,000 kcal/day. Immunonutrition support was provided for enteral and parenteral administration of the Omega-3 fatty acids. In connection with the stricture of the right ureter, an internal ureteral stent was placed on the right.
13.12.2016 the patient was operated under endotracheal anesthesia in combination with epidural anesthesia. At the stage of intraoperative revision, a circular tumor of the antral section, which propagates proximally to the body of the stomach and the subcardia by a small curvature (Figure 3), distally to the bulb and the postbulbar part of duodenum, is revealed invading the serous of the anterior and posterior walls of the stomach. It was found invasion of the tumor along the back wall of the antrum into the head of the pancreas, the mesocolon to the right and left of the middle colonic vessels, into the wall of the transverse colon in the hepatic flexure (Figure 4). In addition, infiltration of the right paracolic space, presence of characteristic foci of dissemination on the visceral peritoneum of ileo-cecal angle and in the projection of the distal part of the inferior mesenteric vein were determined. A macroscopic increase in the lymph nodes of groups 3, 4d, 5, 6, 7, 15 (according to JCGC) was found.
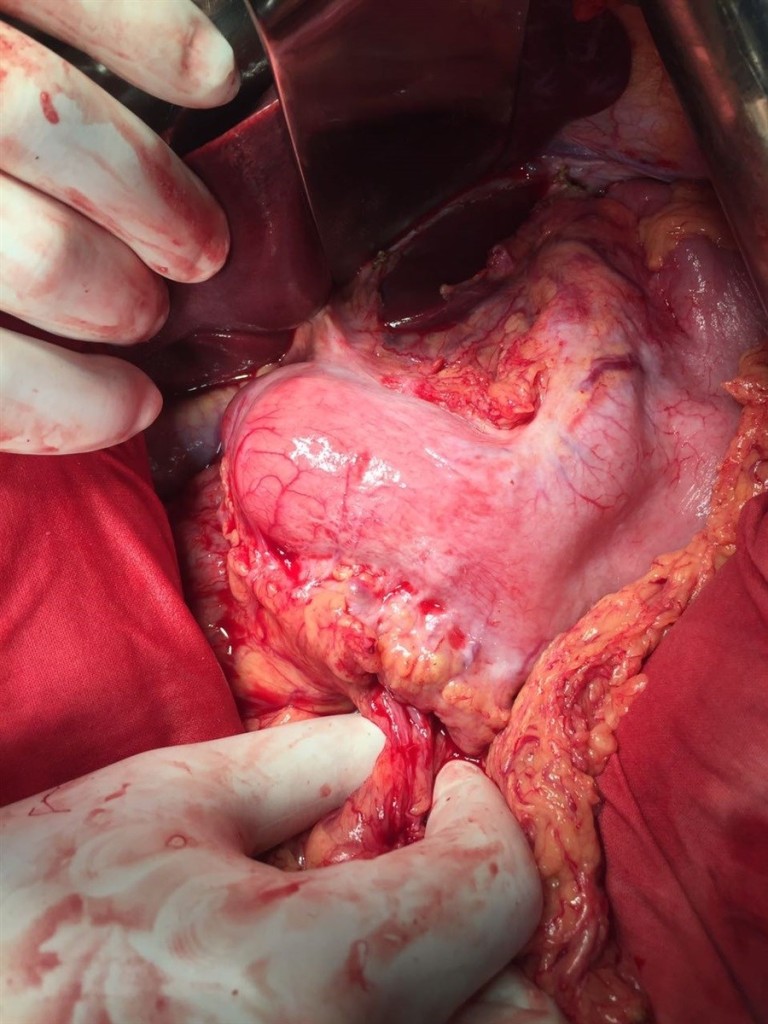
Figure 3. Appearance of the stomach during intraoperative exploration.
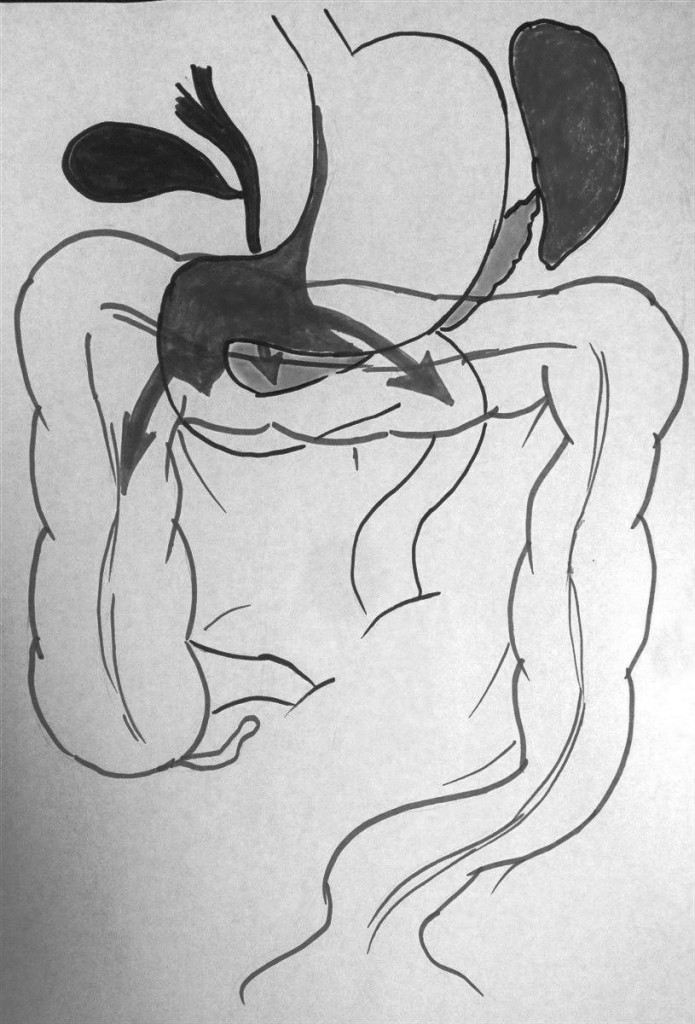
Figure 4. Local prevalence of the tumor process.
Taking into account the data of the operational finding, the volume of the operation was extended to gastrectomy, pancreatoduodenectomy, extended right colectomy with regional lymphadenectomy D2. During the resection stage, the esophagus was crossed 3 cm above the cardia, the jejunum – 10 cm distal to Treitz ligamentum; the pancreas was crossed along the border of the neck and body to the left of the superior mesenteric vein ; the ileum was crossed 20 cm proximal to the ileocolic angle, the colon – 8 cm distal to the splenic flexure; the c holedoch was crossed 0.5 cm distal to the confluence of the cystic duct; ilio-colon and middle colonic artery are ligated at the point of departure from the superior mesenteric artery, veins of the same name – at the point of confluence in the superior mesenteric vein. The inferior mesenteric vein after the test compression was crossed 4 cm from the point of confluence into the splenic vein. Regional lymphadenectomy with removal of lymph nodes of groups 1-12, 13, 14v, 15, 16b1, 17, 18 (according to JGCA classification) was performed (Figure 5). The resected tissues were removed by a single block (Figure 9). Dissection of tissues during the resection stage was carried out using ultrasound dissection and bipolar coagulation. Urgent histological examination showed no tumor growth at the margins of resection.
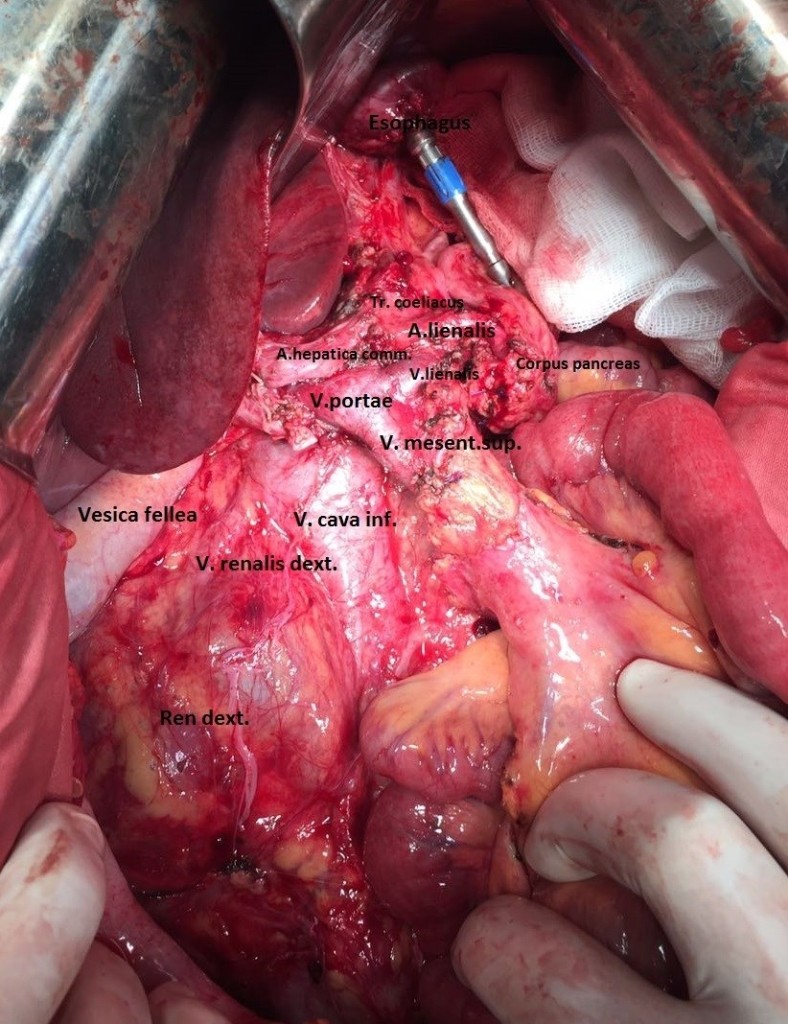
Figure 5. Resection stage of the surgery is completed.
The reconstructive stage of the surgery was performed with the formation of alimentary and biliopancreatic (70 cm) loops of small bowel according to Roux mode (Figure 6). On the alimentary loop, an “end-to-end” esophagogo-enteroanastomosis was formed with the circular stapler (28 mm), ileo-descendoanastomosis “side by side” was formed with the stapler device (60mm) (Figure 7). The alimentary and biliopancreatic loops were connected by “side-to-side” Rouxe-en-Y-anastomosis with the stapler device (60mm), distal to esophago-enteroanastomosis by 45 cm. On the biliopancreatic loop, the “end-to-end” pancreato-enteroanastomosis was formed by single sutures Maxon 3/0 according to J.L. Cameron mode (invagination of the edge of the pancreas into the lumen of the small intestine) . This method of formation of pancreato-enteroanastomosis anastomosis was chosen because of the small diameter of the main pancreatic duct (up to 1.5 mm), the absence of fibrosis of the parenchyma and the unexpressed pancreatic capsule. At 20 cm distal to this anastomosis, cholecysto-enteroanastomosis was formed with a single continuous Biosyn 3/0 suture. In addition, on the biliopancreatic loop, the interintestinal (Braun’s) anastomosis was formed “side by side” with the stapler device (60mm) (Figure 8). A transnasal nourishing probe was conducted into the alimentary loop beyond the esophago-enteroanastomosis and Roux-en-Y-anastomosis. Surgery was completed by draining the subhepatic, left subdiaphragmatic space, the pelvic cavity and the pancreato-enteroanastomosis zone. The duration of the surgery was 7 hours and 30 minutes. The total volume of intraoperative blood loss, taking into account the remote tissues – up to 1 liter. Transfusion of one unit of RBC and three units of plasma was performed intraoperatively.
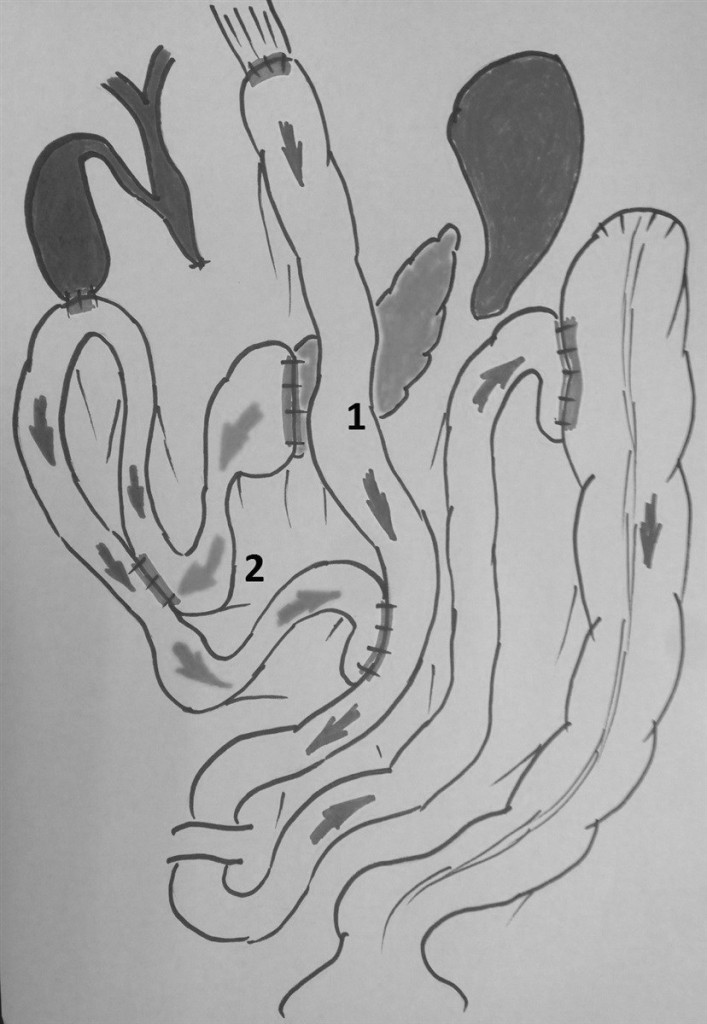
Figure 6. The general plan of the reconstructive stage of the surgery: 1 – alimentary loop of the small bowel, 2 – biliopancreatic loop of the small bowel.
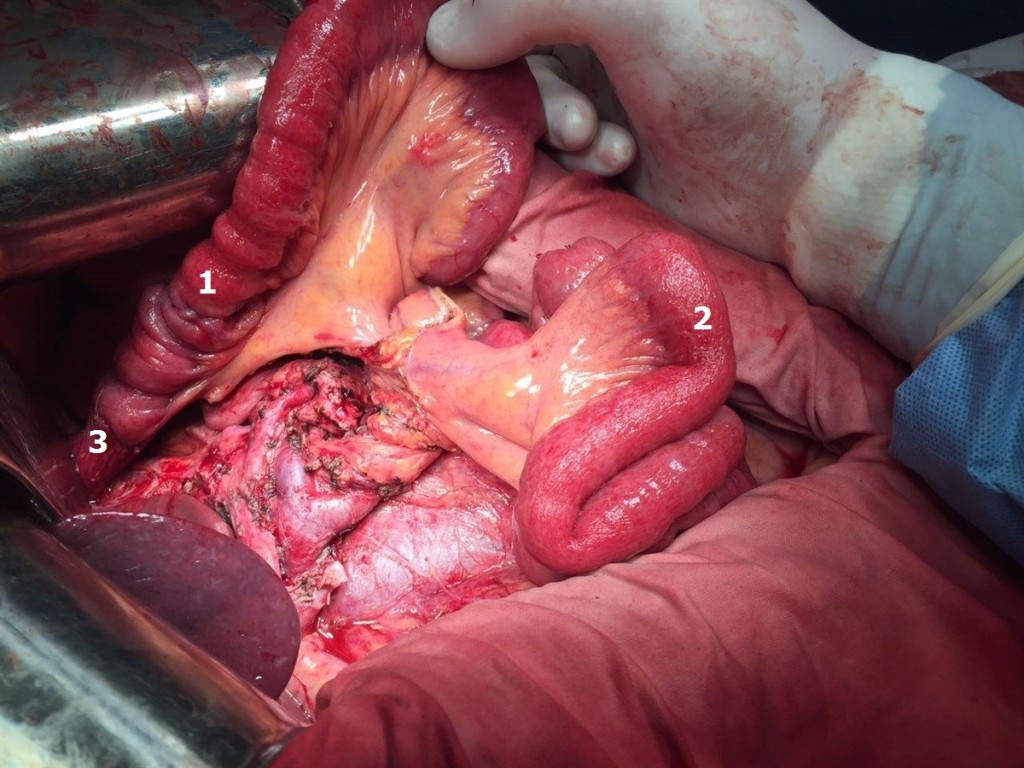
Figure 7. The beginning of the reconstructive stage of the surgery: 1 – alimentary loop of the small bowel, 2 – biliopancreatic loop of the small bowel before the formation of anastomoses, 3 – esophagoeteroanastomosis.
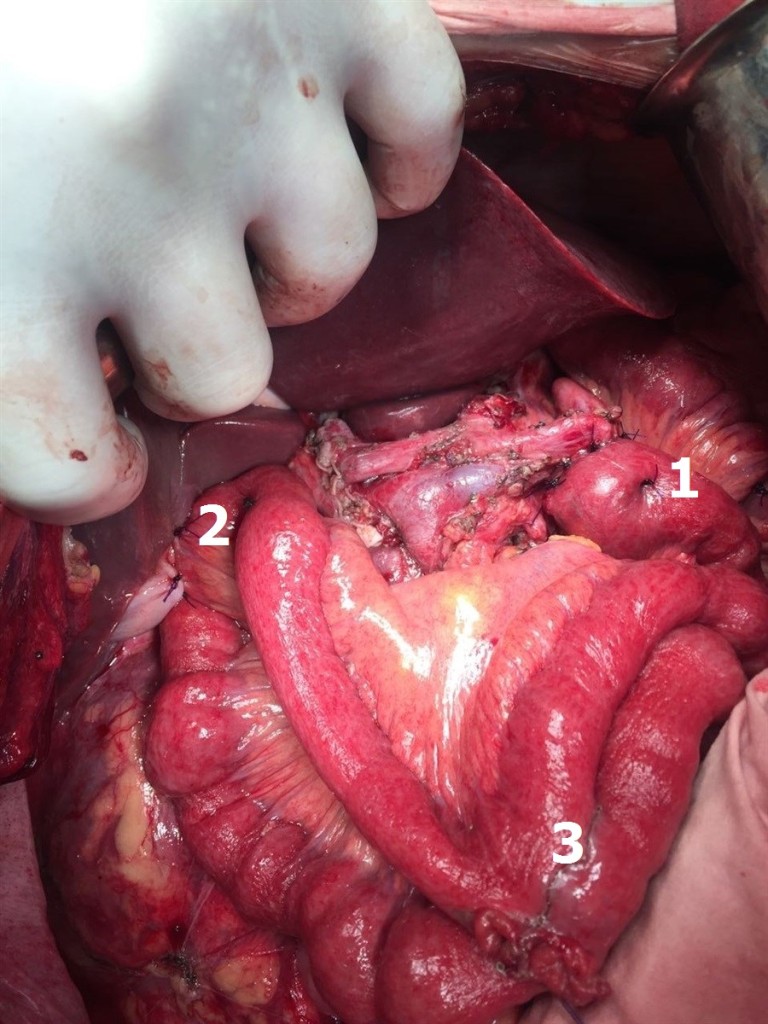
Figure 8. Figure 8. Biliopancreatic loop of small bowel: 1 – invaginated pancreatoenteroanastomosis according to J.L. Cameron, 2 – cholecystoenteroanastomosis, 3 – interintestinal anastomosis according to Braun.
Thus, the patient underwent surgical treatment in the following volume: total gastrectomy, pancreatoduodenectomy, expanded right colectomy, D2+ lymphadenectomy (Figure 9).
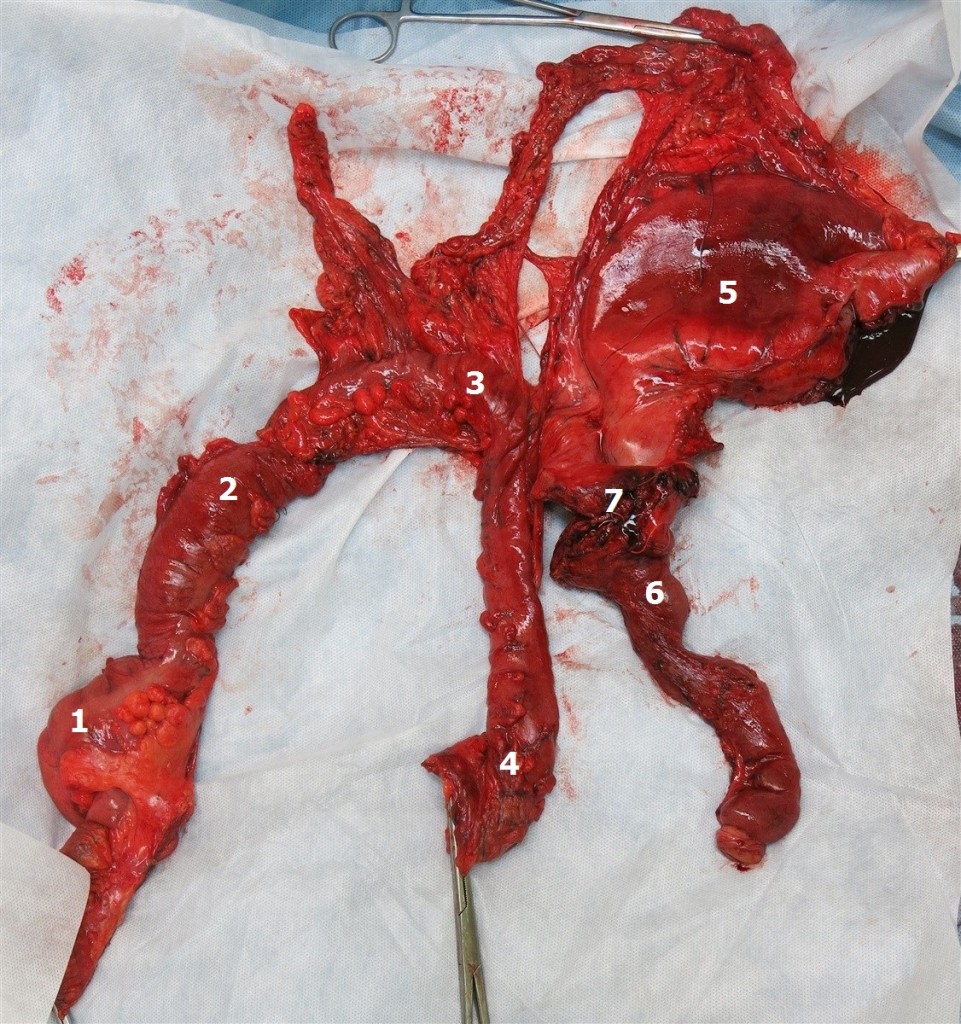
Figure 9. Surgical specimen: 1 – caecum, 2 – ascending colon, 3 – transverse colon, 4 – the left splenic flexure, 5 – stomach, 6 – duodenum, 7 – head and neck of the pancreas.
In the first 48 hours of the postoperative period the patient was observed in the ICU. Self-breathing was restored in one hour after the end of the surgery. Six hours after the end of the surgery infusion of semi-elemental mixtures into the nutritive probe, parenteral nutritional support with a “three in one” mixture was started. After 24 hours from the end of the surgery the patient was switched to a probe feed with a standard enteral mixture. The feeding probe was removed 36 hours after the end of the operation. Later the patient received standard postoperative therapy according “fast track” protocol: prolonged epidural anesthesia and NSAID without opioids, combined parenteral-enteral support with the siping of high-calorie mixtures, immunonutrition support with the Omega-3 fatty acids, antibacterial prophylaxy, octreotide infusion 0.025 mg / h, thromboprophylaxis. From the second day after surgery began the physical activation of the patient (sitting in bed, lifting to the feet). Auscultatory peristalsis began to be determined 18 hours after the end of the surgery, stool – on the 3rd day of the postoperative period.
From the third day of the postoperative period, rehabilitation was performed under the conditions of the abdominal surgery department. The diet was extended by oral intake of fermented milk products, broths. During 3-6 days there was a multiple liquid stool, periodic spastic pains in the abdomen, and phenomena of flatulence. However, already by the 7 days of the postoperative period, these phenomena were leveled, the stool returned to normal, once a day. Separated by drainage, starting from 1 day postoperative period, was serous, amounting to a total of 100 ml per day and limited to 6 days postoperative period to 50 ml. Drainages from the small pelvis and the left sub-diaphragmatic space were removed on the 4th day of the postoperative period, drainage from the subhepatic space – on day 6. On the 7th day of the postoperative period, a clear colorless discharge from the drainage set in the region of pancreato-enteroanastomosis in the amount of up to 50-100 ml per day (amylase 9100 IU) was noted. With control ultrasound of the abdominal cavity on the 1st, 3rd, 6th, 9th and 13th day of the postoperative period there were no accumulations of fluid in the abdominal cavity and in the retroperitoneal space. The patient completely switched to taking the standart diet on the 9th day after surgery.
In laboratory indicators moderate anemia (Hb up to 95 g/l), leukocytosis (WBC up to 13.4), hyperamilazemia up to 340 IU, hypoproteinemia (total protein up to 47 g/l) for 1-4 days of the postoperative period were noted. Episodes of hyperthermia for the entire period of postoperative observation were not noted. On the 12th day of the postoperative period, Hb 103 g / l, WBC – 7.7, a-amylase – 76 IU, total protein – 66 g / l. The surgical wound healed by primary tension.
In consideration of absence of infectious complications, the relative normalization of the function of the digestive tract, but the remaining rate of pancreatic juice in the 50-70 ml / day, it was decided to discharge the patient from the hospital for outpatient monitoring with functioning drainage on the 12-day postoperative period. When follow-up examined on the 14th day after discharge, it was found that there was no liquid by drainage. The drainage was removed.
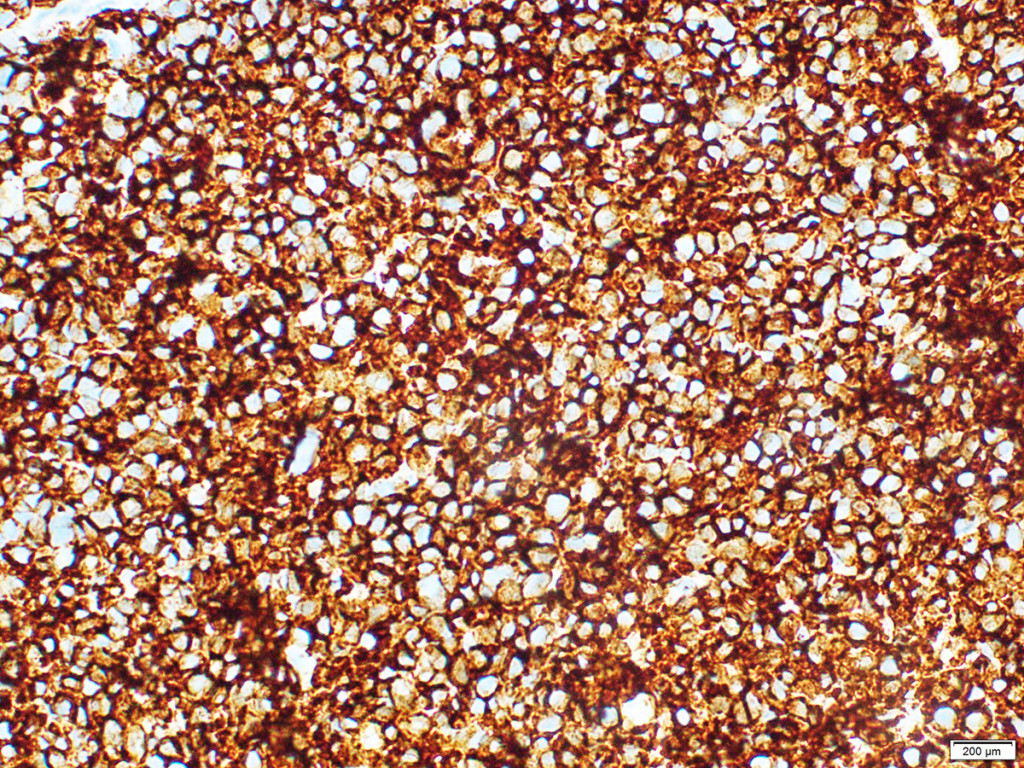
Histological study of the surgical specimen (stomach with omentum major and minor, duodenum, proximal part of small bowel, head and neck of pancreas, distal part of ileum, caecum, ascending colon with paracolic fat, transverse colon with mesocolon, left splenic flexure) : the circular tumor infiltration in the antrum and the body of the stomach is determined, spreading along the small curvature to the subcardia, passing to the duodenum, the ulceration of the tumor in the antrum (type III Borrmann), with signs of bleeding; in the wall of the stomach – the growth of a tumor having the structure of a low-grade adenocarcinoma with the presence of signet-ring cells; the tumor grows into the submucosal and muscular layers, into the subserous and serous layer, grows into a small omentum, the transverse colon and mesocolon, grows along the fibrous layers in the thickness of the fatty tissue; a large number of tumor cells is determined in perineural spaces, lymphatic vessels and veins; elements of the tumor are found in the tissue of the head of the pancreas, the muscular and submucosal layer of the caecum and the appendix, the wall of the duodenum, mesocolon, paracolic fiber. Tumor metastases were detected in 7 of the 38 lymph nodes examined. In the margins of resection (stomach, pancreas, jejunum, ileum, colon, mesocolon) tumor growth was not detected (PM 0, DM 0), radical surgery – R0. Pathomorphologic diagnosis: C16.8, advanced stomach cancer (type III Borrmann) with spread to the duodenum, pancreas head, transverse colon, mesocolon, right paracolon, metastasis of the visceral peritoneum of the caecum pT4b ly3 v3 N3 M1 P1 CYX H0. Immunohistochemical examination with antibodies to Her2 / neu (Pathway 4B5 Roche-Ventana): Her2 / neu – 0.
Starting with the fifth week of the postoperative period, the patient was subjected to adjuvant chemotherapy according to the EOX scheme (oxorubicin, oxaliplatin, capecitabine). A total of 6 courses of chemotherapy with stimulation filgrastim. In August 2017, a control PET CT was performed. A slight diffuse increased accumulation of difluoroglucose in the parietal peritoneum of the epigastric region is determined. At the control laboratory examination: indicators of clinical and biochemical blood tests within reference values, CA 72-4 5, 6 IU, CA 19-9 32,3 IU. Patient was assigned continued reception of capecitabine in mono regimen.
Currently in September 2017, the patient leads a normal lifestyle, has a regular diet without dyspepsia, regains her usual body weight and works by her profession.
Conclusion
Concluding the description of the above clinical case, we consider it necessary to give a number of comments. Undoubtedly, the surgical treatment of the patient is non-standard and rarely performed operations. This operation should be attributed to the category of desperation operations dictated by a perfectly understandable motivation to save or at least prolong the patient’s life in the presence of not only formal indications in the form of decompensated stenosis and recurrent bleeding from the tumor, but also motivation caused by a variety of social factors. During the surgery, having determined the prevalence of the tumor, we were perfectly aware of the illusory nature of our hopes for performing absolutely radical surgery. And at the same time, the decision to limit the surgery only by bypass formation, depriving the patient of any chance of life for more than 2-3 months was collectively found unacceptable. Moreover, taking into account the high risk of intra- and postoperative complications, we nevertheless counted on a favorable outcome of the surgery, taking into account a number of apparently positive factors, namely: young age and satisfactory physical condition of the patient, absence of signs of subclinical organ failure and significant violations of homeostasis. When performing surgery for a tumor of this prevalence, we certainly hoped for the possibility of modern adjuvant chemotherapy options. The early postoperative period and nine months of patient monitoring showed that our hopes were not unfounded.
We have presented only a single clinical observation of multivisceral resection in locally advanced stomach cancer, but we believe that it can be useful both for continuing the discussion about the necessity and possibility of operations of this size, and for making a decision that is extremely difficult from a medical and human perspective, in a concrete clinical situation.
References
- Xin-Bao Wang, Li-Tao Yang, Ze-Wei Zhang (2008) Pancreaticoduodenectomy for advanced gastric cancer with pancreaticoduodenal region involvement. World J Gastroenterol 14: 3425–3429.
- Roberts P, Seevaratnam R, Cardoso R, Law C, Helyer L, et al. (2012) Systematic review of pancreaticoduodenectomy for locally advanced gastric cancer. Gastric Cancer 15 Suppl 1: S108–115. [crossref]
- Kit OI, Kasatkin VF, Maksimov AY, Trifanov VS (2005) Gastrectomy in combination with pancreatoduodenal resection for gastric cancer. Oncosurgery Vol.5: 1.
- Combined operations for stomach cancer. Ed. V.F. Kasatkin
- Otsuji E, Yamaguchi T, et al. Total gastrectomy with simultaneous pancreaticosplenectomy or splenectomy in patients with advanced gastic carcinoma. Br J Cancer 79: 1789–1793.
- Zhang M, Zhang H, Ma Y, Zhu G, Xue Y. Prognosis and surgical treatment of gastric cancer invading adjacent organs. ANZ J Surg 80: 510–4.
- Ozer I, Bostanci EB, Orug T, Ozogul YB, Ulas M, Ercan M, et al. (2017) Surgical outcomes and survival after multiorgan resection for locally advanced gastric cancer. Am J Surg 198: 25–30.