Abstract
Background: Hepatitis B virus (HBV) infection is a global health problem. Immigrants to the United States have a high prevalence of HBV infection. Understanding the HBV infection trends and its distribution can improve prevention and control strategies. This study was to determine the infection trends, distribution, and factors associated with HBV infection in Delaware.
Methods: We performed a retrospective study on persons suspected of having HBV infection reported to Delaware Division of Public Health’s Surveillance System during January 1, 2005-December 31, 2015. The charts of 4, 981 persons were reviewed and included in the analysis.
Results: Of these 4, 981 persons, 2, 119 (42.5%) had HBV infection. During 2005-2015, acute and chronic HBV infection declined 80.9% and 60%, respectively for an overall reduction of 62.2%.
Males had a higher yearly infection rate. Rates declined 63.5% among males and 60.1% among females. There was an increase of 13.4% in the HBV infection in females during 2010-2015. HBV infection declined in all racial groups. Asians had a higher yearly infection rate and it increased 40.0% during 2010-2015. HBV infection declined in all age groups. However, an increase of 12.2% was seen among those 15-39 years during 2010-2015. Sixty-six percent of infected patients were in five cities: Wilmington, Newark, New Castle, Dover, and Bear.
In a multivariable logistic model, significant predictors for HBV infection included being male [adjusted odds ratio (aOR): 1.6, 95% CI: 1.4-1.8], age 15-39 years and 40-59 years (aOR: 3.7, 95% CI: 2.3-5.9 and 2.4, 95%CI: 1.5-3.8). Asian, black, and other race had a greater risk compared with white, with aOR of 5.8 (95% CI: 4.8-7.0), 1.7 (95% CI: 1.4-1.9), and 1.4 (95% CI: 1.1-1.9), respectively.
Conclusions: HBV infection is significant in Delaware and concentrated mainly in a few cities. Despite an overall decline, increases were seen among females, in the 15-39 age group, and in the Asian population during 2010-2015. Further studies should be conducted to identify factors contributing to these increases
Keywords
Hepatitis B virus (HBV), hepatitis B virus infection, incidence, prevalence, epidemiology, surveillance
Introduction
Hepatitis B virus (HBV) infection remains a major global health problem with an estimated 257 million chronic HBV-infected persons worldwide in 2017 [1]. In the United States, despite a comprehensive vaccination program to eliminate HBV transmission since 1991 [2], the estimated prevalence of current active HBV infection during 2011-2014 was 0.4% among U.S. adults age 18 years and over [3], with an estimate of 850, 000-2.2 million HBV-infected persons [4-6]. HBV infection is a vaccine preventable disease that is transmitted by percutaneous or mucosal exposure to infectious blood or body fluids. It is among the top 10 causes of infectious disease-related mortality in the world, with over 887, 000 deaths annually [1]. Delaware is a small state with a population of 945, 934 people in 2015 and home to 76, 768 immigrants in 2013 [7]. Immigrants to the United States have a high prevalence of viral hepatitis B surface antigen (HBsAg); it was 4.9% during 2004-2008 [8] and around 71.3% of chronic HBV infections were among persons born outside the United States [9]. Since individuals with chronic HBV infection are often unaware of their infection status, they are a major source of ongoing HBV transmission [10]. An understanding of HBV epidemiology is important for targeted public health efforts. This study aimed to determine HBV infection trends, identify its distribution and factors associated with HBV infection in Delaware during the period 2005-2015.
Methods
Data and patient population
HBV data reported by hospitals, clinics, and laboratories to the Delaware Division of Public Health (DPH) through the Delaware Electronic Reporting and Surveillance System (DERSS) were obtained for the years 2005-2015 (11-year period). Data reported to DERSS include information on laboratory testing results of suspected HBV infection persons. In addition, information collected by epidemiologists during the disease investigation process was reviewed, including data on the persons’ demographics, diagnosis, hospitalization, and vaccination status.
Study design
A retrospective study on persons suspected of having HBV infection was conducted. All reported persons to DERSS and information gathered during the disease investigation were included for review and analysis. The rate of HBV infection was the principal study outcome. HBV infection was defined based upon the Center for Disease Control and Prevention’s (CDC) clinical case definitions and laboratory criteria [11]. For acute HBV infection: a case was confirmed if met the clinical case definition, was laboratory confirmed, and was not known to have chronic hepatitis B. Clinical description includes an acute illness with a discrete onset of any sign or symptom consistent with acute viral hepatitis, and either a) jaundice, or b) elevated serum alanine aminotransferase (ALT) levels >100 IU/L. Laboratory criteria include hepatitis B surface antigen (HBsAg) positive, and Immunoglobulin M (IgM) antibody to hepatitis B core antigen (IgM anti-HBc) positive (if done). For chronic HBV infection: clinically, no symptoms are required. Persons with chronic HBV may have no evidence of liver disease or may have a spectrum of disease ranging from chronic hepatitis to cirrhosis or liver cancer. Laboratory criteria include IgM anti-HBc negative and a positive result on one of the following tests: HBsAg, hepatitis B e antigen (HBeAg), or nucleic acid test for hepatitis B virus DNA, or HBsAg positive or nucleic acid test for HBV DNA positive or HBeAg positive two times at least 6 months apart. A case was classified as a probable case if a person has a single HBsAg positive or HBV DNA positive or HBeAg positive and does not meet the case definition for acute hepatitis B, and a confirmed case if a person who meets either of the above laboratory criteria for diagnosis [11].
Statistical analysis
Descriptive statistics such as frequencies, means, medians, inter-quartile range, and cross-tabulation were used for patient characteristics. Between-group differences were evaluated using the chi-square test or Fisher’s exact test for categorical data or a Mann-Whitney test for continuous data. The yearly cumulative incidence of acute HBV infection and the yearly prevalence rate of chronic HBV infection per 100, 000 population were determined for the 2005-2015 period. Calculation of the yearly cumulative incidence was based on the number of newly-diagnosed patients and the number of people at risk for HBV infection within each year. The yearly prevalence rate of chronic HBV infection was estimated based upon the yearly number of chronic HBV-infected cases divided by the number of people in the population in the same year. In addition, the yearly rate of HBV infection per 100, 000 population was calculated by population characteristics (sex, age, and race). The yearly infection rate was estimated based on the yearly number of HBV-infected cases and the Delaware population in the same year stratified by sex, age group, and race. To identify distribution of HBV infection, patient characteristics were described and established by geographical location. Risk factors associated with HBV infection were analyzed by logistic regression models. Hosmer and Lemeshow stepwise strategies were applied for model building: potential independent variables with P-value <0.25 were included in the initial full model. Data analyses were performed using the Stata software program (version 13; STATA Corp., College Station, TX). P-values less than 0.05 (two tailed) were considered statistically significant.
Results
A total of 4, 981 people suspected of having HBV infection were identified and included in the analysis. Baseline and demographic characteristics, by HBV infection status, are presented in Table 1. HBV infection was identified in 2, 119 patients (42.5%, 232 acute and 1, 887 chronic HBV-infected patients), including 1, 988 (39.9%) and 131 (2.6%) cases of confirmed and probable HBV infection, respectively. Of this study population, a significantly larger number of reported persons were males compared with females [55.0% versus (vs.) 44.8%, P<0.001]. The overall study population’s mean age was 45.3 years [inter-quartile range (IQR): 34-56]. A majority (79.2%) were 15-59 years old; and white, black, and Asian races were observed in 38.5%, 34.1%, and 16.0%, respectively. Only 10.6% of the population had received one or more doses of HBV vaccination. Compared with the non-HBV infection group, the HBV-infected patients were younger [mean age: 42.7 years (IQR: 32-52) vs. 47.2 years (IQR: 36-58)] and had a significant larger number of patients in the 15-39 age group (43.1% vs. 27.3%, P<0.001). In addition, the HBV-infected patients had significantly fewer whites (26.4% vs. 47.4%), more persons of Asian origin (26.8% vs. 7.9%, P<0.001), and fewer patients who had received one or more doses of HBV vaccination, compared with the non-HBV infection group (6.1% vs. 14.0%, P < 0.001).
Table 1. Population characteristics
| Characteristics | HBV Infection(N = 2,119) | Non-HBVInfection(N = 2,862) | Total(N = 4,981) | P-value |
| Gender; N (%) | ||||
| Male | 1246 (58.8) | 1495 (52.2) | 2741 (55.0) | <0.001 |
| Female | 870 (41.1) | 1363 (47.6) | 2233 (44.8) | |
| Missing/Unknown | 3 (0.1) | 4 (0.2) | 7 (0.2) | |
| Age, N (%) mean:45.3 years, IQR: 34-56 years) | ||||
| <15 | 27 (1.3) | 94 (3.3) | 121 (2.4) | <0.001 |
| 15-39 | 914 (43.1) | 782 (27.3) | 1696 (34.1) | |
| 40-59 | 907 (42.8) | 1341 (46.8) | 2248 (45.1) | |
| ≥60 | 271 (12.8) | 646 (22.6) | 917 (18.4) | |
| Race/Ethnicity, N (%) | ||||
| White | 560 (26.4) | 1358 (47.4) | 1918 (38.5) | <0.001 |
| Black | 703 (33.2) | 997 (34.8) | 1700 (34.1) | |
| Asian | 568 (26.8) | 227 (7.9) | 795 (16.0) | |
| Others* | 82 (3.8) | 128 (4.5) | 210 (4.2) | |
| Unknown | 14 (0.7) | 68 (2.4) | 82 (1.7) | |
| Missing | 192 (9.1) | 84 (3.0) | 276 (5.5) | |
| Received ≥01 dose of hepatitis B virus vaccination | ||||
| Yes | 130 (6.1) | 399 (14.0) | 529 (10.6) | <0.001 |
| No | 1987 (93.8) | 2463 (86.0) | 4450 (89.3) | |
| Unknown/Missing | 2 (0.1) | 0 | 2 (0.1) | |
* American Indian/Alaska Native, Pacific Islander, Hispanic, Multiracial
Hepatitis B virus infection trend
Between 2005 and 2015, 2, 119 patients (232 acute, 1, 887 chronic) infected with HBV were identified. Figure 1 shows the incidence of acute HBV infection and the prevalence rate of chronic HBV infection per 100, 000 population from 2005 through 2015. The incidence of acute HBV per 100, 000 population declined 80.9%, from 4.2 (34 cases in 2005) to 0.8 (8 cases in 2015). Similarly, chronic HBV infection per 100, 000 population declined 60% from 36.0 (295 cases in 2005) to 14.4 (136 cases in 2015), making the overall reduction (acute and chronic) of 62.2% from 40.2 (329 cases) to 15.2 (144 cases) per 100, 000 population. During a period of 2010-2012, there was a moderate spike of 28% in the prevalence of chronic HBV infection, from 13.4 (in 2010) to 17.1 cases (in 2012) per 100, 000 population; and then a slight increase of approximately 7%, from 13.5 (in 2013) to 14.4 cases (in 2015) per 100, 000 population.
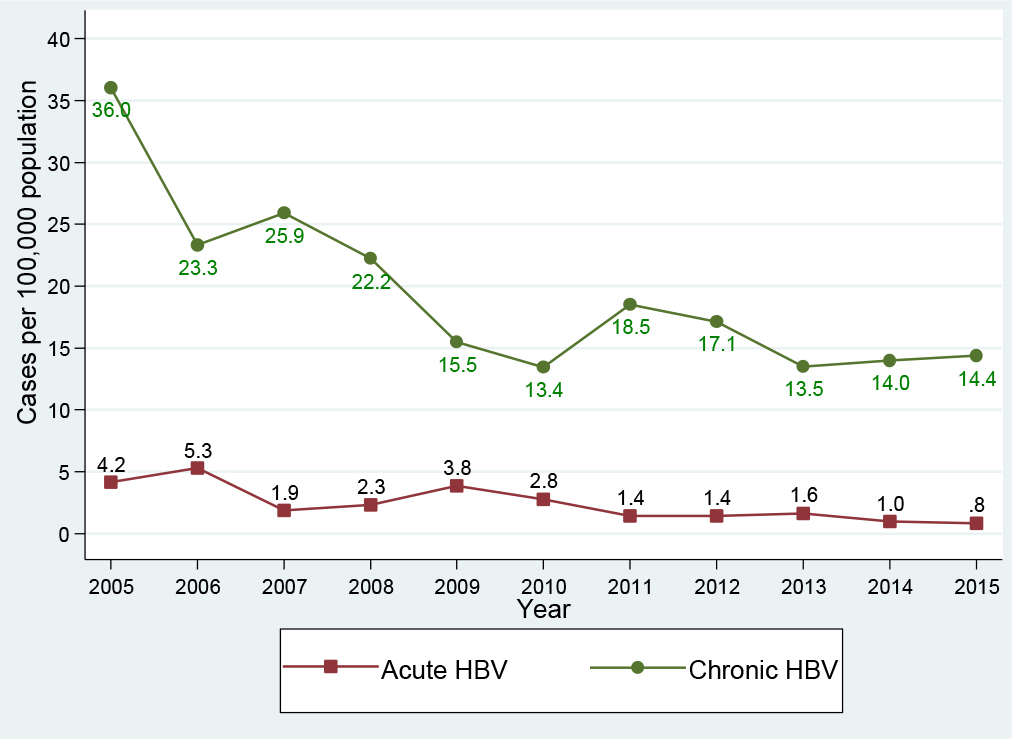
Figure 1. Hepatitis B virus infection trend, Delaware, 2005-2015
Hepatitis B virus infection by gender
Of the 2, 119 patients infected with HBV, males accounted for 58.8% (1, 246 cases) compared with 41.1% (870 cases) among females. In the acute HBV-infected group, 66.0% (153 cases) were in males compared with 33.6% (78 cases) in females. Similarly, in the chronic HBV-infected group, 57.9% (1, 093 cases) were in males compared with 42.0% (792 cases) in females, Table 1. Figure 2 presents the HBV infection trend by gender per 100, 000 population during the period 2005-2015: Generally, males had a higher yearly HBV infection rate in comparison with females. Between 2005 and 2015, the HBV infection rate among males declined 63.5%, from 49.1 (195 cases) to 17.9 (82 cases) per 100, 000 population; and the HBV infection rate among females declined 60.1%, from 31.8 (134 cases) to 12.7 (62 cases) per 100, 000 population. Interestingly, in the period 2005-2010, the HBV infection declined 64.8% among females, which was higher than the 56.2% decline for males. However, in the period 2010-2015, while we observed a decline of 16.7% in males (from 21.5 to 17.9 cases per 100, 000 population), the HBV infection rate increased 13.4% in females (from 11.2 to 12.7 cases per 100, 000 population).
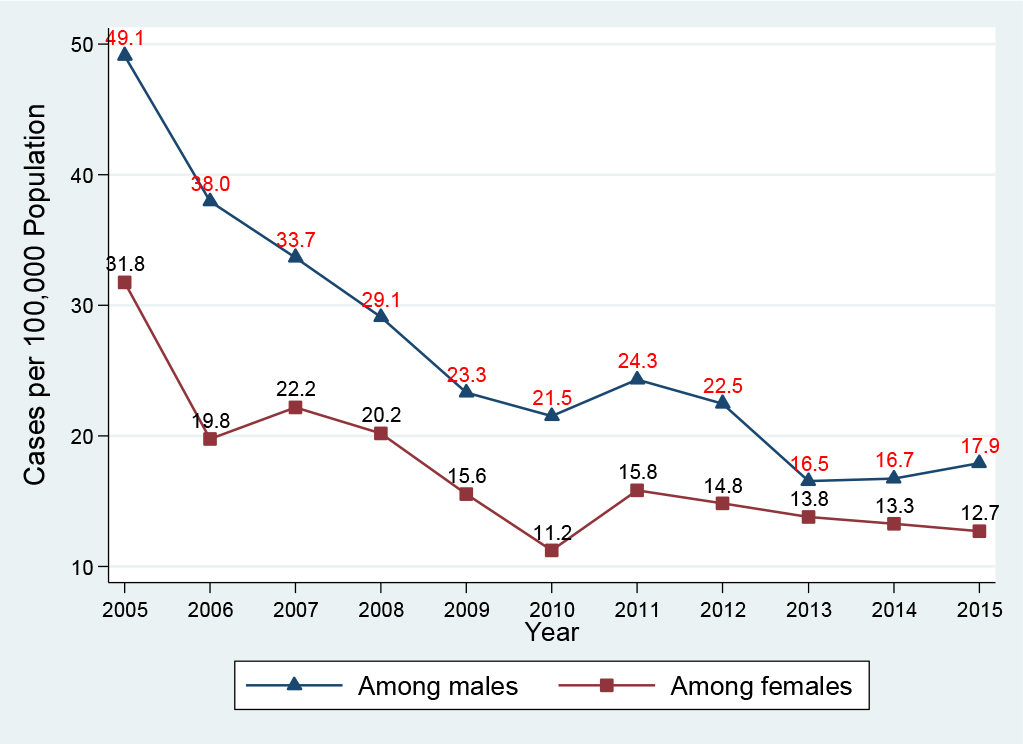
Figure 2. Hepatitis B virus infection by gender, Delaware, 2005-2015
Hepatitis B virus infection by age group
Of those infected with HBV, 85.9% (1, 821/2, 119 cases) were in the age groups of 15-39 and 40-59 years old, Table 2. Figure 3 presents the HBV infection trend per 100, 000 population by age group: In general, all age groups had a huge reduction between 2005 and 2015. The highest reduction (100%) was seen in the age group <15 years, from 2.5 (4 cases in 2005) to 0.6 (1 case in 2014) and 0.0 case (0 case in 2015) per 100, 000 population. The smallest reduction (63.6%) was observed in the age group of 15-39 years, from 51.7 (141 cases in 2005) to 23.8 (73 cases in 2015) per 100, 000 population. Approximately 88.9% reduction was seen in the age group of ≥60 years, from 19.7 (29 cases in 2005) to 7.2 (16 cases in 2015) per 100, 000 population; and 65.9% reduction was seen in the age group of 40-59 years, from 65.4 (155 cases in 2005) to 22.3 (55 cases in 2015) per 100, 000 population. Interestingly, in the period of 2010-2015, there was an increase of 12.2% in the HBV infection rate in the age group of 15-39 years, from 20.9 (62 cases in 2010) to 23.8 (73 cases in 2015) per 100, 000 population.
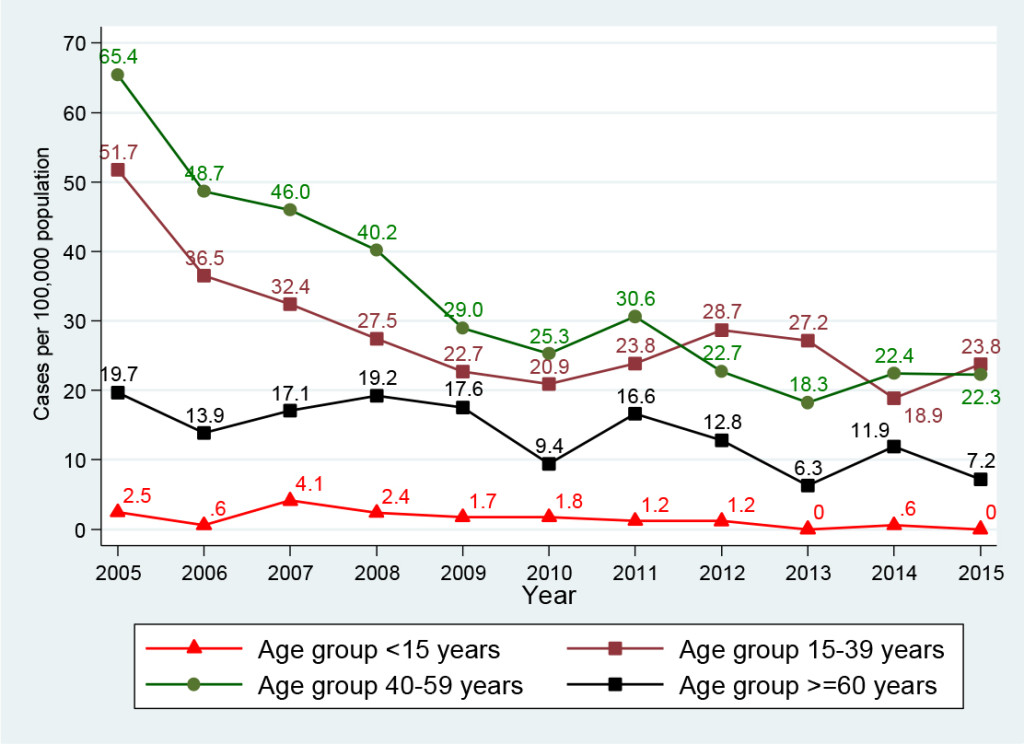
Figure 3. Hepatitis B virus infection by age group, Delaware, 2005-2015
Table 2. Characteristics of patients infected with Hepatitis B virus, Delaware, Period 2005-2015
| Characteristics | Acute HBVInfection(N=232) | Chronic HBVInfection (N=1,887) | Total (N=2,119) | |
| Gender; N (%) | ||||
| Male | 153 (66.0) | 1, 093 (57.9) | 1, 246 (58.8) | |
| Female | 78 (33.6) | 792 (42.0) | 870 (41.1) | |
| Missing/Unknown | 1 (0.4) | 2 (0.1) | 3 (0.1) | |
| Age, N (%) mean: 42.7 years, IQR: 32-52 years old) | ||||
| <15 | 0 | 27 (1.4) | 27 (1.3) | |
| 15-39 | 103 (44.4) | 811 (43.0) | 914 (43.1) | |
| 40-59 | 110 (47.4) | 797 (42.2) | 907 (42.8) | |
| ≥60 | 19 (8.2) | 252 (13.4) | 271 (12.8) | |
| Race/Ethnicity, N (%) | ||||
| White | 101 (43.5) | 459 (24.3) | 560 (26.4) | |
| Black | 94 (40.5) | 609 (32.3) | 703 (33.2) | |
| Asian | 16 (6.9) | 552 (29.3) | 568 (26.8) | |
| Others* | 3 (1.3) | 79 (4.2) | 82 (3.9) | |
| Unknown/Missing | 18 (7.8) | 188 (9.9) | 206 (9.7) | |
| County (N, %) and City** (zip code) | ||||
| New Castle | Wilmington (19801-19810) |
84 (36.2) | 507 (26.9) | 591 (27.9) |
| Smyrna (19977) |
3 (1.2) | 25 (1.3) | 28 (1.3) | |
| Newark (19702, 19711, 19713) |
19 (8.1) | 360 (19.0) | 379 (17.9) | |
| New Castle (19720) |
28 (12.0) | 131 (6.9) | 159 (7.5) | |
| Middletown (19709) |
2 (0.8) | 46 (2.4) | 48 (2.2) | |
| Hockessin (19707) |
1 (0.4) | 51 (2.7) | 52 (2.4) | |
| Claymont (19703) |
6 (2.5) | 58 (3.1) | 63 (3.0) | |
| Bear (19701) |
10 (4.3) | 104 (5.5) | 114 (5.3) | |
| Kent | Dover (19901, 19904) |
13 (5.6) | 139 (7.3) | 152 (7.1) |
| Smyrna (19977) |
4 (1.7) | 51 (2.7) | 55 (2.6) | |
| Sussex | Georgetown (19947) |
6 (2.5) | 38 (2.0) | 44 (2.0) |
| Lewes (19958) |
6 (2.5) | 33 (1.7) | 39 (1.8) | |
| Millsboro (19966) |
3 (1.2) | 27 (1.4) | 30 (1.4) | |
| Rehoboth Beach (19971) |
6 (2.6) | 28 (1.4) | 34 (1.6) | |
| Seaford (19973) |
4 (1.7) | 44 (2.3) | 48 (2.2) | |
*: American Indian/Alaska Native, Pacific Islander, Hispanic, Multiracial
**: Only cities with a number of cases ≥25
Hepatitis B virus infection by race
Of the entire study population (4, 981 persons), white and black population accounted for a larger number of reported persons in comparison with Asian population (38.5% and 34.1% versus 16.0%, Table 1). However, in the group of HBV-infected patients (2, 119 HBV-infected persons, Table 2): the largest infected number was seen in black (33.2%), then Asian (26.8%), and white (26.4%). Particularly, in the acute HBV-infected patients, the largest number of cases was identified in white (43.5%), then black (40.5%, Asian (6.9%), and others (1.3%). In the chronic HBV-infected patients, the largest number was identified in black (32.3%), then Asian (29.3%), white (24.3%), and others (4.2%). Figure 4 presents the HBV infection trend per 100, 000 population by racial/ethnic group from 2005 to 2015: Generally, the decline was seen in all racial/ethnic groups. Asian population had a higher yearly infection rate per 100, 000 population in comparison with other populations: Compared with white, it was 25.1-fold and 31.5-fold higher in 2005 and 2015, respectively; and it was 5.9-fold and 6.4-fold higher in comparison with black in 2005 and 2015, respectively. In addition, Asian population had the lowest decline at 54.7%, from 348.6 (78 cases in 2005) to 157.8 (57 cases in 2015) per 100, 000 population; other race had the highest decline of 89.9%, from 38.8 (12 cases in 2005) to 3.9 (2 cases in 2015) per 100, 000 population; blacks had the second lowest decline of 57.9%, from 58.3 (95 cases in 2005) to 24.5 (50 cases in 2015) per 100, 000 population; and white obtained a decline of 64.0%, from 13.9 (84 cases in 2005) to 5.0 (33 cases in 2015) per 100, 000 population. Interestingly, regardless of a decline in all racial/ethnic groups, Asian group had an increase of 40.0% in the HBV infection rate, from 94.6 (26 cases in 2010) to 157.8 (57 cases in 2015) per 100, 000 population, during a period of 2010-2015.
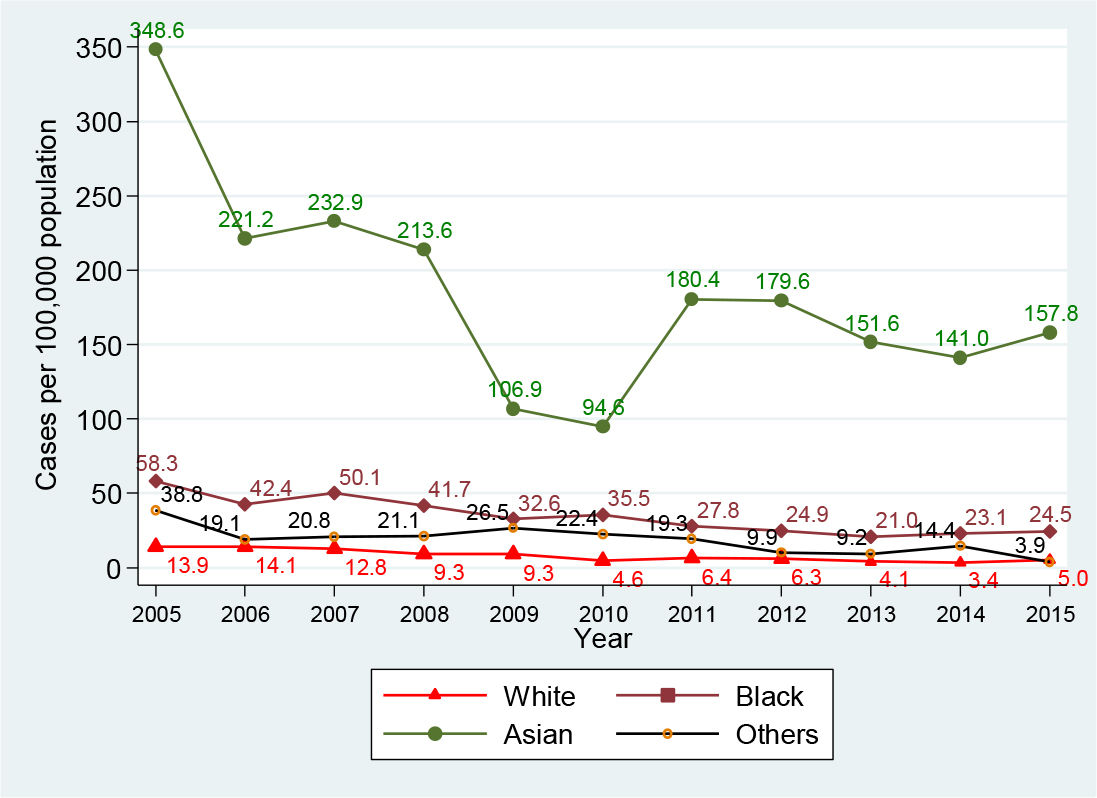
Figure 4. Hepatitis B virus infection by race, Delaware, 2005-2015
Geographical distribution of HBV infection
Delaware state consists of three counties (New Castle, Kent, and Sussex counties), with a total of 56 cities. Table 2 presents characteristics of HBV-infected patients and their geographic distribution. Of the 2, 119 HBV-infected people, 66% (1, 395 cases) were identified in five cities: Wilmington (27.9%, 591 cases), Newark (17.9%, 379 cases), New Castle (7.5%, 159 cases), Dover (7.1%, 152 cases), and Bear (5.3%, 114 cases). Figure 5 presents the trend of HBV infection for these top five cities for the period 2005-2015 versus the remaining 51 other cities combined. The top-ranking city for the number of HBV-infected patients in 2005 was Wilmington, which also achieved the largest reduction of 69.9%, from 93 cases in 2005 to 28 cases in 2015. Newark ranked second in 2005 and during the period 2005-2010, its HBV cases declined 71.4%, from 70 cases in 2005 to 20 cases in 2010; however, between 2010 and 2015, the case count increased 45%, from 20 cases in 2010 to 29 cases in 2015. The City of New Castle ranked third for HBV cases in 2005 and its case count fell 64%, from 25 cases in 2005 to 9 cases in 2015. The City of Dover’s HBV cases declined 26.3% between 2005 (19 cases) and 2006 (14 cases), and then it fluctuated up and down, maintaining around 13-15 cases per year. All other cities combined (51 cities) obtained an overall decline of 53.5%, from 112 cases in 2005 to 46 cases in 2010 and to 52 cases in 2015.
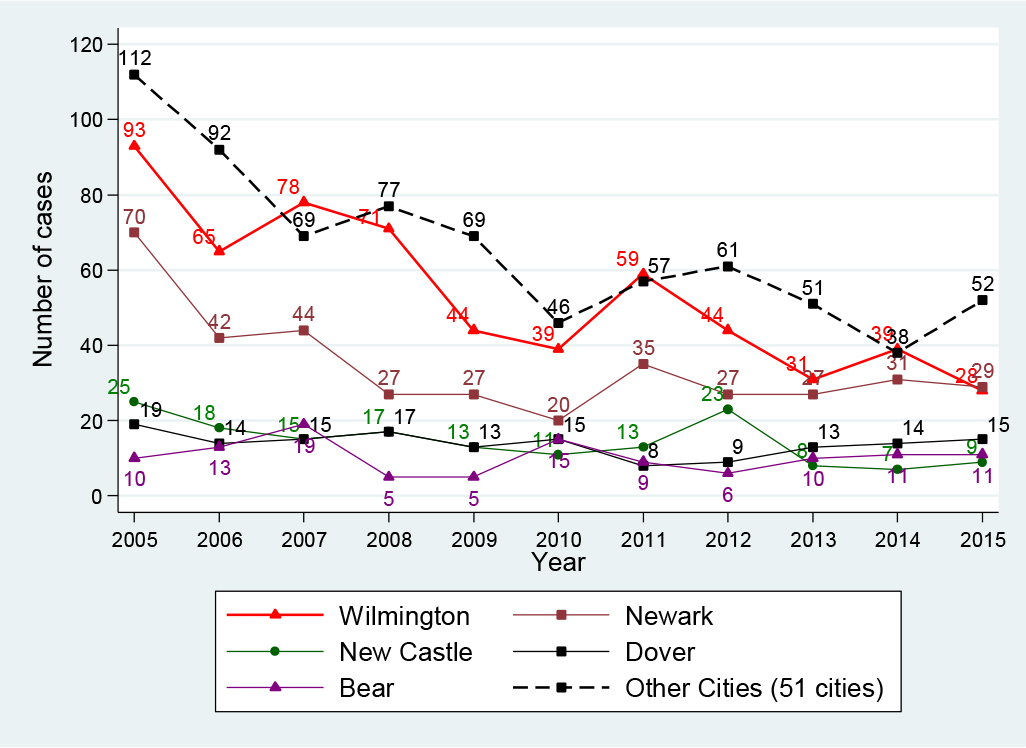
Figure 5. HBV infection in top five and other cities, Delaware, 2005-2015
Factors associated with HBV infection
Potential risk factors associated with HBV infection were examined in univariate and multivariate logistic regression models. These include gender, age, and race. Table 3 shows the selected demographic predictors in the univariate and multivariable logistic regression analyses. Results from the multivariable analysis indicate that males had a greater risk for HBV infection than females [adjusted odds ratio (aOR): 1.6, 95% CI: 1.4-1.8); those 15-39 years and 40-59 years had a greater risk of HBV infection (aOR: 3.7, 95% CI: 2.3-5.9 and 2.4, 95% CI: 1.5-3.8, respectively) than those in the age group less than 15 years. Interestingly, compared with whites, Asians had a 5.8-fold (aOR: 5.8, 95% CI: 4.8-7.0) greater risk of HBV infection; black and other racial groups also had a greater risk, its aOR was 1.7 (95% CI: 1.4-1.9) and 1.4 (95% CI: 1.1-1.9) for black and other racial groups compared with white, respectively.
Table 3. Factors associated with Hepatitis B virus infection
| Predictor | Univariate Odds ratio (95% CI) |
Multivariate Odds ratio (95% CI) |
| Gender | ||
| Female | 1 | 1 |
| Male | 1.3 (1.2-1.5) | 1.6 (1.4-1.8) |
| Age, years | ||
| <15 | 1 | 1 |
| 15-39 | 4.1 (2.6-6.3) | 3.7 (2.3-5.9) |
| 40-59 | 2.4 (1.5-3.6) | 2.4 (1.5-3.8) |
| ≥ 60 | 1.5 (0.9-2.3) | 1.5 (0.9-2.4) |
| Race/Ethnicity | ||
| White | 1 | 1 |
| Black | 1.7 (1.4-1.9) | 1.7 (1.4-1.9) |
| Asian | 6.1 (5.1-7.3) | 5.8 (4.8-7.0) |
| Others | 1.5 (1.1-2.1) | 1.4 (1.1-1.9) |
Discussion
Understanding HBV infection trends and the epidemiologic characteristics of those infected with HBV are key to inform improvements in prevention and control strategies. While there are reliable data about the relationship between HBV vaccination and HBV infection, there are no published data on infection trends and epidemiologic characteristics of persons infected with HBV in Delaware. Over the past 11 years, our data suggest that HBV infection remains a significant public health issue in Delaware. During the period 2005-2015, although Delaware achieved a 62.2% overall reduction in HBV infection, its yearly infection rate exceeded the national rate and rates in many other states, including Maryland, California, New Jersey, New York, and Pennsylvania [9, 12]. The Centers for Disease Control and Prevention reported the yearly national rate of acute HBV infection per 100, 000 population at 1.9 cases for 2005, 1.1 cases for 2010, and around 0.9 cases for the period of 2011-2014 [9]. Delaware’s yearly infection rate for acute HBV infection per 100, 000 population was much higher at 4.2 cases in 2005, 2.8 cases in 2010, 1.4-1.6 cases for the period 2011-2013, and 1.0 case for 2014. In regards to chronic HBV infection, although Delaware achieved a large decline of 62.7%, from 36.0 (in 2005) to 13.4 cases (in 2010), it experienced spikes to 18.5 cases in 2011, 17.1 cases in 2012, then remained at 13.5-14.4 cases per 100, 000 population for the period 2013-2015. With the infection rate of 14.0 cases per 100, 000 population in 2014, Delaware’s infection rate was higher in comparison with the 2014 rates as reported by CDC: Massachusetts, 3.3 cases; Michigan, 4.9 cases; New York, 5.3 cases; the City of Philadelphia, 6.0 cases; and Washington, 1.3 cases, all per 100, 000 population [9].
New HBV infections in the United States are increasingly concentrated among certain populations such as injection drug users, prison inmates, and persons with sexual risk behaviors such as multiple sex partners, sex partners of HBV-infected persons, and men who have sex with men [13]. The spikes in rates of HBV infection we observed may probably be related to a rising trend of heroin use in Delaware [14]: During 2010-2014, we observed a spike in HBV infection that coincided with a spike in the number of people seeking heroin treatment. For example, in 2011, 1, 263 people in Delaware sought heroin treatment; that number accelerated to 1, 845 people in 2012, 2, 750 in 2013, and 3, 182 in 2014 [15].
Hepatitis B vaccination is the most effective measure to prevent HBV infection. In Delaware, the hepatitis B vaccination requirement for children going to public school began in the 1999-2000 school year, and by the 2005-2006 school year, all children from kindergarten to grade 12 must have the hepatitis B vaccine series. Our data showed that almost 90% of the study subjects (4, 981 persons) had no HBV vaccination, and among those infected with HBV (2, 119 persons), almost 94% had no HBV vaccination. Ongoing HBV transmission occurs primarily among unvaccinated persons with high risk behaviors for HBV transmission [16]. Our finding suggests that there is still a large proportion of Delawareans who may not have received the hepatitis B vaccine series.
We found the Asian population not only have a higher yearly infection rate in comparison to all other populations, but they also had the lowest decline in HBV infection: Compared with whites, Asians had a 5.8 fold increased risk for HBV infection; and interestingly, the Asian population had a 40% increase in HBV infection rate during a period of 2010-2015. Our findings are consistent with findings from the CDC and other studies from New York City, San Francisco, and Minnesota that Asians were at higher risk for HBV infection and the majority of chronic HBV infections in the United States were among Asians [9, 16-18].
France et al. reported that more than 93% of chronic HBV cases from January 1, 1999 to December 31, 2008 in New York City were among persons born outside the United States [19]. Recent studies also found that persons born outside of the United States, especially immigrants, had a high prevalence of chronic HBV infection and since they were often unaware of their infection status, were sources of infection [8-10]. Higher rates of HBV infection in Delaware and a recent increase in HBV infection among its Asian population may be attributed to a large number of immigrants. In 2013, Delaware was home to 76, 768 immigrants (8.3% of Delaware’s population); Asians accounted for 33, 639 persons (3.6% of the 2013 Delaware population); and around 34, 625 immigrants were naturalized U.S. citizens in Delaware in 2013. Unauthorized immigrants comprised roughly 20, 000 people (2.4% of the Delaware population) in 2012 [7], a group that may have limited access to health care. A large burden of HBV infection among certain populations suggest a need for the hepatitis B program targeting these populations to identify the infected and link them to care.
Chronic HBV was more common among males than females [20, 21]. We found males had a higher yearly rate of HBV infection, they had a 1.6 fold increased risk for HBV infection compared to females; our finding was consistent with CDC reports and other studies [5, 9, 12]. Interestingly, during the period 2010-2015, we observed an increase of 13.4% in HBV infection among females. The reasons for this increase are unknown, elucidating it would provide important insight into potential trends or behaviors that may affect Delaware’s HBV prevention efforts, such as whether Delaware females have experienced an increase using heroin or practicing risky sexual behaviors. In the United States, most infections occur among adolescents and adults due to sexual and injecting drug use exposures [16]. Adolescents and young adults are the most vulnerable subjects to risky sexual behaviors and injecting drug use. We found the young age group of 15-39 years had the least overall reduction in HBV infection compared with other age groups, and infection increased 12.2% in this age group during 2010-2015. Our finding suggests that more prevention efforts are needed to target this young age group e.g. education on HBV prevention and risky behaviors, screening for HBV, and HBV vaccination.
The geographical distribution of HBV infections provides an important hint in terms of where the HBV prevention efforts should be targeted. Delaware consists of 56 cities, however 66% of HBV-infected persons identified were in five cities: Wilmington, Newark, New Castle, Dover, and Bear. We observed different levels of reduction in these cities. Our finding suggests that there may be benefit to targeting HBV prevention activities in those five cities, especially in Newark, where HBV infection increased 45% in 2010-2015; and Wilmington, where around 60% of the state’s population lives, to reduce Delaware’s HBV infection rate.
Our study has some limitations. First, our study design was a retrospective with information obtained through chart review, we may have missed asymptomatic patients who might not be detected or documented by treating physicians; hence, have underestimated the infection rate. Nonetheless, because HBV infection is a reportable condition in Delaware, it is likely that the database captured the majority of identified HBV-infected cases. Second, our data were from the state surveillance data for hepatitis B virus infection, the study subjects were more likely to have HBV infection. Finally, DERSS is a state passive surveillance system. Although epidemiologists had tried to gather all necessary information on a case during the investigation process, it was obvious that lots of information (e.g. risky health behaviors, immigration status, comorbidities) was not captured in the system, thus, not allowing us the obtain data that definitely identify subsets of local population with higher risk for infection.
Conflict of interest: All authors have no conflict of interest to declare. This work was presented at the 2017 Council of State and Territorial Epidemiologists Annual Conference.
References
- World Health Organization. Hepatitis B: Fact Sheet, updated July 2017. July 2016. Accessed September 20, 2017. http: //www.who.int/mediacentre/factsheets/fs204/en/.
- Centers for Disease Control and Prevention (1991) Hepatitis B virus: a comprehensive strategy for eliminating transmission in the United States through universal childhood vaccination. Recommendations of the Immunization Practices Advisory Committee (ACIP). MMWR Recomm Rep 1991: 1–25.
- Kruszon-Moran D, Paulose-Ram R, Denniston M, McQuillan G (2015) Viral Hepatitis among Non-Hispanic Asian Adults in the United States, 2011-2014. NCHS Data Brief 2015: 1–8. [Crossref]
- Roberts H, Kruszon-Moran D, Ly KN, Hughes E, Iqbal K, et al. (2016) Prevalence of chronic hepatitis B virus (HBV) infection in U.S. households: National Health and Nutrition Examination Survey (NHANES), 1988-2012. Hepatology 63: 388–397.
- Wasley A, Kruszon-Moran D, Kuhnert W, Simard EP, Finelli L, et al. (2010) The prevalence of hepatitis B virus infection in the United States in the era of vaccination. J Infect Dis 202: 192–201.
- Kowdley KV, Wang CC, Welch S, Roberts H, Brosgart CL (2012) Prevalence of chronic hepatitis B among foreign-born persons living in the United States by country of origin. Hepatology 56: 422–433.
- American Immigration Council. New Americans in Delaware: The Political and Economic Power of Immigrants, Latinos, and Asians in the First State. 2015. Accessed January 4, 2017. https: //www.americanimmigrationcouncil.org/research/new-americans-delaware.
- Mitchell T, Armstrong GL, Hu DJ, Wasley A, Painter JA (2011) The increasing burden of imported chronic hepatitis B–United States, 1974–2008. PLoS One 6(12): e27717.
- Centers for Disease Control and Prevention (2016) Viral Hepatitis Surveillance-United States, 2014. Accessed 12/23, 2016. https: //www.cdc.gov/hepatitis/statistics/2014surveillance/index.htm.
- Weinbaum CM, Williams I, Mast EE, Wang SA, Finelli L, et al. (2008) Recommendations for identification and public health management of persons with chronic hepatitis B virus infection. MMWR Recomm Rep 19: 1–20. [Crossref]
- Centers for Disease Control and Prevention (CDC). National Notifiable Diseases Surveillance System (NNDSS). Case Definition. 2016; Accessed 12/17, 2016.https: //wwwn.cdc.gov/nndss/conditions/.
- Centers for Disease Control and Prevention. Viral Hepatitis Surveillance-United States, 2009. Accessed Jan 6, 2017. https://www.cdc.gov/hepatitis/statistics/2009surveillance/index.htm.
- Shepard CW, Simard EP, Finelli L, Fiore AE, Bell BP (2006) Hepatitis B Virus Infection: Epidemiology and Vaccination. Epidemiol Rev 28: 112–125.
- DEA Philadelphia Field Division. The Drug Situation in Delaware. 2016.
- Taylor A (2016) Delaware’s Heroin Crisis-Special report. Accessed March 13, 2017. http://www.delawareonline.com/story/news/local/heroindelaware/2014/06/14/delaware-heroin-problems/10468289/.
- Mast EE, Weinbaum CM, Fiore AE, Alter MJ, Bell BP, et al. (2006) A comprehensive immunization strategy to eliminate transmission of hepatitis B virus infection in the United States: recommendations of the Advisory Committee on Immunization Practices (ACIP) Part II: immunization of adults. MMWR Recomm Rep 8: 1–33.
- Centers for Disease Control and Prevention (CDC) (2012) Surveillance for chronic hepatitis B virus infection – New York City, June 2008-November 2009. MMWR Morb Mortal Wkly Rep 61: 6–9. [Crossref]
- Centers for Disease Control and Prevention (CDC) (2007) Characteristics of persons with chronic hepatitis B–San Francisco, California, 2006. MMWR Morb Mortal Wkly Rep 11: 446–448.
- France AM, Bornschlegel K, Lazaroff J, Kennedy J, Balter S (2012 ) Estimating the prevalence of chronic hepatitis B virus infection–New York City, 2008. J Urban Health 89: 373–383.
- Kim WR (2009) Epidemiology of hepatitis B in the United States. Hepatology 49: S28–34. [Crossref]
- Blumberg BS (2006) The curiosities of hepatitis B virus: prevention, sex ratio, and demography. Proc Am Thorac Soc 3: 14–20. [Crossref]