Abstract
Influencer marketing has become a dominant strategy in the age of social media. Social media influencers (SMIs) affect consumer behavior by sharing experiences and recommendations across platforms, often leading to purchase decisions. The retail industry has embraced this practice as a primary marketing tool, with SMIs leveraging paid activations or personal experiences to create a sense of need among followers. While much research has focused on SMIs in the fashion industry, this study contributes by turning attention to the cosmetic and beauty sector and by examining the often-overlooked negative consequences of influencer marketing. Specifically, it explores overconsumption, distorted brand perception, and adverse consumer psychology. Drawing on a comprehensive literature review and a survey of Gen-Z consumers, this study investigates the relationship between influencer marketing in cosmetics and its detrimental outcomes.
Keywords
Influencer marketing, Social media influencers, Cosmetic and beauty sector, Social identity, Overconsumption
Introduction
In the age of rampant social media use in daily life, with 4.41 billion projected users by 2025, a category of social media users classified as ‘social media influencers’ (SMIs) or ‘opinion leaders’ has become a constant across various social media platforms [1]. These influencers are defined as “experts or social connectors influencing other people’s attitude regarding products and brands” [2]. Influencers garner audiences that share their interests and opinions on platforms such as Instagram, TikTok, Facebook, and other social media platforms. Brands have taken note of the unique ability that SMIs possess to connect with their audiences by building a personal brand and authenticity on their platform [3]. Whether focused on fashion, fitness, health, or niche topics, SMIs attract audiences ranging from hundreds to hundreds of thousands of followers who value their opinions. Brands that tap into these individuals’ skills engage in the practice of influencer marketing. This strategy, adopted by brands, represents a relatively new branch of marketing. The influencer marketing channel, which pays opinion leaders (SMIs) to post and promote products in order to increase sales, has become prevalent with every brand that has a social media presence. The success of the strategy in the digital climate is undeniable, in that it is estimated that “spending on influencer campaigns has increased dramatically, with a global spend of $16.4 billion in 2022” [4]. With constant exposure to advertisements and brand messaging, consumers often look to these opinion leaders to determine what they need and should buy [5]. This, in turn, drives consumer buying intention and consumption patterns, as well as impacts their perception of brands [6]. No industry is necessarily excluded from this marketing practice, which has led to the prominence and success of influencer marketing.
One industry that significantly benefits from this practice is the cosmetic industry. Already valued at nearly 500 billion dollars globally, the cosmetic market continues to grow as consumer interest increases, in large part due to social media trends and influencers. The cosmetic industry has always had a space in media, particularly in movies and magazines. In the current age of social media, makeup and beauty trends continuously shape and evolve the industry, with makeup artists and influencers, as well as lifestyle influencers, sharing their everyday products. Younger generations, who are key consumers of social media, form the primary target demographic for the influencer marketing of cosmetic products [7]. This study explores the heavily social media dependent college-age population and their consumer habits, while factoring in the consideration of the cohort having little disposable income.
At its core, the role of influencers is to create desire by encouraging consumers to want to look like them, share their lifestyle, or fit in with their community. Brands rely on this persuasive power, paying influencers to place products directly in front of target audiences. Yet this raises important questions: Have brands lost their own voice when it comes to speaking to their consumers? Have they relied on influencers so much that they are no longer going to be able to reach consumers on their own? This study seeks to address these questions by exploring how influencer marketing in cosmetics affects consumer habits, particularly overconsumption and its psychological and environmental impacts. It considers whether consumers purchase products they neither need nor like, simply because an influencer recommended them. The waste involved in production, packaging, shipping, and spending are all underrepresented consequences of this practice.
Theoretical Framework
This study examines social media marketing within the cosmetic industry, specifically focusing on overconsumption, psychological/environmental impacts, and distortion of brand perception. To address these issues, a theoretical framework grounded in consumer psychology and behavior is applied. The central theory guiding this research is the media dependency theory. Media Dependency Theory Media dependency theory contributes significantly to this study’s framework by demonstrating “a dependency relationship between digital influencers and their followers”. The theory explains how influencers cultivate trust and credibility, which fosters a perceived relationship with their followers. This relational dynamic is a key driver of influencer marketing’s effectiveness as a strategy. Brands recognize that individuals can establish more authentic connections with consumers than organizations can, and therefore utilize influencers in promoting and selling their products. In the context of cosmetics, Kurshid et al. [8] emphasized that influencers are “key sources of product-related information for consumers, particularly in the beauty industry.” The characteristics that set influencers apart from other social media users further support this dependency. Influencers foster relationships through their authentic appearance, voices, and opinions. Their success depends on qualities such as relatability, expertise, entertainment, and attractiveness, which resonate with their follower base.
Social media users consciously or subconsciously seek these characteristics when choosing who to follow, and their presence often correlates with the effectiveness of influencer promotions. These qualities attract attention, build followings, and facilitate interactions that form the foundation of trust and influence. Prior research has shown that consumers often make purchase decisions based on the opinions—or by actively seeking the opinions—of influencers they follow [9]. As these relationships develop, users may increasingly depend on influencers’ recommendations, preferences, and lifestyles to guide their own decisions. This study applies media dependency theory to better understand how influencers persuade followers to purchase products they may not want, need, or use, as an outcome of this dependency. Examining how influencer characteristics build followings, foster relationships, and encourage consumer action helps explain the potential negative consequences of such dependency, including overconsumption and its associated environmental impacts. Furthermore, the theory aids in exploring how an influencer’s role in shaping consumer choices can sometimes overshadow or even replace a brand’s ability to connect directly with consumers.
Literature Review
Social Media Influencers (SMIs)
Over the past 20 years, the presence and popularity of social media have rapidly increased. What began as platforms for sharing photos and thoughts, along with likes and comments, has evolved into live streaming, short-form video content, stories, saved posts, and more. With this evolution of content came the rise of social media celebrities, commonly known as social media influencers (SMIs). These individuals are defined as those who lead, influence, and inspire followers on social media platforms through their online presence and opinions [10]. Their influence spans many domains: beauty, fashion, do-ityourself projects, cars, watches, sports, and more, as they share skills, styles, and interests that attract likes, comments, and followers.
Recognizing the persuasive power of these individuals, brands have increasingly partnered with influencers to advertise and endorse products. By leveraging their credibility and authenticity, influencers build trust and foster genuine communication with followers [11]. Influencer marketing is defined as a sub branch of digital marketing, where famous key individuals who are believed to have a master-level understanding try to influence the buyer to purchase a certain brand of product or service, including product placement and endorsements via social influence. The relationship between influencers and consumer behavior is well established, as influencer marketing consistently drives buying decisions. Consumers now use social media not only as a platform for connection but also as a search engine and recommendation tool, relying on influencers for both advice and product discovery. This constant exposure to promotional content often drives consumers to purchase beyond their actual needs, as influencers rapidly shape trends that reach thousands to millions of people [12].
The cosmetic sector is particularly reliant on influencer content. Product demonstration is often essential in cosmetics, making social media platforms ideal for showing how products work and look. With more than 90% of cosmetic brands maintaining a strong presence on social media, the industry is highly saturated, and visibility is vital. Social media also serves as a review hub, search engine, and trend reporter, especially for younger consumers. Brands showcase their identity through imagery, copy, and interaction with followers, while influencers lend authenticity and credibility by giving these brands a personal voice.
Motivations for Following and Characteristics of SMIs
For influencers to impact consumer purchases, they must first attract followers and encourage interaction. Motivations for following vary but often include inspiration, relatability, attractiveness, and credibility. These qualities are central to the effectiveness of influencers, as influencers who display honesty, integrity, and sincerity, along with trustworthiness and ethics, are perceived as more believable. When influencers successfully convey these characteristics, they are more likely to build trust, increase engagement, and ultimately influence purchasing decisions. Indicators of success such as follower counts, likes, comments, shares, and overall reach are carefully monitored by both audiences and brands. These metrics serve as signals of credibility and play a significant role in determining whether brands choose to collaborate with influencers to promote products. The integration of influencers into retail marketing is substantial. For every dollar invested in influencer marketing, brands generate more than six dollars in revenue, with some reporting over twenty dollars per dollar spent. This level of return demonstrates how influencer marketing has reshaped retail strategies and developed into a multi-billion dollar industry. By amplifying brand reach through multiple voices, influencer marketing extends communication beyond official brand accounts and allows messages to be tailored to diverse audiences. This strategy has become a powerful driver of consumer purchase decisions and can help build brand loyalty through the trust followers place in influencers.
Negative Impacts of Influencer Marketing in Cosmetics
Although research on influencer marketing, particularly in the fashion sector, is extensive, most studies emphasize positive aspects of consumer psychology, such as uses and gratifications, social identity, or purchase intention, rather than the tangible negative outcomes. This study seeks to address three critical areas that remain underexplored in the cosmetic sector: overconsumption, psychological and environmental impacts, and distortion of brand perception. Heavy reliance on social media for product discovery often leads to overdependence or even addictive behaviors, which result in overconsumption. Consumers frequently purchase products they do not need simply because influencers recommend them. Such behavior contributes to significant waste in production, packaging, and distribution, ultimately creating serious environmental consequences. While research on fast fashion has highlighted similar concerns, their relevance in the cosmetic industry remains insufficiently examined. Furthermore, constant exposure to influencer-driven promotions can blur the distinction between a brand’s voice and an influencer’s voice. When consumers cannot clearly separate the two, brand identity risks distortion. In some cases, reliance on influencer partnerships may even alienate loyal customers. These psychological effects on brand perception are as critical as the material consequences of overconsumption and waste.
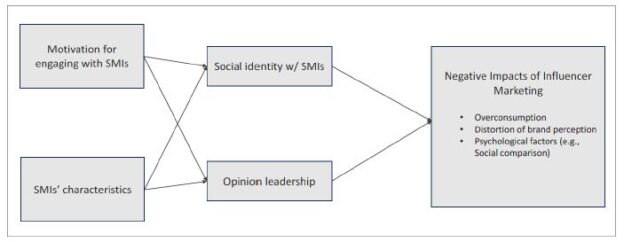
Based on the theoretical framework and relevant literature reviewed, the following conceptual model is proposed (see Figure 1).
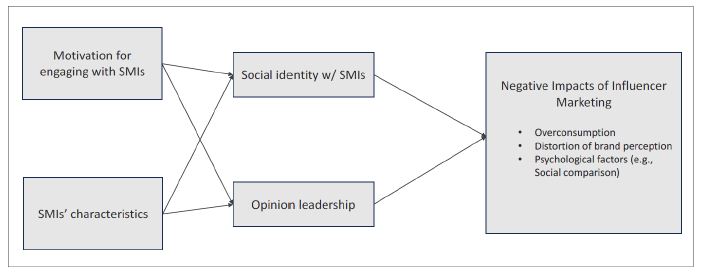
Figure 1: Conceptual model
Method
An online survey was created to gather robust data surrounding consumer habits regarding interaction with social media influencers. The survey employed a convenience sample drawn from a major research-intensive university located in the southeastern region of the United States. The survey was created using Qualtrics XM software and distributed to participants via an email invitation containing the survey link. On average, students required approximately 10 to 15 minutes to complete it. Prior to data collection, the survey received approval from the university’s Institutional Review Board (IRB). This study focused exclusively on college-age social media users who follow influencers promoting beauty and cosmetic products. This demographic was selected because “Gen Z has a dependence on technology for seeking out information about goods and services before making a purchase decision, and they have a strong reliance on e-word-of-mouth (WOM) advertising”. To ensure eligibility, participants were first asked if they use social media, which platforms they use, and whether they follow beauty and cosmetic influencers. Only those who indicated “yes” to all three questions qualified to continue. Clarifying questions were then used to confirm that the influencers they follow promote beauty and cosmetic products within their content. Participants who did not meet these criteria were excluded from the study.
Instruments
Nine key constructs were assessed using established scales from prior research. Unless otherwise noted, all items were measured on a 7-point Likert scale (1 = strongly disagree, 7 = strongly agree). Along with the primary constructs proposed in the conceptual model, this study also measured several external variables to provide additional insight into college-age students’ social media habits, such as purchase loyalty, purchase intention, and social comparison. Before examining motivations for following influencers, the study measured participants’ general social media usage using a scale developed by Hagerborn et al. [13]. To understand what qualities resonate most with users when deciding to follow and engage with influencers, scales from Croes and Bartels and Zhang et al. [14] were employed. These measures included characteristics such as trends, followers, attractiveness, relatability, and entertainment value. Participants selected the characteristics that best reflected their experiences.
Social identification with social media beauty and cosmetic influencers was measured using a three-item scale adapted from Leach et al.. Participants indicated the extent to which they felt psychologically connected and aligned with the influencers. Opinion leadership was also assessed to capture the role influencers play in shaping followers’ attitudes and decisions. Scales were adapted from Gentina et al. and Thakur et al. Participants indicated how effectively influencers interacted and engaged with their audiences while promoting beauty and cosmetic products. To maintain focus, they were asked to name a specific influencer to keep in mind when responding. Consumption habits were measured using the consumption desire scale by Patwardhan et al. [15]. Participants reflected on whether their perceived need or pressure to buy products increased with greater exposure to influencers, and whether they had overspent or purchased beyond their needs. This measure provided insight into how influencer-driven marketing contributes to excessive consumption. Distortion of brand perception was measured using items adapted from existing parasocial interaction/relationship (PSI/PSR) and influencer characteristic scales, modified to fit the cosmetic and influencer context.
Buying behavior and purchase intention were examined through several validated scales. Participants were first asked how many beauty and cosmetic products recommended by the named influencer they had purchased in the past 12 months. A purchase intention scale by Ki and Kim [16], along with items adapted from Fakhreddin and Foroudi and Kay et al. [17], measured likelihood of future purchases. Buying behavior was further assessed using scales from Ki and Kim, Croes and Bartels, and Kay et al. Purchase loyalty was measured using a scale adapted from Pereira et al. and Walsh et al., as cited in Fakhreddin and Foroudi. This construct examined participants’ allegiance to influencers and the products they endorse. Product knowledge was measured using a scale by Kay et al. which assessed participants’ interest, confidence, and expertise with beauty and cosmetic products, providing insight into how easily they might be persuaded by influencer recommendations. Finally, social comparison was measured using the online social comparison scale developed by Gibbons and Buunk, Steers et al., Reer et al., and Latif et al., as cited in Tandon et al. [18]. Participants indicated their experiences of comparing themselves to others in terms of appearance and possessions. This measure contextualized consumer buying behavior within the cosmetic sector.
Results
Participants
A total of 237 students participated in the survey; after removing incomplete responses, 157 usable samples remained (66.2%). All participants were between 18 and 22 years old, with 96.2% identifying as female. The majority identified as White American (82.8%), followed by African American (7.8%). By class standing, seniors represented the largest group (33.1%). Reported annual household income varied, with 30.6% indicating $150,000 or more and 25.5% reporting $100,000–$149,999 (see Table 1).
Table 1: Demographic profile
|
Demographic Variable |
Category | Frequency | Valid Percent |
Cummulative Percent |
| Gender | Male |
6 |
3.8% |
3.8% |
| Female |
151 |
96.2% |
100.0% |
|
| Total |
157 |
100.0% |
||
| Age | 18-21 |
123 |
78.3% |
78.3% |
| 22-25 |
31 |
19.7% |
98.1% |
|
| 26-41 |
3 |
1.9% |
100.0% |
|
| Academic class standing | Freshman |
18 |
11.5% |
11.5% |
| Sophomore |
40 |
25.5% |
36.9% |
|
| Junior |
38 |
24.2% |
61.1% |
|
| Senior |
52 |
33.1% |
94.3% |
|
| Graduate |
9 |
5.7% |
100.0% |
|
| Ethnicity | White American |
130 |
82.8% |
82.8% |
| Black or African American |
12 |
7.6% |
90.4% |
|
| Hispanic or Latino |
5 |
3.2% |
93.6% |
|
| Asian |
4 |
2.5% |
96.2% |
|
| Other |
6 |
3.8% |
100.0% |
|
| Annual Household income | Under $25000 |
27 |
17.2% |
17.2% |
| $25,000-$50,000 |
11 |
7.0% |
24.2% |
|
| $50,001-$75,000 |
13 |
8.3% |
32.5% |
|
| $75,001-$99,999 |
18 |
11.5% |
43.9% |
|
| $1,00,000-$1,49,999 |
40 |
25.5% |
69.4% |
|
| $1,50,000 and Over |
48 |
30.6% |
100.0% |
Social Media Usage and Influencers Followed
Survey participants shared their social media habits to reflect their exposure to various platforms and interactions with influencers. A majority (63.1%) reported spending between one and three hours per day on social media. TikTok emerged as the most commonly used platform for following influencers (84.4%), followed by Instagram (66.9 %). In terms of purchasing behavior, 65.6% indicated that they had purchased between one and five cosmetic or beauty products in the past year as a result of influencer recommendations. Participants also identified the influencers they followed most closely in the context of beauty and cosmetic promotion. Alix Earle was the most frequently mentioned, cited by 25% of participants, followed by Bridget Pheloung (Acquired Style) and Emilie Kieser. The responses included both traditional lifestyle influencers and professional makeup artists, highlighting the diversity of influencer types within the cosmetics space.
Reasons for following and Motivations for Engaging with SMIs
Participants identified the characteristics most important when choosing to follow influencers (see Table 2). Entertainment value ranked highest (71.3%), followed by relatability and authenticity, each selected by more than half of respondents. Mean score analysis revealed the strongest motivations for engaging with beauty influencers were information seeking (M = 6.02), content style and aesthetics (M = 5.75), and relaxing entertainment (M = 5.37). Among influencer attributes, trust (M = 5.83), expertise (M = 5.56), and interactivity (M = 5.06) were ranked most important, while attractiveness and popularity were considered less influential.
Table 2: Reasons for Following SMIs
|
Rank |
Reason | Frequency |
Percentage |
|
1 |
Entertainment |
114 |
71.3% |
|
2 |
Relatability |
102 |
63.7% |
|
3 |
Authenticity |
89 |
55.6% |
|
4 |
Creative Inspiration |
87 |
54.4% |
|
5 |
Humor |
61 |
38.1% |
|
6 |
Credibility |
61 |
38.1% |
|
7 |
Expertise |
55 |
34.4% |
|
8 |
Attractiveness |
51 |
31.9% |
|
9 |
Conumerism |
23 |
14.4% |
|
10 |
Number of Followers |
13 |
8.1% |
|
11 |
Other |
3 |
1.9% |
|
12 |
Congruency |
0 |
0.0% |
Relationships Among Variables
Correlation and regression analyses were conducted to examine the proposed model (Tables 3 and 4). A principal components extraction with Varimax rotation was first conducted to identify the underlying factor structure. Factors with eigenvalues greater than 1.0 were retained. After removing three cross-loading items, the retained factors explained 74.5% of the variance. Scale reliability was confirmed with Cronbach’s alpha values ranging from .71 to .96, exceeding the .70 threshold (Nunnally & Bernstein, 1994). Harman’s single-factor test (Mayr & Teller, 2024) showed that a single factor accounted for 25% of the variance, below the 50% threshold, indicating that common method bias was not a major concern. Most variables were significantly correlated at the .05 level or below. Regression analyses further indicated that both social identity and opinion leadership had positive effects on overconsumption (β = .22, t = 3.01, p < .01; β = .38, t = 5.09, p < .001, respectively), distortion of brand perception (β = .15, t = 2.33, p < .05; β = .58, t = 8.88, p < .001, respectively), and social comparison (β = .26, t = 3.41, p < .001; β = .24, t = 3.15, p < .01, respectively).
Table 3: Correlations
|
1 |
2 | 3 | 4 | 5 | 6 | 7 | 8 | 9 | 10 |
11 |
|
| Social identity |
.395** |
.631** | .490** | .277** | .022 | .168* | .325** | .249** | .270** | .171* |
.324** |
| Opinion leadership |
.316** |
.316** | .349** | .231** | .347** | .333** | .409** | .289** | .540** | .615** |
.386** |
| Purchase intent |
.278** |
.276** | .261** | .147 | .303** | .199* | .285** | .319** | .469** | .462** |
.373** |
| Brand loyalty |
.271** |
.236** | .238** | .189* | .275** | .111 | .261** | .255** | .433** | .390** |
.414** |
| Distortion of brand perception |
.243** |
.332** | .280** | .114 | .315** | .423** | .303** | .107 | .476** | .524** |
.279** |
| Overconsumption |
.339** |
.352** | .327** | .351** | .174* | .161* | .296** | .476** | .225** | .197* |
.246** |
| Social comparison |
.133 |
.345** | .238** | .115 | .096 | .168* | .162* | .171* | .213** | .160* |
.182* |
Note: 1=cool; new Trend; 2=Companionship; 3=Relaxing entertainment; 4=Boredom; 5=Information seeking; 6=Content 7=Attractiveness;8=Popularity; 9=Expertise; 10=Trust; 11=Interactivity *p < .05, **p < .01
Table 4: Regression Results
|
IVs |
Social identity | Opinion leader | ||||||||
| β | t | p | β | t |
p |
|||||
| Motivations | ||||||||||
| Companionship |
.53 |
7 .30 | <.001 | .20 | 2.80 |
.006 |
||||
| Relaxation |
.32 |
4.42 | <.001 | .40 | 4.86 |
<.001 |
||||
| Information seeking |
.22 |
2.86 |
.005 |
|||||||
| Content |
.19 |
2.38 |
.018 |
|||||||
| F-value p
Adjust R2 |
24.6 <.001 .47 |
9.61 <.001 .25 |
||||||||
| SMI Characteristics
Attractiveness |
.21 |
2.64 | .009 | .20 | 3.18 |
.002 |
||||
| Popularity |
.17 |
2.75 |
.007 |
|||||||
| Expertise |
.20 |
2.78 |
.006 |
|||||||
| Trust Interactivity | .27 | 3.23 | .002 | .43 | 5.73 |
<.001 |
||||
| F-value p
Adjust R2 |
8.44 <.001 .19 |
33.19 <.001 .51 |
||||||||
Discussion of Findings
This study explored how social media influencer marketing impacts consumer behavior and psychology in the cosmetic sector. The analysis focused on the relationship between exposure to and interaction with influencers, overconsumption of products, and distorted brand perceptions.
The results identified key motivations for following influencers—entertainment, relatability, and authenticity—highlighting that genuine and transparent content is highly valued. For cosmetic and beauty products, influencers perceived as authentic, relatable, and entertaining resonate most strongly with followers. In terms of characteristics, trust, expertise, and interactivity emerged as most influential. Trust was ranked the highest, reflecting consumers’ need to feel confident in recommendations. This trust directly influenced willingness to purchase and contributed to unnecessary buying, linking influencer credibility to overconsumption. Expertise was the second most valued trait, as followers viewed influencer knowledge and skill as signals of product quality, further driving purchase decisions. Interactivity ranked third, enhancing followers’ sense of connection and belonging through comments, live videos, giveaways, and other engagement strategies. These findings demonstrate how trust, expertise, and interactivity together create a strong psychological bond between influencers and their followers.
Overconsumption—the purchase of products beyond need—was a central outcome of this study. Popularity, boredom, and companionship were all highly correlated with overconsumption. Popularity heightened perceptions of product necessity, as consumers sought belonging or alignment with trends. Notably, 89.3% of survey participants reported purchasing a product based on an influencer’s recommendation, with approximately 140 respondents acknowledging such purchases. These behaviors carry implications for product waste, packaging, shipping, and environmental impact when items are bought unnecessarily and discarded. Companionship, the feeling of belonging to an influencer’s community, also contributed to overconsumption by reinforcing a sense of shared identity. Trust and expertise further lowered skepticism toward recommendations, while interactivity amplified exposure to product promotions, strengthening feelings of need. Together, these patterns reveal how influencers can exploit psychological drivers to encourage excessive purchasing.
Distorted brand perception was another key outcome. Trust and expertise strongly correlated with how consumers perceived brands, as influencers’ credibility reduced skepticism and hesitation toward promoted products. Interactivity also shaped brand perception by fostering loyalty through ongoing engagement, which made brands appear more personable and accessible. However, this reliance on influencers meant that trust was often placed in the influencer rather than the brand, blurring the line between the two. Motivations such as content and companionship further influenced brand perception. Content—defined by style, format, and consistency—had the strongest correlation, showing how influencer presentation directly shaped consumer views of brands. Companionship reinforced this effect by creating a sense of friendship and belonging. These findings suggest that when influencers represent brands, they can overshadow brand identity and compromise the direct relationship between brands and consumers.
Finally, the study highlighted broader psychological implications. Attractiveness and popularity were strongly associated with opinion leadership, suggesting that physical appeal, visibility, and follower count significantly enhance an influencer’s ability to shape consumer opinions in the beauty and cosmetics domain. In addition, companionship and relaxation emerged as key motivations for social identification. These findings indicate that perceived interpersonal closeness, such as feeling that influencers are friends or conversational partners, along with psychological relief through enjoyment, stress reduction, or temporary escape, play meaningful roles in fostering users’ identification with influencers. Furthermore, both social identity and opinion leadership were found to positively influence overconsumption, distorted brand perception, and social comparison. Collectively, these results underscore the psychological mechanisms—trust, expertise, interactivity, attractiveness, popularity, and companionship—that make influencer marketing both highly persuasive and potentially problematic.
Implications
Theoretical Implications
The findings of this study align closely with existing literature and extend theoretical perspectives on consumer behavior in social media contexts. Specifically, they support the concept of trend-based consumerism, brand perception theories, and social comparison processes. Denton emphasized the role of influencer-driven social media trends in stimulating consumption, particularly among younger consumers. While Denton’s study focused on apparel, the current research demonstrates a similar pattern in the cosmetics sector, with popularity characteristics strongly correlated with overconsumption. Brand perception theories are also reinforced. Fitriati et al. argued that influencer recommendations shape consumer expectations of product value, a finding consistent with this study’s results showing that interactivity and dependency on influencers influence brand perceptions. Similarly, Bentley et al. emphasized consumers’ direct psychological relationships with brands, an avenue that complements but differs from the present study’s focus on influencer-driven brand associations. Croes and Bartels highlighted the role of social identification and motivations for social media use, shaping how this study measured motivations for following influencers. Adapting their scale produced results consistent with prior findings.
Together, these findings provide strong theoretical support for media dependency theory. The study shows that college-aged consumers rely heavily on influencers for product information and purchase decisions, with information seeking emerging as the strongest motivation. This dependency not only validates the central premise of media dependency theory but also reveals its potential negative outcomes, such as overconsumption and distorted brand perceptions. The psychological drivers of this dependency—such as the need to belong and feelings of companionship—further extend the theory by highlighting how relational ties with influencers contribute to excessive consumption. Importantly, these implications extend beyond cosmetics, offering insight into how reliance on influencers can shape consumer decision-making, brand communication, and purchasing behaviors across industries.
Practical Implications
This study provides several practical implications for brands, influencers, and consumers. For brands, the findings suggest that working with influencers perceived as trusted and knowledgeable is crucial, as these traits are strongly associated with purchase intention and brand perception. High interactivity is also valuable, as greater engagement increases exposure to both influencer content and brand products. However, the study also highlights risks: brand perception can become distorted when closely tied to influencers. The line between actual need and perceived need often blurs in influencer interactions, and consumers who later view their purchases as wasteful may associate this negatively with the brand. While profit remains central, brands will need to address the pressures of overconsumption created by influencer marketing and prioritize direct communication and authentic engagement with consumers. Loyalty and trust can coexist with influencer partnerships, but only if carefully managed.
For influencers, the study underscores the importance of managing relationships with followers ethically and transparently. Trust and expertise are powerful drivers of success but can also contribute to dependency, comparison, and waste. Like brands, influencers may prioritize personal gain in partnerships, which can compromise ethical decision-making. Transparency, as required by FTC regulations, builds trust among followers. Communicating when a recommendation is unaffiliated with a brand can further enhance authenticity. Additionally, being selective about brand partnerships strengthens credibility, whereas promoting products solely for financial gain undermines trust and perceived expertise.
Finally, consumers also benefit from these findings. As social media becomes increasingly embedded in daily life, particularly among Gen Z women, awareness of influencer practices is essential. This study highlights the manipulative nature of influencer marketing, where popularity and psychological drivers—such as the need to belong or relieve boredom— are often used to stimulate purchases. By recognizing these tactics, consumers can better distinguish between actual needs and perceived needs created by influencer messaging. Awareness of how repeated exposure intensifies feelings of need may also help reduce unnecessary purchases. Although challenging in the highly engaging environment of social media, developing this awareness can support more intentional and restrained consumption [19-21].
Conclusion and Future Research
This study examined the negative impacts of influencer marketing in the cosmetic sector, focusing on Generation Z college-aged women who are highly active on platforms such as TikTok and Instagram. The findings confirm that influencers hold significant power in shaping purchase decisions and brand perceptions. This research also contributes to existing knowledge by shifting the conversation on overconsumption from the fast-fashion industry to the cosmetic sector, where influencer marketing similarly drives trend-based cycles and waste. While influencer partnerships are effective in expanding reach, they risk weakening brands’ direct connection with consumers. These insights underscore the importance of balancing influencer strategies with efforts to preserve authentic brand-consumer relationships, laying the groundwork for future research on the long-term consequences of these dynamics. The study also identifies several avenues for future research. Given the breadth of variables examined, further investigation is needed into specific outcomes such as short-term versus long-term brand loyalty, sustained effects on brand perception, and the measurable environmental impact of overconsumption. Future research could explore issues such as shipping, packaging, and product waste to better assess the broader ecological footprint of influencer marketing. As this practice continues to expand, the availability of longitudinal data will offer additional opportunities to examine its implications for both brands and consumers.
References
- Vaghela K, Damle M, Hamza MS, Oudah AY (2023) Impact of social media influencers on brand promotion. AIP Conference Proceedings.
- Fakhreddin F, Foroudi P (2021) Instagram influencers: The role of opinion leadership in consumers’ purchase behavior. Journal of Promotion Management 28: 795-825.
- Croes E, Bartels J (2021) Young adults’ motivations for following social influencers and their relationship to identification and buying behavior. Computers in Human Behavior 124: 106910.
- Bentley K, Rajagopal P, Kulow K (2024) Unfaithful brands: How brand attachment can lead to negative responses to influencer marketing campaigns. Journal of Consumer Psychology 343: 456-472.
- Hassan SH, Teo SZ, Ramayah T, Al-Kumaim NH (2021) The credibility of social media beauty gurus in young millennials’ cosmetic product choice. PLOS ONE 16: e0249286
- Fitriati R, Siwi ISM, Munawaroh, Rudiyanto (2023) Mega-influencers as online opinion leaders: Establishing cosmetic brand engagement on social media. Journal of Promotion Management 29: 359-382.
- Williams DE, Pochipinski B, MacDonald M, Caulfield J (2023) The depiction of beauty-by-beauty influencers on Instagram and generations Z’s perception of them. Journal of Promotion Management 30: 473-512.
- Khurshid S, Ayoub DA, Kortam W (2024) The impact of influencer marketing on consumers’ intentions toward beauty brands after the COVID-19 pandemic. Arab Journal of Administration 44: 1-10.
- Lee JE, Watkins B (2016) YouTube vloggers’ influence on consumer luxury brand perceptions and intentions. Journal of Business Research 69: 12
- Geng R, Chen X, Wang S (2023) Wear in or wear out: How consumers respond to repetitive influencer marketing. Internet Research 34: 810-848.
- Silva MJdB, Farias SAd, Silva CJ (2023) Endorsement on Instagram and cultural dimensions: An analysis of digital influencers. The Bottom Line 36: 1-28.
- Denton A (2023) The cost of looking good: How fashion and trend-based consumerism impact the economy, law, and environment. Indiana Journal of Global Legal Studies 30: 2
- Hagerborn C, Ivarsson I, Linde S (2024) Trending towards overconsumption: The role of social media in shaping Swedish Gen Z’s buying patterns. Bachelor’s thesis, Jönköping University, Jönköping International Business School. DiVA
- Zhang S, Huang C, Li X, Ren A (2022) Characteristics and roles of streamers in ecommerce live streaming. The Service Industries Journal 42: 1001-1029
- Patwardhan V, Mallya J, Kaliappan S, Kumar D (2024) Influence of social media on young adults’ food consumption behavior: Scale development. Cogent Social Sciences 10: 2391016.
- Ki CW, Kim YK (2023) The mechanism by which social media influencers persuade consumers: The role of consumers’ desire to mimic. Psychology & Marketing 40: 24- 46.
- Kay S, Mulcahy R, Parkinson J (2020) What is less is more: The impact of macro and micro social media influencers’ disclosure. Journal of Marketing Management 36: 248-278.
- Tandon A, Dhir A, Talwar S, Kaur P, Mäntymäki M (2021) Dark consequences of social media-induced fear of missing out (FoMO): Social media stalking, comparisons, and fatigue. Technological Forecasting & Social Change 169: 120834.
- ElSayad G (2024) Beyond likes, comments, and shares: How can influencer marketing drive customer equity and purchase intention? Journal of Promotion Management 30: 1087-1112.
- Faust NT, Hong Y, Gains N, Christopoulos GI (2024) The effect of implicit theories of human beauty and perceived pressure on cosmetic consumption. Psychology of Aesthetics 18: 43-58.
- Isyanto P, Gita Sapitri R, Sinaga O (2019) Micro influencers marketing and brand image to purchase intention of cosmetic products Focallure. Systematic Reviews in Pharmacy 11: 601-605.