Author Archives: author

Self-Derivation through Memory Integration: A Unique Predictor of Semantic Knowledge in Children

DOI: 10.31038/PSYJ.2026812

Abstract

Developing a storehouse of semantic or world knowledge is an important developmental achievement. In addition to direct learning such as through books and lectures, semantic knowledge accumulates through so-called productive processes, which permit going beyond the given to generate new knowledge. In the present research, we tested whether the specific productive process of self-derivation through memory integration makes unique contributions to semantic knowledge, even when other known or hypothesized correlates of knowledge (i.e., verbal and visual abilities) are considered. One-hundred-forty- eight 8-12-year-old children participated in two waves of testing, one year apart. At Wave 1, latent constructs of self-derivation and fact recall and verbal and visual abilities each predicted unique and overlapping variance in the latent construct, knowledge; total variance in knowledge accounted for R2 = .56. At Wave 2, verbal and visual abilities predicted unique variance in knowledge, and self-derivation and fact recall contributed to additional shared variance; total variance in knowledge accounted for R2 = .70. Longitudinally, both self-derivation and fact recall and verbal and visual abilities from Wave 1 predicted unique and overlapping variance in the latent construct, knowledge at Wave 2; total variance in knowledge accounted for R2 = .63. The work establishes self-derivation through memory integration as a mechanism of semantic knowledge development.

Keywords

development, longitudinal, productive processes, self-derivation, semantic knowledge

Developing a storehouse of knowledge about the world—so-called semantic knowledge—is a critical developmental achievement. As such, it is important to establish the correlates of the development of semantic knowledge. One contributor to semantic content is memory for information that is directly taught or learned, such as provided through lectures, books, videos, and museum exhibits. Other contributors include productive processes such as analogy, transitive and associative inference, and induction, to name a few. Productive processes go beyond what is given through direct experience, and therefore have the potential to accelerate accumulation of knowledge [1-6]. From among the larger suite of productive processes, self- derivation through memory integration has emerged as a valid model of knowledge accumulation[7,8]. Self-derivation through memory integration involves combination of separate yet related episodes of new learning and use of the novel combination as a basis for inference of new knowledge. For example, a learner may be taught that the heart is the only muscle that never tires, and that the only muscle that never tires is powered by electricity. Combination of these facts supports derivation of the new knowledge that the heart is powered by electricity. This new information can be incorporated into semantic knowledge, even though it was not directly experienced [9].

Consistent with the suggestion that self-derivation through memory integration is a valid model of knowledge accumulation, the process is both a concurrent and longitudinal predictor of academic achievement among elementary-school children, even when other known correlates of academic achievement (e.g., working memory) are considered [10,11]. It also is a concurrent and longitudinal predictor of knowledge in a number of domains as tested by the Woodcock- Johnson measures of achievement[12,13]. However, beyond the classroom, self-derivation through integration has not been tested against other known correlates of domain knowledge, such as existing knowledge as measured by vocabulary, and working memory. As a result, it has not been established as a unique predictor of knowledge accumulation. Accordingly, in the present research, we tested self- derivation through memory integration along with measures of other cognitive abilities, as concurrent and longitudinal predictors of semantic knowledge. The major goal was to determine whether self- derivation makes unique contributions to prediction and thus can be considered a mechanism of semantic knowledge development.

Self-derivation through Memory Integration

Self-derivation through memory integration involves combination of separate yet related facts that have been directly taught, to support derivation of new knowledge. With some important exceptions, the task is structured like those that test associative inference [3]. In associative inference tasks, participants may learn arbitrarily-related pairs of images or symbols that have an overlapping element. For example, they learn the image pairs zucchini-bucket (i.e., notation: A [for zucchini], B [for bucket]) and bucket-truck (B, C [for truck]). They typically are informed that they can form an indirect relation between the two image pairs, based on the overlapping element (bucket). They then are tested for the indirect relation between zucchini-truck (AC; [14]). As suggested by the opening example (above), the test of self- derivation through memory integration is structured similarly to tests of associative inference, with the important exceptions that (a) the stimuli are true facts expected to be unfamiliar to participants, (b) participants are not made aware that the facts they are learning are related to one another, and (c) nor are they made aware that they can form an indirect relation based on an overlapping element. In these respects, the self-derivation through integration task mimics learning outside the laboratory.

Self-derivation through memory integration occurs across ages, venues, and domains. In children as young as 4 years, new information is taught in the context of brief narratives, in the laboratory [15,16]; in kindergarten and elementary school classrooms [17]; or in children’s homes, in the course of shared book reading [18] or visits to virtual museum exhibits[19]. Among children 8 years and older and adults, new information is taught in individual sentences (such as the opening example, above). Information is drawn from a range of domains, including arts and humanities, math, science, and elementary [7] and college [20] curricula. Developmental differences in self-derivation through integration are readily apparent in early childhood. By roughly 8 years of age, developmental differences are eclipsed by individual differences that persist at least into young adulthood [21].

Self-derivation through Memory Integration and Academic Achievement

As expected from a model of learning, performance on tasks of self-derivation through memory integration relates to measures of academic achievement. For example, among children in Grades 1-3 (roughly ages 7-10 years), self-derivation through integration was found to predict both math and reading achievement, as measured by end-of-year assessments. It explained up to 23% of the variance in math and 12% in reading [17]. Similar findings were reported in [10], among children in 2nd and 3rd grades. Self-derivation through memory integration also predicts math and reading achievement over one year, among children in 2nd and 3rd grade at Time 1 and 3rd and 4th grade at Time 2 ([11], Study 2). Self-derivation through memory integration performance at Time 1 predicted 18% and 21% of the variance in the Time 2 end-of-year math and end-of-year reading achievement, respectively.

Of course, self-derivation through memory integration is not the only predictor of academic achievement. For example, a consistent correlate of academic achievement is working memory [22, 23]. Children’s working memory skills predict math and reading achievement 6 years later, above measures of IQ [24]. Working memory in preschoolers predicts math and reading achievement in the first three years of primary school, and visual short term memory predicts math achievement in particular[25]. Further, visuospatial working memory predicts student’s math achievement from first grade to second grade [26].

Importantly, self-derivation through memory integration is predictive of academic performance even when other known correlates of achievement are considered. Specifically,[10] tested the concurrent predictive utility of self-derivation through integration when considered along with verbal comprehension, nonverbal intelligence, and working memory and other executive functions. End-of-year math performance was jointly predicted by self-derivation through integration, verbal comprehension, nonverbal intelligence, and working memory. The total variance in math achievement accounted for was 51% and 41% among children in 2nd and 3rd grades, respectively. Self-derivation through integration alone accounted for 31% and 25% of the total for children in 2nd and 3rd grades, respectively. In the models predicting end-of-year reading performance, for children in 2nd grade, self-derivation through integration was the only significant predictor, accounting for 32% of the variance in reading achievement. For children in the 3rd grade, self-derivation through integration was a significant predictor, along with verbal comprehension and nonverbal intelligence. The full mode accounted for 48% of the variance in reading achievement; self-derivation through integration alone accounted for 22% of the total variance. Longitudinally, as noted above, Esposito & Bauer [11], Study 2) found that self-derivation through memory integration performance at Time 1 predicted 18% of the variance in the Time 2 end-of-year math achievement. The addition of measures of vocabulary and parent education in the model did not result in significant improvement. Thus self-derivation through integration was the sole longitudinal predictor of math achievement. For the Time 2 end-of-year assessment of reading achievement, self- derivation through memory integration at Time 1 predicted 21% of the variance. The addition to the model of vocabulary and parent education increased the variance accounted for to 31%.

Self-derivation through Memory Integration and Semantic Knowledge

Just as self-derivation through integration is not the only predictor of academic achievement, so too is it the case that academic achievement is not the only measure of semantic knowledge. Indeed, end-of-year achievement tests are administered en-mass in sometimes noisy and crowded classrooms and thus may not reflect a given student’s actual achievement. As well, they do not provide information about the broader contents of semantic knowledge, beyond the skills of math and reading.

As expected from a model of learning more broadly, performance on tasks of self-derivation through memory integration relates to individually administered tests of knowledge in a larger number and variety of domains, thus providing converging evidence of relations between self-derivation through integration and semantic knowledge. Specifically, Bauer and colleagues [12] tested the predictive utility of self-derivation through integration to six domains assessed by the Woodcock-Johnson IV tests of achievement [27]. The sample was 8- to 12-year-old children tested individually, on a Zoom platform. The specific domains of achievement tested were humanities, math, sciences, and social studies, as well as general knowledge of what and where, and passage comprehension [12]. The battery thus provided a relatively comprehensive assessment of the status of semantic knowledge.

In tests of concurrent relations, self-derivation through integration predicted 15%-36% of the variance in 8- to 12-year-old children’s performance across the domains [12]. The exception was the domain of sciences, for which self-derivation through integration was not a significant predictor. [13] extended the sample to examine longitudinal relations between self-derivation through integration and the knowledge domains in the same sample of children, across one year’s time. They combined the six individual domains into one latent factor, knowledge. Self-derivation through integration at Time 1 was a significant predictor of Time 2 knowledge. Self-derivation through memory integration at Time 1 was a stronger predictor of Time 2 knowledge (β = .43) than either age (β = .33) or memory for directly taught facts (β = .30). To date, the predictive utility of the productive process of self-derivation through integration has not been tested in the context of a larger suite of cognitive abilities known to be or logical predictors of learning and semantic knowledge. This test is the subject of the present research.

The Present Research

The major goal of the present research was to determine whether self-derivation makes unique contributions to prediction of domain knowledge and thus can be considered a mechanism of semantic knowledge development in childhood. We addressed the question concurrently and longitudinally over one year, in a sample of 148 8- to 12-year-old children. The sample was the same as tested by Bauer and colleagues [12,13]. In the prior studies, self-derivation was found to predict semantic knowledge both concurrently [12] and longitudinally [13]. In those studies, self-derivation through integration—and its attendant measures of memory for the directly taught facts on which self-derivation depends—were the only measures in the predictive models. The extension provided by the present research was to include in predictive models measures of a number of cognitive abilities that have been found to relate to self-derivation itself, both concurrently and longitudinally [8].

The specific cognitive abilities measured in the present research were (a) verbal comprehension (vocabulary, synonyms, antonyms, analogies), which often is considered a measure of semantic knowledge and even as a proxy for intelligence [28]; (b) working memory, a known correlate of academic achievement in childhood [22]; (c) visual-auditory learning, which is a measure of encoding and retention of new information, such as on which self-derivation through integration depends; and (d) visualization, a potential predictor of knowledge of math and sciences in particular. The measure of verbal comprehension was from the WJ-III; the measures of working memory, visual-auditory learning, and visualization were from the WJ-IV. In [12], verbal comprehension, visual-auditory learning, and visualization were significantly positively correlated with self-derivation through integration; working memory was not. However, they were neither concurrently nor longitudinally predictive of self-derivation when measures of directly taught facts—such as on which self-derivation through integration depends—were included in the model.

Consideration of self-derivation through integration and measures of other cognitive abilities as predictors of semantic knowledge across a number and variety of domains permits test of the major question motivating the research, namely, whether self-derivation is a unique predictor, concurrently and/or longitudinally. Based on findings from elementary classroom-based studies [10, 11], we expected self-derivation through integration to make unique contributions to variance in semantic knowledge. To our knowledge, beyond the tests to evaluate the psychometric properties of the Woodcock-Johnson measures, there have not been assessments of relations between the measures of cognitive abilities and those of semantic knowledge. The present research thus presents a unique test of this question, as well as of the question of unique prediction of the measures. The work stands as an evaluation of the potential of self-derivation through integration as a mechanism of semantic knowledge development.

Method

Participants

Participants were 148 children ages 8 to 12 years (M=10.45, SD=1.37, range=8.13-12.91 years) at enrollment. Nominally, there were 30 8-year-olds, 27 9-year-olds, 42 10-year-olds, 20 11-year-olds, and 29 12-year-olds. Most participants were recruited from a database of families who had expressed interest in taking part in research in child development. The rest were recruited through a marketing firm or by referral by participants already recruited (i.e., snowballing). The sample was 76 female (51%) and 70 male (47%); 2 caregivers did not report their child’s assigned sex at birth. The racial and ethnic composition of the sample was 7% Asian, 15% Black/African American, 1% Middle Eastern or Arab, 65% White or Caucasian, 9% multi-racial, and 3% did not report on their children’s race; 7% of the sample self-identified as Hispanic or Latinx. Ninety-two percent of caregivers had received at least some college education, and 56% of caregivers had received at least some graduate level education; 7% did not report caregiver education. All demographic information is based on caregiver report provided at Year 1 (analyses of demographic information are provided [12], and are not repeated in the present report). An additional 25 children were recruited but their data were not included because of failure to complete all four sessions across the two years of data collection (18), technical failure (3), prior participation in a related study (1), parental report of a developmental disability (2), and child-initiated request to end the session before all tasks were administered (1).

The study involved two sessions in each of two consecutive years. Within each year, the two sessions took place an average of 7 days apart (Year 1 range=6-13 days; Year 2 range=5-14 days). Children participated in Year 2 Session 1 an average of 364 days after completing Year 1 Session 1 (range=341–435 days). This study was begun during the 2020 COVID-19 related shutdown, and all data were collected online via Zoom. Written informed consent for children’s participation was provided by the children’s caregivers; children provided verbal assent. Participants were compensated with $40.00 in an e-gift card at the end of the second session at Year 1, and with $50.00 in an e-gift card at the end of the final session at Year 2. The procedures were reviewed and approved by the university Institutional Review Board.

Stimuli and Materials

At both waves of data collection, the full protocol included tests of self-derivation through memory integration, recall of directly-taught and of self-derived facts, measures of candidate component cognitive abilities, and measures of domain knowledge. Concurrent and longitudinal relations between self-derivation through integration and measures of domain knowledge were reported [12,13], respectively. The unique contribution of the present report is to augment measures from the self-derivation through integration task with measures of candidate component cognitive abilities as concurrent and longitudinal predictors of measures of domain knowledge. The current analyses thus permit examination of the unique and combined predictive utility of the entire suite of potential predictors of domain knowledge. The exception is the measure of recall of self-derived facts. As reported in [12], it was not predictive of domain knowledge and for this reason, it is not included in the present report.

Outcome Measures: Tests of Achievement/Semantic Knowledge

The outcome variable of interest was domain knowledge/ semantic knowledge. Six tests from the Woodcock-Johnson® IV (WJ® IV) Tests of Achievement and Tests of Cognitive Abilities [27] were used to measure semantic knowledge. The tests assess content knowledge in a number of different domains: (a) Test 2, Applied problems (analyze and solve math problems); (b) Test 4, Passage comprehension (use syntactic and semantic cues to provide a missing word in a text passage); (c) Tests 8a and 8b, General knowledge-what and General knowledge-where (respond to questions of the form “What would you do with a                              ?” and “Where would you find a       ?”); (d) Test 18, Sciences (knowledge of anatomy, biology, geology, medicine, chemistry, and physics); (e) Test 19, Social Studies (knowledge of economics, psychology, government, history, and geography); and (f) Test 20, Humanities (knowledge of music, art, and literature). For children in the age range of 5 to 19 years, the tests have median reliability of .76 to .92. To accommodate online data collection, the tests were rendered as Qualtrics® surveys.

Predictor Variables

For both concurrent relations at each wave of testing, and for longitudinal prediction of semantic knowledge, there were two categories of predictors: measures from the self-derivation through memory integration task and measures from the Woodcock-Johnson III and IV tests of cognitive abilities.

Self-derivation through memory integration

The stimuli were 40 pairs of related facts (hereafter, stem facts) that could be used to self-derive new facts (hereafter, self-derivation facts). All facts were true and based on pilot testing with adults, were deemed unlikely to be familiar to children in the target age range. That is, adult testing demonstrated that the facts were unfamiliar to adults and that both members of the fact pairs were necessary to support high levels of production of the self-derivation facts. Specifically, for all 40 stimulus sets, adult performance was at least two-times as high when both members of the fact pair were presented (2-stem condition) relative to when only one member of the fact pair was presented (1- stem condition). Given these findings with adults, we may logically assume that the facts also would be unfamiliar to children, and that their production of the self-derivation facts would depend on exposure to both members of the fact pairs. Consistent with this assumption, at Wave 1, across the age range and for each nominal age group (8, 9, 10, 11, 12 years), performance in the 2-stem condition was reliably higher than performance in the 1-stem condition [12]. The same effect obtained at Wave 2 [13]. Because only 2-stem performance is indicative of self-derivation through integration, in the present manuscript, all analyses are of performance in the 2-stem condition only; 1-stem condition performance is not included in the present report ([12] for analysis of relative performance in the 1- and 2-stem conditions, and evidence that self-derivation depends on integration of separate yet related facts).

An example stimulus set is provided in Figure 1. The stimuli were obtained from the Bauer Lab Integration and Self-derivation Stimulus (BLISS) bank [29] , from which the stimuli are available upon request: (BLISS bank stimulus numbers S002, S051, S055-057, S066-67, S069, S084, S086, S093, S096-97, S108-111, S113, S126-147). The stimuli also included 24 “filler” facts (BLISS bank stimulus numbers F098-102, F104, F106-107, F109-110, F119-132). Filler facts were structurally similar to the stem facts yet could not be integrated with one another to derive new facts. For purposes of the present report, the purpose of the filler facts was to permit an independent test of fact recall (see below).

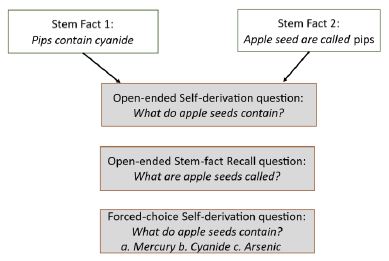
Figure 1: Example stimulus set, including a pair of related stem facts (Stem Facts 1 and 2), example open-ended test questions for self-derivation and stem-fact recall, and example forced-choice test question, with sample options.

Measures of cognitive abilities

Adapted versions of four tests from the Woodcock-Johnson Tests of Cognitive Abilities were used as candidate predictors of measures of domain knowledge: from the Woodcock Johnson III [30], (a) Test 1: Verbal Comprehension, which assesses comprehension of individual words and relations among words across the four subtests of Picture Vocabulary [1a], Synonyms [1b], Antonyms [1c] and Analogy [1d]; and from the Woodcock-Johnson IV [31]; (b) Test 7: Visualization, which is a two-part test of spatial relations, requiring visual-spatial recognition (Spatial Relations [Test 7a]) and mental manipulation of two- and three-dimensional visual representations (Block Rotation [Test 7b]); (c) Test 10: Numbers Reversed, which requires the participant to listen to and then recall a sequence of digits in reverse of the order of presentation. It is considered a measure of working memory; and (d) Test 13, Visual-Auditory Learning, which requires the participant to learn and recall pictographic representations of words. It assesses long-term storage and retrieval as well as associative memory. Verbal Comprehension is considered a measure of semantic memory and thus a “crystalized” ability, whereas Visualization, Numbers Reversed, and Visual-Auditory Learning are considered measures of “fluid” abilities. Due to the online format of data collection, the tests were rendered as Qualtrics® surveys.

Procedure

At each wave of testing, children took part in two sessions conducted and recorded via Zoom. Testing was conducted by one of six female experimenters. Within a wave, children were tested by the same experimenter for both sessions. Children were tested by different experimenters at Waves 1 and 2. The experimenters followed a detailed written protocol. Consistency was assessed by regular viewing of the session recordings by all experimenters. The protocols were the same at Wave 1 and Wave 2. Both within and between sessions, the order of the tasks and tests was the same for all participants. The order of administration was determined based on pilot testing with the goals of minimizing participant burden and maximizing participant engagement. Because the order was fixed, any general or specific carry-over effects are the same for all participants. A schematic of the testing protocol is provided in Figure 2, with Session 1 in the left panel and Session 2 in the right panel.

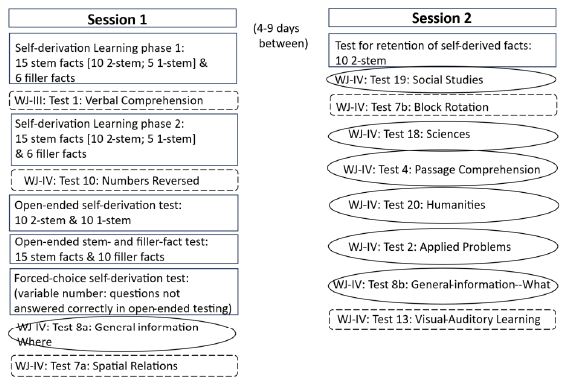
Figure 2: Schematic representation of the testing protocol. Tests in squared boxes are from the self-derivation through memory integration task; tests in rounded rectangles with broken/dashed outlines are measures of cognitive abilities; tests surrounded by ovoids are outcome measures.

Session 1

At each wave, in Session 1, participants engaged in the self- derivation through integration task, three tests of cognitive abilities, and one test of semantic knowledge.

Self-derivation through memory integratiaon

Learning phases. At each wave, in each of two learning phases, children were exposed to 21 novel facts, for a total of 42 facts. Of the 42 facts, 20 were in a 2-stem condition, 10 were in a 1-stem condition, and the remaining 12 were filler facts. Pairs of facts in the 2-stem condition could be integrated such that participants could self-derive new knowledge that had not been directly presented (i.e., self-derivation facts). The 10 facts presented in the 1-stem condition served as a control: each fact was one half of an integrable pair and thus there was no opportunity for integration and self-derivation. As noted above, because only 2-stem performance is indicative of self- derivation through integration, in the present manuscript, all analyses are of performance in the 2-stem condition only; 1-stem condition performance is not included in the report [12,13]. Each integrable fact pair was used approximately equally often in the 2-stem and 1-stem conditions across participants. The 12 filler facts provided the opportunity to examine recall of directly-taught facts, independent of the self-derivation task.

The 42 novel facts were presented across two learning phases. In Learning phase 1, children were presented with 21 facts: the first member of 10 pairs of facts in the 2-stem condition, 5 facts in the 1-stem condition, and 6 filler facts. Children were instructed to pay attention to the facts because they might be asked some questions about them later. Facts were presented individually on the experimenter’s screen, which was shared with the participant via Zoom. The experimenter first read the fact to the child and then the child read it back to the experimenter. After all 21 facts had been displayed and read aloud, children completed the Woodcock Johnson III [30] test of Verbal Comprehension (Test 1; see below for procedure). After the test for verbal comprehension, children engaged in Learning phase 2, during which they were presented with the remaining 21 facts: 10 facts in the 2-stem condition, 5 facts in the 1-stem condition, and 6 filler facts. Participants then completed Woodcock Johnson IV [27,30] Numbers Reversed test (Test 10), as a measure of auditory working memory (see below for procedure).

In total, there were 40 pairs of related stem facts, divided into two sets of 20 pairs of related facts. At each wave, half of the participants were tested on one set of related facts and half on the other. The stem-fact sets were used approximately equally often in each wave of testing, and participants were tested on different sets of facts at each wave. Within a stem-fact set, each stem-fact pair was used in the 2-stem and 1-stem conditions approximately equally often. In the 2-stem condition, each member of the stem-fact pair was presented in Learning phase 1 and Learning phase 2 approximately equally often. Each stem-fact set was presented in one of four different random orders, each used approximately equally often across participants. Participants were pseudo-randomly assigned to one of the four orders, constrained by the need to use each order approximately equally often.

Self-derivation through integration

Test phases. Following the Woodcock Johnson IV Numbers Reversed test (Test 10), children were presented with 20 open-ended questions testing for self-derivation through memory integration: 10 questions on facts from each of the 2-stem and 1-stem conditions. They then were presented with 15 open-ended stem-fact and 10 filler- fact recall questions. After tests for open-ended recall of stem and filler facts, children were tested on any self-derivation questions answered incorrectly in open-ended testing, this time in 3-alternative forced- choice format (see Figure 1 for example open-ended and forced- choice questions). Forced-choice testing of stem and filler facts was not conducted, in consideration of participant burden.

At each wave, the order of presentation of open-ended self- derivation through integration questions was randomized in Qualtrics. As well, the order of forced-choice testing of self-derivation questions not answered correctly in open-ended testing also was randomized in Qualtrics. Open-ended testing for recall of the stem and filler facts was conducted in one of eight pseudo-random orders each of which was used approximately equally often across participants. The constraint was that stem facts from the same fact set were not tested sequentially. Across participants, stem and filler facts were tested approximately equally often. After testing of self-derivation through integration and fact recall, children completed a test of domain knowledge (WJ-IV: Test 8a) and then were administered the third Woodcock-Johnson test: Test 7a: Visualization-Spatial Relations (see below for procedure).

Woodcock-Johnson tests of cognitive abilities

Between Learning phases 1 and 2, children were tested on the WJ- III test Verbal Comprehension (Test 1a-d). Between Learning phase 2 and the tests for self-derivation and fact recall, children were tested on the WJ-IV test of Numbers Reversed test (Test 10). As the final test of the session, children were tested on the WJ-IV test of Visualization- Spatial Relations (Test 7a). The tests were administered following the WJ protocols, with test items displayed on the Zoom screen. Children’s responses were recorded by the experimenter.

Woodcock-Johnson test of semantic knowledge

The pen-ultimate task of Session 1 was a test of academically- related content knowledge WJ-IV: General Information-where (Test 8a). The test was administered following the WJ protocols, with test items displayed on the Zoom screen. Children’s responses were recorded by the experimenter.

Session 2

Session 2 took place approximately 1 week after Session 1. Children were tested for retention of the self-derived facts from Session 1, six tests of academically-related content knowledge, and two tests of cognitive abilities (see Figure 2).

Retention of self-derivation facts

At each wave, children were tested for retention of the self- derivation facts from the 2-stem condition of Session 1. However, because retention of self-derived facts was not a significant predictor of semantic knowledge [12], we did not include measures of retention in analyses.

Woodcock-Johnson tests of semantic knowledge/achievement

Six tests of achievement were administered in the standard order as indicated: Test 19: Social Studies; Test 18: Sciences; Test 4: Passage comprehension; Test 20: Humanities; Test 2: Applied Problems; and Test 8b: General Information-what. All tests were administered following the WJ-IV protocol, with questions displayed on the Zoom screen.

Woodcock-Johnson tests of cognitive abilities

At Session 2, children completed two tests of cognitive abilities (see Figure 2). Between Tests 19 and 18, children completed WJ-IV test of Visualization—Block Rotation (Test 7b). As the final test of the session, children completed the WJ-IV test of Visual-Auditory Learning (Test 13). The tests were administered following the WJ protocols, with test items displayed on the Zoom screen. Children’s responses were recorded by the experimenter.

Scoring and Data Reduction

Scoring was conducted the same way for Waves 1 and 2. For open-ended self-derivation through integration and open-ended recall of stem and filler facts, 1 point was awarded for each correct response, for a total possible of 10 self-derivation facts in the 2-stem condition, 10 self-derivation facts in the 1-stem condition, 15 stem facts (5 stem-fact pairs from the 2-stem condition [10 facts] and 5 facts from the 1-stem condition), and 10 filler facts. Levels of self- derivation performance and of open-ended recall of the stem and filler facts at Session 1 were considered as potential predictors of semantic knowledge (along with measures from the Woodcock-Johnson tests; see below). Self-derivation also was tested in forced-choice. However, because open-ended performance provides stronger evidence of self- derivation, relative to performance that also includes selection of correct responses from among distracters, in subsequent analyses, we focus on open-ended self-derivation performance only ([12], for further justification for focus on open-ended performance only).

The tests of cognitive abilities were scored as per the test protocol and standardized using WJ-III and WJ-IV proprietary software.

Results

The results are presented in four sections, starting with descriptive statistics and zero-order correlations among the variables in Section 1. Section 2 outlines the results of factor analyses to determine the number of latent factors among (a) the outcome measures of domain knowledge; and (b) the predictors of domain knowledge, namely, the (i) tests of cognitive abilities (verbal comprehension, visual-auditory learning, visualization, numbers reversed) and (ii) experimental measures of self-derivation through integration performance, and memory for stem and filler facts. In Section 3 we present the results of tests for concurrent relations among the outcome measures and the predictors at each of Waves 1 and 2. Finally, in Section 4, we present the results of longitudinal prediction of the outcome measures by the predictors from Wave 1 to Wave 2, one year later.

Section 1: Descriptive Statistics and Zero-order Correlations

Descriptive statistics for the measures of interest are provided in Table 1, Panels a and b for Wave 1 and Wave 2, respectively. For the outcome measure of domain knowledge, following [13], we report W Scores for each of the six Woodcock-Johnson Tests probing domain knowledge. W Scores represent the child’s performance on the task, based on the average performance of neuro-typical children of their age (in months). For every raw score, there is a W Score that is generated by Woodcock-Johnson Score Reports. W scores are centered on a value of 500, with a typical range on any given task of between 430 and 550. As discussed in [13], W scores represent an equal interval scale across tasks, making them particularly relevant for reporting participants’ actual growth in a measured trait [32]. For all other measures, we report proportion correct out of total trials. Initial skewness and kurtosis measures indicated that the data for all variables were normally distributed, with the exception of the Wave 2 measure of applied problems. One participant performed more than 5 standard deviations below the mean on this assessment. With the data from that participant removed, skewness and kurtosis values indicated normal distribution, as indicated in Table 1. Whether the data from this participant were or were not removed, overall results from subsequent analyses did not change.

Table 1: Descriptive statistics for outcome variables (domain knowledge) and predictor variables (cognitive abilities, self-derivation) at Wave 1 (Panel a) and Wave 2 (Panel b)

Category and Measure

Descriptive Statistics
Category Measure N Model Label Mean SD Skewness

Kurtosis

Panel a: Wave 1          
Domain knowledge Domain knowledge total

148

Total01 3020.42 80.74 -.16

.40

  General information

148

Gen01 503.51 14.19 -.274

-.214

  Passage comprehension

148

PC01 499.95 14.51 .022

-.154

  Sciences

148

Sci01 501.52 14.24 -.263

-.593

  Applied problems

148

App01 509.63 19.83 -.697

.958

  Social studies

148

Soc01 505.98 17.26 -.084

-.624

  Humanities

148

Hum01 499.83 15.75 .194

-.329

Cognitive abilities Verbal comprehension

143

VC01 107.90 10.755 .032

-.613

  Visual-Auditory learning

147

VisAud01 105.551 13.426 .007

.395

  Visualization

148

Vis01 104.541 13.543 -.029

.438

  Numbers Reversed

138

Num01 107.754 15.325 -.524

2.151

Self-derivation Open-ended self-derivation

148

SDI01 .329 .206 .354

-.423

  Stem fact recall

148

Stem01 .488 .186 .015

-.376

  Filler fact recall

148

Fill01 .567 .202 -.328

.137

Panel b: Wave 2          
Domain knowledge Domain knowledge total

148

Total02 3060.14 78.09 -.21

-.28

  General information

148

Gen02 509.19 13.13 -.075

-.158

  Passage comprehension

148

PC02 506.43 14.54 .067

.034

  Sciences

148

Sci02 507.80 13.25 -.481

-.355

  Applied problems

147

App02 517.57 16.69 -.54

.93

  Social studies

148

Soc02 513.35 16.54 -.378

-.676

  Humanities

148

Hum02 506.39 16.35 .200

-.453

Cognitive abilities Verbal comprehension

143

VC02 107.783 11.368 .066

.005

  Visual-Auditory learning

144

VisAud02 113.465 12.847 .64

.902

  Visualization

148

Vis02 105.653 14.583 .016

.056

  Numbers Reversed

143

Num02 108.329 16.369 -.109

-.31

Self-derivation Open-ended self-derivation

148

SDI02 .388 .209 .086

-.807

  Stem fact recall

148

Stem02 .533 .188 -.225

-.449

  Filler fact recall

148

Fill02 .592 .197 -.313

.011

Note. W Scores are used for all measures of domain knowledge (domain knowledge total, general information, passage comprehension, sciences, applied problems, social studies, humanities); proportion scores are used for measures of self-derivation, including stem-fact and filler-fact recall.

Zero-order correlations among the outcome variables (domain knowledge) and predictor variables (cognitive abilities, self- derivation), within and across waves, are provided in Table 2. Pearson’s product-moment correlations between the categories of predictor variables (cognitive abilities and self-derivation), within and across waves, are provided in Table 3. Pearson’s product-moment correlations within predictor variables (cognitive abilities, self-derivation), within and across waves, are provided in Table 4.

Table 2: Pearson’s product-moment correlations among outcome variables (domain knowledge) and predictor variables (cognitive abilities, self-derivation), within and across waves

Predictor Variables

Age Measures of Outcome Variables: Domain Knowledge
  Age 1 Total1 Gen1 PC1 Sci1 App1 SS1 Hu1 Total2 Gen2 PC2 Sci2 App2 SS2

Hu2

VC1

-.38 .39 .38 .37 .39 .20** .28 .40 .49 .46 .44 .41 .30 .37 .51
VA1 .01ns .42 .32 .36 .35 .32 .32 .47 .49 .42 .40 .40 .39 .35

.52

Vis1

-.09ns .24** .16* .26** .26 .22** .09ns .24** .31 .27 .24** .23** .30 .16ns .31
NR1 .09ns .20* .17* .22** .01ns .25** .13ns .20* .22** .19* .19* -.01ns .24** .18*

.22*

SDI1

.15ns .59 .54 .52 .45 .37 .52 .60 .61 .52 .50 .59 .46 .51 .61
Stm1 .20* .60 .55 .50 .49 .42 .54 .58 .62 .56 .48 .55 .47 .55

.61

Fill1

.16ns .53 .42 .50 .45 .35 .45 .56 .57 .47 .51 .56 .41 .44 .58
VC2 -.20* .55 .54 .57 .51 .30 .40 .54 .64 .61 .59 .56 .43 .47

.65

VA2

.05ns .42 .31 .38 .36 .37 .29 .43 .47 .41 .38 .44 .41 .30 .45
Vis2 0ns .30 .26** .29 .30 .27** .11ns .31 .36 .32 .28 .32 .32 .16ns

.40

NR2

.04ns .16ns .14ns .20* .02ns .22* .10ns .13ns .20* .15ns .18* .00ns .21* .19* .16ns
SDI2 .11ns .61 .46 .53 .56 .45 .55 .52 .63 .57 .49 .55 .48 .56

.62

Stm2

.06ns .55 .44 .48 .52 .38 .49 .48 .62 .57 .51 .60 .43 .50.61  
Fill2 -.01ns .52 .43 .44 .48 .31 .45 .54 .59 .54 .47 .57 .39 .48

.62

Note: Measures ending in “1” were collected at Wave 1; measures ending in “2” were collected at Wave 2. Age = participant age, Total = total domain knowledge, Gen = general information, PC = passage comprehension, Sci = sciences, App = applied problems, SS = social studies, and Hu = humanities. VC = verbal comprehension, VA = visual-auditory learning, Vis = visualization, NR = numbers reversed, SDI = self-derivation, Stm = stem-fact recall, and Fill = filler-fact recall. Unless otherwise indicated, all correlations are significant at p < .001. For other correlations, **= p < .01, * = p < .05, ns = not statistically significant.

Table 3: Pearson’s product-moment correlations between the categories of predictor variables (cognitive abilities, self-derivation), within and across waves

Measures of Self-derivation

Age Measures of Cognitive Abilities
  Age1 VC1 Vis-Aud1 Visual1 NR1 VC2 Vis-Aud2 Visual2

NR2

SDI1

.15ns .36** .30** .16* .13ns .51** .35** .27** .06ns
Stem1 .20* .35** .39** .18* .19* .42** .37** .34**

.22*

Fill1

.16ns .43** .33** .25** .12ns .49** .39** .30** .15ns
SDI2 .11ns .41** .34** .18* .14ns .48** .33** .26**

.14ns

Stem2

.06ns .45** .44** .23** .09ns .52** .42** .30** .12ns
Fill2 -.01ns .52** .42** .25** .13ns .56** .43** .31**

.11ns

Note: Measures ending in “1” were collected at Wave 1; measures ending in “2” were collected at Wave 2. Age = participant age, VC = verbal comprehension, Vis-Aud = visual-auditory learning, Visual = visualization, NR = numbers reversed, SDI = self-derivation, stem = stem-fact recall, and Fill = filler-fact recall. ** = p < .001, * = p < .05, ns = not statistically significant.

Table 4: Pearson’s product-moment correlations within predictor variables (cognitive abilities, self-derivation), within and across waves

Measures of Predictor Variables at Wave 2

Measures of Predictor Variables at Wave 1
  VC1 Vis-Aud1 Visual1 NR1 SDI1 Stem1

Filler1

VC2

.801** .48** .42** .15ns  


(See Table 3 for values in this quadrant)

Vis-Aud2 .35** .582** .32**

.14ns

Visual2

.30** .44** .71** .24**
NR2 .12ns .19* .21*

.66**

SDI2


(See Table 3 for values in this quadrant)

.537** .65** .50**
Stem2 .58** .632**

.60**

Filler2

.56**

.65**

.556**

Note: Measures ending in “1” were collected at Wave 1; measures ending in “2” were collected at Wave 2. Age = participant age, VC = verbal comprehension, Vis-Aud = visual-auditory learning, Visual = visualization, NR = numbers reversed, SDI = self-derivation, Stem = stem-fact recall, and Fill = filler-fact recall. ** = p < .001, * = p < .05, ns = not statistically significant.

Section 2: Factor Analyses

We conducted factor analyses to determine the number of latent factors among (a) the outcome measures of domain knowledge; and (b) the predictors of domain knowledge, namely, the (i) tests of cognitive abilities (verbal comprehension, visual-auditory learning, visualization, numbers reversed) and (ii) experimental measures of self-derivation through integration performance, and memory for stem and filler facts.

Outcome measures: Domain knowledge

Exploratory factor analysis (EFA) reported in [13] indicated that the six domains of knowledge formed one latent factor, thereafter referred to as knowledge. The specific procedures used to arrive at this solution are detailed in [13].

Predictors

For the Wave 1 variables, we used EFA to determine the number of latent factors formed by the tests of cognitive abilities (verbal comprehension, visual-auditory learning, visualization, numbers reversed) and the measures from the self-derivation through integration paradigm (open-ended self-derivation, stem-fact recall, filler-fact recall). The analysis was conducted using JASP software with the following settings: number of factors based on parallel analysis of factors, using the minimum residual estimation method, oblique rotation (promax), and with a factor loading cut off of .4. For Wave 2, given the absence of a theoretical expectation of a different factor structure, we conducted a confirmatory factor analysis (CFA) on the new data, using the factor structure discovered at Wave 1.

For the Wave 1 assessments, a Kaiser-Meyer-Olkin test indicated that the measures were suitable for factor analysis, with an overall MSA =.776. Bartlett’s test was significant, X2(21) = 322.33, p < .001, indicating that the data are a good fit to the factor analysis. As depicted in Table 5, two factors emerged: Factor 1 was comprised of the measures of stem-fact recall, open-ended self-derivation through integration, and filler-fact recall (hereafter self-derivation and fact recall). Factor 2 was comprised of the measures of the cognitive abilities of visual-auditory learning, verbal comprehension, and visualization (hereafter verbal and spatial abilities). The test of working memory (WJ-IV, Numbers Reversed) did not load on either factor. For the confirmatory factor analysis of the Wave 2 data, a Kaiser-Meyer- Olkin test indicated that the measures were suitable for factor analysis, with an overall MSA = .827. Bartlett’s test was significant, X2(15) = 338.269, p < .001, indicating good model fit. RMSEA = .069, indicating acceptable model fit. The parameter estimates are provided in Table 6.

Table 5: Results of exploratory factor analysis (EFA) for the predictor variables (self-derivation through integration, cognitive abilities) at Wave 1

Predictor Variables

Factor Structure
  Factor 1

(self-derivation and fact recall)

Factor 2

(verbal and spatial abilities)

Uniqueness

Stem-fact recall

0.906


0.215

Self-derivation

0.877


0.307

Filler-fact recall

0.642


0.468

       
Visual-Auditory Learning

0.703

0.484

VerbalComprehension

0.618

0.531

Visualization

0.614

0.687

       
Numbers Reversed


0.919

Note. Applied rotation method is promax.

Table 6: Parameter estimates for confirmatory factor analysis (CFA) for the predictor variables (self-derivation and fact recall, verbal and spatial abilities) at Wave 2: Factor loadings (Panel a) and residual variances (Panel b)

Factor and Indicator

Parameter Estimates
       

95% Confidence Interval

Factor

Indicator Estimate Std. Error z-value p Lower

Upper

Panel a: Factor loadings          
Self-derivation & fact recall Self-derivation

0.171

0.015 11.677 < .001 0.142

0.2

Filler-fact recall

0.143

0.015 9.695 < .001 0.114

0.172

  Stem-fact recall

0.169

0.013 13.211 < .001 0.144

0.194

Verbal & spatial abilities Verbal comprehension

8.543

0.955 8.942 < .001 6.671

10.416

  Visualization

7.008

1.297 5.404 < .001 4.466

9.55

  Visual-Auditory Learning

7.632

1.117 6.832 < .001 5.443

9.822

Panel b: Residual variances          
Self-derivation & fact recall Self-derivation

0.14

.002 6.233 < .001 0.010

0.018

Filler-fact recall

0.018

.003 7.134 < .001 0.013

0.023

  Stem-fact recall

0.007

.002 3.835 < .001 0.003

0.010

Verbal & spatial abilities Verbal comprehension

53.965

11.357 4.752 < .001 31.705

76.224

  Visualization

162.122

20.923 7.749 < .001 121.114

203.131

  Visual-Auditory Learning

105.082

15.182 6.921 < .001 75.325

134.838

Section 3: Concurrent Relations among Outcome Measures and Predictors

To examine concurrent relations among the outcome measures of knowledge and the predictors of self-derivation and fact recall and verbal and spatial abilities, we conducted Structural Equation Modeling (SEM) at each of Waves 1 and 2. At each wave, we used the two latent structures discovered using factor analyses (self- derivation and fact recall, verbal and spatial abilities) as predictors of the latent outcome variable of knowledge. We did not include the WJ-IV measure of Numbers Reversed (working memory) because, as discussed in Bauer et al. (2025), SEM modeling that included working memory was less than an ideal fit; the model without working memory was a better fitting model. Accordingly, in subsequent analyses, we used the model with only the latent constructs. At both waves, Chi-square goodness of fit tests indicated good model fit: X2(12) = 12.164, p = .433, X2(12) = 17.687, p = .126, for Waves 1 and 2, respectively. Model statistics are provided in Table 7, Panels a and b for Wave 1, and Panels c and d for Wave 2. Semi-partial R-squared values indicating the proportion of variance explained by each factor are provided in Table 8, Panel a.

Table 7: Parameter estimates for Structural Equation Modeling (SEM) of the outcome measure of knowledge with the predictor variables (verbal and spatial abilities, self-derivation and fact recall) at Wave 1: Factor loadings (Panel a) and regression coefficients (Panel b), and Wave 2: Factor loadings (Panel c) and regression coefficients (Panel d)

Factor and Indicator

Parameter Estimates

Panel a: Wave 1 Factor loadings        
       

95% Confidence Interval

Latent Indicator

Estimate

Std. Error z-value p Lower

Upper

Verbal & spatial abilities1 Verbal comprehension1

1.000

.000     1.000

1.000

  Visualization1

0.873

0.182 4.808 < .001 0.517

1.229

  Visual-Auditory Learning1

1.277

0.213 6.005 < .001 0.860

1.694

Self-derivation & fact recall1 Self-derivation1

1.000

.000     1.000

1.000

Filler-fact recall1

0.864

0.091 9.538 < .001 0.687

1.042

  Stem-fact recall1

0.959

0.082 11.650 < .001 0.798

1.121

Panel b: Wave 1 Regression coefficients      
     

95% Confidence ICnterval

Predictor Outcome

Estimate

Std. Error z-value p Lower

Upper

Verbal & spatial abilities1 Knowledge1

2.235

1.063 2.103 < .036 0.152

4.319

Self-derivation & fact recall1 Knowledge1

273.283

45.282 6.035 < .001 184.533

362.034

Panel c: Wave 2 Factor loadings          
           

95% Confidence Interval

Latent Indicator

Estimate

Std. Error z-value p Lower

Upper

Verbal & spatial abilities2 Verbal comprehension2

1.000

.000     1.000

1.000

  Visualization2

0.773

0.150 5.160 < .001 0.479

1.066

  Visual Auditory Learning2

0.852

0.133 6.400 < .001 0.591

1.112

Self-derivation & fact recall2 Open-ended self-derivation2

1.000

.000     1.000

1.000

Filler-fact recall2

0.827

0.085 9.778 < .001 0.661

0.993

  Stem-fact recall2

0.948

0.078 12.188 < .001 0.796

1.101

Panel d: Wave 2 Regression coefficients        
           

95% Confidence Interval

Predictor Outcome

Estimate

Std. Error z-value p Lower

Upper

Verbal & spatial abilities2 Knowledge2

5.284

1.609 3.284 < .001 2.130

8.437

Self-derivation & fact recall2 Knowledge2

121.647

69.387 1.753 0.080 -14.349

257.643

Note: Measures ending in “1” were collected at Wave 1; measures ending in “2” were collected at Wave 2.

At Wave 1, both self-derivation and fact recall and verbal and spatial abilities contributed significant unique variance in predicting knowledge: 33.3% and 4.5%, respectively (Table 8). Shared variance was 18.4%, bringing combined variance explained to R2 = .56. At Wave 2, verbal and spatial abilities once again contributed significant unique variance in knowledge (35.4%). However, the latent factor of self- derivation and fact recall merely approached significance, with 7.4% variance accounted for. The amount of shared variance was 27.3%, bringing combined variance explained to R2 = .70. Discussion of the most likely explanations for this pattern is reserved for the Discussion.

Table 8: Beta weights and semi-partial R2 values for concurrent predictors of knowledge at each of Waves 1 and 2 (Panel a) and longitudinal predictors of knowledge from Wave 1 to Wave 2 (Panel b)

Wave

Beta Weights   Variance Explained

Type of Variance

Wave

ß(VVA)

ß(SDI) r(VVA,SDI) R2 (total) Unique VVA% Unique SDI%

Shared%

Panel a: Concurrent prediction          
Wave 1

.212

.577 .754 .562 4.5% 33.3%

18.4%

Wave 2

.595

.272 .843 .701 35.4% 7.4%

27.3

Panel b: Longitudinal prediction        
Wave 1 to Wave 2

.379

.507 .635 .625 9.3% 15.8%

37.4%

Note: VVA = verbal and visual abilities, SDI = self-derivation and fact recall.

Section 4: Longitudinal Relations among Outcome Measures and Predictors

To examine longitudinal relations among the outcome measures of knowledge at Wave 2 and the predictors of self-derivation and fact recall and verbal and spatial abilities at Wave 1, we conducted SEM. We used the two latent structures of verbal and spatial abilities and self-derivation and fact recall from Wave 1 as predictors of the latent outcome variable of knowledge at Wave 2. A Chi-square goodness of fit test indicated good model fit: X2(12) = 12.088, p = .439. Model statistics are provided in Table 9. As reflected in Table 8, Panel b, both self-derivation and fact recall and verbal and spatial abilities at Wave 1 were significant predictors of knowledge one-year later, at Wave 2, explaining 15.8% and 9.3%, respectively. Shared variance was 37.4%, bringing the combined variance explained to R2 = .63.

Table 9: Parameter estimates for Structural Equation Modeling (SEM) of the outcome measure of knowledge at Wave 2 with the predictor variables (verbal and spatial abilities, self-derivation and fact recall) from Wave 1: Factor loadings (Panel a) and regression coefficients (Panel b)

Factor and Indicator

Parameter Estimates

Panel a: Wave 1 to Wave 2 factor loadings      
       

95% Confidence Interval

Latent Indicator

Estimate

Std. Error z-value p Lower

Upper

Verbal & spatial abilities1 Verbal comprehension1

1.000

.000     1.000

1.000

  Visualization1

0.865

0.174 4.967 < .001 0.524

1.206

  Visual Auditory Learning1

1.251

0.193 6.486 < .001 0.873

1.629

Self-derivation & fact recall1 Self-derivation1

1.000

.000     1.000

1.000

Filler-fact recall1

0.863

0.090 9.608 < .001 0.687

1.039

  Stem-fact recall1

0.949

0.081 11.675 < .001 0.790

1.109

Panel b: Wave 1 to Wave 2 Regression coefficients        
           

95% Confidence Interval

Predictor Outcome

Estimate

Std. Error z-value p Lower

Upper

Verbal & spatial abilities1 Knowledge2

3.829

1.014 3.774 < .001 1.841

5.817

Self-derivation & fact recall1 Knowledge2

231.203

40.682 5.683 < .001 151.467

310.939

Note: Measures ending in “1” were collected at Wave 1; measures ending in “2” were collected at Wave 2.

Discussion

The major purpose of the present research was to determine whether self-derivation through memory integration makes unique contributions to prediction of domain knowledge and thus can be considered a mechanism of semantic knowledge development in childhood. The question was tested in a sample of 148 children, ages 8 to 12 years at the time of enrollment. The outcome measure of semantic knowledge was based on six domains that were treated as one latent factor, knowledge: applied problems (math), humanities, sciences, social studies, general knowledge of what and where, and passage comprehension. The predictors were (a) tests of self- derivation through memory integration and memory for directly taught facts (stem facts and filler facts); and (b) measures of four cognitive abilities, namely, verbal comprehension, visual-auditory learning, visualization, and working memory. The predictors formed two latent factors: self-derivation and fact recall and verbal and spatial abilities. Working memory was not included in either factor. Children participated in two waves of testing, separated by one year.

In prior research on the same sample, self-derivation through memory integration was found to predict semantic knowledge for five of the six individual domains assessed; the exception was the domain of sciences (Bauer et al., 2024). In a subsequent test of longitudinal relations, the six individual domains were treated as one latent factor, knowledge. Self-derivation through integration predicted knowledge both concurrently, at each of Waves 1 and 2, and longitudinally over one year [13]. In a separate evaluation, measures of memory for directly taught facts (stem and filler facts) were found to be both concurrently related and longitudinally predictive of self-derivation, whereas the measures of cognitive abilities were not [8]. Based on this pattern of findings, in the present research, we expected to observe (a) separate latent factors for self-derivation and fact recall and visual and spatial abilities; and (b) that both latent factors would be predictive of knowledge, concurrently and over one year.

Consistent with expectations, at Wave 1, the latent constructs of self-derivation and fact recall and verbal and spatial abilities both were uniquely predictive of semantic knowledge. The amount of unique and shared variance in semantic knowledge explained by the factors was 56%. At Wave 2, only verbal and spatial abilities was uniquely predictive. Self-derivation and fact recall predicted a nonsignificant 7.4% of the variance in semantic knowledge. Considering the amount of unique and shared variance, the total variance explained by the factors was 70%. Notably, semantic knowledge at Wave 2 was predicted by Wave 1 self-derivation and fact recall and Wave 1 verbal and spatial abilities. Both latent factors made unique contributions to prediction of semantic knowledge at Wave 2. The amount of unique and shared variance in semantic knowledge explained by the factors was 63%.

Overall, the findings of the present research were as expected, with the exception of the concurrent test at Wave 2, in which only verbal and spatial abilities emerged as a statistically significant predictor of semantic knowledge; self-derivation and fact recall only approached significance. We attribute this pattern to the strong correlations among the various Woodcock-Johnson tests at Wave 2 (see Table 2), and to the nominal increase in shared variance of the factors at Wave 2 (27.3%), relative to Wave 1 (18.4%; see Table 8). The result was relatively less variance to be explained by the experimental measures of self- derivation. The pattern of relatively stronger correlations among the Woodcock-Johnson tests at Wave 2, relative to Wave 1 was especially apparent for the measure of verbal comprehension: at Wave 1, the correlations with the individual semantic domains ranged from rs = .20-.40, whereas at Wave 2, they ranged from rs = .43-.65. This finding is understandable in light of the fact that the Woodcock-Johnson tests were essentially identical at the two waves: the same questions were asked in the same format. The only differences were in one or possibly two additional questions posed to establish ceiling performance. Given this feature of the instrument, there was substantial shared task variance at Wave 2, likely inflating the proportion of variance in semantic knowledge accounted for by verbal and spatial abilities. In contrast, whereas the format of the tests for self-derivation and fact recall were the same at both waves, the specific items were unique at each wave.

An unexpected—yet explicable—finding in the present research was of the substantial amount of variance in longitudinal prediction shared by the latent factors of self-derivation and fact recall and verbal and spatial abilities. Whereas each factor contributed unique variance, the amount of shared variance in knowledge explained approached 40%. We interpret this pattern as a reflection of the tight relation between existing knowledge and the ability to add to it. In the present research, existing knowledge was reflected in the latent construct of verbal and spatial abilities, which included a measure often used as a proxy for existing knowledge, namely verbal comprehension. The ability to add new knowledge was reflected in the latent construct of self-derivation and fact recall, which included both memory for directly taught facts and the productive process of generating new knowledge from them. Critically, each individual construct at Wave 1 was a unique predictor of semantic knowledge at Wave 2, over and above the variance they shared. Self-derivation and fact recall accounted for a nominally greater proportion of variance relative to verbal and spatial abilities (15.8% and 9.3%, respectively)

The present research makes a substantial contribution to the literature in establishing self-derivation through memory integration as a unique predictor of semantic knowledge, at least among children ages 8 to 12 years. It is not without limitations, however. One limitation is that, based on the present research, it is not known whether the same pattern of findings would be apparent among children younger than age 8 years or among participants older than 12 years. The structure of cognitive abilities changes across the late elementary school years, with increasing differentiation of cognitive abilities from one another [33]. As such, different patterns may be expected at younger and older ages. It will be left to future research to address this possibility.

A second potential limitation is that the children were tested online, as opposed to in person. The online format may have resulted in lower performance than might be expected from in-person testing. Importantly, given that all tasks and all participants were tested in the same way, any general or specific effects of online testing would be equally distributed over the entire battery and sample.

A third potential limitation of the present research is that only one productive process was tested as a predictor of semantic knowledge. As noted earlier, self-derivation through memory integration is but one among many productive processes, including (but not limited to) analogy, induction, and associative and transitive inference [1,4, 34]. It is possible that one or more of these processes also may account for unique variance in semantic knowledge. This question has yet to be tested empirically in children. Among adults, self-derivation through integration has been found to be uniquely related to academic achievement relative to other paradigms that test productive processes [35]. Importantly, finding that other productive processes also predict semantic knowledge would not undermine the importance of self- derivation through memory integration as a mechanism of semantic knowledge development. Rather, it would establish a larger suite of productive processes on which knowledge expansion depends.

In conclusion, in the present research, we tested self-derivation through memory integration along with measures of other cognitive abilities, as concurrent and longitudinal predictors of semantic knowledge. Both factors were found to be concurrent predictors at Wave 1. Critically, both factors as measured at Wave 1 predicted semantic knowledge at Wave 2. The work thus establishes self- derivation through memory integration as a unique longitudinal predictor of semantic knowledge in childhood. As such, it can be considered a mechanism of semantic knowledge development.

Acknowledgement

Support for this research was provided by NICHD R01 HD094716 to Patricia J. Bauer. The authors also thank Britney Del Solar, Jessica Dugan, Melanie Hanft, and Alissa Miller, for their help with data collection and reduction, and other members of the Memory at Emory laboratory group for their help at various stages of this research, and the children and families who so generously gave of their time to take part in this research.

References

  1. Richland, L. E., Morrison, R. G., & Holyoak, K. J. (2006). Children’s development of analogical reasoning: Insights from scene analogy problems. Journal of Experimental Child Psychology;94(3): 249–273.
  2. Bryant, E., & Trabasso, T. (1971). Transitive inferences and memory in young children. Nature, 232(5311):456–458. [crossref]
  3. Schlichting, M. L., & Preston, A. R. (2015). Memory integration: Neural mechanisms and implications for behavior. Current Opinion in Behavioral Sciences, 1:1-8. [crossref]
  4. Schulz, E., Goodman, N. D., Tenenbaum, J. B., & Jenkins, A. C. (2008). Going beyond the evidence: Abstract laws and preschoolers’ responses to anomalous data. Cognition, 109(2):211-223. [crossref]
  5. Goswami, (2011). Inductive and deductive reasoning. In U. Goswami (Ed.), Childhood cognitive development (pp. 399–419). Oxford, UK: Wiley–Blackwell.
  6. Siegler, S. (1989). Mechanisms of cognitive development. Annual Review of Psychology, 40:353–379. [crossref]
  7. Bauer, P.J. (2021). We know more than we ever learned: Processes involved in accumulation of world knowledge. Child Development Perspectives, 15(4), 220-227. [crossref]
  8. Bauer, J., Lee, K. A., Dugan, J. A., & Cronin-Golomb, L. M. (2025). Longitudinal predictors of self-derivation through memory integration—A mechanism of knowledge accumulation. Journal of Experimental Child Psychology. Advanced online publication. doi.org/10.1016/j.jecp.2024.106120
  9. Bauer, J., & Jackson, F.L. (2015). Semantic elaboration: ERPs reveal rapid transition from novel to known. Journal of Experimental Psychology: Learning, Memory, and Cognition, 41(1):271-282.[crossref]
  10. Esposito, G., & Bauer, P. J. (2022). Determinants of elementary-school academic achievement: Component cognitive abilities and memory integration. Child Development, 93(6):1777-1792.[crossref]
  11. Esposito, G., & Bauer, P. J. (2024). Self-derivation through memory integration: A longitudinal examination of performance and relations with academic achievement in elementary classrooms. Cognitive Development, 69:101416.[crossref]
  12. Bauer, J., Dugan, J. A., Cronin-Golomb, L. M., Lee, K. A., Del Solar, B., et al.(2024). Development of self-derivation through memory integration and relations with world knowledge. Memory, 32(8), 981-995.[crossref]
  13. Cronin-Golomb, M., & Bauer, P. J. (in press). Longitudinal relations between self-derivation and semantic knowledge growth. Journal of Experimental Child Psychology.[crossref]
  14. Shing, Y. L., Finke, C., Hoffmann, M., Pajkert, A., Heekeren, H. R., & Ploner, C. J. (2019). Integrating across memory episodes: Developmental trends. PLOS ONE, 14(4), [crossref]
  15. Bauer J., & Larkina, M. (2017). Realizing relevance: The influence of domain- specific information on generation of new knowledge through integration in 4- to 8-year-old children. Child Development, 88:247-262. [crossref]
  16. Bauer, J., & San Souci, P. (2010). Going beyond the facts: Young children extend knowledge by integrating episodes. Journal of Experimental Child Psychology, 107(4):452-465.[crossref]
  17. Esposito, A. G., & Bauer, P. J. (2017). Going beyond the lesson: Self-generating new factual knowledge in the classroom. Journal of Experimental Child Psychology, 153:110-125.
  18. Miller-Goldwater, E., Williams, B. M., Hanft, M. H., & Bauer, P. J. (2024). Contributions of shared book reading to children’s learning of new semantic facts through memory integration. Early Childhood Research Quarterly; 68:99-111. [crossref]
  19. Cronin-Golomb, M., Pejic, J., Miller-Goldwater, H. E., & Bauer, P. J. (2024). Factors affecting children’s explicit learning and productive memory processes in the context of virtual museums. Cognitive Development; 71: 101454.[crossref]
  20. Wilson, J. T., & Bauer, P. J. (2024). Generative and active engagement in learning neuroscience: A comparison of self-derivation and rephrase. Cognition, 245:105709. [crossref]
  21. Varga, L., & Bauer, P. J. (2017). Young adults self-derive and retain new factual knowledge through memory integration. Memory & Cognition, 45:1014-1027.
  22. Gathercole, E., Pickering, S. J., Knight, C., & Stegmann, Z. (2003). Working memory skills and educational attainment: Evidence from national curriculum assessments at 7 and 14 years of age. Applied Cognitive Psychology, 18:1-16.
  23. Serpell, N., & Esposito, A. G. (2016). Development of executive functions: Implications for educational policy and practice. Policy Insights from the Behavioral and Brain Sciences, 3:203–210.
  24. Alloway, P., & Alloway, R. G. (2010). Investigating the predictive roles of working memory and IQ in academic attainment. Journal of Experimental Child Psychology, 106(1):20-29.[crossref]
  25. Bull, , Espy, K. A., & Wiebe, S. A. (2008). Short-term memory, working memory, and executive functioning in preschoolers: Longitudinal predictors of mathematical achievement at age 7 years. Developmental Neuropsychology, 33(3):205–228.[crossref]
  26. Fanari, R., Meloni, C., and Massidda, D. (2019). Visual and spatial working memory abilities predict early math skills: a longitudinal study. Frontiers in Psychology; 10:2460. [crossref]
  27. Schrank, A., McGrew, K.S., & Mather, N. (2014). Woodcock-Johnson IV Tests of Cognitive Abilities. Rolling Meadows, IL: Riverside.
  28. Terman, M., Kohs, S. C., Chamberlain, M. B., Anderson, M., & Henry, B. (1918). The vocabulary test as a measure of intelligence. Journal of Educational Psychology, 9(8):452–466.
  29. Bauer, P. J. (06 May 2020). Bauer Lab Integration and Self-derivation Stimulus (BLISS) bank. PsyArXiv. Doi: 10.31234/osf.io/rv9n7
  30. Woodcock, W., McGrew, K. S., & Mather, N. (2001). Woodcock-Johnson III Tests of Cognitive Abilities. Itasca, IL: Riverside.
  31. Schrank, F. A., & Wendling, B. J. (2018). The Woodcock–Johnson IV: Tests of cognitive abilities, tests of oral language, tests of Contemporary intellectual assessment: Theories, tests, and issues, 4th ed (pp. 383–451). The Guilford Press.
  32. Jaffe, (2009). Development, Interpretation, and Application of the W Score and the Relative Proficiency Index (11; Woodcock-Johnson III Assessment Service). Riverside Publishing.
  33. Mungas, , Widaman, K., Zelazo, P. D., Tulsky, D., Heaton, R. K., et al. (2013). NIH Toolbox Cognition Battery (CB): Factor structure for 3- to 15-year-olds. Monographs of the Society for Research in Child Development, 78:103–118. [crossref]
  34. Smith, C., & Squire, L. R. (2005). Declarative memory, awareness, and transitive The Journal of Neuroscience, 25(44):10138-10146. [crossref]
  35. Varga, N. L., Gaugler, T., & Talarico, J. (2019). Are mnemonic failures and benefits two sides of the same coin?: Investigating the real-world consequences of individual differences in memory integration. Memory & Cognition, 47(3):496-510.[crossref]

Gender, Care, and Mobility: A Practice Approach

DOI: 10.31038/AWHC.2026912

Introduction

Mobility practices have been understood as practices that consume distance [1]. This research note investigates the gender dimensions of mobility practices and their components, as well as their links with sustainability issues. Particular focus is given to car commuting. The context studied is Belgium, a federal country comprising three regions – Flanders, Wallonia, and Brussels – each of which has competence in housing, mobility, and other socio-economic matters. Regarding mobility, rules, signs and even city names can vary between regions, meaning commuters effectively commute between different mobility systems.

In Belgium, most people are mobile (making at least one trip on the reference day): in 2024–25, the average number of trips per day is 3.53 for men aged 18 and over and 3.30 for women of the same ages, with 85% and 82% of men and women respectively making at least one trip on the reference day (Service Public Fédéral Mobilité et Transports, 2025a: 6–7). Most round trips are made mainly by car, with little difference by gender (61% for men and 59% for women). However, women walk slightly more often (23% versus 20% for men) and use local public transport (bus, tramway, or metro) more frequently (6% versus 4%). Meanwhile, men cycle more often (12% versus 10%) and use the train slightly more frequently (3% versus 2%) (Ibidem: 11). Almost four-fifths (78%) of the total daily distance is travelled by car for both men and women (Ibidem: 12). This figure has remained stable for 25 years, despite the increase in cycling (Ibidem: 28). However, men spend more time on daily travel (69 minutes) than women (60 minutes) (Ibidem: 13).

Conceptual Framework: The Social Theory of Practice

As car is the main mode of transport, let us focus on the practice of commuting by car, with reference to the sociological theory of practice. Its main author ([2]: 89) defines a practice as both a performance and a coordinated entity. For him, practice as performance ‘denotes the doing, the actual activity or energization, at the heart of action […] and reminds us that existence is a happening taking the form of a ceaseless performing and carrying out’ ([2], 90). As coordinated entities, practices are ‘open spatial-temporal nexuses of doings and sayings that are linked by arrays of understandings, rules and end-task-action combinations (also emotions and even moods) that are acceptable for or enjoined of participants’ ([3], 15). A practice as a coordinated entity is thus a pattern for action. Understandings refer to the know-how and competences needed to carry out the practice, as well as the mental and bodily routines involved. Rules are explicit, such as ‘principles, precepts, instructions, and the like [which] means that people take account of and adhere to these formulations when participating in the practice’ ([2], 100). Previously, rather than ‘end-task-action combinations’, Schatzki writes about ‘teleo-affective structures’, which he defines as ‘embracing ends, projects, tasks, purposes, beliefs, emotions and moods’ ([2], 89). [4,5], and the same later together with Watson ([6], 82) define materials as a component of a practice. As material arrangements and infrastructures are of special interest for mobility studies based on practice theory, they are included in this research.

When applying the practice theory framework, the practice under study – in this case, commuting by car – is considered the unit of analysis rather than the commuters themselves and their individual characteristics that could explain their behaviour. To understand the difference between a practice and behaviour (as studied in economics, psychology, and geography), it is helpful to make a comparison: behaviour (such as a car journey) is like the visible part of an iceberg, whereas the components of a practice – the understandings, rules, teleo-affective structure, and material arrangements – are the submerged part of the iceberg. Therefore, to understand and possibly change a practice, these components must be studied. The components of the car commuting practice are described in section 4 below. The data and methods used are presented in the following section.

Data and Methods

Along with published statistics, data come from two dozen in-depth interviews conducted with car commuters during the spring of 2022 and 2023. In spring 2022, fuel prices were high. The interviewees represented a variety of ages, genders, locations and car types, whether private or company-owned.

In-depth interviews resemble a conversation between familiar acquaintances, but the interviewer should not know the interviewee beforehand [7]. Open-ended questions allow the interviewee to express themselves, and many follow-up questions help to create empathy. Most interviews were conducted face-to-face, with only a few conducted online by my appropriately trained students. The interviews lasted between 35 and 75 minutes. To ensure comparability between the interviews, a common, detailed interview guide was developed.

All interviews were recorded and then fully transcribed. Based on a content analysis, they were analysed using a common framework based on the concepts of practice theories, particularly to describe and compare the four components that underpin commuting to Brussels by car, whether private or company. Parts of the analysis are derived from [8].

Results

Rules

The company car system replaces part of an employee’s salary by providing them with a car as a form of payment in kind, which they can use for work-related reasons or otherwise [9]. The system has existed in Belgium since the 1970s, and since the 1990s, the company car has often simply been a ‘wage car’. In practice, the company car system is a legal tax avoidance scheme from which both the employer and the employee benefit [9,10]. This form of remuneration is unfair, particularly from a distributional perspective, as neither the employee nor the employer pays tax on this portion of their wages, resulting in the state losing out on tax revenue. In 2007, 272,000 company cars were granted to 7.4% of employees, and this figure increased by around 5% each year, reaching 627,600 cars granted to 14.9% of employees by 2025. However, both figures remained stable between 2024 and 2025 ([11]: 3).

Company cars were more often provided to men in 2010 [9] and 2021 [12]. Among employees with the right to alternative financial benefits in 2023, 16.67% of women have a company car for private use, compared to 27.99% of men ([13]: 34). However, these figures should be adjusted for other factors. For example, it is well established that company cars mainly benefit higher earners (Ibidem, 36), raising issues of social justice [14]. Additionally, women tend to earn less than men. Controlling for income decile, sector of activity, age group, number of workers, and status (white- versus blue-collar), men are 1.85 times more likely than women to have a company car for private use ([13]: 77).

Since 2019, the mobility budget has set new rules to correct the fiscal advantages of company cars. It proposes alternatives to employees in the form of in-kind benefits, such as a budget for public transport, electric scooters or bicycles, smaller and less expensive company cars, and, under certain conditions, a housing cost contribution. The mobility budget can also be used as a wage supplement for the remaining part, if any [15]. Although the adoption of the mobility budget has been slow, it is increasing. Most beneficiaries choose other benefits over a company car. In 2022, there were 4,865 beneficiaries of a mobility budget who did not receive a company car. This figure increased to 9,592 in 2023 and 17,157 in 2024 ([11]: 4). In 2023, 60% of all beneficiaries of a mobility budget were men, enjoying an average financial advantage of €7,263, while 40% were women, enjoying a lower advantage of €6,660 [13]: 46). Thus, among employees granted a company car or a mobility budget, women are more likely to choose a more environmentally friendly option.

Material Arrangements

As [8] describe in detail, there are some significant material differences between commuting by private car and commuting by company car: the characteristics of the car used – company cars are generally larger and more powerful than private cars ([16]: 8), places for refuelling and repairs (specific garages for company cars). Although the same network of highways and roads is used, commuting with a company car involves longer journeys. Company cars are often granted a ‘free’ petrol or diesel card. To the best of my knowledge, there are no gender-specific statistics for any of these aspects.

Company cars offer better protection in the event of a road accident [17]. Women are less likely to be involved in road accidents than men at all ages below 65. As ([16]: 15) shows, men driving company cars are much more often involved in road accidents than men driving private cars, especially between the ages of 25 and 59. The figures are more similar and lower for women, except after the age of 55, when there is a higher incidence of road accidents involving women driving private cars. Regarding accidents involving bodily injury, 3.8 deaths occur among occupants of company cars compared to 8.8 in private cars. However, company cars cause more serious damage to third parties: 6.8 deaths as opposed to 5.0 deaths caused by private cars ([16]: 16). There are no gender-specific statistics regarding injuries.

Understandings

No difference in driving or navigation skills was found among our interviewees of different genders. Among those who commute by private car, men may have more knowledge and practice of economical driving, although our sample is too small to be conclusive in this respect. Those commuting by private car are more familiar with public transport alternatives than those travelling by company car, but there is no gender difference in this regard.

Some pragmatic versatility – taking the train once in a while for example – is shown by several women of all ages among our interviewees and by a few young men, whether they use their private car or a company car. Women thus seem to have more environmentally friendly practices than men, but this should be confirmed, or not, with a larger sample size.

Teleo-affective Structure

Autonomy, social success, efficiency, and safety are the four values structuring the practice of commuting by car. All are enhanced if commuting by company car.

Women place greater importance on flexibility and time-saving when using a car. In particular, the mothers in the sample consider the car to be essential for fulfilling their responsibilities, such as taking the children to school or their activities. [18] also highlight the dependence of mothers on cars for childcare-related tasks. Therefore, gender roles also structure mobility practices.

In addition, women attach greater importance than men to the fact that the car provides a sense of security, particularly at night and/or in areas deemed insecure, such as near large train stations.

Concluding Discussion: Gender and Environmentally Friendly Practices

As this research shows, women are less likely to have powerful vehicles or SUVs than men because they are less likely to benefit from a company car. Furthermore, when given the option of a mobility budget, women are more likely to choose this than men. Additionally, women appear to demonstrate greater pragmatic versatility, such as occasionally taking the train, than men, although this result requires confirmation with a larger sample size. Thus, women appear to engage in more environmentally friendly practices than men. However, in order to fulfil their gender role as mothers, women rely on cars, which are seen as a necessity. According to [19], representations of gender roles relating to obligations towards children and family are stronger for mothers than for fathers.

MacGregor analyses the increased gender differentiation in institutional and individual responses to climate change both as ‘a masculinization of environmentalism’ and what she calls ‘ecomaternalism’ ([20]: 128, 136). For her, “[i]n so far as consumption is a private sphere activity, and women tend to be principally responsible for household consumption, it is likely that exhortations to ‘live green’ are directed at (and will be received primarily by) women. Men may hear them, but expect women to do the work” ([20]: 134). Her examples are conserving energy, taking public transportation, recycling waste and avoiding flights.

[21] in the UK and [22] in Belgium found that women engaged in more ‘green’ practices than men. Men use more energy than women, particularly in terms of mobility and meat consumption [23]. When it comes to changing practices, [24] notes that ‘the lifestyle changes were gender-biased, with the women as driving forces but also bearing most of the extra workload’.

More sustainable mobility practices, by train or by cycling for example, were also found to be ‘compensatory practices’: some mothers reported that they could only compensate the lack of environmentally friendlier actions of their family members by changing their own practices, here for their daily trips. [25].

Overall, a practice-based approach to car commuting, combined with a gender analysis, has yielded significant findings. While women may exhibit certain mobility practices that are slightly more sustainable than men, even in the case of car commuting, for care-taking trips, cars remain a crucial necessity. The apparent conflict between caring for children and caring for the environment is thus a salient concern.

In the future, more statistics on mobility should be published by gender. Further research on a larger sample would be necessary to investigate knowledge of and practice in economical driving, pragmatic versatility, and the material arrangements and policies governing compatibility between caring for others (namely children) and caring for the environment [26,27].

References

  1. Heisserer B, Rau H (2017) Capturing the consumption of distance? A practice-theoretical investigation of everyday travel. Journal of Consumer Culture 17(3): 579-599. DOI: 1177/1469540515602304.
  2. Schatzki T (1996) Social Practices: A Wittgensteinian Approach to Human Activity and the Social. Cambridge: Cambridge University Press.
  3. Schatzki T (2015) Practices, governance and sustainability. Strengers Y, Maller C (eds.) Social Practices, Intervention and Sustainability: Beyond Behaviour Change 15-30. Abingdon: Routledge.
  4. Reckwitz A (2002) Toward a theory of social practices: A development in culturalist theorizing. European Journal of Social Theory 5(2): 243-263.
  5. Shove E, Pantzar M (2005) Consumers, producers and practices: Understanding the invention and reinvention of Nordic walking. Journal of Consumer Culture 5(1): 43-64.
  6. Shove, E, Pantzar M, Watson M (2012) The Dynamics of Social Practice: Everyday Life and How It Changes. Thousand Oaks, CA: SAGE.
  7. Kaufmann, J.-C (2016) L’entretien compréhensif. Paris: A. Colin.
  8. Bartiaux F, Habay A (2024) Commuting by car to Brussels: Insights from theories of practice. Norsk Geografisk Tidsskrift-Norwegian Journal of Geography 78(5): 1-17.
  9. May, X, Ermans T, Hooftman N (2019) Company Cars: Identifying the Problems and Challenges of a Tax System, Brussels Studies.
  10. Courbe P (2022) Le tabou des voitures de société. Politique 121: 35-39.
  11. Service Public Fédéral Mobilité et Transports (2025b) Voitures de société et budget mobilité en Belgique en 2025. https://mobilit.belgium.be/fr/publications?f%5B0%5D=b_publications_domains%3A203&f%5B1%5D=date_day%3A2025-09-18&f%5B2%5D=date_month%3A2025-09&f%5B3%5D=day_year%3A2025&f%5B4%5D=type%3A27
  12. Office National de Sécurité Sociale (2022) Évaluation des différents systèmes de rémunérations alternatives existants. Volet 3: Données salariales 2021. https://shorturl.at/9vCtr(accessed 8 August 2024)
  13. Office National de Sécurité Sociale (2025) Évaluation des différents systèmes de rémunérations alternatives existants. Volet 6: Données salariales 2023. https://shorturl.at/O7A9D(accessed 9 February 2026)
  14. da Schio N, Van Eenoo E, Caset F, Vanparys L, Bartiaux F, et al (2023) Why and how we should mainstream social justice in the car-restrictive policy agenda. BSI Position Papers, no 6, 13/11/2023.
  15. Securex (2024) Budget mobilité. https://www.securex.be/fr/politique-rh/mobilite/budget-mobilite (accessed 9 March 2024)
  16. Lambert M (2023) La voiture de société et la sécurité routière. Brussels: Institut VIAS. https://shorturl.at/kF4Kz(accessed 9 February 2026)
  17. Nuyttens N, Ben Messaoud Y (2023) Impact des caractéristiques des véhicules sur la gravité des lésions des occupants de voiture et de la partie adverse. Rapport n° 2023-R-17-FR. Brussels: Institut Vias.
  18. Demoli Y, Gilow M (2019) Mobilité parentale en Belgique: question de genre, question de classe, Espaces et Sociétés 176-177: 137-154.
  19. Southerton, Dale (2006) Analysing the Temporal Organization of Daily Life: Social Constraints, Practices and Their Allocation, Sociology 40(3): 435-454,
  20. MacGregor S (2010) A stranger silence still: The need for feminist social research on climate change. The Sociological Review 57(2): 124-140.
  21. Gilg, A, Barr S, Ford N (2005) Green consumption or sustainable lifestyles? Identifying the sustainable consumer, Futures 37(6): 481-504.
  22. Bartiaux F, Reátegui Salmón L. A (2012) Are there domino effects between consumers’ ordinary and ‘green’ practices? An analysis of quantitative data from a sensitisation campaign on personal carbon footprint, International Review of Sociology 22(3): 463-482.
  23. Räty R, Carlsson-Kanyama A (2010) Energy consumption by gender in some European countries, Energy Policy 38(1): 646-649.
  24. Svensson E (2012) Achieving sustainable lifestyles? Socio-cultural dispositions, collective action and material culture as problems and possibilities, Local Environment 17(3): 369-386.
  25. Bartiaux F, Reátegui Salmón LA (2014) Family Dynamics and Social Practice Theories: An Investigation of Daily Practices Related to Food, Mobility, Energy Consumption and Tourism, Nature and Culture 9(2): 204-224.
  26. Gilow M (2015) Travelling in Brussels and feeling unsafe: Women’s perceptions and strategies. Brussels Studies.
  27. Service Public Fédéral Mobilité et Transports (2025a) Enquête fédérale sur la Mobilité en Belgique. https://mobilit.belgium.be/fr/publications?f%5B0%5D=b_publications_domains%3A203&f%5B1%5D=date_month%3A2025-11&f%5B2%5D=day_year%3A2025&f%5B3%5D=type%3A27

Planning for Women’s Health and Wellbeing in the City: the Birmingham for People Women’s Group

DOI: 10.31038/AWHC.2026911

Abstract

The impact of the built environment on health outcomes has been long recognised [1,2], however the gender dimensions of this remain underexplored. This article uncovers the hidden history of a group of women who came together in Birmingham (England) in the 1990s to campaign for a city that would suit the needs of women. This summary of the women’s work highlights the need, then and now, for women’s views to be taken into account in the planning process. This experience shows that including women’s voices in the planning system is not only vital to ensure women’s equal access to public space, city resources and opportunities, but also has potential health benefits. We highlight two aspects of their work relevant to health: the importance of safety in urban planning, and the importance of women’s collective involvement in decision-making for positively reinforcing their self- confidence, well-being and mental health.

Keywords

Community-led planning, Women’s histories, Urban planning, Feminist planning, Health, Wellbeing; Participation

The impact of the built environment on health outcomes has long been recognised. As long ago as 1898, with the founding of the Garden City movement, Ebenezer Howard was advocating for an antidote to the ‘dark satanic mills’. Fast forward to this century and the Marmot review reinforced the role of the built environment in promoting or restricting healthy lifestyles [2]. However, the gender dimensions of the impact of planning and the environment on health and wellbeing remained underexplored (Brennan undated;[3]). This is despite research which highlights the differential experience of the built environment between men and women [4-6] and despite decades of action by women to improve urban spaces [7,8]. This piece reveals the hidden history of one such group and the relationship between two aspects of their work and public health impacts.

In the 1990s a group of women came together in Birmingham (England) to campaign for a city that would suit the needs of women. Central to their work was an emphasis on safety, in the context of the city that had been redeveloped in the 1970s on the model of the male commuting businessman, rather than to meet the everyday needs of the women who lived and worked there. This was manifested most prominently in the dangerous and disorienting subways that pedestrians had to access up and down steps in order to reach the city centre, going under the urban motorway Ring Road that encircled it. Recent reports have highlighted the impact of unsafe spaces on women’s physical and mental health [9,10], but women have been aware of this for decades. From 2022-2024 we conducted historical and archival participatory research unearthing the work in the 1990s of Birmingham for People (BfP) Women’s Group, as part of the Spaces of Hope project that explored the hidden histories of community-led planning across the four nations of the UK [11,12]. The built environment is an upstream determinant of health and this summary of the women’s work highlights the need, then and now, for women’s views to be taken into account in the planning process. It also highlights the importance, further downstream, of women being given a voice in the context of collective activism for their health and wellbeing.

BfP Women’s Group emerged from a broader community campaign called Birmingham for People who were campaigning for a more people-friendly redevelopment in Birmingham City centre. Whilst this brought together a committed group of planners, architects, market traders and community organisers, the women in the group realised at the very first meeting in 1989 that their voices and needs were not being heard. In response they set up a sister group which for the next five years worked relentlessly to push for women’s needs to be recognised and met by the city planners. Women across the UK had already begun to fight for women’s voices and needs to be included in a planning system that was typically gender blind, with a negative impact on women’s access to and experience of public space [4-6,13]. This led to the emergence of a Women in Planning movement in the mid 1980s, was manifested in the establishment of bodies such as the Women’s Design Service (WDS) in London in 1987, and the inclusion of Women’s Committees and Women’s Units in the more progressive Local Authority planning departments, including in Birmingham.

Right from the beginning women’s health and wellbeing were central to BfP Women’s Group’s work, which was evident in their key focus on safety campaigns, as well as pushing for the spaces that women needed. So, on the one hand they focused on making the city’s public spaces and transport safer for women, such as calling for the subways, multi-storey car parks and bus stops to be better lit; and on the other hand they attended to the embodied needs of women, pushing for more breast feeding areas and more public toilets (see Figures 1 and 2).

Figure 1: Cover of BfP Women’s Group’s report on women’s public toilets in Birmingham. Courtesy of BfP Women’s Group.

Figure 2: Birmingham for People News promotes the women’s group’s work. Courtesy of Birmingham for People Group.

One BfP Women’s Group member, Tonia Clark, explains how the focus on safety incorporated both the physical and emotional, and was connected to women’s typical role as carers,

“We did a lot of work on community safety – both feelings of safety and the changes needed to the built environment to make them actually safer. This was central to health in terms of a lower risk of attack or rape. We looked at physical space in terms of safety and I think feelings of wellbeing were part of this. When women have a voice in planning and in urban design they will design spaces that improve wellbeing – partly I think because of their need to create positive spaces for their children and dependent elders.”

From the start it was apparent that as well as making demands for a more women -friendly built environment, the processes of involvement and advocacy brought other benefits, both with potential health impacts. Karen Garry was the first paid worker for the group, and the central remit of her job was to build relationships with the City Council and influence council policies,

“it was a fabulous first job out of university for me… here was a chance to be right in the middle of my city. You know, I was really, really very passionate about it.”

At the time the City Council was pedestrianising the main streets in Birmingham, and BfP Women’s Group looked at women’s physical access around Birmingham city centre, particularly thinking about women with children and push chairs, which also worked to improve access for people using wheelchairs.

Karen worked with the council’s Community Safety Unit and the planning and architecture department, supported by the council’s newly-established Women’s Unit. Through this she made contact with Jeanette Arregger, who was seconded from the council as a community architect, and together they worked on the Bloomsbury estate in Nechells, a housing estate undergoing regeneration. Karen describes it as,

“a typical 1960s estate. Lots of dead end alleys, lots of overhanging bushes. Lots of lighting that’s not working. Lots of steps, lots of underpasses”

The estate already had a resident-led management board, but again dominated by men, so Karen and Jeanette pulled together a group of women residents on the estate, which became the Safe Estates for Women (SEW) group,

“We walked around the estate, and the women mapped it, and they said these are areas that we go to, these are areas that we don’t go to. This is where we’ll let our children play. And they did it from their point of view. They also identified their desire paths” (Karen).

To ensure the women’s views translated into action, Karen and Jeanette built strong relationships between SEW and the City planning department, as well as with local service providers such as the police, the council’s Community Safety Unit, Highways, Lighting and Maintenance teams and with Councillors, who they showed round the estate, “going around with clipboards, finding all the nasty areas on the estate that were just unsafe basically” (Jeanette). The relationships were built over several years and the women had a hotline to the relevant bodies to report issues, “they used to report lights going out and uneven paving slabs and all that tasking kind of thing. And they did get changes on the estate as a result of their work” (Karen) (see Figures 3 and 4).

Figure 3: Women residents auditing the Bloomsbury estate. Photo courtesy of Jeanette Arregger.

Figure 4: The Bloomsbury estate women residents and BfP Women’s Group photographed unsafe areas of the estate. Photo courtesy of Jeanette Arregger.

The methods used on the estate were developed into a Safety Audit tool that was then used by women across the city to gather evidence about their environment and lobby for change. The work of SEW on the estate also led to the setting up a more strategic city-wide body called the Women’s Safety Initiative (WSI). Karen convened its Women and Safety in the Built Environment Task Group, which brought women representing various bodies across the city together, including the City Planning Department, the voluntary sector, the Police Community Safety Unit, BfP Women’s Group, SEW and the West Midlands Passenger Transport Executive. This cross-sectoral group was able to effectively push for women’s perspectives to be taken on board in policy decision-making. Thus they had influence on city-wide issues such as anti-social behaviour, police safety initiatives and planning issues such as improved design and pedestrianisation, ultimately contributing to the break up of the Inner City Ring Road with surface-level crossings. BfP Women’s Group also benefited from a grant from the Home Office Safer Cities project, set up in 1988 by the Conservative government and launched in Birmingham with a £250,000 budget for three years to fund crime prevention schemes, a multi-agency approach and to work with existing locally-run schemes (see Figure 5).

Figure 5: Birmingham for People News, publicising the women’s work for the Forum on Women’s Safety and SEW, supported by the Home Office Safer Cities project. Courtesy of Birmingham for People Group.

The building of relationships, between BfP Women’s Group and the residents, between residents and the relevant authorities, and between the city partners, took time, which was in part about building trust and confidence. Karen says of the women residents in Nechells, “It took time for that to build up really, for the women to have confidence”. BfP Women’s Group even fundraised for one of the residents, Jo Townsend, to present their estate work as a case study at a conference in San Francisco. Jo describes how important this was for her self-confidence,

“I’ve never flown before…For me personally, it was quite amazing. It was another building of confidence moment because of getting up and speaking in front of people… it was a really big step for me… quite nerve wracking. But it definitely helped build my confidence”

The BfP Women’s Group members also spoke of how important their work was for positively reinforcing their self-confidence and well-being, and indeed how important community activism is for women’s health in general. Polly Feather, a volunteer, says

“My over-riding belief is that most forms of community and grass-roots engagement and activism, where people who perceive themselves as being ‘without a voice’ do actually acquire a voice and make themselves heard, are health-giving to those involved. By ‘health’ in this context I mean mostly mental health. Any improvement in self- esteem and self-confidence is by definition a strengthening process, even leaving aside the possible beneficial outcomes that the activism has been aiming for. These ideas apply particularly to women’s activism. Hence I believe that for myself, getting involved in campaigning for change in the attitudes and practice of the world of Planning and the Built Environment was a much healthier behaviour than not engaging and feeling frustrated, ignored & dismissed. I think others in the BfP Women’s Group would subscribe to this view too.”

Through her experiences as a community architect on the Bloomsbury estate, Jeanette Arregger joined BfP Women’s Group as a volunteer, and she reflects on the importance of being part of a women-only group for her health. Throughout her career she had undiagnosed ADHD and says she struggled to make her voice heard, especially in groups and committees, and in the context of a male- dominated patriarchal society,

“I was terrified of saying the ‘wrong thing’ and found those situations extremely stressful. Birmingham for People Women’s group offered a supportive group where my ideas were listened to and taken seriously. Knowing that the group supported my ideas gave me the confidence to set up the Women’s Safety Group in Nechells with their help, and to promote the Women’s Safety Group at the Bloomsbury Estate Management Board and the Heartlands Development Corporation. With both organisations, I had to attend all male or male dominated meetings and raise issues that were not necessarily prioritised. So having a supportive group behind me encouraged me to promote other women too. My mental health must have benefitted from their support as my role as Community Architect was quite an isolated one. As the BFP Women’s Group grew in stature we were able to attract interest from the planning department and West Midlands transport and were included in consultation. We interviewed Les Sparks, head of Planning at Birmingham City Council, for a video and were able to influence the renewal of the City Centre that all added to the strength and status of the group and individuals in it. The support of the group extended to long term friendships and Karen Garry was a really great and supportive friend to me. I think that having a “cause” to fight for brought us closer as a group.”

This highlights the affective dimension of being part of a supportive group, particularly important to consider in the context where a person’s identity (in this case as a woman) is not the model upon which decisions are made. It also has crucial impacts where your positionality (such as being a woman, living in poverty or suffering a health condition) can erode your mental health and confidence to speak out. This was evident as Jeanette describes how the Bloomsbury women residents who joined SEW also benefitted from the support of a local group where they felt safe to express their feelings and personal situations, as well as their opinions about the public good,

“where they could discuss their fears and problems with negotiating the immediate environment and their frustrations with getting their voices heard by the local authority. One woman who was disabled could not use a bath and the local authority didn’t want to remove the bath as a future tenant may need it. We were able to negotiate with them to get her a shower. Some of the women who joined the group struggled with poverty and ill health and the isolation of living on a large housing estate, but gained confidence and optimism from being listened to and seeing small improvements being made to their environment. One woman volunteered to take the minutes of the meetings and as a result grew in confidence enough to apply for and get a job at the Development Corporation.”

Several of the women went on to take what they had learned with BfP Women’s Group into other workplaces, some specifically in health, such as Karen,

“it was a fantastic opportunity, it opened my eyes to all sorts of possibilities around people having a voice and being able to influence things and that’s never gone away for me. After Birmingham for People, I worked on a regeneration project in inner city Birmingham, City Challenge, on the health side of one of those massive area regenerations that happened in the early ‘90s. And currently I am working in an NHS environment on still the same topics, really”

The work that Birmingham for People Women’s Group did clearly centres safety in urban planning as a crucial upstream determinant of women’s health, and the importance of understanding health inequities in relation to gender, as well as to disability and class. Further downstream, the importance of women having a voice, being involved in activism and decision-making, and being part of a women’s group in order to further such participation, is also crucial for positively reinforcing self-confidence, mental health and wellbeing. Creating the conditions to enable participation as a way to address health inequities is increasingly being recognised by both researchers and public health agencies [2,14]. And, as the women’s work here indicates, integral to creating those conditions is understanding the ways in which gendered and other marginalised identities can be better enabled to participate. We need to learn the lessons from these types of projects and carry them forward, as well as continuing to engage in more research focusing on the relationship between women’s health and the built environment, and women’s health and their participation in community activism and public-health decision-making.

Acknowledgements

The Spaces of Hope research was funded by an AHRC grant number AH/T00729X/1

Thanks to all the women who participated in the Spaces of Hope research, including Jeanette Arregger, Tonia Clark, Polly Feather, Mary Fielding and Jo Townsend. And special thanks to Karen Garry who made a crucial and exceptional contribution to the BfP Women’s Group. Karen sadly died last year.

No conflict of interest.

References

  1. Howard E (1898) Tomorrow; A Peaceful Path to Real Reform.
  2. Marmot M, Allen,J, Boyce T,Goldblatt P, Morrison J (2020) Health Equity in England; The Marmot Review 10 years BMJ, 368: m693. [crossref]
  3. Kettel B (2020) Women, health and the environment. Women, Medicine, Ethics and the Law, pp: 23-35.
  4. Greed CH (1994) Women and Planning: creating Gendered Routledge: London, New York.
  5. Little J (2002) Women, planning and local central relations in the In Gender, planning and human rights (pp: 25-38) Routledge.
  6. Horwood K (2022) Women and planning: developing the Town Planning Review 93(6): 571-573.
  7. Wall C (2017) Sisterhood and squatting in the 1970s: feminism, housing and urban change in History Workshop Journal 83(1): 79-97. Oxford University Press.
  8. McGiveron K (2023) ‘Notes on a Community Struggle’ Big Flame, the Kirkby rent strike and the ‘mass struggle of housewives’, Women’s History Review 32(4): 517-539,
  9. Arup, University of Liverpool &UNDP (2022) Cities Alive; Designing citiest hat works for women https://www.undp.org/publications/cities-alive-designing-cities- work-women
  10. Barker A Holmes G Alam R et al et al.(2022) What Makes a Park Feel Unsafe, West Yorkshire Combined authority, available at https://eprints.whiterose.ac.uk/id/ eprint/194214/1/Parks Report FINAL 7.12.2022.pdf accessed on 3 Feb 2026
  11. Humphry D, Brownill S (2025) Women in the centre: dialogue on past and present community-led planning in Birmingham (UK) City 29(5–6): 1118–1132.
  12. Inch AS, Brownill Humphry, Broomfield D (2025) “Uncovering Hidden Histories of Community-Led Planning.” Chapter 12 In New Planning Histories, edited by L. Andres Y. Beebeejaun, and Y. Rydin, 199–214. Palgrave MacMillan.
  13. Greed CH (2003) Women and planning: creating gendered Routledge.
  14. Baxter S, Barnes A, Lee C, Mead R, Clowes M (2023) Increasing public participation and influence in local decision-making to address social determinants of health: a systematic review examining initiatives and theories. Local Government Studies 49(5): 861-887.

Vascular Disease as a Consequence of Impaired Endothelial Redox Adaptation

DOI: 10.31038/JCRM.2026911

Abstract

Endothelial dysfunction plays a central role in cardiovascular and cerebrovascular disease, but its portrayal as a simple imbalance associated with oxidative stress and nitric oxide (NO) deficiency has somewhat hindered therapeutic progress over the years. Accumulating evidence supports a conceptual shift towards endothelial redox plasticity, the capacity of vascular endothelium to dynamically regulate NO synthase activity and reactive oxygen species (ROS) production during various physio-pathological processes, including growth, repair, and ageing. Experimental, genetic, and clinical data exhibit that ROS are required for physiological adaptation, and that pathology emerges from a regulatory imbalance rather than oxidative stress alone. Mechanistic studies have further exhibited that redox-sensitive signalling networks tightly coordinate endothelial survival, mitochondrial function, and inflammatory activation, reinforcing the concept that oxidative signalling is integral to vascular homeostasis rather than merely deleterious. Distinct vessel-specific redox profiles, microenvironmental factors, progenitor cell dysfunction, and cellular senescence further determine vascular resilience. Hence, restoration of redox adaptability offers a sound foundation for precision vascular therapies.

Introduction

Endothelial dysfunction, characterised by impaired endothelium-dependent vascular relaxation, remains a central concept in the pathogenesis, progression, and exacerbation of cardiovascular and cerebrovascular disease [1,2]. However, its underlying mechanistic framework has changed remarkably little over the past few decades. Oxidative stress, stemming from an imbalance between pro-oxidant and antioxidant bioavailability and the consequent reduction in nitric oxide (NO) levels, has long been regarded as a principal driver of endothelial dysfunction [1]. Inevitably, this oversimplified view of endothelial dysfunction has contributed to the translational failures observed with antioxidant therapies over the years [3]. We propose that a more accurate interpretation, supported by experimental, genetic, and clinical evidence, is that vascular disease reflects a profound disruption of endothelial redox plasticity, defined as the capacity of endothelial cells to dynamically coordinate NO synthase (NOS) activity and reactive oxygen species (ROS) signalling in response to diverse physio-pathological processes such as growth, injury, and ageing.

Redox Regulation and Endothelial Growth

Early mechanistic studies revealed a close interplay between endothelial cell growth and redox regulation. In coronary endothelial cells, NOS and NAD(P)H oxidase appear to regulate proliferation and survival in a coordinated manner, rather than acting in opposition [4]. Subsequent studies demonstrated that the state of endothelial cell growth directly regulates the expression of a functionally critical NAD(P)H oxidase subunit, p22-phox, a membrane-bound subunit also required for enzymatic stability [5]. These findings refute the notion that ROS generation is inherently pathological and highlight the role of ROS as critical signalling mediators during endothelial adaptation and angiogenesis. These in turn suggest that the problem lies in the loss of regulatory balance, rather than in the bioavailability of ROS.

Experimental studies have further shown that endothelial redox signalling interacts with mitochondrial dynamics and apoptotic pathways, linking ROS generation to cell cycle progression and cell survival decisions [6,7]. Additional evidence demonstrates that ROS genetaed by NADPH oxidase modulate cardiomyocyte and endothelial growth responses in a context-dependent fashion, reinforcing the notion that tightly controlled oxidative signalling is critical for adaptive vascular remodelling [8].

However, in pathological conditions such as diabetes and hypertension, ROS signalling becomes poorly controlled, leading to endothelial NOS (eNOS) uncoupling. This process is accompanied by excessive production of superoxide anion (O2), the foundation molecule of all ROS and reduced NO bioavailability [9].

Angiotensin II exemplifies the dual nature of redox signalling within the vascular endothelium. As the key effector peptide of the renin-angiotensin-aldosterone system (RAAS), angiotensin II plays a central role in the regulation of blood pressure, vascular tone, fluid balance, and electrolyte homeostasis [10]. Beyond its well-documented classical haemodynamic actions, angiotensin II modulates intracellular and intercellular signalling pathways, particularly those mediated by ROS and NO. Through these interactions, it exerts context-dependent effects on endothelial cell function.

Notably, the influence of angiotensin II on NO generation changes according to the physiological state of the endothelium. In proliferating or remodelling endothelial cells, such as during angiogenesis or vascular repair, angiotensin II can induce a transient increase in ROS production. Under these conditions, ROS act as second messengers that activate redox-sensitive signalling cascades, supporting endothelial adaptation, cell migration, proliferation, and survival. In this adaptive setting, tightly regulated ROS production facilitates coordinated vascular growth and repair rather than eliciting injury.

Contrary to this, in quiescent or resting endothelial cells, sustained exposure to elevated levels of angiotensin II tilts the redox balance towards oxidative dominance. Chronic stimulation of NADPH oxidase leads to increased generation of O₂⁻ which rapidly reacts with NO to form another ROS called peroxynitrite and as a result reduces NO bioavailability and compromises vasodilatory, anti-proliferative, anti-aggregatory and anti-inflammatory functions. Moreover, peroxynitrite and related oxidative modifications promote eNOS uncoupling thereby inducing even more O₂⁻ production, exacerbating oxidative stress and establishing a self-perpetuating cycle in which ROS generation continues to rise at the expense of protective NO signalling [9,11,12].

Earlier human and experimental studies in hypertension similarly demonstrated that angiotensin II-driven oxidative stress impairs endothelium-dependent relaxation and enhances vascular superoxide production, thereby linking RAAS activation directly to functional endothelial decline [13,14].

Taken together, data from studies of angiotensin II illustrate that endothelial dysfunction does not result from ROS overproduction, but from an inability to effectively control redox balance in a context-dependent manner. Under physiological conditions, endothelial cells preserve NO-mediated vascular relaxation and equilibrium by meticulously regulating the balance between ROS and NO signalling and thus enabling short-lived oxidative signals to facilitate adaptive responses. However, when this regulatory flexibility is disrupted, such as during sustained activation of the RAAS activation in hypertension or metabolic disease, the redox balance cannot be appropriately adjusted. As a consequence, the endothelium becomes trapped in a persistent pro-oxidant state characterised by diminished NO bioavailability and elevated oxidative stress status. This loss of redox adaptability ultimately drives the progression from adaptive signalling to endothelial damage and vascular dysfunction.

Genetic Determinants of Basal Redox Tone

In this context, the findings of a previous genetic study were particularly important [15]. Rather than focusing on the consequences of acute activation of the pro-oxidant enzyme NADPH oxidase, this study investigated functional polymorphisms in the p22phox subunit encoded by the CYBA gene. The study showed strong associations between specific CYBA variants, vascular oxidative stress phenotypes, and cardiovascular risk. Allelic variants linked to enhanced enzymatic activity were associated with attenuated endothelium-dependent relaxation. This was in accordance with greater O2 generation and reduced NO bioavailability. These findings suggest that inherited differences in ROS-producing capacity can establish a basal vascular redox tone, predisposing certain individuals to oxidative imbalance and rendering them more susceptible to endothelial dysfunction even before environmental and haemodynamic stressors, such as hypertension, smoking or diabetes, are superimposed.

Genetic evidence further corroborates this adaptive redox framework. Namely, polymorphisms in the eNOS gene have been linked with ischaemic heart disease risk, signifying the importance of endogenous NO production in vascular health and protection [16]. Allelic variants that affect eNOS expression, enzymatic activity, and/or susceptibility to uncoupling may diminish capacity to preserve NO signalling in settings associated with oxidative stress. Taken together with functional polymorphisms that induce excessive ROS production, a coherent picture emerges in that cardiovascular risk reflects the cumulative impact of genetically determined redox imbalance. In this model, predisposition to vascular disease is not triggered by a single defective mechanism, but by the combination of genetically determined reductions in NO bioavailability and elevations in oxidative status which significantly lower the threshold for vascular dysfunction in the presence of environmental and haemodynamic modifiers.

Gene–Environment Interactions in Vascular Disease

Genetic susceptibility becomes clinically relevant only when combined with adverse environmental influences. Ex vivo studies of human vessels have shown that endothelium-dependent relaxation in saphenous vein grafts and internal mammary arteries varies markedly according to sex, smoking status, hypertension, and diabetes [17]. Among these factors, smoking and hyperglycaemia enhance NADPH oxidase activity and promote eNOS uncoupling, whereas hypertension sustains angiotensin II–driven oxidative signalling. Through increased ROS generation, eNOS uncoupling, and persistent neurohormonal activation, these conditions directly impair endothelial integrity and function [2,18]. In individuals who are genetically predisposed, particularly those carrying high-activity variants of the CYBA gene or less effective alleles of the eNOS gene, such environmental stressors may overwhelm intrinsic redox-regulating mechanisms. The resulting imbalance can lock the vasculature into a maladaptive pro-oxidant state, thereby accelerating the progression toward ischaemic vascular disease.

Notably, vascular beds do not share the same structural and functional characteristics. For instance, vascular smooth muscle cells from internal mammary artery (IMA) exhibit greater intrinsic antioxidant capacity and reduced migratory capacity compared to their counterparts from other conduit vessels. These inevitably account, at least in part, for IMA’s superior long-term graft patency [19]. This inherent resistance to oxidative stress and pathological remodelling may help explain why the IMA is considered as the best conduit for coronary artery bypass grafting. These important findings imply that intrinsic, vessel-specific redox phenotypes, rather than systemic risk factors only, play a decisive role in determining vascular resilience to atherosclerotic disease. Susceptibility to oxidative injury and maladaptive remodelling is therefore, to a degree, intrinsically determined within the vascular wall itself. Therapeutic strategies that overlook this biological heterogeneity and treat the vasculature as a uniform system may be limited in their efficacy and fail to provide appropriate or long-lasting protection.

Endothelial Progenitor Cells and Impaired Vascular Repair

The concept of endothelial redox plasticity also extends to vascular repair mechanisms. Endothelial progenitor cells (EPCs) have emerged as potential biomarkers for the diagnosis and prognosis of ischaemic stroke [20]. EPCs are bone marrow-derived stem cells that play a crucial role in the maintenance of endothelial integrity and function by re-endothelialisation of blood vessels under both physiological conditions and pathological settings such as ischaemic injury [21,22]. Similar to embryonic angioblasts, EPCs possess an intrinsic capacity to circulate, proliferate and differentiate into mature endothelial cells Beyond vascular repair, EPCs can mitigate the detrimental consequences of ischaemic injury by inducing endothelial repair, angiogenesis and vasculogenesis, key physiological processes that are adversely affected by chronological ageing [21,22]. However, EPC dysfunction closely mirrors that of mature endothelial cells, characterised by perturbed NO signalling and increased oxidative stress. Recent work further indicates that oxidative imbalance disrupts EPC mobilisation, differentiation, and paracrine signalling capacity, thereby limiting their regenerative potential and compromising post-ischaemic vascular repair [23].

This parallel deterioration indicates that vascular disease involves not only damage to the endothelium but also a compromised capacity for endothelial regeneration. In this context, reduced NO bioavailability and excessive synthesis and release of ROS adversely influence both resident mature endothelial cells and their progenitors in systemic circulation. The impairment of vascular repair mechanisms reinforces the concept that atherosclerotic and ischaemic vascular disorders may derive from a general failure of redox adaptability rather than isolated or merely structural cellular damage.

Ageing, Senescence, and the Collapse of Redox Flexibility

Ageing represents the ultimate stress test for endothelial redox control. Endothelial cell senescence, characterised by the acquisition of senescence-associated secretory phenotype (SASP), chronic inflammatory and pro-oxidant states, and the breakdown of endothelial barrier integrity and function signals the end of flexible signalling [24]. Recent integrative analyses have highlighted that mitochondrial dysfunction, impaired autophagy, and persistent NADPH oxidase activation collectively drive senescence-associated redox imbalance in ageing vasculature, further supporting the concept that loss of redox plasticity is central to vascular ageing [25].

Recent evidence demonstrates that delaying endothelial senescence helps preserve the integrity of the cerebral vascular barrier and attenuates age-related dysfunction. Treatment with antioxidant vitamins, NADPH oxidase inhibitors and senotherapeutics, including both senolytics (that selectively eliminate senescent cells) and senomorphics (that suppress the SASP without killing the cells) have emerged as promising agents to mediate vascular ageing [26]. These findings propose a rethink of vascular therapeutics and pinpoint a prerequisite to prioritise strategies that can maintain or restore normal endothelial function throughout the lifespan as opposed to focusing on the downstream consequences of vascular disease.

Future Therapeutic Directions

Collectively, the evidence presented in this paper argues against reductionist approaches that target single ROS or isolated redox signalling molecules. This does not imply that oxidative stress is irrelevant despite repeated lack of success in large-scale antioxidant trials. Instead, it indicates that the indiscriminate suppression of ROS impairs physiological endothelial signalling processes. ROS function as seminal signalling molecules in the maintenance of overall vascular tone and homeostasis [1,12]. The assumption that they are merely damaging metabolic by-products is inaccurate. Therefore, broadly neutralising ROS can radically perturb endothelial function instead of restoring it [3].

Future therapeutic strategies should move beyond blanket antioxidant approaches and aim to re-establish redox balance in a more targeted manner. This ranges from preservation of eNOS coupling to maintain NO bioavailability, keeping NAD(P)H oxidase activity within physiological range to maintain necessary ROS signalling, regulating endothelial senescence process, rejuvenating endothelium to increasing both the number and functional capacity of EPCs.

Conclusion

In conclusion, endothelial dysfunction should be reframed as a pathology of redox adaptability. Genetic predisposition, environmental risk factors, cellular growth state, and ageing converge on a common failure to dynamically regulate NO and ROS signalling. Recognising endothelial redox plasticity as the defining feature of vascular health not only reconciles decades of experimental and clinical data, but also provides a rational framework for precision-based therapies in cardiovascular and cerebrovascular disease.

Declarations

Competing Interests

The authors declare that they have no competing interests.

Funding

The authors would like to thank the Turkish Academy of Sciences (TÜBA) for financial support.

Author’s Contributions

UB searched the literature and prepared the manuscript. FG edited the manuscript. Both authors read and approved the final manuscript.

References

  1. Förstermann U, Xia N, Li H (2017) Roles of vascular oxidative stress and nitric oxide in the pathogenesis of atherosclerosis. Circ Res 120: 713-735. [crossref]
  2. Rajendran P, Rengarajan T, Thangavel J, Nishigaki Y, Sakthisekaran D, et al. (2013) The vascular endothelium and human diseases. Int J Biol Sci 9: 1057-1069. [crossref]
  3. Steinhubl SR (2008) Why have antioxidants failed in clinical trials? Am J Cardiol 101: 14D-19D. [crossref]
  4. Bayraktutan U (2004) Nitric oxide synthase and NAD(P)H oxidase modulate coronary endothelial cell growth. J Mol Cell Cardiol 36: 277-286.
  5. Bayraktutan U (2005) Coronary microvascular endothelial cell growth regulates expression of the gene encoding p22-phox. Free Radic Biol Med 39: 1342-1352. [crossref]
  6. Abdullah Z, Bayraktutan U (2016) NADPH oxidase mediates TNF-α-evoked in vitro brain barrier dysfunction: roles of apoptosis and time. Mol Cell Neurosci 61: 72-84. [crossref]
  7. Shao B, Bayraktutan U (2014) Hyperglycaemia promotes human brain microvascular endothelial cell apoptosis via induction of protein kinase C-βI and prooxidant enzyme NADPH oxidase. Redox Biol 2: 694-701. [crossref]
  8. Allen CL, Bayraktutan U (2008) Differential mechanisms of angiotensin II and PDGF-BB on migration and proliferation of coronary artery smooth muscle cells. J Mol Cell Cardiol 45: 198-208. [crossref]
  9. Daiber A, Steven S, Weber A, Shuvaev VV, Muzykantov VR, et al. (2017) Targeting vascular (endothelial) dysfunction. Br J Pharmacol 174: 1591-1619. [crossref]
  10. Unger T, Borghi C, Charchar F, Khan NA, Poulter NR, et al. (2020) 2020 International Society of Hypertension global hypertension practice guidelines. Hypertension 75: 1334-1357. [crossref]
  11. Bayraktutan U (2003) Effects of angiotensin II on nitric oxide generation in growing and resting rat aortic endothelial cells. J Hypertens 21: 2093-2101. [crossref]
  12. Münzel T, Camici GG, Maack C, Bonetti NR, Fuster V, et al. (2017) Impact of oxidative stress on the heart and vasculature: part 2 of a 2-part series. J Am Coll Cardiol 70: 212-229. [crossref]
  13. Bayraktutan U, Ülker S (2003) Effects of angiotensin II on nitric oxide generation in proliferating and quiescent rat coronary microvascular endothelial cells. Hypertens Res 26: 749-757. [crossref]
  14. Demirci B, McKeown PP, Bayraktutan U (2005) Blockade of angiotensin II provides additional benefits in hypertension- and aging-related cardiac and vascular dysfunctions beyond its blood pressure-lowering effects. J Hypertens 23: 2219-2227. [crossref]
  15. Spence MS, McGlinchey PG, Patterson CC, Allen AR, Murphy G, et al. (2003) Investigation of the C242T polymorphism of NAD(P)H oxidase p22 phox gene and ischaemic heart disease using family-based association methods. Clin Sci (Lond) 105: 677-682. [crossref]
  16. Spence MS, McGlinchey PG, Patterson CC, Allen AR, Murphy G (2004) Endothelial nitric oxide synthase gene polymorphism and ischaemic heart disease. Am Heart J 148: 847-851. [crossref]
  17. Muir AD, McKeown PP, Bayraktutan U (2010) Role of gender, smoking profile, hypertension, and diabetes on saphenous vein and internal mammary artery endothelial relaxation in patients with coronary artery bypass grafting. Oxid Med Cell Longev 3: 199-205. [crossref]
  18. Sena CM, Leandro A, Azul L, Seiça R, Perry G (2018) Vascular oxidative stress: impact and therapeutic approaches. Front Physiol 9: 1668. [crossref]
  19. Mahadevan VS, Campbell M, McKeown PP, Bayraktutan U (2006) Internal mammary artery smooth muscle cells resist migration and possess high antioxidant capacity. Cardiovasc Res 72: 60-68. [crossref]
  20. Rakkar K, Othman O, Sprigg N, Bath P, Bayraktutan U (2020) Endothelial progenitor cells, potential biomarkers for diagnosis and prognosis of ischaemic stroke: protocol for an observational case-control study. Neural Regen Res 15: 1300-1307. [crossref]
  21. Ya J, Pellumbaj J, Hashmat A, Bayraktutan U (2024) The role of stem cells as therapeutics for ischaemic stroke. Cells 13: 112. [crossref]
  22. Bayraktutan U (2017) Endotheliu, Endothelial Progenitor Cells and Stroke. J Neurol Clin Neurosci 1: 21-22. [crossref]
  23. Ya J, Bayraktutan U (2024) Senolytics and senomorphics targeting p38MAPK/NF-κB pathway protect endothelial cells from oxidative stress-mediated premature senescence. Cells 13: 1292. [crossref]
  24. Childs BG, Durik M, Baker DJ, van Deursen JM (2015) Cellular senescence in aging and age-related disease: from mechanisms to therapy. Nat Med 21: 1424-1435. [crossref]
  25. Bayraktutan U (2025) Angiotensin II and Cardiovascular Disease: Balancing Pathogenic and Protective Pathways. Curr Issues Mol Biol 47: 501. [crossref]
  26. Ya J, Kadir RRA, Bayraktutan U (2023) Delay of endothelial cell senescence protects cerebral barrier against age-related dysfunction: role of senolytics and senomorphics. Tissue Barriers 11: 2103353. [crossref]

A Case of Right Atrial Thrombus Mimicking Cardiac Myxoma: Surgical and Postoperative Management

DOI: 10.31038/JCCP.2026911

Abstract

Background: Intra-atrial thrombi, though rare, can develop in either atrium, with a higher prevalence in the left atrium. The causes are often difficult to determine, leading many cases to be classified as having uncertain origins.

Case Presentation: We present the case of a 35-year-old non-smoking male with a history of deep vein thrombosis who experienced worsening shortness of breath and pleuritic chest pain. Echocardiography revealed a right atrial thrombus extending into the left atrium through a patent foramen ovale. The thrombus was surgically excised; however, the patient developed postoperative complications, including pericardial effusion, pulmonary embolism, and acute liver injury. Following treatment and close monitoring, his condition stabilized, and he was discharged on anticoagulation therapy. Diagnosing intra-atrial thrombi presents significant challenges due to a broad differential diagnosis. Accurate assessment often requires multimodal imaging techniques, including echocardiography, CT angiography, and PET scans. Treatment options include anticoagulation, thrombolysis, and surgical thrombectomy, but there is no universal consensus on the optimal management approach.

Conclusion: Therefore, early detection of intra-atrial thrombi, timely surgical intervention when indicated, and vigilant postoperative monitoring with continued anticoagulation are essential for improving patient outcomes. Consequently, further research is necessary to elucidate the underlying etiologies and enhance diagnostic and therapeutic strategies for this rare condition.

Introduction

Right atrial thrombi (RAT) are blood clots located within the heart’s right atrium. Unlike left heart thrombi, right heart thrombi may originate from two different sources: they may develop within the right heart chambers (autochthonous clots) or represent peripheral venous clots that, en route to the lungs, accidentally lodge in a patent foramen ovale, tricuspid chordae, or elsewhere (transferred clots) [1,2].

This condition can be caused by several underlying factors, such as atrial fibrillation, deep vein thrombosis, and the presence of foreign objects like pacemaker leads. Consequently, RAT poses a significant risk of severe morbidity, including pulmonary embolism and stroke, as the thrombus may pass through a patent foramen ovale (PFO) and enter other parts of the circulatory system. Furthermore, To classify right heart thrombi, the European Working Group on Echocardiography identifies three types. Type A – RAT in Transit are large, free-floating clots from the deep venous system passing through the right atrium, posing a high risk of pulmonary embolism. Type B – RAT in Situ are smaller clots that attach to the right atrial wall or intracardiac devices and form within the atrium. Type C – Mobile In Situ Thrombi have a stalk-like structure with a thin attachment to the atrial wall, resembling an atrial myxoma. In clinical settings, RAT can present with chest pain, dyspnea, and palpitations. Additionally, some patients may exhibit features of right heart failure, including peripheral edema and jugular venous distension [1-4].

The literature indicates that right heart thrombi, though rare, are clinically significant. Numerous case reports have documented these cases, and a high proportion of patients have succumbed to embolic complications. In this context, we present the case of a 35-year-old non-smoking male who presented with concerning respiratory and cardiac symptoms. Imaging revealed a right atrial thrombus extending through a patent foramen ovale. Following surgical removal of the thrombus, the patient developed significant postoperative complications, including pericardial effusion and pulmonary embolism, necessitating further interventions. The patient’s condition stabilized with treatment, and he was discharged with instructions for continued anticoagulation therapy and regular follow-up.

Case Presentation

A 35-year-old non-smoking male presented to the emergency department with a three-day history of worsening shortness of breath and pleuritic chest pain. His symptoms were aggravated by respiration but did not change with body position. Additionally, he reported post-exertion palpitations, which resolved spontaneously. Two weeks prior, the patient experienced constitutional symptoms, including headache, chills, joint pain, low-grade fever, and a non-productive cough suggestive of an upper respiratory tract infection. During this period, he also noted a significant decrease in physical activity, easy fatigability, and generalized weakness. Notably, the patient had a past medical history of deep vein thrombosis (DVT) in the right leg but was otherwise healthy, with a history of tonsillectomy as the only surgical intervention.

Following evaluation, the patient presented with critically low oxygen saturation of 75% on pulse oximetry, necessitating immediate hospital referral. Upon admission, oxygen support was initiated, resulting in an improvement in oxygen saturation to 90%. A comprehensive cardiovascular examination revealed no signs of DVT, peripheral edema, or clubbing. Chest X-ray findings indicated clear lung fields and the electrocardiogram (ECG) showed sinus rhythm without ischemic changes. A transthoracic echocardiogram revealed a distinct cylindrical mass originating from the RA and extending through a PFO into the Left atrium (LA), with attachment to the right atrial septum. The mobile edges of this structure raised suspicion for either myxoma or thrombus (Video 1).

Given the echocardiographic findings, the patient was prepared for the surgical excision of the right atrial mass. Intraoperatively, it was discovered that the cylindrical mass in the RA extended into the LA through a PFO (see Figure 1). The interatrial septum was subsequently opened, allowing for the complete excision of the mass. The excised mass was then sent for histopathological examination, which confirmed the diagnosis of a thrombus.

Figure 1: Demonstrates Intraoperative Views, The left image presents a close-up of the heart, highlighting the attachment point of the mass. The center image illustrates the cylindrical mass within the heart chambers. The right image depicts the excised long, cylindrical mass.

Following the successful excision of the right atrial mass, the patient was transferred to the intensive care unit (ICU) for close monitoring and comprehensive postoperative care. The immediate postoperative care involved continuous hemodynamic monitoring to ensure stability. Vital signs were closely watched, including heart rate, blood pressure, respiratory rate, and oxygen saturation. The patient remained hemodynamically stable, supported by inotropic agents such as adrenaline and noradrenaline infusion pumps as needed. Regular arterial blood gas analyses were performed to monitor respiratory and metabolic status.

Pain management was a crucial aspect of postoperative care. Pethidine 75 mg was administered intramuscularly on an as-needed basis to control pain. Pain levels were regularly assessed using a standardized pain scale. To maintain adequate hydration and electrolyte balance, intravenous fluids were administered, and serum electrolytes were closely monitored. Potassium chloride infusions were given as needed to correct any imbalances.

Wound care involved daily inspection and dressing changes to keep the surgical wound clean and dry. The initial observation of a hematoma in the upper chest necessitated careful monitoring for signs of infection or further complications. Antibiotic prophylaxis included intravenous vancomycin (500 mg three times a day) and meropenem (1 g twice a day) to prevent postoperative infections. Additionally, omeprazole 40 mg was administered intravenously once daily to prevent stress-related mucosal damage and peptic ulcers.

Nutritional support began early with enteral feeding to maintain the patient’s nutritional status. Blood glucose levels were monitored regularly, and insulin was administered to manage hyperglycemia as required.

Anticoagulation therapy was managed meticulously. Warfarin (Coumadin) therapy was temporarily withheld due to elevated International normalized ratio (INR) levels. Low molecular weight heparin (Clexane) was administered to maintain anticoagulation until INR levels stabilized. Regular INR monitoring guided the resumption and dosage adjustments of warfarin. After a Few Days, the Warfarin was restarted at 5 mg once daily, with careful monitoring to maintain therapeutic INR levels.

Unfortunately, after a few days, the patient developed significant pericardial effusion, necessitating the drainage of 1500 cc of fluid. after that, the Daily clinical assessments were monitored for signs of pericardial effusion, and repeat echocardiography was performed to evaluate pericardial fluid levels. Respiratory support included supplemental oxygen and mechanical ventilation as needed, along with incentive spirometry and chest physiotherapy to prevent atelectasis and promote lung expansion.

Shortly thereafter, the patient presented with a sudden onset of chest pain, dyspnea, and apprehension. Physical examination revealed tachypnea, tachycardia, and hypoxemia. Given the clinical suspicion of PE, an urgent computed tomography (CT) was performed, confirming the presence of right segmental and left subsegmental pulmonary embolism (PE). Additionally, laboratory tests revealed acute liver injury, characterized by markedly elevated liver enzyme levels with aspartate aminotransferase (AST) at 560 U/L and alanine aminotransferase (ALT) at 1902 U/L. Consequently, anticoagulation therapy was adjusted based on the patient’s status, with closely monitored follow-up.

Throughout his hospital stay, the patient’s liver function and coagulation profiles were closely monitored, with serial laboratory tests and imaging to assess the resolution of complications. The patient was encouraged to mobilize early to reduce the risk of further thrombotic events. As his condition stabilized, with decreasing liver enzyme levels and improvement in clinical symptoms (see Table 1), the chest drains were removed. The patient was eventually discharged with instructions for ongoing anticoagulation therapy and regular follow-up appointments to monitor his liver function and prevent recurrence of thrombotic events.

Table 1: Laboratory test results and normal ranges.

Lab Test

Admission Day 1 week after the Operation Day Discharge Day Normal Range

Unit

Complete Blood Count
Hemoglobin (Hb)

17.9

10.0 13.3 13.5-17

g/dL

Hematocrit (Hct)

56.6

35.7 38.8 43.5-53.7

%

Mean Corpuscular Volume (MCV)

84.7

84.2 82.4 80-100

fL

Platelet Count

285

299 260 150-450

10^3/μL

White Blood Cell (WBC)

12.6

19.5 10.4 4 .0-11.0

K/uL

Coagulation Profile
Prothrombin Time (PT)

13

43 12 11-15

s

Activated Partial Thromboplastin Time (aPTT)

32

39.8 29.7 25-35

s

International Normalized Ratio (INR)

0.95

3.44 1.03 0.8-1.1

General Chemistry
Sodium (Na)

139

128 137 135-145

mEq/L

Potassium (K)

4.3

4.5 4 3.5-5.3

mEq/L

Chloride (Cl)

105

105 104 98-100

mEq/L

Blood Urea Nitrogen (BUN)

13

13.4 11 6-20

mg/dL

Creatinine

0.88

1.15 0.63 0.7-1.2

mg/mL

Liver Function Test (LFT)
Total Bilirubin

0.85

1.88 1.03 0.1-1.1

mg/dL

Direct Bilirubin

0.311

0.87 0.432 0.0-0.3

mg/dL

Aspartate Aminotransferase (AST)

23

560 41 0-40

(U/L)

Alanine Aminotransferase (ALT)

24

1902 46 0-41

(U/L)

Others
Troponin I

0.3417

0.3318 0.1664 0-0.029

ng/mL

C-reactive protein (CRP)

39.9

151 99.5 0-0.5

mg/dL

Erythrocyte Sedimentation Rate (ESR)

12

22 15 0-10

mm/hr

Discussion

This condition can be caused by several underlying problems, such as atrial fibrillation, deep vein thrombosis, and the presence of foreign objects, like pacemaker leads, among others. RAT carries the potential risk of severe morbidity, including pulmonary embolism and stroke, since the thrombus may pass through PFO and reach the other parts of the circulatory system. The characteristics related to size, location, and mobility are vital features in defining the clinical presentation that frequently includes signs and symptoms such as dyspnea, neck vein distension, and syncope [1,3].

RAT can develop from local intracardiac sources or as emboli originating from peripheral venous thrombi. In this case, the thrombus likely originated as a peripheral embolus, considering the patient’s history of DVT. Peripheral thrombi typically form in the deep veins of the legs due to stasis, hypercoagulability, or endothelial injury, known collectively as Virchow’s triad. When a thrombus dislodges from its peripheral origin, it travels through the venous system, ultimately reaching the right atrium. so If there is PFO, a remnant of fetal circulation present in approximately 25% of the adult population, the thrombus can pass from the right atrium into the left atrium, thereby entering the systemic circulation. This passage significantly heightens the risk of systemic embolism, including strokes or peripheral arterial emboli [1,5].

The presence of a PFO is particularly concerning because it allows for paradoxical embolism. In this scenario, a thrombus can bypass the pulmonary circulation and directly enter the systemic arterial system, leading to severe complications such as cerebral ischemia or myocardial infarction. The clinical significance of a PFO in the context of RAT lies in its potential to convert an otherwise isolated right-sided thrombus into a systemic threat. This underscores the need for immediate and precise diagnostic interventions to identify and manage such conditions effectively [1,6].

The differential diagnosis in a right atrial thrombus is exhaustive. Considerations have to be made for myxoma, other benign or malignant tumors, infective endocarditis vegetation, and foreign bodies such as pacemaker leads. To differentiate between these, requires a multi-dimensional assessment done by sophisticated imaging techniques, such as the use of echocardiography, and CT scans [7].

The diagnosis of RAT generally requires a multimodal approach using TTE, TEE, and CT to confirm. TTE is often the initial imaging modality, but sensitivity, especially for small thrombi, remains a limitation. TEE is more effective at providing clear imaging of the heart and great vessels and thus plays an important role both at the time of the initial diagnosis and during the subsequent management of patients with right atrial thrombi. A 360-degree view is provided with TEE and it is particularly useful when results of TTE are inconclusive. For example, in one study, TEE detected right atrial thrombi in all patients, whereas TTE diagnosed only a small fraction of cases with thrombi. It is also done to exclude concomitant pulmonary embolism which often can coexist with RAT [1,3,5].

Cases of right atrial thrombi mimicking myxomas are rare but have been documented in medical literature. These cases often present diagnostic challenges due to the difficulty in distinguishing between thrombus and myxoma using imaging techniques alone. In a case reported by Ondrusek et al., a 65-year-old male had a right atrial tumor initially suspected to be a myxoma, but it was found to be an aneurysm of the atrioventricular septum filled with thrombus during surgery and confirmed histologically. Similarly, Hashmath et al. described a 24-year-old woman with a right atrial mass that was initially thought to be a myxoma but was confirmed as a thrombus post-surgery. This patient had antiphospholipid antibodies, a rare factor in such cases [8,9].

Another interesting case by Khusnurrokhman and Wulandari involved a 32-year-old male with mediastinal non-Hodgkin’s lymphoma, who had a mass in the right atrium that mimicked a myxoma. The mass turned out to be a metastatic tumor thrombus. Additionally, Al-Sarraf et al. discussed a case in which a right atrial mass in a patient with antiphospholipid syndrome was misdiagnosed as myxoma but was actually a thrombus upon surgical excision [10,11].

Our case aligns with these reports in terms of diagnostic challenges and the necessity of histopathological confirmation for a definitive diagnosis. Similar to the documented cases, our patient, a 35-year-old non-smoking male with a history of DVT, presented with acute respiratory and systemic symptoms. Echocardiographic findings initially suggested a myxoma, but surgical excision and histopathological examination confirmed the mass as a thrombus. The patient’s presentation with post-exertion palpitations, respiratory distress, and acute liver injury adds a distinctive aspect to our case, not commonly reported in the literature. Moreover, our case involved a thrombus extending through a PFO into the left atrium, a unique anatomical finding compared to the other reported cases. Postoperative complications included significant pericardial effusion and pulmonary embolism, highlighting the complexity of managing such patients. These features contribute valuable insights into the clinical spectrum and management of right atrial thrombi mimicking myxomas, underscoring the importance of thorough postoperative monitoring and multidisciplinary care.

RAT should not be left untreated, especially if it moves through a PFO into the left atrium. This would demand an extensive approach since the risk of developing paradoxical embolism and systemic complications such as stroke is very high. Surgical intervention to extract the thrombus in question, supplemented by PFO closure, might also need to be done to prevent the immediate risks of embolization. This is followed by anticoagulation therapy through heparin and warfarin to prevent further thrombus formation and reduce the risk for thromboembolism. The other percutaneous approaches include the use of AngioVac aspiration system guided by TEE and fluoroscopy, and even though they are quite effective, they could be complicated by such as mechanical dislodgement and even cardiac chamber rupture. Post-procedure, long-term anticoagulation therapy and regular monitoring through imaging techniques like TEE form an important component of treatment to ensure no residual thrombus remains and the prevention of recurrence leading to poor outcomes in the patients [6,7,12].

This case describes the paramount significance of early diagnosis, timely surgical intervention, and meticulous postoperative management in handling intra-atrial thrombi. Additionally, it highlights the diagnostic complexities and the essential role of multimodal imaging in distinguishing RAT from other cardiac masses. The substantial risks associated with RAT, including pulmonary embolism and stroke, underscore the urgency of surgical excision and PFO closure. Vigilant postoperative monitoring is crucial to address potential complications such as pericardial effusion, pulmonary embolism, or SIRS, as observed in our case

We have encountered several limitations in our study. Firstly, the lack of long-term follow-up with the patient restricts our ability to assess the enduring efficacy of the surgical intervention and the ongoing risk of thromboembolic events. Secondly, although we employed multimodal imaging techniques, the case could have benefited from additional diagnostic tests, such as cardiac MRI, to provide further detail on the thrombus’s characteristics and the surrounding cardiac structures. Additionally, the absence of genetic testing to explore potential underlying thrombophilic conditions represents a gap in the comprehensive evaluation of the patient’s thrombotic predisposition

The prognosis of RAT depends on a number of factors, such as size and mobility of the thrombi, underlying health conditions, and treatment given timely and type-wise. For instance, the larger and more mobile the thrombi are, the greater the risk of complications. Additionally, underlying conditions such as atrial fibrillation, heart failure, and cancer can adversely affect outcomes. Prompt and appropriate treatment significantly improves the prognosis, although outcomes can still be variable [4].

Conclusion

This case highlights both the complexity and high risks associated with right atrial thrombi, especially those extending into a patent foramen ovale. Management that guaranteed survival in such a case entailed timely surgical intervention, comprehensive postoperative care, and close follow-up; it clearly underlines the critical need for a multidisciplinary approach. Pericardial effusion and pulmonary embolism are examples of the complications suffered that show high-risk outcomes and call for careful surveillance and adaptive treatment strategies. The report should increase awareness for right atrial thrombi and the importance of early diagnosis, complete surgical excision, and tailored postoperative management in order to enhance patient prognosis and prevent a recurrence of thrombotic events.

Conflicts of Interest

The author(s) declared no potential conflicts of interest with respect to the research, authorship, and/or publication of this article.

Ethic Approval

Ethics approval was not required for this case report, as our institution does not mandate ethical approval for the reporting of individual cases or case series.

Informed Consent

Written informed consent was obtained from the patient for the publication of his anonymized information in this article.

Funding

The author(s) received no financial support for the research, authorship, and/or publication of this article.

References

  1. Carda R, Almería C, Lennie V, Serra V, Zamorano JL (2008) What to do with an atrial thrombus? Eur J Echocardiogr. [crossref]
  2. THE EUROPEAN WORKING GROUP ON ECHOCARDIOGRAPHY, KRONIK G (1989) The European Cooperative Study on the clinical significance of right heart thrombi. Eur Heart J. [crossref]
  3. Aroke D, Nnaoma CB, Nubong TF, Okoye OC, Visveswaran G (2021) Right Atrial Thrombi, the Management Conundrum 2 Case Reports. Am J Case Rep. [crossref]
  4. Oldershaw PJ, Coll L (1982) Echocardiographic appearances of right atrial thrombus. Clin Cardiol. [crossref]
  5. Crowley JJ, Kenny A, Dardas P, Connolly DL, Shapiro LM (1995) Identification of right atrial thrombi using transoesophageal echocardiography. Eur Heart J. [crossref]
  6. Ramamoorthy S, Mahmoud SA, High K (2017) Extraction of Atrial and Pulmonary Thrombi Using Angiovac Aspiration System with Transesophageal Echocardiography and Fluoroscopic Guidance. Open J Anesthesiol. [crossref]
  7. Nakashima K, Uchino H, Shimanuki T (2020) Right Atrial Thrombus which was Difficult to Differentiate from Tumor Report of a Case. Kyobu Geka. [crossref]
  8. Ondrusek M, Artemiou P, Gasparovic I, Hulman M (2022) Aneurysm of the atrioventricular septum mimicking myxoma in the right atrium. Kardiochirurgia Torakochirurgia Pol Pol J Cardio-Thorac Surg. [crossref]
  9. Hashmath Z, Bose A, Thabet R, Mishra AK, Kranis M (2022) Right Atrial Thrombus Mimicking a Myxoma Synergism of Hormonal Contraceptives and Antiphospholipid Antibodies. Tex Heart Inst J. [crossref]
  10. Khusnurrokhman G, Wulandari L (2021) Mediastinal Non-Hodgkin’s Lymphoma Metastatic to Right Atrium Mimicking Right Atrial Myxoma. Folia Medica Indones
  11. Al-Sarraf N, Abdelmoaty A, Abu Alam S, Al-Fadhli J (2019) Right Atrial Mass Mimicking a Myxoma as a First Presentation of Antiphospholipid Syndrome. Heart Surg Forum. [crossref]
  12. Feuchter AC, Katz KD (2012) Right Atrial Thrombus Secondary to Pacemaker Wires. J Emerg Med. [crossref]

The Role of the Medical Sector in Victim Protection and Early Intervention in Intimate Partner Violence

DOI: 10.31038/IJNM.2026711

Abstract

Intimate partner violence (IPV) constitutes a major public health and human rights issue with profound physical, psychological, and social consequences for individuals and societies worldwide. Extensive research demonstrates that IPV contributes significantly to morbidity, mortality, and long-term health inequalities across populations. The medical sector occupies a critical frontline position in victim protection and early intervention, as healthcare professionals are often the first formal point of contact for individuals experiencing violence. This paper examines the role of the medical sector in victim protection and early intervention in cases of intimate partner violence, integrating empirical findings from the EU-funded VIPROM (Victim Protection in Medicine) project with established international research and policy frameworks. By analysing stakeholder needs, institutional challenges, and innovative training and capacity-building models, the paper highlights persistent gaps in medical responses to IPV as well as promising strategies for improvement. The findings underscore the importance of societal awareness, trauma-informed care, early identification in healthcare settings, interdisciplinary cooperation, and the sustainable integration of domestic violence training into medical education. Strengthening the capacity of the medical sector is essential for preventing further victimisation, improving long-term health outcomes, and advancing broader public health and human rights objectives.

Keywords

Intimate partner violence, Victim protection, Healthcare professionals, Trauma-informed care, Early intervention, Clinical training

Introduction

Intimate partner violence (IPV) is widely recognised as a pervasive and global public health issue affecting individuals across gender, age, socioeconomic status, and cultural contexts. International evidence indicates that a substantial proportion of women worldwide experience physical or sexual violence by an intimate partner during their lifetime, with similarly severe consequences observed among other victim groups [1]. Beyond immediate physical injuries, IPV is strongly associated with long-term mental health disorders, including depression, anxiety, post-traumatic stress disorder, and substance use disorders. It is also linked to chronic pain, gastrointestinal disorders, reproductive health complications, disability, and increased risk of premature mortality [2]. Consequently, IPV is increasingly conceptualised not solely as a criminal justice concern but as a critical public health and human rights issue requiring comprehensive and coordinated responses [3]. Healthcare systems occupy a unique and strategically important position within this response landscape. Individuals experiencing violence often seek medical care for injuries, chronic symptoms, or stress-related health problems long before disclosing abuse to law enforcement or specialised victim support organisations. Emergency departments, primary care practices, dental clinics, gynaecology and obstetrics units, paediatric services, and orthopaedic settings frequently serve as the first professional environments in which the consequences of violence become visible [4]. This situates healthcare professionals at the forefront of early detection, victim protection, documentation of injuries, and referral to appropriate support services. Despite this critical role, extensive research demonstrates that many healthcare professionals feel insufficiently prepared to identify and respond effectively to intimate partner violence. Commonly reported barriers include limited training, lack of clear institutional protocols, uncertainty regarding legal responsibilities, time pressure, and fear of causing further harm or offending patients [5,6]. These challenges highlight the need for structured, evidence-based approaches that support healthcare professionals in fulfilling their role in victim protection and early intervention. Addressing IPV within the medical sector therefore requires both individual competence and systemic organisational change.

Conceptual Framework: Victim Protection and Early Intervention

Victim protection in the context of intimate partner violence refers to a set of measures aimed at preventing further harm, safeguarding physical and psychological well-being, and facilitating access to specialised protection and support services. Early intervention involves the timely identification of violence and the initiation of appropriate responses at the earliest possible stage, ideally before violence escalates or becomes chronic. Within healthcare settings, victim protection and early intervention are closely interconnected and mutually reinforcing [7]. A central component of effective victim protection is societal awareness and sensitivity to the prevalence and dynamics of intimate partner violence. Recognising that victims of IPV may be present in everyday clinical encounters challenges persistent stereotypes about who is affected by violence and under what circumstances. Increased awareness within healthcare settings can foster environments in which patients feel safe to disclose abuse and confident that their experiences will be taken seriously [7]. Equally important is the adoption of trauma- informed approaches to care. Trauma-informed practice acknowledges the widespread impact of trauma and emphasises safety, trust, choice, collaboration, and empowerment. In the context of IPV, trauma- informed care aims to avoid secondary victimisation by ensuring that medical examinations, questioning, and documentation are conducted sensitively and respectfully. Research consistently shows that negative or dismissive responses by healthcare professionals can retraumatise victims and deter future engagement with services, whereas supportive and validating interactions can facilitate disclosure and improve long- term outcomes [8].

The Medical Sector as a Frontline Actor in IPV Response

Healthcare professionals across medical disciplines are uniquely positioned to identify and respond to intimate partner violence. Victims may present with a wide range of indicators, including acute injuries, unexplained or recurrent trauma, chronic pain, gastrointestinal complaints, reproductive health issues, dental injuries, and psychosomatic symptoms. However, these indicators are often non-specific, making detection challenging without appropriate training and awareness [2]. Empirical evidence from international research demonstrates that healthcare professionals regularly encounter victims of IPV but frequently fail to recognise the underlying cause of health problems [4]. Findings from the VIPROM Stakeholder Needs Assessment confirm these patterns across multiple European countries, revealing substantial variation in awareness, confidence, and expertise among medical professionals. Detection of IPV often depends on individual experience rather than systematic institutional practices, resulting in inconsistent responses and unequal levels of victim protection [9]. When disclosure of violence occurs, healthcare professionals play a decisive role in shaping victims’ subsequent pathways to safety and recovery. Compassionate listening, validation of experiences, and the provision of clear information about available resources are essential components of effective response. Even brief supportive interventions in healthcare settings have been shown to positively influence victims’ willingness to seek further help [5]. Nevertheless, many healthcare professionals report uncertainty regarding legal obligations, documentation procedures, and referral pathways. This uncertainty can lead to hesitation or inaction, even when violence is suspected or disclosed. Furthermore, a narrow focus on women and children as the primary victims of IPV, while justified by prevalence data, risks overlooking other affected groups such as men, older adults, individuals with disabilities, and those in same-sex relationships. An inclusive and intersectional approach is therefore necessary to ensure equitable access to protection and care [1].

Training and Capacity Building in the Medical Sector

A robust body of evidence demonstrates that targeted training significantly improves healthcare professionals’ ability to identify and respond to intimate partner violence. Effective training programmes increase confidence, enhance communication skills, improve documentation practices, and strengthen referral pathways [5,8]. However, research also indicates that training is most effective when it is practical, multidisciplinary, and embedded within institutional structures rather than offered as isolated or optional initiatives [6]. The VIPROM project provides a comprehensive example of how training and capacity building can be systematically addressed within the medical sector. Based on extensive stakeholder needs assessments conducted across several European countries, VIPROM developed tailored training curricula for various medical professionals, including physicians, nurses, midwives, dentists, and medical students. The curricula emphasise practical competencies such as recognising indicators of violence, trauma-informed communication, medical documentation, risk assessment, and interprofessional cooperation [10]. A key innovation of the VIPROM approach is the use of a modular European Training Platform on Domestic Violence, complemented by a Train-the-Trainer model. This structure supports sustainability by enabling trained professionals to disseminate knowledge within their institutions and national contexts. Importantly, the training materials are adapted to different professional roles and healthcare settings, enhancing relevance and uptake. By embedding IPV training within existing medical education and professional development structures, VIPROM addresses a critical gap in traditional medical curricula [10,11].

Discussion

The findings presented in this paper reaffirm the central role of the medical sector in victim protection and early intervention in intimate partner violence. Healthcare professionals often represent the first and sometimes only formal point of contact for individuals experiencing violence, placing them in a critical position to identify risk, initiate support, and prevent further harm [4]. Nevertheless, a substantial gap remains between this potential role and everyday clinical practice. Recognition of IPV indicators continues to rely heavily on individual awareness rather than standardised institutional procedures. Time pressure, high workloads, and competing clinical priorities further limit opportunities for proactive intervention. These challenges underscore the importance of organisational support, clear protocols, and leadership commitment in enabling effective medical responses to IPV [11]. The persistence of stereotypical assumptions about victim profiles also constrains effective intervention. Although women and children are disproportionately affected by IPV, other victim groups remain under-recognised and underserved. Adopting intersectional frameworks that acknowledge diverse experiences of violence is essential for inclusive and equitable care. Training initiatives such as VIPROM demonstrate how healthcare systems can move towards more comprehensive, prevention-oriented responses through structured education, multidisciplinary collaboration, and institutional change.

Conclusion

This paper has examined the role of the medical sector in victim protection and early intervention in intimate partner violence, integrating international research with empirical findings from the VIPROM project. The analysis confirms that healthcare professionals are pivotal actors in identifying violence, responding to disclosures, and facilitating access to specialised support services, thereby influencing both immediate safety and long-term recovery [2,10]. At the same time, structural constraints including insufficient training, lack of institutional guidance, and organisational pressures continue to undermine effective responses. Strengthening the medical sector’s role requires sustained integration of IPV training into medical education, the adoption of trauma-informed and inclusive frameworks of care, and robust interprofessional cooperation [7,11]. By embedding victim protection within healthcare systems, initiatives such as VIPROM contribute not only to improved clinical practice but also to broader public health and human rights objectives. Enhancing the medical response to intimate partner violence is therefore both an ethical obligation and a critical strategy for preventing further violence and promoting safer societies.

Acknowledgment

VIPROM (Victim Protection in Medicine) is a European Union’s Citizens, Equality, Rights and Values Programme (CERV-2022- DAPHNE, No.101095828) project co-funded by the European Union Views and opinions expressed are however those of the author(s) only and do not necessarily reflect those of the European Union or CERV. Neither the European Union nor the granting authority can be held responsible for them.

References

  1. World Health Organization (2021) Violence against women prevalence estimates, 2018: Global, regional and national prevalence estimates for intimate partner violence against Geneva: World Health Organization.
  2. Campbell JC (2002) Health consequences of intimate partner The Lancet 359: 1331-1336. [crossref]
  3. Krug EG, Dahlberg LL, Mercy JA, Zwi AB, et (eds) (2002) World report on violence and health. Geneva: World Health Organization.
  4. García-Moreno C, Hegarty K, d’Oliveira AFL, Koziol-McLain J, et al. (2015) The health-systems response to violence against The Lancet 385: 1567-1579. [crossref]
  5. Feder G, Davies R.A, Baird K, Dunne D, Sandra E, et al. (2011) Identification and referral to improve safety (IRIS) of women experiencing domestic violence with a primary care training and support programme. The Lancet 378: 1788-1795. [crossref]
  6. Taft A, O’Doherty L, Hegarty K, Ramsay J, Leslie LD, Gene F, et al. (2013) Screening women for intimate partner violence in healthcare settings. Cochrane Database of Systematic Reviews (4), CD007007.
  7. World Health Organization (2013) Responding to intimate partner violence and sexual violence against women: WHO clinical and policy Geneva: World Health Organization.
  8. Hegarty K, O’Doherty L, Taft A, Chondros P, Stephanie B, et al. (2013) Screening and counselling in primary care for women who have experienced intimate partner violence (WEAVE): A cluster randomised controlled The Lancet 382: 249-258. [crossref]
  9. VIPROM Consortium (2023) Deliverable 1: Stakeholder Needs Assessment.
  10. VIPROM Consortium (2024a) Deliverable 1: EU and international Training content tailored to the various first line responders in the medical sector.
  11. VIPROM Consortium (2024b) Deliverable 2: Design of EU and national Train- the-Trainer curricula tailored to various frontline responders.

Beyond Size: Multistage Coalescence and Crystallinity-dependent Nucleation Pathways

DOI: 10.31038/NAMS.2026912

Abstract

Within classical nucleation theory (CNT), an initially formed crystal nucleus is often treated analogously to a droplet, with its evolution primarily described by changes in cluster size. However, increasing evidence suggests that the internal phase state of a cluster, including density for liquids and crystallinity for solids, evolves together with size and plays a decisive role in determining nucleation pathways and rates. Here we relate in situ transmission electron microscopy (TEM) observations of intermediate monomers to recent theoretical simulations, showing a phase-aware description of nucleation. Time-resolved TEM reveals that (i) coalescence proceeds through discrete, multistage events assisted by e-beam energy input; (ii) intermediate monomers repeatedly switch roles between reactants and products as their phase stability evolves; and (iii) mass redistribution can occur, consistent with crystallinity-dependent chemical potential and phase-dependent susceptibility to vaporization and redeposition. Motivated by these observations, we propose a more general framework that extends classical nucleation descriptions by incorporating coupled size and phase variables together with external driving fields. This phase aware description reconciles nonclassical multistage pathways with a tractable energetic model and suggests experimentally accessible control parameters, such as dose rate and dwell time, for steering early stage nanocrystal evolution.

Keywords

Nucleation, Nonclassical crystallization, In Situ TEM, Electron beam

Introduction

Understanding nucleation and early growth is central to controlling nanomaterial synthesis and transformation. Although classical nucleation theory (CNT) remains a useful baseline, its size-only description implicitly assumes that a nascent nucleus already possesses the bulk properties of the product phase. Recent rare-event simulations of Lennard–Jones vapor condensation demonstrate that this assumption can fail even for simple fluids: critical droplets nucleate with a density substantially different from the macroscopic liquid, and the reactive pathway involves simultaneous growth and densification [1]. In solids, an analogous internal variable is structural order (crystallinity, defect density, polymorph), which can evolve concurrently with size and invert size-only expectations such as anti-Ostwald ripening [2].

ZnO is a particularly suitable model to explore this coupling because it exhibits crystalline, poorly crystalline and amorphous states on the nanoscale, and these states respond differently to electron irradiation. In earlier in situ TEM studies, we observed multistage transitions among ZnO intermediate species and anti-Ostwald-like mass diffusion, indicating that intermediate monomers are not rigid building blocks but continually change size and phase [2]. More recently, we showed that e-beam irradiation can facilitate crystal reconstruction and even promote vapor-mediated mass transfer between unconnected particles, with the direction set by crystallinity- dependent stability [3].

In this paper, as an extension of our previous studies [2,3], we revisit representative multistage coalescence events in the pulsed- laser-produced ZnO system and use them to formulate a concise, phase-aware nucleation framework that bridges liquid condensation and nanocrystal evolution. Our goals are to distill experimental signatures of coupled size and phase evolution under e-beam driving, and to provide a minimal model that can be used to interpret and control such pathways in nanoscale crystallization.

Results and Discussion

Revisiting Classical Nucleation Theory

The theoretical fundamentals of crystal synthesis and crystallization are mainly based on classical theories, ascending to Gibbs free energy theories [4]. In CNT, when a crystal is initially formed, it could be regarded as a droplet. The Gibbs free energy ΔG of a droplet (assuming in a spherical shape) is described as in the following:

where  is the bulk energy, is the surface energy also referred to as the resistance force for nucleation, and r is the radius of the droplet. is often referred to as the driving force of nucleation. The difference in bulk free energy between product and reactant is related to saturation of solution, which is expressed as:

where C is the concentration of a solution, C0 is the concentration of a solution when it is saturated, k is the Boltzmann constant, and T is temperature.

The Gibbs free energy change with the crystal radius is shown in Figure 1. A diagram of Gibbs free energy is provided vs. radius of nucleation, showing graphs of interface free energy, , the Gibbs free energy, ΔG, and bulk energy, . The maximum value of free energy is the energy barrier for nucleation, ΔG*, when Correspondingly, the value of r* at the energy barrier is the critical size of nucleation, after which the addition of new molecules to nuclei decreases the free energy, so nucleation is favorable.

Figure 1: Free Gibbs energy diagram of nucleation in classical nucleation theory.

CNT remains a foundational framework because it reduces an intrinsically collective, many body process to a simple thermodynamic competition between a bulk free energy gain that scales with cluster volume and an interfacial free energy penalty that scales with cluster area. This reduction yields a single critical cluster size and a corresponding free energy barrier, providing a convenient and widely adopted basis for comparing nucleation behavior across different systems and conditions. However, the most consequential assumption underlying CNT is not the capillary approximation itself, but rather the implicit identification of the nucleating cluster with the equilibrium bulk phase. While cluster size quantifies the amount of material involved in nucleation, it does not specify the internal thermodynamic or structural state of that material.

In many nucleation processes, internal equilibration within the cluster is not instantaneous. Liquid droplets may initially form with reduced density and undergo subsequent densification, while crystalline nuclei may first appear as amorphous or poorly ordered aggregates before transforming into an ordered phase. Similarly, nanoparticles can nucleate in metastable polymorphs or defect rich configurations and later evolve toward more stable structures. When internal ordering and cluster growth occur on comparable time scales, nucleation cannot be adequately described by a single size parameter, but must instead be treated as a coupled process involving at least two collective variables: a size coordinate, such as the cluster radius R, particle number n, or volume, and an internal phase or order parameter, such as density ρ in fluids or crystallinity and structural order α in solids, with additional variables including composition or strain becoming relevant in more complex systems.

In literatures [5], the authors regarded the intermediate monomers, i.e., the primary particles, having energy at its minimum as , where is its energy averaging over both surface and bulk energies. The intermediate monomers were proposed to contribute the free energy of the crystallization system by . Therefore, the critical energy of the system change is   It implied that the primary particle was a precursor-like reactant, which has the effect equivalent to a change in the saturation of the solution, from S0Sp x S, where the supersaturation is defined as , where C is the concentration and Cs is the solubility limit. As a result, the intermediate monomers affects the free energy of the system simply by adding/subtracting an amount of free energy (depending on the primary particles metastable/stable).

In the model proposed by Mirabello and coworkers [6], the process of non-classical crystallization was described as a three-stage transition: (1) the formation particle (P); (2) the aggregation of Ps in which the Gibbs free energy changes due to the change of surface area; (3) the phase transition into the final crystalline phase. In the stage of the phase transition, a factor was assigned to describe the degree of the conversion. However, the definition of the conversion factor Φ is intuitional. Neither mass conservation nor additional nucleation was considered. Moreover, the model identified a critical cluster size, Rconv, by the condition: It implies that the transition direction is predetermined, from P to crystals (C) with increasing of Φ, and the process is size depended that in the early stage of R < Rconv the phase is dominated by P, and the conversion to C becomes favorable above Rconv. However, this predetermined phase change direction excludes the possibility of phase change from C to amorphous (A), or the possibilities of the growth of P consuming C, as we observed in this study.

Observation of Multistages of Crystal Evolution

ZnO crystals or intermediate monomers in this study were produced by the pulsed laser method, similar to the previous studies [7]. The precursor solution for producing ZnO crystals was prepared from zinc acetate dihydrate in alcoholic solution under basic conditions [8]. Specifically, 1.5mM Zn(CH3COO)2 · 2H2O was dissolved in 25 mL DI water and mixed with 25mL ethanol (all chemicals from Sigma-Aldrich). Additionally, 1mL dilute NH3 · H2O solution (pH = 10) was added dropwise under vigorous stirring at room temperature. The substrate of Si (100) in a size of 1 cm × 1 cm was cleaned by DI water and immersed in the precursor solution. Copper grid holder for Transmission Electron Microscope (TEM) was placed on the silicon substrate, with film side face-up, and the grid edge was sealed by copper tape. The copper grid has 400 mesh with a thin film of pure silicon monoxide (15 – 30 nm) (SF400-Cu from Electron Microscopy Sciences, Hatfield, PA). The substrate was irradiated by pulsed laser for 1s. Ytterbium pulsed fiber laser with a wavelength of 1064 nm, pulse width of 100 ns was used to irradiate the substrate to trigger the hydrothermal reaction. Pulsed laser power density is 1.27 kW/cm2 in a repetition rate of 100kHz. After irradiated by the pulsed laser, the grid was taken out and rinsed with DI water. After dried by air, it was cleaned by plasma (Ar) for 40s before TEM observation. FEI Tecnai G2 20 TEM with 200 kV LaB6 filament was used. The CCD camera is a bottom mount Gatan US1000 2K x 2K, and videos were captured with a frame rate of ~30s-1 [frames per second (fps)].

Figure 2 shows an in-situ observation of multistages of crystallization. Starting from 1 s, two adjacent ZnO particles (intermediate monomers) can be resolved as distinct entities in the time resolved TEM sequence, each maintaining its own boundary and contrast. Under continuous electron beam irradiation, the pair evolves progressively toward integration through coupled interfacial and structural relaxation processes. As irradiation proceeds, surface atom diffusion smooths initially rough or high energy surface segments and promotes the development of a contact neck at the junction, while gradual lattice rearrangement and rotation reduce the crystallographic mismatch across the interface. Concurrently, local mass transport and boundary relaxation decrease the interfacial free energy, leading to a steady loss of boundary sharpness and a more coherent morphology. By the end of the 60 s observation window, the two monomers have merged into a single larger particle that exhibits a more uniform, crystal like contrast, consistent with the electron beam facilitated structural evolution mechanisms previously reported for multiphase nano ZnO, including surface diffusion, grain rotation, and irradiation activated mass transfer that collectively drive the system toward a lower energy configuration [3].

Figure 2: Particle coalescence processes. The frame size of each picture: w:153 nm, h:133 nm.

The theoratical model could be summarized in Figure 3 that in one stage of the reaction during the multi-stage process, from monomer (Mi) at stage i, which composed of two monomers (Mi1 and Mi2) to monomer (Mi+1) at stage i+1, representing the aggregated monomer (Mi1+Mi2). ΔE represents the energy barrier of particles’ moving, attaching, and aggregating under the assistance of the mass diffusion. The electron beam provided the energy for overcoming the energy barrier. Monomer Mi has a Gibbs energy of Gi, and monomer Mi+1 has a smaller energy of  Gi+1. ΔG<0 indicates that Mi+1 is more stable than Mi. Monomer Mi+1 will continue interacting with surrounding monomers, evolving in the following stages.

Figure 3: Energy diagram of the particle coalescence processes shown in Figure 2.

Mass Redistribution Among Clusters

Mass transfer among monomers was experimentally observed and shown as an important mechanism in the crystallization process. The continuous change of individual monomers (particles) indicated that successive mass transfer and phase change was induced by e-beam. Figure 4 was viewed from a TEM view window; each frame size is about 1.28× 0.81 μm. Two particles were tracked over 100s; the particle on the left is marked as p1, and the particle on the right is marked as p2. Two particles didn’t have significant change during the first 10s. At 12.90s, e-beam intensity increased artificially. As a result, particles shrank and p1 was hardly observed. At 22.83s, particles reappeared and continue to grow. At about 53.87s, p1 and p2 showed a crystalline structure rather than round shape. After 66.27s, particles continue to shrank. p1 disappeared at 73.93s and reappeared at 78.63s, and p2 disappeared at 78.63s. Although they disappeared eventually, a series of shrinkage and growth indicated the existence of local minimums in crystal growth energy diagrams.

Figure 4: A series of phase changes of two particles due to e-beam. Snapshots from videos of observations from TEM view window. Magnification is 19.5k. Each frame size is about 1.28 × 0.81 μm. E-beam intensity increase at 12.90 s.

The reaction is found dose sensitive, in which a high dose rate leads to a high reaction rate. Particles didn’t have significant change until increasing the e-beam intensity (dose rate) at 12.90 s. In-situ measurement of the intensity of e-beam interacting with the sample is difficult (not allowed at our equipment). However, it could be a good reference using the dose rate projected at the screen, which records the electron density transmitted through the sample to detectors sitting below the sample. In this study, a dose rate of 673 e/(nm2s) was used at a magnification of 19.5 k; 1560 e/(nm2s) at a magnification of 29 k; and 3330 e/(nm2s) at a magnification of 43 k. Convert the electron flux to dose rate, ψ, on samples, using equation [9]:

where S is total stopping power for water, 2.79 (MeV cm2 g-1), a is the radius of irradiation area, I is the beam current, unit of Gy is defined as the absorption of one joule per kilogram of matter. Dose- related effect was studied by the effect of e-beam induced damage effect [10,11]. Therefore, the dose rate is then 3.01 × 10⁷ Gy/s for 19.5 k,  6.98 × 10⁷ Gy/s for 29 k, and 1.49 × 10⁸ Gy/s for 43 k. Although it’s hard to have precise quantitative results between dose rate and crystallization kinetics, this result shows that electron beams could not only be used for imaging crystallization processes, but also as a promising tool to initiate and control the reactions in the observed area.

A General Framework of Crystallinity-dependent Nucleation Pathways

These observations align with our prior in situ TEM and simulation results on multiphase nano ZnO under electron irradiation, where the electron beam can induce constructive microstructural evolution rather than only damage [3]. Here, as an extension of our previous studies, we presented a generic model by extending the Gibbs energy profile of classical nucleation theories. The cases in ref. [5,6] discussed above could be included in this model. Moreover, two new features described by this model need to be stressed: firstly, considering that the crystal evolution results from the equilibrium among M, P, and C or A, intermediate monomers change their roles dynamically. Representative monomer types are schematically illustrated in Figure 5a. The relatively stable phase will consume less stable ones, e.g., the growth of stable P may consume adjacent C or A. Secondly, the phase transition and size change has no specific direction. The multi-stages reactions could result from either change of  μMi , γMi or RMi , as long as the system reduce the Gibbs free energy as a whole, for example, a transition from A to C by reducing RMi .

The crystal evolution includes multi-stages reaction, and intermediate monomers at different stages indicated the local minimums in energy diagrams (shown in Figure 5b). Figure 5c describes a schematic overview of crystal evolution pathways, starting from intermediate monomers. Intermediate monomers were a mixture of ion-molecule monomers, dense liquid, amorous particles, poorly crystalline particles and nanocrystals, generated by the pulsed laser method from indirect nucleation in our system. The intermediate monomers under e-beam continue to undergo a kinetically favored pathway, in which mass- transfer induced new monomer formation and existed monomer dissolving lower energy barriers and alter evolution pathways.

In each stage (shown in Figure 5c), monomers move and attach, with or without adjustment of crystalline orientation depending on the phase properties of monomers, as discussed above. Then monomers coalesce directly or through mass distribution to form a new crystalline phase. The new crystalline phase then transforms into a more stable phase by mass redistribution and phase adjustment. Finally, the large newly formed phase shows as a more stable monomer, usually a crystalline phase, with lower Gibbs free energy and serves as the reactant for the next stage. The final crystal is the product of several stages of monomer interactions. In addition, as the trajectories of monomer interactions may not remain in the final crystals, single crystals could also be formed from various monomers’ interactions.

Figure 5: (a) Various monomers types shown in blue dash block, adapted from [12]. (b) Proposed crystallization dynamics schematic diagram showing multi-stages transformation from initial monomers M1 to final crystals. (c) A proposed example of a certain stage of crystal evolution. The mass and phase transfer from unstable phases to more stable phases. The product of a certain stage (M2) continue react and contribute to the crystal evolution in next stage.

The proposed mechanism in literatrues are certain possible crystal evolution pathways. Here, we extend the diversity of the intermediate reactions, in which the role of the primary particles or intermediate monomers could be more complex. The reaction from molecules (M) to crystals (C) or amorphous (A) involving primary particle (P) is not only in the form of M + P C or A as implied in ref. [5], but could be considered as the equilibrium among MP and C or A as:

If P is unstable (Sp>1), reaction (1) will be reversely favored, and reaction (2)(3) is forwardly promoted. Similar to the case described in Figure S4D-E of Ref.5, consuming P will lower the total free energy of the system. However, if P is stable (Sp<1), we should consider whether it will still be consumed and increase the energy barriers, as described in Figure 3C-D of Ref. [5]. If it favors reaction in a different way, such as by the direct growth of P, the role of the primary particle will not always be a reactant but could be a product, and its effect on the free energy diagram of the system would be more complicated. The generic model proposed here implies all those possible roles of intermediate monomers and all the possible evolution pathways.

Conclusions

In summary, we combined in-situ intermediate monomer observations with a phase-aware nucleation viewpoint to highlight a unifying principle: nucleation and early growth are governed by coupled evolution of size and an internal phase coordinate. In the ZnO system, e-beam irradiation facilitates discrete multistage coalescence events, enables dynamic role switching of intermediates, and drives crystallinity-dependent, sometimes anti-Ostwald, mass redistribution. By casting these behaviors on a minimal two-coordinate free-energy landscape and including an explicit driving term for e-beam energy input, we obtain a compact framework that connects nanocrystal evolution to recently established variable-density nucleation pathways in liquid condensation. This framework motivates phase-aware experimental metrics and provides actionable control knobs for e-beam-assisted nanomanufacturing.

Notes: The authors declare no competing financial interest.

References

  1. Wu Y, Philippe T, Graini A, Lam J (2026) Nonclassical Nucleation Pathways in Liquid Condensation Revealed by Simulation and Phys Rev Lett. [crossref]
  2. Liu S, Liu C R (2021) Observation of New Dynamics of Transitions among Intermediate Species in Crystal Evolution and Its Role in a Generic Model of Journal of Physical Chemistry C. [crossref]
  3. Liu S, Wang R, Cai X, Wang Y (2025) Electron beam facilitated structural evolution of nano-zincoxide. Nanoscale. [crossref]
  4. Gibbs JW, Bumstead H A (1906) Longmans Green and Company
  5. Baumgartner J et al (2013) Nucleation and growth of magnetite from Nature Materials. [crossref]
  6. Mirabello G et al (2020) Crystallization by particle attachment is a colloidal assembly Nature Materials. [crossref]
  7. Liu S, Liu CR (2019) Morphology Control by Pulsed Laser in Chemical Deposition Illustrated in ZnO Crystal Crystal Growth and Design. [crossref]
  8. Pacholski C, Kornowski A, Weller H (2002) Self-Assembly of ZnO From Nanodots to Angew Chem Int Ed. [crossref]
  9. De Jonge N, Ross F M (2011) Electron microscopy of specimens in liquid. Nature Nanotechnology. [crossref]
  10. Egerton R F, Li P, Malac M (2004) Radiation damage in the TEM and Micron. [crossref]
  11. Jiang N (2015) Electron beam damage in oxides A Reports on Progress in Physics. [crossref]
  12. De Yoreo J J et al (2015) Crystallization by particle attachment in synthetic biogenic and geologic Science. [crossref]

Assessing Perceptions of the Healthcare Community, Perceived Stress, Perceived Racism, Postpartum Depression, and Differences in Income among Black Women

DOI: 10.31038/AWHC.2025844

Abstract

Purpose: The purpose of this study was to assess differences in perceptions of the healthcare community across annual income and perceived stress levels, and the relationship between perceived stress, perceived racism, postpartum depression, and the perceptions of the healthcare community among Black women.

Methods: Two Hundred Nineteen Black mothers participated in this study. To better understand the relationship between the primary variables, Spearman Rho, Correlations, and a Non-Parametric Independent Sample T test were run. Standard, Multiple, and Hierarchical regressions were used to measure the moderating role of perceptions of racism on perceptions of the healthcare community and perceived stress.

Results: Results indicated that higher levels of stress in Black women were related to lower perceptions of the healthcare community, and there was evidence to support perceived racism as a moderator between perceptions of the healthcare community and perceived stress. There were unique differences in perceived racism across income and middle-income individuals reported less perceived racism. Lastly, perceptions of the healthcare community and annual pre-tax income combined were found to be better predictors of postpartum depression than either variable alone.

Conclusion: By understanding these factors as contributors to maternal mortality rates among Black women, it can influence training and professional development for new and existing mental health practitioners.

Keywords

Healthcare community, Income, Perceived stress, Perceived racism, Postpartum depression

Introduction

Black mothers are dying at 3 to 4 times the rate of non-Hispanic white mothers [1]. Seven hundred individuals die during pregnancy or in the year after in the United States while Black mothers represent almost 45% of the deaths [2]. The etiology of maternal-related mortality disproportionately affecting Black women is quite complex. Three key issues have been presented to explain this difference in outcomes: 1- Black women are more susceptible to having a pre- existing cardiovascular morbidity; 2- Black women are more likely to experience adverse pregnancy outcomes including a high risk for cardiovascular disease, and; 3- racial bias of providers and perceived racial discrimination of themselves as a patient [3].

As important as maternal mortality is in representing differences in outcomes, maternal morbidity rates may best represent the size of the problem for many women. Koblinsky (2012) defined maternal morbidity as a term that refers to any physical or mental illness or disability related to pregnancy and/or childbirth [4]. Examples of maternal morbidity include, but are not limited to, diabetes, high blood pressure, preeclampsia, blood clots, hemorrhage, and anemia. On average, more than 60,000 women in the United States affected by severe maternal morbidity annually. The rates of morbidity for Black women exceeds that of their white counterparts in 22 of the 25 severe morbidity indicators [2,4]. The Center for Disease Control (CDC) has reduced the original list of indicators to now represent 21 items that correspond to severe maternal morbidity (SMM) [2].

Pieterse et al. (2012) suggest that perceived racial discrimination can occur on multiple levels (interpersonal, institutional, cultural) and can be stressful for Black individuals negatively affecting their mental and physical health. Black individuals, on average, report higher levels of exposure to racism and discrimination than any other marginalized group [5]. Persistent high levels of stress can cause a deterioration of mental, emotional, and physical health. Persistent high levels of stress have been linked, but are not limited to heart disease, high blood pressure, heart attacks, depression, anxiety, and stroke.

Black individuals deal with racism-related stress daily, and it is very prominent in every aspect of living in the United States and thusly creating grave concern as it pertains to the healthcare system. Black individuals have not been afforded non-racial biased treatment, whether it was for a physical or mental ailment. Researchers previously found that there is a significant racial difference in mistrust of medical care settings for Black individuals. This was due to the Tuskegee Study and from broader personal and historical experiences [6]. Over time, the mistrust of the healthcare community has influenced the Black community to not seek medical attention when needed. Furthermore, it discourages Black mothers from seeking proper prenatal care out of fear of getting racially biased treatment from their nurses and doctors.

Perceptions of the Healthcare Community

One’s view of something or someone can influence how they interact with it. Perceptions of the healthcare community are having an impact on how Black women are viewing their quality of healthcare. This is evidenced by a study conducted by Blair and her colleagues (2013) that involved administration of a telephone survey on White and Black patients completing the Primary Care Assessment Survey. The Primary Care Assessment survey assessed the patients’ view of the clinicians’ interpersonal treatment, communication, trust, and contextual knowledge. They also had a panel of 134 clinicians that completed the explicit/implicit ethnicity/race bias assessments. The findings from this study revealed that clinicians with greater implicit bias were rated lower in patient-centered care by their Black patients as compared to the White patients. Another study conducted by Cuevas and her colleagues (2016) involved focus groups of Black women and men discussing their perceptions of racism in the medical setting, mistrust in medical settings, poor communication from doctors, and race discordance. The findings from this study revealed that Black women perceived higher discrimination than Black men feeling as though their symptoms were being discredited and ignored [7,8].

Perceptions of the Healthcare Community and Income

The intersectionality of income and race has shown to have an impact on the quality of care you may receive and your perception of your quality of healthcare. This is evidenced by a study conducted by Oliha and her colleagues (2020), which involved in-depth interviews of low-income Black women. Black women in this study reported receiving less than satisfactory patient care. The findings from this study attributed their less than satisfactory patient care to three significant themes: 1) perceived discrimination based on race, 2) perceived discrimination based on socioeconomic status, and 3) stereotypical assumptions (i.e., drug-seeking or having an STD) (Oliha et. al., 2020). Another study conducted by Berry and Colleagues (2009) examined the effects of race on cancer outcomes by performing a retrospective study. The methodology involved analyzing the cancer registry, billing, and medical records for Black and White patients diagnosed with Stage 4 cancer between the years of 2000 and 2005. The findings from this study revealed that even after controlling for insurance, income, and disease severity, Black patients were receiving lower quality care [9,10].

A pivotal survey was conducted by the Commonwealth Fund in 2001 to assess the quality of healthcare based on race. The study was conducted using a sample size of 1,037 Americans that identify as Black or Black out of a total sample size of 6,722 [11]. Results from this survey provided evidence of racial disparities economically and in the quality of healthcare.

Income and access make a difference on your quality of healthcare or whether you end up receiving healthcare at all. This is evidenced by a survey conducted by Collins and Colleagues (2001). The results revealed that 59% of Black individuals were less likely to have job-based insurance and were more likely to rely on public programs. The survey also revealed that 50% of Black individuals reported annual income at or near poverty levels as compared to 30% of White individuals. Furthermore, regular doctor access was assessed as consistent access to a doctor that knows of your health status and that addresses all your concerns. It was found that 28% of Black individuals reported not having a regular doctor and cite emergency rooms, “nowhere”, and clinics as usual sources of care as compared to 9% of white individuals. This previous evidence suggests that income does not protect a Black woman from the risk of dying from pregnancy complications. It is a racial systematic issue that needs to be considered [11].

Perceived Stress and Postpartum Depression

The interaction of perceived stress and postpartum depression has an impact on the mothers’ postpartum experience, which can be detrimental for the mother and the baby. This is evidenced by a study conducted by Sidor and his colleagues (2011) that involved assessing Black non-clinical mother-infant dyads at psychosocial risk. The psychosocial risks they focused on included poverty, alcohol or drug abuse, and lack of social support. The findings from this study suggested that mothers that reported higher postpartum depression reported higher perceptions of parenting stress. Another study conducted by Suárez-Rico and his colleagues (2021) involved collecting data on postpartum Mexican mothers between August and September 2020. The purpose of this study specifically was to look at the perceived stress accumulated from COVID-19 by a postpartum mother. The findings from this study revealed that depression, anxiety, and perceived stress was higher during the COVID-19 pandemic lockdown for Mexican postpartum mothers than previously reported in literature [12,13].

Postpartum depression also known as perinatal depression is a mood disorder that can affect women during and after childbirth. Symptoms include anxiety, feelings of extreme sadness, and fatigue that can make it difficult for them to carry out daily tasks, including caring for themselves and others. Previous research suggests that postpartum depression is caused by an integration of environmental and genetic factors. Some environmental factors could be experiences of past trauma, while genetic factors can be a family history of depression.

Previous studies have measured postpartum depression by using the tool known as the Edinburgh Postnatal Depression Scale, which screens women for psychological distress. The prevalence of depression and anxiety for women during pregnancy was 16 percent and 19 percent after pregnancy. Halbreich and Karkun (2006) conducted a comprehensive review of depression attributing the cultural differences in young women reporting and understanding depression. Perinatal depression is another form of depression that constitutes being depressed during pregnancy. The risk for suicidality is significantly elevated among depressed women in the perinatal period and has been found to be the second leading cause of death in the depressed population of pregnant women [14-16].

Perceived Racism and Postpartum Depression

The relationship of perceived racism and postpartum depression is important to look at given that systemic racism is constantly negatively impacting Black women and mothers. This is evidenced by a study conducted by Stepanikova & Kukla (2017), which involved collecting survey data mid-pregnancy and at 6 months postpartum on Black mothers with low and high education. The findings revealed that Black mothers with low education perceived higher racism and discrimination, which was in turn associated with higher odds of postpartum depression. Another study by Rosenthal and colleagues (2015) involved examining changes across pregnancy and postpartum as it relates to perceived discrimination for Black and Hispanic mothers [18]. The findings revealed that according to the age of the mother, perceived discrimination increased and decreased between trimesters and strongly predicted anxiety and depression among Black and Hispanic mothers that reported food insecurity [17,18].

The current study assessed the differences in perceptions of the healthcare community across annual income and perceived stress levels, and the relationship between perceived stress, perceived racism, postpartum depression, and the perceptions of the healthcare community among Black women. With the minimal amount of information on this topic there is a need for further research on maternal mortality and solutions as it pertains to Black Women and the role of perceived discrimination. The following research questions were explored (1) Are there differences in perceptions of the healthcare community for women that report high levels of stress and those that report low levels of stress? (2) Do the perceptions of racism moderate the relationship between Black women’s perceptions of the healthcare community and stress and (3) Are there differences in the perceptions of the medical health care community for Black women across income level? (4) Does the combination or combined influence of perceptions of the healthcare community and income predict postpartum depression than either variable alone?

Methods

Research Design

To understand the differences in perceptions of the healthcare community across annual income, and the relationship between perceived stress, perceived racism, & postpartum depression among Black women, survey methodology was used. Twenty percent of data were randomly reentered. Frequency and distributions were run to ensure data is in acceptable data ranges. Non-Parametric Independent Sample T-tests were run to investigate differences in the perceptions of the healthcare community across stress and income. Spearman Rho correlations were run to investigate relationships between primary variables. Standard, Multiple, and Hierarchical regressions were run to investigate the moderating role of perceived racism and combined influence of perceptions of the healthcare community and annual pre-tax income.

Participants

Two-Hundred Nineteen Black mothers were recruited for the present study and solicited through agencies that provide services to expecting mothers in the Triangle Area. Black mothers were also solicited via online platforms such as Facebook, Instagram, and Tiktok. The only requirements or exclusions were that all participants must be at least 18 years of age or older, had a baby within the last two years, and identify as Black or of African descent. Finally, Cohen’s (1992) power analysis determined that for results to be significant at the .05 alpha level, and using a medium effect size, the present study needed a total of at least 85 participants to assess perceptions of the healthcare community, perceived stress, perceived racism, and postpartum depression. However, given that regression analysis needed to be performed, 200 was needed according to Fidell [19,20].

Regarding the participants in this study, 9.6% were 18-25 years old, 20.5% were 25-30 years old, 32.9% were 30-35 years old, and 37% were 35 years of age or older. In terms of their level of education, 6.4% of the participants were continuing education students, 1.4% non-degree seeking, .5% undergraduate freshmen, 2.3% sophomore, 3.7% junior, 6.4% senior, 42.5% Bachelor’s, 10% Master’s/Doctoral, and 19.6% Associate’s. 95.9% of the participants reported being enrolled full-time in school. 33.8% of the participants in the study reported being married.

In terms of socioeconomic status, 2.7% reported having an income of $15,000 or less, 34.7% reported having an income of $45,001-$60,000, and 5.5% reported making approximately over $100,000 a year. Regarding children, 74.5% of the participants reported having 3 children or less, while 6.4% of participants reported having a total of five or more children. Regarding children that were given birth to within the last five years, 89.4% of the participants reported having 1-2 children, while 1.9% of the participants reported having a total of four or more children. In terms of prenatal care, 95% of the participants reported having received it, while 5% reported not receiving prenatal care.

Regarding mental health counseling during or after pregnancy, 22.9% of the participants reported having received counseling, while an average of 89% of participants reported not receiving counseling and 92.2% of the participants reported experiencing financial difficulties, while 7.8% reported experiencing no financial difficulties. Roughly 90.9% of the participants reported being the primary caregiver of their children. Fifty point two percent of the participants reported having 3-4 family members or friends that help raise the child, while 33.8% of the participants reported having 4 or more family members or friends that help.

Forty-five-point two percent of the participants reported that they have sometimes seen media coverage regarding maternal health, while 7.8% of the participants reported that they have very often seen media coverage regarding maternal health. Thirty-nine point three percent of the participants reported that they have sometimes heard family or friends discuss maternal health, while 11.4% of the participants reported that they have very often heard family or friends discuss maternal health. Thirty point six percent of the participants reported having attended maternal health support groups sometimes, while 19.2% of the participants reported having attended maternal health support groups very often (Table 1).

Table 1: Descriptive Statistics for Participants’ Demographic Information.

Variable

Mean SD n

%

Age     219 100
18-25     21 9.6
25-30     45 20.5
30-35     72 32.9
35 or Older     81 37
Race/Ethnicity        
African     15 6.8
Black American     104 47.5
Afro-Black Caribbean     48 21.9
Afro-Black Latin X     38 17.4
Afro Latino     14 6.4
Region        
Northeast     19 8.7
Southwest     47 21.6
West     52 23.9
Southeast     63 28.9
Midwest     37 17
Missing     1  
Enrollment Status        
Part-Time     9 4.1
Full-Time     209 95.9
Missing     1  
Education        
High-School Diploma/GED     16 7.3
Freshman     1 .5
Sophomore     5 2.3
Junior     8 3.7
Senior     14 6.4
Bachelor’s Degree     93 42.5
Continuing Education Student     14 6.4
Masters/Doctoral/Professional     22 10
Non-Degree Seeking     3 1.4
Associates degree     43 19.6
Marital Status        
Single     13 5.9
In a Relationship     81 37
Married     74 33.8
Separated     25 11.4
Divorced     20 9.1
Widowed     6 2.7
Annual Income        
$15,000 or less     6 2.7
$15,001 – $30,000     19 8.7
$30,001 – $45,000     45 20.5
$45,000 – $60,000     76 34.7
$60,001 – $80,000     50 22.8
$80,000 – $100,000     11 5
Over $100,000     12 5.5
Number of Children        
1     24 11
2     56 25.6
3     83 37.9
4     42 19.2
5+     14 6.4
Number of Children in the last Five years        
1     119 54.8
2     75 34.6
3     19 8.8
4     3 1.4
5+     1 .5
Missing     2  
Prenatal Care During Pregnancy        
No     11 5
Yes     208 95
Pregnancy Complications        
No     19 8.7
Yes     199 91.3
Missing     1  
Mental Health Services During Pregnancy        
No     196 88.1
Yes     26 11.9
Missing     1  
Mental Health Services After Pregnancy        
No     195 89
Yes     24 11
Financial Difficulties During Pregnancy        
No     17 7.8
Yes     201 92.2
Missing     1  
Average Work Hours/ Week        
5 hours or less     8 3.7
5-10 hours     16 7.3
10-15 hours     102 46.6
15+ hours     93 42.6
Number of Jobs        
None     4 1.8
One     83 38.1
Two     95 43.6
Three     32 14.7
More than Three     4 1.8
Missing     1  
Primary Caregiver        
No     20 9.1
Yes     199 90.9
Number of Family/Friends That Help        
1-2     35 16
3-4     110 50.2
4+     74 33.8
Media on Maternal Health        
Very Often     17 7.8
Often     86 39.3
Sometimes     99 45.2
Not at All     17 7.8
Maternal Health discussed. By Family/Friends        
Very Often     25 11.4
Often     72 32.9
Sometimes     86 39.3
Not at All     36 16.4
Maternal Health Support Groups        
Very Often     42 19.2
Often     47 21.5
Sometimes     67 30.6
Not at All     63 28.8
N=219        

Measures

Demographics

Demographic information was collected by asking the participants to indicate their age, race or ethnicity, region of the U.S. in which they were born, current or previous enrollment status in school, highest level of education received, marital status, annual pre-tax income, number of children, number of children they had within the last five years, whether they received prenatal care during pregnancy, whether they experienced pregnancy complications, whether they received counseling during or after pregnancy, whether they experienced financial difficulties during pregnancy, how many hours a week they work, how many jobs they hold, whether they are the primary caregiver, and number of family or friends that help with child caring. The questionnaire also assessed aspects of the individual’s awareness about maternal health outcomes and if they have attended maternal health support groups for women of color.

Perceptions of the Healthcare community

The Discrimination in Medical Settings Scale

In 1997, David Williams and his colleagues cultivated a scale known as the Everyday Discrimination Scale (EDS) [21]. This widely utilized and measure of self-reported discrimination was adapted and modified into the DMS. The Discrimination in Medical Settings Scale is a 7-item 5-point Likert scale (1-never, 2-rarely, 3-sometimes, 4-most of the time, 5-always) used to assess discrimination in medical settings. Some examples of items are as follows: 1) You are treated with less respect than other people. 2) A doctor or nurse is not listening to what you were saying. 3) A doctor or nurse acts as if he or she thinks you are not smart. 4) The doctor or nurse acts as if he or she is afraid of you. This measure was found to be of good internal reliability; Cronbach’s alpha for the 7-item scale was 0.89 or higher. This measure also expanded upon the previous measures of discrimination and provided more focus on defining experiences of discrimination in healthcare settings.

Perceived Stress

Perceived Stress Scale

In 1983, Sheldon Cohen and his colleagues cultivated a scale known as the Perceived Stress Scale (PSS) [22]. This is the most widely used psychological instrument for measuring the perception of stress within the last 30 days. The Perceived Stress Scale (PSS) is a 10-item 4-point Likert scale (0-never, 1-almost never, 2-once in a while, 3-often, 4-very often). Some examples of items are as follows: 1) In the last month, how often have you felt that things were going your way? 2) In the last month, how often have you found that you could not cope with all the things that you had to do? 3) In the last month, how often have you felt nervous and stressed? 4) In the last month, how often have you felt that you were on top of things? This measure was found to be of good internal reliability; Cronbach’s alpha for the 10-item scale was 0.70 or higher. This measure also expanded upon the previous measures of stress.

Perceived Racism

The Perceived Racism Scale.

In 1996, Mcneily and her colleagues cultivated a scale known as the Perceived Racism Scale (PRS) [23]. This scale was created to assess the experiences of white racism against Blacks in multiple domains including employment and public domains. The Perceived Racism Scale (PSS) is a 14-item 4-point Likert scale (0-never, 1-rarely, 2-sometimes, 3- fairly often, 4-very often). Some examples of items are as follows: 1) How often in the past year have you had difficulty getting a loan because you are Black? 2) How often during your life have waiters and waitresses ignored you and served whites first? 3) How often in the past year have people “talked down” to you because you are Black? 4) How often in the past year have you experienced being followed, stopped, or arrested by White police more than others because of your race? This measure was found to be of good internal reliability; Cronbach’s alpha for the 14-item Likert scale was 0.70 or higher. This measure also expanded upon the previous measures of racism.

This scale was adapted to be appropriate for use in a cohort of Black mothers that have had a baby within the last two years. The Adapted Perceived Racism Scale (PSS) is a 12-item 5-point Likert scale (1-never, 2-less than once a year, 3-a few times a year, 4- about a few times a month, 5-once a week or more). Some examples of items are as follows: 1) How often have you been made to feel intimidated or less intelligent by doctors or nurses? 2) How often have you had a doctor or nurse make minimal eye contact with you or don’t give you a thorough physical examination? 3) How often do you feel that you have had to work twice as hard to explain your symptoms to a doctor for them to take you seriously? 4) How often do you feel that you are ignored or not taken seriously by doctors or nurses? This measure was found to be of good internal reliability; Cronbach’s alpha for the 12- item scale was 0.925. This measure also expanded upon the previous measures of racism.

Postpartum Depression

The Edinburgh Postnatal Depression Scale

In 1987, Cox and colleagues developed this scale to assist health professionals in detecting mothers that are suffering from postpartum Depression [24]. Postpartum is defined as a prolonged “blues” that can begin for the mother within a week after delivery of the baby. The Edinburgh Postnatal Depression Scale (EDPS) is a 10-item 3-point Likert scale (0-yes, all of the time, 1-yes, most of the time, 2-no, not very often, 3-no, not at all). Some examples of items are as follows: 1) I have felt miserable or sad.2) I have been so unhappy that I have been crying. 3) The thought of harming myself has occurred to me. 4) I have been so unhappy that I have had difficulty sleeping.

Procedures

To assess the differences in perceptions of the healthcare community across annual income, and the relationship between perceived stress, perceived racism, and postpartum depression, the present researcher submitted the study to the NCCU Institutional Review Board for approval. After receiving approval, the researcher contacted maternal health agency directors to gain permission to solicit participation from their mothers. The researcher also solicited participation from social media platforms such as Facebook, Instagram, and TikTok. The data was collected via an online survey on Qualtrics where the participants first completed a consent from, the demographic measure, and then completed the Discrimination in Medical Settings Scale, Perceived Stress Scale, The Perceived Racism Scale (Adapted), and The Edinburgh Postnatal Depression Scale to examine the variables. Participants were provided with a list of local mental health resources at the end of the survey [14-21].

Results

Data analysis was conducted using the SPSS 29.0 software. Frequency distributions were run to ensure that the data was within normative ranges. Spearman Rho correlations were calculated to examine the primary variables and demographic variables. Multiple and hierarchical regressions were utilized next to view to what extent perceived racism is a moderator for perceptions of the medical health community and perceived stress. As well as the combined influence of perceptions of the healthcare community and annual pre-tax income as predictors of postpartum depression. Median scores were created for each scale (see Table 2).

Table 2: Psychometric Properties (Medians and Ranges for Primary Variables).

Variables

Mdn

IQR

Perceived Stress (PSS)

29

14-40

Perceived Racism in Medical Settings (PRS) Postpartum Depression (PND)

49

14

12-60

4-37

Perceptions of the Medical Health Care Community (DMS)

26

7-35

Preliminary Analysis

In order to understand differences in the healthcare community across income, and the relationship between perceived stress, perceived racism, and postpartum depression among Black women Spearman Rho correlations were run. Spearman Rho correlations to assess the relationship between primary variables. The results revealed that there was a significant positive relationship between perceptions of the healthcare community and perceived stress (rs=.75, p≤0.001). Perceptions of the healthcare community was related to perceived racism (rs=.67, p≤0.001). Perceived racism was related to perceived stress (rs=.68, p≤0.001). Perceived stress and postnatal depression were negatively associated and not significant, however, it was approaching (rs=-.13, p=.06). Perceived stress and postnatal depression were negatively related (rs=-.14, p≤0.05). The Annual Pre-Tax Income was not significantly related to any of the primary variables (Tables 2 and 3).

Table 3: Correlation Results for Primary Variables

Variables

API PND DMS PSS

PRS

Annual Pre-Tax Income (API)          
Postpartum Depression (PND)

-.017

       
Discrimination in Medical Settings (DMS)

-.028

-.110

     
Perceived Stress (PSS)

.026

-.141*

.752**

   
Perceived Racism (PRS)

.017

-.130 .671**

.675**


p<.05* p<.01** p<.001***

Hypothesis 1: Differences in Perceptions of the Healthcare Community Across Levels of Stress

To assess differences in perceptions of the Healthcare community across levels of stress, a Mann Whitney U Test was run. The Mann Whitney U Test indicated that negative perceptions of the healthcare community were greater for individuals that reported higher levels of stress (Mdn=29) than those that had lower levels of stress (Mdn=21) (See Table 4a) that reported high levels of perceived stress (U=10638.5, p≤0.05) (see Table 4b).

Table 4a: Statistics: Perceptions of the Medical HealthCare.

Community across levels of Stress

Stress Group

DMS

1 Median

21
2 Median

29

Table 4b: Independent -Samples Mann-Whitney U.

Stress Group

1 (n=219)

2 (n=219)

Perceptions of the Mean Rank Medical HealthCare Community (DMS) 67.79

Mean Rank Z-Value

152.60 -9.921

Hypothesis 2: Perceptions of Racism as a Moderator between Perceptions of the Healthcare Community and Stress

In the first regression analysis, perceptions of racism were examined as a moderator between the perceptions of the healthcare community and perceived stress. The first regression model accounted for 49% of the variance (R2=.49., F (1,218)=, p≤0.001). Independently, perceived racism was associated with perceived stress among Black women (b=.70, p≤0.001). The results of the second regression model explained that these combined variables accounted for 62% of the variance (R2=.617, F (2,218)=, p≤0.001) and perceptions of the healthcare community was associated with perceived stress in Black women (b=.53, p≤0.001). In the third model of the regression analysis, the interaction term (perceptions of the healthcare community x perceived racism) was entered into the model to determine the possibility of moderation. The model was significant and accounted for 63% of the variance (R2=.63, F (3,218)=, p≤0.001), and there was evidence for moderation (∆R2=.009, ∆F=4.95). Independent Samples Non-Parametric Mann Whitney U Tests were run and individuals who were high in perceived stress (Mdn=52) reported significantly more racism than individuals that were low in perceived stress (Mdn=43) (U=10077.5, p≤0.001)) (Table 5).

Table 5: Moderator Analysis: Perceived Racism and Perceptions of the Medical Health Care Community on Perceived Stress.

β p R2

∆R2

Model 1

Perceived Racism (PRS)

.70

.001*** .49

.49

Model 2

Perceptions of the Medical Health Care Community (DMS)

.53

.001*** .62

.13

Model 3

PRS x DMS

.49

.001*** .63

.01

*p< .05, **p<.01, ***p<.001

Hypothesis 3: Perceptions of the Healthcare Community and Income

To assess mean differences in the perceptions of the healthcare community, a One-Way ANOVA was run. Results of the ANOVA indicated that there was significant mean difference in perceptions across income F(6, 218)=6.79, p≤0.001) (Table 6). Post Hoc analysis using Tukey and Bonferroni indicated that individuals that made $45,000-$60,0000 reported more favorable views of the healthcare community than those who made $30,000 and less and individuals who made over $100,000.

Table 6: One-Way ANOVA: Perceptions of the Medical Health Care Community across Income.

Source

df SS MS F p

N

Between Groups

6

1369.321 228.220 6.79 <.001***

218

Within Groups

212

7129.237 33.628    

218

Total

218

8498.557


p< .05* p< .01** p< .001***

Hypothesis 4: Perceptions of the Healthcare Community and Annual Pre-Tax Income as Predictors Postpartum Depression

The fourth hypothesis predicted that Perceptions of the Healthcare community and Annual Pre-Tax Income combined will be better predictors of Postpartum Depression than either variable alone. Standard and multiple regressions were run. Independently, perceptions of the healthcare community accounted for 3% of the variance in postpartum depression among Black women F(1, 218)=5.52, p≤0.05) (See Table 7) and was a significant negative predictor of postpartum depression among Black women (b=-.16, p≤0.05). Independently, annual pre-tax income accounted for less than 1% of the variance in postpartum depression among Black women F(1,218)=.25, p=ns and was not significantly associated with postpartum depression (b=.03, p=ns). Combined in the regression model, perceptions of the healthcare community and annual pre- tax income accounted for 3% of the variance and the model was approaching significance F(2, 218)=2.962, p≤0.054 (See Table 7). Thus, hypothesis 4 was not supported but approaching significance.

Table 7: Predictors of Postpartum Depression.

β p

R2

Model 1

Perceptions of the Medical Health Care Community (DMS)

-.157

.020*

.025

Model 2

Annual Pre-Tax Income

-.034

.620

.001

Model 3

DMS + Income

-.204

.001***

.018

*p< .05, **p<.01, ***p<.001.

Discussion

Findings

The current study was conducted to better understand differences and relationships in perceptions of the healthcare community, annual pre-tax income, perceived stress, perceived racism, and postpartum depression. In doing so, we hoped to provide detailed results about the relationships between these variables while also pinning down potential underlying factors. Research on perceptions of the healthcare community, annual pre-tax income, perceived stress, perceived racism, and postpartum depression among Black women has been largely qualitative. The current study sought to assess the relationship between perceptions of the healthcare community, annual pre-tax income, perceived stress, perceived racism, and postpartum depression.

We found a statistically significant difference in perceptions of the healthcare community between participants reporting high versus low perceived stress. This finding is consistent with prior literature examining healthcare mistrust, discrimination, and stress among Black women. Previous studies have shown that negative healthcare experiences and perceived discrimination are associated with increased psychological distress and stress-related outcomes [18-25]. For example, Cuevas and colleagues have documented that African American adults who report greater mistrust in healthcare institutions also report poorer psychological outcomes, including heightened stress and negative emotional responses related to healthcare encounters. Qualitative and quantitative studies by Cuevas and colleagues further indicate that experiences of discrimination, poor communication, and lack of respect in medical settings contribute to diminished trust and increased stress among Black patients [8,25]. These experiences are frequently framed as discrimination-related stressors rather than isolated interpersonal events. Related work has also demonstrated that medical mistrust and perceived discrimination are associated with adverse mental health outcomes among Black patients, including anxiety and depressive symptoms. Studies using established measures of physician mistrust and institutional medical mistrust have shown that discriminatory healthcare experiences contribute to stress and disengagement from care [26,27].

We found evidence of a moderation effect; women that were low on the PRS reported higher stress and those that were high in PRS reported less stress. Black women who had higher perceptions of racism reported higher levels of stress, whereas Black women that had lower perceptions of racism reported lower levels of stress. These findings are consistent with previous research by Suárez-Rico and his colleagues (2021) involved collecting data on postpartum Mexican mothers between August and September 2020 [13]. The purpose of this study specifically was to look at the perceived stress accumulated from COVID-19 by a postpartum mother. The findings from this study revealed that depression, anxiety, and perceived stress was higher during the COVID-19 pandemic lockdown for Mexican postpartum mothers than previously reported in literature.

We also found that there was a statistically significant mean difference in perceptions of the healthcare community across incomes. More specifically, we found that lower and higher income Black mothers reported less favorable views of the healthcare community than the middle-class income Black mothers. These findings could indicate that lower income women have a perceptual bias or potentially received subpar levels of care. Middle-class income women have insurance and certain expectations along with a certain level of education about the prenatal process. High income women have insurance, have the money to pay for prenatal health experts, and may live with a heightened awareness of racism. and the resources to pay for experts.

We lastly found that perceptions of the healthcare community accounted for more of the variability in postpartum depression than annual pre-tax income as an independent predictor. These findings are consistent with previous research while adding more information to the literature about Black women [28].

Conclusions

The purpose of this study was to assess differences in perceptions of the healthcare community across annual income, and the relationship between perceived stress, perceived racism, and postpartum depression. The results from this study give distinctive insight into Black women’s pregnancy and birthing experience, as well as how varying factors such as annual pre-tax income and social support, can act as potential buffers for postpartum depressive symptomatology. Future research is warranted given maternal and mental health challenges among the population and continued systematic racism and negative perceptions of the healthcare community.

Future studies investigating the relationship between perceptions of the healthcare community, perceived stress, perceived racism, and postpartum depression may benefit greatly from more extensive participant solicitation techniques via the internet (i.e., snowballing, purposive sampling) and in-person data collection in maternal health agencies. It is imperative that the researcher takes time to build relationships (i.e., volunteering, participating in different events or activities, etc.) with the maternal health agencies before soliciting participants. It is also imperative that future research focus on empowering Black women, through programmatic activities, to be aware of and then effectively manage the morbidities that are most associated with poor clinical maternal outcomes [29].

References

  1. Novoa C, Taylor J (2018) Exploring African Americans’ high maternal and infant death Center for American Progress. Available from: https://www. americanprogress.org/issues/early-childhood/reports/2018/02/01/445576/ exploring-African-Americans-high-maternal-infant-death-rates
  2. Centers for Disease Control and Prevention (2021) Working Together to Reduce Black Maternal Mortality.
  3. Lister RL, Drake W, Scott BH, Graves C (2019) Black Maternal Mortality-The Elephant in the World J Gynecol Womens Health 3(1): 10.33552/wjgwh.2019.03.000555. [crossref]
  4. Koblinsky M, Chowdhury ME, Moran A, Ronsmans C (2012) Maternal morbidity and disability and their consequences: neglected agenda in maternal J Health Popul Nutr 30(2): 124-130. [crossref]
  5. Pieterse AL, Todd NR, Neville HA, Carter RT (2012) Perceived racism and mental health among Black American adults: a meta-analytic review. J Couns Psychol 59(1): 1-9. [crossref]
  6. Brandon DT, Isaac LA, LaVeist TA (2005) The legacy of Tuskegee and trust in medical care: is Tuskegee responsible for race differences in mistrust of medical care? J Natl Med Assoc 97(7): 951-956. [crossref]
  7. Blair IV, Steiner JF, Fairclough DL, et al. (2013) Clinicians’ implicit ethnic/racial bias and perceptions of care among Black and Latino patients. Ann Fam Med 11(1): 43-52. [crossref]
  8. Cuevas AG, O’Brien K, Saha S (2016) African American experiences in healthcare: “I always feel like I’m getting skipped over”. Health Psychol 35(9): 987-995. [crossref]
  9. Okoro ON, Hillman LA, Cernasev A (2020) “We get double slammed!”: Healthcare experiences of perceived discrimination among low-income African-American Womens Health (Lond) 16: 1745506520953348. [crossref]
  10. Berry J, Caplan L, Davis S, et (2010) A black-white comparison of the quality of stage-specific colon cancer treatment. Cancer 116(3): 713-722. [crossref]
  11. Collins KS, Tenney K, Hughes DL (2002) Quality of health care for African Americans: findings from the Commonwealth Fund 2001 health care quality New York, NY: The Commonwealth Fund.
  12. Sidor A, Kunz E, Schweyer D, Eickhorst A, Cierpka M (2011) Links between maternal postpartum depressive symptoms, maternal distress, infant gender and sensitivity in a high-risk Child Adolesc Psychiatry Ment Health 5(1): 7. [crossref]
  13. Suárez-Rico BV, Estrada-Gutierrez G, Sánchez-Martínez M, et al. (2021) Prevalence of Depression, Anxiety, and Perceived Stress in Postpartum Mexican Women during the COVID-19 Int J Environ Res Public Health 18(9): 4627. [crossref]
  14. Fisher J, Cabral de Mello M, Patel V, et al. (2012) Prevalence and determinants of common perinatal mental disorders in women in low- and lower-middle-income countries: a systematic review. Bull World Health Organ 90(2): 139G-149G. [crossref]
  15. Halbreich U, Karkun S (2006) Cross-cultural and social diversity of prevalence of postpartum depression and depressive symptoms. J Affect Disord 91(2-3): 97-111. [crossref]
  16. Lindahl V, Pearson JL, Colpe L (2005) Prevalence of suicidality during pregnancy and the postpartum. Arch Womens Ment Health 8(2): 77-87. [crossref]
  17. Stepanikova I, Kukla L (2017) Is Perceived Discrimination in Pregnancy Prospectively Linked to Postpartum Depression? Exploring the Role of Matern Child Health J 21(8): 1669-1677. [crossref]
  18. Rosenthal L, Earnshaw VA, Lewis TT, et al. (2015) Changes in Experiences With Discrimination Across Pregnancy and Postpartum: Age Differences and Consequences for Mental Health. American Journal of Public Health 105(4): 686-693. [crossref]
  19. Cohen J (1992) A power Psychol Bull. 1992 112(1): 155-159. [crossref]
  20. Tabachnick BG, Fidell LS (2007) Using multivariate statistics. 5th New York, NY: Pearson Education.
  21. Williams DR, Yu Y, Jackson JS, Anderson NB (1997) Racial differences in physical and mental health: Socio-economic status, stress and J Health Psychol 2(3): 335-351. [crossref]
  22. Cohen S, Kamarck T, Mermelstein R (1983) A global measure of perceived stress. J Health Soc Behav 24(4): 385-396. [crossref]
  23. McNeilly MD, Anderson NB, Armstead CA, et (1996) The perceived racism scale: a multidimensional assessment of the experience of white racism among African Americans. Ethn Dis 6(1-2): 154-166. [crossref]
  24. Cox JL, Holden JM, Sagovsky R (1987) Detection of postnatal depression. Development of the 10-item Edinburgh Postnatal Depression Br J Psychiatry 150: 782-786. [crossref]
  25. Cuevas AG, O’Brien K (2019) Racial centrality may be linked to mistrust in healthcare institutions for African J Health Psychol 24(14): 2022-2030. [crossref]
  26. LaVeist TA, Isaac LA, Williams KP (2009) Mistrust of health care organizations is associated with underutilization of health services. Health Serv Res 44(6): 2093-2105. [crossref]
  27. Bazargan M, Cobb S, Assari S (2021) Discrimination and Medical Mistrust in a Racially and Ethnically Diverse Sample of California Ann Fam Med 19(1): 4-15. [crossref]
  28. Hansotte, E, Payne, S. I, Babich, S. M (2017) Positive postpartum depression screening practices and subsequent mental health treatment for low-income women in Western countries: a systematic literature review. Public Health Reviews, 38(3). [crossref]
  29. Collins-McNeil J, Edwards CL, Batch BC, Benbow D, McDougald CS, et al. (2012) A culturally targeted self-management program for African Americans with type 2 diabetes mellitus. Can J Nurs Res 44(4): 126-141. [crossref]

Examining the Impact of Cultural Education on Fertility Behaviours Among Schoolgirls in South African Schools

DOI: 10.31038/AWHC.2025843

Abstract

The South African government has introduced various policies designed to prevent and manage learner pregnancy within schools. These initiatives form part of a broader national effort to address the social and health challenges that young people encounter across the country. Despite various interventions, teenage pregnancy remains a persistent social and public health challenge in South Africa with the rates of pregnancy and subsequent school dropouts among these young mothers persist, leading to severe economic consequences and perpetuating cycles of poverty. This paper examines how cultural education affects fertility behaviors among schoolgirls in South Africa, drawing from contemporary literature on cultural norms, teenage pregnancy, and school-based interventions. Evidence suggests that culturally grounded learning improves critical awareness, supports contraceptive uptake, and empowers girls to navigate pressures from families and communities. However, cultural barriers, religious norms, and moralistic attitudes often limit the effectiveness of these initiatives.

Keywords

Teenage pregnancy, Poverty, Cultural barriers, Prevention, Contraceptives

Introduction

Teenage pregnancy is a major concern in South African schools, with thousands of pregnancies recorded each year [1]. In support of this is [2] who argues that South Africa has one of the highest teenage pregnancy rates in the world, with nearly one in four girls becoming pregnant before the age of 20. According to Statistics South Africa, 90,037 girls aged 10 to 19 gave birth across the nine provinces between March 2021 and April 2022 (Stats SA [3]). This pattern highlights the urgent need for comprehensive sexual and reproductive health education and adolescent‑focused services to help curb rising teenage pregnancy rates, particularly during periods of crisis [4].

Many of pregnancies occur in contexts shaped by cultural expectations related to femininity, sexuality, and motherhood [5]. According to [6] cultural norms often transmitted through families, communities, and religious institutions play a significant role in shaping adolescents’ fertility decisions. Hence, [7], argues that 85% of pregnant women indicated that their families favoured their pregnancy. Research also shows that peer education and cultural dialogue are important interventions in addressing contraceptive behavior [8] and [2], but these efforts must meaningfully engage cultural and religious influences to be effective.

Therefore, cultural education, when integrated into school curricula, can challenge harmful norms, promote informed reproductive choices, and empower schoolgirls. Hence, is of paramount important to undergo this study as it aims to explore how such education affects fertility behavior among schoolgirls.

Literature Review

Cultural Norms as Predictors of Fertility Behavior

Socio‑cultural factors such as religion, ethnicity, and community beliefs significantly predict teenage pregnancy in South Africa. In the same vein, [9] argus that cultural beliefs and principles play a significant role in shaping the social landscape of the macrosystem. For instance, cultural predictors such as religious affiliation and ethnicity strongly influence adolescent fertility, especially in urban areas. In the same breath, [1] argues that the influence of ethnicity and religion play a crucial role more so in urban areas than in rural areas. All these are found in the macrosystem the adolescent leaves in. Above all, these norms shape beliefs about ideal family size, the acceptability of contraceptive use, and the meaning of womanhood [2]. In the same breath, [10] argues that women’s fertility preferences such as the number of children they desire and their willingness to use modern family planning methods are shaped by a complex interplay of social, economic, and cultural factors operating at multiple levels, often reinforcing or counterbalancing one another. Demographic characteristics including age and geographic context, levels of education [11‑13], religious orientation [14], as well as prevailing social norms and cultural beliefs [15], all play influential roles in determining women’s fertility aspirations and their adoption of family planning practices. Together, these factors contribute significantly to broader fertility patterns.

The Role of Education in Shaping Reproductive Behavior

Educational interventions, particularly peer education programs, have been shown to improve young people’s sexual health knowledge and reduce risky behavior. Hence, [2] argues that cultures, values, and traditions influence the prevailing negative perception of teenage mothers. However, their effectiveness is constrained if they do not address cultural and religious pressures. As one study found, cultural norms, church teachings, and community expectations limited adolescents’ ability to mentor peers on contraception, despite improved knowledge [1]. In the same vein, [16], argues that such perceptions have a key influence on decision‑ making processes and behaviour and may be particularly important in contexts of subsistence livelihoods and resource constraints, where households are vulnerable to both food insecurity and environmental degradation.

School Policy, Gender Norms, and Reproductive Outcomes

South African schools often operate within moralistic and conservative discourses around sexuality. These school‑based cultural norms can affect students’ reproductive choices. Research indicates that dominant school cultures that frame teenage pregnancy as moral failure reinforce shame, exclusion, and silence factors that limit informed fertility choices [17].

Cultural Education as an Intervention

Cultural education helps learners question harmful traditions, challenge myths about contraception, and understand the cultural roots of gender expectations. By discussing cultural norms openly, girls can develop stronger decision‑making skills. Literature further suggests that including cultural discussions in reproductive health interventions increases adolescents’ acceptance of contraception and reduces pregnancy risk [18]. On the other hand, [19] argues that cultural education serves as a mechanism to challenge and reshape these dominant social norms by engaging students in discussions about traditions, beliefs, and cultural misconceptions.

Theoretical Framework

This study is underpinned by Social Norms Theory (SNT). Social norms theory explains how individuals often misjudge the attitudes or behaviours of their peers and wider community, assuming them to differ from their own. This pattern of misunderstanding referred to as pluralistic ignorance [20] can arise in relation to both risky or problematic behaviours as well as healthy or protective ones. Such misperceptions may lead people to modify their own behaviour to align with what they mistakenly believe to be the norm [21]. As a result, individuals may adopt or justify harmful behaviours or, conversely, suppress positive, health‑promoting behaviours.

The Social Norms Theory asserts that individuals’ behaviours are shaped by perceived social expectations, cultural beliefs, and community norms. This theory deemed relevant to the current study as it allows the researcher to explain why schoolgirls may conform to social expectations encouraging early sexual activity or discouraging contraceptive use. Furthermore, it will guide the researcher to propose the interventions which will correct these misperceptions by revealing the actual, healthier norm that will have a beneficial effect on adolescent girl in, to reduce their participation in potentially problematic behaviour or be encouraged to engage in protective, healthy behaviours [22].

Methodology

Research Design

The methodology employed in this study involved the implementation of a systematic literature review research strategy synthesizing findings from peer‑reviewed studies, government reports, and policy documents exploring cultural influences on adolescent fertility. The researcher searched for peer‑reviewed studies on socio‑cultural predictors of teenage pregnancy, school‑based responses to teenage pregnancy, South African public health and educational reports and studies examining the interaction between culture and contraceptive use via google scholar.

This approach involved the meticulous identification and selection of relevant articles, as well as the exclusion of those that did not meet the predetermined inclusion criteria [2]. The detailed process of article retrieval, inclusion, and exclusion is elaborated upon in this section. According to [23], as cited in [24], conducting reviews transparently and reproducibly is what the systematic literature review as a research method aims to achieve. Above all, it enables the researcher to make selection of articles to incorporate or omit in the study [24]. Upon completing the reading, themes were identified across the literature reviewed, which includes, cultural norms and fertility, school‑based cultural influences, effects of cultural education, and barriers to culturally relevant sexual education.

Discussion

Cultural Education Improves Reproductive Knowledge

Evidence shows that when cultural beliefs are openly discussed in education settings, students gain a more nuanced understanding of fertility and contraception. Peer‑education programs, when culturally grounded, increase knowledge and enable adolescents to critically examine cultural messages about sexuality [1].

Challenging Myths and Misconceptions

Several scholars [25‑27] contend that rumours surrounding contraceptives such as beliefs that injectable methods damage the body negatively and oral contraceptives cause lower rates of acne, hirsutism, and weight gain, but higher rates of venous thromboembolism [28] influence both access to and utilisation of contraception. These misconceptions contribute to low contraceptive uptake, which in turn results in high levels of unmet need and increased rates of unintended pregnancy among adolescent girls and women. Similarly, [29] notes that many individuals are more preoccupied with the perceived negative side effects of contraceptives than with their effectiveness in preventing unwanted pregnancies. [27] further report that numerous adolescent girls and women cite side effects such as weight gain or loss, irregular bleeding, amenorrhea, and other bodily changes as reasons for avoiding contraceptive use. Participants also expressed fears that contraception could cause infertility or make the vagina “too wet,” leading to concerns about being viewed as undesirable by partners. Condoms, on the other hand, were often associated with discomfort, irritation from lubricants, and suspicions of infidelity. These misconceptions persist largely due to limited contraceptive education, particularly in low‑ and middle‑income countries (LMICs) [27]. Cultural beliefs such as the idea that contraceptives cause infertility also to exacerbate these concerns. [30] argue that dismissing these beliefs as mere rumours simply because they stem from social accounts of other women’s experiences rather than from clinical providers undermines a valuable and legitimate source of knowledge for many women.

Consequently, Jones (2023) argues that the decision to initiate contraception and select a method requires careful consideration; however, conflicting and confusing information often leaves individuals without the necessary knowledge to make informed choices. Culturally sensitive education has therefore been identified as essential for dispelling myths, reducing fear, and promoting informed contraceptive decision‑making. On the other hand, many programs recommend that providers address women’s concerns about the possible negative health effects of contraceptive methods by reassuring them that such fears are unfounded and that any side effects are likely to be minimal [31,32]. This type of counselling is commonly advocated in research that identifies associations between women’s beliefs and their contraceptive use [26,33‑35].

Empowering Girls Against Harmful Gender Norms

Many South African girls face cultural pressure to prove fertility, maintain submissiveness to partners, or conform to traditional femininity. Cultural education empowers girls to question these norms, advocate for themselves, and resist early sexual debut. According to [1] statistics of girls affiliating to traditional African religion were significantly positive with a 24% higher likelihood of pregnancy compared with Christian girls, while it was not significant and almost equal with a 1% lower chance of pregnancy among rural dwellers. This indicates that cultural education has its ways of decreasing teenage pregnancy. As observed in a practice of Basotho culture, where girls are not allowed to eat food such as eggs and intestine . This kind of practice is pass down to girls through gathering such as pitiki. According to [36], Basotho women gather during pitiki celebrations to support one another, share their experiences, and offer advice on addressing various challenges, particularly those involving their marriages or relationships with men. Consequently, ([37]: 88) agrees with [36] by pointing out that ‘we need new alternatives and sometimes this means revisiting the old wisdoms and tapping into the maternal legacies of knowledge in Africa’. Hence, pitiki is seen as a good space were Indigenous Basotho women’s knowledges related to sexual, reproductive health and well‑being, maternal and child health within and around the Indigenous are discussed [38]. In this space, girls are free to discuss any matters related to sex, as such this helps to reduce teenage pregnancy.

Addressing Cultural and Religious Barriers

Studies show that religion and cultural identity strongly influence teenage fertility. Cultural education enables learners to navigate these influences by offering critical reflection rather than dismissing cultural identity. Programs that ignore culture tend to be ineffective [2]. Previous research has highlighted religion understood as systems of faith and worship as a factor that influences teenage pregnancy [39,40]. In the South African context, the influence of religion on teenage pregnancy appears to stem largely from religious teachings that discourage the use of contraceptives. For example, a study conducted in the North‑West province found that 6.83% of participants believed that using contraception was against their religious beliefs [41]. Likewise, research carried out in the Vhembe district of Limpopo reported that, because most teenagers (94.1%) identified as Christian, religious beliefs played a significant role in teenage pregnancy, as contraception was generally not supported [42]. Concurring to this is [1] who argues that the most affected groups are Nguni group (51%), Christian faith (84.9%) and lived in urban areas (53%) in KwaZulu‑Natal (21%). Therefore, understanding these cultural and religious influences is essential for developing effective, culturally and religiously sensitive reproductive health strategies that respect community beliefs while promoting women’s autonomy and well‑being.

The Role of Schools

The South African government has introduced various policies designed to prevent and manage learner pregnancy within schools. Amongst those policies is the Policy on the Prevention and Management of Learner Pregnancy in that was finalised in 2021 by the Department of Basic Education. The policy expressly provides that a school may not discriminate against a learner based on her pregnancy status [43]. The School Governing Body (SGB) is given the mandate to implement and fulfil the need of the policies governing the school [44]. This suggest that SBG in their policy will be in position to suggest the programmes that raise awareness on teenage pregnancy. Therefore, these initiatives form part of a broader national effort to address the social and health challenges that young people encounter across the country.

To reduce the likelihood of young people engaging in unsafe sexual practices, it is essential to equip them with the knowledge and skills necessary for practicing safe sex [45‑47]. Schools serve as an ideal setting for delivering this education, as they provide access to most children and adolescents. I therefore, argue that recently schools often perpetuate moralistic messages about sexuality, which create stigma around pregnancy and contraceptive use. This is because teachers offering sex education often use more passive forms of learning and tend to disregard skill‑oriented learning activities [48‑50]. On the same breath, [51] argue that cultural and societal taboos surrounding sexual and reproductive health strongly shape both educational content and public health policies. In many countries, school‑based sex education is either highly restricted or entirely absent due to cultural sensitivities and political opposition. The United States, for example, has long experienced controversy over abstinence‑only versus comprehensive sex education, with the preference for abstinence‑only approaches often grounded in religious and cultural norms [52]. In contrast, nations that adopt more open and comprehensive approaches to sexual health such as the Netherlands report lower rates of teenage pregnancy and sexually transmitted infections [53]. These comparisons demonstrate how cultural contexts are both reflected in and reinforced by policy choices, which signal varying levels of societal comfort and openness toward sexual and reproductive health topics. Therefore, changing school culture through inclusive cultural education can create safer environments for discussing reproductive choices [2].

Conclusion

It has been observed that fertility choices such as preferred family size, timing of childbearing and contraceptive use are deeply shaped by cultural and religious norms as well as social expectations. In many communities, beliefs about womanhood, lineage continuation, masculinity, religious teachings, and social status influence how women make reproductive decisions. Cultural education significantly shapes fertility behavior among South African schoolgirls. By addressing cultural norms, challenging myths, and empowering girls, it contributes to informed reproductive decision‑making and helps reduce teenage pregnancy. However, cultural education must be delivered in ways that respect community traditions while promoting girls’ rights and autonomy. Schools, families, and communities must collaborate to develop culturally sensitive and empowering educational interventions. As observed, high fertility rates pose challenges not only for country, but also for food security and the general welfare of households [54].

References

  1. Mkwananzi S, Lebelo RS, Mashinini A, Ngake A, Paledi MS, Thwala LS (2022) Socio‑ cultural predictors of teenage pregnancy in South Africa: A cross‑sectional study that compares rural and urban Gender and Behaviour 20(4): 20525‑20541.
  2. Mbongwa L, Mpanza S, Mlambo VH (2024) The teenage pregnancy crisis in South Africa among high school students, causes, implications and possible solutions: A literature review. Futurity Education 4(3): 200‑216.
  3. Pikoli Z (2023) Teenage pregnancy prevention is not just about irresponsible teens say activists. Daily Available from: https://www.dailymaverick.co.za/ article/2023‑09‑29‑teen‑pregnancyprevention‑not‑just‑about‑irresponsible‑teens/
  4. Barron P, Subedar H, Letsoko M, Makua M, Pillay Y (2022) Teenage births and pregnancies in South Africa, 2017‑2021‑a reflection of a troubled country: Analysis of public sector data. South African Medical Journal 112(4): 252‑258. [crossref]
  5. Blackwood E (2000) Culture and women’s Journal of Social Issues 56(2): 223‑238.
  6. Taiwo MO, Oyekenu O, Hussaini R (2023) Understanding how social norms influence access to and utilization of adolescent sexual and reproductive health services in Northern Frontiers in Sociology 8: 865499. [crossref]
  7. Bhana D, Morrell R, Shefer T, Ngabaza S (2010) South African teachers’ responses to teenage pregnancy and teenage mothers in Culture Health and Sexuality 12(8): 871‑83. [crossref]
  8. Gwala L (2022) Recent policy around teenage pregnancy within the South African basic education sector. Adams & Adams. https://www.adams.africa/commercial‑litigation/ familylaw/recent‑policy‑around‑teenage‑pregnancy‑within‑the‑south‑african‑ basic‑education‑sector/
  9. Donald D, Lazarus S, Lolwana P (2002) Educational psychology in social context (2nd ) Oxford University Press.
  10. Rodrigues P, Manlosa AO, Fischer J, Schultner J, Hanspach J, et (2022) The role of perceptions and social norms in shaping women’s fertility preferences: a case study from Ethiopia. Sustainability Science 17(6): 2473‑2488.
  11. Martin TC (1995) Women’s education and fertility: results from 26 demographic and health Stud Fam Plann 26: 187. [crossref]
  12. Bongaarts J (2003) Completing the fertility transition in the developing world: the role of educational differences and fertility Popul Stud. 57(3): 321‑335. [crossref]
  13. Bongaarts J, Mensch BS, Blanc AK (2017) Trends in the age at reproductive transitions in the developing world: the role of education. Popul Stud 71(2): 139‑154. [crossref]
  14. Adsera A (2006) Religion and changes in family‑size norms in developed Rev Relig Res 47: 271‑286.
  15. Caldwell JC, Caldwell P (1987) The cultural context of high fertility in sub‑Saharan Population and Development Review 13: 409‑437.
  16. Pyhälä A, Fernández‑Llamazares Á, Lehvävirta H, Byg A, Ruiz‑Mallén I, et (2016) Global environmental change: local perceptions, understandings, and explanations. Ecology and society: a journal of integrative science for resilience and sustainability 21(3): 25. [crossref]
  17. Twitty TD, Hitch AE, Marais L, Sales JM, Sharp C, et (2024) Pregnancy and STI/ HIV prevention intervention preferences of South African adolescent girls: Findings from a cultural consensus modelling qualitative study. Culture Health & Sexuality 26(2): 191‑207. [crossref]
  18. Roets L, Clemence IS (2021) Teenage pregnancy prevention: The church, community, culture and African Journal of Reproductive Health 25(6): 51‑57. [crossref]
  19. Zalli E (2024) Globalization and education: exploring the exchange of ideas, values, and traditions in promoting cultural understanding and global citizenship. Interdisciplinary Journal of Research and Development 11(1 S1): 55‑55.
  20. Miller, DT, McFarland, C (1991) When Social Comparison Goes Awry: The Case of Pluralistic Chapter 11 in Suls J, Wills, T (Eds) Social Comparison: Contemporary Theory and Research, Hillsdale, NJ: Erlbaum.
  21. Prentice, DA, Miller DT (1993) Pluralistic Ignorance and Alcohol Use on Campus: Some Consequences of Misperceiving the Social Norm. Journal of Personality and Social Psychology 64(2): 243‑256. [crossref]
  22. Berkowitz AD (2003) Applications of social norms theory to other health and social justice issues. The social norms approach to preventing school and college age substance abuse: A handbook for educators counselors and clinicians 1: 259‑279.
  23. Davis J, Mengersen K, Bennett S, Mazerolle L (2014) Viewing systematic reviews and meta‑analysis in social research through different lenses. Springer Plus 3: 511.
  24. Snyder H (2019) Literature review as a research methodology: An overview and Journal of Business Research 104: 333‑339.
  25. Ankomah A, Anyanti J, Oladosu M (2011) Myths, misinformation, and communication about family planning and contraceptive use in Open Access J Contracept. 2: 95‑105.
  26. Gueye A, Speizer IS, Corroon M, Okigbo CC (2015) Belief in family planning myths at the individual and community levels and modern contraceptive use in urban International Perspectives on Sexual and Reproductive Health 41(4): 191.
  27. Jonas K, Duby Z, Maruping K, Harries J, Mathews C (2022) Rumours, myths, and misperceptions as barriers to contraceptive use among adolescent girls and young women in South Frontiers in Reproductive Health 4: 960089. [crossref]
  28. Joseph J, Pradeepkumar K, Chettyparambil Lalchand T (2024) Myths and Misconceptions‑Unraveling the Paradox of Oral Contraceptive International Journal of Health Sciences and Research 14(5): 368‑375.
  29. Castle S (2003) Factors influencing young Malians’ reluctance to use hormonal contraceptives, Studies in Family Planning 34(3): 86‑199. [crossref]
  30. Stevens R, Machiyama K, Mavodza CV, Doyle AM (2023) Misconceptions, misinformation, and misperceptions: A case for removing the “mis‐” when discussing contraceptive Studies in Family Planning 54(1): 309‑321. [crossref]
  31. PATH (2015) “Outlook on Reproductive Health: Countering Myths and Misperceptions about ” Washington, DC.
  32. Kaur Simranvir, Paul Blumenthal (2021) “Global Myth Busting in Family Planning.” Current Opinion in Obstetrics & Gynecology 33(6): 458‑462. [crossref]
  33. Odwe G, Wado YD, Obare F, Machiyama K, Cleland J (2021) Method‑specific beliefs and subsequent contraceptive method choice: Results from a longitudinal study in urban and rural PloS one 16(6): e0252977. [crossref]
  34. Wado YD, Mutua MK, Odwe G, Obare F, Machiyama K, et (2021) Method Related Attributes and Contraceptive Discontinuation: Results from A Prospective Study from Nairobi and Homa Bay Counties in Kenya.
  35. Sedlander E, Bingenheimer JB, Lahiri S, Thiongo M, Gichangi P, et (2021) Does the belief that contraceptive use causes infertility actually affect use? Findings from a social network study in Kenya. Studies in Family Planning 52(3): 343‑359. [crossref]
  36. Mokala NT (2020) Understanding the Meanings Represented in Ditolobonya Songs: Basotho Women’s Experiences and Realities. International Journal of Linguistics Literature and Translation 3(3): 144‑153.
  37. Magoqwana B (2021) Gendering social science: Ukubuyiswa of maternal legacies of knowledge for balanced social science studies in South Africa. In J. B. Bernedette Muthien (Ed.), Rethinking Africa: Indigenous women re-interpret Southern Africa’s pasts (pp. 87‑102) Johannesburg: Jacana Media.
  38. Mohlabane N (2022) Unsettling knowledge boundaries: the Indigenous pitiki space for Basotho women’s sexual empowerment and reproductive well‑being. Health Sociology Review 31(2): 158‑172. [crossref]
  39. Thobejane TD (2015) Factors contributing to Teenage Pregnancy in South Africa: The Case of Matjitjileng Journal of Sociology and Social Anthropology 6(2): 273‑277.
  40. Yakubu I, Salisu WJ (2018) Determinants of adolescent pregnancy in sub‑Saharan Africa: A systematic Reproductive Health 15(1): 15. [crossref]
  41. Donatus, Sama, Tsoka‑Gwegweni, Cumber (2018) Factors associated with adolescent school girl’s pregnancy in Kumbo East Health District North West region Pan African Medical Journal 31(138): 1‑11. [crossref]
  42. Miriri, T.M, Ramathuba, D.U, Mangena‑Netshikweta ML (2014) Social factors contributing to teenage pregnancy at Makhado Municipality, Limpopo province, South African Journal for Physical Health Education Recreation and Dance 20(sup‑1): 130‑141.
  43. Veriava F (2024) The Basic Education Laws Amendment Bill: A case study in transformative constitutionalism beyond the African Human Rights Law Journal 24(1): 153‑178.
  44. Masowa AM (2024) The Impact of Kwazulu‑Natal Provincial Language Policy on Sesotho Speakers at Nquthu. E-Journal of Humanities Arts and Social Sciences 5(11): 1831‑1840.
  45. Rotheram‑Borus MJ (1995) Aids prevention with AIDS Education and Prevention 7: 320‑336. [crossref]
  46. Jemmott, JB III (2000) HIV risk reduction behavioral interventions with heterosexual AIDS 14: S40‑S52. [crossref]
  47. Kirby D (2002) .The impact of schools and school programs upon adolescent sexual Journal of Sex Research 39(1): 27‑33. [crossref]
  48. Schaalma H, Poelman J, Reinders J (1993) De herziening van ‘Lang leve de liefde’. Een lespakket over aids, soa en veilig vrijen [Revision of Long Live Love. A curriculum about AIDS, STD and safe sex]. Tijdschrift Gezondheidsvoorlichting 10: 5‑7.
  49. Van den Akker J, Kuiper W (1993) .The implementation of a social studies Journal of Curriculum and Supervision 8: 293‑305.
  50. Paulussen TGW (1994) Adoption and implementation of AIDS education in Dutch secondary schools. Dissertation. Landelijk Centrum GVO, Utrecht.
  51. Tohit NFM, Haque M (2024) Forbidden conversations: A comprehensive exploration of taboos in sexual and reproductive health. Cureus 16(8). [crossref]
  52. Santelli JS, Kantor LM, Grilo SA, Speizer IS, Lindberg LD, et (2017) Abstinence‑ only‑until‑marriage: An updated review of US policies and programs and their impact. Journal of Adolescent Health 61(3): 273‑280. [crossref]
  53. Wiefferink CH, Poelman J, Linthorst M, Vanwesenbeeck I, Van Wijngaarden JCM, et (2005) Outcomes of a systematically designed strategy for the implementation of sex education in Dutch secondary schools. Health Education Researc20(3): 323‑333. [crossref]
  54. Shefer T, Bhana D, Morrell R (2013) Teenage pregnancy and parenting at school in contemporary South African contexts: Deconstructing school narratives and understanding policy implementation. Perspectives in Education 31(1): 1‑10.

Using Mind Genomics Thinking and AI Simulation to Study Socio-political Issues: Possible Individual ‘Fall-Out’ from the US DOGE Efforts

DOI: 10.31038/MGSPE.2026611

Abstract

Using a combination of the Mind Genomics platform BimiLeap.com and AI, the paper shows how one can rapidly explore ideas in today’s unstable world of political instability coupled with social instability. The paper shows by means of simulation how the investigator can identify a problem by using AI to create a ‘situation backgrounder’, and then use that backgrounder in turn to create classification questions about people, questions about responses to situations calling for betraying one’s country, and then answers to those questions. The questions never appear in the analysis, but simply act as guides to generate answers, which are presented as statements. Synthetic respondents, created by AI, are then exposed to vignettes comprising 2-4 of these above-mentioned answers. The respondents are also given personas by AI, as well as given different types of background instructions. The effort provides an instructional database showing how response classified as either ‘loyal’ or ‘tempted’ can be traced to the types of messages a person receives, the persona of the person created by AI, and finally the type of situation which prevails (e.g., public feelings shortly after DOGE, Department of Government Efficiency has made its cuts). The process is quick (hours and days), affordable (only costs are AI), and deep information, allowing the simulation to give a sense of what may happen.

Introduction

In President Trump’s second term as US President, he created DOGE. Dept of Governmental; Efficiency. The goal was to audit government expenditures and cut waste, doing so dramatically by firing people who had spent years and even decades as civil servants and as other ways of working for the US government. The outcome was that many government employees lost their jobs. There were, of course, negative feelings by the fired people (and others) towards the government. The topic here is to simulate what might be the actions of these disaffected, fired people, were they to be approached by individuals by another country to take money for selling what they know, and possibly learned during their tenure with the US government [1,3,7,8].

During this same period, research in the emerging science of Mind Genomics continued to show the ability of this science to understand the way people think about the topics of ordinary life and make decisions of the ordinary [4]. The Mind Genomics process of creating elements (messages) about a topic and combining these messages into vignettes according to an underlying plan called an experimental design ended up revealing many facets of how people think about topics. The strategy was to avoid having people ‘intellectualize’ about a topic. Rather, one would create simple combinations of messages, so-called vignettes, and have the respondent rate the vignette. The respondent was not challenged at all to defend the choice or even to verbalize the reasons for the choice of rating scale value for a particular vignette). The subsequent analysis, using standard statistical methods like regression and clustering, revealed in clear detail the criteria that the respondent used to rate the individual elements in the vignette [9,11].

The happy outcome of the above was a way to simulate the compound nature of reality. Much like in daily life, the respondent simply made decisions, almost without thinking. We should not be surprised at this behavior, and how natural it is easy. What is important comes down to the simple reality that here is a more natural way to measure thinking about a topic, and in fact one which is becoming increasingly cheaper, faster, and simpler from the user’s point of view.

A historical note is in order here: The original efforts began in the 1980’s, four decades ago. The process was simple although convoluted and effortful by today’s standards. In an era when the personal computer was starting, the researcher would assemble the material, usually sentences, but sometimes pictures. The user would then create one experimental design, with 2-3 times the number of fixed vignettes as elements. That is, the researcher might have 96 elements. The researcher would then create 192 combinations, which each element appearing 4-5 times across the 192 combinations. These combinations were fixed. The design was ‘tested’ ahead of time to make sure that it was amenable to analysis by OLS (ordinary least squares) regression [12]. The creation of one experiment allowed the researcher to manually check each vignette, each combination of elements, to make sure no vignette contained prohibited combinations, viz, elements which contradicted each other.

Today’s version of BimiLeap has evolved from those early days of forty years ago. Today’s version has evolved from a starting idea about 36 elements requiring 60 combinations or vignettes (4 categories, each with 9 elements), then 36 elements requiring 48 combinations or vignettes (6 categories, each with 6 elements), and finally today’s time- starved design of 16 elements requiring 24 combinations (4 categories, each with four elements).

Incorporating AI into the Process

AI interacts with Mind Genomics at least four levels, all ow which are currently available on the Mind Genomics platform, www. BimiLeap.com.

Step 1: Create a Backgrounder to Develop a Deeper Sense of the Topic

Our first step is to assemble information about the topic, more for general knowledge than for the framing of specific questions. Any of today’s LLM models, e.g., Chat GPT or Co-Pilot can provide a useful backgrounder to the topic. The backgrounder shown in Table 1 was developed by Microsoft’s LLM, Co-Pilot. The request was to provide a 10-paragraph composition on the likely feelings, opportunities and vulnerabilities of those civil servants who were summarily dismissed without cause from their jobs as part of the DOGE effort. As we will see below, this first effort need not be made, but it is advisable to do so just for the purposes of creating an overview of the topic.

Table 1: Using AI to create a general story.

Moving beyond the orientation to the problem is using AI to sharpen one’s ideas about how the Mind Genomics approach should be used. Table 2 shows how Microsoft’s CoPilot provides a way to focus the user on what might be the most effective way to use Mind Genomics. The information in Table 2 is not necessary for the project and indeed was never codified in such a short form until AI was available. Table 2 may provide material already known to experts, but at the same time the user can benefit from a reiteration of basic ideas provided by reinterrogating AI.

Table 2: AI introduction to the process of Mind Genomics.

Step 2: Set Up the Mind Genomics Study

  1. Develop a series of questions which ‘tell a story’,
  2. For each question create four answers, the four answers (or elements) differing as much as possible from each other.
  3. Create up to 16 classification questions which allow the respondent to profile themselves.
  4. Create an introductory statement explaining the topic, and then provide rating scale.

The order of activities listed above has changed in different versions of the Mind Genomics program. `

Figure 1 (left panel) shows the first screen that the user fills. The left panel shows simply the name of the Mind Genomic study (really ‘experiment’) the language, and a disclaimer that no personal information will be taken.

Figure 1: User steps to set up a Mind-Genomics study (Panel A), and to create four questions (Panel B).

Panel B below shows the request for four questions. Up to the advent of LLM models such as Chat GPT, it was at this first step that the process often encountered is first resistance, and indeed many studies were aborted at this early stage. Panel B requests that the respondent generate four questions which tell a story. During the period of evolution, from approximately 1998 onwards, it seemed to be becoming increasingly harder for researchers, or at least those who wanted to use Mind Genomics, to come up with four questions which ‘told a story’ That observation, although subjective, corresponded to many people saying that they wished there were an easier way to develop these questions along. Indeed, by the year 2020 it seemed that Mind Genomics was destined to suffer a death because many prospective users felt simply that coming up with questions was beyond them. This observation tallies with the often- repeated observation by many that the thinking abilities of people seemed to be eroding.

Step 3: Generate the Four Questions Using AI

Figure 2 shows the Idea Coach section introduced in Figure 1. The left panel shows the request made to the AI embedded in the Idea Coach. The right panel shows the output from this initial iteration. Each iteration of the Idea Coach at this stage generates 15 different questions. The iterations may be repeated to generate a new set of 15 questions. Some of the questions will overlap. A strong introduction to the topic may emerge when the user runs many iterations, since later AI will analyze the output from AI, and offer new insights as Table 3 shows.

Figure 2: Idea Coach allowing user to write about the study (panel A), an intermediate output of 15 questions with the output comprising the first of possibly many iterations (panel B) and finally an example of four question finally selected from or even across several iterations (panel C).

The actual output from the Mind Genomics set-up is much richer, with the analysis occurring as the study is being completed. An ‘iteration’ in the setup occurs when then the Idea Coach on the left is submitted. Table 3 shows the rich nature of the outcome, including the original input request the questions, as well as AI analysis of the output. The AI is once again Chat GPT.

Table 3: First iteration, viz., first set of questions generated by AI, based upon the information provided in the Idea Coach.


Step 4: Use AI to Guide Thinking about the Questions and Answers to Choose

When AI was first incorporated into Mind Genomics in 2023, the principal use was to make researcher’s job less taxing, viz., by providing questions and then answers to the questions. Table 4 shows four questions generated by the AI in IDEA Coach, and for each question, four of the 15 answers further generated by Idea Coach. Table 4 need not contain questions from the same iteration. The BimiLeap program is set up so that the user can instruct the embedded AI to go through another iteration. Only when the user finally selects the four questions (from repeated iterations) and well as provides four answers to a specific question (from repeated iterations does the program move on.

The actual process to generate the questions and then select the answers was approximately 15 minutes, a speed unimagined even a decade ago. The actual study ended up being created in a matter of about an hour.

Table 4: The four questions and the four answers (elements) generated for the study.

Step 5: Create Self-proflling Questions as the Basis of ‘Personas’ to be Used by AI

It is by now a truism that people differ from each other. When working with Mind Genomics, whether using people or synthetic AI- created ‘personas’, it is instructive to find out about the respondent. This discovery may be about who the respondent IS, what the respondent DOES, how the respondent FEELS AND THINKS, etc. An efficient way to discover this information is to present the respondent with a closed end questionnaire, such as that shown in Table 5. The respondent, or in this case the AI, simply chooses the most appropriate answer for each question. To arrive at the nine questions shown in Table 5 we instructed AI to provide nine different questions that could describe a person involved in losing their job due to DOGE, and then for each question generate two radically different answers.

When people answer the questions in Table 5 we end with a sense of who they ‘are’. The thinking is different with AI. The AI program can be provided by a persona, created by an underlying program. In BimiLeap the underlying program randomly selects one of the three answers for each question in Table 5. The objective was to estimate the absolute contribution of answer in the subsequent analysis. It is for that reason that a final answer, “I cannot answer this question”, was added. With that type of answer, the AI ignores the topic in the creation of the persona.

Later, in the analysis, we will consider the contribution of the elements, as well as the contributions of the persona, to the rating. This analysis will allow us to understand the relative importance of the message versus of the nature of the ‘respondent, as a driver of the response.

Table 5: The nine questions used by AI to create a synthetic persona. The person emerged from the random (but ultimately balanced) choice of one answer from each question to generate the synthetic person.

Step 6; ‘Orient’ AI in Terms of Four Introductions to the Situation, and the Five Point Rating Scale to Use to Evaluate the Vignettes

To obtain an even deeper understanding of how AI could integrate with Mind Genomics, we explored our different scenarios of introductions, with each introduction run in an experiment all its own. The top of Table 6 shows the four introductions, A-D. Introduction A talks about DOGE effort, combined with an upbeat mood. Introduction B talks about DOGE effort, with a downbeat mood. Introduction C talks about DOGE effort. All three introductions talk about foreign countries approaching laid-off government employees. Introduction provides no background at all but simply proceeds to the introduction about how to use the rating scale. The bottom of Table 6 shows the introduction to the vignettes, and the labelled five-point rating scale.

Table 6: The four introductions, one introduction for each of the four experiments and then introduction to the rating scale, and the five-point labelled rating scale.

Step 7: Prepare for Data Analysis by Regression by Specifying BDV’s (Binary Dependent Variables)

The original Mind Genomics studies were developed with a simple nine-point rating scale. The only labels were at the two extremes. The rationale for this form of scale was the popularity of top-and-bottom anchored scales in the world of applied science and consumer research. Author Moskowitz traces his roots to that field. The choice of a nine-point scale was based upon the belief that the respondents should have as much space on the scale to show the magnitude of their feelings.

Ongoing experience revealed that managers exposed to the research findings were uncomfortable with the scale. Most of the managers had been through business school, so they understood the general idea of the scale. The major problem emerging was that the scale simply could not be interpreted in a simple manner, as simple perhaps as the ‘no/yes’, is my product, my idea, even my vision ‘good’ or ‘bad.’ It became obvious that the precision to be offered by a scale did not give much to the users in terms of what the user of the scale information needed.

Rather than using the scale as a measure of magnitude, the easier approach, and one already in use by other researchers, was to divide the scale into regions, usually two regions. The common use of many researchers during the time that Mind Genomics was developing (2000 – 21010) was to use a simple, anchored 5-point scale [5,10]. Rather than searching for the so-called precision of the 9-point scale, and an ability to reveal differences, the effort recognized that five points were enough. Further practice by researchers was to divide the scale into two parts, and convert the scale to two points, for example so-called ‘Top 2’ (ratings of 5 and 4 converted to 100, ratings of 3,2, and 1 converted to 0),

The nice thing about this conversion is that it tells the researcher what percentage of the researchers can be said to agree with the idea, like the idea, etc. the specifical words to interpret Top 2 come from the anchors of the scale. The benefit for researchers of this change is that it moves the data to a form that can be analyzed by different statistical methods, whether to compute averages, or use as input in regression, or clustering.

Step 8: Run Study Once with Each Introduction, Using ‘Synthetic’ (AI-Created) Respondents

Once the user creates the test elements, the introduction, the rating scale, and if desired the self-profiling classification, the rest is left to the BimiLeap.com program. The user can select human respondents, or instruct the program to simulate respondents, viz., create synthetic respondents. Figure 3 shows the instructions for the user. The third selection allows the user to work with synthetic respondents, these respondents to be constructed by the combination of answers to the nine questions shown in Table 5.

Figure 3: Screen shot showing the choice of respondents given to the user. The third row shows the option to use AI-generated synthetic respondents.

Results

The Distribution of Ratings Across the Set of Four Studies

Our first analysis looks at the distribution of the five scale points across the different subgroups of usage. Table 7 shows the distribution of the five scale points for each classification statement. The classification statements were created to be independent of each other.

Across the total of four studies, each with 500 synthetic respondents, there were an altogether of 48,000 ratings (4 studies x 400 respondents/study x 24 vignettes/respondent = 48,000). Table 7 suggests that the AI did understand the meaning of the scales and chose rating 5 a vanishingly small number of times. Keep in mind that we are talking here about 48,000 independent decisions, with the AI presented with a persona, a scale, and then a vignette of 2-4 elements. A more fine-grained analysis would reveal further evidence that the synthetic respondents generated by AI make sense in terms of the linking of ‘who they are’ with what they end up rating.

The labelled 5-point can be divided into sections, one loyal (ratings 1 and 2), one disloyal (rating5), and one tempted (ratings 3 and 4). Table 7 reveals very few ratings of 5, viz., disloyal, but a substantial number of ratings for ‘tempted’ and a lesser but still substantial number of ratings for loyalty. For the remaining analysis we will consider two newly created BDV’s (binary dependent variables). R12 (Loyal) and R34 (Tempted).

Table 7: Distribution of ratings across the four sets of studies.

Relating the Presence/Absence of the 16 Elements to Positive Versus to Negative Responses

The use of an underlying permuted experimental design ensures that each synthetic respondent would test a different but appropriate set of 24 vignettes. The vignette comprises a specified combination of elements, at most one element or answer from each question, but with many vignettes comprising as few as two elements, and some vignettes comprising three elements. A vignette had at most one element or answer from a question. Across the 24 vignettes, each element appeared five times and was absent 19 times. Thus, a single question would contribute exactly one of its four answers to 20 or the 4 vignettes and be absent from the remaining four of the vignettes.

The above-mentioned design was modified so that each respondent would test a different set of 24 combinations. The mathematical structure of these 24 combinations was maintained from respondent to respondent. Only the specific combinations differed. This permutation scheme allowed the user to create individual-level models across respondents. The great benefit was the ability to analyze studies with few as well as with many respondents.

Our first analysis looks at contribution of the 16 elements to the two key BDVs, LOYAL (ratings of 1 or 2), or TEMPTED (rating 3 or 4). We eliminated rating 5 from consideration because it received vanishingly few ratings from the synthetic respondents. It is clear from Table 8A that the coefficients for Temptation are almost all high, with the cut-off of a coefficient of 21 being statistically significant (t statistic >2). Table further shows that the range of coefficients across the four introductions is usually quite small, a value of 6 or lower. Importantly, and quite remarkable, the coefficient for TEMPTED is highest when there is no introduction, and lowest for the introduction with presents DOGE along with the statement that the attitude of the citizen is upbeat, positive, and patriotic. We interpret this pattern to mean that for the same element, the most the country is described as positive and optimistic after DOGE has done its work, the (slightly) less tempting the element may be.

Table 8A: How the introduction and the elements interact to generate coefficients for equations relating the presence/absence of the 16 elements to ‘TEMPTED’ and ‘LOYAL’, respectively.

An ‘Integrative Model’ Incorporating Contributions of Messages, Introductions, and Feelings

Thus far the analysis has been of the 16 elements (A1-D4) as it has been affected by introduction to the synthetic respondent. We also know from Table 7 that there are differences in the patterns of ratings by WHO the respondent is (gender) and how the respondent profiles themselves (e.g., gender).

Our next analysis attempts to create a general, integrative model, using the variables for which there is a true zero, or for which a case can be made that variable has a meaningful zero. The model is straightforward. The independent variables are coded as ‘1’ if present, and ‘0’ if absent from the data. The elements were created by an underlying experimental design which ensured true 0’s. The first set of variables are the elements, specifically presence/absence of the elements in the vignette, with presence coded as 1, and absence coded as 0. The second set of variables are the three introductions (A, B, C) which present the DOGE action (all three introductions) as well as the emotional reactions (positive, negative, introductions A and B). The third set of variables are the nine self-profiling classification questions, each having three answers, two options, and the third option being the ‘zero’ case, presented as ‘I cannot answer this question).

Altogether, we have 16 elements, three introductions, and 18 self-profiling classifications, or 37 predictor variables. We have 2,000 respondents, each of whom provided 24 respondents on a scale which we define as either ‘loyal’ (ratings 1 and 2 transformed to 100; ratings 3,4, transformed to 0) or ‘tempted (ratings 3 and 4 transformed to 100, ratings 1 and 2 transformed t0 0). Rating 5 was entirely ignored in the analysis.

The integrated model provides a rapid way to understand the patterns in the data, and to uncover patterns that might have been missed because of the sheer volume of data (48,000 synthesized ratings). It may also be that the integrated model allows us insights that would otherwise be masked. Table 8B shows the integrated model for the Total Panel.

Table 8B: Integrated model for the total panel. The model relates relating the binary dependent variables of LOYAL and TEMPTED, respectively, to each of the elements, introductions, and self-descriptions of the way one feels. Only coefficients of +5 or higher are shown.

What drives loyal: No elements drive ‘loyal’

A positive reaction to DOGE and DOGE itself without any statement of citizen reaction

One specific answer in the self-profiling: Being native-born (Q31) and feeling the US is the best place to live (Q71)

What drives tempted: Most of the elements drive ‘tempted’, virtually to the same degree.

A negative reaction to DOGE in the introduction

Any of three specific answers in the self-profiling

I don’t know feel a strong connection to this country (Q11)

I do not feel appreciated by my country (Q21)

I am not at all confident that my future in the United States is good (Q42)

1=I feel that I can be ‘bought’ for the right price because everyone has a price.

Two Mind-sets and the Integrated Model Combining Elements, Personas, and Introductions

The final analysis of our data involves mind-set segmentation. A hallmark of Mind Genomics is at the level of granular experience; people differ from each other. These differences, once thought to be simply the intractable interpersonal variation which haunts ever study, turn out to be interpretable and important systematic differences between people in the way people evaluate the world of everyday. The differences end up pointing to the existence of so-called mind-sets, clusters of individuals with different ways of evaluating the stimuli of the everyday. It is not that all inter-individual variation can be traced to these mind-sets, but rather some part of the variation is due to systematic differences.

What these mind-sets are eds up emerging when we look at how people differ in what is important to them. The Mind Genomics process clusters respondents, dividing the full bank of respondents into smaller groups, based strictly on mathematical considerations. Once the respondents are divided into these smaller groups, it is straightforward to repeat the analysis on the different groups. These emergent groups, clusters in the language of statistics, are called mind- sets in the language of Mind Genomics.

Previous studies using the Mind Genomics method suggest that mind-sets abound in areas as diverse as food preferences, responses to legal issues, and the way one listens to one’s doctor and the type of information that drives patient compliance [2,6].

The Mind Genomics process lends itself to easy discovery of mind- sets. The process comprises the development of individual level models relating a specific BDV (binary defined variable) to the presence/ absence of the elements that were systematically varied. In this study we have 2000 respondents, each of whom evaluated the 16 elements combined into the 24 vignettes, with each respondent evaluating elements arranged in an experimental design. It is straightforward to create 2000 equations, one per respondent, to relate the 16 elements to Loyal (set 1) and then Tempted (set 2).

The first order of business is to create the BDV for each respondent. The BDV Loyal takes on the rating 100 when the original rating was 3 or 4. The BDV Tempted takes on the value 100 when the original rating was 1 or 2. Otherwise the BDV takes on the value 0. A vanishingly small number (<10-5) is added to every newly created BDV to ensure that there is some minimal level of variation in the BDV values when they serve as dependent variables in the regression which follows the transformation.

The foregoing modeling by OLS (ordinary least squares) regression generates two parallel sets of 2000 rows of coefficients, each row containing 16 coefficients with no additive constant. We can combine these two sets of data into one block of data of 2000 rows, one row for each respondent. In turn, the left side (columns 1-16) comprise the coefficients for Loyal, and the right side comprises the coefficients for the same respondent, this time for Tempted.

The next step in clustering uses so-called k-means clustering. The clustering program attempts to put the 2000 synthetic respondent into a minimal set of groups called clusters, or mind-sets in the language of Mind Genomics; The k-means algorithm does so by first computing the pairwise distance between every pair of the 2000 respondent. There are almost 4 million pairs of respondents. The distance between each pair is defined as (1-Pearson Correlation). In turn, the Pearson correlation is computed between every pair of respondents, based on the values of the 32 corresponding coefficients, the 16 coefficients for LOYAL and the 16 coefficients for TEMPTED.

For exploratory purposes we begin with the two mind-sets, shown in Table 9. Mind-Se 1 comprises 1469 of the 2000 respondents, Mind-Set 2 comprise 531 of the 2000 respondents. Table 9 presents a great deal of data. To make the table easier to read we arbitrarily remove all coefficients of +3 or lower, leaving coefficients of 4 or higher. It is clear that the mind-sets differ dramatically on their reactions to LOYAL.

Table 9: The integrated model showing the coefficients from the single model incorporating predictors of the elements, the nine self-profiling questions to establish the persona, and the three introductions which ‘set the stage’. The table shows four integrated models, one for each pair of mind-set and BDV (loyal vs tempted).

Expanded Integrated Models for Three, Four, and Five Mind-sets

The final analysis in this exploration extracted three, four and then five mind-sets. The clustering program was precisely the same as done for the two-mind-set analysis. Table 10 shows the results. Once again, we remove any coefficients lower than 5. Table 10A shows the coefficient for LOYAL. Table 10B shows the coefficient for Tempted. Table 10 shows many more blank but also shows many higher coefficients. Furthermore, the mind-sets seem simpler in terms of the pattern of self-classifying questions, but more complex in terms of how the introduction fit into the model. The reader is invited to dive more deeply into the tables to extract additional insights about the way mind-set segmentation is influenced by personas developed by AI.

Table 10A: Coefficients for the integrated model for LOYAL, for three, four, and five mind-sets created through k-means clustering.

Table 10B: Coefficients for the integrated model for LOYAL, for three, four, and five mind-sets created through k-means clustering.

Discussion and Conclusions

This paper demonstrates, in example form, what might be learned about a totally new topic (effects of DOGE on loyalty vs temptation), doing so in the matter of a few hours, or at most a day or two. The approach merges the now standardized approaches used by Mind Genomics with the power of AI to synthetize personas and have those personas rate test stimuli (vignettes).

There are a variety of considerations, mostly positive, that should be kept in mind when evaluating the possible contribution of the approach presented here. These considerations range from today’s trends to today’s needs, and can be grouped into two major areas, ‘learning speed through simplicity’ and ‘learning from storytelling’.

Speed and Simplicity

1.  Speed is the New Power in Learning

This approach teaches fast. A user can set up questions, answers, and stories in hours, not weeks. A child can test ideas about honesty in school rules and see results the same day. A police officer can test ideas about crime prevention and get insights before the week finishes. A political scientist can test ideas about public opinion and see patterns in one afternoon. Speed keeps attention strong. Speed makes learning exciting. Speed builds confidence.

2.  Speed Builds Confidence

Fast results encourage learners. A student who sees patterns in one day feels proud. A police officer who sees insights in one week feels prepared. A researcher who sees trends in one afternoon feels informed. Speed keeps motivation high. Learners try repeatedly. Each cycle builds skill. Confidence grows with each fast success.

3.  Simplicity is a Path to Increasing One’s Understanding

The system uses short stories called vignettes. Each vignette shows a situation and asks for a choice. This makes the lesson easy to follow. A teenager can read a vignette about loyalty and decide how they would act. A teacher can use vignettes to explain fairness without complex words. A police trainer can use vignettes to show how suspects might be tempted. Simple stories make hard issues clear. Simplicity opens the door to learning.

4.  Simplicity Builds Trust

The system avoids complex math in the front view. Users see clear outputs like “loyal” or “tempted.” A student can understand without equations. A teacher can explain without formulas. A police officer can train without statistics. A researcher can share results without jargon. Simple outputs build trust. Learners believe what they see. Trust makes education strong.

5.   Control Belongs to the Learner, and a Tool to Drive Education

The user decides the questions, the answers, and the scenarios. This control makes the process personal. A student can design questions about friendship. A researcher can design questions about corruption. A police officer can design questions about crime. Each user shapes the study to fit their interest. Control teaches responsibility. Control makes learning active, not passive. Control builds ownership of knowledge.

6.  Control Builds Responsibility

When users design their own experiments, they learn to think carefully. A student who writes a question about honesty must decide what honesty means. A police officer who writes a question about crime must decide what crime means. A researcher who writes a question about loyalty must decide what loyalty means This reflection teaches values. Responsibility grows with control. Learners become thoughtful.

7.  Education Can Inspire Better Action

Learning should not stop at knowledge. It should lead to wise choices. Simulation makes issues vivid, simple, and under user control. A student learns to act fairly. A police officer learns to act carefully. A researcher learns to act responsibly. Each user sees choices clearly. Each user imagines better futures. Education inspires action. Action makes society stronger.

Stories Teach Better than Simple Facts, Engaging Creativity and Thinking

8.  Stories Build Memory

People remember stories better than lists of facts. A vignette about a worker facing temptation sticks in the mind. Later, the learner recalls the lesson about loyalty and risk. A student remembers the story about cheating. A police officer remembers the story about bribery. A researcher remembers the story about betrayal. Stories make lessons last. Memory grows stronger with stories.

9.  Stories Bring Issues to Life

Numbers alone do not move the heart. Stories make issues real. A vignette about a fired worker tempted to share secrets feels alive. Readers imagine the worker’s choice and feel the tension. A child reading about a friend tempted to cheat feels the same pull. A police officer reading about a suspect tempted by money feels the risk. A political scientist reading about citizens tempted by anger feels the danger. Stories make lessons stick in memory.

10.  Creativity Grows from Mixing Ideas

The system combines different answers into new vignettes. This mixing creates surprises. A student may see that anger plus money creates more risk than sadness plus flattery. A police officer may see that fear plus friendship creates more temptation than greed alone. A researcher may see that pride plus recognition creates stronger loyalty than rules alone. These surprises spark imagination. Creativity grows when people see new patterns. Mixing ideas makes learning playful and deep.

11.  Young Learners can Explore Society

Teenagers curious about politics can use the system to test ideas. They can design questions about fairness, loyalty, or justice. They can see how synthetic personas respond. This builds civic awareness. A student may learn that anger leads to rash choices. Another may learn that kindness builds trust. These lessons prepare young people to think about society. Simulation gives them a safe way to explore big issues.

12.  Simulation Teaches Without Danger

Real experiments with betrayal or crime would be unsafe. Simulation avoids risk. AI creates synthetic respondents who act like real people. Learners can explore sensitive topics safely. A student can study cheating without hurting classmates. A police officer can study bribery without risking real cases. A researcher can study espionage without touching secrets. Simulation makes dangerous lessons safe. Safety allows bold exploration.

13.  Law Enforcement can Train with Realism

Police and security teams face real temptations and risks. Simulation lets them practice safely. They can design vignettes about suspects offered money or friendship. They can see how synthetic personas respond. This prepares them for real cases. A police officer may learn that suspects often justify betrayal as harmless. Another may learn that suspects respond strongly to flattery. These lessons improve training. Simulation builds readiness.

14.  Political Scientists can Map Ideas

Researchers study how public opinion shifts. Simulation helps them test scenarios. They can design vignettes about economic crises or foreign threats. They can see how synthetic groups respond. This shows patterns of social change. A researcher may learn that fear increases loyalty. Another may learn that anger increases betrayal. These insights help predict society’s future. Simulation gives political science new tools.

15.  Simulation Builds Bridges

The same tool works for young learners, police, and scholars. This connects groups. A high school project and a government training can use the same platform. A college class and a research lab can share methods. A police academy and a university can compare results. This shared method builds common understanding. Bridges grow between groups. Simulation unites society.

Acknowledgments

The authors would like to acknowledge the extensive use of AI (specifically Microsoft CoPilot) as an assistant helping to frame the ideas. The use of AI provides a way to incorporate an ‘objective’ way to help structure the data. The AI was extensively ‘trained’ on the Mind Genomics and Psychophysics publications of author Moskowitz, publications appearing from 1990 onwards.

The authors would like to thank Vanessa M. Arcenas for her ongoing participation as coordinator and editor of these efforts regarding Mind Genomics and its intersection with Psychophysics and with AI, respectively.

References

  1. Chohan UW (2025) DOGE A Public Value Critique SSRN.
  2. Coussa A, Bellissimo N, Poulia K-A, Karavetian M (2024) Use of mind genomics for public health and wellbeing Lessons from COVID 19 Advances in Biomedical and Health Sciences. [crossref]
  3. Gentry JA (2025) Strategic warning intelligence Revival Comparative Strategy. [crossref]
  4. Gere A, Papajorgji P, Moskowitz H, Milutinovic V (2019) Using a Rule Developing Experimentation Approach to Study Social Problems The Case of Corruption in International Journal of Political Activism and Engagement. [crossref]
  5. Gofman A, Moskowitz HR (2010) Isomorphic Permuted Experimental Designs And Their Application In Conjoint Analysis. Journal of Sensory Studies. [crossref]
  6. Harizi A, Trebicka B, Tartaraj A, Moskowitz H (2020) A mind genomics cartography of shopping behavior for food products during the covid-19 23rd International Conference on Multidisciplinary Studies Resilience for Survival.
  7. Makridis C (2025) Overcoming the Federal Talent Gap Evidence from Special Governmental Employees and Other Pathways SSRN.
  8. Monahan T (2025) Surveillance in Trump’s Surveillance & Society. [crossref]
  9. Moskowitz H, Kover A, Papajorgji P (2022) Applying Mind Genomics to Social IGI Global. [crossref]
  10. Moskowitz H, Wren J, Papajorgji P (2020) Mind Genomics and the LAP LAMBERT Academic Publishing. [crossref]
  11. Papajorgji P, Moskowitz H (2022) The ‘Average Person’ Thinking About Radicalization A Mind Genomics Cartography. Journal of Police and Criminal Psychology. [crossref]
  12. Zdaniuk B (2014) Ordinary Least-Squares OLS Model Encyclopedia of Quality of Life and Well-Being Research. Springer Netherlands.