Monthly Archives: February 2024

fig 2

Accelerated the Mechanics of Science and Insight through Mind Genomics and AI: Policy for the Citrus Industry

DOI: 10.31038/MGSPE.2024412

Abstract

The paper introduces a process to accelerate the mechanics of science and insight. The process comprises two parts, both involving artificial intelligence embedded in Idea Coach, part of the Mind Genomics platform.. The first part of the process identifies a topic (policy for the citrus industry), and then uses Mind Genomics to understand the three emergent mind-sets of real people who evaluate the topic, along with the strongest performing ideas for each mind-set. Once the three mind-sets are determined, the second part of the process introduces the three mind-sets and the strongest performing elements to AI in a separate ‘experiment’, instructing Idea Coach to answer a series of questions from the point of view of each of the three mind-sets. The acceleration can be done in a short period of time, at low cost, with the ability to generate new insight about current data. The paper closes by referencing the issues of critical thinking and the actual meaning of ‘new knowledge’ emerging from a world of accelerated mechanics of science and insight.

Introduction

Traditionally, policy has been made by experts, often consultants to the government, these consultants being experts in the specific topic, in the art and science of communication, or both. The daily press is filled with stories about these experts, for example the so-called ‘Beltway Bandits’ surrounding Washington D.C [1]. It is the job of these experts to help the government decide general policy and specific implementation. The knowledge of these experts helps to identify issues of importance to the government groups to whom they consult. The ability of these expert to communicates helps to assure that the policy issues on which they work will be presented to the public in the most felicitous and convincing manner. At the same time that these experts are using the expertise of a lifetime to guide policy maker, there is the parallel world of the Internet, source of much information, and the emerging world of AI, artificial intelligence, with the promise of supplanting or perhaps more gently, the promise of augmenting, the capabilities and contributions of these expert. Both the internet and AI have been roundly attacked for the threat that they pose [2]. It should not come as a surprise that the world of the Internet has been accused of being replete with false information, which it no doubt is [3]. AI receives equally brutal attacks, such as producing false information [4] an accusation at once correct and capable of making the user believe that AI is simply not worth considering because of the occasional error [5]. The importance of public policy is already accepted, virtually universally. The issue is not the general intent of a particular topic, but the specifics. What should the policy emphasize? Who should be the target beneficiaries of the policy? What should be done, operationally, to achieve the policy? How can the policy be implemented? And finally, in this short list, what are the KPI’s, the key performance indicators by which a numbers-hungry administration can discover whether the policy is being adopted, and whether that adoption is leading to desire goals.

Theory and Pragmatics: The origin of this Paper

This paper was stimulated by the invitation of HRM to attend a conference on the Citrus Industry in Florida, in 2023. The objective of the conference was to bring together various government, business and academic interests to discuss opportunities in the citrus industry, specifically for the state of Florida in the United States, but more generally as well. Industry-center conferences of this type welcome innovations from science, often with an eye on rapid application. The specific invitation was to share with the business, academic and government audiences new approaches which promised better business performance. The focus of the conference was oriented towards business and towards government. As a consequence, the presentation to the conference was tailored to show how Mind Genomics as a science could produce interesting data about the response to statements about policy involving the business of citrus. As is seen below, the material focused on different aspects of the citrus industry, from the point of view of government and business, rather than from the point of view of the individual citrus product [6-9].

The Basic Research Tool: Mind Genomics

At the time of invitation the scope of the presentation was to share with the audience HOW to do a Mind Genomics study, from start to finish. The focus was on practical steps, rather than theory, and statistics. As such the presentation was to be geared to pragmatics, about HOW to do the research, WHAT to expect, and how to USE the results. The actual work ended up being two projects, the first project to get some representative data using a combination of research methods and AI, AI to generate the ideas and then research to explore the ideas with people. The second part, done recently, almost five months after the conference, expanded the use of AI to further analyze the empirical results, opening up new horizons for application.

Project #1: Understanding the Mind of the Ordinary Person Faced with Messages about Citrus Policy

The objective of standard Mind Genomics studies is to understand how people make decisions about the issues of daily life. If one were to summarize the goals of this first project, the following sentence would do the best job, and ended up being the sentence which guided the efforts. The sentence reads: Help me understand how to bring together consumers, the food trade, and the farmer who raises citrus products, so we can grow the citrus industry for the next decade. Make the questions short and simple, with ideas such as ‘how’ do we do things. The foregoing is a ‘broad stroke’ effort to under what to do in the world of the everyday. The problem is general, there are no hypotheses to test, and the results are to be in the form of suggestions. There is no effort to claim that the results tell us how people really feel about citrus, or what they want to do when the come into contact with the world of citrus as business, as commerce, as a regulated piece of government, viz., the agriculture industry. In simple terms, the sentence in bold is a standard request that is made in industry all the time, but rarely treated as a topic to be explored in a disciplined manner. Mind Genomics works by creating a set of elements, messages about a topic, and mixing/matching these elements to create small vignettes, combinations comprising a minimum of two messages and a maximum of four messages. The messages are created according to an underlying structure called an experimental design. The respondent, usually sitting at a remote computer, logs into the study, reads a very short introduction to the study, and then evaluates a set of 24 vignettes, one vignette at a time. The entire process takes less than 3-4 minutes and proceeds quickly when the respondents are members of an on-line panel and are compensated for their participation by the panel company. The Mind Genomics process allows the user to understand what is important to people, and at the same time prevents the person from ‘gaming’ the study to give the correct answer. In most studies, the typical participant is uninterested in the topic. The assiduous researcher may instruct the participant to pay attention, and to give honest answers, but the reality is that people tend to be interested in what they are doing, not in what the researcher wants to investigate. As a consequence, their answers are filled with a variety of biases, ranging from different levels of interest and involvement to distractions by other thoughts. The Mind Genomics process works within these constraints by assuming that the respondent is simply a passive observer, similar to a person driving through their neighborhood, almost in an automatic fashion. The person takes in the information about the road, traffic, and so forth, but does not pay much attention. At the end, the driver gets to where they are going, but can barely remember what they did when asked to recall the steps. This seems to be the typical course of events. The systematic combinations mirror these different ‘choice points.’ The assumption is that the respondent simply looks at the combination, and ‘guesses’, or at least judges with little real interest. Yet, the systematic variation of the elements in the vignettes ends up quickly revealing what elements are important, despite the often heard complain that ‘I was unable to see the pattern, so I just guess.’

The reasons for the success of Mind Genomics are in the design and the execution [10-12].

  1. The elements are created with the mind-set of a bookkeeper. The standard Mind Genomics study comprises four questions (or categories), each question generating four answers (also called element). The questions and answers can be developed by professionals, by amateurs, or by AI. This paper will show how AI can generate very powerful, insight questions and answers, given a little human guidance by the user.
  2. The user is required to fill in a templated form, asking for the questions (see Figure 1, Panel A). When the user needs help the AI function (Idea Coach) can recommend questions once Idea Coach is given a sense of the nature of the topic. Figure 1, Panel B shows the request to Idea Coach in the form of a paragraph, colloquially called a ‘squib.’ The squib gives the AI a background, and what is desired. The squib need not follow a specific format, as long as it is clear. The Idea Coach returns with sets of suggested questions. The first part of the suggest questions appears in Figure 1, Panel C, showing six of the 15 questions returned by the AI-powered Idea Coach. The user need only scroll through to see the other suggestions. The user can select a question, edit it, and then move on. The user can run many iterations to create different sets of questions and can either edit the squib or edit the question, or both. At the end of the process, the user will have created the four questions, as shown in Figure 1, Panel D. Table 1 shows a set of questions produced by the Idea Coach, in response to the squib.
  3. The user follows the same approach in order to create the answers. This time, however, the squib does not need to be typed in by the user. Rather, the question selected by the user, and after editing, becomes the squib for Idea Coach to use. For this project, Figure 1, Panel D shows the four squibs, one for each question. Idea Coach once again returns with 15 answers (elements) for each squib. Once again the Idea Coach can be used, so that the Idea Coach becomes a tool to help critical thinking, providing sequential sets of 15 answers (elements). From one iteration to another the 15 answers provided by Idea Coach differ for the most part, but with a few repeats Over 10 or so iterations it’s likely that most of the answers will have been presented.
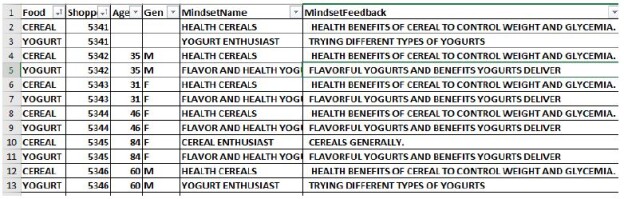
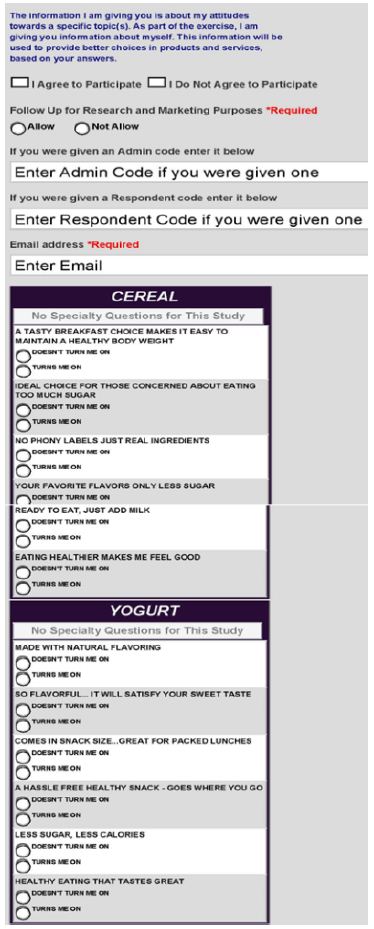
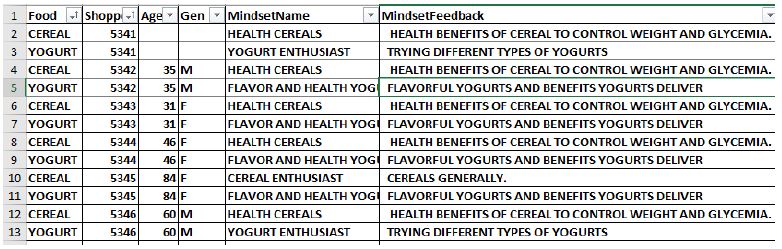
  4. Once the user has selected the questions, and then selected four answers for each question, the process continues with the creation of a self-profiling questionnaire. That questionnaire allows the user to find out how the respondent thinks about different topics directly or tangentially involved with the project. The self-profiling questionnaire has a built-in pair questions to record the respondent’s age (directly provided), and self-described gender. For all questions except that of age, the respondent is instructed to select the correct answer to the question, the question presented on the screen, the answers presented in a ‘pull-down’ menu which appears when the corresponding question is selected for answering.
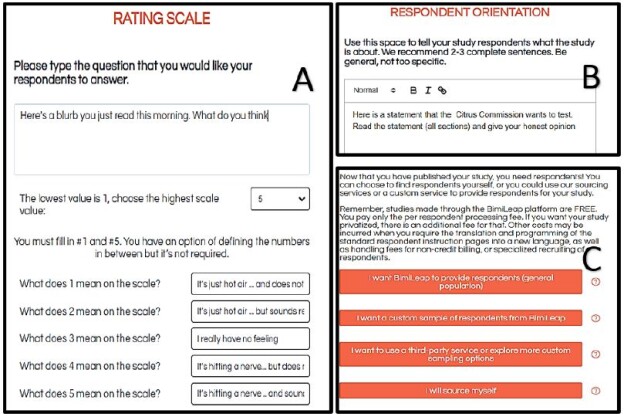
  5. The next step in the process requires the user to create a rating scale (Figure 2, Panel A). The rating scale chosen has five points as show below. Note that the scale comprises two parts. The first part is evaluative viz., how does the respondent feel (hits a nerve vs hot air). The second part is descriptive (sounds real or does not sound real). This two-sided scale enables the user to measure both the emotions (key dependent variable for analysis), as well as cognitions. For this study, the focus will be on the percent of ratings that are either 5 or 4 (hitting a nerve). Note that all five scale points are labelled. Common practice in Mind Genomics studies has been to label all the scales for the simple reason that most users of Mind Genomics results really are not focused on the actual numbers, but on the meaning of the numbers.
    Here’s a blurb you just read this morning on the web when you were reading stuff.. What do you think
    1=It’s just hot air … and does not sound real
    2=It’s just hot air … but sounds real
    3=I really have no feeling
    4=It’s hitting a nerve… but does not sound real
    5=It’s hitting a nerve .. and sounds real
  6. The user next create a short introduction to the study, to orient the respondent (Figure 2, Panel B). Good practice dictates that wherever possible the user should provide as little information about the topic as possible. The reason is simple. It will be from the test stimuli, the elements in the 4×4 collection, or more specifically the combinations of those elements into vignette, that the respondent will make the evaluation and assign the judgment. The purpose of the orientation is to make the respondent comfortable and give general direction. The exceptions to this dictum come from situations, such the law, where knowledge of other factors outside of the material being presented can be relevant. Outside information is not relevant here.
  7. The last step of the setup consists of ‘sourcing’ the respondents (Figure 2, Panel C). Respondents can be sourced from standing panels of pre-screened individuals, or from people one invites, etc. Good practice dictates working with a so-called online panel provider, which for a fee can customize the number and type of respondent desired. With these online panel providers the study can be done in a matter of hours.
  8. Once the study has been set-up, including the selection of the categories and elements (viz, questions and answers), the Mind Genomics platform creates combinations of these elements ‘on fly’, viz., in real time, doing so for each respondent who participates in the study. It is at the creation of the vignettes where Mind Genomics differentiates itself from other approaches. The conventional approach to evaluating a topic uses questionnaires, with the respondent present with stand alone ideas in majestic isolation, one idea at a time. The idea or topic might be a sentence, but the sentence has the aspects of a general idea, such as ‘How important is government funding for a citrus project.’ The goal is to isolate different, relevant ideas, focus the mind of the respondent on each idea, one at a time, obtain what seems to be an unbiased evaluation of the idea, and then afterwards to the relevant analyses to obtain a measure of central tendency, viz., an average, a median, and so forth. The thinking is straightforward, the execution easy, and the user presumes to have a sense of the way the mind of the respondent works, having given the respondent a variety of ‘sterile ideas’, and obtained ratings for each of the separate ideas.Figure 3 shows a sample vignette as the respondent would see it. The vignette comprises a question at the topic, a collection of four simple statements, without any connectives, and then the scale buttons on the bottom. The respondent is presented with 24 of these vignettes. Each vignette comprises a minimum of two and a maximum of four elements, in the spare structure shown in Figure 3. There is no effort made to make the combination into a coherent whole. Although the combinations do not seem coherent, and indeed they are not, after a moment’s shock the typical respondent has no problem reading through the vignette, as disconnected as the elements are, and assigning a rating to the combination. Although many respondents feel that they are ‘guessing,’ the subsequent analysis will reveal that they are not.

    The vignettes are constructed by an underlying plan known as an experimental design. The experimental design for these Mind Genomics studies calls for precisely 24 combinations of elements, our ‘vignettes’. There are certain properties which make the experimental design a useful tool to understand how people think.

    a. Each respondent sees a set of 24 vignettes. That set of vignette suffices to do a full analysis on the ratings of one respondent alone, or on the ratings of hundreds of respondents. The design is explicated in Gofman & Moskowitz.

    b.  The design calls for each element to appear five times in 24 vignettes and be absent 19 times from the 24 vignettes.

    c.  Each question or category contributes at most one element to a vignette, often no elements, but never two or more elements. In this way the underlying experimental design ensures that no vignette every present mutually contradictory information, which could easily happen if elements from the same category appeared together, presenting different specifics of the same type of information.

    d.  Each respondent evaluates a different set of vignettes, all sets structurally equivalent to each other, but with different combinations [13]. The rationale underlying this so-called ‘permutation’ approach is that the researcher learns from many imperfectly measured vignettes than from the same set of vignettes evaluated by different respondents in order to reduce error of measurement. In other words, Mind Genomics moves away from reducing error by averaging out variability to reducing error by testing a much wider range of combinations. Each combination tested is subject to error, but the ability to test a wide number of different combinations allows the user to uncover the larger pattern. The pattern often emerges clearly, even when the measurements of the individual points on the pattern are subject to a lot of noise.

    The respondent who evaluates the vignettes is instructed to ‘guess.’ In no way is the respondent encouraged to sit and obsess over the different vignettes. Once the respondent is shown the vignette and rates it, the vignette disappears, and a new vignette appears on the screen. The Mind Genomics platform constructs the vignettes at the local site where the respondent is sitting, rather than sending the vignettes through the email.

    When the respondent finishes evaluating the vignettes, the composition of the vignette (viz., the elements present and absent) is sent to the database, along with the rating (1-5, as show above) as well as the response time, defined as the number of seconds (to the nearest 100th) elapsing between the appearance of the vignette on the respondent’s screen and the respondent’s assignment of a rating.

    The last pieces of information to be added comprise the information about the respondent generated by the self—profiling questions, done at the start of the study, and a defined binary transformation of the five-point rating to a new variable, called convenient R54x.. Ratings 5 and 4 (hitting nerve) were transformed to the value 100; . Ratings 3,2,1 (not hitting a nerve) were transformed to the value 0. To the transformed values 0 or 100, respectively, was added a vanishingly small random number (<10-5). The rationale for the random number is that later the ratings would be analyzed by OLS (ordinary least-squares) regression and then by k-means clustering, with the focus on the coefficients to emerge from OLS regression as inputs to the clustering. To this end it was necessary to ensure that all respondent data would generate meaningful coefficients from OLS regression, a requirement only satisfied when the newly created binary variables were all different from each other. Adding the vanishingly small random number to each newly created binary variable ensured that variation.

  9. The analysis of the ratings follows two steps once the ratings have been transformed to R54x. The first step uses OLS (ordinary least-squares) regression, at the level of the individual respondent. OLS regression fits a simple linear equation to the data, relating the presence/absence of the 16 elements to the variable R54x. The second step uses k-means clustering (Likas et. al., 2003) to divide the respondents into groups, based upon the pattern of the coefficients for the equation.

Table 1: Questions provided to the user by AI embedded in Idea Coach

tab 1


fig 1

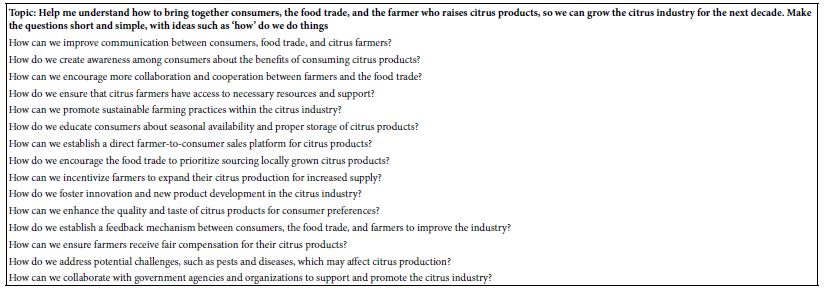
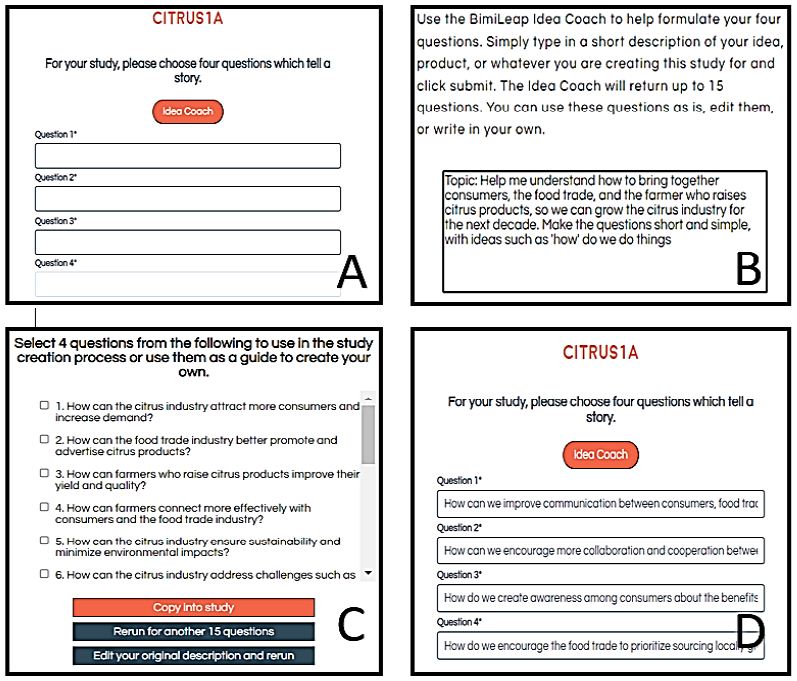
Figure 1: Set up for the Mind Genomics study. Panel A shows the instructions to provide four questions. Panel B shows the input to Idea Coach. Panel C shows the first part of the output from Idea Coach, comprising six of the 15 questions generated. Panel D shows the four questions selected, edited, and inserted into the template.

fig 2

Figure 2: Final steps in the set-up of the study. Panel A shows the rating scale; the user types in the rating question select the number of scale points, and describe each scale point. Panel B shows the short orientation at the start of the study. Panel C shows the request to source respondents.

fig 3

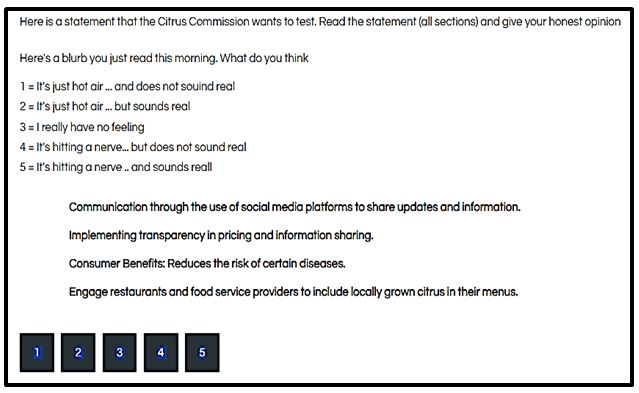
Figure 3: Example of a four-element vignette, together with the rating question, the 5-point rating scale, and the answer buttons at the bottom of the screen.

The equation is expressed as: R54x = k1A1 + k2A2 … k16D4. The OLS regression program has no problem creating an equation for each respondent, based upon the prophylactic step of having added a vanishingly small random number to each transformed rating. That prophylactic step ensures that the OLS regression will never encounter the situation of ‘no variation in the dependent variable’, R54x.

Once the clustering has finished, the cluster program assigns each respondent first into one of two non-overlapping clusters, and second into one of three non-overlapping clusters. In the nomenclature of Mind Genomics these clusters are called ‘mind-sets’ to recognize the fact that they represent different points of view.

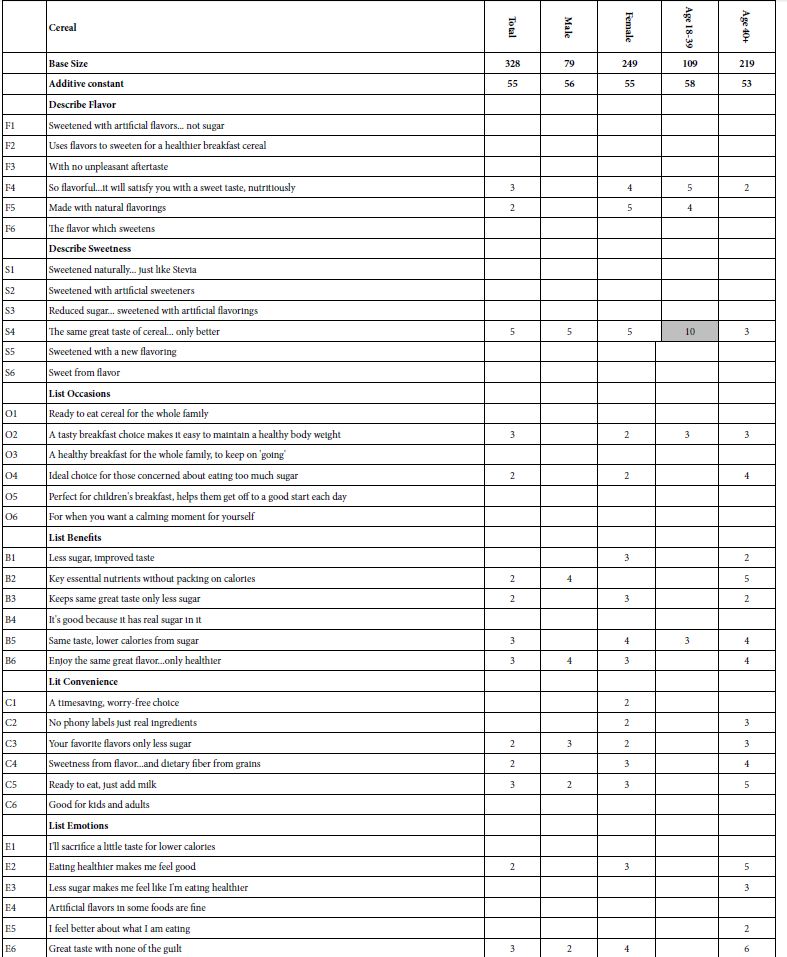
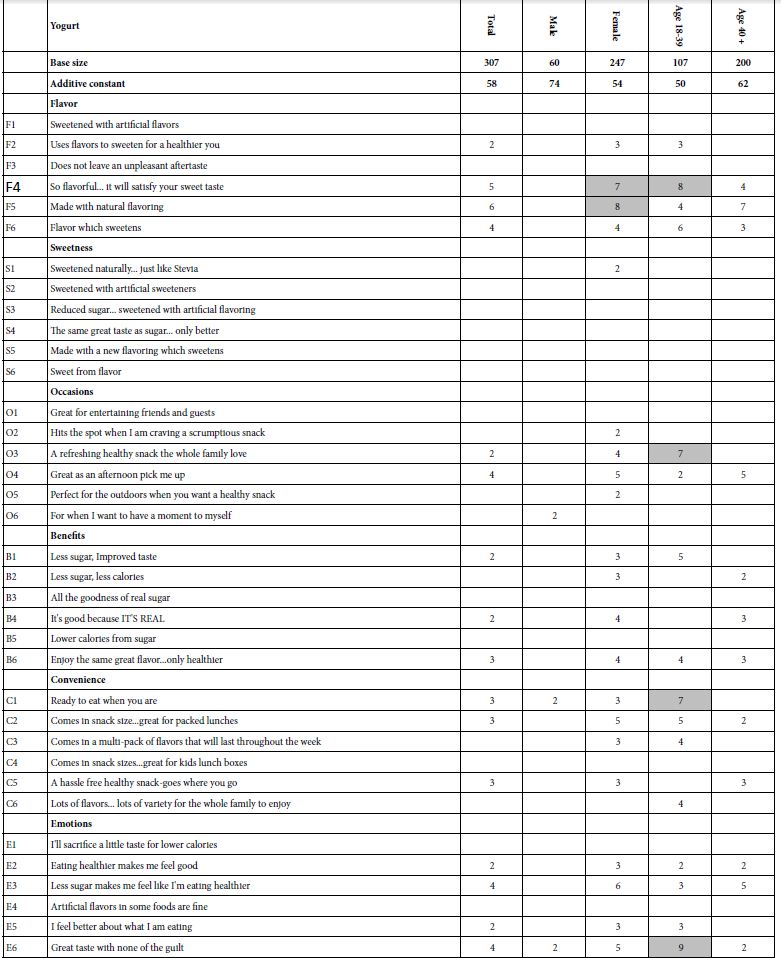
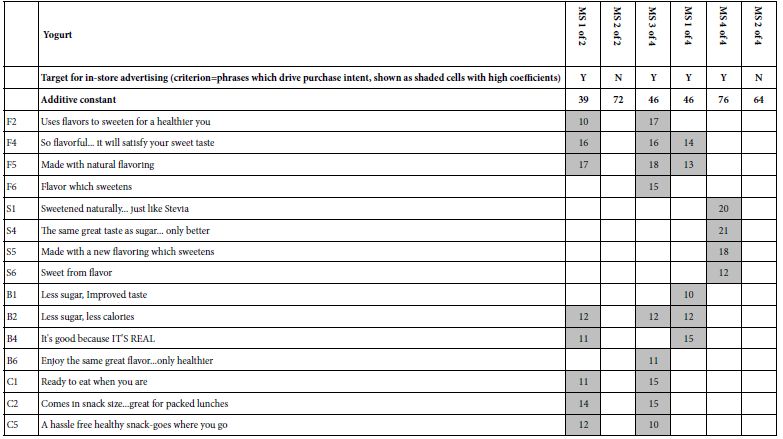
Table 2 presents the coefficients for the Total Panel, then for the two-mind-set solution, and then for the three-mind-set solution. Only positive coefficients are shown. The coefficient shows the proportion of time a vignette with the specific element generate a value of 100 for variable R54x. There emerges a large range in the numerical values of 16 coefficients, not so much for the Total Panel as for the mind-sets. This pattern of large difference across mind-sets in the range of the coefficients for R54x makes sense when we consider what the clustering is doing. Clustering is separating out groups of people who look at the topic in the same way, and do not cancel each other. When we remove the mutual cancellation through clustering the result is that all of the patterns of coefficients in a cluster are similar. The subgroup no longer has averages of numbers from very high to very low for a single element, an average which suppressed the real pattern. No longer do the we have the case that the Total Panel ends up putting together streams flowing in different directions. Instead, the strengths of different mind-sets becomes far more clear, more compelling, and more insights driven.

Table 2: Coefficients for the Total Panel, and then for the two-mind-set solution, and then for the three-mind-set solution, respectively.

tab 2


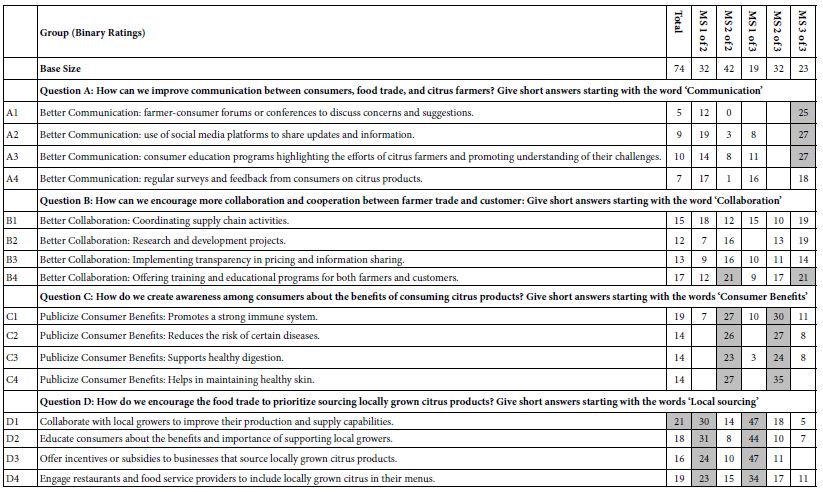
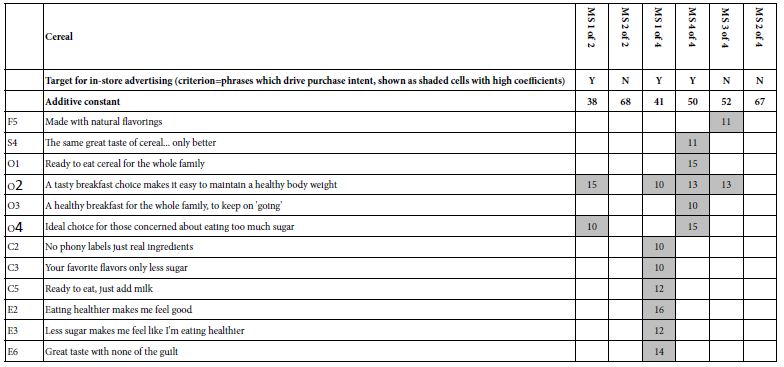
We focus here on the easiest take, namely, to interpret the mind-set. It is hard to name mind-sets 1 of 2 and 2 of 2. In contrast, it becomes far easier to describe the different mind-sets. We look only at the very strong coefficients; those score 21 or higher.

  1. Mind-Set 1 of 3-Focus on interacting with users, include local rowers, consumers, businesses which grow locally, and restauranteurs.
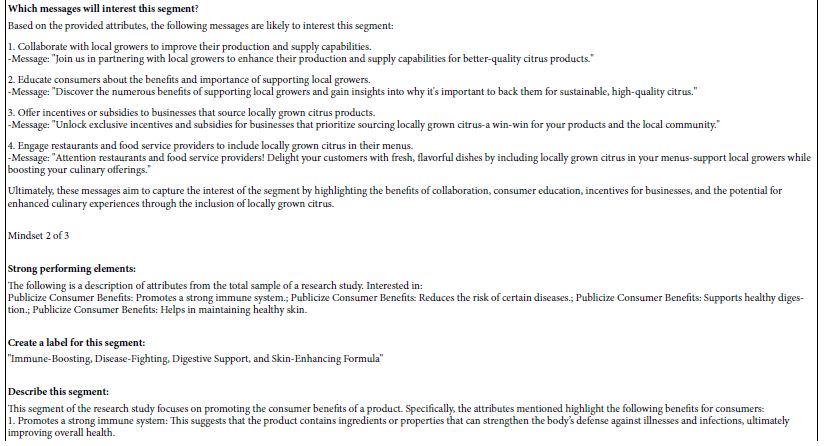
  2. Mind-Set 2 of 3-Focus on publicizing benefits to consumers.
  3. Mind-Set 3 of 3-Focus on communication.

Table 2 shows a strong consistency within the segments, a consistency which seems more art than science. The different groups emerge clearly, even though it would be seemingly impossible to find patterns among the 24 vignettes, especially recognizing that each respondent ended up evaluating a unique set of vignettes. The clarity of the mind-set emerges again and again in Mind Genomics studies, despite the continue plaint by study respondents that they could not ‘discover the pattern’ and ended up ‘guessing.’ Despite that plaint, the patterns emerging make overwhelming sense, disposing of the need of some of the art of storytelling, the ability to craft an interesting story from otherwise boring and seemingly pattern-less data. A compelling story emerges just from looking at what element are shade, for each mind-set. Finally, the reason for the clarity ends up being the hard-to-escape reality that the elements all are meaningful in and of themselves. Like the reality of the everyday, each individual element, like each individual impression of an experience, ‘makes sense’.

The Summarizer: Finding Deeper Meanings in the Mind-set Results

Once the study has finished, the Mind Genomics platform does a thorough ‘work-up’ of the data, creating models, creating tables of coefficients, etc. As part of this the Mind Genomics platform applies a set of pre-specified queries to the set of strong performing elements, operationally defined as those elements with coefficients of 21 or higher. The seemingly artificial lower limit of 21 comes from analysis of the statistical properties of the coefficients, specifically at what value of coefficient can user feel that the pattern of coefficients is statistically robust, and thus feel the pattern to emerge has an improved sense of reality. The Summarizer is programmed to write these short synopses and suggestions, doing so only with the tables generated by the Mind Genomics platform, as shown above in Table 2. Thus, for subgroups which generate no coefficients of 21 or higher, the Summarizer skips those subgroups. Finally, the summarizer is set up to work for every subgroups defined in the study, whether age, gender, or subgroup defined by the self-profiling classification question in which respondent profile themselves on topics relevant to the study.

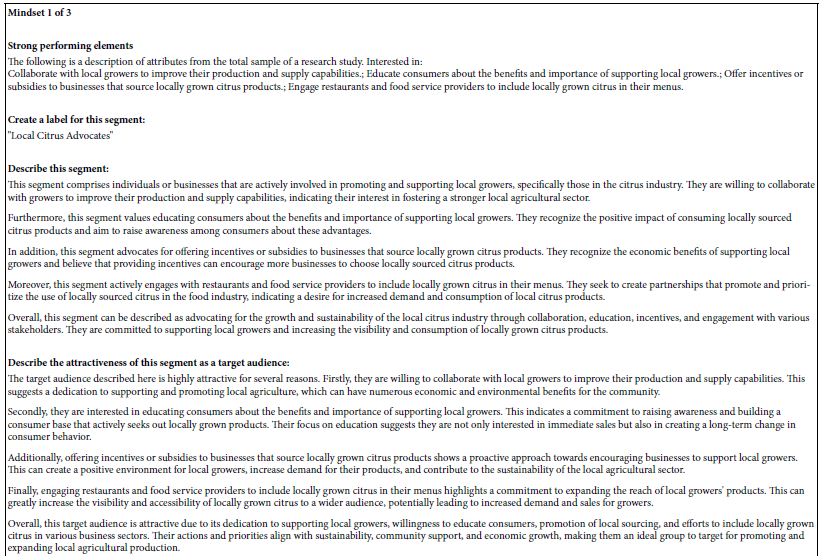
Table 3 shows the AI summarization of the results for each of the three mind-sets. The eight summarizer topics are:

  1. Strong performing elements
  2. Create a label for this segment
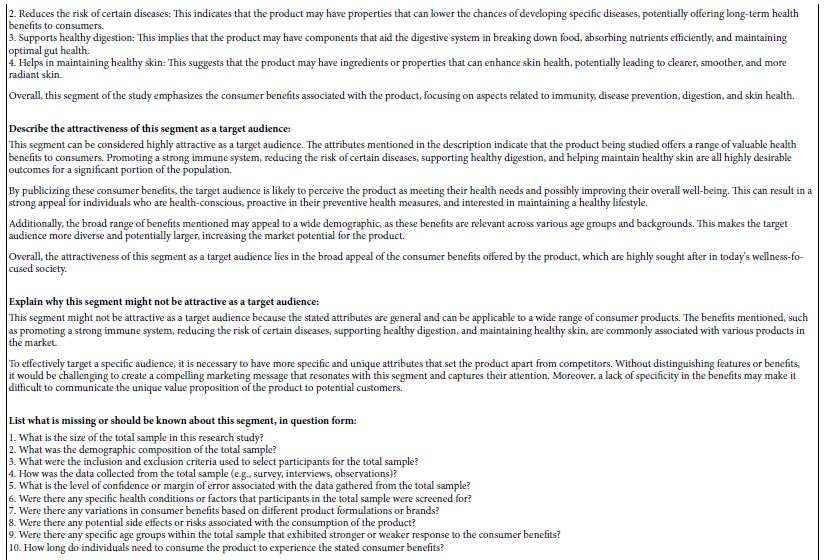
  3. Describe this segment
  4. Describe the attractiveness of this segment as a target audience:
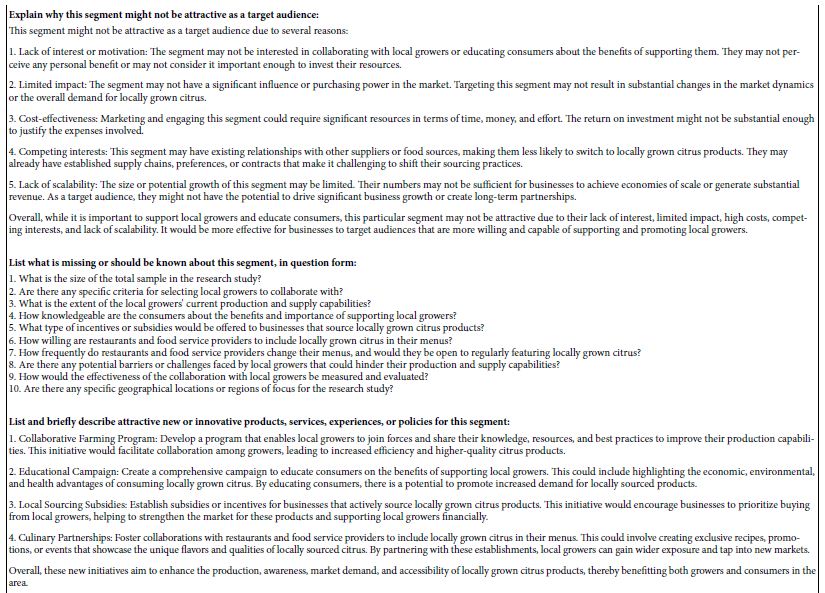
  5. Explain why this segment might not be attractive as a target audience:
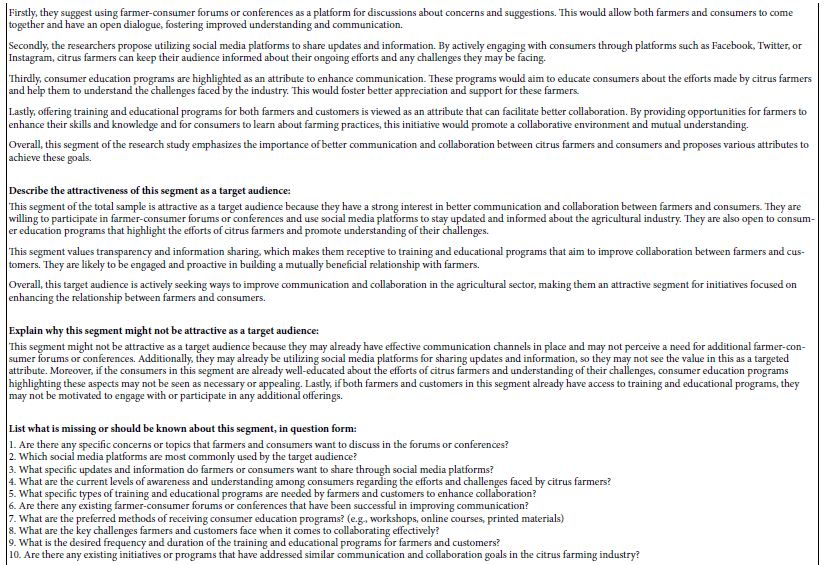
  6. List what is missing or should be known about this segment, in question form:
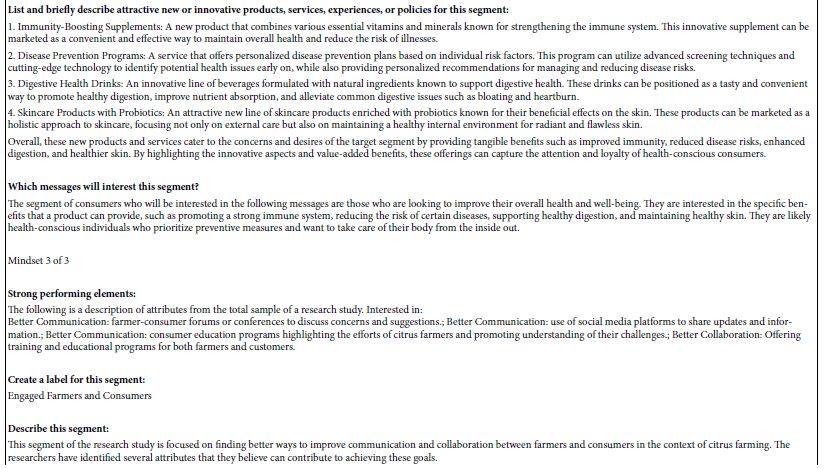
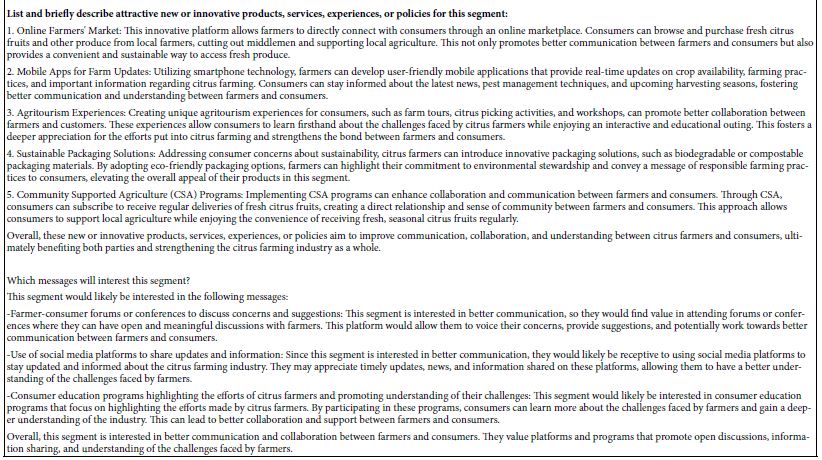
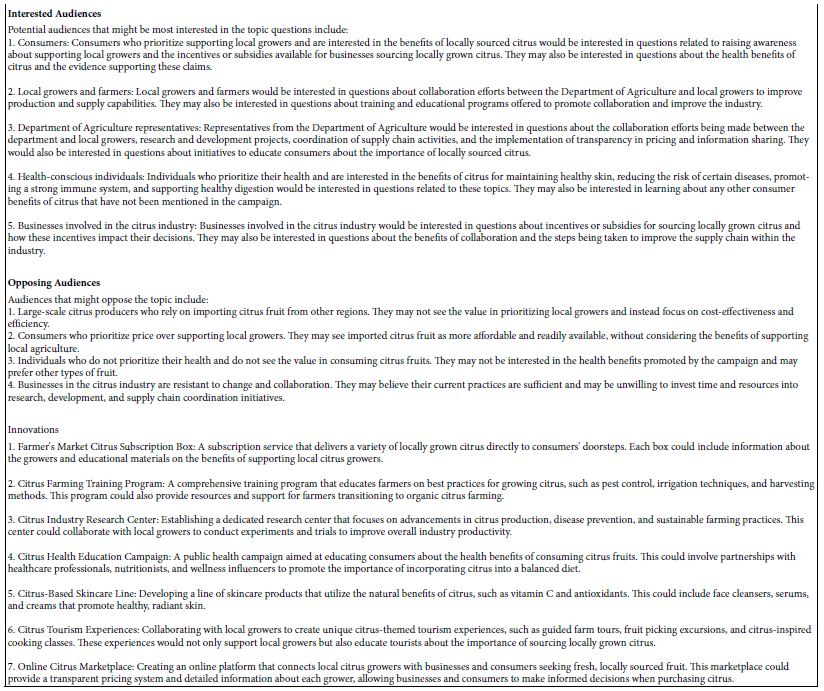
  7. List and briefly describe attractive new or innovative products, services, experiences, or policies for this segment:
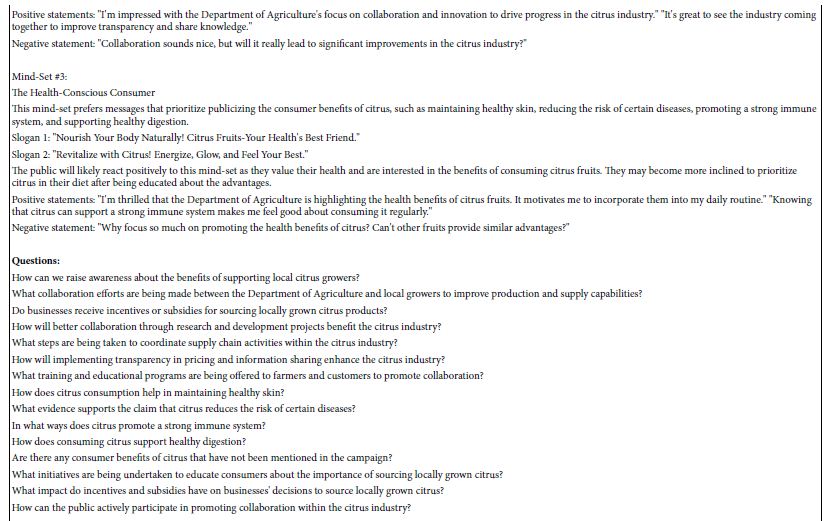
  8. Which messages will interest this segment?

Table 3: The output of the AI-based Summarizer applied to the strong performing elements from each of the mind-sets in the three-mind-set solution.

tab 3(1)

tab 3(2)

tab 3(3)

tab 3(4)

tab 3(5)

tab 3(6)

tab 3(7)
 

Part 2: AI as a Tool to Create New Thinking, Create New Hypotheses

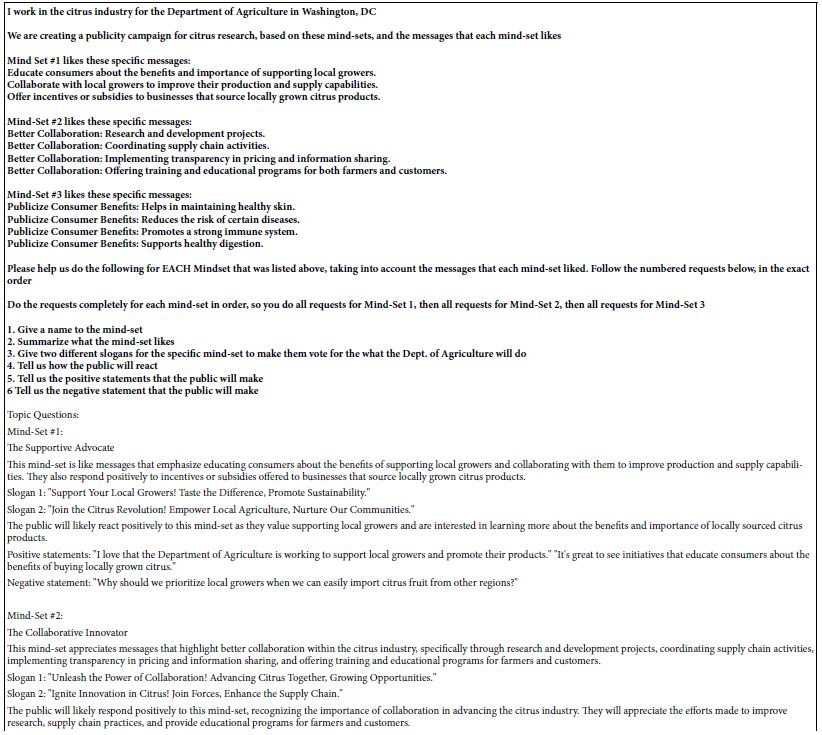
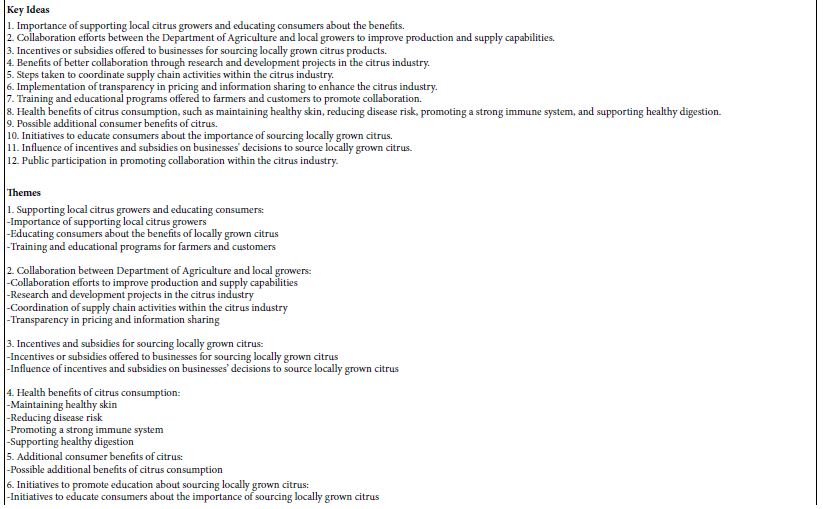
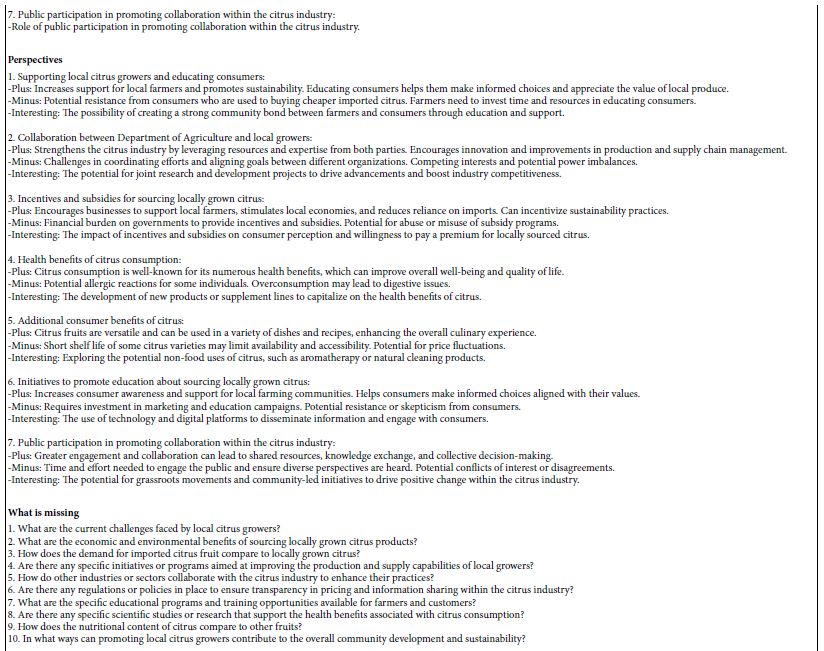
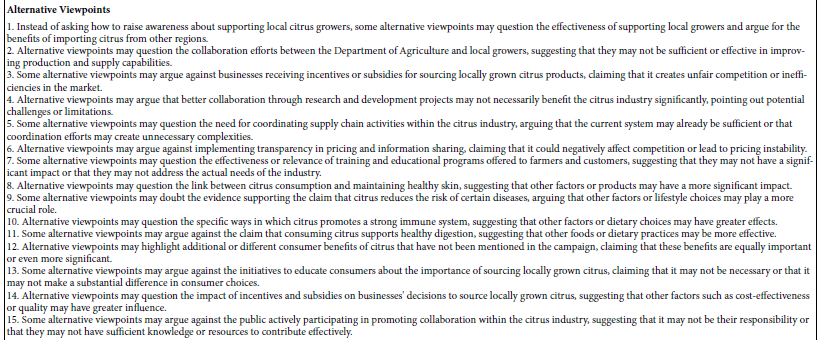
During the past six months of experience with AI embedded in Idea Coach, a new and unexpected discovery emerged, resulting from exploratory work by author Mulvey. The discovery was that the squib for Idea Coach could be dramatically expanded, moving it beyond the request for questions, and into a more detailed request. The immediate reaction was to explore how deeply the Idea Coach AI could expand the discovery previously made. Table 4 shows the expanded squib (bold), and what the Idea Coach returned with later on. The actual squib was easy to create, requiring only that the user copy the winning elements for each mind-set (viz., elements with coefficients of 21 or higher). Once these were identified and listed out, squib was further amplified by a set of six questions. Idea Coach returned with the answers to the six questions for each of the three mind-sets, and then later did its standard analysis using the eight prompts. These appear in Table 4. It is important to note that Table 4 contains no new information, but simply reworks the old information. In reworking that old information, however, the AI creates an entirely new corpus of suggestions of insights. From this simple demonstration emerges the realization that the sequence of Idea Coach, questions, answers, results, all emerging in one hour or less for a set of 100 respondents or fewer, can be further used to springboard the investigations, and create new insights. These insights should be tested, but it seems likely that a great deal of knowledge can be obtained quickly, at very low cost, with no risk.

Table 4: AI ‘super-analysis’ of results from an earlier Mind Genomic study, revealing three mind-sets, and the strong performing elements for each mind-set.

tab 4(1)

tab 4(2)

tab 4(3)

tab 4(4)

tab 4(5)

tab 4(6)

Discussion and Conclusions

This paper began with a discussion of a small-scale project in the world of citrus, a project meant to be a demonstration to be given to a group at the citrus conference in September 2023. At that time, the Idea Coach had been introduced, and was used as a prompt for the study. It is important to note that the topic was not one based on a deep literature search of existing problems, but instead a topic crafted to be of interest to an industry-sector conference. The focus was not on science to understand deep problems, but rather research on how to satisfy industry-based needs. That focus explains why the study itself focuses on a variety of things that one should do. The focus was tactics, not knowledge. The former being said, the capability to accelerate and expand knowledge is still relevant, especially as that capability bears upon a variety of important issues. The first issue is the need to instill critical thinking into students [14,15]. The speed, simplicity, and sheer volume of targeted information may provide an important contribution to the development of critical thinking. Rather than giving students simple answers to simple questions, the process presented here opens up the possibility that the Idea Coach format shown here can become a true ‘teacher’, working with students to formulate questions, and then giving the students the ability to go into depth, in any direction that they wish, simply by doing an experiment, and then investigating in greater depth any part of the results which interest them. The second issue of relevance is the potential to create more knowledge through AI. There are continuing debates about whether or not AI actually produces new knowledge [16,17]. Rather than dealing with that issue simply in philosophy-based arguments, one might well embark on a small, affordable series of experiments dealing with a defined topic, find the results from the topic in terms of mind-sets, and then explore in depth the mind-sets using variations of the strategy used in the second part of the study. That is, once the user has obtained detailed knowledge about mind-sets for the topic, there is no limitation except for imagination which constrains the user from asking many different types of questions about what the mind-sets would say and do. After a dozen or so forays into the expansion of knowledge from a single small Mind Genomics project, it would then be of interest to assess the degree to which the entire newly developed corpus of AI-generated knowledge and insight is to be considered ‘new knowledge’, or simply a collection of AI-conjectures. That consideration awaits the researcher. The tools are already here, the effort is minor, and what awaits may become a treasure trove of new knowledge, perhaps.

References

  1. Butz EL (1989) Research that has value in policy making: a professional challenge. American Journal of Agricultural Economics 71: 1195-1199.
  2. Wang J Molina, MD, Sundar SS (2020) When expert recommendation contradicts peer opinion: Relative social influence of valence, group identity and artificial intelligence. Computers in Human Behavior 107, p.106278, https://doi.org/10.1016/j.chb.2020.106278
  3. Molina MD, Sundar SS, Le T, Lee D (2021) “Fake news” is not simply false information: A concept explication and taxonomy of online content. American Behavioral Scientist 65: 180-212.
  4. Dalalah D, Dalalah OM (2023) The false positives and false negatives of generative AI detection tools in education and academic research: The case of ChatGPT. The International Journal of Management Education 21: 100822.
  5. Brundage M, Avin S, Clark J, Toner H, Eckersley P, Garfinkel B, Dafoe A, Scharre P, et al. and Anderson H (2018) The malicious use of artificial intelligence: Forecasting, prevention, and mitigation. arXiv preprint arXiv: 1802.07228.
  6. Batarseh FA and Yang R (eds.) (2017) Federal data science: Transforming government and agricultural policy using artificial intelligence. Academic Press.
  7. Ben Ayed R, Hanana M (2021) Artificial intelligence to improve the food and agriculture sector. Journal of Food Quality, 1-7, ID 5584754 | https://doi.org/10.1155/2021/5584754
  8. Sood A, Sharma RK, Bhardwaj AK (2022) Artificial intelligence research in agriculture: A review. Online Information Review 46: 1054-1075.
  9. Taneja A, Nair G, Joshi M, Sharma S, Sharma S, Jambrak AR, Roselló-Soto E, Barba FJ, Castagnini JM Leksawasdi N, Phimolsiripol Y et.al (2023) Artificial Intelligence: Implications for the Agri-Food Sector. Agronomy 13: 1397.
  10. Harizi A, Trebicka B, Tartaraj A, Moskowitz, H (2020) A mind genomics cartography of shopping behavior for food products during the COVID-19 pandemic. European Journal of Medicine and Natural Sciences 4: 25-33.
  11. Porretta S, GereA, Radványi D, Moskowitz H (2019) Mind Genomics (Conjoint Analysis): The new concept research in the analysis of consumer behaviour and choice. Trends in Food Science & Technology 84: 29-33.
  12. Zemel R, Choudhuri SG, Gere A, Upreti H, Deite Y, Papajorgji P, Moskowitz H (2019) Mind, consumers, and dairy: Applying artificial intelligence, Mind Genomics, and predictive viewpoint typing. In: Current Issues and Challenges in the Dairy Industry (ed R, Gywali S, Ibrahim, T, Zimmerman), Intech Open, IntechOpen, IBSN: 9781789843552, 1789843553
  13. Gofman A, Moskowitz H (2010) Isomorphic permuted experimental designs and their application in conjoint analysis. Journal of Sensory Studies 25: 127-145.
  14. Guo Y, Lee D (2023) Leveraging chatgpt for enhancing critical thinking skills. Journal of Chemical Education 100: 4876-4883.
  15. Ibna Seraj, PM, Oteir I (2022) Playing with AI to investigate human-computer Interaction Technology and Improving Critical Thinking Skills to Pursue 21st Century Age. Education Research International, 2022. Article ID 6468995 | https://doi.org/10.1155/2022/6468995
  16. Schäfer MS (2023) The Notorious GPT: science communication in the age of artificial intelligence. Journal of Science Communication 22: Y02.
  17. Spennemann DH (2023) ChatGPT and the generation of digitally born “knowledge”: How does a generative AI language model interpret cultural heritage values? Knowledge 3: 480-512.
FIG 2

Mind-Set Based Signage: Applying Mind Genomics to the Shopping Experience

DOI: 10.31038/MGSPE.2024411

Abstract

The paper presents a new approach to optimizing the shopper experience, combining easy-to-implement tools for understanding shopper mind-sets at the granular, specific level (Mind Genomics; www.BimiLeap.com) with a simple, rapid way which assigns any shopper or prospective shopper to the relevant mind-set for that granular topic (www.PVI360.com). The approach begins with a simple study of the motivating power of relevant messages, and thus uncovers mind-sets or groups of respondents showing similar patterns of what motivates them. Then, using the same data, the approach creates a simple questionnaire comprising six questions taken from the original study, the pattern of answers to which assign a new person to a mind-set. Once the mind-set of the shopper is ‘identified’ for the granular topic using the PVI (personal viewpoint identifier) it is a matter of giving the shopper the appropriate motivating message, either at the time of shopping in brick and mortar store or e-store, or sending the message on the Internet in the form of an advertisement or individualized coupon.

Introduction

The past two decades have seen an explosion of knowledge about the consumer, the knowledge emerging from the speed and affordability of internet-based surveys, the sophisticated analysis of masses of cross-sectional data known as Big Data, and the application of artificial intelligence to uncover patterns. What continues to emerge is that nature is simultaneously tractable and intractable. As the macro level we know what to expect in terms of purchase patterns and expected time to repurchase, some of which knowledge may transfer to the level of the individuals, only for the general pattern just exposed to be disrupted by the idiosyncrasies of each individual. The world at the time of this writing (Fall, 2023) is quite different from the world of just a decade ago, and most certain far different from the earlier decades. The notion that one could change advertisements is well-accepted, easily and widely done. Outdoor advertisements and LED technology assault us everywhere we go. We are accustomed to see large billboards with attention-grabbing sequences advertisements, the modern day evolution of signage of decades ago, once static, now plastic, and changeable at will. Now technology makes it possible to individualize the messaging for an individual, much as is done on a cell phone. This paper presents one approach. The organizing nature of this paper is how one might advertise to a single customer, using science to uncover the ‘mind’ of that customer ahead of time. The objective of this study was to understand the different types of messages which might appeal to shoppers of cereal in the middle isle, and shoppers of yogurt in the refrigerated dairy section. Could the technology of 2023 be set up to deliver the proper messages to an individual who is walking along the store? And could the approach be set up to be done at scale, affordably, quickly, with scientific precision rather than with guessing about what the person wants based upon who the person is. This latter condition is important. It means that the messages must be delivered to the person most likely to respond to the specific messages. The studies reported here were done with the intention of testing out the possibility that one could create a knowledge-based system about messaging for simple, conventional, familiar products. The paper does not deal with new to the world products which have their own mystique, and both positive and negative messaging attached. Rather, the paper deals with what one might call ‘tired, old, utterly familiar’ products that may not be susceptible to the romance of the new and different.

A Short Historical Overview to ‘Messaging the Shopper’

The notion that one can influence the shopper by proper messaging is decades old, and the subject of numerous experiments. Indeed, the real-world behaviors of shoppers and the change in behavior resulting from the proper messaging opens up the topic to anyone interested in messaging, whether the interest be theory such as experimental psychology, to applied science such as consumer psychology, and of course the world of business applications. As a consequence, there have been a number of different studies focusing specifically on shopping.

  1. Schumann et al. (1991) reported only modest effectiveness of signage in shopping cart [1]. To summarize their results: “Findings from both studies reflect that over 60% of the 2 samples noted the presence of the signs in their carts. When Ss were questioned about their awareness of cart advertising on a specific occasion, only 3.0-6.5% recalled the product. There was no evidence that cart signage acts in a subliminal fashion that results in the purchase of the brand.” It may well be the signage in the cart was general information about the product, not necessarily information that would tug at the heartstrings of the shopper.
  2. Dennis et al. (2012) confirmed the efficacy of digital signage but argued for emotional content [2]. They noted that the typical content of digital signal is ‘information-based’ whereas digital signage might be more effective if it were to comprise emotional messaging as well, or even instead of simple information. Results are limited as the DS (digital signage) screens content was information based, whereas according to LCM, (Limited Capacity Model of Mediate Messaging) people pay more attention to emotion-eliciting communications. The results have practical implications as DS appeals to active shoppers.
  3. Buttner et al. (2013) proposed at two types of shopping orientations (mind-sets), task focused and experiential shopping, respectively [3]. They report that “Activating a mindset that matches the shopping orientation increases the monetary value that consumers assign to a product. ….marketers and retailers will benefit from addressing experiential and task-focused shoppers via the mindsets that underlie their shopping orientation.”
  4. Chang and Chen (2015) reported that mind-sets are important, and that the communication should consider the different mind-sets [4]. Their notion was that people may or may not be skeptical to advertising. Those who have a ‘utilitarian orientation’ and an ‘individualistic’ mind-set tend to be skeptical about advertising, and need messages which are different from those individuals who have a ‘hedonic’ and a ‘collectivistic’ mind-set. Chang and Chen bring this topic into discussions about CRM and donating, but their notions can be easily extended to the right type of messaging for digital signage

The Contribution of Mind Genomics to the Solution

Mind Genomics is an emerging science which grew out of the need to understand how people make decisions about the issues of the ‘everyday’. Mind Genomics rests on the realization that the ‘everyday’ situations are compounds of different stimuli. To study these stimuli requires that the respondent, the test subject, be confronted by compound test stimuli which comprise different aspects of everyday situation, stimuli that the respondent ‘evaluates’, such as rating the combination. Through statistics, applied after the researcher properly sets up the blends, it becomes possible to understand just exactly what features ‘drive’ the rating. Properly executed, this seeming ‘roundabout way’, testing mixtures, ends up dramatically revealing the underlying mind of the respondent [5]. The foregoing process, testing systematically created mixtures and deconstructing through statistics, stands in striking opposition to the now-hallowed approach of ‘isolate and study.’ The traditional approach requires that the features of the everyday be identified, and separately evaluated, one feature at a time. Typically the evaluation ends up presenting each of the features separately, getting a rating, analyzing the pattern of ratings across people, and then identifying the key variables which a difference.

Attractive as the traditional methods may be, the one-at-a-time is severely flawed for several reasons:

  1. Combinations of features are more natural. It may be that a feature will receive a different score when evaluated alone compared to the evaluation of the feature as part of a mixture. And it may be that the feature will receive different scores when evaluated against backgrounds provided by a variety of other features. Thus, the wrong answer may emerge.
  2. People may change their criterion of judgment when presented with an array of different types of features, such as features dealing with product safety versus features dealing with branding, with benefits, and so forth. All too often the researcher AND the respondent fail to recognize the underlying shifts in these criteria.
  3. It becomes very difficult to ‘game the system’ when the test stimulus comprise a combination. Often, and perhaps even without knowing it, the respondent tries to assign the ‘correct’ or ‘socially appropriate’ answer. Such effort to ‘be right’ is doomed to failure when the respondent is presented with a combination. Often the respondent asks the researcher or interviewer for ‘help’, such as asking ‘what do I pay attention to in this combination?’

Mind Genomics works with the response to combination of text messages, called vignettes. The vignettes comprise specified combinations of elements, viz., verbal messages. Table 1 below (left part of table) shows these messages. The messages are sparse, to the point, paint a word picture. The vignettes are created according to an underlying plan called an experimental design. The experimental design may be thought of as a set of different combinations, different recipes, combining the same messages, the same elements, in different ways. A key difference between Mind Genomics and conventional research is how Mind Genomics considers variability among people and how it deal with that variability. We start the comparison by considering conventional research, which often considers variability in the data to be error, usually unwanted error which masks the ‘signal’. Occasionally the variability can be traced to some clear factor, such as the nature of the respondent, in which case this irritating variation hiding the signal is actually a signal itself. For the most part, however, researchers consider variability to be unwanted, and either suppress it by meticulous control of the test stimulus/situation, or average out the variability by working with a lot of respondents, and assuming that the variability is random, and so will cancel out. In the world of Mind Genomics variability is considered in a different light. Certainly there is the appreciation of error, but there is also the acceptance of the fact that people differ from each, and that these differences may be important. The differences between people are not necessarily random error, but rather point to potential profound differences among people, albeit differences which exist in a small, granular aspect of daily life. In other words, sometimes the differences are important, and sometimes the differences are merely random noise.

Table 1: Positive elements for cereal, viz., those elements which drive the rating of a vignette towards definitely buy/probably buy). All elements shown have positive coefficients of +2 or higher.

TAB 1

Explicating the Research Process

For the project reported here, the researcher selected two products (cereal, yogurt), asked six questions about the product, questions that could be used to create consumer-relevant messages, and then developed the database of 36 possible consumer messages for each product. Thus far, the process is quite simple, requiring only that the researcher do a bit of thinking about what types of messages might be relevant to consumers. One of the in-going ‘constraints’ from the perspective of marketing and the trade was that the messages had to be of the type which drive purchase. It was not an issue of building one’s brand through advertising. Rather, the messages were chosen so that they could be put on a coupon, or flashed on an LCD panel as the respondent ‘walked by.’ The actual process of developing the raw materials can be daunting for those who are not professionals. In the two studies reported here, a significant effort was expended to develop the six ideas which tell a ‘product story’. One the six ideas are developed, the most intellectually intense part of the effort, the creation of six messages for each idea becomes much easier. Recently, the creation of these basic ideas (or questions), and the elements (or answers) has been improved by a process called Idea Coach, which provides different options, using artificial intelligence (www.BimiLeap.com). The data reported here were collected before the Idea Coach system was incorporated into Mind Genomics.

  1. The actual selection of messages generated six groups of six message, one set of 36 such messages for cereal (Table 1), and another set of comprising different messages, for yogurt (Table 2).When looking at the table, the reader should keep in mind that the elements either pain a simple word picture, or specify a specific a specific claim that could be turned into ‘copy.’
  2. When creating the messages and assigning them to groups, The only requirement for the researcher is to ensure that all of the messages in a single idea (viz., all the answers given to a single question) remain together. For example, messages about ‘calories’ must all be put into one group or idea, and not split across two groups or questions. The rationale for this requirement comes from the fact that the underlying experimental design will need to combine elements from different questions (described below). When the researcher puts a calorie message in one group, and another calorie messages in a second group, there is the likelihood that the underlying experimental design may put these mutually incompatible messages into the same combination.
  3. Once the elements are created, comprising the question and the six answers, as shown in Tables 1 and 2, the next step is to use the basic experimental design, which specifies 48 combinations, each combination comprising either three or four elements. Each combination or vignette contains at most one element from any question. The vignettes are by design incomplete, since there are six questions, but a vignette can only have three or four answers, one from three or four questions. As noted above, each respondent evaluates a unique set of 48 combinations. The underlying mathematics remains the same. What changes is the assignment of a message to a code. For example, for one person, element A1 may be assigned as A1, whereas for another person a permutation is done, so the former A1 becomes A2, A2 becomes A3, et. the experimental design is maintained, but the combinations change [6].
  4. The final steps comprise the introductory message and the rating scale. In Mind Genomics studies most of the judgment must be driven by the individual elements, and not by the introductory statement. It is better to be vague about the product, and let the individual elements drive the reaction, rather than to specify too much in the general introduction. For this study, the introduction was simply ‘Please read this description of cereal and rate it on the 5-point scale below. For yogurt the introductory statement was virtually the same ‘please read this description of yogurt and rate it on the 5-point scale below’
  5. The five-point rating of purchase is anchored: 1: definitely not buy, 2: probably not buy, might not/might buy, 4: probably buy, 5: definitely buy. The anchored five point purchase intent scale has been used for many decades in the world of consumer research, both because the scale is sensitive to differences and because managers understand the scale, and generally look at the percentage of responses that are 4 and 5 on the 5-point scale. These two rating scale points are probably buy and definitely buy. The scale is often transformed to a binary scale, as was done here. Ratings of 4 and 5 were transformed to 100. Ratings of 1, 2 and 3 were transformed to 0. Managers who use the data more easily understand a yes/no scale, buy/not buy.
  6. Following the evaluation of 48 vignettes, the respondent completed a short self-profiling questionnaire, providing information about gender and age.
  7. Respondents were sent one of two links, the first appropriate to the cereal study, the second appropriate to yogurt. Approximately 70% of the individuals who were invited ended up participating. The high completion rate can be traced to the professionalism of the on-line research ‘supplier’. As a general point of view, it is almost always better to work with companies specializing in on-line research. Trying to recruit the respondents oneself ends up with a completion rate much low, often lower than 15%.

Creating the Database and Analyzing the Data for a Study

Each respondent ended up evaluating 48 different combinations, called vignettes, assigning each vignette a rating on an anchored 5-point scale. The next step creates a ‘model’ or equation showing how each of the 36 elements about the product ‘drives’ purchase intent. Recall that all 48 vignettes of a respondent differed from respondent to respondent, although the mathematical structure was the same. This ‘permutation’ strategy allows the research to cover a large percent of the possible combinations [7].

In order to uncover the impact of the elements, the key variables, it is necessary to create an equation relating the presence/absence of the 36 text elements about the product to the rating. This can be easily done. The data are easily analyzed, first by OLS (ordinary least-squares regression) and then by clustering. OLS regression shows how the 36 elements ‘drive’ the response (purchase). Clustering identifies groups of respondents with similar patterns of coefficients groups that we will call ‘mind-sets.’

  1. The OLS regression, applied to either the individual data, or to group data, is expressed by the following: Positive Intent to Purchase=k0 + k1(A1) + k2(A2) . k36(F6).
  2. For regression analysis to work, the dependent variable, the transformed variable (either 0 or 100) must show some small variation across the different 48 ratings for each individual respondent. Often, respondents confine their ratings to one part of the scale (e.g. 1-2; 4-5, etc.). To avoid a ‘crash’ of the OLS regression program, and yet not affect the results in a material way, it is a good idea to add a vanishingly small random number (e.g. around 10-4) to every transformed rating. The random number ensures variation in what will be the dependent variable, but does not affect the magnitude of the coefficients which emerge from the OLS regression.
  3. The underlying experimental design for each individual respondent makes it straightforward to quickly estimate the equation, either for individuals or for groups. The coefficient, whether for individual or for group, shows the degree to the element drives the response the rating of ‘definitely or probably purchase.’ The individual coefficients, viz., for the hundreds of respondents, are typically ‘noisy’, but when the coefficients become stable and reproducible when the corresponding coefficients are averaged across dozens of respondents, or when the equation is estimated from the raw data of dozens of respondents.
  4. The additive constant (k0) shows the estimated proportion of responses that will be 4 or 5 (viz., definitely purchase or probably purchase), in the absence of elements. Of course the underlying experimental design dictated that all 48 vignettes evaluated by any respondent would comprise a maximum of four elements (at most one element from a group) and a minimum of three elements (again, at most one element from a group, not more).
  5. The 36 individual coefficients (A1-F6) represent the contribution of each element to the expected interest in purchasing. When an element is inserted into a vignette, we can estimate its likely contribution by adding together the additive constant and the coefficient for the element. The sum is the percent of the respondents who would assign a rating of 4 or 5 to that newly constructed vignette.
  6. One of the ingoing tenets of Mind Genomics is that there exist groups in the population which think about the same topic, but in different ways. The information to which these respondents react may be the same but these groups use the information in different ways. Some respondents may value the information so that the information appears to covary with their rating of purchase the product. In contrast, other respondents may completely ignore the information. These differences reflect what Mind Genomics calls ‘mind-sets’, viz groups of individuals with clearly defined and different ways of processing the same information.
  7. The mind-sets emerge through the well-accepted statistical analysis called clustering [8]. Briefly, the clustering algorithm computes the Pearson correlation between pairs of respondents, based upon their 36 pairs of corresponding coefficients. Respondents with similar patterns (high positive correlation) are assigned to the same mind-set. Respondents with dissimilar patterns (negative or low positive correlations) are assigned to different mind-sets.
  8. For this study the ideal number of mind-sets is as few as possible. The paper reports the results emerging from dividing the respondents into two mind-sets, and then into four mind-sets, to show the effect of making the clustering more granular. The focus will be on interpreting the results from the two mind-set solution, and creating a tool to assign a new person to the one of the two mind-sets.

Applying the Learning-Cereal

Our data with 328 respondents provides us a wealth of information about to say, what not to say, and to whom. Table 1 shows the results for cereal. The table is organized with the key subgroups of respondents across the top and the messages down the side. In order to make the table easier to read, and allow the patterns to emerge, the table only shows positive coefficients of 2 or higher. The other coefficients were estimated, but are not relevant to the presentation since they do not drive positive interest in purchase. Furthermore, Table 1 shows strong performing elements as shaded cells. Strong performing is defined as a coefficient of + 10 or higher. Table 1 is rich in detail. The table shows the results from running the aforementioned linear equation using the data from all respondents (total), then the data by gender, then by age

  1. The additive constants differ, neither by gender nor age. Again and again Mind Genomics studies reveal that for the most part, conventional methods dividing people fail to show dramatic differences in how these divisions generate groups which think differently. It is eternally tempting to divide people by who they are, and presume that because people are different they think differently.
  2. The total panel of 328 respondents shows very few positive elements, and no strong elements. That is, knowing nothing else we cannot find elements which strongly drive purchase intent. Most of the elements are blank, meaning that the coefficients for those elements are either around zero or negative. In effect, ‘doing the experiment,’ viz. evaluating different messages, fails to uncover strong performing elements. No matter what experts might think, there are no apparent ‘magic bullets’ for cereal.
  3. A first effort to divide groups looks at gender. The additive constant is the same, but the females have a few more positive than do the males. Yet, none of the elements are strong drivers purchase when evaluated in the body of a vignette.
  4. The second effort divides the respondents by age. In terms of the additive constant, the younger respondents (ages 18-39) show a slightly higher additive constant than do the older respondents (age 40+; constants of 58 vs 53). The only strong performer (coefficient >1=10) is S4 for the younger respondents: The same great taste of cereal. only better.
  5. The third effort divides the full set of respondents into exactly two mind-set and then into exactly four mind-sets using k-means clustering (Likas et al. 2003). To save space and make it easier for patterns to emerge, Table 2 shows the only those elements which perform strongly in at least one mind-set of the six created (two mind-sets + four mind-sets=six mind-sets). ‘Performing strongly’ is again operationally defined as a coefficient of +10 or higher. The groups with fewer strong performing elements will be harder to reach.
  6. Focusing just on the two mind-set solution, Mind-Set 2 is more primed than Mind-Set to be interested in buying the cereal (additive constant of 68 for Mind-Set 2, additive constant of 38 for Mind-Set 1). However, Mind-Set 1 shows two elements which excite its members: O2: A tasty breakfast choice makes it easy to maintain a healthy body weight O4: Ideal choice for those concerned about eating too much sugar.

Table 2: Strong performing elements for cereal, for divisions of respondents into two complementary mind-sets, and then into four complementary mind-sets. All elements shown have positive coefficients of +10 or higher.

TAB 2

Applying the Learning-Yogurt

Our second study, this time with 307 respondents, shows similar patterns. Table 3 shows the data for the total panel, gender, and age. Table 4 shows the strong performing elements for the mind-sets, viz., those with coefficients of +10 or higher.

  1. The total panel again does not show strong performing elements (coefficient ≥+10).
  2. The additive constants differ dramatically by gender. Recall that the additive constant is the basic level of purchase intent estimated in the absence of elements. Males shows a higher basic intent, females show a lower basic interest (74 vs. 54). This is a dramatic difference.
  3. Closer inspection of Table 3 reveals that the coefficients for the males are around 0 or lower whereas there are a number of coefficients for females which are moderately positive. Males have a basic higher acceptance, but do not show any strong performing elements. In contrast, females show the lower basic acceptance, but are more selective. The two elements which drive their purchase intent are:
    F4: So flavorful. it will satisfy your sweet taste
    F5: Made with natural flavoring
  4. The second effort divides the respondents by age. In terms of the additive constant, the younger respondents (ages 18-39) show a lower additive constant, the older respondents show a higher additive constant (50 vs 62).
    The younger respondents find five elements to drive purchase:
    E6    Great taste with none of the guilt
    F4    So flavorful. it will satisfy your sweet taste
    O3    A refreshing healthy snack the whole family love
    C1    Ready to eat when you are
    F6    Flavor which sweetens
    In contrast, the older respondents find only one element to drive purchase.
    F5   Made with natural flavoring.
  5. The results emerging from clustering show the two mind-sets (MS1 of 2, MS2 of 2) to have dramatically different additive constants (39 for MS1 of 2; 72 for MS2 of 2). Mind-Set 2 is prepared to purchase, even without messaging, whereas Mind-Set 1 must be convinced. Fortunately, eight of the 36 elements for yogurt perform strongly, two performing quite strongly (F4, F5):
    F5:    Made with natural flavoring
    F4:    So flavorful. it will satisfy your sweet taste
    C2:    Comes in snack size… great for packed lunches
    B2:    Less sugar, less calories
    C5:    A hassle free healthy snack-goes where you go
    B4:    It’s good because IT’S REAL
    C1:    Ready to eat when you are
    F2:    Uses flavors to sweeten for a healthier you.

Table 3: Positive elements for yogurt, viz., those elements which drive the rating of a vignette towards definitely buy/probably buy). All elements shown have positive coefficients of +2 or higher.

TAB 3

Table 4: Strong performing elements for yogurt, for divisions of respondents into two complementary mind-sets, and then into four complementary mind-sets. All elements shown have positive coefficients of +10 or higher.

TAB 4

Part 2 – Messaging the Shopper

One thing we learn from Tables 1 and 3 versus Tables 2 and 4 is that when we look for a strong message for the total panel, we will not find any strong message for Total Panel, for either food. Tables 2 and 4 tell us that when we divide the shoppers in two mind-sets, the one mind-set for each food is ready to buy the food, whereas the other, complementary mind-set can be persuaded to buy, but only when the correct messages are ‘beamed’ to this second group of shoppers. It is to the task of finding this group of shoppers and then sending them the correct messages in the store to which the paper now turns. One of the perplexing problems of knowing mind-sets is the difficulty of assigning a random individual to a mind-set. The reason is simple, but profound. The mind-sets emerge out of the granularity of experience, and are based on the response of people to small, almost irrelevant pieces of communication. We are not talking about issues which are critical to the shopper, issues such as health, income, and so forth, and the decisions one makes about them. Those topics are sufficiently important to people to merit studies by academics and by interested professionals. A great deal of money is spent defining the preferences of a person, so that the sales effort can be successful. Not so with topics like cereal and yogurt, where there is knowledge, but little in the way of knowing the preferences of a particular shopper. Companies which manufacturer cereal and yogurt ‘know’ what to say, but the revenue to be made by knowing the preferences a randomly selected individual is too little to warrant deep investment. To understand the preferences of a randomly selected individual may require one of two things. The first is extensive information about that individual, and a way to link that knowledge to one’s preference about what to say about cereal or about yogurt. That exercise could happen, at least for demonstration purposes, although it does not lend itself to being scaled, at least with today’s technology. Another way is to present the person, our shopper, with the right messages for that shopper. This latter approach requires a way to identify the shopper, and to assign the shopper to the proper mind-set, with low investment, in a way that can be done almost automatically. This second approach has to reckon with practicalities, such as the reluctance of the shopper to provide personal information, the potential disruption of the knowledge-gathering step to the shopping experience, and of course the need to find the appropriate motivation. The proposed process has to be simple, quick, easy to implement. Most of all, the process should motivate the shopper to participate. The answer to the question of ‘how to assign a shopper to a mind-set’ comes from the use of a simple questionnaire called the PVI (personal viewpoint identifier; Gere et al., 2020; Moskowitz et al. 2019). The PVI uses the data from the Tables 2 and 4, to create a set of six questions having two answers (no/yes; not for me/for me, etc.) The questions come from the 16 elements, and are chosen to best differentiate between the two (or among the three) mind-sets. The important thing to keep in mind is that the PVI emerges directly from reanalysis of the data used to create the mind-sets. It will be the pattern of answers to the PVI which will assign a person to one of the mind-sets. With two products, and thus 12 questions, the PVI ‘step’ should take about a minute. The motivation might be lowered price for participants for some products, such as cereal and yogurt.

Figure 1 show the PVI, completed by the shopper at the start of the shopping effort or even ahead of visiting the store. Figure 2 shows a screen shot of the database, in which each shopper who participated is assigned to one of the two mind-sets for cereal, and one of the two mind-sets for yogurt.

Here is a sequence of four proposed steps to test the approach.

  1. At the start of the shopping the individual could be invited to participate, by completing a short questionnaire on a computer, the PVI tool shown in Figure 1. The incentive could a special ‘participant’s pricing’ for the cereal or the yogurt. The objective is to get the shopper to participate, discover the shopper’s membership in a mind-set (in return for the promise of a lower price), and have the shopper interact, with the program assigning the shopper to the correct mind-set for one or several products. The opportunity further remains to engage the shoppers off-line, ‘type’ their preferences for dozens of products, and place ‘intelligent’ signage with the proper message for the two or three mind-sets emerging for each product. Thus the data would be granular, by person, and by product.
  2. Once the data has been acquired and put into the database, the shopper should be furnished a device linked to the database, with the shelf location linked both to the database, and to the shopper’s portable device.
  3. When the shopper reaches the appropriate store location, an ad for the product should be flashed on to the screen of the device, the ad possibly paid for by a vendor of yogurt or cereal. The ad should be the name of the vendor, the product type, and the appropriate message for the shopper, based upon the shopper’s assignment to the mind-set.
  4. The performance of the system can be measured by comparing the purchases of cereals and/or yogurt, comparing those who participated versus those who did not.

FIG 1

Figure 1: The PVI (personal viewpoint identifier) for the cereal and yogurt, completed before the shopper begins, or completed at home. The website used to acquire the information is: https://www.pvi360.com/TypingToolPage.aspx?projectid=2317&userid=2.

FIG 2

Figure 2: Example of a database attached to the PVI which records the mind-set to which the respondent belongs and the recommended types of messages for that mind-set.

Selecting the Specific Messages to Show to the Shopper

Up to now we have focused on the science of the effort, figuring out the existence of mind-sets, the messages about cereal and yogurt to which they are most responsive, and then the creation of a simple tool, the PVI, to assign a person to a mind-set. We now face the most important task, selecting the messages that will be flashed to the shopper at the right time (e.g., when the shopper is passing the specific product, and the objective is to get the shopper to select the product). Keep in mind that up to now the effort to learn about the mind-set of the shopper has been brand-agnostic. That is, the objective has been to identify what messages differentiate the two kinds of cereal shoppers and the two kinds of yogurt shopper. In the real world, it is necessary to drive the shopper towards the appropriate brand, using the appropriate message. If we remain with two mind-sets, and concentrate on shopping, we need not worry about Mind-Set 2. Mind-Set 2 for cereal has an additive constant of 68. They are ready to buy. They should be directed to the ‘brand’. It is Mind-Set 1 which must be convinced, since Mind-Set 1 has an additive constant of 38. They need motivating messages. Here are the two strongest messages for Mind-Set 1

O2 A tasty breakfast choice makes it easy to maintain a healthy body weight 15

O4 Ideal choice for those concerned about eating too much sugar    10

The same dynamics hold for yogurt. The additive constant is 72 for Mind-Set2, and 39 for Mind-Set 1. Mind-Set 2 is already primed to buy yogurt, and again should be directed to the ‘brand’. Mind-Set 1 with a low additive constant of 39 needs motivating messages, along with the brand. They have eight messages which score well in expected motivating power, and of those eight, three which score very well with coefficients 14 or higher.

      1. F5 Made with natural flavoring 17
      2. F4 So flavorful. it will satisfy your sweet taste 16
      3. C2 Comes in snack size… great for packed lunches 14
      4. B2 Less sugar, less calories 12
      5. C5 A hassle free healthy snack-goes where you go 12
      6. B4 It’s good because IT’S REAL 11
      7. C1 Ready to eat when you are 11
      8. F2 Uses flavors to sweeten for a healthier you 10

Discussion and Conclusions

One need only read the trade magazines about the world of retail to recognize that the world is becoming increasing aware of the potential of ‘knowledge’ to make a difference to growth and to profits. Over the past half century, knowledge of the consumer has burgeoned in all areas of business, with the knowledge often making the difference between failure and success, or more commonly today, the magnitude of success. We are no longer living in a business world dominated by the opinions of one person in the management of a consumer-facing effort. Whereas decades ago it was common for the key executives to proclaim that they had a ‘golden tongue’ which could predict consumer behavior, today just the opposite occurs. Managers are afraid to decide without the support of consumer researchers, or as they title themselves, ‘insights professionals.’ At the level of shopping, especially when one buys something, or even searches for something, there are programs which ‘follow’ the individual, selling the data to interested parties that use that information to offer their own version of that for which the individual was shopping. The tracking can be demonstrated by filling out a form or a product or service, not necessarily buying such a product. The outcome is a barrage of advertisements on the web for that product, from a few different vendors offering their special version. The Mind Genomics approach presented here differs from the current micro-segmentation on the basis of previous behaviors demonstrated on the internet. Rather than watching what a person does to put the person into a specific grouping, or rather than applying artificial intelligence to the text material produced by the person, Mind Genomics moves immediately to granularity. The basic science of the topic (viz., messages for cereal, or messages for yogurt) is established at a convenient time, using language that the product manufacturer selects as appropriate for a customer. The important phrases and the relevant mind-sets are developed inexpensively, and rapidly, perhaps within a day. The PVI is part of that set-up. The next steps involve the shopper herself or himself. What emerges is a system wherein the shopper plays a simple but active role, and through a few keystrokes identifies the relevant group(s) to which she or he belongs. Once the shopper encounters the appropriate location, it is only a matter of sending the shopper the appropriate message. The ‘appropriate location’ can be the store shelf where the product is displayed, or on the web at an e-store, or even when the prospective shopper searches for the item. Both the item and the relevant motivating messages can be sent to the shopper, as long as the shopper’s membership in the appropriate mind-set can be determined.

References

    1. Schumann DW, Grayson J, Ault J, Hargrove K (1991) The effectiveness of shopping cart signage: Perceptual measures tell a different story. Journal of Advertising Research. 31: 17-22.
    2. Dennis C, Michon R, Brakus JJ, Newman A, Alamanos E et al. (2012) New insights into the impact of digital signage as a retail atmospheric tool. Journal of Consumer Behaviour 11: 454-466.
    3. Büttner OB, Florack A, Göritz AS (2013) Shopping orientation and mindsets: How motivation influences consumer information processing during shopping. Psychology, Marketing 30: 779-793.
    4. Chang CT, Cheng ZH (2015) Tugging on heartstrings: shopping orientation, mindset, and consumer responses to cause-related marketing. Journal of Business Ethics 127: 337-350.
    5. Gere A, Harizi A, Bellissimo N, Roberts D, Moskowitz H (2020) Creating a mind genomics wiki for non-meat analogs. Sustainability 12, 5352.
    6. Gofman A and Moskowitz H (2010) Isomorphic permuted experimental designs and their application in conjoint analysis. Journal of Sensory Studies 25: 127-145.
    7. Moskowitz H, Gere A, Moskowitz D, Sherman R, Deitel Y (2019) Imbuing the supply chain with the customer’s mind: today’s reality, tomorrow’s opportunity. Edelweiss Applied Sci Tech 3: 44-51.
    8. Likas A, Vlassis N and Verbeek JJ (2003) The global k-means clustering algorithm. Pattern Recognition 36: 451-461.