DOI: 10.31038/AWHC.2023645
Abstract
The study focused on the messages which might enhance women’s participation in mammogram screening. The study followed the Mind Genomics process of presenting respondents with different combinations of relevant messages, identifying the strong performing messages for each respondent, and clustering respondents on the basis of the patterns of elements which drive positive responses. The messages themselves were developed using AI, allowing the researcher ahead of the experiment to gain a broad education-type overview of the types of messages that could be used. Two mind-sets of respondents emerged, representing different patterns of messages which are deemed motivating. Mind-Set 1, “Motivated and Informed Women,” seeks improved breast health, values screenings, with the goal to minimize health risk, and maximize well-being. Mind-Set 2, “Concerns and Motivations,” focuses on the mammogram experience itself, the mammogram risks, comfort, and cost, demanding accurate diagnoses. It may be possible to increase mammogram screening by assigning a person to one of these mind-sets. The Mind-Set Assigner (previously called Personal Viewpoint Identifier (PVI)) comprises a set of six questions based upon the study, the patterns of answers to which assign a person to either Mind-Set1 or Mind-Set 2. The Mind-Set assigner offers the promise of a personalized approach to understanding what people need to hear to ensure better health.
Introduction
Despite its significant advantages in understanding human perception and decision-making, contemporary technology involving health messages is confronted at every turn by hosts of drawbacks and challenges. Among these, data privacy and security concerns loom large as the collection and storage of vast amounts of personal data raise questions about safeguarding sensitive information [1]. Moreover, the potential for bias and unfairness in machine learning algorithms remains an ongoing challenge, demanding continual efforts to ensure fairness and reduce [2]. A consequence of the efforts to maintain privacy in a data-intensive world is the focus on making sure that key information about a patient is safeguarded [3]. Those efforts move the focus from advancing by understanding the patient as a human being towards protecting the patient who could be the source of possibly compromising data.
The focus of this paper moves attention from understanding the body and behavior of the patient to the mind of the patient as a consumer of the health care experience. The objective of this paper is to showcase what can be achieved in just a few hours, even with limited prior knowledge of a subject. Our goal is to gain insights into how people perceive the ordinary world, make decisions, and, perhaps most crucially, understand the myriad ways in which everyday individuals view topics in their daily lives using the innovative approach of Mind Genomics. Instead of focusing on exceptional or unusual circumstances, Mind Genomics centers on the daily, commonplace world in which most people live.
For this exercise, we have chosen to examine the issue of mammography, a vital aspect of healthcare, as it pertains to women’s participation in breast cancer screening. The focus will be on the person as a receiver of heath messages, the person being likened to a consumer, the health messages being the motivational communications to get the consumer, the woman, to buy the product.
When healthcare providers screen patients for breast cancer, their primary objective is to encourage greater participation among women in screening mammograms. Increasing participation needs a multifaceted approach which goes beyond simply knowing what to say. Rather, it is critical to understand and interpret women’s responses and, in turn, effectively address their concerns. Communication plays a pivotal role in this process. Providers must effectively convey the importance of regular screenings and underscore the potential to save lives through early detection.
The literature about mammography is large, not surprisingly because of the pivotal role of mammography in detecting breast cancer. The existing literature recognizes the importance of the doctor-patient relationship, and the emotions involved in breast cancer. There is a significant literature on mammograms and mammography. Part of the focus is on the medical aspects of mammograms as a preventive for breast cancer, which belongs in the world of biological and medical science [4,5].
Unfortunately, the existing literature often falls short when it comes to delving into the communicating with patients, even though the literature does recognize the psychological and emotional effects on individuals undergoing mammography, with a predominant focus on clinical and technical facets [6], as well as keeping appointments [7-9]. Whereas some studies do touch upon the significance of communication and addressing patient concerns, there remains the important gap regarding the specific language, words, and customized communication strategies which truly resonate with individuals.
Closing this gap by understanding the unique needs, assessing the psychological impact, and recognizing the decision-making processes of patients is paramount. Such an approach can significantly enhance the effectiveness of breast cancer screening and improve the overall patient experience, ultimately leading to increased participation rates and earlier detection of cancer.
The important thing to keep in mind is that the approach presented here breaks new intellectual ground, lying between the world of the scientific establishment and the world of the practitioner. As will be shown below, the objective is to understand the way the person thinks, letting the patterns which emerge suggest directions for research. In scientific parlance, the traditional way, the hypothetico-deductive system [10] with its effort to create science step-by-step gives way to the more intellectually adventurous but less rigorous effort called ‘grounded theory’ [11]. In a sense the approach presented here will end up being a ‘user’s manual of the everyday mind.’
Mind Genomics Offers a New Perspective on Thinking
Surveys are popular, easy to use, and understand. However, polls have fundamental issues. One of the worst is susceptibility to respondent bias toward giving the “correct answer.” This bias is especially harmful when the topic is emotional, or when the respondent doesn’t know the answer. The desire to appear positive often leads to hesitation to respond negatively [12].
A second, subtle bias is lack of context. The respondent is instructed to rate or to rank relevance of distinct characteristics like price, nutrition, brand, etc. Respondents typically adapt their rating criteria to fit the thing being rated. Interspersing topic examples is better. Instead of asking how important ‘price’ is against ‘availability in store’, a more productive technique may be to present different combinations of features, and afterwards deconstruct the response to the combination into the contribution of the single components of the combinations.
Mind Genomics has been developed to address these biases. Mind Genomics combines experimental psychology (psychophysics), statistics (experimental design), and consumer research (focus on the world as is, rather than put the respondent through an artificial situation, unless that artificial situation is of direct scientific interest). The past history and future opportunities Mind Genomics have been described in previous papers [13-15].
Mind Genomics traces its history to three disciplines:
- Psychophysics – The oldest discipline of experimental psychology. Psychophysics examines how humans interpret external inputs. Traditional psychophysics connects the physical and psychological worlds. Traditional psychophysics focuses on ‘measuring’ the intensity of perception, such as beverage sweetness [16].
- Experimental design is a discipline in statistics which examines how independent factors combine to create a dependent variable. Mind Genomics adopts that concept but focuses on how thoughts interact. It might be called the ‘algebra of the mind.’
- Consumer research explores daily life. Mind Genomics explores everyday scenarios rather than developing contrived ones, in its effort to understand the way people think. Consumer research shows how individuals act in the real world as consumers and humans.
The Mind Genomics approach has evolved from paper and pencil evaluations of vignettes (combinations of ideas or messages, now called ‘elements’) to a DIY (do it yourself) system which allows rapid, inexpensive study creation using a template combined with artificial intelligence to help the researcher think through a topic, along with subsequent automated analysis of the data and reporting in a user-friendly set of tables.
In early versions of the Mind Genomics science, it was up to researchers to develop the raw materials, so-called ‘elements’ or messages. The elements often numbered in the dozens, and occasionally far more. The researcher categorized the elements into like-ideas, manually created the vignettes, viz., combinations of elements, checking that the elements were statistically independent of each other, and that mutually contradictory elements never appeared together. The process was tedious, frustrating, required a great deal of up-front preparation, took a long time, and ended being expensive when the time of the researcher was factored-in to the total cost.
Implementing the early Mind Genomics studies was also a challenge, and expensive. The studies were presented on a local computer, with respondents pre-recruited to participate. All respondents evaluated a randomized set of combinations or vignettes, selected from the original large set of vignettes. During the course of the supervised evaluation on the local computer, the respondent would end up evaluating 50-100 vignettes in 20-30 minutes. The results were pooled and analyzed by total panel and self-identified subgroups, with subgroups formed by a questionnaire about attitudes and practices on the problem. The Internet evolved the Mind Genomics approach to a structured, simple design (four categories or now four ‘questions’, four elements or answers per category), a basic experimental design with 24 statistically appropriate combinations. The underlying design ensured that the 16 elements are statistically independent and set up for immediate analysis. The data could be analyzed by OLS (ordinary least squares) regression at the level of a defined group or respondents, or even at the level of an individual respondent. Furthermore, Mind Genomics ensured that each respondent would evaluate 24 different vignettes, or combinations, a method halfway between the constricting requirements of a single design replicated for each respondent, and the combinations encountered in a cross-sectional study with the combinations of independent variables being uncontrolled. The benefit of the permuted design was that it was no longer necessary to know the answer before doing the study. The study would end up covering many of the possible combinations, using a systematized permutation system [17], reducing a lot of the need for prior knowledge.
A Worked Example – What Goes Through the Mind of a Female Patient When Thinking about Mammography?
The rest of this paper shows study design, implementation, and analysis of a study on communications about why a patient should consider mammography. The study goal was to generate a new topic and advance it via AI. AI becomes a ‘second set of eyes’ for question-and-answer-development at the time of set-up, and for discovery of themes at the time of analysis.
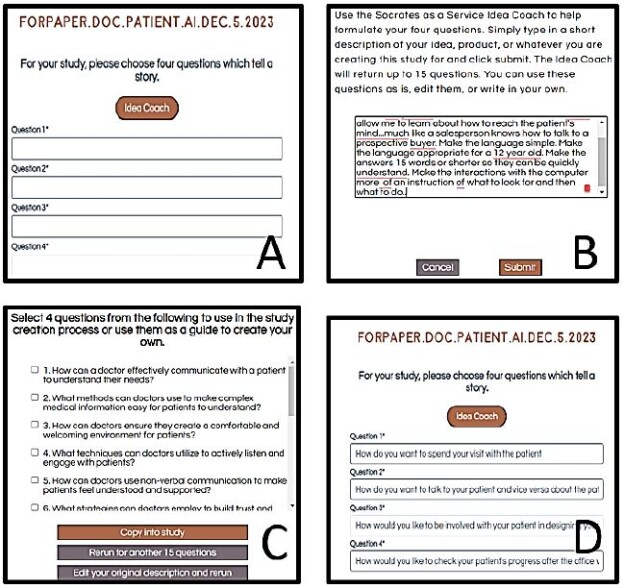
Mind Genomics starts with a query, a brief paragraph to explains the situation and the research objective. The statement is constructed to allow the embedded link to AI (Idea Coach), to generate the appropriate query to Chat GPT 3.5 (Liu et. al., 2023) [18]. For this study, the brief paragraph was: Explain to me exactly how I should talk to women so I can convince them to get their yearly mammogram? I want to talk to them as a doctor who is concerned about their health as their mother or their daughter. please make the question easy to understand, filled with emotion and no more than 12 words. Figure 1 shows a schematic of these first steps of the set-up process.

Figure 1: Schematic process. Panel A shows the space for four questions. Panel B shows a schematic ‘general background prompt’ given to Idea Coach.
Generating Questions to Answer the General Background Prompt
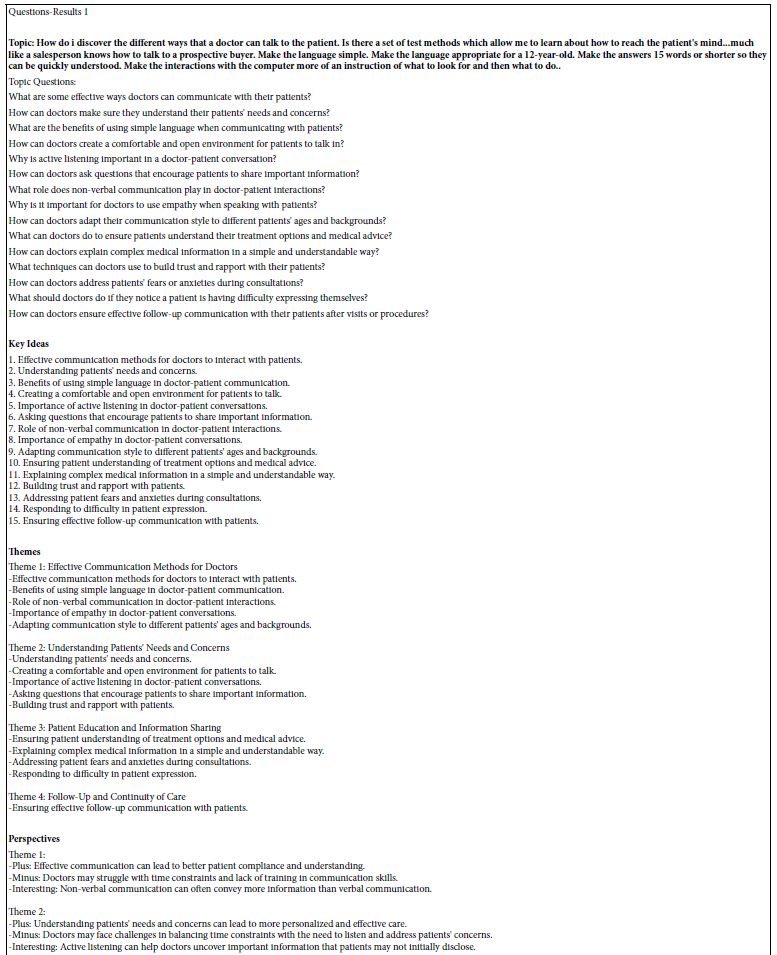
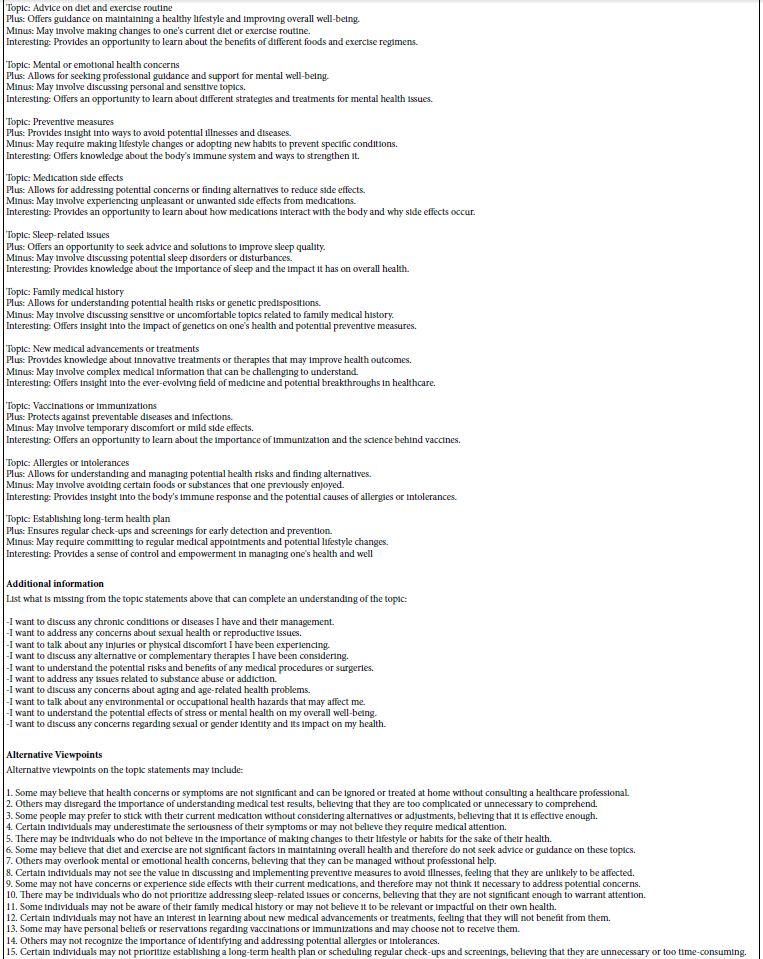
The researcher requests Idea Coach (AI) to provide 15 questions based upon the general prompt (see Figure 1, Panel B). The researcher can vary the general background prompt given to Idea Coach or can re-run the same request several times. The results are provided immediately, as well as recorded in the Idea Book, along with a set of AI based ‘summarizations’ and expansions of the topic (Table 1). These questions may be ‘on target.’ If not, the researcher can tweak the paragraph to guide the AI, run Idea Coach again, and indeed several times, each time learning more about the topic through the questions provided.
Table 1: The first set of questions emerging from the Idea Coach in response to the paragraph written by the research, which generates the query. The text in in Table comes from the Idea Book provided to the researcher after the element creation has been completed, both for questions and for answers.

A user-trend has emerged during the past several months since the Idea Coach was incorporated into Mind Genomics. ‘Newbies’, beginning researchers, find this process with the Idea Coach to be pleasant, entertaining, and anxiety-reducing. Their excitement about research increases. And, as a bonus, after some experiences with Idea Coach, even in one study, the new researcher begins to feel empowered to add in her or his own questions.
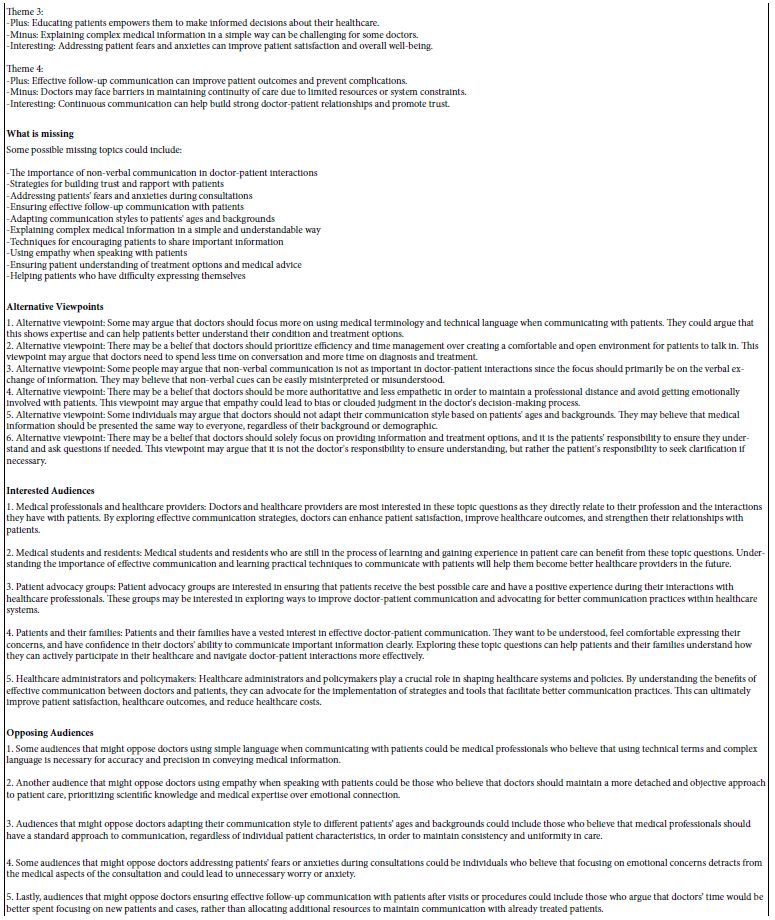
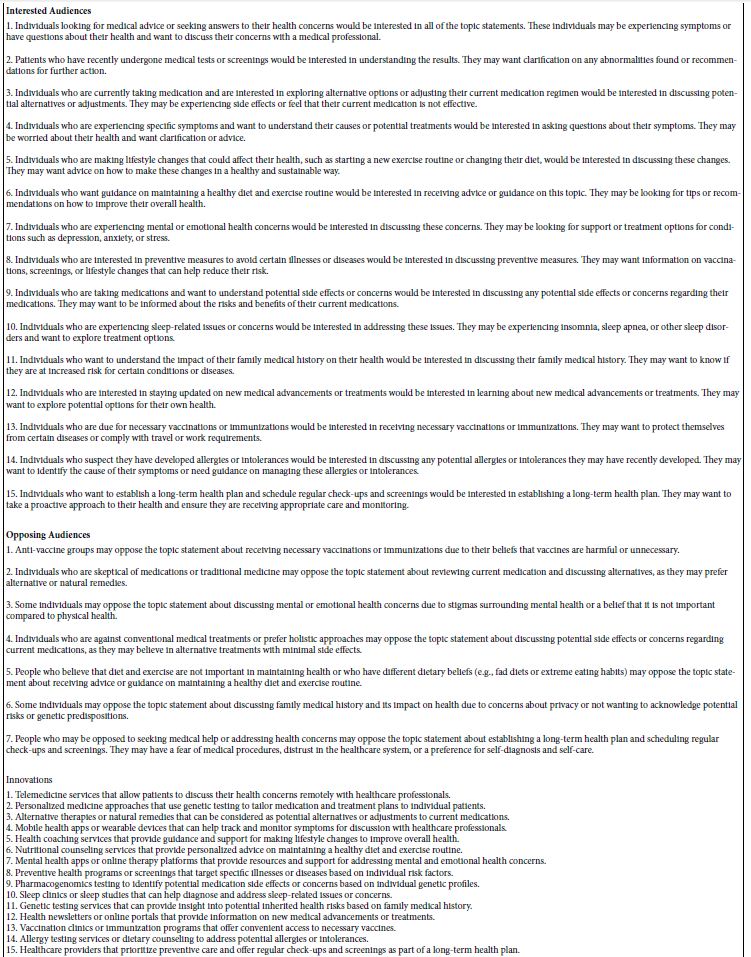
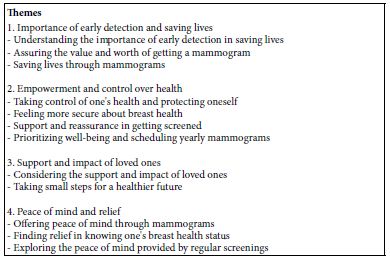
Idea Coach now analyzes returned questions instead of just coaching. Table 2 shows how Idea Coach (viz., AI) uses a cue about ‘themes’ to find commonalities in Table 1 queries. Again, the Idea Coach summarizes ‘themes’ for each researcher-generated question set. The researcher could use Idea Coach say 10x to get 10 theme analyses, one for each set of returned questions. One could analyze all themes for all aspects, but the bookkeeping to eliminate similar-but-not-identical issues would take time.
Table 2: Themes emerging from the set of questions returned in the first iteration of Idea Coach
AI then finds ‘holes’ in themes, a major benefit. Table 3 presents the third analysis of the first set of questions, ‘what is missing.’
Table 3: Suggestion of ideas that may be missing from the set of questions returned by Idea Coach

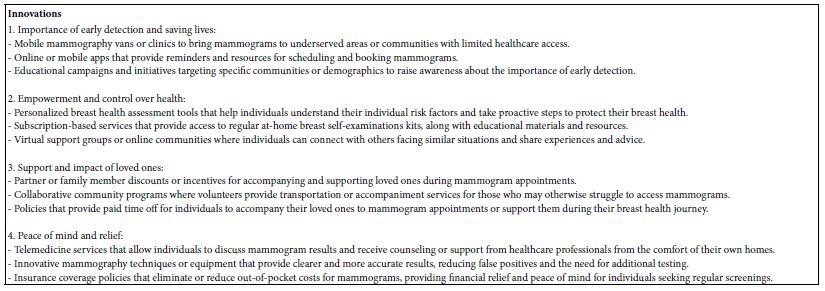
Finally, Tables 4-6 look at possible innovations in products and services.
Table 4: Suggestion of alternative viewpoints, viz., contrary ideas

Table 5: Suggestion of the likely audience

Table 6: Suggestion of innovations in products services, experiences, policies
Creating Answers to Questions
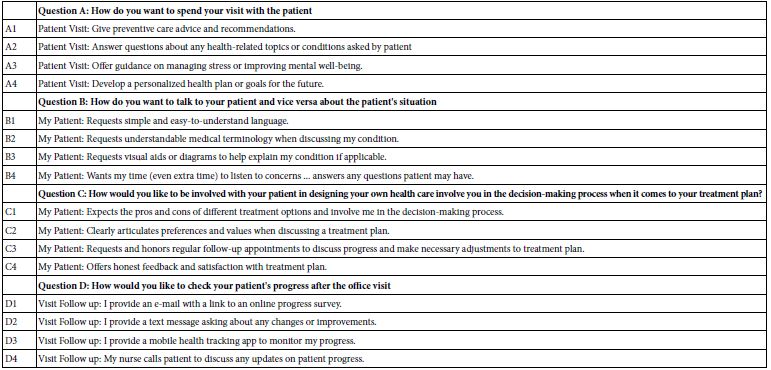
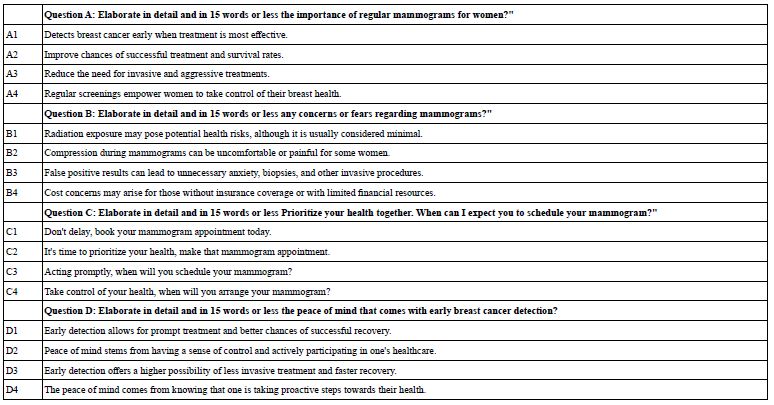
The second step creates four answers to each question selected by the researcher. The researcher must come up with four answers to each question. The same process is followed, with Idea Coach providing sets of 15 answers to a question, and with the researcher selecting the four answers for each study. The final four sets of questions appear below. The substantive part of the question as returned by Idea Coach is shown in italics. The other part of the question, viz., the phrase ‘Elaborate in detail and in 15 words or less’ was added to the Idea Coach query to ensure simple to understand answers to the question.
- Question A: Elaborate in detail and in 15 words or less The importance of regular mammograms for women?”
- Question B: Elaborate in detail and in 15 words or less Any concerns or fears regarding mammograms?”
- Question C: Elaborate in detail and in 15 words or less Prioritize your health together. When can I expect you to schedule your mammogram?”
- Question D: Elaborate in detail and in 15 words or less The peace of mind that comes with early breast cancer detection?
Once again the process with Idea Coach ends up educating the researcher as the researcher continues to request the four answers for each question, with each request generating four answers. Many users consider this activity crucial. The shock of seeing 15 answers appear a few seconds after the question is asked is remarkable, and often quite motivating.
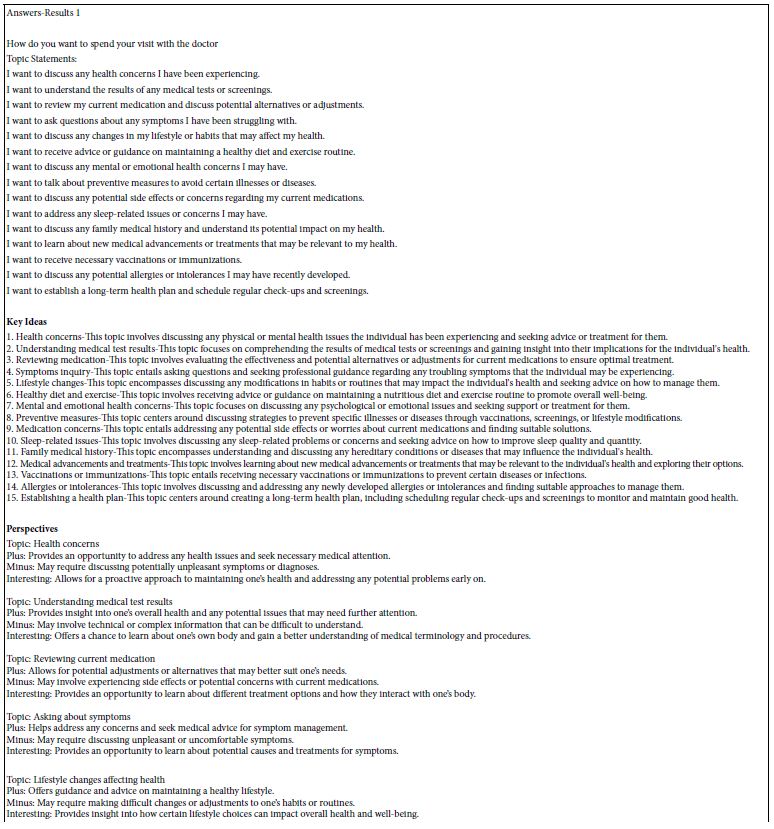
Each set of the 15 solutions undergoes the same set of AI analyses, similar in depth to the AI analyses above done for the questions, but with a few different queries. The first 15 answers to the first question appear in Table 7, which also shows the extensive AI summarization.
Table 7: The first set of answers to Question #1: Elaborate in detail and in 15 words or less the importance of regular mammograms for women
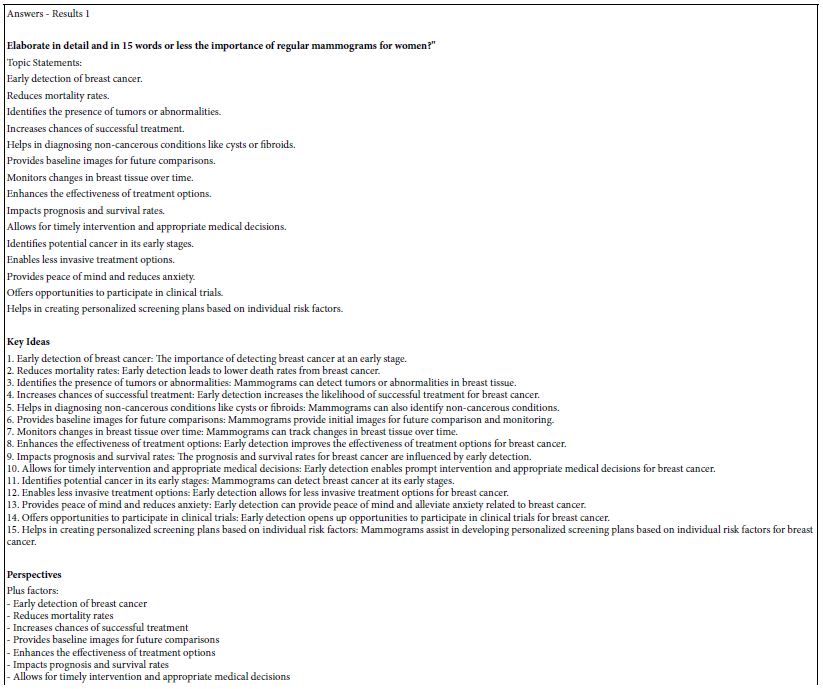
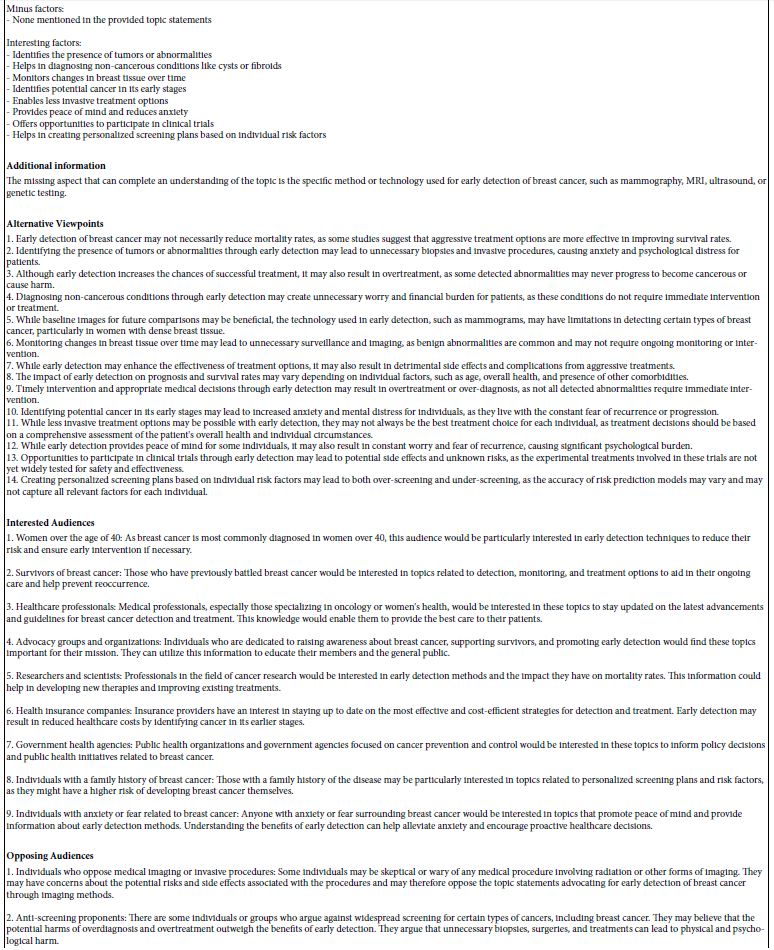
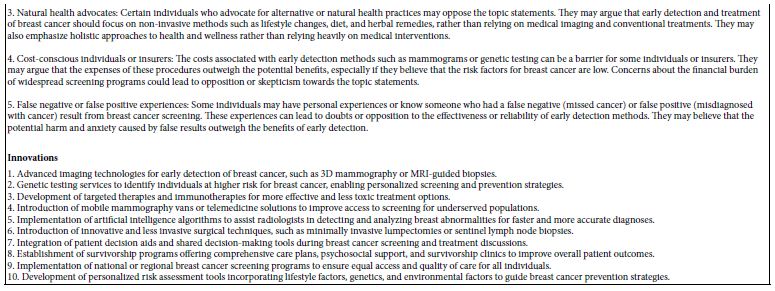
Table 8 shows the final set of questions and answers, edited by the researcher. In the actual study, the vignettes will comprise only answers (also called ‘elements’) in combinations comprising a minimum of two and a maximum of four answers, never more than one answer for a question. The questions never appear in the vignette, but rather are used only to guide the creation of the answers.
Table 8: The final set of questions and answers, after creation by Idea Coach and editing by the researcher
The Self-profiling Classification
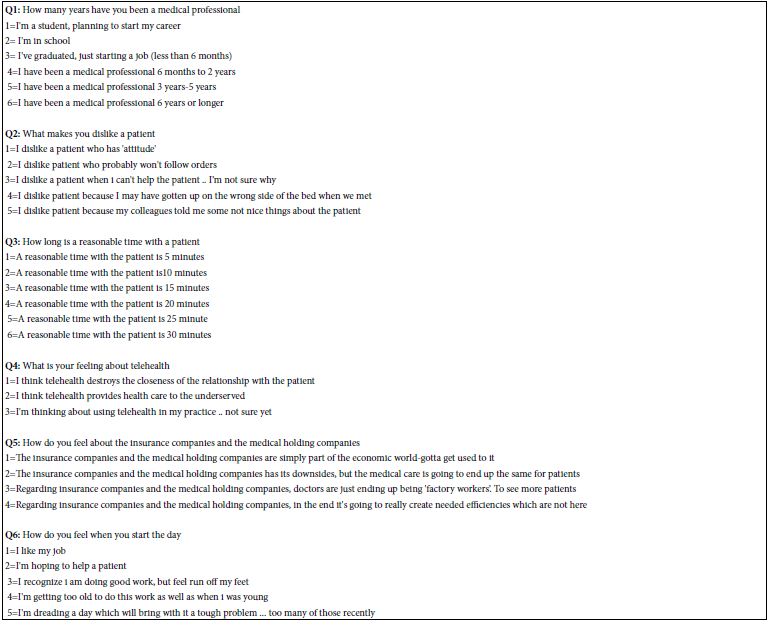
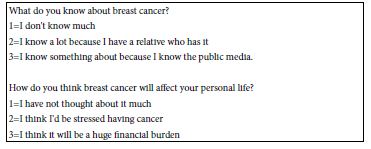
Mind Genomics allows the researcher to create a set of eight questions which allow the respondent to provide more about the topic from the respondent’s point of view. Table 9 shows the list of questions. Gender and age questions are asked as a matter of course in all Mind Genomics studies.
Table 9: Self profiling questions about the respondent
In addition to the self-profiling classification questions, the respondent was instructed to complete an open-ended question about their own feelings and history regarding mammograms. The respondent completed this open-end question after having completed the Mind Genomics evaluation, and thus were ‘primed.’ Most respondents wrote detailed answers, an unusual occurrence in Mind Genomics studies of simpler, less emotionally tinged topics.
The Test Stimuli
Test stimuli combine answers to questions, with these answers henceforth called ‘elements’, and combinations called vignettes. The underlying experimental design prescribes the specific composition of each of the 24 vignettes. Each set of 24 vignettes can be analyzed in and of itself, to estimate the contribution of the elements to the response. The method of analysis is called OLS (ordinary least-squares) regression [19]. In the experimental design, each element occurs five times in 24 vignettes and absent from 19. Thus, each question contributes an element to 20 of the 24 vignettes and is absent from four of the 24 vignettes.
A key benefit of Mind Genomics is the ability to have each respondent evaluate virtually a totally unique set of vignettes, the aforementioned combinations of elements. The process to create the unique sets is called isomorphic permutation [17]. The benefit is that the researcher ends up testing many combinations, rather than testing a few combinations but many people. The happy consequence is that Mind Genomics empowers researchers to study a topic without having to have an idea of the answer ahead of time. The sheer scope of the combinations tested allow the research to ‘explore’ the unknown rather than having to ‘confirm’ one’s hypothesis.
We can contrast the Mind Genomics approach with the way typical research is conducted in the hypothetico-deductive system. Typical research studies aim to understand nature. Reducing the ‘noise’ around the ‘signal’ helps it emerge more clearly. Typically, this is done by decreasing superfluous variability, or ‘noise.’ In consumer research, dozens or hundreds of respondents evaluating the same vignettes is easy. Average variance, or standard error, diminishes with the square root of replicates. Four times the number of participants are needed to reduce variation around the mean by half. The above technique works when the researcher already ‘knows’ the right vignettes or elements, with the research ending up confirming hypotheses rather than discovering new realities. Mind Genomics focus on these new realities.
One reaction to the Mind Genomics experience is frustration, especially among professionals, far less so among non-professionals with no ‘ego’. Because there is no order or consistency, professionals and beginners alike think these pairings are random. The number of elements in a vignette varies, confusing those who try to outsmart the system. Many Mind Genomics research participants feel like they are guessing because they cannot see a pattern but ‘soldier on’, generally just doing what they have been instructed to do. These respondents participate in a state of relaxation and what might seem to be a lack of involvement, that seeming indifference actually being a good thing because it allows true feelings to emerge. The situation is even more frustrating to professionals, especially consumer researchers, who stop participating in the middle of the study because they become frustrated that they cannot ‘game the system.’
Respondent Orientation and Rating Scale
Every effort is made to lighten the mental ‘load’ of the respondent. The respondent need not read a long paragraph. All the respondent needs to know is that the topic is breast cancer. Everything else makes sense. The attitudes and judgments come from the respondent as she reads the vignette.
When presented with the vignettes, most respondents do not know what to do, since the vignettes are simply lists of phrases. The design of the vignette in that way is deliberate, making it easy for the respondent to ‘graze’ through the vignette and immediately give a rating. There is no effort made to fill the spaces between the elements with connective words, an effort which often backfires because the vignette goes from sparse, easy to scan, to dense, weighty, and simply obstructively boring.
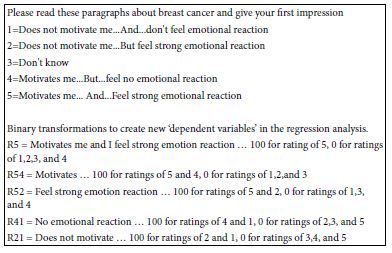
Table 10 shows the very short orientation and the five scale values. The scale has two dimensions. The analysis uses newly created variables, each of which has only two values, ‘0’ to denote ‘no’ and ‘100’ to denote yes. That is, the responses 1-5 are transformed according to specific rules listed at the bottom half of Table 10. After creating these new binary variables, the Mind Genomics program adds a vanishingly small random number (<10-4) to ensure some minimal variability, a prophylactic step ensuring the variability necessary for subsequent creation of equations or ‘models’ using OLS (ordinary least-squares).
Table 10: The rating question, the two-dimensional scale, and the binary transformation
Creating the Database for Analysis
The previous stages established an analysis-ready database. The Mind Genomics program delivers test vignettes and gathers 5-point ratings and response time, the number of seconds elapsing between stimulus presentation and rating. After responding to the current vignette, the program automatically proceeds to the next one. Figure 2 shows a screen shot of the database returned automatically to the researcher in an Excel booklet after the Mind Genomics study has been completed and the result automatically analyzed. The first set of columns shows information about the respondent. The second set of columns shows information about the structure of the vignettes. The third set of columns shows the rating information and some of the transformed data. The last column shows the open-ended questions.

Figure 2: Example of the first vignette evaluated by 10 respondents, with some of the transformations already created.
Creating ‘Models’ (equations) Which Relate the Presence/Absence of Elements to the Binary Ratings
A hallmark analysis of Mind Genomics reveals, though regression, the magnitude of ‘driving power’ of each element for the group of newly developed binary variables. OLS (ordinary least squares) regression is appropriate here, either for the data from each individual, or the data from a defined group. The term ‘appropriate’ is used because the 24 vignettes evaluated by each respondent were created through experimental design, enabling the subsequent regression analysis at the level of the individual respondent.
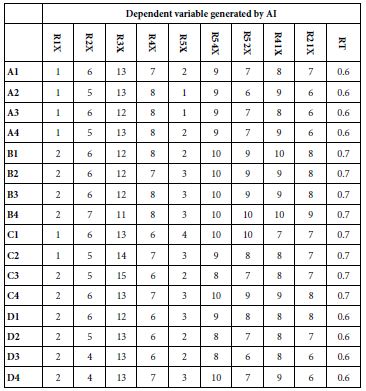
The OLS regression estimates the 16 parameters for this simple equation, doing so for all the newly created dependent variables (DV): DV = k1(A1) + k2(A2) … k16(D4)
The independent variables A1-D4 take on the value ‘1’ when the element appears in the vignette, and, in turn, take on the value ‘0’ when the element is absent from the vignette. This coding is called ‘dummy variable [20]. Nothing is known about the element except its presence or absence, hence the term ‘dummy’. The equation shows the best estimation of the 16 coefficients. The coefficients themselves are easy to understand. Let us consider the dependent variable ‘R54’, viz., ‘motivates.’ A coefficient of 10, for example, means that when the element is present in the vignette,10% of the vignettes will be rated ‘5’ or ‘4’. When the coefficient is 20, two times as many vignettes will be rated 5 or 4. Thus, if we were to come upon four elements, each generating a coefficient of 25, then 100% of the vignettes with those four elements would be rated 5 or 4. Statistical analysis suggest that coefficients around 15 are ‘significant’ at the 95% confidence level. Our focus is not so much on significant elements, but rather on the patterns which reveal themselves.
We can immediately identify patterns of respondent thinking from the patterns of the strong performing coefficients. In ordinary research these patterns would go undetected because the test stimuli have no ‘cognitive richness.’ Thus, the researcher would have to search deeply to find a story behind the pattern. The situation is easier in Mind Genomics because the text of each element has meaning so that the results become easier to interpret. A ‘story’ ends up emerging more readily.
Table 11 shows the pattern of coefficients for the binary variables developed in Table 10, and for response time. The form of the equation is always the same, as described above. No equation has an additive constant or ‘intercept’, simply because the intercept adds a complicating parameter which prevents the coefficients from being compared directly in terms of both magnitude and real meaning. The elements in Table 11 are sorted by the coefficient for R54 (motivates), the key dependent variable.
Table 11: Coefficients for the total panel, for response time (RT) and for five binary variables
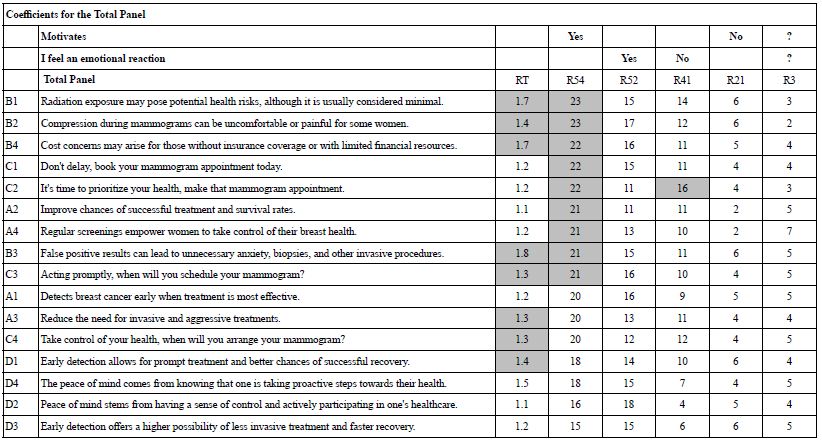
The strong performing elements are shaded.
- Response time (RT)-In most Mind Genomics studies the respondents rush through the study, with many elements almost skipped over, since they have RT coefficients of 0.2 to 0.5. Not so with mammography. It is worth noting that the respondent stopped to read and think about virtually all of the elements, since many elements have coefficients of 1.3 or higher for RT. These 101 respondents focused on the messages.
- Motivates me (R54). The convention for Mind Genomics studies is to shade coefficients of magnitude 21 or higher. Once again the results are startling. Nine of the 16 elements have coefficients of 21 or higher, a ‘first’ in Mind Genomics, and a signal that the topic is exceptionally important. Despite the strong performance of the elements, however, there is no apparent pattern in terms of what makes an element perform strongly.
- Emotional reaction (R52) also shows many strong performing elements, but again no clear patterns.
- The binary variable, R41 (no emotional reaction) shows one moderate performing element. The one which may not drive an emotional reaction is C2 (It’s time to prioritize your heath make that mammogram appointment). There is no clear story for binary variable R41.
- The binary variable R21 (does not motivate) show no elements which fail to motivate.
- The binary variable R3 (don’t know) shows no strong performing elements.
If we were to sum up the results, we would conclude that the elements hold the attention of the respondent, motivate quite strongly, drive an emotional reaction. We also should conclude that there is no clear pattern.
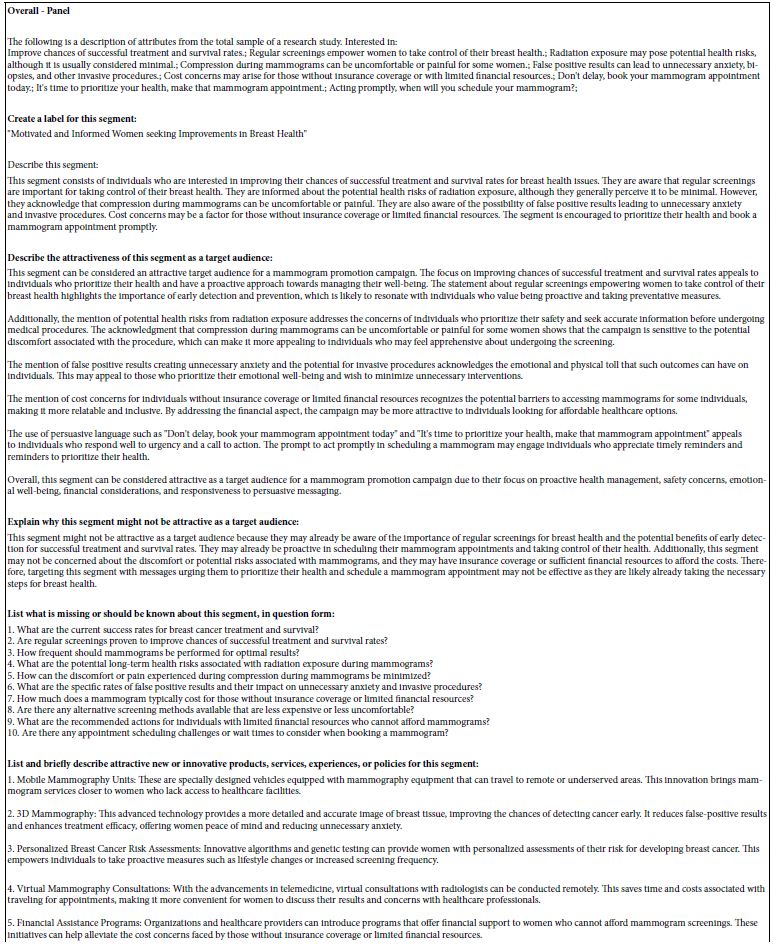
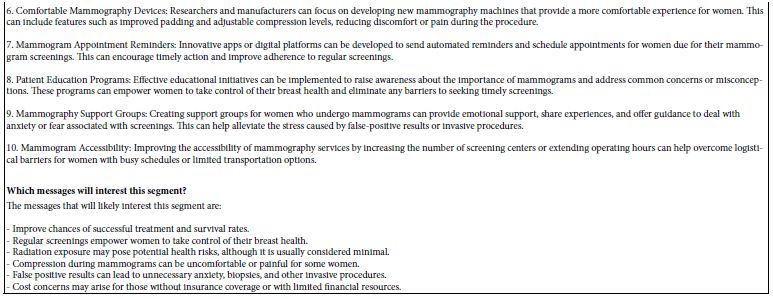
One of the benefits of Mind Genomics is the ability for AI to summarize the patterns among the strong performing elements, much as AI does when creating the Question Book at the set-up of the project. Table 12 shows the AI summarization based upon the results from the total panel.
Table 12: The summarization of performance of strong element(s) for the Total Panel by AI embedded in www.BimiLeap.com, the Mind Genomics platform.
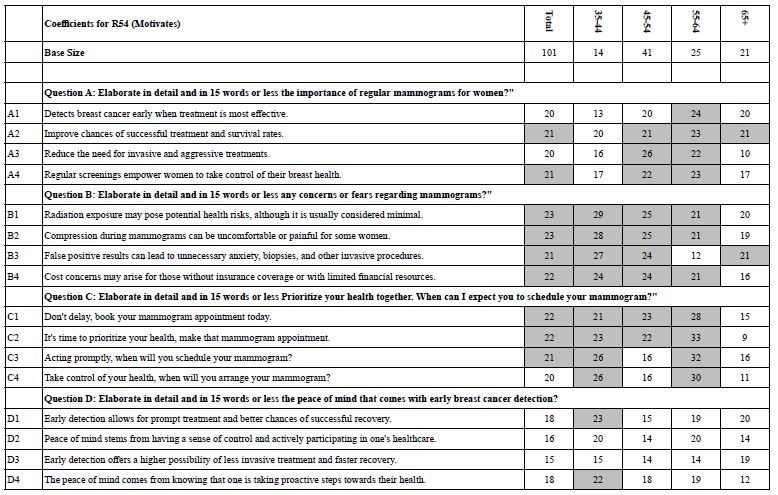
The next level of analysis in the search for meaningful patterns focuses on the respondent’s age. Table 13 shows a richer pattern of results, focusing only on R54, Motivates. There are many coefficients which exceed the cut-off value of 21, and thus the pattern is still elusive. The 21 respondents age 65+ show the lowest values for the coefficients.
Table 13: Strong performing elements for Total Panel and four subgroups defied by the respondent’s age
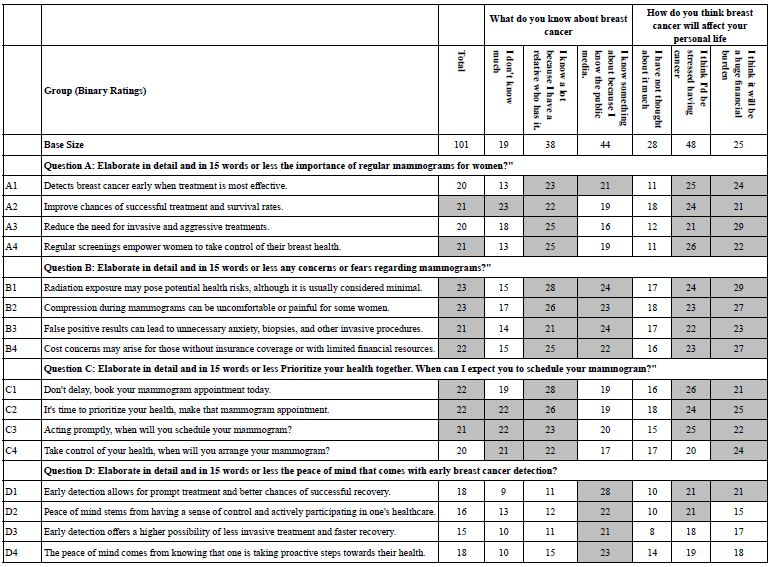
Recall that at the start of the Mind Genomics experiment, the respondent was asked to select answers to two questions, one asking about knowledge about breast cancer, and the other asking about how breast cancer would affect her life. Table 14 shows the remarkable effects of knowing about breast cancer and expectations about life with breast cancer. The patterns across groups become quite clear. For those who either do not know about breast cancer or who have not thought about it, the elements are moderate, but most do not reach the threshold of 21 to be shaded. One group in particular deserves a note. That group of respondents comprises those who when asked about their knowledge of breast cancer selected the answer: I know a lot because I have a relative who has it. They ended up saying that they are strongly motivated by all of the elements except the last set, about peace of mind from early detection. That pattern makes a great deal of sense and is not immediately intuitive. This group has gone beyond peace of mind into the personal angsts accompanying experience with breast cancer, whether breast cancer has struck oneself or a family member, or friend.
Table 14: Strong performing elements for Total Panel and two sets of subgroups, defined by knowledge of breast cancer, and by selected reactions to the prospect of coming down with breast cancer.
Focusing Opportunities by Uncovering Mind-sets
Mind Genomics searches for intuitively obvious patterns of coefficients. Without dancing around the data, spinning theories, and creating stories, the researcher should be struck by ‘ocular trauma’—that is, the patterns should ‘hit one squarely between the eyes.’
The coefficients for the different subgroups identified through the self-profiling classification may be strongly positive, but there are no clear patterns. Tables 13 and 14 simply fail to reveal a pattern. One might strain to develop a credible explanation, but that goes against the worldview embodied in the phrase ‘ocular trauma’. Hypotheses and stories of what may be happening do not constitute science, but simply conjectures. We need a quantitative method which advances our thinking.
The answer to the issue of ‘ocular trauma’ and ‘self-evident patterns’ may emerge from a well-accepted class of statistical procedure known as ‘clustering’. Clustering methods sort items into mutually exclusive, exhaustive groups using mathematical criteria. The researcher specifies the number of groups, intragroup coherence, and intergroup distance, and calculation follows. The researcher names the groups (interpretability) after the exercise.
Numerous statistical methods have been developed to cluster objects. The approach currently used by Mind Genomics is known as k-means clustering [21]. The objects are our 101 female respondents, each of whom generates 16 coefficients for R54, ‘motivates’. The individual-level modeling is valid for these data because each respondent evaluated a unique set of 24 vignettes laid out by experimental design, and because the newly created binary variables, such as R54, were guaranteed to exhibit some minimal level of variable by the prophylactic addition of a vanishingly small random number.
K-means clustering calculates the “distance” between each pair of people (1-Pearson Correlation). The strength of the linear relation relationship between two comparable data points is shown by the Pearson Correlation. Two study respondents are separated by zero distance (1-1 = 0) when the Pearson Correlation is 1. Two study respondents are separated by the maximum distance (1–1 = 2) when the Pearson Correlation is-1, and the patterns of coefficients go in opposite directions.
Table 15 shows the coefficients for the two-cluster solution. These clusters are called ‘mind-sets’ in the language of Mind Genomics. They are more readily interpretable. Mind-Set 1 is clearly most strongly motivated by the appeal to taking control of one’s health. Mind-Set 2 is clearly more strongly motivated by information, by knowing the benefits and negatives of regular mammograms.
Table 15: Strong performing elements for Total Panel and the two emergent mind-sets (MS 1 and MS 2). The labels are assigned by the researcher.. All coefficients of 21 or higher are shown in shaded cells. The equations are estimated without an additive constant (viz., forced through the origin).
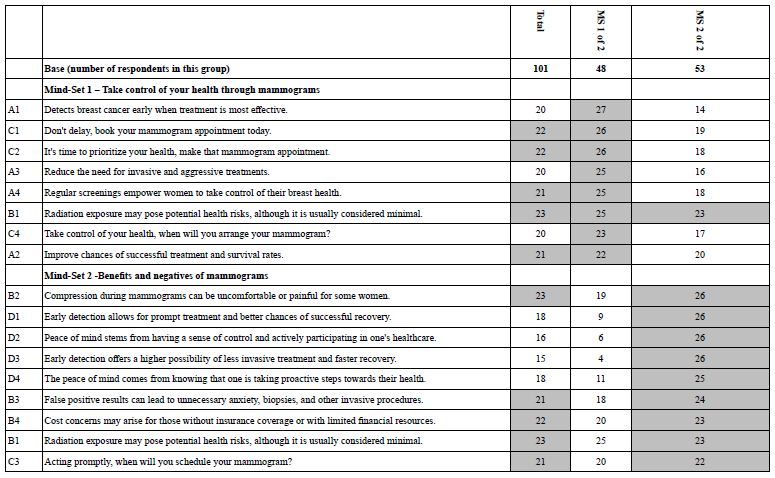
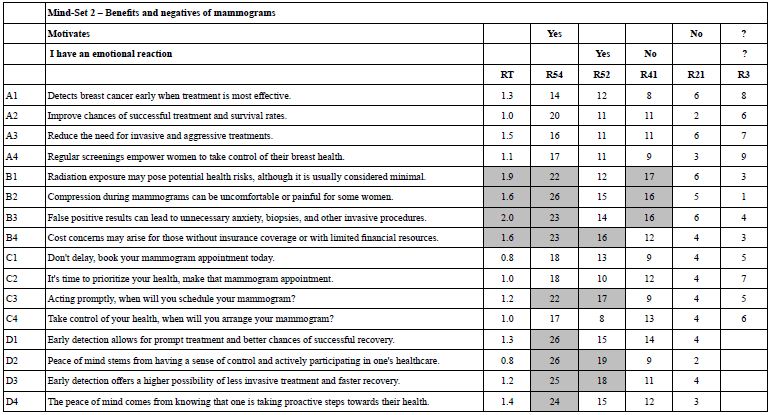
Table 16A shows the full set of coefficients for Mind-Set 1, Take control of your health through mammograms. These are the set of newly created binary dependent variables. Table 16B shows the same full set of coefficients for Mind Set 2, Benefit and negatives of mammograms Tables 16A and 16B show shaded cells for Response Times of 1.6 seconds or longer, highlighting those elements which engage attention. For R54 (Motivates) the elements which motivate are also highlighted, with values of 21 or higher. Finally for other rating variables, the threshold level has been lowered to 16+. Elements with ‘0’ or negative coefficients are presented with a blank cell.
Table 16 A: Coefficients for key dependent variables for Mind-Set 1 – Take control of your health through mammograms
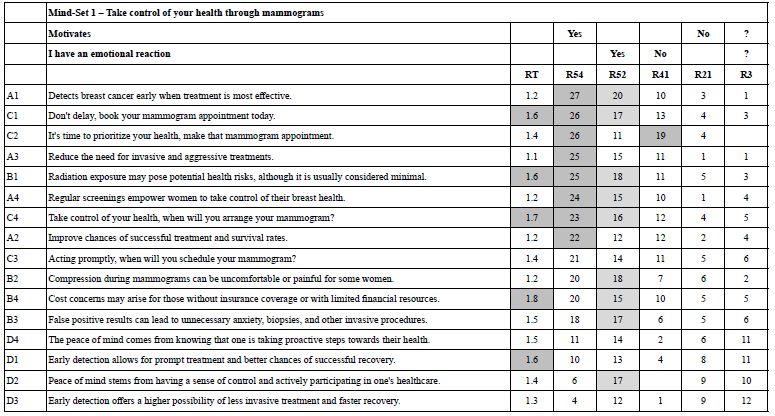
Table 16 B: Coefficients for key dependent variables for Mind-Set 2 – Benefits and negatives of mammograms
Measuring the Performance of the Research Results Using the IDT (Index of Divergent Thought)
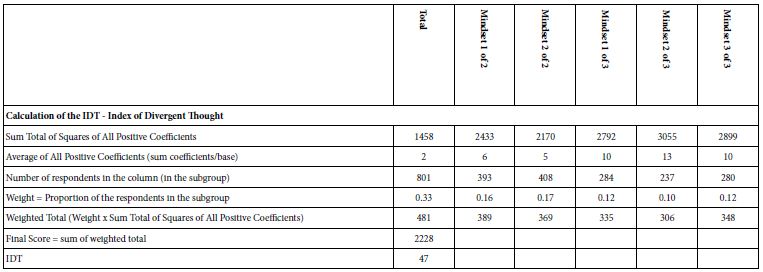
One of the critiques levelled against Mind Genomics is that the simple-to-use templated form makes the research available to anyone, and that the automated analyses done routinely after the data has been collected allows anyone to do powerful research of the type called ‘conjoint analysis’ [22]. The criticism is valid. Indeed, following the approach laid out by Mind Genomics enables a school child to do a study, and most certainly a high school student [23]. With this simplicity of process, and with the widespread available of computation, even on the smart phone, how does the world of science evaluate the contribution of the research? If the world of daily issues can be investigated with profound tools by inexperienced researchers, then can we measures the strength of the research instead of relying on the reputation of the researcher?
The answer to the foregoing can be ‘yes’ if we create an objective system to measure the strength of the research. One way to do this is the IDT, Index of Divergent Thought. The IDT uses the coefficients, or more properly the squares of the coefficients, to assess the strength of the research. Table 17 shows the computational formula. The IDT is operationally defined. For the computation of the IDT the researcher first must create the two-mind-set solution and then the three-mind-set solution, respectively, no matter which mind-set solution ends up being accepted.
Table 17: The IDT (index of divergent thought) for the mammogram study, based upon the coefficients for R54 (motivates)

Typically, novice researchers with no really strong ideas end up with IDT values around 50-60. Good research, the type with meaningful patterns, ends up with IDT values of 65-80. Really strong data, viz. studies with high coefficients, end up with IDT values of 80+, although in such cases experience suggests that all of the mind-sets respond strongly to the elements, and thus the segmentation may not be clear. These numbers for the IDT are not engraved in stone, but rather are preliminary numbers after six months of studies addressing a variety of topics with Mind Genomics. Whether the high IDT value comes from an interesting topic or comes from powerful research is not a question that can as yet be answered.
What We have Learned-AI Summarization Elements Which ‘Motivate’ Mind-Sets 1 and 2, Respectively
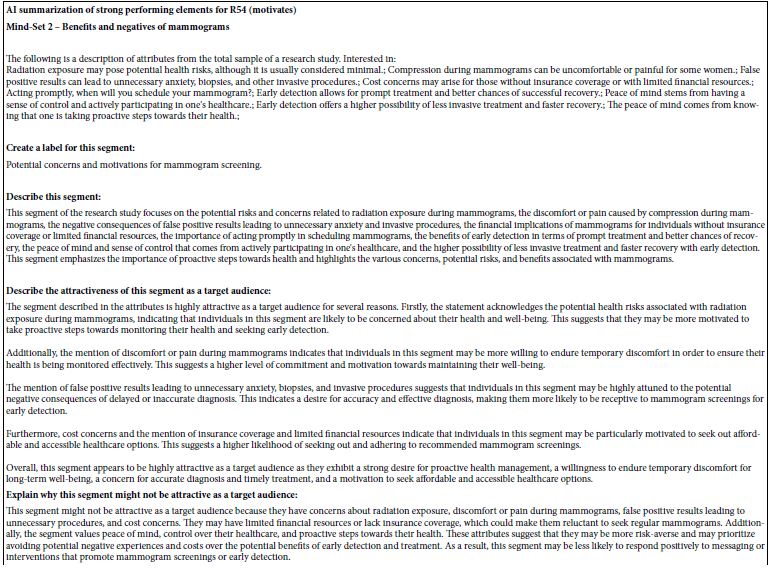
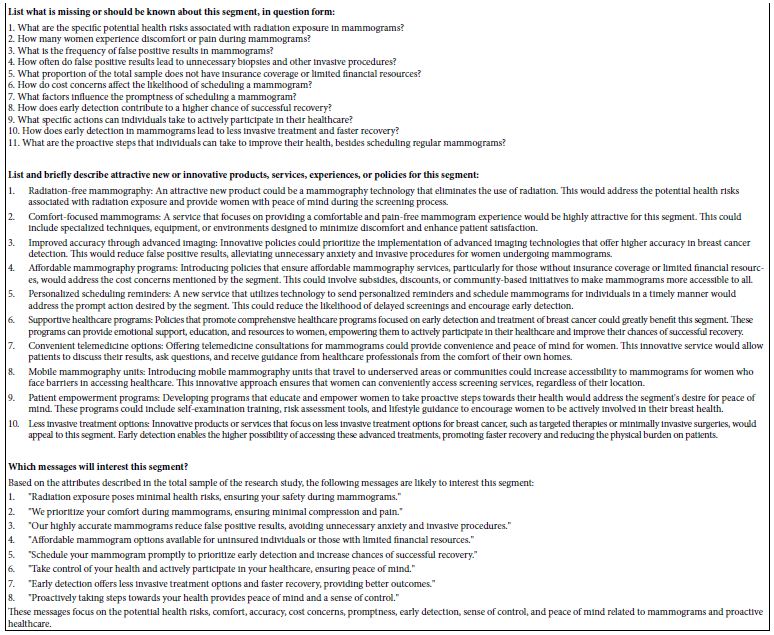
A key benefit of Mind Genomics is the ability to summarize the data using the criteria defined by the researcher. Just as we were able to ‘summarize’ the different questions and answers using Idea Coach, we are now able to summarize the findings for Mind-Sets 1 and 2, respectively Tables 18A and 18B show this summarization, based upon the dependent variable R54, motivates, and based upon the patterns and meaning generated by those elements with coefficients 21 or higher. Table 18A shows the AI summarization of the strong performing elements for Mind-Set 1. Table 18B shows the AI summarization of the strong performing elements for Mind-Set 2.
Table 18 A: AI summarization of strong performing elements for R54 (motivates) for Mind-Set 1
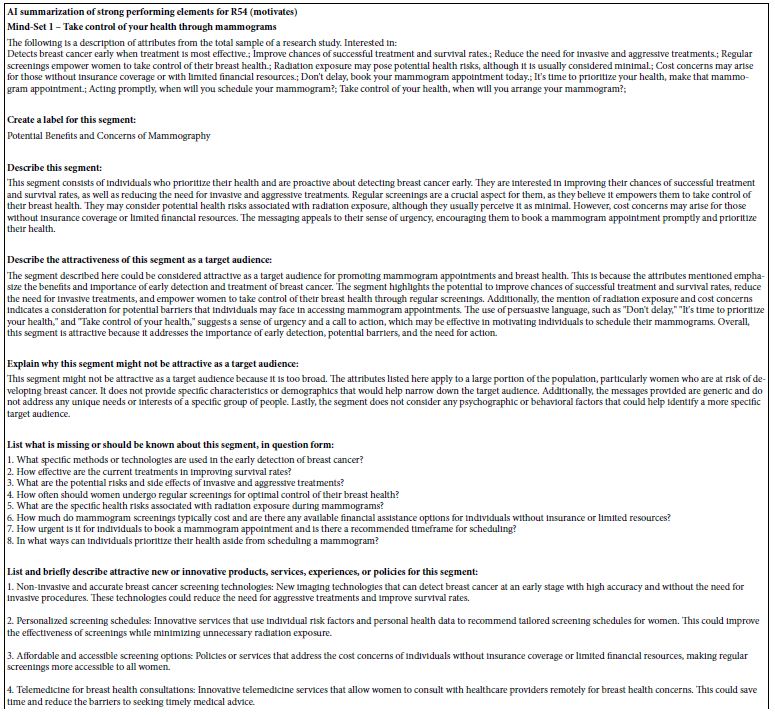
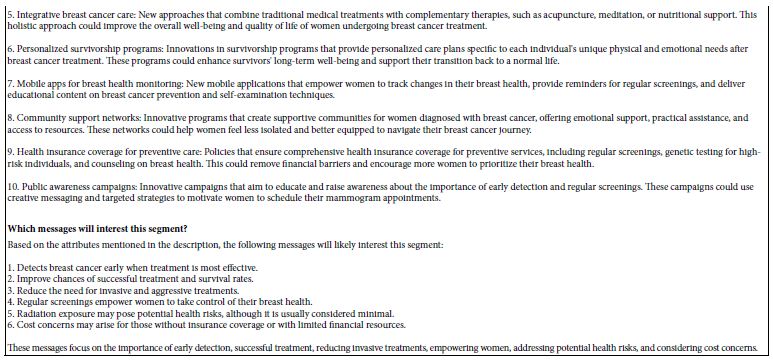
Table 18 B: AI summarization of strong performing elements for R54 (motivates) for Mind-Set 2
Finding Mind-sets in the Population
The Mind Genomics approach works with a relatively few number of respondents, but from those respondents uncovers mind-sets, and through the strong performing elements knows the tonality of the messages and even some of the text of the messages to which the mind-sets will respond. One cannot perform a Mind Genomics study on millions of women, however, to analyze their data, and then assign each woman to the appropriate mind-set for making appointments for a mammography. Such a capability would be wonderful, but not feasible.
To address the issue of assigning a new person to a mind-set, Moskowitz and colleagues developed the PVI, the personal viewpoint identifier. The PVI uses the data from the study, putting it into a simulator, and identifying the best set of elements and their weights in order to assign a new person to one of the two mind-sets.
The PVI system has been embedded in an easy-to-use computer program (www.PVI360.com), linked to the data from a Mind Genomics study.
Figure 3 Panel A shows the first part of the PVI, which gathers information from the respondent. It is here that one can create a registry of individuals, who give their permission to be contacted for further research.
Figure 3 Panel B shows the actual set of six questions, comprising six statements taken directly from the research study, but presented to the respondent as a set of questions with two answers.
Figure 3 Panel C shows the feedback to the researcher or to the respondent about mind-set membership given the responses.
Figure 3 Panel D shows the set-up screen that the researcher uses to transfer summary data from the Mind Genomics results to the input for the PVI. The task takes less than five minutes.
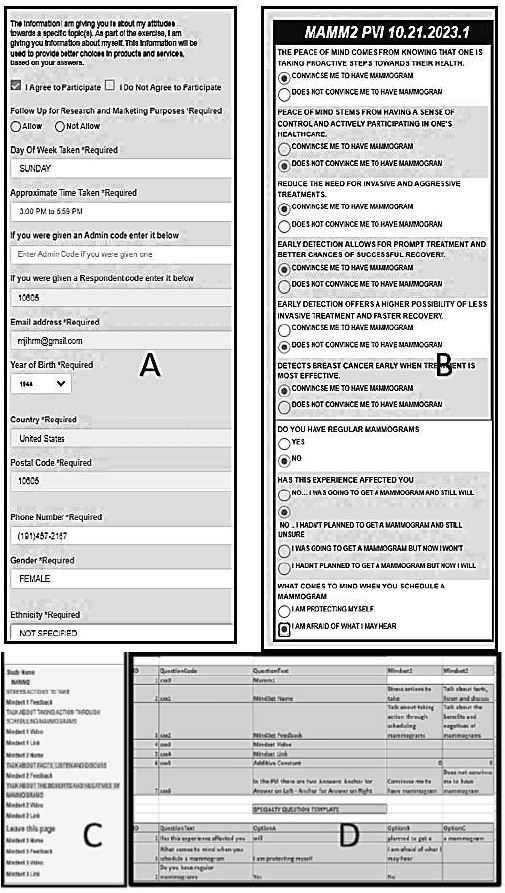
Figure 3: Panel A shows the qualification and background questions for the PVI. Panel B shows the six question PVI and additional questions about mammography asked to the respondents. Panel C shows the feedback information provided immediately by email to either the medical professional or to the respondent, or to both. Panel D shows the first part of the set-up page, done in Excel.
The Mind-sets Differ in the Style of Their Open-ended Responses
Traditionally, the Mind Genomics studies (really experiments) have not been ‘productive’ when it comes to having the response write about the topic. Most respondents are not particularly interested in the topic. This study on mammograms, and perhaps others studies on personal health, may open up an opportunity to learn more from the person, or the patient since the study deals with a topic of interest.
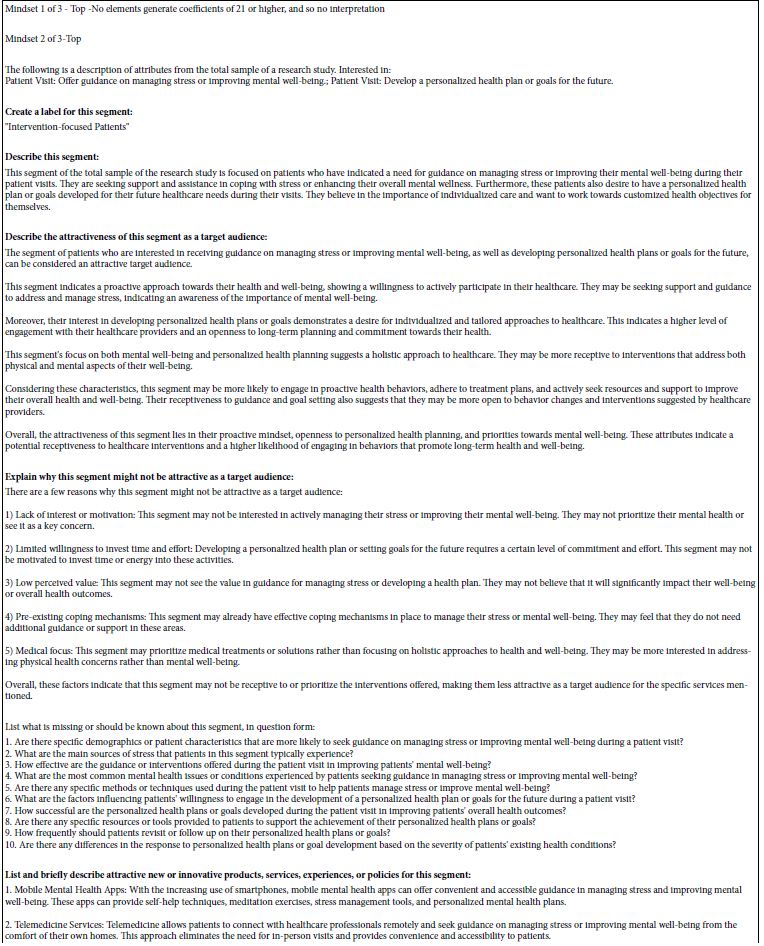
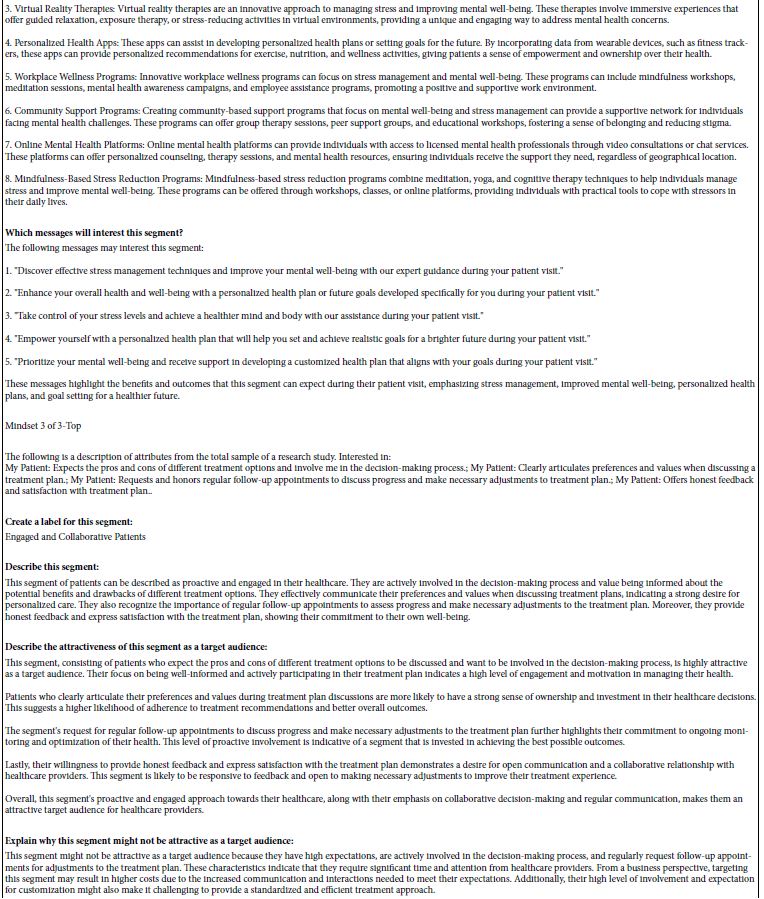
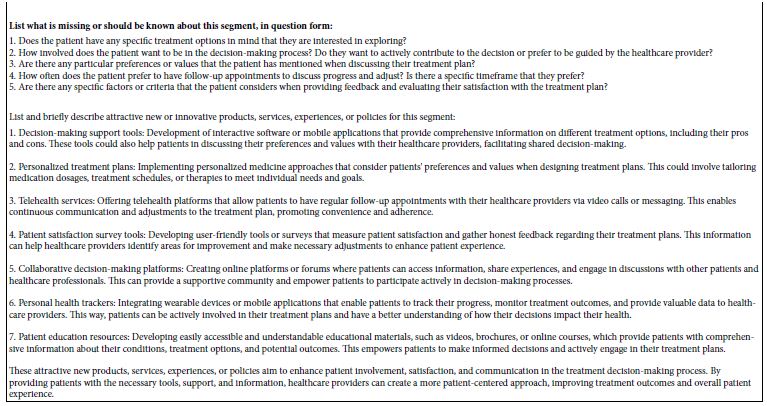
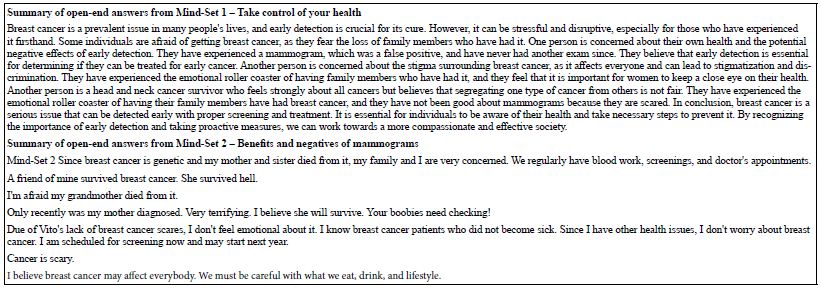
The final analysis subjected the open-end response to AI summarization through an APP ‘QuillBot’ [24] and requested the program to summarize the information contained in the open-end answers. No other request was made. The AI program was given the answers in the form of an excel sheet, one sheet for Mind-Set 1 (Take control of your health), the other sheet for Mind-Set 2 (Benefits and negatives of mammograms). No other information was provided.
Table 19 shows the remarkable difference in the way AI summarized the two sets of open-ended answers. The AI generated summary for Mind-Set 1, take control of your health, appears to be a coherent paragraph. In contrast, the AI generated summary for Mind-Set 2, benefits and negatives of mammograms, appears to be a set of disconnected sentences, rather than a single or small set of paragraphs. This difference in the morphological characteristics of the open-end answers may hint at important ways the different mind-sets organize information and provide new opportunities for understanding the minds of patients.
Table 19: AI summarization of open-end answers for Mind-Set 1 (Take control of your health) and Mind-Set 2 (Benefits and negatives of mammograms).
Discussion and Conclusions
This paper is based upon work originally done as a demonstration project to teach Mind Genomics. The powerful results were unexpected. Most studies using Mind Genomics end up with respondents who are only moderately interested in the topic. These studies usually deal with product features and with messaging about those features. More serious studies, such as those regarding society, law, ethics, and so forth, cannot be said to engage the respondent more deeply. The response times for these other studies are short. The coefficients for RT for these are studies are in the order of 0.3-0.7 seconds for most, suggesting little interest. Rather, it seems for the most part the respondents graze the messages, give a meaningful answer, but are not particularly involved in the Mind Genomics exercise.
The fact that topics of personal medical health produce this degree of interest suggest a rich opportunity to understand the patient at a level not before seen. One can imagine working with patients in a variety of situations, individuals who are motivated to learn about the topic, and learn about themselves at the same time. One could even imagine larger scale initiatives, where patients could participate for 5-10 studies on the different aspects of their condition, join a ‘club’ and keep contributing, with follow-up visits to their doctor, and follow-up studies. Their compensation might be some consideration given to them when they get their drugs and other materials from the pharmacy, a sort of ‘affinity group’ to forward knowledge.
As a final thought, it is worth thinking about the role of Mind Genomics as a way to understand the world. Research has been thought of as a highly disciplined, hypothesis-based procedure done by specialists, researchers, and scientists. Research as an everyday event is rarely discussed, but our intellectual curiosity makes us researchers, whether we realize it or not. Our world exploration includes watching, asking questions, acting on them, and moving on. People learn this way. The Mind Genomics “program” brings science and careful observation to the everyday. We discuss the everyday grind. Mind Genomics practitioners, like the pioneering scientists of the past, can study the globe in hours, discovering new themes. Artificial intelligence combined with natural curiosity is the next instrument for exploring, learning, and comprehending. The science is kept, but childlike love of simplicity, a guide or mentor, quickness, low cost, and most of all learning fun is introduced. Why not an adult serious researcher engaged in important problems where people’s thoughts are studied . If a nine-year-old can do the experiment and have fun, why not adults and more important, why not patients with medical conditions? The result might be a healthier world if one could discover how to have the patients comply, live a healthier lifestyle, and pass on their ideas to others through the systematization afforded by Mind Genomics.
References
- Enaizan O, Zaidan AA, Alwi NHM, Zaidan BB, Alsalem MA, et al. (2020) Electronic medical record systems: Decision support examination framework for individual, security & privacy concerns using multi-perspective analysis. Health and Technology 10: 795-822.
- Gianfrancesco MA, Tamang S, Yazdany J, Schmajuk G (2018) Potential biases in machine learning algorithms using electronic health record data. JAMA Internal Medicine 178: 1544-1547. [crossref]
- Li J, Shaw MJ (2012) Safeguarding the Privacy of Electronic Medical Records. In Cyber Crime: Concepts, Methodologies, Tools and Applications. IGI Global 891-901.
- Gøtzsche PC, Jørgensen KJ (2013) Screening for breast cancer with mammography. Cochrane Database of Systematic Reviews 2013.
- Kerlikowske K, Grady D, Rubin SM, Sandrock C, Ernster VL (1995) Efficacy of screening mammography: a meta-analysis. JAMA 273: 149-154. [crossref]
- Brett J, Bankhead C, Henderson B, Austoke J (2005) The psychological impact of mammographic screening. A systematic review. Psycho-Oncology 14: 917-938. [crossref]
- Bernstein J, Mutschler P, Bernstein E (2000) Keeping mammography referral appointments: motivation, health beliefs, and access barriers experienced by older minority women. Journal of Midwifery & Women’s Health 45: 308-313. [crossref]
- Holm CJ, Frank DI, Curtin J (1999) Health beliefs, health locus of control, and women’s mammography behavior. Cancer Nursing 22: 149-156. [crossref]
- Taplin SH, Barlow WE, Ludman E, MacLehos R, Meyer DM, et al. (2000) Testing reminder and motivational telephone calls to increase screening mammography: a randomized study. Journal of the National Cancer Institute 92: 233-242. [crossref]
- Lawson AE (2000) The generality of hypothetico-deductive reasoning: Making scientific thinking explicit. The American Biology Teacher 62: 482-495.
- Backman K, Kyngäs HA (1999) Challenges of the grounded theory approach to a novice researcher. Nursing & health sciences 1: 147-153. [crossref]
- Nederhof AJ (1985) Methods of coping with social desirability bias: A review. European Journal of Social Psychology 15: 263-280.
- Moskowitz HR (2012) ‘Mind Genomics’: The experimental, inductive science of the ordinary, and its application to aspects of food and feeding. Physiology & Behavior 107: 606-613. [crossref]
- Moskowitz HR, Gofman A, Beckley J, Ashman H (2006) Founding a new science: Mind Genomics. Journal of Sensory Studies 21: 266-307.
- Zemel R, Choudhuri SG, Gere A, Upreti H, Deitel Y, et al. (2019) Mind, Consumers, and Dairy: Applying Artificial Intelligence, Mind Genomics, and Predictive Viewpoint Typing. In Current Issues and Challenges in the Dairy Industry. Intech Open.
- Stevens SS (1975) Psychophysics: An Introduction to Its Perceptual, Neural and Social Prospects, New York, John Wiley.
- Gofman A, Moskowitz H (2010) Isomorphic permuted experimental designs and their application in conjoint analysis. Journal of Sensory Studies 25: 127-145.
- Liu Y, Han T, Ma S, Zhang J, Yang, Y, et al. (2023) Summary of ChatGPT-related research and perspective towards the future of large language models. Meta-Radiology 100017.
- Craven BD, Islam SM (2011) Ordinary least-squares regression. The SAGE Dictionary of Quantitative Management Research 224-228.
- Hardy MA (1993) Regression with Dummy Variables. Sage 93.
- Likas A, Vlassis N, Verbeek JJ (2003) The global k-means clustering algorithm. Pattern Recognition 36: 451-461.
- Marshall D, Bridges JF, Hauber B, Cameron R, Donnalley L, et al. (2010) Conjoint analysis applications in health—how are studies being designed and reported? An update on current practice in the published literature between 2005 and 2008. The Patient: Patient-Centered Outcomes Research 3: 249-256. [crossref]
- Kornstein B, Rappaport S, Moskowitz H (2023) Communication styles regarding child obesity: Investigation of a heath and communication issue by a high school student researcher, using Mind Genomics and artificial intelligence. Mind Genomics Studies in Psychology and Experience 3: 1-14.
- Fitria TN (2021) QuillBot as an online tool: Students’ alternative in paraphrasing and rewriting of English writing. Englisia: Journal of Language, Education, and Humanities 9: 183-196.
![]() and likewise for tensors,
and likewise for tensors, ![]() The symbol ∇ denotes the gradient, ∇· the divergence, and ⊗ the dyadic product.
The symbol ∇ denotes the gradient, ∇· the divergence, and ⊗ the dyadic product.![]() function the dashed symbol
function the dashed symbol ![]() denotes the material derivative relative to the pertinent constituent, viz.
denotes the material derivative relative to the pertinent constituent, viz.![]()
![]()
![]()
![]()
![]()
![]() be the specific internal energy. The local version of the balance of energy eventually reads
be the specific internal energy. The local version of the balance of energy eventually reads![]()
![]() is the energy supply and
is the energy supply and![]()
![]() be the absolute temperature and
be the absolute temperature and ![]() the specific entropy. The balance of entropy is derived by the general view that the entropy change equals the entropy transfer plus the entropy production. This is made formal by letting jα be the entropy flux,
the specific entropy. The balance of entropy is derived by the general view that the entropy change equals the entropy transfer plus the entropy production. This is made formal by letting jα be the entropy flux, ![]() the entropy supply and
the entropy supply and ![]() the entropy production so that
the entropy production so that![]()
![]()
![]()
![]() be given by constitutive equations, as is done for the entropy fluxes {jα} after [7].
be given by constitutive equations, as is done for the entropy fluxes {jα} after [7].![]()
![]()
![]() from (3) results in
from (3) results in![]()
![]() we have
we have![]()
![]()
![]()

![]()
![]() of the fluid and the solid. We let θf = θs = θ while ∇ θf ≠ ∇ θs. Then we observe that
of the fluid and the solid. We let θf = θs = θ while ∇ θf ≠ ∇ θs. Then we observe that![]()
![]()

![]() and observe that the relations
and observe that the relations


![]()
![]() qf, qs imply that each term has to vanish; the vanishing of the second and third terms results in
qf, qs imply that each term has to vanish; the vanishing of the second and third terms results in![]()
![]()
![]() implies that
implies that![]()

![]()

![]()
![]() , shear viscosity μf, and interaction force coefficient β.
, shear viscosity μf, and interaction force coefficient β.
![]()
![]()
![]() which requires that the rate equations (7), (8) are applied.
which requires that the rate equations (7), (8) are applied.![]()
![]() and q is not considered and (see, e.g., [12]) ε is assumed to depend only on the temperature θ.
and q is not considered and (see, e.g., [12]) ε is assumed to depend only on the temperature θ.![]() and q if
and q if![]()
![]() . Though this looks a very specific model, eq. (17) is the necessary assumption that makes ε (θ, ρ ) thermodynamically consistent if Tf and qf are subject to the rate equations (7) and (8).
. Though this looks a very specific model, eq. (17) is the necessary assumption that makes ε (θ, ρ ) thermodynamically consistent if Tf and qf are subject to the rate equations (7) and (8).


