DOI: 10.31038/NAMS.2023621
Abstract
In this study, a novel graphitic carbon nitride/cobalt molybdate (g-C3N4/CeO2) nanocomposites (NCs) as a photocatalys was examined during photocatalytic degradation process in the efficient removal of Ofloxacin (OFX) from pharmaceutical industry wastewater plant, İzmir, Turkey. Different pH values (3.0, 4.0, 6.0, 7.0, 9.0 and 11.0), increasing OFX concentrations (5 mg/l, 10 mg/l, 20 mg/l and 40 mg/l), increasing g-C3N4/CeO2 NCs concentrations (1 mg/l, 2 mg/l, 4 mg/l, 6 mg/l, 8 mg/l and 10 mg/l), different g-C3N4/CeO2 NCs mass ratios (5/5, 6/4, 7/3, 8/2, 9/1, 1/9, 2/8, 3/7 and 4/6), increasing recycle times (1., 2., 3., 4., 5., 6. and 7.) was operated during photocatalytic degradation process in the efficient removal of OFX in pharmaceutical industry wastewater. The characteristics of the synthesized nanoparticles (NPs) were assessed using X-Ray Difraction (XRD), Field Emission Scanning Electron Microscopy (FESEM), Energy-Dispersive X-Ray (EDX), Fourier Transform Infrared Spectroscopy (FTIR), Transmission Electron Microscopy (TEM), and Diffuse reflectance UV-Vis spectra (DRS) analyses, respectively. The acute toxicity assays were operated with Microtox (Aliivibrio fischeri also called Vibrio fischeri) and Daphnia magna acute toxicity tests. The photocatalytic degradation mechanisms of g-C3N4/CeO2 NCs and the reaction kinetics of OFX were evaluated in pharmaceutical industry wastewater during photocatalytic degradation process. ANOVA statistical analysis was used for all experimental samples. The maximum 99% OFX removal efficiency was obtained during photocatalytic degradation process in pharmaceutical industry wastewater, at 300 W UV-vis light irradiation power, after 180 min photocatalytic degradation time, at pH=6.0 and at 25°C, respectively. The maximum 99% OFX removal efficieny was found with photocatalytic degradation process in pharmaceutical industry wastewater, at 20 mg/l OFX, at 300 W UV-vis light irradiation power, after 180 min, at pH=6.0 and at 25°C, respectively. The maximum 99% OFX removal efficieny was measured to 8 mg/l g-C3N4/CeO2 NCs with photocatalytic degradation process in pharmaceutical industry wastewater, at 20 mg/l OFX, at 300 W UV-vis light irradiation power, after 180 min, at pH=6.0 and at 25°C, respectively. The maximum 99% OFX removal efficiency was measured at 2/8wt g-C3N4/CeO2 NCs mass ratios at 20 mg/l OFX, at 300 W UV-vis light irradiation power, after 180 min, at pH=6.0 and at 25°C, respectively. The maximum 99% OFX removal efficiency was measured in pharmaceutical industry wastewater during photocatalytic degradation process, after 1. recycle time, at 20 mg/l OFX, 8 mg/l g-C3N4/CeO2 NCs, at 2/8wt g-C3N4/CeO2 NCs mass ratio, after 180 min, at pH=6.0 and at 25°C, respectively. 96.41% maximum Microtox (Aliivibrio fischeri) acute toxicity removal yield was found in OFX=20 mg/l after 180 min photocatalytic degradation time and at 60°C. It was observed an inhibition effect of OFX=40 mg/l to Microtox with Vibrio fischeri after 180 min and at 60°C. 92.38% maximum Daphnia magna acute toxicity removal was obtained in OFX=20 mg/l after 180 min photocatalytic degradation time and at 60°C, respectively. It was observed an inhibition effect of OFX=40 mg/l to Daphnia magna after 180 min and at 60°C. OFX concentrations > 20 mg/l decreased the acute toxicity removals by hindering the photocatalytic degradation process. Similarly, a significant contribution of increasing OFX concentrations to acute toxicity removal at 60°C after 180 min, was not observed. It can be concluded that the toxicity originating from the OFX is not significant and the real acute toxicity throughout photocatalytic degradation process was attributed to the pharmaceutical industry wastewater, to their metabolites and to the photocatalytic degradation process by-products. As a result, the a novel g-C3N4/CeO2 NCs photocatalyst during photocatalytic degradation process in pharmaceutical industry wastewater was stable in harsh environments such as acidic, alkaline, saline, and then was still effective process. When the amount of contaminant was increased, the a novel g-C3N4/CeO2 NCs photocatalys during photocatalytic degradation process performance was still considerable. The synthesis and optimization of g-C3N4/CeO2 heterostructure photocatalyst provides insights into the effects of preparation conditions on the material’s characteristics and performance, as well as the application of the effectively designed photocatalyst in the removal of antibiotics, which can potentially be deployed for purifying wastewater, especially pharmaceutical wastewater. Finally, the combination of a simple, easy operation preparation process, excellent performance and cost effective, makes this a novel g-C3N4/CeO2 NCs a promising option during photocatalytic degradation process in pharmaceutical industry wastewater treatment.
Keywords
ANOVA statistical analysis, Antibiotics, Coronavirus Disease-2019 (COVID-19), Cost analysis, Diffuse reflectance UV-Vis spectra (DRS), Electrochemical filtration process, Energy-dispersive X-ray (EDX), Field emission scanning electron microscopy (FESEM), Fourier transform infrared spectroscopy (FTIR), Hydrothermal-calcination method, Hydroxly (OH●) radicals, Microtox (Aliivibrio fischeri or Vibrio fischeri) and Daphnia magna acute toxicity tests, Nanoparticles (NPs), Novel graphitic carbon nitride/cerium dioxide nanocomposites (g-C3N4/CeO2 NCs), Ofloxacin (OFX), Pharmaceutical industry wastewater, Photocatalytic degradation mechanisms, Reaction kinetics, Sol–gel method, Transmission Electron Microscopy (TEM), Ultraviolet (UV), X-ray difraction (XRD)
Introductıon
Emerging contaminants (ECs), sometimes known as contaminants of emerging concern (CECs) can refer to a wide variety of artificial or naturally occurring chemicals or materials that are harmful to human health after long-term disclosure. ECs can be classified into several classes, including agricultural contaminants (pesticides and fertilizers), medicines and antidote drugs, industrial and consumer waste products, and personal care and household cleaning products [1,2]. Antibiotics are one of the ECs that have raised concerns in the previous two decades because they have been routinely and widely used in human and animal health care, resulting in widespread antibiotic residues discharged in surface, groundwater, and wastewater.
Antibiotics, which are widely utilized in medicine, poultry farming and food processing, have attracted considerable attention due to their abuse and their harmful effects on human health and the ecological environment. The misuse of antibiotics induces Deoxyribonucleic Acid (DNA) contamination and accelerates the generation of drug-resistant bacteria and super-bacteria thus, some diseases are more difficult to cure . A number of studies have revealed that the level of antibiotics in the soil, air and surface water, and even in potable water, is excessive in many areas, which will ultimately accumulate in the human body via drinking water and then damage the body’s nervous system, kidneys and blood system. Therefore, it is necessary to develop an efficient method to remove antibiotics present in pharmaceutical industry wastewater [3-13].
The uncontrolled, ever-growing accumulation of antibiotics and their residues in the environment is an acute modern problem. Their presence in water and soil is a potential hazard to the environment, humans, and other living beings. Many therapeutic agents are not completely metabolized, which leads to the penetration of active drug molecules into the biological environment, the emergence of new contamination sources, the wide spread of bacteria and microorganisms with multidrug resistance. Modern pharmaceutical wastewater facilities do not allow efficient removal of antibiotic residues from the environment, which leads to their accumulation in ecological systems . Global studies of river pollution with antibiotics have shown that 65% of surveyed rivers in 72 countries on 6 continents are contaminated with antibiotics. According to the World Health Organization (WHO), surface and groundwater, as well as partially treated water, containing antibiotics residue and other pharmaceuticals, typically at < 100 ng/l concentrations, whereas treated water has < 50 ng/l concentrations, respectively . However, the discovery of ECs in numerous natural freshwater sources worldwide is growing yearly. Several antibiotic residues have been reported to have been traced at concentrations greater than their ecotoxicity endpoints in the marine environment, specifically in Europe and Africa . Thus, the European Union’s Water Framework Directive enumerated certain antibiotics as priority contaminants. In some rivers, the concentrations were so high that they posed a real danger to both the ecosystem and human health. This matter, the development of effective approaches to the removal of antibiotics from the aquatic environment is of great importance [14-26].
The removal of antibiotics and their residues from water and wastewater prior to their final release into the environment is of particular concern. Modern purification methods can be roughly divided into the following three categories depending on the purification mechanism: biological treatment, chemical degradation, and physical removal. Each of these methods has its own advantages and disadvantages. For example, biological purification can remove most antibiotic residues, but the introduction of active organisms into the aquatic environment can upset the ecological balance. Various chemical approaches (ozonation, chlorination, and Fenton oxidation) cannot provide complete purification and, in some cases, lead to the death of beneficial microorganisms due to low selectivity. Photocatalysis is widely used in new environmental control strategies. However, this method has a number of key disadvantages, such as insufficient use of visible light, rapid annihilation of photogenerated carriers, and incomplete mineralization, which greatly limits its application [27-33].
Ofloxacin (OFX) is a quinolone antibiotic useful for the treatment of a number of bacterial infections . A quinolone antibiotic is a member of a large group of broad-spectrum bacteriocidals that share a bicyclic core structure related to the substance 4-quinolone . They are used in human and veterinary medicine to treat bacterial infections, as well as in animal husbandry, specifically poultry production . OFX is well-known for their antimicrobial and anti-inflammatory capabilities . OFX is used to treat pneumonia, skin and urinary tract infections . Severe acute respiratory syndrome (SARS)-CoV-2 (COVID-19) pandemic, which has killed and infected people in 216 countries/territories, has become the most significant pandemic of the century . OFX combined with other drugs, has been widely used to minimise COVID-19-induced inflammation in 2020.OFX is a typical fluoroquinolone antibiotic administered to both humans and animals, and after administration, approximately 78% of OFX is excreted. OFX pharmaceutical compounds enter water resources in various ways, such as human and animal excretions and inefficient industrial wastewater treatment. In the class of antibiotics, OFX is also recognised as highly refractory and persistent in aquatic water systems. As the biodegradation of OFX is difficult, sewage treatment plants (STPs) have a low removal rate, and the OFX concentrations in the STP effluents of Beijing, Hangzhou, and Vancouver have been determined to be between 6×10⁻⁷ and 1.405×10⁻³ mg/l [34-41].
Generally, the advanced oxidation processes (AOPs), such as the Fenton or Fenton-like reaction, ozonation or catalytic ozonation, photocatalytic oxidation, electrochemical oxidation, and ionizing radiation, have been widely used for antibiotics degradation in recent years . One of the most promising techniques applied for efficient degradation of antibiotics are Advanced Oxidation Processes (AOPs). Nowadays, particular attention is paid to photocatalytic reactions, in which highly oxidizing species responsible for mineralization of organic pollutants are formed in-situ in the reaction media by means of light and a photocatalyst . The photocatalytic activity is closely related to the physicochemical properties but also to the morphology and texture of the materials studied, for this reason the synthesis techniques are often of great importance. Photocatalysis, which occurs under exposure to UV light, is also a common method for the environmental pollutant elimination . The conventional photocatalysis utilizes mostly UV from sunlight, which accounts for only 4% of the solar energy. Therefore, through the introduction of catalysts, the utilization rate of sunlight can be effectively improved. To overcome the low-efficiency problem of the photocatalysis, the development of a more efficient catalyst system that would effectively improve the catalytic oxidation efficiency and overcome the existing limitations is important. The catalytic activity of the catalyst can be effectively improved by modulating its surface area, preparation method, and changing its properties and structures [42-57].
Numerous materials have been reported to have the potential and capacity to treat water or wastewater polluted with these antibiotics residue by applying the processes of adsorption and catalytic oxidation during the last few decades. The reported materials include mesoporous carbon beads, clay minerals, activated carbon, cellulose, and chitosan. As a result of engineering and science evolution, and in complement to the urgent need to increase the adsorption capability of antibiotic contaminants, more advanced materials such as carbon nanotube (CnT), nano-zero valent iron (nZVI), nanoporous carbons, porous graphene and graphene oxide (GO), to date have been analyzed and improved in their ability to remove these ECs from water [58-85].
Nanomaterials with a high specific surface area are a promising platform for the development and production of low-cost and highly efficient sorbents for various pollution molecules. For example, graphene-based nanomaterials were utilized to remove antibiotics, which are adsorbed on the material surfaces due to π-π-, electrostatic or hydrophobic interactions, as well as the formation of hydrogen bonds. Highly efficient antibiotic sorption was also observed when using highly porous, surface-active, and structurally stable silica-based materials, metal oxide NPs, and metal-organic frameworks. The photocatalysts, which mainly rely on the production of highly oxidizing species such as hydroxyl radical (OH●) and superoxide anion radical (O2− ●), have been considered an effective approach for the degradation of antibiotics in water [86-103].
The two-dimensional (2D) g-C3N4 semiconductor has a wide range of applications in the environmental and energy fields because of its visible-light activity, unique physicochemical properties, excellent chemical stability and low-cost. Some important limitations of the photocatalytic activity of g-C3N4 are its low specific surface area, fast recombination of electrons and holes and poor visible light absorption. To improve the above problems, the construction of a heterojunction with a suitable band gap semiconductor (co-catalyst) has been shown to be a good strategy to improve the photocatalytic performance of g-C3N4, such as g-C3N4-based conventional type II heterostructures, g-C3N4-based Z-scheme heterostructures, and g-C3N4-based p–n heterostructures, etc. The unique “Z” shape as the transport pathway of photogenerated charge carriers in Z-scheme photocatalytic systems is the most similar system to mimic natural photosynthesis in the many g-C3N4-based heterojunction photocatalysts. The construction of Z-scheme photocatalytic systems can promote visible light utilization and carrier separation, and maintain the strong reducibility and oxidizability of semiconductors. There are many studies on g-C3N4-based Z-scheme heterojunction photocatalysts, such as ZnO/g-C3N4, WO3/g-C3N4, g-C3N4/ZnS,, g-C3N4/NiFe2O4, g-C3N4/graphene/NiFe2O4, NiCo/ZnO/g-C3N4 and Bi2Zr2O7/g-C3N4/Ag3PO4, respectively. g-C3N4-based Z-scheme heterojunction photocatalysts have been made to improve the photocatalytic activity by combining with other semiconductor materials. Therefore, there are some problems with the single photocatalytic method, such as low adsorption ability, limited active sites and low removal efficiency. The integration of the adsorption and photocatalytic degradation of various organic pollutants is considered as a suitable and promising technology. On the other hand, it is still essential to fabricate photocatalysts with superior adsorption and degradation efficiencies [104-121].
g-C3N4 has been gaining great attention as a potential photocatalyst due to its stability and safety characteristics, as well as the fact that it can be facilely synthesized from low-cost raw materials. The low bandgap (~2.7 eV) can drive photo-oxidation reactions even under visible light. However, the pure g-C3N4 has some drawbacks such as its low redox potential and high rate of recombination between photo-induced electrons and holes, which dramatically limits its photocatalytic efficiency. Several strategies have been investigated, including modification of the material’s size and structure, nonmetal and metal doping, and coupling with other photocatalysts. For example, Liu et al. improved bulk g-C3N4’s performance in terms of Rhodamine B degradation from 30% to 100% by synthesizing mesoporous g-C3N4 nanorods through the nano-confined thermal condensation method. Dai et al. doped g-C3N4 with Cu through a thermal polymerization route and acquired a degradation rate of 90.5% with norfloxacin antibiotic. Nithya and Ayyappan, synthesized hybridized g-C3N4/ZnBi2O4 for reduction of 4-nitrophenol and reached an optimal removal efficiency of 79%. Among all, the construction of heterostructure photocatalysts by coupling g-C3N4 with other semiconductors seems to be an effective strategy to prevent electron and hole recombination, hence improving photocatalytic efficiency for contaminant treatment [122-131].
CeO2 (Ceria or Cerium(IV) oxide) is a versatile, inert, and physically and chemically stable material with multiple and diverse applications. Due to its hardness (Mohs scale 7), it was initially used as an abrasive material, but today it is used (alone or in binary or complex mixtures) in the field of heterogeneous catalysis (oxidation of hydrocarbons) or in the field of sensors, energy, and fuels such as solid oxide fuel cells, but also in water-splitting processes or photocatalysis. CeO2 applications in the dermato-cosmetics industry and in the biomedical field (antibacterial effect) should also be mentioned here. CeO2 is also possible to combine two or more properties, for example, the infrared filtering properties with the photocatalytic ones, to optimize practical applications. CeO2 is semiconductor photocatalyst with various applications and similar properties to TiO2. However, its band gap is in the wide range of 2.6 to 3.4 eV, depending on the preparation method. Furthermore, CeO2 exhibits promising photocatalytic activity. Nonetheless, the position of CB and VB limits its application as an efficient photocatalyst utilizing solar energy, even though CeO2 can absorb a larger fraction of the solar spectrum than TiO2. The photocatalytic and photoelectrocatalytic activity of CeO2 in wastewater treatment can be improved by various modification techniques, including changes in morphology, doping with metal cation dopants and non-metal dopants, coupling with other semiconductors, combining it with carbon supporting materials, etc.. The main properties that make CeO2 significant as a photocatalyst and photoelectrode material applied in the degradation of various pollutants result from its high band gap energy, high refractive index, high optical transparency in the visible region, high oxygen storage capacity, and chemical reactivity. The other properties of CeO2 which should be mentioned include its high thermal stability, high hardness, oxygen ion conductivity, special redox features, and easy conversion between Ce+3 and Ce+4 oxidation states [132-156].
The conduction band (CB) of g-C3N4 is more negative than that of CeO2 (-1.24 eV and -0.44, respectively), while CeO2 possesses a relatively positive valance band (VB) (2.56 eV) compared to the conduction band of g-C3N4, would theoretically facilitate the electron transition within the coupled photocatalyst to prolong the electron-hole separation [157]. Particularly, under the illumination of visible light, g-C3N4 can be excited to generate electron-hole pairs. Cerium (Ce) has exciting catalytic characteristics because 4d and 5p electrons sufficiently defend the 4f orbitals. The photogenerated electrons in the conduction band of CeO2 tend to transfer and recombine with the photogenerated holes in the valence band of g-C3N4. Like this, the larger number of photogenerated electrons accumulated in the conduction band of g-C3N4 can reduce the adsorbed O2 to form more O2– ●. At the same time, the photogenerated holes left behind in the valence band of CeO2 can oxidize the adsorbed H2O to give OH●. But, the photocatalytic activity of the g-C3N4/CeO2 system would be significantly increased, leading to the decomposition of organic compounds by O2– ● and OH● reactive species.
In this study, a novel g-C3N4/CeO2 NCs as a photocatalys was examined during photocatalytic degradation process in the efficient removal of OFX from pharmaceutical industry wastewater plant, İzmir, Turkey. Different pH values (3.0, 4.0, 6.0, 7.0, 9.0 and 11.0), increasing OFX concentrations (5 mg/l, 10 mg/l, 20 mg/l and 40 mg/l), increasing g-C3N4/CeCO2 NCs concentrations (1 mg/l, 2 mg/l, 4 mg/l, 6 mg/l, 8 mg/l and 10 mg/l), different g-C3N4/CeO2 NCs mass ratios (5/5, 6/4, 7/3, 8/2, 9/1, 1/9, 2/8, 3/7 and 4/6), increasing recycle times (1., 2., 3., 4., 5., 6. and 7.) was operated during photocatalytic degradation process in the efficient removal of OFX in pharmaceutical industry wastewater. The characteristics of the synthesized NPs were XRD, FESEM, EDX, FTIR, TEM and DRS analyses, respectively. The acute toxicity assays were operated with Microtox (Aliivibrio fischeri also called Vibrio fischeri) and Daphnia magna acute toxicity tests. The photocatalytic degradation mechanisms of g-C3N4/CeO2 NCs and the reaction kinetics of OFX were evaluated in pharmaceutical industry wastewater during photocatalytic degradation process. ANOVA statistical analysis was used for all experimental samples.
Materıals and Methods
Characterization of Pharmaceutical Industry Wastewater
Characterization of the biological aerobic activated sludge proses from a pharmaceutical industry wastewater plant, İzmir, Turkey was performed. The results are given as the mean value of triplicate samplings (Table 1).
Table 1: Characterization of Pharmaceutical Industry Wastewater
|
Parameters
|
Unit
|
Concentrations
|
| Chemical oxygen demand-total (CODtotal) |
(mg/l) |
4000
|
| Chemical oxygen demand-dissolved (CODdissolved) |
(mg/l) |
3200
|
| Biological oxygen demand-5 days (BOD5) |
(mg/l) |
1500
|
| BOD5/CODdissolved |
|
0.5
|
| Total organic carbons (TOC) |
(mg/l) |
1800
|
| Dissolved organic carbons (DOC) |
(mg/l) |
1100
|
| pH |
|
8.3
|
| Salinity as Electrical conductivity (EC) |
(mS/cm) |
1552
|
| Total alkalinity as CaCO3 |
(mg/l) |
750
|
| Total volatile acids (TVA) |
(mg/l) |
380
|
| Turbidity (Nephelometric Turbidity unit, NTU) |
NTU |
7.2
|
| Color |
1/m |
50
|
| Total suspended solids (TSS) |
(mg/l) |
250
|
| Volatile suspended solids (VSS) |
(mg/l) |
187
|
| Total dissolved solids (TDS) |
(mg/l) |
825
|
| Nitride (NO2–) |
(mg/l) |
1.7
|
| Nitrate (NO3–) |
(mg/l) |
1.91
|
| Ammonium (NH4+) |
(mg/l) |
2.3
|
| Total Nitrogen (Total-N) |
(mg/l) |
3.2
|
| SO3-2 |
(mg/l) |
21.4
|
| SO4-2 |
(mg/l) |
29.3
|
| Chloride (Cl–) |
(mg/l) |
37.4
|
| Bicarbonate (HCO3–) |
(mg/l) |
161
|
| Phosphate (PO4-3) |
(mg/l) |
16
|
| Total Phosphorus (Total-P) |
(mg/l) |
40
|
| Total Phenols |
(mg/l) |
70
|
| Oil & Grease |
(mg/l) |
220
|
| Cobalt (Co+3) |
(mg/l) |
0.2
|
| Lead (Pb+2) |
(mg/l) |
0.4
|
| Potassium (K+) |
(mg/l) |
17
|
| Iron (Fe+2) |
(mg/l) |
0.42
|
| Chromium (Cr+2) |
(mg/l) |
0.44
|
| Mercury (Hg+2) |
(mg/l) |
0.35
|
| Zinc (Zn+2) |
(mg/l) |
0.11
|
Preparation of Graphitic Carbon Nitride (g-C3N4) Nanoparticles
g-C3N4 was prepared by calcination of melamine (C3H6N6) in a crucible with a lid at 550°C for 4 h. The obtained yellow powder was ground in an agate mortar after being cooled down to 25°C room temperature.
Preparation of Cerium Dioxide (CeO2) Nanoparticles
CeO2 NPs were prepared by sol–gel method. Nano-sized CeO2 was also prepared by the sol–gel procedure using Cerium nitrate hexahydrate [Ce(NO3)3.6H2O] and 20 ml of Triethanolamine (C6H15NO3). Then, they were mixed together by a magnetic stirrer on a hot plate to insure that the cerium salt was dissolved in C6H15NO3. After that the solution was heated up to 90°C until the clear dark brown homogenous solution, sol, was observed. To prepare black colloidal solution (gel), it was kept in a digital furnace at 270°C for 2 h. As gel was produced, it was cooled to 25°C room temperature. In order to form the expected precipitate, the volume of the gel solution was adjusted to 100 ml by adding ethanol (C₂H₆O). Then, synthesized precipitate was separated by centrifugation and washed by deionized water and C₂H₆O. Finally, the produced CeO2 NPs was dried at 90°C and calcinated.
Preparation of A Novel Graphitic Carbon Nitride/Cerium Dioxide (g-C3N4/CeO2) Nanocomposites
The g-C3N4/CeO2 NCs was synthesized by the hydrothermal-calcination method. Firstly, 1 gram g-C3N4 NPs was added into distilled water and magnetically stirred for 30 min. Then, the portions of prepared g-C3N4 NPs were added to the mixtures to obtain the mass ratios of g-C3N4 to CeO2 of 5/5, 6/4, 7/3, 8/2, 9/1, 1/9, 2/8, 3/7 and 4/6, respectively, and kept being stirred for another 1 h. The final mixtures were transferred into a 100 ml autoclave and reacted at 180°C for different hydrothermal (HT) times of 2 h, 4 h and 6 h. The final samples were centrifuged and washed with distilled water and C₂H₆O for 2 times. Then, the samples were dried, and finally, the dried products were heated in a Muffle furnace at different calcination temperatures of 300°C, 400°C and 500°C for 4 h to get the target composites. The synthesis conditions and the corresponding sample names were summarized at Table 2.
Table 2: The optimization parameters of g-C3N4/CeO2 NCs samples
|
Sample Name
|
Mass Ratios of g-C3N4/CeO2 NCs
|
Calcination Temperature (°C)
in 240 min
|
Hydrothermal Time (min) at 180°C
|
| HT-2h-Cal300 |
8/2
|
300°C
|
120
|
| HT-2h-Cal400 |
8/2
|
400°C
|
120
|
| HT-2h-Cal500 |
8/2
|
500°C
|
120
|
| HT-4h-Cal300 |
8/2
|
300°C
|
240
|
| HT-4h-Cal400 |
8/2
|
400°C
|
240
|
| HT-4h-Cal500 |
8/2
|
500°C
|
240
|
| HT-6h-Cal300 |
8/2
|
300°C
|
360
|
| HT-6h-Cal400 |
8/2
|
400°C
|
360
|
| HT-6h-Cal500 |
8/2
|
500°C
|
360
|
| 5/5 wt, g-C3N4/CeO2 |
5/5
|
500°C
|
360
|
| 6/4 wt, g-C3N4/CeO2 |
6/4
|
500°C
|
360
|
| 7/3 wt, g-C3N4/CeO2 |
7/3
|
500°C
|
360
|
| 8/2 wt, g-C3N4/CeO2 |
8/2
|
500°C
|
360
|
| 9/1 wt, g-C3N4/CeO2 |
9/1
|
500°C
|
360
|
| 1/9 wt, g-C3N4/CeO2 |
1/9
|
500°C
|
360
|
| 2/8 wt, g-C3N4/CeO2 |
2/8
|
500°C
|
360
|
| 3/7 wt, g-C3N4/CeO2 |
3/7
|
500°C
|
360
|
| 4/6 wt, g-C3N4/CeO2 |
4/6
|
500°C
|
360
|
Photocatalytic Degradation Reactor
A 2 liter cylinder quartz glass reactor was used for the photodegradation experiments in the pharmaceutical industry wastewater at different operational conditions. 1000 ml pharmaceutical industry wastewater was filled for experimental studies and the photocatalyst were added to the cylinder quartz glass reactors. The UV-A lamps were placed to the outside of the photo-reactor with a distance of 3 mm. The photocatalytic reactor was operated with constant stirring (1.5 rpm) during the photocatalytic degradation process. 10 ml of the reacting solution were sampled and centrifugated (at 10000 rpm) at different time intervals. The UV irradiation treatments were created using one or three UV-A lamp emitting in the 350–400 nm range (λmax = 368 nm; FWHM = 17 nm; Actinic BL TL-D 18W, Philips). Six 50 W UV-A lamps (Total: 300 W UV-A lamps) were used during experimental conditions for this study.
Characterization
X-Ray Diffraction Analysis
Powder XRD patterns were recorded on a Shimadzu XRD-7000, Japan diffractometer using Cu Kα radiation (λ = 1.5418 Å, 40 kV, 40 mA) at a scanning speed of 1°/min in the 10-80° 2θ range. Raman spectrum was collected with a Horiba Jobin Yvon-Labram HR UV-Visible NIR (200-1600 nm) Raman microscope spectrometer, using a laser with the wavelength of 512 nm. The spectrum was collected from 10 scans at a resolution of 2 /cm. The zeta potential was measured with a SurPASS Electrokinetic Analyzer (Austria) with a clamping cell at 300 mbar.
Field Emission Scanning Electron Microscopy (FESEM) and Energy Dispersive X-Ray (EDX) Spectroscopy Analysis
The morphological features and structure of the synthesized catalyst were investigated by FESEM (FESEM, Hitachi S-4700), equipped with an EDX spectrometry device (TESCAN Co., Model III MIRA) to investigate the composition of the elements present in the synthesized catalyst.
Fourier Transform Infrared Spectroscopy (FTIR) Analysis
The FTIR spectra of samples was recorded using the FT-NIR spectroscope (RAYLEIGH, WQF-510).
Transmission Electron Microscopy (TEM) Analysis
The structure of the samples were analysed TEM analysis. TEM analysis was recorded in a JEOL JEM 2100F, Japan under 200 kV accelerating voltage. Samples were prepared by applying one drop of the suspended material in ethanol onto a carbon-coated copper TEM grid, and allowing them to dry at 25°C room temperature.
Diffuse Reflectance UV-Vis Spectra (DRS) Analysis
DRS Analysis in the range of 200–800 nm were recorded on a Cary 5000 UV-Vis Spectrophotometer from Varian. DRS was used to monitor the OFX antibiotic concentration in experimental samples.
Analytical Procedures
Chemical oxygen demand-total (CODtotal), chemical oxygen demand-dissolved (CODdissolved), total phosphorus (Total-P), phosphate phosphorus (PO4-3-P), total nitrogen (Total-N), ammonium nitrogen (NH4+-N), nitrate nitrogen (NO3–-N), nitrite nitrogen (NO2–-N), biological oxygen demand 5-days (BOD5), pH, Temperature [(°C)], total suspended solids (TSS), total volatile suspended solids (TVSS), total organic carbon (TOC), Oil, Chloride (Cl–), total phenol, total volatile acids (TVA), disolved organic carbon (DOC), total alkalinity, turbidity, total dissolved solid (TDS), color, sulfide (SO3-2), sulfate (SO4-2), bicarbonate (HCO3–), salinity, cobalt (Co+3), lead (Pb+2), potassium (K+), iron (Fe+2), chromium (Cr+2), Mercury (Hg+2) and zinc (Zn+2) were measured according to the Standard Methods (2017) 5220B, 5220D, 4500-P, 4500-PO4-3, 4500-N, 4500-NH4+, 4500-NO3–, 4500-NO2–, 5210B, 4500-H+, 2320, 2540D, 2540E, 5310, 5520, 4500-Cl–, 5530, 5560B, 5310B, 2320, 2130, 2540E, 2120, 4500-SO3-2, 4500-SO4-2, 5320, 2520, 3500-Co+3, 3500-Pb+2, 3500-K+, 3500-Fe+2, 3500-Cr+2, 3500-Hg+2, 3500-Zn+2, respectively [158].
Total-N, NH4+-N, NO3–-N, NO2–-N, Total-P, PO4-3-P, total phenol, Co+3, Pb+2, K+, Fe+2, Cr+2, Hg+2, Zn+2, SO3-2, and SO4-2 were measured with cell test spectroquant kits (Merck, Germany) at a spectroquant NOVA 60 (Merck, Germany) spectrophotometer (2003).
The measurement of color was carried out following the methods described by Olthof and Eckenfelder [159] and Eckenfelder [160]. According these methods, the color content was determined by measuring the absorbance at three wavelengths (445 nm, 540 nm and 660 nm), and taking the sum of the absorbances at these wavelengths. In order to identify the color in pharmaceutical industry wastewater (25 ml) was acidified at pH=2.0 with a few drops of 6 N HCl and extracted three times with 25 ml of ethyl acetate. The pooled organic phases were dehydrated on sodium sulphate, filtered and dried under vacuum. The residue was sylilated with bis(trimethylsylil)trifluoroacetamide (BSTFA) in dimethylformamide and analyzed by gas chromatography–mass spectrometry (GC-MS) and gas chromatograph (GC) (Agilent Technology model 6890N) equipped with a mass selective detector (Agilent 5973 inert MSD). Mass spectra were recorded using a VGTS 250 spectrometer equipped with a capillary SE 52 column (HP5-MS 30 m, 0.25 mm ID, 0.25 μm) at 220°C with an isothermal program for 10 min. The initial oven temperature was kept at 50°C for 1 min, then raised to 220°C at 25°C/min and from 200 to 300°C at 8°C/min, and was then maintained for 5.5 min. High purity He (g) was used as the carrier gas at constant flow mode (1.5 ml/min, 45 cm/s linear velocity).
The total phenol was monitored as follows: 40 ml of pharmaceutical industry wastewater was acidified to pH=2.0 by the addition of concentrated HCl. Total phenol was then extracted with ethyl acetate. The organic phase was concentrated at 40°C to about 1 ml and silylized by the addition of N,O-bis(trimethylsilyl) acetamide (BSA). The resulting trimethylsilyl derivatives were analysed by GC-MS (Hewlett-Packard 6980/HP5973MSD).
Methyl tertiary butyl ether (MTBE) was used to extract oil from the water and NPs. GC-MS analysis was performed on an Agilent gas chromatography (GC) system. Oil concentration was measured using a UV–vis spectroscopy fluorescence spectroscopy and a GC–MS (Hewlett-Packard 6980/HP5973MSD). UV–vis absorbance was measured on a UV–vis spectrophotometer and oil concentration was calculated using a calibration plot which was obtained with known oil concentration samples.
Acute Toxicity Assays
Microtox Acute Toxicity Test
Toxicity to the bioluminescent organism Aliivibrio fischeri (also called Vibrio fischeri or V. fischeri) was assayed using the Microtox measuring system according to DIN 38412L34, L341, (EPS 1/ RM/24 1992). Microtox testing was performed according to the standard procedure recommended by the manufacturer [161]. A specific strain of the marine bacterium, V. fischeri-Microtox LCK 491 kit was used for the Microtox acute toxicity assay. Dr. LANGE LUMIX-mini type luminometer was used for the microtox toxicity assay [162].
Daphnia magna Acute Toxicity Test
To test toxicity, 24-h born Daphnia magna were used as described in Standard Methods sections 8711A, 8711B, 8711C, 8711D and 8711E, respectively [163]. After preparing the test solution, experiments were carried out using 5 or 10 Daphnia magna introduced into the test vessels. These vessels had 100 ml of effective volume at 7.0– 8.0 pH, providing a minimum dissolved oxygen (DO) concentration of 6 mg/l at an ambient temperature of 20–25°C. Young Daphnia magna were used in the test (≤24 h old); 24–48 h exposure is generally accepted as standard for a Daphnia magna acute toxicity test. The results were expressed as mortality percentage of the Daphnia magna. Immobile animals were reported as dead Daphnia magna.
Statistical Analysis
ANOVA analysis of variance between experimental data was performed to detect F and P values. The ANOVA test was used to test the differences between dependent and independent groups, [164]. Comparison between the actual variation of the experimental data averages and standard deviation is expressed in terms of F ratio. F is equal (found variation of the date averages/expected variation of the date averages). P reports the significance level, and d.f indicates the number of degrees of freedom. Regression analysis was applied to the experimental data in order to determine the regression coefficient R2, [165]. The aforementioned test was performed using Microsoft Excel Program.
All experiments were carried out three times and the results are given as the means of triplicate samplings. The data relevant to the individual pollutant parameters are given as the mean with standard deviation (SD) values.
Results and Dıscussıons
A Novel g-C3N4/CeO2 NCs Characteristics
The Results of X-Ray Diffraction (XRD) Analysis
The results of XRD analysis was observed to pure g-C3N4 NPs, pure CeO2 NPs and g-C3N4/CeO2 NCs, respectively, in pharmaceutical industry wastewater with photocatalytic degradation process for OFX antibiotic removal (Figure 1). The characterization peaks were observed at 2θ values of 14.21°, 20.12° and 28.24°, respectively, implying pure g-C3N4 NPs in pharmaceutical industry wastewater with photocatalytic degradation process for OFX antibiotic removal (Figure 1a). The characterization peaks were obtained at 2θ values of 29.41°, 34.22°, 48.45°, 57.62°, 59.27°, 70.18°, 77.17° and 79.31°, respectively, implying pure CeO2 NPs in pharmaceutical industry wastewater with photocatalytic degradation process for OFX antibiotic removal (Figure 1b). The characterization peaks were found at 2θ values of 13.20°, 28.72°, 33.67°, 48.15°, 58.39°, 60.16°, 71.17°, 75.35° and 79.53°, respectively, and which can also be indexed as (100), (002), (111), (200), (220), (311), (222), (400), (331) and (420), respectively, implying g-C3N4/CeO2 NCs in pharmaceutical industry wastewater with photocatalytic degradation process for OFX antibiotic removal (Figure 1c).
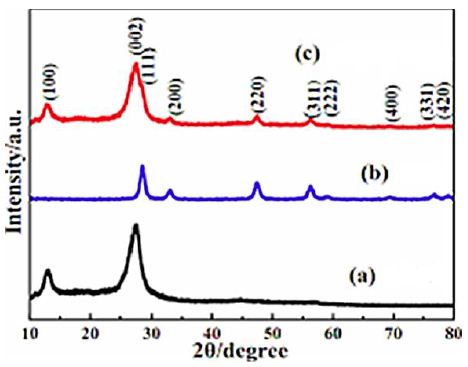
Figure 1: The XRD patterns of (a) pure g-C3N4 NPs (black pattern), (b) pure CeO2 NPs (blue pattern) and (c) g-C3N4/CeO2 NCs (red pattern), respectively, in pharmaceutical industry wastewater with photocatalytic degradation process for OFX antibiotic removal.
The Results of Diffuse Reflectance UV-Vis Spectra (DRS) Analysis
The absorption spectra of OFX was observed in DRS Analysis (Figure 2). First, the absorption spectra of OFX were obtained at a maximum concentration of 40 mg/l in the wavelength range from 250 nm to 800 nm using diffuse reflectance UV-Vis spectra (Figure 2). Absorption peaks were observed at wavelengths of 400 nm for pure g-C3N4 NPs (black pattern) (Figure 2a), 310 nm for pure CeO2 NPs (green pattern) (Figure 2b), and 340 nm for g-C3N4/CoMoO4 NCs (blue pattern) (Figure 2c), respectively, in pharmaceutical industry wastewater with photocatalytic degradation process for OFX antibiotic removal.
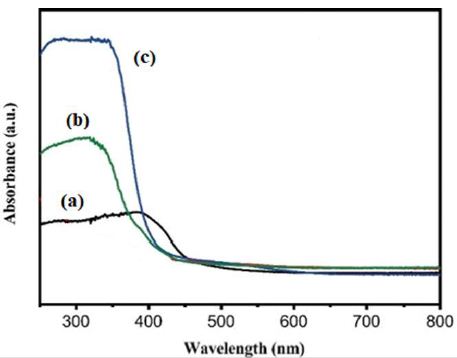
Figure 2: The DRS patterns of (a) pure g-C3N4 NPs (black pattern) (b) pure CeO2 NPs (green pattern) and (c) g-C3N4/CeO2 NCs (blue pattern), respectively, in pharmaceutical industry wastewater with photocatalytic degradation process for OFX antibiotic removal.
The Results of Field Emission Scanning Electron Microscopy (FESEM) Analysis
The morphological features of pure g-C3N4 NPs, pure CeO2 NPs and g-C3N4/CeO2 NCs were characterized through FE-SEM images (Figure 3). The FESEM images of pure g-C3N4 NPs were obtained in in pharmaceutical industry wastewater with photocatalytic degradation process for OFX antibiotic removal (Figure 3a). The FESEM images of pure CeO2 NPs were observed in pharmaceutical industry wastewater with photocatalytic degradation process for OFX antibiotic removal (Figure 3b). The FESEM images of g-C3N4/CeO2 NCs were characterized in pharmaceutical industry wastewater with photocatalytic degradation process for OFX antibiotic removal (Figure 3c).
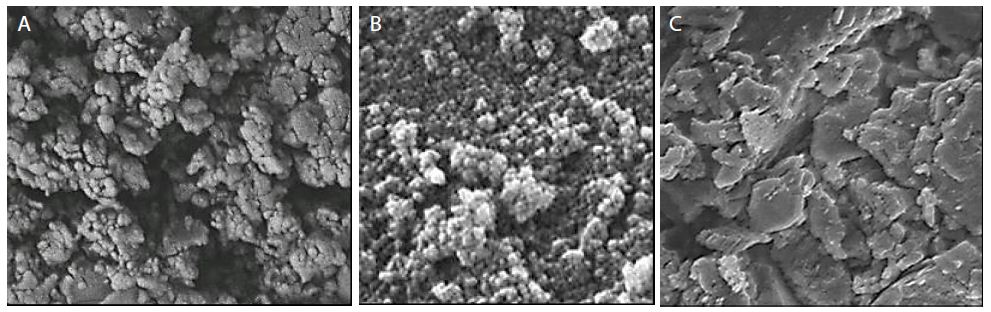
Figure 3: FESEM images of (a) pure g-C3N4 NPs, (b) pure CeO2 NPs and (c) g-C3N4/CeO2 NCs, respectively, in pharmaceutical industry wastewater with photocatalytic degradation process for OFX antibiotic removal.
The Results of Energy Dispersive X-Ray (EDX) Spectroscopy Analysis
The EDX analysis was also performed to investigate the composition of g-C3N4/CeO2 NCs (Figure 4), respectively, in pharmaceutical industry wastewater with photocatalytic degradation process for OFX antibiotic removal.
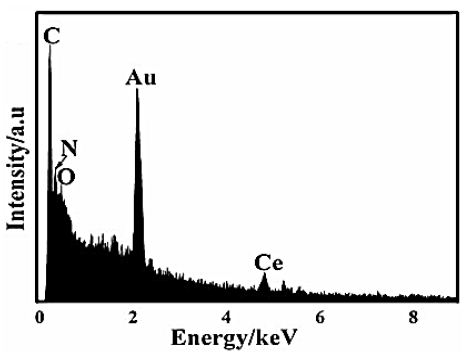
Figure 4: EDX spectrum of g-C3N4/CeO2 NCs, respectively, in pharmaceutical industry wastewater with photocatalytic degradation process for OFX antibiotic removal.
The Results of Fourier Transform Infrared Spectroscopy (FTIR) Analysis
The FTIR spectrum of pure g-C3N4 NPs (black spectrum), pure CeO2 NPs (blue spectrum) and g-C3N4/CeO2 NCs (red spectrum), respectively, in pharmaceutical industry wastewater with photocatalytic degradation process for OFX antibiotic removal (Figure 5). The main peaks of FTIR spectrum for pure g-C3N4 NPs (black spectrum) was observed at 1645 1/cm, 1564 1/cm, 1411 1/cm, 1321 1/cm, 1240 1/cm and 807 1/cm wavenumber, respectively (Figure 5a). The main peaks of FTIR spectrum for pure CeO2 NPs (blue spectrum) was obtained at 462 1/cm wavenumber, respectively (Figure 5b). The main peaks of FTIR spectrum for g-C3N4/CeO2 NCs (red spectrum) was determined at 462 1/cm wavenumber, respectively (Figure 5c).
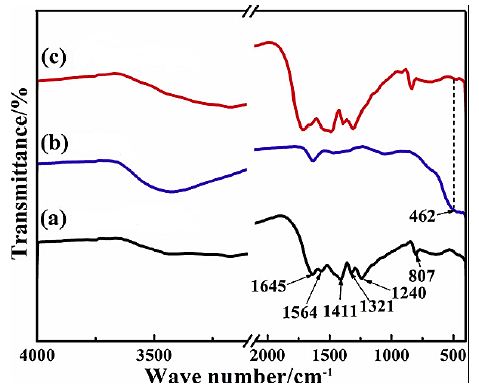
Figure 5: FTIR spectrum of (a) pure g-C3N4 NPs (black spectrum), (b) pure CeO2 NPs (blue spectrum) and (c) g-C3N4/CeO2 NCs (red spectrum), respectively, in pharmaceutical industry wastewater with photocatalytic degradation process for OFX antibiotic removal.
The Results of Transmission Electron Microscopy (TEM) Analysis
The TEM images of g-C3N4/CeO2 NCs was observed in micromorphological structure level in pharmaceutical industry wastewater with photocatalytic degradation process for OFX antibiotic removal (Figure 6).
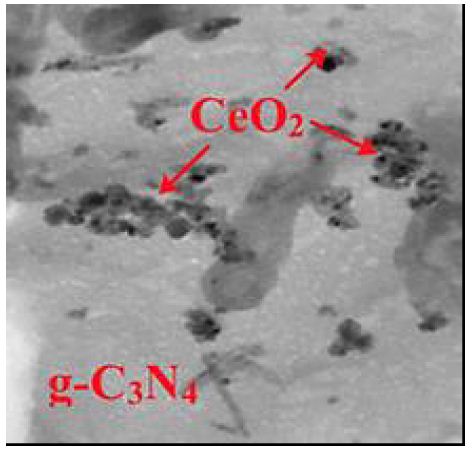
Figure 6: TEM images of g-C3N4/CeO2 NCs in micromorphological structure level in pharmaceutical industry wastewater with photocatalytic degradation process for OFX antibiotic removal.
The Reaction Kinetics of OFX Antibiotic
The reaction kinetics OFX were investigated using the Langmuir–Hinshelwood first-order kinetic model, expressed by Eddy et al. [166], as following Equation (1):
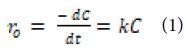
where; ro: denotes the initial photocatalytic degradation reaction rate (mg/l.min), and k: denotes the rate constant of a first-order reaction. At the beginning of the reaction, t = 0, Ct = C0, the equation can be obtained after integration as following Equation (2):
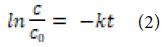
where; C0 and C : are the initial and final concentration (mg/l) of OFX; the solution at t (min) and k (1/min) are the rate constant.
The correlation coefficients had R2 values greater than 0.9, as a result, the first-order kinetic model fit the experimental data well. The first-order rate constants (k) were determined from the slope of the linear plots.
Photocatalytic Degradation Mechanisms
The photocatalytic performance of the catalyst in the degradation of OFX is determined by photons. The degradation mechanism of OFX by hydroxyl radicals (OH●) radicals concerning g-C3N4/CeO2 NCs as following equations (Equation 3, Equation 4, Equation 5, Equation 6, Equation 7, Equation 8, Equation 9 and Equation 10):
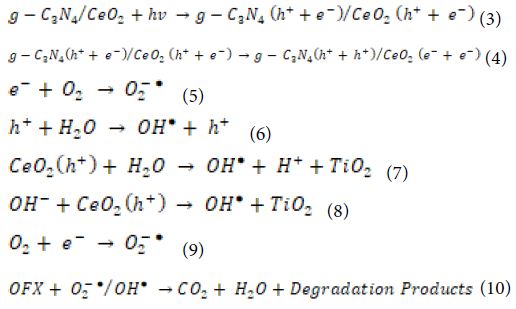
g-C3N4/CeO2 NCs absorbs photons with energies greater than the photocatalyst bandgap. As a result, the electron in the valence band (VB) jumps to the conduction band (CB), leaving a hole in the CB. The electrons present in the CB and VB will react with oxygen (O2) and water (H2O) molecules which are absorbed by the photocatalyst and lead to the formation of OH● radicals which react with OFX. OH● radicals are produced when the photocatalyst surface is illuminated with photons, and OH● radicals are strong oxidising species, with an oxidation potential of approximately 2.8 V [as opposed to Normal hydrogen electrode (NHE)], which may increase total pollutant mineralisation. Normally, the higher the rate of formation of OH● radicals, the greater the separation efficiency of electron-hole pairs. In this way, there is a correlation between the increased photocatalytic activity and the rate of formation of OH● radicals. The OH● radicals generation of g-C3N4/CeO2 NCs was extremely high, indicating that the sample has a high electron and hole separation rate.
CeO2 composites with g-C3N4 are also promising photocatalytic materials with a lower band gap energy [167-169] and significantly higher photocatalytic efficiency in degradation processes [170,171]. Considering the position of CB and VB in CeO2 and g-C3N4, the higher photocatalytic efficiency can be attributed to the transfer of photoexcited electrons and holes between CeO2 and g-C3N4, which suppresses the recombination of photogenerated h+/e − pairs. During irradiation, photogenerated electrons on CB in g-C3N4 are transferred to CB in CeO2 and react with O2, while photogenerated holes on VB in CeO2 are transferred to VB in g-C3N4 and react with H2O according to the following reactions [172]:
The superoxide and hydroxyl radicals formed in the above-presented reactions take part in the degradation of pollutants. In the case of CeO2 composites with g-C3N4, two problems have still not been resolved. The first one is related to the lower rates of TOC or COD decrease in wastewater in comparison with the degradation rate of pollutants [173]. The second one is attributed to the immobilization of a composite photocatalyst, which could eliminate the post-treatment process of photocatalyst removal from the wastewater.
Effect of Increasing pH values for OFX Removal in Pharmaceutical Industry Wastewater during Photocatalytic Degradation Process
Increasing pH values (pH=3.0, pH=4.0, pH=6.0, pH=7.0, pH=9.0 and pH=11.0, respectively) was examined during photocatalytic degradation process in pharmaceutical industry wastewater for OFX removal (Figure 7). 67.2%, 85.7%, 96.4%, 56.5% and 44.8% OFX removal efficiencies was measured at pH=3.0, pH=4.0, pH=6.0, pH=7.0 and pH=11.0, respectively, at 300 W UV-vis light irradiation power, after 180 min photocatalytic degradation time, at 25°C (Figure 7). The maximum 99% OFX removal efficiency was obtained during photocatalytic degradation process in pharmaceutical industry wastewater, at 300 W UV-vis light irradiation power, after 180 min photocatalytic degradation time, at pH=6.0 and at 25°C, respectively (Figure 7).
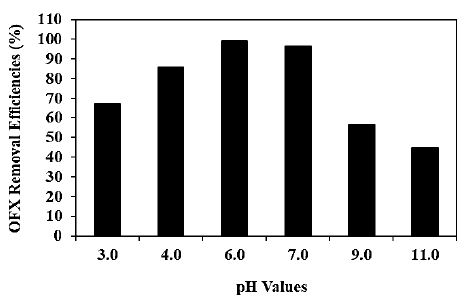
Figure 7: Effect of increasing pH values for OFX removal in pharmaceutical industry wastewater during photocatalytic degradation process, at 300 W UV-vis light irradiation power, after 180 min photocatalytic degradation time, at pH=6.0 and at 25°C, respectively.
Effect of Increasing OFX Concentrations for OFX Removal in Pharmaceutical Industry Wastewater during Photocatalytic Degradation Process
Increasing OFX concentrations (5 mg/l, 10 mg/l, 20 mg/l and 40 mg/l) were operated at 300 W UV-vis irradiation power, after 180 min photocatalytic degradation time, at pH=6.0, at 25°C, respectively (Figure 8). 85.3%, 94.1% and 77.2% OFX removal efficiencies were obtained to 5 mg/l, 10 mg/l and 40 mg/l OFX concentrations, respectively, at pH=6.0 and at 25°C (Figure 8). The maximum 99% OFX removal efficieny was found with photocatalytic degradation process in pharmaceutical industry wastewater, at 20 mg/l OFX, at 300 W UV-vis light irradiation power, after 180 min photocatalytic degradation time, at pH=6.0 and at 25°C, respectively (Figure 8).
The percentage decrease (8%) in the concentration of OFX during the studies under the dark conditions was due to the contaminant adsorption onto the catalyst surface [174]. The formation of contaminant monolayer on the surface of the catalyst may have occupied all its active sites, and therefore no more adsorption was observed.
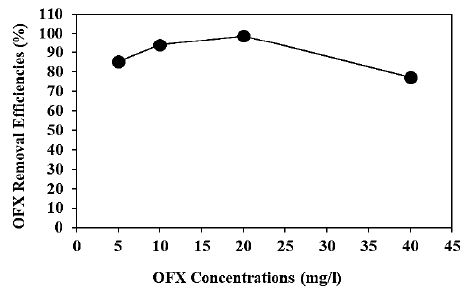
Figure 8: Effect of increasing OFX concentrations for OFX removal in pharmaceutical industry wastewater during photocatalytic degradation process, at 300 W UV-vis light irradiation power, after 180 min photocatalytic degradation time, at pH=6.0 and at 25°C, respectively.
Effect of Increasing g-C3N4/CeO2 NCs Concentrations for OFX Removals in Pharmaceutical Industry Wastewater during Photocatalytic Degradation Process
Increasing g-C3N4/CeO2 NCs concentrations (1 mg/l, 2 mg/l, 4 mg/l, 6 mg/l, 8 mg/l and 10 mg/l) were operated at 20 mg/l OFX, at 150 W UV-vis light irradiation power, after 180 min photocatalytic degradation time, at pH=6.0, at 25°C, respectively (Figure 9). 54.5%, 68.1%, 75.8%, 87.3% and 92.1% OFX removal efficiencies were obtained to 1 mg/l, 2 mg/l, 4 mg/l, 6 mg/l and 10 mg/l g-C3N4/CeO2 NCs concentrations, respectively, at 20 mg/l OFX, at 300 W UV-vis light irradiation power, after 180 min photocatalytic degradation time, at pH=6.0, at 25°C, respectively (Figure 9). The maximum 99% OFX removal efficieny was measured to 8 mg/l g-C3N4/CeO2 NCs with photocatalytic degradation process in pharmaceutical industry wastewater, at 20 mg/l OFX, at 300 W UV-vis light irradiation power, after 180 min photocatalytic degradation time, at pH=6.0 and at 25°C, respectively (Figure 9).
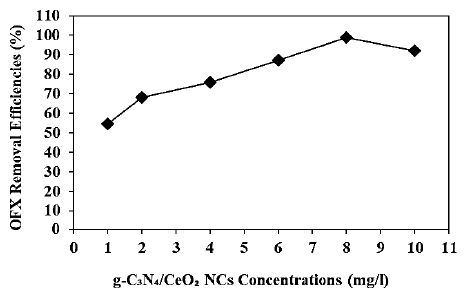
Figure 9: Effect of increasing g-C3N4/CeO2 NCs concentrations for OFX removal in pharmaceutical industry wastewater during photocatalytic degradation process, at 20 mg/l OFX, at 300 W UV-vis light irradiation power, after 180 min photocatalytic degradation time, at pH=6.0 and at 25°C, respectively.
Effect of Different g-C3N4/CeO2 NCs Mass Ratios for OFX Removals in Pharmaceutical Industry Wastewater during Photocatalytic Degradation Process
Different g-C3N4/CeO2 mass ratios (5/5wt, 6/4wt, 7/3wt, 8/2wt, 9/1wt, 1/9wt, 2/8wt, 3/7wt and 4/6wt, respectively) were examined for OFX removal in pharmaceutical industry wastewater during photocatalytic degradation process, at 20 mg/l OFX, at 300 W UV-vis light irradiation power, after 180 min photocatalytic degradation time, at pH=6.0 and at 25°C, respectively (Figure 10). 80.3%, 84.6%, 77.9%, 62.1%, 48.4%, 55.2%, 64.0% and 79.7% OFX removal efficiencies were measured at 5/5wt, 6/4 wt, 7/3wt, 8/2wt, 9/1wt, 1/9wt, 3/7wt and 4/6wt g-C3N4/CeO2 NCs mass ratios, respectively, at 20 mg/l OFX after 180 min photocatalytic degradation time, at pH=6.0 and at 25°C, respectively (Figure 10). The maximum 99% OFX removal efficiency was measured at 2/8wt g-C3N4/CeO2 NCs mass ratios at 20 mg/l OFX, at 300 W UV-vis light irradiation power, after 180 min photocatalytic degradation time, at pH=6.0 and at 25°C, respectively (Figure 10).
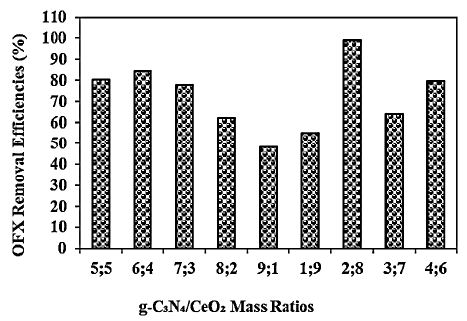
Figure 10: Effect of different g-C3N4/CeO2 NCs mass ratios for OFX removal in pharmaceutical industry wastewater during photocatalytic degradation process, at 20 mg/l OFX, at 300 W UV-vis light irradiation power, after 180 min photocatalytic degradation time, at pH=6.0 and at 25°C, respectively.
Effect of Different Recycle Times for OFX Removals in Pharmaceutical Industry Wastewater during Photocatalytic Degradation Process
Different recycle times (1., 2., 3., 4., 5., 6. and 7.) were operated for OFX removals in pharmaceutical industry wastewater during photocatalytic degradation process, at 20 mg/l OFX, 8 mg/l g-C3N4/CeO2 NCs, at 2/8wt g-C3N4/CeO2 NCs mass ratio, after 180 min photocatalytic degradation time, at pH=6.0 and at 25°C, respectively (Figure 11). 97.5%, 96.2%, 94%, 93.8%, 89.2%, 86.2% and 80.1% OFX removal efficiencies were measured after 2. recycle time, 3. recycle time, 4. recycle time, 5. recycle time, 6. recycle time and 7. recycle time, respectively, at 20 mg/l OFX, 8 mg/l g-C3N4/CeO2 NCs, at 2/8wt g-C3N4/CeO2 NCs mass ratio, after 180 min photocatalytic degradation time, at pH=6.0 and at 25°C, respectively (Figure 11). The maximum 99% OFX removal efficiency was measured in pharmaceutical industry wastewater during photocatalytic degradation process, after 1. recycle time, at 20 mg/l OFX, 8 mg/l g-C3N4/CeO2 NCs, at 2/8wt g-C3N4/CeO2 NCs mass ratio, after 180 min photocatalytic degradation time, at pH=6.0 and at 25°C, respectively (Figure 11).
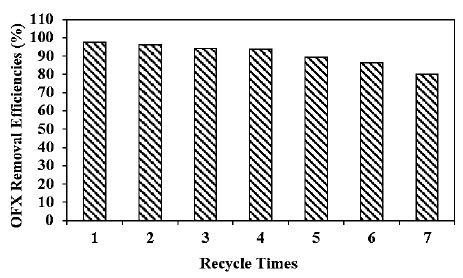
Figure 11: Effect of recycle times for OFX removal in pharmaceutical industry wastewater during photocatalytic degradation process, at 20 mg/l OFX, 8 mg/l g-C3N4/CeO2 NCs, at 2/8wt g-C3N4/CeO2 NCs mass ratio, at 300 W UV-vis light irradiation power, after 180 min photocatalytic degradation time, at pH=6.0 and at 25°C, respectively.
Acute Toxicity Assays
Effect of Increasing OFX Concentrations on the Microtox (Aliivibrio fischeri or Vibrio fischeri) Acute Toxicity Removal Efficiencies in Pharmaceutical Industry Wastewater at Increasing Photocatalytic Degradation Time and Temperature
In Microtox with Aliivibrio fischeri (also called Vibrio fischeri) acute toxicity test, the initial EC90 values at pH=7.0 was found as 825 mg/l at 25°C (Table 3: SET 1). After 60 min, 120 min and 180 min photocatalytic degradation time, the EC90 values decreased to EC57=414 mg/l to EC22=236 mg/l and to EC12=165 mg/l in OFX=20 mg/l at 30°C (Table 3: SET 3). The Microtox (Aliivibrio fischeri) acute toxicity removal efficiencies were 40.86%, 79.75% and 90.86% after 60 min, 120 min and 180 min, respectively, in OFX=20 mg/l and at 30°C (Table 3: SET 3).
The EC90 values decreased to EC51, to EC16 and to EC6 after 60 min, 120 min and 180 min, respectively, in OFX=20 mg/l, at 60°C (Table 3: SET 3). The EC51, the EC11 and the EC7 values were measured as 550 mg/l, 540 mg/l and 500 mg/l, respectively, in OFX=20 mg/l at 60°C. The toxicity removal efficiencies were 46.41%, 85.30% and 96.41% after 60 min, 120 min and 180 min, respectively, in OFX=20 mg/l, at 60°C (Table 3: SET 3). 96.41% maximum Microtox (Aliivibrio fischeri) acute toxicity removal yield was found in OFX=20 mg/l after 180 min and at 60°C (Table 3: SET 3).
The EC90 values decreased to EC62=422 mg/l to EC21=241 mg/l and to EC17=168 mg/l after 60 min, 120 min and 180 min, respectively, in OFX=5 mg/l at 30°C (Table 3: SET 3). The EC90 values decreased to EC62=421 mg/l to EC27=239 mg/l and to EC11=167 mg/l after 60 min, 120 min and 180 min, respectively, in OFX=10 mg/l at 30°C. The EC90 values decreased to EC67=408 mg/l to EC32=230 mg/l and to EC22=162 mg/l after 60 min, 120 min and 180 min, respectively, in OFX=40 mg/l at 30°C. The Microtox (Aliivibrio fischeri or Vibrio fischeri) acute toxicity removals were 85.30%, 85.28% and 79.75% in 5 mg/l, 10 mg/l and 40 mg/l OFX, respectively, after 180 min, at 30°C. It was obtained an inhibition effect of OFX=40 mg/l to Vibrio fischeri after 180 min and at 30°C (Table 3: SET 3).
The EC90 values decreased to EC57=419 mg/l to EC22=266 mg/l and to EC12=150 mg/l after 60 min, 120 min and 180 min, respectively, in OFX=5 mg/l at 60°C (Table 3: SET 3). The EC90 values decreased to EC57=414 mg/l to EC22=232 mg/l and to EC12=161 mg/l after 60 min, 120 and 180 min, respectively, in OFX=10 mg/l at 60°C. The EC90 values decreased to EC62=403 mg/l to EC27=218 mg/l and to EC17=148 mg/l after 60 min, 120 and 180 min, respectively, in OFX=40 mg/l at 60°C. The Microtox (Aliivibrio fischeri or Vibrio fischeri) acute toxicity removals were 90.86%, 90.83% and 85.30% in 5 mg/l, 10 mg/l and 40 mg/l OFX, respectively, after 180 min, at 60°C. It was observed an inhibition effect of OFX=40 mg/l to Microtox with Vibrio fischeri after 180 min, and at 60°C (Table 3: SET 3).
Table 3: Effect of increasing OFX concentrations on Microtox (Aliivibrio fischeri) acute toxicity in pharmaceutical industry wastewater after photocatalytic degradation process, at 30°C and at 60°C, respectively.
|
No
|
Parameters
|
Microtox (Aliivibrio fischeri) Acute Toxicity Values, * EC (mg/l)
|
|
25°C
|
|
0 min
|
60 min
|
120 min
|
180 min
|
|
*EC90
|
*EC
|
*EC
|
*EC
|
| 1 |
Raw ww, Control |
825
|
EC70=510
|
EC60=650
|
EC49=638
|
|
|
30°C
|
60°C
|
|
0. min
|
60 min
|
120. min
|
180. min
|
0 min
|
60 min
|
120 min
|
180 min
|
|
*EC90
|
*EC
|
*EC
|
*EC
|
*EC90
|
*EC
|
*EC
|
*EC
|
| 2 |
Raw ww, control |
825
|
EC70=580
|
EC50=580
|
EC39=548
|
825
|
EC55=550
|
EC40=590
|
EC29=688
|
|
| 3 |
OFX=5 mg/l |
825
|
EC62=422
|
EC27=242
|
EC17=168
|
825
|
EC57=419
|
EC22=266
|
EC12=150
|
|
OFX=10 mg/l |
825
|
EC62=421
|
EC27=239
|
EC17=167
|
825
|
EC57=414
|
EC22=232
|
EC12=161
|
|
OFX=20 mg/l |
825
|
EC57=414
|
EC22=236
|
EC12=165
|
825
|
EC52=550
|
EC17=540
|
EC7=500
|
|
OFX=40 mg/l |
825
|
EC67=408
|
EC32=230
|
EC22=162
|
825
|
EC62=403
|
EC27=218
|
EC17=148
|
| * EC values were calculated based on CODdis (mg/l). |
Effect of Increasing OFX Concentrations on the Daphnia magna Acute Toxicity Removal Efficiencies in Pharmaceutical Industry Wastewater at Increasing Photocatalytic Degradation Time and Temperature
The initial EC50 values were observed as 850 mg/l at 25°C (Table 4: SET 1). After 60 min, 120 and 180 min photocatalytic degradation time, the EC50 values decreased to EC31=350 mg/l to EC17=240 mg/l and to EC12=90 mg/l in OFX=20 mg/l, at 30°C (Table 4: SET 3). The toxicity removal efficiencies were 42.96%, 72.87% and 82.65% after 60 min, 120 min and 180 min, respectively, in OFX=20 mg/l at 30°C (Table 4: SET 3).
The EC50 values decreased to EC27 to EC12 and to EC7 after 60 min, 120 min and 180 min, respectively, in OFX=20 mg/l at 60°C (Table 4: SET 3). The EC27, the EC12 and the EC7 values were measured as 150 mg/l, 60 mg/l and 375 mg/l, respectively, in OFX=20 mg/l at 60°C. The toxicity removal efficiencies were 52.94%, 82.62% and 92.36% after 60 min, 120 min and 180 min, respectively, in OFX=20 mg/l at 60°C (Table 4: SET 3). 92.38% maximum Daphnia magna acute toxicity removal was obtained in OFX=20 mg/l after 180 min and at 60°C, respectively (Table 4: SET 3).
The EC50 values decreased to EC37=450 mg/l to EC22=145 mg/l and to EC17=260 mg/l after 60 min, 120 min and 180 min, respectively, in OFX=5 mg/l at 30°C (Table 4: SET 3). The EC50 values decreased to EC37=450 mg/l to EC22=175 mg/l and to EC17=100 mg/l after 60 min, 120 min and 180 min, respectively, in OFX=10 mg/l and at 30°C. The EC50 values decreased to EC42=300 mg/l to EC27=170 mg/l and to EC22=52 mg/l after 60 min, 120 min and 180 min, respectively, in OFX=40 mg/l and at 30°C. The Daphnia magna acute toxicity removals were 72.22%, 72.56% and 63.21% in 5 mg/l, 10 mg/l and 40 mg/l OFX, respectively, after 180 min and at 30°C. It was observed an inhibition effect of OFX=40 mg/l to Daphnia magna after 180 min and at 30°C (Table 4: SET 3).
The EC50 values decreased to EC32=130 mg/l to EC17=425 mg/l and to EC12=340 mg/l after 60 min, 120 min and 180 min, respectively, in OFX=5 mg/l and at 60°C (Table 4: SET 3). The EC50 values decreased to EC32=425 mg/l to EC17=140 mg/l and to EC7=90 mg/l after 60 min, 120 min and 180 min, respectively, in OFX=10 mg/l and at 60°C. The EC50 values decreased to EC37=250 mg/l to EC22=110 mg/l and to EC17=10 mg/l after 60 min, 120 min and 180 min, respectively, in OFX=40 mg/l and at 60°C. The Daphnia magna acute toxicity removals were 83.06%, 92.65% and 73.11% in 5 mg/l, 10 mg/l and 40 mg/l OFX, respectively, after 180 min and at 60°C. It was observed an inhibition effect of OFX=40 mg/l to Daphnia magna after 180 min and at 60°C (Table 4: SET 3).
Increasing the OFX concentrations from 5 mg/l to 40 mg/l did not have a positive effect on the decrease of EC50 values as shown in Table 4 at SET 3. OFX concentrations > 20 mg/l decreased the acute toxicity removals by hindering the photocatalytic degradation process. Similarly, a significant contribution of increasing OFX concentration to acute toxicity removal at 60°C after 180 min of photocatalytic degradation time was not observed. Low toxicity removals found at high OFX concentrations could be attributed to their detrimental effect on the Daphnia magna (Table 4: SET 3).
Table 4: Effect of increasing OFX concentrations on Daphnia magna acute toxicity in pharmaceutical industry wastewater after photocatalytic degradation process, at 30°C and at 60°C.
|
No
|
Parameters
|
Daphnia magna Acute Toxicity Values, * EC (mg/l)
|
|
25°C
|
|
0. min
|
60. min
|
120. min
|
180. min
|
|
*EC50
|
*EC
|
*EC
|
*EC
|
| 1 |
Raw ww, control |
850
|
EC45=625
|
EC40=370
|
EC29=153
|
|
|
30°C
|
60°C
|
|
0 min
|
60 min
|
120 min
|
180. min
|
0. min
|
60. min
|
120. min
|
180. min
|
|
*EC50
|
*EC
|
*EC
|
*EC
|
*EC50
|
*EC
|
*EC
|
*EC
|
| 2 |
Raw ww, control |
850
|
EC39=468
|
EC34=228
|
EC23=111
|
850
|
EC34=373
|
EC29=210
|
EC18=71
|
|
| 3 |
OFX=5 mg/l |
850
|
EC32=450
|
EC22=145
|
EC17=260
|
850
|
EC32=130
|
EC17=425
|
EC12=340
|
|
OFX=10 mg/l |
850
|
EC37=450
|
EC22=175
|
EC17=100
|
850
|
EC32=425
|
EC17=140
|
EC7=90
|
|
OFX=20 mg/l |
850
|
EC32=350
|
EC17=240
|
EC12=90
|
850
|
EC27=150
|
EC12=60
|
EC7=375
|
|
OFX=40 mg/l |
850
|
EC42=300
|
EC27=170
|
EC22=52
|
850
|
EC37=250
|
EC22=110
|
EC17=11
|
| * EC values were calculated based on CODdis (mg/l). |
Direct Effects of OFX Concentrations on the Acute Toxicity of Microtox (Aliivibrio fischeri or Vibrio fischeri) and Daphnia magna without Pharmaceutical Industry Wastewater after Photocatalytic Degradation Process
The acute toxicity test was performed in the samples containing 5 mg/l, 10 mg/l, 20 mg/l and 40 mg/l OFX concentrations, at 25°C room temperature. In order to detect the direct responses of Microtox (Aliivibrio fischeri or Vibrio fischeri) and Daphnia magna to the increasing OFX concentrations the toxicity test were performed without pharmaceutical industry wastewater after photocatalytic degradation process, at 25°C room temperature. The initial EC values and the the EC50 values were measured in the samples containing increasing OFX concentrations after 180 min photocatalytic degradation time. Table 5 showed the responses of Microtox (Aliivibrio fischeri or Vibrio fischeri) and Daphnia magna to increasing OFX concentrations.
The acute toxicity originating only from 5 mg/l, 10 mg/l, 20 mg/l and 40 mg/l OFX were found to be low (Table 5). 5 mg/l OFX did not exhibited toxicity to Aliivibrio fischeri (or Vibrio fischeri) and Daphnia magna before and after 180 min photocatalytic degradation time. The toxicity atributed to the 10 mg/l, 20 mg/l and 40 mg/l OFX were found to be low in the samples without pharmaceutical industry wastewater after photocatalytic degradation process for the test organisms mentioned above. The acute toxicity originated from the OFX decreased significantly to EC2, EC4 and EC6 after 180 min photocatalytic degradation time. Therefore, it can be concluded that the toxicity originating from the OFX is not significant and the real acute toxicity throughout photocatalytic degradation process was attributed to the pharmaceutical industry wastewater, to their metabolites and to the photocatalytic degradation by-products (Table 5).
Table 5: The responses of Microtox (Aliivibrio fischeri or Vibrio fischeri) and Daphnia magna acute toxicity tests in addition of increasing OFX concentrations without phamaceutical industry wastewater during photocatalytic degradation process after 180 min photocatalytic degradation time, at 25°C room temperature.
|
OFX Conc. (mg/l)
|
Microtox (Aliivibrio fischeri or Vibrio fischeri)
Acute Toxicity Test
|
Daphnia magna
Acute Toxicity Test
|
|
Initial Acute Toxicity EC50 Value (mg/l)
|
Inhibitions after 180 min photocatalytic degradation time
|
EC Values (mg/l)
|
Initial Acute Toxicity EC50 Value (mg/l)
|
Inhibitions after 180 min photocatalytic degradation time
|
EC Values (mg/l)
|
|
5
|
EC10=24
|
–
|
–
|
EC10=39
|
–
|
–
|
|
10
|
EC15=79
|
3
|
EC2=3
|
EC20=99
|
5
|
EC3=5
|
|
20
|
EC20=149
|
5
|
EC4=6
|
EC30=199
|
6
|
EC6=11
|
|
40
|
EC25=219
|
7
|
EC6=9
|
EC40=299
|
9
|
EC8=15
|
The Comparison with Other Scientific Studies in the Literature
Comparison of our study “The use of a novel graphitic carbon nitride/cerium dioxide (g-C3N4/CeO2) nanocomposites for the ofloxacin removal by photocatalytic degradation in pharmaceutical industry wastewaters and the evaluation of microtox (Aliivibrio fischeri) and Daphnia magna acute toxicity assays” with other scientific studies in the literature is summaried at Table 6 [175-182].
Table 6: The Comparison with other Scientific Studies in the Literature
|
Photocatalyst
|
Experimental Conditions (for maximum removal efficiencies)
|
Experimental Results
|
References
|
| a-Bi2O3/g-C3N4 |
[DOX]=10 mg/l, [Material]=500 mg/l, [H2O2]=10 mM, Unadjusted pH, Xe lamp (150 W). |
79.1% DOX (30 min) |
(Liu et al., 2021a) |
|
| Ag/AgCl@ZIF-8/g-C3N4 |
150 W, Xe, λ > 420 nm, 50 mg/l, [LVFX]=10 mg/l, V=50 ml, |
87.3% LVFX (60 min) |
(Zhou et al., 2019) |
|
| Ag@ZIF-8/g-C3N4 |
300 W, Xe, λ > 420 nm, [Ten antibiotics] =10 mg/l, V=50 ml |
90% (60 min) |
(Guo et al., 2022) |
|
| Peroxymonosulfate/ZnFe2O4 |
Waters e2695 HPLC instrument (Milford, USA), UV-Vis detector λ=294 nm [OFX]=1000 mg/l, pH=6.0 |
80.9% OFX (30 min), pH 6.0 |
(Sun et al., 2021b) |
|
| Bi2WO6 and g-C3N4 nanosheets |
[CRO]=16.5-66 µM, KrCl excilamp, λ=222 nm, 23 W, incident irradiance 0.74 mW/cm2, 60 min |
91% Ceftriaxone (60 min) |
(Sizykh et al., 2023) |
|
| Bi2WO6/g-C3N4 |
[CRO]=100 mg/l 300 W Xe lamp, |
94.5% Ceftriaxone (120 min) |
(Zhao et al., 2018) |
|
| CeO2-ZnO hetero photocatalyst |
[TCN]=100 mg/l, 300 W Xenon lamp, |
87.25% Tetracycline (60 min) |
(Ye et al., 2016) |
|
| g-C3N4/CeO2 core-shell structure |
Hydrothermal method, [DOX]=1000 mg/l, HCl=10 mg/l, H2O2=100 µl, 150 W Xe lamp (λ > 400 nm), g-C3N4=2.82 eV, CeO2=2.76 eV |
66.7%g-C3N4, 71.7%CeO2,
84% g-C3N4/CeO2 (60 min) |
(Liu et al., 2019) |
|
| CeO2/ATP/g-C3N4 ATP—attapulgite |
Electrostatic-induced self-assembly method, Dibenzothiophene (DBT), m(catal)/m(DBT)=1/10, SO₂=200 mg/l, 30% H2O2, 300 W Xe lamp (λ > 420 nm) |
Desulfurization 42% g-C3N4,
83% CeO2/g-C3N4, 98% CeO2/ATP/g-C3N4 (180 min) |
(Li et al., 2017b) |
|
| g-C3N4/CeO2 NCs |
g-C3N4/CeO2 NCs was prepared to hydrothermal calcination method, CeO2 was prepared sol-gel method, g-C3N4 was prepared to calcination method, pH=6.0,
[OFX]=20 mg/l,
[g-C3N4/CeO2 NCs]=8 mg/l, g-C3N4/CeO2 mass ratio=2/8,
300 W UV-vis A lamp λ=350-400 nm range (λmax=368 nm; FWHM=17 nm; Actinic BL TL-D 18W, Philips)
Recycle time=7, at 25°C Microtox (Aliivibrio fischeri) and Daphnia magna acute toxicity assays |
99% OFX (180 min, at 25°C)
96.41% maximum Microtox (Aliivibrio fischeri) acute toxicity removal (180 min, at 60°C)
92.38% maximum Daphnia magna acute toxicity removal (180 min, at 60°C),
99% OFX after 1. recycle time |
This study |
| DOX: doxycycline; LVFX: Levofloxacin; CRO: ceftriaxone; TCN: Tetracycline; OFX: ofloxacin |
Conclusıons
The maximum 99% OFX removal efficiency was obtained during photocatalytic degradation process in pharmaceutical industry wastewater, at 300 W UV-vis light irradiation power, after 180 min photocatalytic degradation time, at pH=6.0 and at 25°C, respectively.
The maximum 99% OFX removal efficieny was found with photocatalytic degradation process in pharmaceutical industry wastewater, at 20 mg/l OFX, at 300 W UV-vis light irradiation power, after 180 min photocatalytic degradation time, at pH=6.0 and at 25°C, respectively.
The maximum 99% OFX removal efficieny was measured to 8 mg/l g-C3N4/CeO2 NCs with photocatalytic degradation process in pharmaceutical industry wastewater, at 20 mg/l OFX, at 300 W UV-vis light irradiation power, after 180 min photocatalytic degradation time, at pH=6.0 and at 25°C, respectively.
The maximum 99% OFX removal efficiency was measured at 2/8wt g-C3N4/CeO2 NCs mass ratios at 20 mg/l OFX, at 300 W UV-vis light irradiation power, after 180 min photocatalytic degradation time, at pH=6.0 and at 25°C, respectively.
The maximum 99% OFX removal efficiency was measured in pharmaceutical industry wastewater during photocatalytic degradation process, after 1. recycle time, at 20 mg/l OFX, 8 mg/l g-C3N4/CeO2 NCs, at 2/8wt g-C3N4/CeO2 NCs mass ratio, after 180 min photocatalytic degradation time, at pH=6.0 and at 25°C, respectively.
96.41% maximum Microtox (Aliivibrio fischeri) acute toxicity removal yield was found in OFX=20 mg/l after 180 min and at 60°C. It was observed an inhibition effect of OFX=40 mg/l to Microtox with Vibrio fischeri after 180 min photocatalytic degradation time and at 60°C. 92.38% maximum Daphnia magna acute toxicity removal was obtained in OFX=20 mg/l after 180 min photocatalytic degradation time and at 60°C, respectively. It was observed an inhibition effect of OFX=40 mg/l to Daphnia magna after 180 min photocatalytic degradation time and at 60°C. OFX concentrations > 20 mg/l decreased the acute toxicity removals by hindering the photocatalytic degradation process. Similarly, a significant contribution of increasing OFX concentrations to acute toxicity removal at 60°C after 180 min photocatalytic degradation time was not observed. Finally, it can be concluded that the toxicity originating from the OFX is not significant and the real acute toxicity throughout photocatalytic degradation process was attributed to the pharmaceutical industry wastewater, to their metabolites and to the photocatalytic degradation process by-products.
As a result, the a novel g-C3N4/CeO2 NCs photocatalyst during photocatalytic degradation process in pharmaceutical industry wastewater was stable in harsh environments such as acidic, alkaline, saline, and then was still effective process. When the amount of contaminant was increased, the a novel g-C3N4/CeO2 NCs photocatalys during photocatalytic degradation process performance was still considerable. The synthesis and optimization of g-C3N4/CeO2 heterostructure photocatalyst provides insights into the effects of preparation conditions on the material’s characteristics and performance, as well as the application of the effectively designed photocatalyst in the removal of antibiotics, which can potentially be deployed for purifying wastewater, especially pharmaceutical wastewater. Finally, the combination of a simple, easy operation preparation process, excellent performance and cost effective, makes this a novel g-C3N4/CeO2 NCs a promising option during photocatalytic degradation process in pharmaceutical industry wastewater treatment.
Acknowledgement
This research study was undertaken in the Environmental Microbiology Laboratories at Dokuz Eylül University Engineering Faculty Environmental Engineering Department, Izmir, Turkey. The authors would like to thank this body for providing financial support.
References
- Idham MF, Abdullah B, Yusof KM (2017) Effects of two cycle heat treatment on the microstructure and hardness of ductile iron. Pertanika J Sci Technol 25: 99-106.
- Idham MF, Falyouna O, Eljamal O (2021) Effect of graphene oxide synthesis method on the adsorption performance of pharmaceutical contaminants. Proc Int Exch Innov Conf Eng Sci 7: 232-239.
- Arenas NE, Melo VM (2018) Producción pecuaria y emergencia de antibiótico resistencia en Colombia: Revisión sistemática. Infectio 22: 110-119.
- Pellerito A, Ameen SM, Micali M, Caruso G (2018) Antimicrobial substances for food packaging products: the current situation. J AOAC Int 101: 942-947. [crossref]
- Fridkin S, Baggs, J, Fagan R, Magill S, Pollack LA, et al. (2014) Vital signs: improving antibiotic use among hospitalized patients. MMWR-Morb Mortal Wkly Rep 63: 194-200. [crossref]
- Tamma PD, Avdic E, Li DX, Dzintars K, Cosgrove SE (2017) Association of adverse events with antibiotic use in hospitalized patients. JAMA Intern Med 177: 1308-1315. [crossref]
- Huo TI (2010) The first case of multidrug-resistant NDM−1-harboring Enterobacteriaceae in Taiwan: here comes the superbacteria! J Chin Med Assoc 73: 557-558. [crossref]
- Ferri M, Ranucci E, Romagnoli P, Giaccone V (2017) Antimicrobial resistance: A global emerging threat to public health systems. Crit Rev Food Sci 57: 2857-2876. [crossref]
- Tan L, Li LY, Ashbolt N, Wang XL, Cui YX, et al. (2018) Arctic antibiotic resistance gene contamination, a result of anthropogenic activities and natural origin. Sci Total Environ 621: 1176-1184. [crossref]
- Tong S, Pan J, Lu S, Tang J (2018) Patient compliance with antimicrobial drugs: a Chinese survey. Am J Infect Control 46: E25-E29. [crossref]
- Alygizakis NA, Gago-Ferrero P, Borova VL, Pavlidou A, Hatzianestis I, et al. (2016) Occurrence and spatial distribution of 158 pharmaceuticals, drugs of abuse and related metabolites in offshore seawater. Sci Total Environ 541: 1097-1105. [crossref]
- Casanova LM, Sobsey MD (2016) Antibiotic-resistant enteric bacteria in environmental waters. Water 8: 561-567.
- Zhang LH, He YW, Chen M, Gao M, Qiu TL, et al. (2016) Pollution characteristics of antibiotic resistant bacteria from atmospheric environment of animal feeding operations. Huan Jing Ke Xue 37: 4531-4537. [crossref]
- Jiménez TM, Ferreira IJ, da Silva DS, Guimarães Barrocas PR, Saggioro EM (2018) Removal of contaminants of emerging concern (CECs) and antibiotic resistant bacteria in urban wastewater using UVA/TiO2/H2O2 photocatalysis. Chemosphere 210: 449-457. [crossref]
- Kerrigan JF, Sandberg KD, Engstrom DR, LaPara TM, Arnold WA (2018) Small and large-scale distribution of four classes of antibiotics in sediment: association with metals and antibiotic resistance genes. Environ Sci Process Impacts 20: 1167-1179. [crossref]
- McConnell MM, Truelstrup HL, Jamieson RC, Neudorf KD, Yost CK, et al. (2018) Removal of antibiotic resistance genes in two tertiary level municipal wastewater treatment plants. Sci Total Environ643: 292-300. [crossref]
- Karthikeyan KG, Meyer MT (2006) Occurrence of antibiotics in wastewater treatment facilities in Wisconsin, USA, Sci Total Environ 361: 196-207. [crossref]
- Dinh QT, Moreau-Guigon E, Labadie P, Alliot F, Teil MJ, et al. (2017) Occurrence of antibiotics in rural catchments. Chemosphere 168: 483-490. [crossref]
- Dong D, Zhang L, Liu S, Guo Z, Hua X (2016) Antibiotics in water and sediments from Liao River in Jilin Province, China: occurrence, distribution, and risk assessment. Environ Earth Sci 75: 1202.
- Siedlewicz G, Białk-Bielinska A, Borecka M, Winogradow A, Stepnowski P, et al. (2018).Presence, concentrations and risk assessment of selected antibiotic residues in sediments and near-bottom waters collected from the Polish Coastal Zone in the Southern Baltic Sea-Summary of 3years of studies. Mar Pollut Bull 129: 787-801. [crossref]
- Barry S (2019) Dangerously high levels of antibiotics found in world’s major rivers, says study. World news global study 1: 1-10.
- Maycock DS, Watts CD (2011) Pharmaceuticals in drinking water. Encycl Environ Heal 472-484.
- Fekadu S, Alemayehu E, Dewil R, Van der Bruggen B (2019) Pharmaceuticals in freshwater aquatic environments: a comparison of the african and european challenge. Sci Total Environ 654: 324-337. [crossref]
- Wang J, Hao J, Liu D, Qin S, Chen C, et al. (2017a) Flower stamen-like porous boron carbon nitride nanoscrolls for water cleaning. Nanoscale 9: 9787-9791. [crossref]
- Wang X, Wang A, Lu M, Ma J (2017b) Synthesis of magnetically recoverable Fe0/graphene-TiO2 nanowires composite for both reduction and photocatalytic oxidation of metronidazole. Chem Eng J 337: 372–384.
- Wang W, Zhu Q, Dai Q, Wang X (2017c) Fe doped CeO2 nanosheets for catalytic oxidation of 1,2-dichloroethane: Effect of preparation method. Chem Eng J 307: 1037-1046.
- Yang X, Chen Z, Zhao W, Liu C, Qian X, et al. (2021) Recent advances in photodegradation of antibiotic residues in water. Chem Eng J 405: 126806. [crossref]
- Akyon B, McLaughlin M, Hernández F, Blotevogel J, Bibby K (2019) Characterization and biological removal of organic compounds from hydraulic fracturing produced water. Environ Sci Process 21: 279-290. [crossref]
- Zhang C, Li Y, Shuai D, Shen Y, Xiong W, et al. (2019) Graphitic carbon nitride (g-C3N4)-based photocatalysts for water disinfection and microbial control: A review. Chemosphere 214: 462-479. [crossref]
- de Souza Santos LV, Meireles AM, Lange LC (2015) Degradation of antibiotics norfloxacin by fenton, UV and UV/H2O2. J Environ Manag 154: 8-12. [crossref]
- Yang L, Zhu YJ, He G, Li H, Tao JC (2022) multifunctional photocatalytic filter paper based on ultralong nanowires of the calcium-alendronate complex for high-performance water purification. ACS Appl Mater Interfaces 14: 9464-9479. [crossref]
- Zhong Y, Han L, Yin X, Li H, Fang D, et al. (2018) Three dimensional functionalized carbon/tin(IV) sulfide biofoam for photocatalytical purification of chromium(VI)-containing wastewater. ACS Sustain Chem Eng 6: 10660-10667.
- Alagha O, Ouerfelli N, Kochkar H, Almessiere MA, Slimani Y, et al. (2021) Kinetic modeling for photo-assisted penicillin G degradation of (Mn0.5Zn0.5)[CdxFe2-x]O4 (x ≤ 0.05) nanospinel ferrites. Nanomaterials 11: 970-986. [crossref]
- The American Society of Health-System Pharmacists. Ofloxacin. Archived from the original on 28 December 2016.
- Andriole VT (1989) The Quinolones, Academic Press.
- Johnson JR, Murray AC, Gajewski A, Sullivan M, Snippes P, et al. (2003) Isolation and molecular characterization of nalidixic acid-resistant extraintestinal pathogenic escherichia coli from retail chicken products. Antimicrob Agents Chemother 47: 2161-2168.
- Kritas S, Ronconi G, Caraffa A, Gallenga C, Ross R, et al. (2020) Mast cells contribute to coronavirus-induced inflammation: new anti-inflammatory strategy. J Biol Regul Homeost Agents 34: 9-14. [crossref]
- Amini Z, Givianrad MH, Husain SW, Azar PA, Saber-Tehrani M (2020) Cu-S codoping TiO2/SiO2 and TiO2/SiO2/Fe3O4 core-shell nanocomposites as a novel purple LED illumination active photocatalyst for degradation of diclofenac: the effect of different scavenger agents and optimization. Chem Eng Commun. 207: 1536-1553.
- Sen Gupta PS, Rana MK (2020) Ivermectin, famotidine, and doxycycline: A suggested combinatorial therapeutic for the treatment of COVID-19. ACS Pharmaco Trans Sci3: 1037-1038. [crossref]
- Tong C, Zhuo X, Guo Y (2011) Occurrence and risk assessment of four typical fluoroquinolone antibiotics in raw and treated sewage and in receiving waters in Hangzhou, China. J Agric Food Chem 59: 7303-7309. [crossref]
- Xiao Y, Chang H, Jia A, Hu J (2008) Trace analysis of quinolone and fluoroquinolone antibiotics from wastewaters by liquid chromatography–electrospray tandem mass spectrometry. J Chromatogr A 1214: 100-108. [crossref]
- Anjali R, Shanthakumar S (2019) Insights on the current status of occurrence and removal of antibiotics in wastewater by advanced oxidation processes. J Environ Manage 246: 51-62. [crossref]
- Liu J, Yin ML, Xiao TF, Zhang CS, Tsang DCW, et al. (2020) Thallium isotopic fractionation in industrial process of pyrite smelting and environmental implications. J Hazard Mater 384: 121378. [crossref]
- Wang J, Zhuan R (2020) Degradation of antibiotics by advanced oxidation processes: An overview. Sci Total Environ 701: 135023. [crossref]
- Liu W, Li Z, Kang Q, Wen L (2021a) Efficient photocatalytic degradation of doxycycline by coupling α-Bi2O3/g-C3N4 composite and H2O2 under visible light. Environ Res 197: 110925. [crossref]
- Liu YP, Lv YT, Guan JF, Khoso FM, Jiang XY, et al. (2021b) Rational design of three-dimensional graphene/graphene oxide-based architectures for the efficient adsorption of contaminants from aqueous solutions. J Mol Liq 343: 117709.
- Homem V, Santos L (2011) Degradation and removal methods of antibiotics from aqueous matrices-A review. J Environ Manage 92: 2304-2347. [crossref]
- Bagheri S, TermehYousefi SA, Do TO (2017) Photocatalytic pathway toward degradation of environmental pharmaceutical pollutants: Structure, kinetics and mechanism approach. Catal Sci Technol 7: 4548-4569.
- Cuerda-Correa EM, Alexandre-Franco MF, Fernandez-Gonzalez C (2020) Advanced oxidation processes for the removal of antibiotics from water, an overview. Water 12: 102-153.
- Lima VB, Goulart LA, Rocha RS, Steter JR, Lanza MRV (2020) Degradation of antibiotic ciprofloxacin by different AOP systems using electrochemically generated hydrogen peroxide. Chemosphere 247: 125807.
- Biancullo F, Moreira NFF, Ribeiro AR, Manaia CM, Faria JL, et al. (2019) Heterogeneous photocatalysis using UVA-LEDs for the removal of antibiotics and antibiotic resistant bacteria from urban wastewater treatment plant effluents. Chem Eng J 367: 304-313.
- Wei Z, Liu J, Shangguan W (2020) A review on photocatalysis in antibiotic wastewater: Pollutant degradation and hydrogen production. Chinese J Catal 41: 1440-1450.
- Ahmed MM, Brienza M, Goetz V, Chiron S (2014) Solar photo-Fenton using peroxymonosulfate for organic micropollutants removal from domestic wastewater: Comparison with heterogeneous TiO2 Chemosphere 117: 256-261. [crossref]
- Wang Y, Sun H, Ang HM, Tade MO, Wang S (2014) Facile synthesis of hierarchically structured magnetic MnO2/ZnFe2O4 hybrid materials and their performance in heterogeneous activation of peroxymonosulfate. ACS Appl Mater Interfaces 6: 19914-19923. [crossref]
- Ren Y, Lin L, Ma J, Yang J, Feng J, et al. (2015) Sulfate radicals induced from peroxymonosulfate by magnetic ferrospinel MFe2O4 (M ¼ Co, Cu, Mn, and Zn) as heterogeneous catalysts in the water. Appl Catal B: Environ 165: 572-578.
- Mady AH, Baynosa ML, Tuma D, Shim JJ. (2019) Heterogeneous activation of peroxymonosulfate by a novel magnetic 3D gamma-MnO2@ZnFe2O4/rGO nanohybrid as a robust catalyst for phenol degradation. Applied Catalysis B: Environmental 244: 946-956.
- Zhu S, Xu Y, Zhu Z, Liu Z, Wang W (2020) Activation of peroxymonosulfate by magnetic Co-Fe/SiO2 layered catalyst derived from iron sludge for ciprofloxacin degradation. Chem Eng J 384: 123298.
- Ahammad NA, Zulkifli MA, Ahmad MA, Hameed BH, Mohd Din AT (2021) Desorption of chloramphenicol from ordered mesoporous carbonalginate beads: Effects of operating parameters, and isotherm, kinetics, and regeneration studies. J Environ Chem Eng 9: 105015.
- Jiang Q, Zhang Y, Jiang S, Wang Y, Li H, et al. (2020).Graphene-like carbon sheetsupported nZVI for efficient atrazine oxidation degradation by persulfate activation. Chem Eng J 403: 126309.
- Shirani Z, Song H, Bhatnagar A (2020) Efficient removal of diclofenac and cephalexin from aqueous solution using Anthriscus sylvestris-derived activated biochar. Sci Total Environ 745: 140789. [crossref]
- Ahmed MB, Zhou JL, Ngo HH, Guo W (2015) Adsorptive removal of antibiotics from water and wastewater: Progress and challenges. Sci Total Environ 532: 112-126. [crossref]
- Zhang X, Lou S, Zeng Y (2020a) Facile fabrication of a novel visible light active g-C3N4-CoMoO4 heterojunction with largely improved photocatalytic performance. Mater Lett 281: 128661.
- Zhang W, Mohamed AR, Ong WJ (2020b) Z-scheme photocatalytic systems for carbon dioxide reduction: where are we now? Angew Chem Int Ed 59: 22894-22915. [crossref]
- Avcu T, Üner O, Geçgel Ü (2021) Adsorptive removal of diclofenac sodium from aqueous solution onto sycamore ball activated carbon-isotherms, kinetics, and thermodynamic study. Surf Interfaces 24: 101097.
- Ji Y, Zhang C, Zhang XJ, Xie PF, Wu C (2022) A high adsorption capacity bamboo biochar for CO2 capture for low temperature heat utilization. Sep Purif Technol 293: 121131.
- Shahnaz T, Vishnu Priyan V, Pandian S, Narayanasamy S (2021) Use of nanocellulose extracted from grass for adsorption abatement of ciprofloxacin and diclofenac removal with phyto, and fish toxicity studies. Environ Pollut 268: 115494. [crossref]
- Wang Z, Song L, Wang Y, Zhang XF, Yao J (2021) Construction of a hybrid graphene oxide/nanofibrillated cellulose aerogel used for the efficient removal of methylene blue and tetracycline. J Phys Chem Solids 150: 109839.
- Cui G, Guo J, Zhang Y, Zhao Q, Fu S, et al. (2019) Chitosan oligosaccharide derivatives as green corrosion inhibitors for P110 steel in a carbon-dioxide-saturated chloride solution. Carbohydr Polym 203: 386-395. [crossref]
- Phasuphan W, Praphairaksit N, Imyim A (2019) Removal of ibuprofen, diclofenac, and naproxen from water using chitosan-modified waste tire crumb rubber. J Mol Liq 294: 111554.
- ALOthman ZA, Badjah AY, Alharbi OML, Ali I (2020) Synthesis of chitosan composite iron nanoparticles for removal of diclofenac sodium drug residue in water. Int J Biol Macromol 159: 870-876. [crossref]
- Yu F, Sun S, Han S, Zheng J, Ma J (2016) Adsorption removal of ciprofloxacin by multi-walled carbon nanotubes with different oxygen contents from aqueous solutions. Chem Eng J 285: 588-595.
- Zhao H, Liu X, Cao Z, Zhan Y, Shi X, et al. (2016) Adsorption behavior and mechanism of chloramphenicols, sulfonamides, and nonantibiotic pharmaceuticals on multi-walled carbon nanotubes. J Hazard Mater 310: 235-245. [crossref]
- Bellamkonda S, Thangavel N, Hafeez HY, Neppolian B, Ranga Rao G (2019) Highly active and stable multi-walled carbon nanotubes-graphene-TiO2 nanohybrid: An efficient non-noble metal photocatalyst for water splitting. Catal Today 321-322: 120-127.
- Rigueto CVT, Rosseto M, Nazari MT, Ostwald BEP, Alessandretti I, et al. (2021) Adsorption of diclofenac sodium by composite beads prepared from tannery wastesderived gelatin and carbon nanotubes. J Environ Chem Eng 9: 105030.
- Ahmed MB, Zhou JL, Ngo HH, Guo W, Johir MAH, et al. (2017) Nano-Fe0 immobilized onto functionalized biochar gaining excellent stability during sorption and reduction of chloramphenicol via transforming to reusable magnetic composite. Chem Eng J 322: 571-581.
- Zhao J, Yang X, Liang G, Wang Z, Li S, et al. (2020) Effective removal of two fluoroquinolone antibiotics by PEG-4000 stabilized nanoscale zerovalent iron supported onto zeolite (PZ-NZVI) Sci Total Environ 710: 136289. [crossref]
- Nguyen LT, Nguyen HT, Pham TD, Tran TD, Chu HT, et al. (2020) UV–visible light driven photocatalytic degradation of ciprofloxacin by N, S co-doped TiO2: the effect of operational parameters. Top Catal 63: 985-995.
- Nguyen CH, Tran ML, Van Tran TT, Juang RS (2021) Efficient removal of antibiotic oxytetracycline from water by Fenton-like reactions using reduced graphene oxide-supported bimetallic Pd/nZVI nanocomposites. J Taiwan Inst Chem Eng 119: 80-89.
- Falyouna O, Idham MF, Maamoun I, Bensaida K, Ashik UPM, et al. (2022a) Promotion of ciprofloxacin adsorption from contaminated solutions by oxalate modified nanoscale zerovalent iron particles. J Mol Liq 359: 119323.
- Falyouna O, Maamoun I, Bensaida K, Tahara A, Sugihara Y, et al. (2022b) Encapsulation of iron nanoparticles with magnesium hydroxide shell for remarkable removal of ciprofloxacin from contaminated water. J Colloid Interface Sci 605: 813-827. [crossref]
- Mokhati A, Benturki O, Bernardo M, Kecira Z, Matos I, et al. (2021) Nanoporous carbons prepared from argan nutshells as potential removal agents of diclofenac and paroxetine. J Mol Liq 326: 115368.
- Shan D, Deng S, Li J, Wang H, He Cet al. (2017) Preparation of porous graphene oxide by chemically intercalating a rigid molecule for enhanced removal of typical pharmaceuticals. Carbon N Y 119: 101-109.
- Khalil AME, Memon FA, Tabish TA, Salmon D, Zhang S, et al. (2020) Nanostructured porous graphene for efficient removal of emerging contaminants (pharmaceuticals) from water. Chem Eng J 398: 125440.
- Görmez F, Görmez Ö, Gözmen B, Kalderis D (2019) Degradation of chloramphenicol and metronidazole by electro-fenton process using graphene oxide Fe3O4 as heterogeneous catalyst. J Environ Chem Eng 7: 102990.
- Qiao D, Li Z, Duan J, He X (2020) Adsorption and photocatalytic degradation mechanism of magnetic graphene oxide/ZnO nanocomposites for tetracycline contaminants. Chem Eng J 400: 125952.
- Yadav S, Asthana A, Singh AK, Chakraborty R, Vidya SS, et al. (2021) Methionine-functionalized graphene oxide/sodium alginate bio-polymer nanocomposite hydrogel beads: synthesis, ısotherm and kinetic studies for an adsorptive removal of fluoroquinolone antibiotics. Nanomaterial,11: 568-593. [crossref]
- Liu WX, Song S, Ye ML, Zhu Y, Zhao YG, et al. (2022) Nanomaterials with excellent adsorption characteristics for sample pretreatment: a review. Nanomaterials 12: 1845. [crossref]
- Bao J, Zhu Y, Yuan S, Wang F, Tang H, et al.(2018) Adsorption of tetracycline with reduced graphene oxide decorated with MnFe2O4 Nanoscale Res Lett 13: 396-403. [crossref]
- Tang H, Li W, Jiang H, Lin R, Wang Z, et al. (2019) ZIF-8-derived hollow carbon for efficient adsorption of antibiotics. Nanomaterials 9: 117. [crossref]
- Wang ZT, Xu JL, Zhou H, Zhang X (2019a) Facile synthesis of Zn(II)-doped g-C3N4 and their enhanced photocatalytic activity under visible light irradiation. Rare Met 38: 459-467. [crossref]
- Wang B, Zhu B, Yun S, Zhang W, Xia C, et al. (2019b) Fast ionic conduction in semiconductor CeO2-δ electrolyte fuel cells. NPG Asia Mater 11: 51.
- Masoudi F, Kamranifar M, Safari F, Naghizadeh A (2019) Mechanism, kinetics and thermodynamic of Penicillin G antibiotic removal by silica nanoparticles from simulated hospital wastewater. Desalination Water Treat 169: 333-341.
- Zeidman AB, Rodriguez-Narvaez OM, Moon J, Bandala ER, et al. (2020) Removal of antibiotics in aqueous phase using silica-based ımmobilized nanomaterials: a review. Environ Technol Innov 20: 101030.
- Sturini M, Puscalau C, Guerra G, Maraschi F, Bruni G, et al. (2021) Combined layer-by-layer/hydrothermal synthesis of Fe3O4@MIL-100(Fe) for ofloxacin adsorption from environmental waters. Nanomaterial 11: 3275. [crossref]
- Li Y, Gutiérrez Moreno JJ, Song Z, Liu D, et al. (2022) Controlled synthesis of perforated oxide nanosheets with high density nanopores showing superior water purification performance. ACS Appl Mater Interfaces 14: 18513-18524. [crossref]
- Dehghan A, Mohammadi AA, Yousefi M, Najafpoor AA, Shams M etal (2019) Enhanced kinetic removal of ciprofloxacin onto metal-organic frameworks by sonication, process optimization and metal leaching study. Nanomaterials 9: 1422-1438. [crossref]
- Sun T, Fan R, Zhang J, Qin M, Chen W, et al. (2021a).Stimuli-Responsive metal–organic framework on a metal–organic framework heterostructure for efficient antibiotic detection and anticounterfeiting. ACS Appl Mater Interfaces 13: 35689-35699. [crossref]
- Sun L, Cao G, Xu M, Cheng G, Xia D, et al. (2021b) Visible-light-induced peroxymonosulfate activation over ZnFe2O4 fine nanoparticles for ofloxacin degradation. Elementa: Science of the Anthropocene 9: 1-10.
- Luo B, Xu D, Li D, Wu G, Wu Met al. Fabrication of a Ag/Bi3TaO7 plasmonic photocatalyst with enhanced photocatalytic activity for degradation of tetracycline. ACS Appl Mater Interfaces 7: 17061-17069. [crossref]
- Lu Y, Chu Y, Zheng W, Huo M, Huo H, et al. (2019) Significant tetracycline hydrochloride degradation and electricity generation in a visible-light-driven dual photoelectrode photocatalytic fuel cell using BiVO4/TiO2 NT photoanode and Cu2O/TiO2 NT photocathode. Electrochim Acta 320: 134617. [crossref]
- Lu ZY, Ma YL, Zhang JT, Fan NS, Huang BC (2020) A critical review of antibiotic removal strategies: Performance and mechanisms. J Water Process Eng 38: 101681.
- Yu H, Wang D, Zhao B, Lu Y, Wang X, et al. (2020) Enhanced photocatalytic degradation of tetracycline under visible light by using a ternary photocatalyst of Ag3PO4/AgBr/g-C3N4 with dual Z-scheme heterojunction. Separ Purif Tech 237: 116365.
- Chen Y, Yang J, Zeng L, Zhu M (2022) Recent progress on the removal of antibiotic pollutants using photocatalytic oxidation process. Crit Rev Environ Sci Technol 52: 1401-1448.
- Fu J, Yu J, Jiang C, Cheng B (2018) g-C3N4-based heterostructured photocatalysts. Adv Energy Mater 8: 1701503.
- Ren Y, Zeng D, Ong WJ (2019) Interfacial engineering of graphitic carbon nitride (g-C3N4)-based metal sulfide heterojunction photocatalysts for energy conversion: a review Chin J Catal 40: 289-319.
- Hao Q, Chen T, Wang R, Feng J, Chen D, et al. (2018a) A separation-free polyacrylamide/bentonite/graphitic carbon nitride hydrogel with excellent performance in water treatment. J Clean Prod 197: 1222-1230.
- Hao X, Zhou J, Cui Z, Wang Y, Zou, Z (2018b) Zn-vacancy mediated electron-hole separation in ZnS/g-C3N4 heterojunction for efficient visible-light photocatalytic hydrogen production. Appl Catal B 229: 41-51.
- Mestre AS, Carvalho AP (2019) Photocatalytic degradation of pharmaceuticals carbamazepine, diclofenac, and sulfamethoxazole by semiconductor and carbon materials: a review. Molecules 24: 3702. [crossref]
- Low J, Jiang C, Chen B, Wageh S, Al-Ghamdi AA, et al. (2017) A review of direct Z-scheme photocatalysts. Small Methods 1: 1700080.
- Chen Y, Fan ZX, Zhang ZC, Niu WX, Li CL, et al. (2018) Two-dimensional metal nanomaterials: synthesis, properties, and applications. Chem Rev 118: 6409-6455.
- Xu Q, Zhang L, Yu J, Wageh S, Al-Ghamdi AA, et al. (2018) Direct Z-scheme photocatalysts: principles, synthesis, and applications. Mater Today 21: 1042-1063.
- Huang D, Chen S, Zeng G, Gong X, Zhou CY, et al. (2019) Artificial Z-scheme photocatalytic system: What have been done and where to go? Coord Chem Rev 385: 44-80.
- Yu W, Xu D, Peng T (2015) Enhanced photocatalytic activity of g-C3N4 for selective CO2 reduction to CH3OH via facile coupling of ZnO: a direct Z-scheme mechanism. J Mater Chem A 3: 19936-19947.
- Liu X, Pang F, He M, Ge J (2017a) Confined reaction inside nanotubes: New approach to mesoporous g-C3N4 Nano Res 10: 3638-3647.
- Liu D, Zhang M, Xie W, Sun L, Chen Y, et al. (2017b) Porous BN/TiO2 hybrid nanosheets as highly efficient visible-light-driven photocatalysts. Appl Catal B-Environ 207: 72-78.
- Liu S, Chen F, Li S, Peng X, Xiong Y (2017c) Enhanced photocatalytic conversion of greenhouse gas CO2 into solar fuels over g-C3N4 nanotubes with decorated transparent ZIF-8 nanoclusters. Appl Catal B 211: 1-10.
- Cui L, Ding X, Wang Y, Shi H, Huang L, et al. (2017) Facile preparation of Z-scheme WO3/g-C3N4 composite photocatalyst with enhanced photocatalytic performance under visible light. Appl Surf Sci B 391: 202-210.
- Gebreslassie G, Bharali P, Chandra U, Sergawie A, Boruah PK, et al. (2019a/) Novel g-C3N4/graphene/NiFe2O4 nanocomposites as magnetically separable visible light driven photocatalysts. J Photochem Photobiol A: Chem 382: 111960.
- Gebreslassie G, Bharali P, Chandra U, Sergawie A, Boruah PK, et al. (2019b) Hydrothermal synthesis of g-C3N4/NiFe2O4 nanocomposite and its enhanced photocatalytic activity. Appl Organomet Chem 33: e5002.
- Wu J, Hu J, Qian H, Li J, Yang R, et al. NiCo/ZnO/g-C3N4 Z-scheme heterojunction nanoparticles with enhanced photocatalytic degradation oxytetracycline. Diamond Relat Mater 121: 108738.
- Qu Z, Jing Z, Chen X, Wang Z, Ren H, et al. (2023) Preparation and photocatalytic performance study of dual Z-scheme Bi2Zr2O7/g-C3N4/Ag3PO4 for removal of antibiotics by visible-light. J Environ Sci 125: 349-361. [crossref]
- Zhao H, Yu H, Quan X, Chen S, Zhang Y, et al. (2014) Fabrication of atomic single layer graphiticC3N4 and its high performance of photocatalytic disinfection under visible light irradiation. Appl Catal B 152-153: 46-50.
- Mamba G, Mishra AK (2016) Graphitic carbon nitride (gC3N4) nanocomposites: A new and exciting generation of visible light driven photocatalysts for environmental pollution remediation. Appl Catal B 198: 347-377.
- Darkwah WK, Ao Y (2018) Mini review on the structure and properties (photocatalysis), and preparation techniques of graphitic carbon nitride nano-based particle, and its applications. Nanoscale Res Lett 388: 1-15.
- Oh WD, Chang VWC, Hu ZT, Goei R, Lim TT.(2017) Enhancing the catalytic activity of g-C3N4 through Me doping (Me = Cu, Co and Fe) for selective sulfathiazole degradation via redox-based advanced oxidation process. Chem Eng J 323: 260-269.
- Dai Y, Gu Y, Bu Y (2020) Modulation of the photocatalytic performance of g-C3N4 by two-sites co-doping using variable valence metal. Appl Surf Sci 500: 144036.
- Ye L, Liu J, Jiang Z, Peng T, Zan L (2013) Facets coupling of BiOBr-g-C3N4 composite photocatalyst for enhanced visible-light-driven photocatalytic activity. Appl Catal B 142-143: 1-7.
- Tian N, Huang H, He Y, Guo Y, Zhang T, et al. (2015a) Mediator-free direct Z-scheme photocatalytic system: BiVO4/g-C3N4 organic–inorganic hybrid photocatalyst with highly efficient visible-light-induced photocatalytic activity. Dalton Trans 44: 4297-4307.
- Tian N, Huang H, Liu C, Dong F, Zhang T, et al. (2015b) In situ co-pyrolysis fabrication of CeO2/g-C3N4 n-n type heterojunction for synchronously promoting photo-induced oxidation and reduction properties. J Mater Chem A 3: 17120-17129.
- Nithya R, Ayyappan S.(2020) Novel exfoliated graphiticC3N4 hybridised ZnBi2O4 (g-C3N4/ZnBi2O4) nanorods for catalytic reduction of 4-Nitrophenol and its antibacterial activity J Photochem Photobiol Chem 398: 112591.
- Tian N, Huang H, Wang S, Zhang T, Du X, et al. (2020) Facet-charge-induced coupling dependent interfacial photocharge separation: A case of BiOI/g-C3N4 p-n junction. Appl Catal B 267: 118697
- Montini T, Melchionna M, Monai M, Fornasiero P (2016) Fundamentals and catalytic applications of CeO2-based materials. Chem Rev 116: 5987-6041. [crossref]
- Fauzi AA, Jalila AA, Hassan NS, Aziz FFA, Azami MS, et al. (2022) A critical review on relationship of CeO2-based photocatalyst towards mechanistic degradation of organic pollutant. Chemosphere 286: 131651. [crossref]
- Kashmery HA, El-Hout SI, Zak ZI (2022) Fast photocatalytic oxidation of ciprofloxacin over Co3O4@CeO2 heterojunctions under visible-light. J Taiwan Inst Chem Eng 140: 104563.
- Rajeshkumar S, Naik P (2018) Synthesis and biomedical applications of Cerium oxide nanoparticles-A Review. Biotechnol Rep 17: 1-5.
- Latif MM, Haq AU, Amin F, Ajaz-un-Nabi M, Khan I, et al. (2021) Synthesis and antimicrobial activities of manganese (Mn) and iron (Fe) co-doped cerium dioxide (CeO2) nanoparticles. Physica B Condens Matter 600: 412562.
- Parvathy S, Subramanian P, Karthick SA, Subbaiya R (2022) The structural, optical, antimicrobial and anticancer properties of biocompatible astaxanthin coated ZnO and CeO2 Mater Lett 312: 131669.
- Sharma D, Sastsangi VR, Shrivastav R, Waghmare UV, Dass S. (2016).Understanding the photoelectrochemical properties of nanostructured CeO2/CuO2 heterojunction photoanode for efficient photoelectrochemical water splitting. Int J Hydrog Energy 41: 18339-18350.
- Sharma D, Mehta BR (2018) Nanostructured TiO2 thin films sensitized by CeO2 as an inexpensive photoanode for enhanced photoactivity of water oxidation. J Alloys Compd 749: 329-335.
- Yin D, Zhao F, Zhang L, Zhang X, Liu Y, et al. (2016) Greatly enhanced photocatalytic activity of semiconductor CeO2 by integrating with upconversion nanocrystals and graphene. RSC Adv 6: 103795-103802.
- Li R, Li C, Yin S, Fu C, Satom T (2012) Synthesis of C-N Co-doped nano-CeO2 and dye degradation under compact fluorescent lamp irradiation. J Nanosci Nanotechnol 12: 2797-2801. [crossref]
- Channei D, Inceesungvorn B, Wetchakun N, Ukritnukun S, Nattestad A, et al. Photocatalytic degradation of methyl orange by CeO2 and Fe-doped CeO2 films under visible light irradiation. Sci Rep 4: 5757. [crossref]
- Huang K, Li YH, Liang C, Xu X, Zhou YF, et al. (2014) One-step synthesis of reduced graphene oxide-CeO2 nanocubes composites with enhanced catalytic activity. Mater Lett 124: 223-226.
- Qu X, Xie D, Gao L, Du F (2014) Synthesis and photocatalytic activity of TiO2 /CeO2 core-shell nanotubes. Mater Sci Semicond Process 26: 657-662.
- Saranya J, Ranjith KS, Saravanan P, Mangalaraj D, Kumar RTR (2014) Cobalt-doped cerium oxide nanoparticles: Enhanced photocatalytic activity under UV and visible light irradiation. Mater Sci Semicond Process 26: 218-224.
- Zhang C, Zhang X, Wang Y, Xie S, Liu Y, et al. (2014) Facile electrochemical synthesis of CeO2 hierarchical nanorods and nanowires with excellent photocatalytic activities. New J Chem 38: 2581-2586.
- Issarapanacheewin S, Wetchakun K, Phanichphant S, Kangwansupamokon W, Wetchakun N (2015) A novel CeO2 /Bi2WO6 composite with highly enhanced photocatalytic activity. Mater Lett 156: 28-31.
- Mittal M, Gupta A, Pandey OP (2018) Role of oxygen vacancies in Ag/Au doped CeO2 nanoparticles for fast photocatalysis. Sol Energy 165: 206-216.
- Xiu Z, Xing Z, Li Z, Wu X, Yan X, et al. (2018) Ti3+-TiO2 /Ce3+-CeO2 nanosheet heterojunctions as efficient visible-light-driven photocatalysts. Mater Res Bull 100: 191-197.
- Toro RG, Malandrino G, Fragala IL (2004) Relationship between the nanostructures and the optical properties of CeO2 thin films. J Phys Chem B 108: 16357-16364.
- Chen HI, Chang HY (2005) Synthesis and characterization of nanocrystalline cerium oxide powders by two-stage non-isothermal precipitation. Solid State Commun 133: 593-598.
- Avellaneda CO, Berton MAC, Bulhões LOS (2008) Optical and electrochemical properties of CeO2 thin film prepared by an alkoxide route. Sol Energy Mater Sol Cells 92: 240-244.
- Wongkaew A (2008) Effect of cerium oxide and zirconium oxide to activity of catalysts. Chiang Mai J Sci 35: 156-162.
- Zhang N, Zhang G, Chong S, Zhao H, Huang T, et al. (2018) Ultrasonic impregnation of MnO2/CeO2 and its application in catalytic sono-degradation of methyl orange J Environ Manag 205: 134-141. [crossref]
- Aboutaleb WA, El-Salamony RA (2019) Effect of Fe2O3 -CeO2 nanocomposite synthesis method on the Congo red dye photodegradation under visible light irradiation. Mater Chem Phys 236: 121724.
- Munoz-Batista MJ, Gomez-Cerezo MN, Kubacka A, Tudela D, Fernandez-Garcia M (2014) Role of interface contact in CeO2-TiO2 photocatalytic composite materials. ACS Catal 4: 63-72.
- Kusmierek E (2020) A CeO2 semiconductor as a photocatalytic and photoelectrocatalytic material for the remediation of pollutants in ındustrial wastewater: a review. Catalysts 10: 1435-1489.
- Baird RB, Eaton AD, Rice EW (2017) Standard Methods for the Examination of Water and Wastewater.
- Olthof M, Eckenfelder WW (1976) Coagulation of textile wastewater. Text Chem Color8 : 18-22.
- Eckenfelder WW (1989) Industrial Water Pollution Control (2nd ed), Signapore: McGraw-Hill Inc.
- Lange B (1994) LUMISmini, Operating Manual. Dusseldorf, Germany.
- Lange B (2010) Vibrio fischeri -Microtox LCK 491 kit. Germany.
- Lange B (1996) LUMIXmini type luminometer. Dusseldorf.
- Zar JH (1984) Biostatistical analysis, Prentice-Hall, Englewood Cliffs.
- Statgraphics Centurion XV, sofware, StatPoint Inc, Statgraphics Centurion XV, Herndon, VA, USA, 2005.
- Eddy DR, Puri FN, Noviyanti AR (2015) Synthesis and photocatalytic activity of silica-based sand quartz as the supporting TiO2 Proced Chem 17: 55-58.
- Li H, Hu J, Meng Y, Su J, Wang X (2017a) An investigation into the rapid removal of tetracycline using multilayered graphene-phase biochar derived from waste chicken feather. Sci Total Environ 603-604: 39-48. [crossref]
- Li X, Zhu W, Lu X, Zuo S, Yao C, et al. (2017b) Integrated nanostructures of CeO2 /attapulgite/g-C3N4 as efficient catalyst for photocatalytic desulfurization: Mechanism, kinetics and influencing factors. Chem Eng J 326: 87-98. [crossref]
- Vignesh S, Suganthi S, Sundar JK, Raj V (2019) Construction of α-Fe2O3/CeO2 decorated g-C3N4 nanosheets for magnetically separable efficient photocatalytic performance under visible light exposure and bacterial disinfection. Appl Surf Sci 488: 763-777.
- Huang L, Li Y, Xu H, Xu Y, Xia J, et al. (2013) Synthesis and characterization of CeO2/g-C3N4 composites with enhanced visible-light photocatalytic activity. RSC Adv 3: 22269-22279.
- Yuan Y, Huang GF, Hu WY, Xiong DN, Zhou BX, et al. (2017) Construction of g-C3N4 /CeO2/ZnO ternary photocatalysts with enhanced photocatalytic performance. J Phys Chem Solids 106: 1-9.
- Liu W, Zhou J, Hu Z (2019) Nano-sized g-C3N4 thin layer @ CeO2 sphere core-shell photocatalyst combined with H2O2 to degrade doxycycline in water under visible light irradiation. Sep Purif Technol 227: 115665.
- Murali A, Sarswat PK, Free ML (2010) Minimizing electron-hole pair recombination through band-gap engineering in novel ZnO-CeO2-rGO ternary nanocomposite for photoelectrochemical and photocatalytic applications. Environ Sci Pollut Res 27: 25042-25056.
- Dixit D, Verma A, Gupta S, Bansal P (2016) Assessment of solar photocatalytic degradation and mineralization of amoxicillin trihydrate (AMT) using slurry and fixed-bed batch reactor: efficacy of parabolic trough collector. RSC Adv 6: 36109-361017.
- Ferri M, Ranucci E, Romagnoli P, Giaccone V (2017) Antimicrobial resistance: A global emerging threat to public health systems. Crit Rev Food Sci 57: 2857-2876. [crossref]
- Guo X, He S, Meng Z, Wang Y, Peng Y (2022) Ag@ZIF-8/g-C3N4 Z-scheme photocatalyst for the enhanced removal of multiple classes of antibiotics by integrated adsorption and photocatalytic degradation under visible light irradiation. The Royal Society of Chemistry, RSC Adv 12: 17919-17931.
- Lei W, Zhang T, Gu L, Liu P, Rodriquez JA, et al. (2015) Surface-structure sensitivity of CeO2 nanocrystals in photocatalysis and enhancing the reactivity with nanogold. ACS Catal 5: 4385-4393.
- Pellerito A, Ameen SM, Micali M, Caruso G (2018) Antimicrobial substances for food packaging products: the current situation. J AOAC Int 101(4): 942-947.
- Sizykh M, Batoeva M, Matafonova G (2023) Enhanced catalyst-free degradation and mineralization of ceftriaxone by UV/H2O2 and UV/S2O82−processes using KrCl excilamp (222 nm) J Photochem Photobiol A Chem 436: 114357.
- Ye Z, Li J, Zhou M, Wang H, Ma Y, et al. (2016) Well-dispersed nebula-like ZnO/CeO2@HNTs heterostructure for efficient photocatalytic degradation of tetracycline. Chem Eng J 304: 917-933.
- Zhao Y, Liang X, Wang Y, Shi H, Liu E, et al. (2018) Degradation and removal of Ceftriaxone sodium in aquatic environment with Bi2WO6/g-C3N4 J Colloid Interface Sci 523: 7-17. [crossref]
- Zhou JB, Liu W, Cai WQ (2019) The synergistic effect of Ag/AgCl@ZIF-8 modified g-C3N4 composite and peroxymonosulfate for the enhanced visible-light photocatalytic degradation of levofloxacin. Sci Total Environ 696: 133962. [crossref]