Abstract
Background: Hypogonadism in adult men is a clinical and biochemical syndrome associated with low level of testosterone, which may adversely affect multiple organ functions and quality of life. It is closely related to the development of diabetes. This study was designed to determine the incidence of hypogonadism and related risk factors among men with type 2 diabetes (T2D).
Patients and Methods: A total of 300 male patients diagnosed with T2D age from 30-70 years were enrolled in the study. Arabic version of the Androgen Deficiency in Aging Male (ADAM) questionnaire was employed to assess the androgen insufficiency in men. Hemoglobin A1c, FSH, LH, total and free testosterone, levels were measured by enzyme immunoassay.
Results: T2D patients were divided into two groups: 48 (16%) patients with hypogonadism and 252 (84%) patients without hypogonadism. Multiple logistic regression analysis for factors affecting Hypogonadism among patients according to (total testosterone + ADAM +ve) versus those without hypogonadism it was found that age, random blood sugar, body mass index (BMI), Hb A1c are independent risk factors for the development of hypogonadism with odds ratio (0.95, 1, 1.1, 1.37) with p value (0.02, 0.03, 0. 03, 0.008) respectively. The ROC analysis of the accuracy of indices and cut off values for the studied total testosterone for predicting the hypogonadism according to total testosterone + ADAM score positive: The AUC was 0.98 “p-value <0.0001” with sensitivity 100% and specificity of 96.4% at Cut off value ≤ 12.
Conclusion: Several risk factors of diabetes are associated closely with hypogonadism. Age, BMI, blood sugar, and Hb A1c are independent risk factors for the development of hypogonadism in male patients with T2D.
Introduction
Diabetes mellitus is a metabolic disorder characterized by the presence of hyperglycemia due to defective insulin secretion, defective insulin action or both. The chronic hyperglycemia of diabetes is associated with relatively specific Long-term complications from high blood sugar can include macrovascular complications as coronary artery disease, cerebrovascular strokes and chronic limb ischemia and there is microvascular complication as diabetic retinopathy, chronic kidney disease which may require regular dialysis, and diabetic neuropathy [1].
Type 2 diabetes (T2D) is ranging from predominantly insulin resistance with relative insulin deficiency to predominantly an insulin secretory defect with insulin resistance. This form of diabetes, which accounts for 90-95% of those with diabetes, previously referred as non-insulin dependent diabetes, type 2 diabetes, or adult onset diabetes, encompasses individuals who have insulin resistance and usually have relative (rather than absolute) insulin deficiency. This is probably many different causes of this form of diabetes although the specific etiologies are not known. Most patients with this form of diabetes are obese, and obesity itself causes some degree of insulin resistance [2].
Hypogonadism (testosterone deficiency) in adult men is a clinical and biochemical syndrome associated with low level of testosterone, which may adversely affect multiple organ functions and quality of life [3]. Overt hypogonadism was defined as the presence of clinical symptoms of hypogonadism and low testosterone level (total testosterone <8 nmol/l and/or bioavailable testosterone <2.5 nmol/l). Borderline hypogonadism was defined as the presence of symptoms and total testosterone of 8-12 nmol/l or bioavailable testosterone of 2.5-4 nmol/l [4].
From the cross-sectional studies done, it is clear that between 20% and 64% of men with diabetes have hypogonadism; generally, there is a slow and continuous decrease in testosterone production among older population. Furthermore, the prevalence of hypogonadism varies between racial, ethnic groups [5]. A high incidence of hypogonadism in men with (T2D) has been globally reported. This study was designed to determine the incidence of hypogonadism and related risk factors among men with T2D in Minia governorate, Egypt.
Patients and Methods
This prospective cross sectional study included a total of 300 T2D patients; all patients gave verbal consent to participate in the study. Patients were selected from those coming for follow up at different Minia University and Ministry of Health hospitals in the period between January 2018 and June 2019. Patients are known to have type 2 diabetes mellitus according to criteria of American diabetic association [6].
The criteria of diagnosis of hypogonadism in our work is low level of testosterone (12 nmol/L total testosterone 3.5 ng/mL) represents a reliable threshold to diagnose late onset hypogonadism (LOH) or free testosterone <5.7 pg/ml) and positive result of screening of ADAM questionnaire [3,7]. Hypogonadism was classified as primary hypogonadism (total testosterone >12 nmol/L and LH<10 IU\L) and secondary hypogonadism ( total testosterone >12 nmol/L and LH >10 IU/L).
Inclusion Criteria
Male patients, diagnosed with diabetes mellitus type 2, age from 30-70 years and on oral therapy or insulin or both.
Exclusion Criteria
Any patient with any of the following criteria: a history of hypopituitarism, type 1 diabetes mellitus, chronic debilitating diseases, chronic inflammatory diseases, or connective tissue disorders, take any medications affecting glucose metabolism as (steroids, anti-psychotic medications), malignancy, autonomic neuropathy, or patients on testosterone replacement therapy.
All subjects were subjected to full history taking and thorough clinical examination. All the patients were required to complete an Arabic version of the Androgen Deficiency in Aging Male (ADAM) questionnaire designed by the Saint Louis University, MO, USA, 2007. This 10-item screening questionnaire was employed to assess the androgen insufficiency in aging men, including morning erection to exclude psychogenic erectile dysfunction. A positive response denoted the presence of clinical hypogonadism based on a decrease in libido, strength of erections, or any three nonspecific questions that may include a decrease in muscle strength, fatigability, mood changes, and loss of height.
The following laboratory investigations were performed: blood glucose level, renal and liver function tests, complete lipogram using fully automated clinical chemistry auto-analyzer system Konelab 20i (Thermo-Electron Incorporation, Finland). Hemoglobin A1c (glycated hemoglobin), FSH, LH, total and free testosterone, levels were measured by enzyme immunoassay.
Study sample size: the number of study participants was calculated using EPI – Info (statistical; software for epidemiology) depend on population number (diabetic patients) and percentage of disease (prevalence of hypogonadism).
Statistical Analysis
Normality of data distribution was done by using Shapiro-wilk test. Descriptive statistics, such as percentages, frequencies, mean, and standard deviations, were used to measure the demographic variables, clinical and laboratory data. Analytical statistics were applied to investigate the association of the demographic variables, clinical and laboratory data and hypogonadism. Quantitative data were presented by mean (standard deviation), while qualitative data were presented by frequency distribution. The independent sample t-test used for comparison of means and the Chi-square test was used to compare between proportions.
Logestic regression analyses were performed to identify the significant predictors (independent risk factors) for hypogonadism (target dependent factor) The probability of less than 0.05 was used as a cut off point for all significant tests and all statistical tests were 2 tailed. The receiver operating characteristic (ROC) curve is the plot that displays the full picture of trade-off between the sensitivity (true positive rate) and (1-specificity) (false positive rate) across a series of cut-off points. Total area under ROC curve is a single index for measuring the performance a test. The larger the AUC, the better is overall performance of the medical test to correctly identify diseased and non-diseased subjects. All analyses were done using the statistical Package of social Science (SPSS, version 22).
Results
This study included a total of 300 men with T2D. Their socio-demographic characteristics are shown in Table 1. T2D patients were divided into two groups: 48 (16%) patients with hypogonadism and 252 (84%) patients without hypogonadism. 68.8% of the hypogonadal group were in age group 41-60 years with p value 0.009 , 43.3% of hypogonadal group were smokers with p value 0.05, and 25% sere Ex-smoker, 68.8% of the hypogonadal group were on oral treatment of diabetes mellitus (p=0.05), 18.8% were on insulin, 56.3% of hypogonadal group were diabetic 6-10 years with (p=0.0001), 81.3% of hypogonadal group were obese with (p=0.001). The group of hypogonadism show higher BMI, waist circumference grades, waist/hip ratio and waist/height ratio with (p=0.001, =0.008, >0.0001, =0.03) respectively (Table 2).
Table 1: Sociodemographic data of whole patient with type 2 diabetes mellitus
|
Socio-demographic characteristics |
Mean ± SD or N (%) |
| Age (years) |
54.46 ± 9.46 (31-70) |
| Age groups
30-40 (years) 41-50 (years) 51-60 (years) 61-70 (years) |
33 (11%) 60 (20%) 126 (42%) 81 (27%) |
| Smoking
Non smoker Smoker Ex-smoker |
141 (47%) 96 (32%) 63 (21%) |
| Type of treatment of DM
Lifestyle Insulin Oral antidiabetic Mixed (Insulin + oral) |
21 (7%) 60 (20%) 180 (60%) 39 (13%) |
| Complication of DM
No Yes |
198 (66%) 102 (34%) |
| Classification of complication :
Neuropathy Stroke IHD Retinopathy Nephropathy |
39 (13% ) 12 (4%) 27 (9%) 21 (7%) 3 (1%) |
| Hypertension
No Yes |
204 (68%) 96 (32%) |
| Duration of diabetes (years) |
7.73 ± 6.76 (0.1-27) |
| Duration of diabetes ranges
≤ 5 (years) 6-10 (years) 11-15 (years) < 15(years) |
156 (52%) 66 (22%) 51 (17%) 27 (9%) |
| BMI (KGm/M2) |
31.22 ± 6.56 (21.1-40.8) |
| BMI grades (KGm/M2)
≤ 24.9 (KGm/M2) average 25-29.9 (KGm/M2) overweight ≥ 30 (KGm/M2) obesity |
27 (9%) 102 (34%) 171 (57%) |
| Waist circumference (Cm) |
101.62 ± 13.67 (69-135) |
| Waist circumference grades (Cm)
< 102 (Cm) ≥ 102 (Cm) |
84 (28%) 216 (72%) |
| Waist/hip ratio |
0.97 ± 0.06 (0.81-1.15) |
| Waist/height ratio |
60.53 ± 7.71 (43-79) |
BMI: Body mass index, KGm: Kilogram, M: Meter, CM: Centimeter
Table 2: Sociodemographic characteristics in type 2 DM patients with hypogonadism according to (Total Testosterone + ADAM +ve) versus those without hypogonadism.
|
Socio-demographic characteristics |
Hypogonadism |
No hypogonadism |
p-value |
| Age (years) |
52.87 ± 9.03 |
54.76 ± 9.52 |
0.2 |
| Age groups
31-40 (years) 41-50 (years) 51-60 (years) 61-70 (years) |
3 (6.3%) 18 (37.5%) 15 (31.3%) 12 (25%) |
30 (11.9%) 42 (16.7%) 111 (44%) 69 (27.4%) |
0.009* |
| Smoking
Non smoker Smoker Ex-smoker |
15 (31.3%) 21 (43.8%) 12 (25%) |
126 (50%) 75 (29.8%) 51 (20.2%) |
0.05 |
| Type of treatment of DM
Lifestyle Insulin Oral Mixed |
0 (0%) 6 (12.5%) 33 (68.8%) 9 (18.8%) |
21 (8.3%) 54 (21.4%) 147 (58.3%) 30 (11.9%) |
0.05 |
| Complications of DM
No Yes |
33 (68.75%) 15 (31.25%) |
165 (65.5%) 87 (34.5%) |
0.01* |
| Hypertension
No Yes |
33 (68.8%) 15 (31.2%) |
171 (67.9%) 81 (32.1%) |
0.9 |
| Duration of diabetes (years) |
7.15± 3.73 |
7.84± 7.20 |
0.5 |
| Duration of diabetes ranges
≤ 5 (years) 6-10 (years) 11-15 (years) < 15(years) |
15 (31.2%) 27 (56.3%) 6 (12.5%) 0 (0%) |
141 (56%) 39 (15.5%) 45 (17.9%) 27 (10.6%) |
>0.0001* |
| BMI (KGm/M2) |
32.97 ± 7.88 |
30.89 ± 6.24 |
0.04* |
| BMI grades (KGm/M2)
≤ 24.9 Average 25-29.9 Overweight ≥ 30 Obesity |
0 (0%) 9 (18.8%) 39 (81.3%) |
27 (10.7%) 93 (36.9%) 132 (52.4%) |
0.001* |
| Waist circumference grades (cm)
< 102 ≥ 102 |
6 (12.5%) 42 (87.5%) |
78 (31%) 174 (69%) |
0.008* |
| Waist/hip ratio |
1.01 ± 0.07 |
0.96 ± 0.05 |
<0.0001* |
| Waist/height ratio |
62.70 ± 4.68 |
60.11± 8.10 |
0.03* |
*Significant level of p-value is < 0.05.
* p value of frequency was calculated by using chi-square test.
* p value of means was calculated by using independent sample t-test.
In term of complications of diabetes mellitus, our results demonstrated no significant differences between the two studied groups (Table 3). Table 4 shows the comparison between routine investigations and hypogonadism of hypogonadism according to (Total Testosterone + ADAM +ve) versus those without hypogonadism: It was significant in urea, creatinine, eGFR, SGPT with p value (0.01, >0.0001, 0.02, >0.0001). As regard glycemic control non of our hypogonadal patients have HbA1c >7%, but in the non hypogonadal group 33.3% have HbA1c >7 and 66.7% have HbA1c <7%, with p value 0.0001. Regarding the relation between specific investigations and hypogonadism according to total testosterone it was significance in free testosterone, total testosterone, FSH, ADAM score with p value of 0.001, > 0.0001, 0.003, > 0.0001 respectively (Table 5).
Table 3: The classification of complications between the hypogonadism according to (Total Testosterone + ADAM +ve) versus those without hypogonadism.
|
Diabetic complications |
Hypogonadism |
No hypogonadism |
p-value |
| All number of patients complaint of complications |
15(31.25%) |
87 (34.5%) |
|
| Neuropathy |
6 (12.5%) |
33 (13.09%) |
0.9 |
| Stroke |
3 (6.25%) |
9 (3.57%) |
0.4 |
| Ischemic heart disease |
3 (6.25%) |
24 (9.52%) |
0.6 |
| Retinopathy |
3 (6.25%) |
18 (7.14%) |
0.8 |
| Nephropathy |
0 (0%) |
3(1.19%) |
0.4 |
Table 4: Comparison of Routine investigations in hypogonadism group according to (Total Testosterone + ADAM +ve) versus those without hypogonadism.
|
Routine investigations |
Hypogonadism |
No hypogonadism |
p-value |
| Urea (mg/dL) |
36.87 ± 9.71 |
32.42 ± 11.28 |
0.01* |
| Creatinine(mg/dL) |
1.08 ± 0.19 |
0.95 ± 0.22 |
<0.0001* |
| eGFR(ml/min/1.73 M2) |
82.96 ± 19.95 |
89.79 ± 18.57 |
0.02* |
| SGOT(Iu/L) |
23.56 ± 11.95 |
24.20 ± 15.73 |
0.7 |
| SGPT (Iu/L) |
27.68 ± 13.24 |
20.01 ± 8 |
<0.0001* |
| HbA1C (%) |
10.01 ± 1.60 |
8.39 ± 2.17 |
<0.0001* |
| HbA1C ranges (%)
< 7 ≥ 7 |
0 (0%) 48 (100%) |
84 (33.3%) 168 (66.7%) |
<0.0001* |
| HDL (mg/dL) |
35.37 ± 6.40 |
37.34 ± 9.57 |
0.2 |
| LDL (mg/dL) |
149.43 ± 41.47 |
142.27 ± 42.69 |
0.3 |
| TGS (mg/dL) |
180.93 ± 51.75 |
202.05 ± 85.64 |
0.1 |
| Cholesterol (mg/dL) |
223.43 ± 41.01 |
224.96 ± 45.70 |
0.8 |
*Significant level of p- value is < 0.05.
*p value of means was calculated by using independent sample t-test.
Table 5: Relation between specific investigations and hypogonadism according to Total testosterone of the studied group.
|
Specific investigations |
Hypogonadism |
No hypogonadism |
p-value |
| Free testosterone (pg/mL) |
5.58 ± 3.25 |
7.42 ± 3.62 |
0.001* |
| Total testosterone (nmol/L) |
9.09 ± 2.87 |
26.68 ± 12.63 |
<0.0001* |
| FSH(IU/L) |
8.42 ± 4.26 |
9.25 ± 4.68 |
0.003* |
| LH(IU/L) |
11 ± 5.45 |
12.72 ± 6.06 |
0.06 |
| ADAM score
Positive Negative |
48 (100%) 0(0%) |
150 (59.5%) 102 (40.5%) |
<0.0001* |
| Total Testosterone level
Normal Low |
0 (0%) 48 (100%) |
243 (96.4%) 9 (3.6%) |
<0.0001* |
*Significant level of p- value is < 0.05.
*p value of frequency was calculated by using chi-square test.
*p value of means was calculated by using independent sample t-test.
Table 6 shows multiple logistic regression analysis for factors affecting Hypogonadism among patients according to (Total Testosterone + ADAM +ve) versus those without hypogonadism it was found that age, random blood sugar, body mass index, HbA1c are independent risk factors for the development of hypogonadism with odds ratio (0.95, 1, 1.1, 1.37) with p value (0.02, 0.03, 0. 03, 0.008) respectively.
Table 6: Multiple logistic regression analysis for factors affecting Hypogonadism among patients according to (Total Testosterone + ADAM +ve) versus those without hypogonadism.
|
Independent variables |
Adjusted odds for multivariate (95% CI) |
P-value |
| Age (years) |
0.95 (0.91-0.99) |
0.02* |
| Random blood sugar (mg/dL) |
1 (1-1.01) |
0.03* |
| BMI(KGm/M2) |
1.1 (1-1.19) |
0.03* |
| Waist circumference (Cm) |
1 (0.96-1.05) |
0.8 |
| HbA1c (%) |
1.37 (1.08-1.74) |
0.008* |
| HDL(mg/dL) |
0.95 (0.91-1) |
0.06 |
| TGS (mg/dL) |
0.99 (0.99-1) |
0.2 |
| FSH (IU/L) |
0.94 (0.88-1) |
0.08 |
| LH (IU/L) |
0.99 (0.91-1.08) |
0.8 |
Figure 1 shows the receiver operating characteristic (ROC) analysis of demonstration of the accuracy of indices and cut off values for the studied total testosterone for predicting the hypogonadism according to total testosterone + ADAM score positive: The area under the curve (AUC) was 0.98 ” p-value <0.0001″ with sensitivity 100% and specificity of 96.4% at Cut off value ≤ 12. Figure 2 shows the ROC analysis of demonstration of the accuracy of indices and cut off values for the ADAM score for predicting the hypogonadism according to total testosterone + ADAM score positive: The AUC was 0.70 ” p-value <0.0001″ with sensitivity 100% and specificity of 40.5% at Cut off value<0.
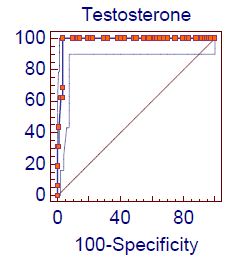
Figure 1: Roc curve analysis of total testosterone level in hypogonadism according to Total testosterone
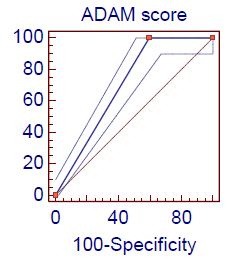
Figure 2: Roc curve analysis of ADAM score in hypogonadism according to Total testosterone
Figure 3 shows the ROC analysis of demonstration of the accuracy of indices and cut off values for the studied HbA1c for predicting the hypogonadism according to total testosterone + ADAM score positive: The AUC was 0.72 ” p-value <0.0001″ with sensitivity 87.5% and specificity of 58.3% at Cut off value < 8.7. Figure 4 shows the ROC analysis of demonstration of the accuracy of indices and cut off values for the studied FSH for predicting the hypogonadism according to total testosterone + ADAM score positive: The AUC was 0.60 ” p-value=0.02″ with sensitivity 75% and specificity of 48.8% at Cut off value < 17.
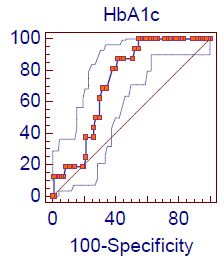
Figure 3: Roc curve analysis of HbA1c level in hypogonadism according to Total testosterone
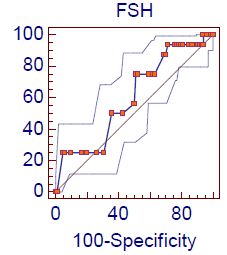
Figure 4: Roc curve analysis of FSH level in hypogonadism according to Total Testosterone
Figure 5 shows the ROC analysis of demonstration of the accuracy of indices and cut off values for the studied eGFR for predicting the hypogonadism according to free testosterone + ADAM score positive: The AUC was 0.39 ” p-value 0.003″ with sensitivity 53.6% and specificity of 37% at Cut off value < 82.5.
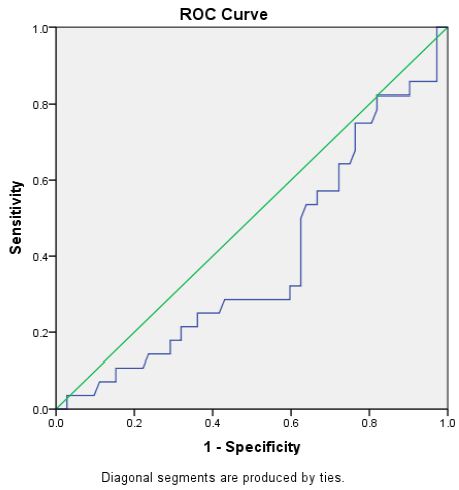
Figure 5: Roc curve analysis of e GFR in hypogonadism according to Free Testosterone
Discussion
Male hypogonadism is a common disease characterized by certain clinical features and low levels of serum testosterone. Its typical clinical manifestations include physical decline, memory loss, difficulty paying attention, depression, loss of libido, and erectile dysfunction. It significantly impacts patients’ quality of life [8]. Recently, studies have shown that hypogonadism is closely related to the development of diabetes [9]. It has been confirmed that male patients with T2D are significantly more likely to develop hypogonadism: the proportions of diabetes patients with low total testosterone levels are 36.5% [10]. Male hypogonadism seriously affects the quality of life in patients with diabetes [11,12]. So far, it is unclear which correlates of diabetes are associated with hypogonadism. Therefore, it is especially important to explore the risk factors for hypogonadism to facilitate prevention, diagnosis, and early treatment.
The current study was designed to evaluate the prevalence and risk factors o hypogonadism in patients with T2D among the egyptian population by using an ADAM questionnaire with the use both total and free testosterone level (≤ 12nmol, ≤5.7). We studied 300 male diabetic, according total testosterone level it showed that the prevalence of hypogonadism was 24.2% with of whom 56.3% was secondary hypogonadism and 43.7% was primary hypogonadism, according to free testosterone level it was found that the prevalence of hypogonadism was 42.42%, and secondary hypogonadism and 42.9% was primary hypogonadism. Similar to our results, the study of Dhindsa et al. [13] which was conducted in 103 patients by hypogonadism (33% in patients aged 28e80 years) and they reported that their high prevalence might be attributed to a higher mean BMI, Multicentre study was done in India reported a hypogonadism prevalence of 20.7% among patients with diabetes mellitus [4].
In our study we found that the prevalence of hypogonadism was higher with free testosterone cut of level (≤5.7 pg/mL) in comparison to total testosterone (≤12 nmol/L), similar to our findings the study of Rhoden et al. [14] which was cross-sectional study from Brazil who reported that that free and total testosterone levels were subnormal in 46% and 34% of diabetics respectively. In the present study hypogonadotropic hypogonadism is the predominant type of hypogonadism in our diabetic subjects. As, 43.7% had primary hypogonadism (LH > 10 MIU/ML) and 56.3% had secondary hypogonadism (LH < 10 MIU/ML); Similar to our finding, the study of Chandel et al. [15] found that LH and FSH concentrations in type 2 diabetic patients with low free testosterone concentrations were in the normal range. Tenover et al. [16] found that the majority of hypogonadal men over the age of 60 had low, or inappropriately normal LH levels. In contrary to our results the study of Ali et al. [17] who found high serum and urinary FSH and LH among diabetics with low serum total and serum free testosterone levels and Kapoor et al. [18] who found that 7% had hypogonadotropic hypogonadism.
Regarding to risk factors for development of hypogonadism, the present study should that age is important risk for development of hypogonadism. A higher prevalence of low total testosterone (69%) was seen in men aged between 60 and 70 years. This finding in agreement Grossmann et al. [19] who reported that 43% of men of the same age had low total testosterone. Many studies reported that the fraction of diabetic men with a subnormal level of total testosterone increased with age [20-22]. Although we found that lower testosterone level was found in older age groups but univariant relationship between total tesosterone and age is not there in similar studies conducted in South Africa and New York [13,23]. In contrast to this study, a study conducted in Jordan reported a significant positive correlation of age with TT [24]. Studies in England and Nigeria reported the presence of a significant negative correlation between age and TT level [25,26]. The most possible explanation for these inconsistencies is that serum hormone binding globulin (SHBG), which accounts for 60-80% of testosterone binding, increases with age. Yet low levels of SHBG may occur in the presence of insulin resistance, thus resulting in a decrease in TT levels. Therefore, in the absence of the assessment of bioavailable testosterone levels, the degree to which this confounder (SHBG) affected our results if at all is difficult to speculate on [27]. In the present study, there was significant association between the serum testosterone level and HbA1c concentration. This finding is consistent with the results obtained by other study Kapoor et al. [25], Our findings also contradict the finding of the study undertaken by Fukui et al. [22], who found that total testosterone concentrations correlated positively with HbA1c concentrations while opposing what was found by Grossmann et al. [21], and Dandona et al. [28].
In the present study, we observed negative association of serum testosterone levels with blood glucose markers including HbA1c values, which is in consistent with the studies of Fukui et al. [22], Rabia et al. [29], and Laaksonen et al. [30] where serum testosterone levels were shown to have negative association with glucose markers, Not only HbA1c levels but Insulin resistance indicators as BMI, waist/hip ratio and waist/height ratio among males have also been found to be related with lower levels of testosterone levels. Many such studies have confirmed that insulin resistance is found to be associated with low serum testosterone levels. The reason would be that the testosterone regulates GLUT-4 gene expression and other genes important for insulin signaling. Lower testosterone levels leads to decrease in the expression of GLUT-4 levels in muscles so reduction in the glycolytic enzyme activity in muscle, liver and abdominal adipose tissues [31,32]. Testosterone reduction also causes dysregulation of lipid metabolism which also increases the risk of developing diabetes [33,34].
Conclusion
Several risk factors of diabetes are associated closely with hypogonadism. Age, BMI, blood sugar, and Hb A1c are independent risk factors for the development of hypogonadism in male patients with T2D.
References
- Powers AC Diabetes Mellitus: Diagnosis, Classification, and Pathophysiology In: Longo DL, Fauci AS, Kasper DL, Hauser SL, Jameson JL, Loscalzo J: Harrison’s Principles of Internal Medicine, 19th ed, New York: McGraw-Hill; 2015;Ch.417: 2399-2406.
- Jones TH, Arver S, Behre HM, Buvat J, Meuleman E, et al. (2011) TIMES2 Investigators. Testosterone replacement in hypogonadal men with type 2 diabetes and/or metabolic syndrome (the TIMES 2 study). Diabetes Care 34: 828-837. [crossref]
- Dandona P, Rosenberg MT (2010) A practical guide to male hypogonadism in the primary care setting. Int J Clin Pract 64: 682-696. [crossref]
- Agarwal PK, Singh P, Chowdhury S, Sharma SK, Majumdar A, et al. (2017) A study to evaluate the prevalence of hypogonadism in Indian males with Type-2 diabetes mellitus. Indian J Endocrinol Metab 21: 64-70. [crossref]
- Jones TH (2007) Testosterone associations with erectile dysfunction, diabetes and metabolic syndrome. Eur Urol Suppl 6: 847-857.
- American Diabetes Association. Standards of medical care in diabetes. Diabetes Care 36: S11-S66.
- Salonia A, Rastrelli G, Hackett G, Seminara SB, Huhtaniemi IT, et al. (2019) Paediatric and adult-onset male hypogonadism. Nat Rev Dis Primers 5: 38. [crossref]
- Basaria (2014) “Male hypogonadism,” The Lancet 383: 1250-1263.
- Bhasin S, Brito JP, Cunningham GR, et al. (2018) Testosterone therapy in men with hypogonadism: an Endocrine Society clinical practice guideline. J Clin Endocrinol Metab 103: 1715-1744. [crossref]
- Al Hayek AA, Robert AA, Alshammari G, Hakami H, Al Dawish MA (2017) Assessment of hypogonadism in men with type 2 diabetes: a cross-sectional study from Saudi Arabia. Clin Med Insights Endocrinol Diabetes 10. [crossref]
- Portillo-Sanchez, F Bril, M Maximos, Lomonaco R, Biernacki D, et al. (2015) “High prevalence of nonalcoholic fatty liver disease in patients with type 2 diabetes mellitus and normal plasma aminotransferase levels,” Journal of Clinical Endocrinology & Metabolism 100: 2231-2238. [crossref]
- Yaturu (2009) “Diabetes and skeletal health,” Journal of Diabetes 4: 246-254.
- Dhindsa S, Prabhakar S, Sethi M, Bandyopadhyay A, Chaudhuri A, et al. (2004) Frequent occurrence of hypogonadotropic hypogonadism in type 2 diabetes. J Clin Endocrinol Metab 89: 5462-5468. [crossref]
- Rhoden EL, Ribeiro EP, Teloken C, Souto CA (2005) Diabetes mellitus is associated with subnormal serum levels of free testosterone in men. BJU Int 96: 867-870. [crossref]
- Chandel A, Dhindsa S, Topiwala S, Chaudhuri A, Dandona P (2008) Testosterone concentration in young patients with diabetes. Diabetes Care 31: 2013-2017. [crossref]
- Tenover JS, Matsumoto AM, Plymate SR, Bremner WJ (1987) The effects of ageing in normal men on bioavailable testosterone and leuteinizing hormone secretion: response to clomiphene citrate. J Clin Endocrinol Metab 65: 1118-1126. [crossref]
- Ali ST, Shaikh RN, Ashfaqsiddiqi N, Siddiqi PQ (1993) Serum and urinary levels of pituitary-gonadal hormones in insulin-dependent and non-insulin dependent diabetic males with and without neuropathy. Arch Androl 30: 117-123. [crossref]
- Kapoor D, Goodwin E, Channer KS, Jones TH (2006) Testosterone replacement therapy improves insulin resistance, glycaemic control, visceral adiposity and hypercholesterolaemia in hypogonadal men with type 2 diabetes. Eur J Endocrinol 154: 899-906. [crossref]
- Grossmann M, Thomas MC, Panagiotopoulos S, Sharpe K, MacIsaac RJ, et al. (2008) Low testosterone levels are common and associated with insulin resistance in men with diabetes. J Clin Endocrinol Metab 93: 1834-1840. [crossref]
- Corrales JJ, Burgo RM, Garca-Berrocal B, Almeida M, Alberca I, et al. (2004) Partial androgen deficiency in aging type 2 diabetic men and its relationship to glycemic control. Metabolism 53: 666-672. [crossref]
- Grossmann M, Panagiotopolous S, Sharpe K, MacIsaac RJ, Clarke S, et al. (2009) Low testosterone and anaemia in men with type 2 diabetes. Clin Endocrinol (Oxf) 70: 547-553. [crossref]
- Fukui M, Soh J, Tanaka M, Kitagawa Y, Hasegawa G, et al. (2007) Low serum testosterone concentration in middle-aged men with type 2 diabetes. Endocrine J 54: 871-877. [crossref]
- Kempa T, Rheedera P (2015) The prevalence and association of low testosterone levels in a South African male, diabetic, urban population. J Endocrinol Metab Diabetes S Afr 20: 92-97.
- Ogbera OA, Sonny C, Olufemi F, Wale A (2011) Hypogonadism and subnormal total testosterone levels in men with type 2 diabetes mellitus. J Coll Physicians Surg Pak 21: 517-521. [crossref]
- Kapoor D, Aldred H, Clark S, Channer KS, Jones TH (2007) Clinical and biochemical assessment of hypogonadism in men with type 2 diabetes: correlations with bioavailable testosterone and visceral adiposity. Diabetes Care 30: 911-917. [crossref]
- Ugwu TE, Ikem RT, Kolawole BA, Ezeani IU (2016) Clinicopathologic assessment of hypogonadism in men with type 2 diabetes mellitus. Indian J Endocrinol Metab 20: 667-673. [crossref]
- Corona G, Mannucci E, Schulman C, Petrone L, Mansani R, et al. (2006) Psychobiologic correlates of the metabolic syndrome and associated sexual dysfunction. Eur Urol 50: 595-604. [crossref]
- Dandona P, Dhindsa S, Chauduri A, Bhatia V, Topiwala S (2008) Hypogonadotropic hypogonadism in type 2 diabetes. Ageing Male 11: 107-117.
- Rabia Farooq, Bhat MH, Majid S, Mir MM (2020) “Association of T2DM with Lowering of Testosterone Levels among Kashmiri Males”. EC Pharmacology and Toxicology 6: 19-26. [crossref]
- Laaksonen DE, Niskanen L, Punnonen K, Nyyssönen K, Tuomainen TP, et al. (2005) “The metabolic syndrome and smoking in relation to hypogonadism in middle-aged men: a prospective cohort study”. The Journal of Clinical Endocrinology and Metabolism 90: 712-719. [crossref]
- Holmang A, Larsson BM, Brzezinska Z, Björntorp P (1992) “Effects of short-term testosterone exposure on insulin sensitivity of muscles in female rats”. American Journal of Physiology 262: E851-E855. [crossref]
- Kelly DM, Akhtar S, Sellers DJ, Muraleedharan V, Channer KS, et al. (2016) “Testosterone differentially regulates targets of lipid and glucose metabolism in liver, muscle and adipose tissues of the testicular feminised mouse”. Endocrine 54: 504-515. [crossref]
- Haring R, Baumeister SE, Völzke H, Dörr M, Felix SB, et al. (2011) “Prospective association of low total testosterone concentrations with an adverse lipid profile and increased incident dyslipidemia”. European Journal of Cardiovascular Prevention and Rehabilitation 18: 86-96. [crossref]
- Senmaru T, Fukui M, Okada H, Mineoka Y, Yamazaki M, et al. (2013) “Testosterone deficiency induces markedly decreased serum triglycerides, increased small dense LDL, and hepatic steatosis mediated by dysregulation of lipid assembly and secretion in mice fed a high-fat diet”. Metabolism-Clinical and Experimental 62: 851-860. [crossref]