DOI: 10.31038/SRR.2022511
Abstract
Background: Head and neck cancers are increasingly becoming a prominent part of oncological practice in Nigeria due to increasing awareness and advances in this area of practice. Tumours of the head and neck region make up about 5-30% of all tumours in the body and often constitute a burden that impacts their sufferers physically, socially, financially and psychologically. In addition, there has been enormous challenges in the management of these conditions in a developing setting such as ours. The study aimed at assessing the pattern of presentation and management of head and neck cancers cases that presented at Federal Medical Centre, Owerri, Nigeria.
Materials and methods: The study is a 5-year retrospective analysis of all head and neck cancer cases that presented to the ENT Department of Federal Medical Centre, Owerri, Nigeria between January 2015 and December 2019. Data was extracted from patients’ case files, sorted and analyzed with SPSS version 25.0.
Results: A total of sixty-eight (68) head and neck cancer cases were seen over the period, however fifteen (15) cases had incomplete records therefore only fifty-three (53) cases were analyzed. A M:F ratio of 1.3:1 was recorded with the mean age of the patients being 53.5±14.0 years. The mean duration of presenting complaints was 12.2±9.2months. The commonest site of cancer among the patients was the larynx (26.3%) while the commonest histological diagnosis was Squamous cell carcinoma (54.5%). Majority of patients (94.3%) presented with advanced disease (stages III and IV). \The commonest modalities of treatment were surgery alone (35.9%) and chemoradiation therapy (33.9%). Outcome of treatment at 3 months was satisfactory in 43.4%. About 15.1% of the patients did not attend follow up clinics after treatment while 3 patients (5.7%) died within 3 months of treatment.
Conclusion: The pattern of presentation and principles of management of head and neck cancers in Federal Medical Centre, Owerri over recent years are similar to those of contemporary facilities around the region and country. The challenges facing the management of these cases include late presentation, financial paucity, poor social support system and poor follow up culture.
Introduction
Head and neck cancers are increasingly becoming prominent in oncological practice in Nigeria owing to the attention given and the advances made in this area of clinical practice. Tumours of the head and neck make up 5-8% of all tumours in the human body in Europe and America. [1] In India, this figure can be as high as 30%. [2] The prevalence of head and neck cancers in Nigeria vary widely from 6.2% in southern Nigeria [3] to 30% in Northern Nigeria. [4] Worthy of note is that these figures were essentially derived from hospital-based studies and as such may represent only a tip of the iceberg of the real burden of disease. This observation notwithstanding, up to half a million cases of head and neck tumours are diagnosed yearly worldwide and a significant proportion of these are in developing countries. [5] The management of head and neck tumours in Africa and Nigeria in particular is still faced with many challenges due to relative paucity of treatment facilities and widespread ignorance of the nature of the disease among the population leading to late hospital presentation. The aim of this study was to assess the pattern of presentation and management of head and neck cancers that presented to a tertiary health centre, Federal Medical Centre, Owerri, Nigeria over a 5-year period (between January 2015 to December 2019).
Materials and Methods
The study was a retrospective analysis of all head and neck tumour cases that presented to the Ear, Nose and Throat/Head and Neck Department of Federal Medical Centre, Owerri in South-Eastern Nigeria between January 2015 and December 2019. A total of sixty-eight (68) head and neck cancer cases were seen over the period, however fifteen (15) cases had incomplete records and were excluded, therefore only fifty-three (53) cases were analyzed. The case files of all the patients were retrieved from the hospital records and data extracted and analyzed with SPSS software version 25.0. The data analyzed include the socio-demographic characteristics, presenting complaints, clinical and histological diagnoses, treatment and general outcome. The results are represented in tables and charts. Statistical significance was set at p < 0.05 (Tables 1-7).
Table 1: Sociodemographic characteristics of the patients
|
|
Male | Female | Total (%) |
p-value |
|
| Age of patients (years) |
<10 |
1 | 0 | 1 (1.9) |
p = 0.353 |
|
11-20 |
1 | 1 | 2 (3.8) | ||
| 21-30 | 5 | 4 |
9 (16.9) |
||
|
31-40 |
4 | 3 | 7 (13.2) | ||
| 41-50 | 6 | 5 | 11 (20.8) | ||
|
51-60 |
5 | 3 | 8 (15.1) | ||
| 61-70 | 4 | 3 |
7 (13.2) |
||
|
71-80 |
3 | 3 | 6 (11.3) | ||
|
>80 |
1 | 1 |
2 (3.8) |
||
| Total | 30 | 23 | 53 (100.0) | ||
| Level of education |
Primary |
6 | 4 | 10 (18.9) |
P = 0.671.
|
|
Secondary |
12 | 6 |
18 (33.9) |
||
|
Tertiary |
10 | 11 | 21 (39.6) | ||
| None | 2 | 2 |
4 (7.6) |
||
|
Total |
30 | 23 |
53 (100.0) |
||
| Occupation |
Student |
2 | 3 | 5 (9.4) |
p = 0.127
|
|
Unemployed |
3 | 5 | 8 (15.1) | ||
| Business | 19 | 7 |
26 (49.1) |
||
|
Civil servant |
6 | 8 | 14 (26.4) | ||
| Total | 30 | 23 |
53 (100.0) |
Table 2: Duration of complaints prior to presentation
|
Male |
Female | Total (%) |
p-value |
|
| < 2 months |
3 |
1 | 4 (7.6) |
0.202 |
| 2-6 months |
9 |
13 |
22 (41.4) |
|
| 7-12 months |
12 |
6 |
18 (33.9) |
|
| 13-24 months |
4 |
0 |
4 (7.6) |
|
| 25-48 months |
1 |
2 |
3 (5.7) |
|
| > 48 months |
1 |
1 |
2 (3.8) |
|
| Total |
30 |
23 |
53 (100.0) |
The mean duration of presenting complaints prior to presentation was 12.2+/-9.2 months
Table 3: Primary sites of tumours among the patients
|
Male |
Female | Total (%) |
p-value |
|
| Larynx |
12 |
2 | 14 (26.3) |
0.001 |
| Sinonasal |
6 |
5 |
11 (20.7) |
|
| Nasopharynx |
7 |
1 |
8 (15.1) |
|
| Parotid gland |
1 |
4 |
5 (9.4) |
|
| Hypopharynx |
0 |
4 |
4 (7.6) |
|
| Oesophagus |
2 |
1 |
3 (5.7) |
|
| Submandibular gland |
2 |
2 |
4 (7.6) |
|
| Thyroid gland |
0 |
2 |
2 (3.8) |
|
| Parapharynx |
0 |
2 |
2 (3.8) |
|
| Total |
30 |
23 |
53 (100.0) |
Table 4: Histological diagnosis of the tumours
|
Male |
Female | Total (%) |
p-value |
|
| Squamous cell carcinoma |
24 |
5 | 29 (54.5) |
0.001 |
| Adenocarcinoma |
0 |
5 |
5 (9.4) |
|
| Lymphoma |
1 |
3 |
4 (7.6) |
|
| Sarcoma |
1 |
1 |
2 (3.8) |
|
| Mucoepidermoid carcinoma |
2 |
1 |
3 (5.7) |
|
| Adenoid cystic carcinoma |
0 |
3 |
3 (5.7) |
|
| Acinic cell carcinoma |
1 |
0 |
1 (1.9) |
|
| Verrucous carcinoma |
0 |
3 |
3 (5.7) |
|
| Others |
1 |
2 |
3 (5.7) |
|
| Total |
30 |
23 |
53 (100.0) |
Table 5: Stages of tumours among the patients
|
Male |
Female |
Total (%) |
|
| Stage I |
0 |
0 |
0 (0.0) |
| Stage II |
1 |
2 |
3 (5.7) |
| Stage III |
11 |
7 |
18 (33.9) |
| Stage IV |
14 |
18 |
32 (60.4) |
| Total |
26 |
27 |
53 (100.0) |
Table 6: Treatment modalities offered to the patients
|
Male |
Female | Total (%) |
p-value |
|
| Surgery alone |
12 |
7 | 19 (35.9) |
0.210 |
| Surgery & Radiotherapy |
2 |
6 |
8 (15.1) |
|
| Chemotherapy and Radiotherapy |
11 |
7 |
18 (33.9) |
|
| Surgery, Chemotherapy and Radiotherapy |
5 |
3 |
8 (15.1) |
|
| Total |
30 |
23 |
53 (100.0) |
Table 7: Outcome of treatment 6 weeks after treatment
|
Male |
Female | Total (%) |
p-value |
|
| Satisfactory |
13 |
10 | 23 (43.4) |
0.594 |
| Persistent disease |
3 |
2 |
5 (9.4) |
|
| Death |
2 |
1 |
3 (5.7) |
|
| Lost to follow |
9 |
5 |
14 (26.4) |
|
| No follow up |
3 |
5 |
8 (15.1) |
|
| Total |
30 |
23 |
53 (100.0) |
Results
A total of 53 head and neck cancer cases were analyzed over the period (excluding ophthalmological, neurosurgical and oral tumours). This comprised 30 males and 23 females with a male to female ratio of 1.3:1. The ages of the patients studied ranged from 9 to 85 years with a mean age of 53.5±14.0 years. The largest proportion of the patients (39.6%) had tertiary level of education while 34.0% and 18.9% had secondary and primary levels of education respectively.
Discussion
Socio-demographic Characteristics
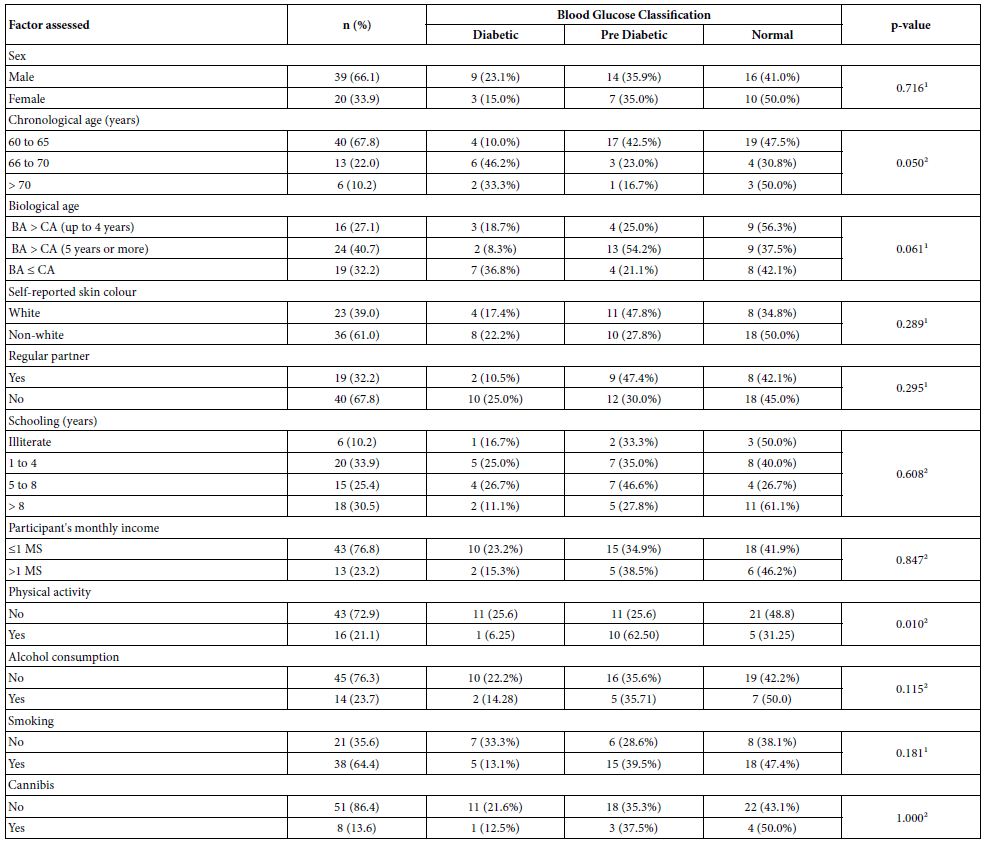
The study noted slight male predominance with a male to female ratio of 1.3:1. This difference was not statistically significant (p = 0.095). Similar pattern was recorded in similar studies notably by Forae et al, [6] Akinshipo et al [7] and Kanu et al. [8] A systematic review by da Lilly-Tariah et al also found M:F ratio ranging from 1.1:1 to 2.3:1 after reviewing 27 publications on the subject. [9] The reason for this pattern is not known however, it may partly be due to the overwhelming preponderance of the male gender in laryngeal cancers which have widely been reported to be among the commonest head and neck cancers in this part of the world. The mean age of patients in this study (53.5±14.0 years) was slightly higher than those found by other workers; Erinoso et al found 39.6±21.1 years, [10] Adeyemi et al found 43.8±19.6 years, [11] Fomete et al found 48.4±16.2 years [12] and Kodiya et al found 35.5±20.1 years. [13] This suggests that head and neck cancers is prevalent in the middle ages in our environment where life expectancy is not as high as in the developed world. Notably, some other similar studies recorded peak prevalence amongst patients between the 4th and 5th decades of life [14,15].
Presenting Features
The commonest presenting symptoms include hoarseness (34.0%), nasal obstruction (30.8%), epistaxis (28.3%), dysphagia (15.1%) and neck swelling (9.4%). This pattern is in keeping with patterns found by similar work where sinonasal and laryngeal malignancies were most predominant. [14,15] The mean duration between the onset of symptoms and presentation was 12.2±9.2 months with majority of the patients (33.9%) presenting after 7-12 months of having the symptoms. This relatively late pattern of presentation is not uncommon in our environment where self-medication with over-the-counter medication is often the first form of care. Only 17 (32.1%) of the patients had formal prior consultations by general practitioners before being referred for specialist attention. In majority of the cases, persistent and worsening symptoms prompted their eventual presentation, albeit in advanced stages. This delayed pattern of presentation was also reported in studies by Okwor et al and in the systematic review by da Lilly-Tariah et al. [9]
Tumour Sites/Clinical Diagnosis
Majority of the tumours were in the larynx (26.3%), Sinonasal region (20.7%) and the nasopharynx (15.1%) while the thyroid and the parapharyngeal area had the lowest proportions at 3.8% each. A systematic review of 27 similar studies found the nasopharynx to be the commonest site followed by the sinonasal region and the larynx.9 Identical pattern was recorded by Nwawolo et al, [14] in Lagos, south-west Nigeria however, about 300km northwards, Ologe et al in Ilorin, Nigeria found relatively low prevalence for the larynx (ranking 4th with 4.5%). [15] The reason for this discrepancy is not clear, however variation in social behaviours such as smoking and alcohol intake between these regions are thought to play a role. [16,17] Our study reveals significant male predominance among laryngeal cancer sufferers (M:F ratio of 6:1) with similar pattern widely reported in this part of the world and attributed largely to such social practices as smoking and alcohol intake which are commoner among men. [3,8,9,12] Similar trend applies for nasopharyngeal carcinoma with a M:F of 7:1 in this study.
Tumour Type/Histological Diagnosis
By far, the predominant cancer in this study was squamous cell carcinoma accounting for 54.5%. Less common types include adenocarcinoma (9.4%), lymphomas (7.6%), adenoid cystic carcinoma (5.7%), sarcomas (3.8%) and acinic cell carcinoma (1.9%). An overwhelming majority (82.9%) of head and neck cancers in this study are of epithelial origin which largely mirrors the pattern in several similar studies in Nigeria such as those by Nwawolo et al (carcinomas 91.0% and sarcomas 6.6%), [14] Forae et al (carcinomas 83.4%, lymphomas 7.7% and sarcomas 3.5%), [6] Akinshipo et al (carcinomas 70.0%, sarcomas 15.0% and sarcomas 15.0%) [7] and Ologe et al (carcinomas 70.8%, lymphomas 20.2% and blastomas 9.0%). [15] The predominance of epithelial cancers is understandable considering that majority of the surfaces of the upper aerodigestive tract where tumourigenesis generally occurs are lined by squamous cell and columnar epithelium. Furthermore, a Nigerian meta-analysis of head and neck cancers lends credence to the pattern. [9]
Tumour Stage
The cases were graded using the TNM group staging (UICC/AJCC) models. Stage III and IV tumours accounted for 33.9% and 60.4% of the tumours respectively and when combined, the two stages accounted for 94.3% of all cases. Similar results were obtained Okwor et al in Ibadan, southwest Nigeria (stages III and IV cancers accounted for 87.5% of all head and neck cancers) [16] and a systematic review of 27 studies by da Lilly-Tariah et al. [9] This underscores the rampant delayed presentation often experienced in the more deprived regions of sub-saharan/tropical Africa and brings to fore the challenges faced by clinicians managing head and neck cancers in this region of the world. Inadequate health knowledge and lack of efficient primary health care centres may be factors responsible for late presentation of head and neck cancers in Nigeria. More elaborate studies aimed at ascertaining these factors are desirable.
Treatment/Management
The modality of treatment adopted for each case was decided based on the nature/stage of the tumour and the available resources for treatment. Because of the lack of radiotherapy facility at the centre of study, patients who required radiation therapy were referred to centres where such facilities were available however, they were seen on follow up schedules at our centre, where feasible. Majority of the patients (35.9%) were treated with surgery alone while 33.9% had combined chemoradiation without surgery. Because majority of the patient presented with advanced disease, there was limited chance for complete surgical removal of the tumour in many patients who were then referred for chemoradiation therapy. This pattern of intervention described here have been reported by authors of similar works. [14,16] A systemic review by da Lilly-Tariah et al revealed that majority of all head and neck cancers in Nigeria presented late and only had palliative chemoradiation therapy. [9] The challenges precipitating this has been highlighted above.
Outcome
The outcome of head and neck cancers depend on a number of factors which include nature and stage of the disease as well as quality of intervention given. Beyond these factors are the peculiar considerations of financial paucity and poor social support systems among many patients such that even when appropriate treatment modalities are available, they are often unaffordable to many patients in our setting. The outcome of our treatment after 3 months was assessed in this study by comparing the symptoms and functionality of the patients pre- and post-management.
Eight patients (15.1%) did not show up for any follow up visits at the clinics in the initial 3 months after treatment while 26.4% were lost to follow up within 3 months (this group had only one follow up visit and defaulted on the next). Among these groups, the outcome of management could not be assessed. Of the patients seen on follow up, 9.4% were found to have features of persistent disease after treatment whereas 43.4% were deemed to have satisfactory outcome. Mortality was recorded in 3 patients (5.7%) within 3 months of follow up; all 3 had advanced cancer with metastasis. Accurate reports on outcome of head and neck cancers in Nigeria are few and far between as highlighted by da Lilly-Tariah et al in their systemic review. [9] A study by Okwor et al assessing the survivorship of head and neck cancer patients in University College Hospital, Ibadan, Nigeria found that the median survival duration after treatment was 7.8 years for stage 1 cancers and 1.9 years for stage 4 diseases. [16] In the same study, combined treatment modalities were found to increase survival rates significantly compared with single treatment modalities. [16] The dearth of advanced modalities for treatment of cancers in our region may account for relatively poorer outcomes when compared with figures from resource-rich climes even though our study did not follow up the patients for more than 3 months.
Follow up of head and neck cancers pose a big challenge to clinicians partly due to low socioeconomic status and poor enlightenment among the patients and their care givers in this part of the world. Many patients do not understand the impact of being seen at scheduled intervals following definitive treatment. Following the initial relief from symptoms it is not unusual for such patients to default check-ups thereby denying researchers the golden opportunity of measuring treatment outcome more accurately. Further researches, preferably prospective and multi-centre based are desirable to assess the survival and outcome of patients treated for head and neck cancers in our region.
Conclusion
To conclude, head and neck cancer patients have presented in significant numbers to Federal Medical Centre, Owerri in recent times and the case profiles mirror those of similar tertiary institutions. Although many of the patients presented with late diseases, concerted efforts were made at diagnosing, staging and treating the diseases. The challenges facing the management of these cases include late presentation, financial paucity, poor social support system and poor follow up culture.
References
- Tobias JS (1994) Cancers of the Head and Neck. BMJ 308: 961-966. [crossref]
- Sanghvi LD, Rao DN, Joshi S (1989) Epidemiology of Head and Neck Cancer. Semin Surg Oncol 5: 305-309.
- Lilly Tariah da OB, Nwana EJC, Okeowo PA (2000) Cancers of the Ear, Nose and Throat. Nig J Surg Sci 10: 52-56.
- Bhatia PL (1990) Head and Neck cancers in Plateau State, Nigeria. West Afr J Med 9: 304-310. [crossref]
- Goldenberg D, Lee J, Koch WM, et al. (2004) Habitual risk factors for Head and Neck cancers. Otolaryngol Head Neck Surg 131: 986-993. [crossref]
- Forae GD and Nwafor CC (2017) Pattern of occurrence of primary head and neck cancers presenting in Benin-City, Southern Nigeria. Saudi J Health Sci 6(1): 52-56. [crossref]
- Akinshipo AO, Taiwo AO, Abdullahi K, et al. (2017) Head and neck cancers: A histopathologic review of cases seen in three tertiary hospitals in Northwestern Nigeria. J Clin Sci 14(3): 113-118. [crossref]
- Kanu OO, Nnoli MA, Asoegwu CA (2015) Prevalence of head and neck tumours in Calabar, Southeastern Nigeria. Asian J Med Sci 7(1): 142-146. [crossref]
- Lilly Tariah da OB, Somefun OO, Adeyemo WL (2009) Current evidence on the burden of head and neck cancer in Nigeria. Head Neck Oncol 1: 14-17. [crossref]
- Erinoso OA, Okoturo E, Gbotolorun OM, et al. (2016) Emerging trends in the epidemiological pattern of Head and Neck Cancers in Lagos, Nigeria. Ann Med Health Sci Res 6(5): 301-307. [crossref]
- Adeyemi BF and Lawoyin JO (2008) Head and neck cancer – A clinicopathological study in a tertiary care centre. J Nat Med Assoc 100(6): 690-697. [crossref]
- Fomete B, Adeola DS (2017) An epidemiological study of 270 cases of carcinomas of head and neck region in Nigeria tertiary healthcare facility. Egypt J Ear Nose Throat Allied Sci 18(3): 251-255. [crossref]
- Kodiya AM, Adamu AI, Nggada HA, et al. (2016) Epidemiology of head and neck cancers in Maiduguri-Northeastern Nigeria. British J Med Med Res 11(5): 1-7. [crossref]
- Nwawolo CC, Ajekigbe AT, Oyeneyin JO, et al. (2001) Pattern of head and neck cancers among Nigerians in Lagos. West Afr Med 20(2): 111-116. [crossref]
- Ologe FE, Adeniji KA, Segun-Busari S (2005) Clinicopathological study of Head and Neck cancers in Ilorin, Nigeria. Trop Doct. 35(1): 2-4. [crossref]
- Okwor VC, Fagbamigbe AF, Fawole OI (2017) Survivorship of patients with head and neck cancer receiving care in a tertiary health facility in Nigeria. Cancer Man Res. 9(1): 331-338. [crossref]
- Adeloye D, Auta A, Fawibe A (2019) Current pattern of tobacco smoking in Nigeria: a systematic review and meta-analysis. BMC Pub Health. 19: 1719-1721. [crossref]
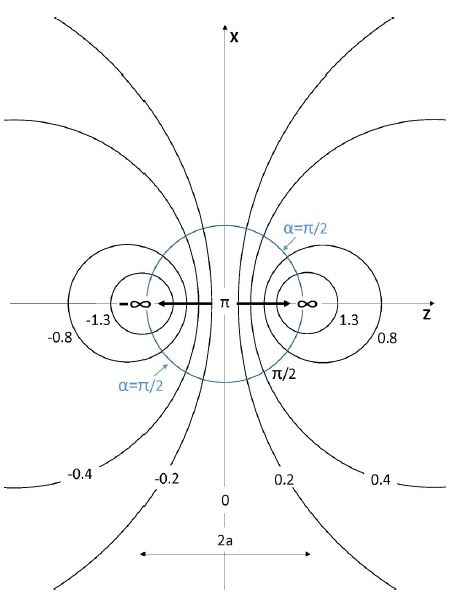


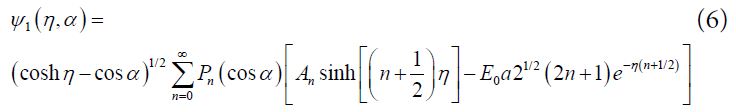
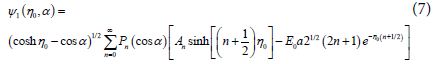

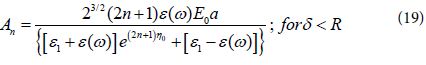
 is antisymmetric with respect to reflections through the xy plane i.e. Z → – Z or η → – η in agreement with the symmetry of the external electric field. The general solutions for the potentials in the surrounding medium, and in the upper sphere are given by Eqs (6) and (8), respectively. But the coefficients An and Bn should be obtained from the boundary conditions.


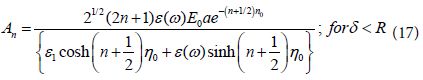
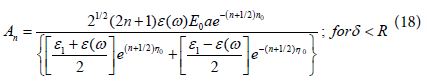
 include the local plasmons charges induced on the surfaces of the spheres. In the present work we follow the idea, that for treating the limits of large field enhancement in hot spots we can use the following approximation which will simplify very much the analysis:
 represent more rapid decay of the local surface plasmons.
 into Eq (11) we get:


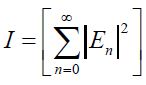 . Then the amplification of the light intensity at the center of the hot spots is given by: