Monthly Archives: October 2021

Featured Image2

C-4 Routes to Methyl Methacrylate: A Sustainable and Environmental Benign Process

DOI: 10.31038/NAMS.2021412


The polymerization process using methyl methacrylate (MMA) has been intensively manufactured owing to poly(methyl methacrylate) (PMMA) is a synthetic thermoplastic with high durability, heat resistance, chemical resistance, light transmission, UV resistant, shattering resistance, optical clarity, high scratch resistance, and so forth. Due to these excellent features, PMMA is patented with trademarks, inclusive of Plexiglas®, Acrylite®, Parapet®, Perspex®, Altuglas®, etc. Its incredible role in our daily life is indispensable as we could find PMMA everywhere, such as solar panels, window profiles, lightning, car windows, lights cover, Smartphone screen displays, dental cavity fillings, and so on. Methyl methacrylate (MMA) is the crucial monomer of PMMA, which is also widely used in coatings, paints, adhesives, packaging, sealants, floor polishes, etc. [1]. Despite amid the outbreak of coronavirus in 2019, the market demand of MMA is estimated to grow in coming years. The MMA annual growth rate of a market report has forecasted 3.9% CAGR till 2028 [2] while another report has projected a higher growth rate, 4.3% CAGR, in year 2020-2027 [3]. Apparently, MMA is an ignorable material found in our daily routines, especially in automotive, coatings and paintings. Several industrial processes have been engaged to produce a series precursors of MMA, including methacrolein (MAL) and methacrylic acid (MAA) through ACH process, C-2, C-3, and C-4 methods [4,5]. ACH process is economically attractive but it is restraining from the usage of hazardous HCN reactant and co-production of toxic NH4HSO4. C-2 process generally presents high selectivity but low one-pass conversion, high preparation costs, and low yield caused by MMA hydrolysis to MAA and methanol; C-3 process suffers from limited starting material (propyne) although it gives high yield of MMA through one-step conversion. The aforementioned literature studies are the pros and cons of ACH, C-2, and C-3 processes in the MAL, MAA or MMA production [5].

On the other hand, C-4 hydrocarbons which comprised of isobutane, isobutene, tert-butyl alcohol, methacrolein (MAL) or 2-methyl-1, 3-propanediol, are the byproducts obtained from petroleum refinery process. Thus, these chemicals are considerably high availability and less hazardous compared to the other methods mentioned. The obtained C-4 materials act as the main feedstocks in chemical industry owing to their intermediates and products have high-commercialised values. This process is also more industrialized practical because the feedstock could produce higher yield of MMA with lower capital costs. By valorizing the byproducts from petroleum to value-added intermediates or products, C-4 process is also in line with Sustainable Global Development, Goal No. 12 Responsible Consumption and Production. To further promote the production of MMA, engineering of appropriate structural catalysts should be studied. There are diverse catalysts used to enhance the conversion, selectivity and yield towards MAL, MAA or/and MMA, such as vanadium pyrophosphate [6], CsFeCoBiMnMoOx [7], Pd-Pb/γ-Al2O3 [8], Bi-doped-styrene-divinyl benzene copolymer (SDB) [9], Cu- and Fe-doped CsH3PMo11VO40 [10], NiAu single atom alloys and so forth [11]. Heteropolyacid is revealed as one of the efficient mixed metal oxides in the oxidation of light alkanes due to its dual functionality, i.e. acidity and oxidative properties. The advanced materials, such as layered double hydroxide (LDH), metal-organic framework (MOF), and etc, are potential to be functionalized with metal oxide-based materials to give synergistic effects.

Additionally, a cascade pathway from C-4 to MMA should be advocated too. Since both MAL and MAA are the intermediates to produce the desired MMA, therefore isobutane or isobutene conversion to MAL and MAA are vastly reported. Undeniably, efforts extensively focus on discontinuous processes to MAL or MAA: the oxidative dehydrogenation of isobutane or/and isobutene to MAL [12-15], oxidative dehydrogenation of isobutane to MAA [16,17], and MAL oxidation to MAA [18-23]. In recent years, it is worth noting that the cascade oxidative esterification of MAL to MMA has been investigated [9,11,24,25], nonetheless, on-going studies are still necessary. Directing the discontinuous process to cascade one-step synthetic route is an urge due to the process simplicity and reduced byproducts. This will be prompting energy- and cost-saving with the aim to create a sustainable, eco-friendly environment and economically viable communities.

In short, this research has grown rapidly with possessing great potential in the field of industrial catalysis, which great strides in synthetic transformation process and catalysts engineering. This is making towards environmental cleanliness and sustainable process.

Acknowledgements

The work is supported by Ministry of Higher Education (MOHE) through the Fundamental Research Grant Scheme (FRGS/1/2019/TK02/XMU/03/1), Hengyuan International Sdn. Bhd. (grant number: EENG/0003) and Xiamen University Malaysia Research Fund (grant number: XMUMRF/2019-C4/IENG/0019 and XMUMRF/2020-C5/IENG/0029).

References

  1. Kato Y, Nitta S, Shimazu S, Kurashina M, Katoh M, et al. (2019) Effect of introduction of trace amount of chromium species in improving catalytic performance of MCM-48 in oxidative dehydrogenation of isobutane. Journal of Chemical Engineering of Japan 52: 99-105.
  2. Global market study on methyl methacrylate (MMA) – Increasing application in PMMA production to account for significant revenue generation opportunities (2019).
  3. Methyl methacrylate (MMA) – Global market trajectory & analytics (2021).
  4. Nagai K (2001) New developments in the production of methyl methacrylate. Applied Catalysis A: General 221: 367-377.
  5. Mahboub MJD, Dubois JL, Cavani F, Rostamizadeh M, Patience GS (2018) Catalysis for the synthesis of methacrylic acid and methyl methacrylate. Chemical Society Review 47: 7703-7738.
  6. Guan J, Xu H, Jing S, Wu S, Ma Y, et al. (2008) Selective oxidation of isobutane and isobutene over vanadium phosphorus oxides. Catalysis Communications 10: 276-280.
  7. Peng Z, Yu C, Cai T, Deng Q (2004) Selective oxidation of isobutene over CsFeCoBiMnMoOx mixed oxide catalyst. Journal of Natural Gas Chemistry 13: 172-176.
  8. Diao Y, Yang P, Yan R, Jiang L, Wang L, et al. (2013) Deactivation and regeneration of the supported bimetallic Pd–Pb catalyst in direct oxidative esterification of methacrolein with methanol. Applied Catalysis B: Environmental 142: 329-336.
  9. Wang B, Li H, Zhu J, Sun W, Chen S (2013) Preparation and characterization of mono-/multi-metallic hydrophobic catalysts for the oxidative esterification of methacrolein to methyl methacrylate. Journal of Molecular Catalysis A: Chemical 379: 322-326.
  10. Zhang H, Yan R, Yang L, Diao Y, Wang L (2013) Investigation of Cu- and Fe-doped CsH3PMo11VO40 heteropoly compounds for the selective oxidation of methacrolein to methacrylic acid. Industrial & Engineering Chemistry Research 52: 4484-4490.
  11. Trimpalis A, Giannakakis G, Cao S, Flytzani-Stephanopoulos M (2020) NiAu single atom alloys for the selective oxidation of methacrolein with methanol to methyl methacrylate. Catalysis Today 355: 804-814.
  12. Weber D, Weidler P, Kraushaar-Czarnetzki B (2017) Partial oxidation of isobutane and isobutene to methacrolein over a novel Mo–V–Nb(–Te) mixed oxide catalyst. Topics in Catalysis 60: 1401-1407.
  13. Zhai Z, Wang X, Licht R, Bell AT (2015) Selective oxidation and oxidative dehydrogenation of hydrocarbons on bismuth vanadium molybdenum oxide. Journal of Catalysis 325: 87-100.
  14. Jia MJ, Valenzuela RX, Amorós P, Beltrán-Porter D, El-Haskouri J, et al. (2004) Direct oxidation of isobutane to methacrolein over V-MCM-41 catalysts. Catalysis Today 91-92: 43-47.
  15. Guan J, Song K, Xu H, Wang Z, Ma Y, et al. (2009) Oxidation of isobutane and isobutene to methacrolein over hydrothermally synthesized Mo–V–Te–O mixed oxide catalysts. Catalysis Communications 10: 528-532.
  16. Jing F, Katryniok B, Dumeignil F, Bordes-Richard E, Paul S (2014) Catalytic selective oxidation of isobutane to methacrylic acid on supported (NH4)3HPMo11VO40 catalysts. Journal of Catalysis 309: 121-135.
  17. Capua AD, Dubois JL, Fournier M (2007) Fine analysis of by-products of the selective oxidation of isobutane into methacrolein and methacrylic acid over Mo–V–P catalyst. Journal of Molecular Catalysis A: Chemical 263: 62-69.
  18. Yasuda S, Iwakura A, Hirata J, Kanno M, Ninomiya W, et al. (2019) Strong Brønsted acid-modified chromium oxide as an efficient catalyst for the selective oxidation of methacrolein to methacrylic acid. Catalysis Communications 125: 43-47.
  19. Zhou L, Sun Y, Li B, Zhengjie Li, Zhang Z, et al. (2019) Selective oxidation of methacrolein to methacrylic acid on carbon catalysts. Catalysis Communications 126: 44-49.
  20. Cao YL, Wang L, Xu BH, Zhang SJ (2018) The Chitin/Keggin-type heteropolyacid hybrid microspheres as catalyst for oxidation of methacrolein to methacrylic acid. Chemical Engineering Journal 334: 1657-1667.
  21. Zhou L, Wang L, Diao Y, Yan R, Zhang S (2017) Cesium salts supported heteropoly acid for oxidation of methacrolein to methacrylic acid. Molecular Catalysis 433: 153-161.
  22. Zheng Y, Zhang H, Wang L, Zhang S, Wang S (2016) Transition metal-doped heteropoly catalysts for the selective oxidation of methacrolein to methacrylic acid. Frontiers of Chemical Science and Engineering 10: 139-146.
  23. Zhou L, Wang L, Wang H, Cao Y, Yan R, et al. (2016) Silica supported heteropoly catalysts for oxidation of methacrolein to methacrylic acid. Journal of Thermodynamic and Catalysis 7: 1000176.
  24. Guan Y, Ma H, Chen W, Li M, Qian G, et al. (2020) Methyl methacrylate synthesis: Thermodynamic analysis for oxidative esterification of methacrolein and aldol condensation of methyl acetate. Industrial & Engineering Chemistry Research 59: 17408-17416.
  25. Li H, Tan Y, Chen X, Yang W, Huang C, et al. (2021) Efficient synthesis of methyl methacrylate by one step oxidative esterification over Zn-Al-mixed oxides supported gold nanocatalysts. Catalysts 11: 162.

Safety of Surgical Management of Diverticulitis during the COVID-19 Pandemic

DOI: 10.31038/JIPC.2021121

Abstract

Aim: The impact of the global COVID-19 on colorectal conditions remains unknown. Thus, we aimed to determine the effect of COVID-19 limitations on diverticular disease.

Method: Retrospective analysis of Premier hospital inpatient files from 1/1/2019 through 6/30/2020 for admissions and surgical procedures for patients with diverticular disease. Comparison between first six months of 2019 and 2020 for disease incidence, severity, operative management, and adverse events. Primary outcome measure was pulmonary failure and secondary outcome measures were adverse events, rates of hospitalization and surgical intervention.

Results: Admissions for diverticulitis declined by 25% in 2020 as compared to 2019. The proportion of urgent diverticular disease cases rose significantly in April 2020 to 59.1% from an average of 37.5% in 2019 (p<0.0001). Although diverticular abscess comprised 55.1% of all admissions in 2019, the proportion of abscess cases rose to 69.3% in April 2020. Consequently, 38% of all procedures in the spring of 2020 resulted in a stoma, 29% higher than in 2019. Select postoperative complications including organ space infections and sepsis were significantly higher in April 2020. Most importantly, pneumonia complications were similar in 2019 (1.6%) and 2020 (1.8%) (p=0.5) as were respiratory failure rates (4.2% in both 2019 and 2020).

Conclusions: During the COVID-19 pandemic, there was a notable decreased rate of hospitalization for diverticulitis but an increased disease severity among those admitted. The increase in diverticular abscess procedures coincided with higher rates of organ space infections and ostomy creations but no difference in respiratory complications. These data indicate that surgery for diverticulitis in the setting of the COVID-19 pandemic can be safely performed.

Statement: Limitations incited by the COVID-19 pandemic resulted in decreased hospitalization rates for diverticulitis but increased severity of disease for those admitted, which coincided with increased rates of postoperative organ space infections and ostomy creations. However, respiratory complications remained stable demonstrating continued safety of operative management in this critical time.

Introduction

Coronavirus disease 2019 (COVID-19) is an infectious disease caused by severe acute respiratory syndrome coronavirus 2 (SARS-CoV-2). Although COVID-19 has a variable clinical course, the virus is associated with severe respiratory, vascular, and/or gastrointestinal symptoms which can progress in severity in high‐risk individuals. In the most common case, COVID-19 is characterized by symptoms of viral pneumonia such as fever, fatigue, and dry cough [1]. The virus is highly contagious as it is spread from person to person through respiratory secretions and/or contaminated fomites. Within short order, Coronavirus spread around the world leading the World Health Organization to declare COVID-19 a pandemic on March 11, 2020 [2].

The COVID-19 pandemic changed many dimensions of health care in the United States and affected the operations of a host of healthcare facilities in 2020 [3]. In surgery, the American College of Surgeons recommended that “each hospital, health system, and surgeon should thoughtfully review all scheduled elective procedures with a plan to minimize, postpone, or cancel electively scheduled operations, endoscopies, or other invasive procedures until we have passed the predicted inflection point in the exposure graph and can be confident that our health care infrastructure can support a potentially rapid and overwhelming uptick in critical patient care needs.” These recommendations led to reduced numbers of patients in ambulatory clinics, fewer screening and other elective procedures, as well as other interruptions in inpatient services [4,5]. Models of these interruptions in cancer screening and treatment have predicted over 10,000 excess deaths from breast and colorectal cancer over the next decade [6].

Given the limitations and restrictions in surgical care as well as other concerns related to obtaining non COVID-19 related treatment, we undertook a study to determine the impact of COVID-19 on colorectal surgery care in the United States. In particular we sought to evaluate diverticulitis care during the height of the pandemic as well as outcomes from surgery during the height of the pandemic as compared to one year prior. In addition, we evaluated the risk of respiratory complications related to surgery during the COVID-19 pandemic, as well as all other postoperative complications, as compared to one year earlier. These data are of particular importance as other COVID surges occur as well as other potential respiratory epidemics.

Methods

Database

We abstracted records from the Premier hospital inpatient files from 1/1/2019 through 6/30/2020 accounting for 586 hospitals. The Premier Healthcare Database is one of the most comprehensive electronic healthcare databases originating from the merger of Premier with American Healthcare Systems and SunHealth in 1997 [7]. Data derive from a large, U.S. hospital-based, service-level, all-payer capture model that contains information on inpatient discharges, primarily from geographically diverse non-profit, non-governmental and community and teaching hospitals and health systems from rural and urban areas [7]. Hospitals and healthcare systems submit administrative, healthcare utilization and financial data from patient encounters approximating 10 million inpatient visits per year or twenty-five percent of annual United States inpatient admissions. The data are de-identified and HIPAA compliant, thereby considered exempt from Institutional Review Board oversight as dictated by Title 45 Code of Federal Regulations, Part 46 of the United States, specifically 45 CFR 46.101(b).

Cohort

All adult patients with diverticular disease were identified based on the primary diagnosis with ICD-10 codes of K57.20, K57.21, K57.32 or K57.33 for hospitalization. Patient demographics were collected as covariates including race, sex, age, and marital status. Charlson comorbidity score was also calculated and can be calculated as described in previous publications [8]. In addition, the covariates of payer information, hospital regional location, hospital rural urban location, hospital bed size, and teaching status of hospital were also abstracted. Presence of abscess at time of admission was determined based on patients who had ICD-10 diagnosis codes K57.20 or K57.21. Patients were then assigned as either medical or surgical based on having surgical Disease Related Group (DRG) codes and ICD-10 procedure codes (Appendix 1). Minimally invasive procedures were identified with the ICD-10 surgical procedure codes possessing the 5th digit as 3, 4 or 6 while open procedures were identified with the ICD-10 surgical procedure codes possessing the 5th digit as 0. Formation of stoma was identified based on ICD-10 procedure codes listed in appendix 1. Cases were classified as urgent cases by hospital admission type.

Primary Outcome

The outcome of primary interest was respiratory failure defined with hypoxia or hypercapnia during the index hospital stay and identified with ICD-10 diagnostic codes of J80, J96, or J98.1 (Appendix 1).

Secondary Outcomes

Secondary outcomes of interest include pneumonia as recorded by ICD-10 codes (see Appendix 1). Additionally, we recorded adverse events of ileus/small bowel obstruction, peritonitis/organ space infection, superficial surgical site infection, gastrointestinal bleeding, urinary tract infection, myocardial infarction, sepsis, acute renal failure, and hemorrhage complications. A full list of ICD-10 codes is included in appendix 1.

Analysis

Admissions and surgical procedures for patients with diverticular disease were compared for the first six months of 2019 (1/1/2019 through 6/30/2019) as compared to the first six months of 2020 (1/1/2020 through 6/30/2020) during the COVID-19 pandemic. Patient demographics, patient covariates, use of surgery procedures, presence of abscess, and adverse events were compared during the two periods with Chi square analysis for categorical variables. Analysis was performed at the monthly basis for admissions and outcomes. In addition, we compared the development of respiratory complications such as pneumonia or pulmonary failure during the two time periods with the same analysis. Multivariable logistic regression analyses were performed to control for urgent nature of surgery while evaluating postoperative complications. The multivariable analysis only included use of urgent nature of surgery and not additional variables due to the small sample size. All analyses were performed with SAS 9.4 and p value of less than 0.05 was considered significant based on multiple tests of variance.

Results

Cohort

Admissions for diverticulitis for the first six months of 2019 totaled 20,717 patients with 14,408 (69.6%) medical admissions and 6,309 (30.5%) surgical admissions. However, during the first six months of 2020, there were 24.6% fewer total admissions comprising 15,630 total admissions with 10,829 (69.2%) medical admissions and 4,801 (30.7%) surgical admissions. Patient demographics were similar across time periods. There were proportionately more women admitted during each time period. In addition, there were proportionately more patients over age 65 and with Charlson Comorbidity of 0 regardless of time period. Commercial insurers were the most common payer for both time periods and most patients were treated at hospitals with over 500 beds (Table 1).

Table 1: Patient and hospital characteristics.

table 1(1)

table 1(2)

table 1(3)

Chi-square analysis was used to compare difference in each characteristic between the years 2019 and 2020 within each month. All p >0.05, except: *p=0.0114 and 0.0036 in April and May respectively; **p=0.0002 in April; ***p=0.024 in April and ****p=0.0266 in March. All cells less than 10 were marked as “<10” and their corresponding percentages were not reported (NR). CCI: Charlson Comorbidity Index.

Disease Severity

There were proportionately more patients admitted with diverticular abscess in the first six months of 2020 as compared to the same time period in 2019 (p<0.0001). There were 9,872 patients (47.7%) admitted with diverticular abscess in 2019 as compared to 7,860 patients (50.3%) in 2020 (Table 2).

Table 2: Incidence of diverticular abscess among all hospital admissions.

Year

2019

  2020


Months

N

% N %

p-value

Jan

1646

48.0 1615 48.4

0.6934

Feb

1537

48.5 1558 49.0

0.6771

Mar

1671

47.3 1330 49.9

0.0416

Apr

1670

47.6 917 54.6

<.0001

May

1715

47.8 1148 51.0

0.0173

Jun

1633

47.0 1292 51.4

0.0008

Total

9872

47.7 7860 50.3

<.0001

The number of urgent surgical cases for diverticular disease was 2,123 for the first six months of 2019 or 33.7% of surgical cases. However, the number of urgent cases in the first six months of 2020 was 1,756 or 36.6% of surgical cases (p<0.001). Comparing individual months of both calendar years, there were proportionately more urgent cases in April 2020 (59.2%) as compared to 36.9% in April 2019 (p<0.0001). There were no other significant differences in urgent surgical cases by month for the other months (Table 3).

Table 3: Urgent Operations by Month.

Year

2019

  2020  


Months

N

% N %

p-value

Jan

360

34.3 336 33.1

0.5805

Feb

322

34.5 326 35.5

0.64

Mar

365

36.2 322 40.6

0.0595

Apr

392

37.5 237 59.1

<.0001

May

360

36.5 285 42.2

0.0182

Jun

324

34.9 250 32.6

0.3245

Total

2123

35.7 1756 38.4

0.0035

Surgery

When surgery was performed in 2019, 55.1% had a diverticular abscess yet 58.6% had an abscess during the same time period in 2020 (p=0.004). In April of 2020, there were substantially more surgical patients with diverticular abscess (69.3%) then in the same time period in 2019 (55.6%) (p<0.0001) (Table 4). In addition, minimally invasive surgical treatment for diverticular disease was slightly less common in 2019 (41.9%) as compared to 2020 (42.8%). The most significant difference in use of minimally invasive procedures occurred in April at which time minimally invasive procedures were used in 43% of all procedures in 2019, yet only 34% of cases in April 2020 (p<0.004) (Table 4).

Table 4: Abscess rate and surgical approach among patients who underwent surgery.

2019   2020    
N % N %

p-value

Abscess

Jan

590 56.1 558 55.0 0.5953
Feb 509 54.5 504 54.9

0.8610

Mar

543 53.9 463 58.3 0.0593
Apr 581 55.6 278 69.3

<.0001

May

551 55.8 400 59.3 0.1647
Jun 509 54.9 447 58.4

0.1475

Total

3283 55.1 2650 58.0

0.0035

MIS

Jan

465 44.2 430 42.4 0.3889
Feb 393 42.1 415 45.2

0.1745

Mar

451 44.7 339 42.7 0.3846
Apr 449 43.0 138 34.4

0.003

May

401 40.6 248 36.7 0.1106
Jun 389 41.9 346 45.2

0.179

Total

2548 42.8 1916 41.9

0.3723

Stoma Creation

Jan

281 26.7 284 28.0

0.5260

Feb

255 27.3 262 28.5 0.5525
Mar 291 28.9 278 35.0

0.0053

Apr

321 30.7 176 43.9 <.0001
May 287 29.1 241 35.7

0.0044

Jun

265 28.6 207 27.0 0.4838
Total 1700 28.6 1448 31.7

0.0005

MIS: Minimally Invasive Surgery.

A stoma was made in 28.6% of all patients who underwent surgery during 2019. Yet in 2020, there was a substantially greater proportion of stomas fashioned (31.7% of all surgical procedures; p=0.0005). In April of 2020, the proportion of patients who received a stoma reached 43.9% which was substantially higher (30.7%) than in April of 2019 (p<0.0001) (Table 4).

Respiratory Adverse Events

Most importantly, pneumonia complications were similar in 2019 (1.7%) as they were in 2020 (1.8%) (p=0.5). There was no difference in pneumonia rates by month across time periods. In addition, respiratory failure rates were similar across time periods, 4.2% in 2019 and 2020, with the only significant difference occurring in April (4.2% in 2019 vs 6.8% in 2020). Rates of respiratory failure were higher in patients who had urgent surgery and no different even in April of 2020 (10.1%) as compared to April 2019 (7.9%) (p=0.4) (Table 6).

Table 6: Postoperative respiratory adverse events.

Year

2019

  2020  


Month

N

% N %

p-value

Pneumonia
Jan

15

1.4 23 2.2

0.156

Feb

20

2.2 20 2.2

0.9559

Mar

22

2.2 18 2.2

0.9038

Apr

14

1.4 <10 NR

0.8896

May

15

1.6 <10 NR

0.7544

Jun

12

1.2 <10 NR

0.6371

Total

98

1.7 83 1.8

0.5053

Pulmonary failure
Jan

51

4.8 45 4.4

0.651

Feb

36

3.8 44 4.8

0.3205

Mar

37

3.6 29 3.6

0.9837

Apr

43

4.2 27 6.8

0.0378

May

37

3.8 19 2.8

0.3001

Jun

44

4.8 28 3.6

0.2701

Total

248

4.2 192 4.2

0.9266

All cells less than 10 were marked as “<10” and their corresponding percentages were not reported (NR).

Adverse Events

There was no difference in the rates of the majority of postoperative complications including superficial surgical site infection, gastrointestinal bleeding, hemorrhage, or urinary tract infection. However, other postoperative complications such as sepsis were significantly higher (6.8%) in April 2020 as compared to the same time period 1 year earlier (3.4%; p<0.005) (Table 5). Similarly, there were statistically significant increases in the rates of postoperative peritonitis or organ space infection as well as ileus/small bowel obstruction in the month of April 2020 compared to April 2019. However, when controlling for the urgent nature of the operation, the rate of all postoperative complications including sepsis became statistically equivalent between the 2019 and 2020 time periods except for organ space infection (OR=1.20 95% CI:1.10-1.31; p<0.001).

Table 5: Post-operative adverse events.

2019   2020    
N % N %

p-value

Ileus/ Small Bowel Obstruction (included constipation and PONV)
Jan 161 15.4 149 14.6 0.6843
Feb 126 13.4 125 13.6

0.9368

Mar 132 13.0 113 14.2

0.4847

Apr 146 14.0 75 18.8

0.0252

May 134 13.6 119 17.6 0.0239
Jun 133 14.4 109 14.2

0.9523

Total

832 14.0 690 15.1

0.1037

Peritonitis/Organ space SSI

Jan

234 22.2 264 26.0 0.0466
Feb 196 21.0 262 28.6

0.0002

Mar

272 27.0 231 29.0 0.3217
Apr 260 24.8 131 32.6

0.0028

May

271 27.4 211 31.2 0.0934
Jun 231 24.8 205 26.0

0.3809

Total

1464 24.6 1304 28.5

<0.0001

Superficial SSI and wound complications (Hematoma/ Seroma, Wound Infection, Wound Dehiscence)

Jan

26 2.4 19 1.8 0.3488
Feb 22 2.4 21 2.2

0.9227

Mar

22 2.2 19 2.4 0.7662
Apr 31 3.0 16 4.0

0.3258

May

23 2.4 20 3.0 0.4249
Jun 14 1.6 15 2.0

0.4777

Total

138 2.3 110 2.4

0.7645

GI bleeding

Jan

66 6.2 63 6.2 0.9455
Feb 54 5.8 48 5.2

0.6021

Mar

59 5.8 47 6.0 0.9527
Apr 58 5.6 24 6.0

0.7489

May

54 5.4 48 7.2 0.1713
Jun 50 5.4 42 5.4

0.9315

Total

341 5.7 272 6.0

0.6253

Urinary tract infection/Retention of urine

Jan

90 8.6 63 6.2 0.0409
Feb 61 6.6 54 5.8

0.563

Mar

63 6.2 49 6.2 0.9452
Apr 70 6.6 38 9.4

0.0721

May

62 6.2 42 6.2 0.9608
Jun 55 6.0 52 6.8

0.468

Total

401 6.7 298 6.5

0.6624

MI/Cardio complication

Jan

46 4.4 53 5.2 0.3687
Feb 40 4.2 45 5.0

0.5243

Mar

51 5.0 38 4.8 0.7901
Apr 45 4.4 31 7.8

0.009

May

65 6.6 35 5.2 0.2384
Jun 33 3.6 43 5.6

0.0417

Total

280 4.7 245 5.4

0.124

Sepsis

Jan

25 2.4 37 3.6 0.0916
Feb 30 3.2 24 2.6

0.4447

Mar

31 3.0 32 4.0 0.2733
Apr 35 3.4 27 6.8

0.0045

May

23 2.4 14 2.0 0.7281
Jun 35 3.8 21 2.8

0.2379

Total

179 3.0 155 3.4

0.2635

Dehydration/ Acute renal failure

Jan

131 12.4 127 12.6 0.9737
Feb 111 11.8 104 11.4

0.7091

Mar

123 12.2 108 13.6 0.3776
Apr 122 11.6 60 15.0

0.0915

May

105 10.6 96 14.2 0.0278
Jun 102 11.0 79 10.4

0.653

Total

694 11.7 574 12.6

0.1576

Hemorrhage

Jan

41 4.0 38 3.8 0.8522
Feb 39 4.2 42 4.6

0.6742

Mar

36 3.6 33 4.2 0.5208
Apr 45 4.4 15 3.8

0.6293

May

29 3.0 29 4.2 0.1384
Jun 29 3.2 33 4.4

0.1968

Total

219 3.7 190 4.2

0.2071

Mortality

In hospital mortality occurred rarely in patients treated for diverticulitis. The proportion of patients who experienced an inpatient mortality was 0.7% in both time periods (Table 1).

Discussion

Data from these analyses reveal a substantial decline in the number of inpatients with diverticulitis during the height of the COVID-19 pandemic or the first two quarters of 2020 as compared to the same time period in 2019. Despite the net decline in diverticulitis admissions, the proportion of cases deemed urgent rose significantly during COVID-19. In addition, there was a marked reduction in the proportion of patients who had minimally invasive surgery during the COVID surge in early 2020. These changes were associated with a temporal increase in sepsis and deep organ space complications in April of 2020. However, this observed increase in postoperative complications during the COVID-19 period became statistically insignificant when accounting for the emergent nature of the operations, with the exception of organ space infection likely secondary to the higher rate of preoperative abscesses. Of great importance, despite high numbers of COVID-19 hospitalizations during the height of the pandemic, there was no increase in respiratory complications. These results indicate that surgery for diverticulitis (both urgent and elective) can be safely performed without any additional increase in respiratory consequences or mortality.

Across the board, many patients with non-respiratory health conditions delayed or avoided care during the height of the COVID-19 pandemic. A number of studies demonstrated reduced emergency room visits across the United States and United Kingdom during the height of the COVID-19 pandemic, including fewer evaluations for acute coronary syndromes and strokes [9-17]. Similarly, our data confirm fewer admissions for diverticular disease as total numbers declined by 25 percent during the height of the pandemic. In addition, among the patients who were admitted for diverticular disease, proportionately more patients were admitted with much more severe disease (i.e. abscess) leading to far greater rates of stoma creation as compared to one year prior.

There are a number of possible explanations for the decline in numbers of diverticulitis admissions during the height of the COVID-19 pandemic. Although lifestyle changes during this time may be one explanation, it is more likely that many patients simply deferred evaluation because of anxiety related to management during the pandemic. In a survey of adult respondents, 40.9% reported having delayed or avoided any medical care, including urgent or emergency care (12.0%) and routine care (31.5%), because of concerns about COVID-19 [18]. Avoidance of routine care was particularly common among unpaid caregivers who sought to avoid potential virus risk for many reasons. Data do reveal that it is difficult for patients to anticipate when emergency department evaluation is necessary [19]. As with other studies our data similarly raise concerns about patients deferring care and presenting to the emergency department when diverticulitis progressed to more complicated forms [20].

In addition to patient avoidance of routine care, many healthcare services underwent paradigm shifts in order to more safely deliver care while reducing potential points of transmission. Elective procedures were prohibited leading to sharp declines across the board for many orthopedic conditions as we also noted with diverticular disease. Delays in surgery are likely to have real impact on patient health outcomes, hospital finances and resources, as well as training and research programs [21]. Delays in surgery have been shown to result in higher rates of surgical site infections, leading to increased costs ranging from $7000 to $17,000 for coronary artery bypass graft and colon and lung resections [22]. It is unclear what the costs of delay in care may be for patients with diverticulitis, but an increase in septic complications was noted during the height of the COVID-19 pandemic.

To promote safe surgery many surgical societies as well as Intercollegiate guidelines from the United Kingdom advocated for non-operative management of many surgical conditions and avoidance of laparoscopy when surgery is unavoidable [23]. The effects of these guidelines on appendicitis treatment in the United Kingdom was associated with many practice changes during the pandemic [20]. Early concerns were also raised involving the risk of aerosolization with minimally invasive surgery in the operating room. Many hospitals began to screen patients for the virus before any scheduled surgery and when not possible, personal protective equipment to decrease susceptibility to aerosol diffusion was advised. As expected, we identified a reduction in the rate of laparoscopic treatment during the pandemic which may have been related to the suggested guidelines. It is, however, highly likely that the changes we noted in use of laparoscopy may have been related to more severe diverticular disease.

Interestingly, in the previously described appendicitis study (English et al.), the investigators did not notice an increase in short-term complications nor any detriment in length of stay related to appendicitis treatment during COVID [20]. Our data, however, revealed a significant change in septic complications during the height of the COVID-19 pandemic following surgery for diverticular disease. In addition, there were substantial concerns of pulmonary complications related to surgical treatment. Our data from 586 hospitals across the country indicate no significant increase in pulmonary complications throughout the study period, with only slight increase during the single month of April. After accounting for disease severity, this difference became insignificant.

Conclusions

In conclusion, data from these studies reveal deferral of care in patients with diverticular disease during the COVID-19 pandemic. Patients who did seek care for diverticulitis experienced no additional respiratory complications. Given that postoperative pulmonary complications occur in half of patients with perioperative COVID-19 infection, regardless of whether the diagnosis is made with laboratory-confirmation or due to clinical signs, these data can be used to reassure patients needing surgery [24]. Some have advocated that during COVID-19 outbreaks, consideration should be given for postponing non-critical procedures [25]. However, as we prepare for future waves of COVID cases, these studies may help us answer questions related to patient safety while reassuring our patients regarding surgical care. Awareness of community COVID-19 prevalence, testing, as well as patient and provider preparedness are critical elements of surgical care during respiratory pandemics.

References

  1. Cucinotta D, Vanelli M (2020) WHO Declares COVID-19 a Pandemic. Acta Biomed 91: 157-160. [crossref]
  2. WHO Director-General’s opening remarks at the media briefing on COVID19 – March 2020.
  3. Healthcare Facilities: Managing Operations During the COVID-19 Pandemic. National Center for Immunization and Respiratory Diseases (NCIRD), Division of Viral Diseases.
  4. Schrag D, Hershman DL, Basch E (2020) Oncology practice during the COVID-19 pandemic. JAMA 323: 2005-2006. [crossref]
  5. van de Haar J, Hoes LR, Coles CE, Seamon K, Frohling S, et al. (2020) Caring for patients with cancer in the COVID-19 era. Nat Med 26: 665-671. [crossref]
  6. Sharpless N (2020) COVID-19 and cancer. Science 368: 1290.
  7. Premier Data. Available at https://products.premierinc.com/downloads/PremierHealthcareDatabaseWhitepaper.pdf
  8. Charlson M, Wells MT, Ullman R, King F, Shmukler C (2014) The Charlson comorbidity index can be used prospectively to identify patients who will incur high future costs. PloS One 9: e112479. [crossref]
  9. Siegler JE, Heslin ME, Thau L, Smith A, Jovin TG (2020) Falling stroke rates during COVID-19 pandemic at a comprehensive stroke center. Journal of Stroke and Cerebrovascular Diseases 29: 104953.
  10. Garcia S, Albaghdadi MS, Meraj PM, Schmidt C, Garberich R, et al. (2020) Reduction in ST-segment elevation cardiac catheterization laboratory activations in the United States during COVID-19 pandemic. J Am Coll Cardiol 75: 2871-2872. [crossref]
  11. Bullrich MB, Fridman S, Mandzia JL, Mai LM, Khaw A, et al. (2020) COVID-19: Stroke Admissions, Emergency Department Visits, and Prevention Clinic Referrals. Canadian Journal of Neurological Sciences 47: 693-696. [crossref]
  12. Morelli N, Rota E, Terracciano C, Immovilli P, Spallazzi M, et al. (2020) The baffling case of ischemic stroke disappearance from the casualty department in the COVID-19 era. Eur Neurol 83: 213-215. [crossref]
  13. Kansagra AP, Goyal MS, Hamilton S, Albers GW (2020) Collateral effect of Covid-19 on stroke evaluation in the United States. New England Journal of Medicine 383: 400-401. [crossref]
  14. Solomon MD, McNulty EJ, Rana JS, Leong TK, Lee C, et al. (2020) The Covid-19 pandemic and the incidence of acute myocardial infarction. New England Journal of Medicine 383: 691-693. [crossref]
  15. Kim HS, Cruz DS, Conrardy MJ, Gandhi KR, Seltzer JA, et al. (2020) Emergency department visits for serious diagnoses during the COVID-19 pandemic. Acad Emerg Med 27: 910-913. [crossref]
  16. Westgard BC, Morgan MW, Vazquez-Benitez G, Erickson LO, Zwank MD (2020) An analysis of changes in emergency department visits after a state declaration during the time of COVID-19. Ann Emerg Med 76: 595-601. [crossref]
  17. Jeffery MM, D’Onofrio G, Paek H, Platts-Mills TF, Soares WE, et al. (2020) Trends in emergency department visits and hospital admissions in health care systems in 5 states in the first months of the COVID-19 pandemic in the US. JAMA Intern Med 180: 1328-1333. [crossref]
  18. Czeisler MÉ, Marynak K, Clarke KE, Salah Z, Shakya I, et al. (2020) Delay or Avoidance of Medical Care Because of COVID-19–Related Concerns–United States, June 2020. MMWR Morb Mortal Wkly Rep 69: 1250-1257.
  19. Coster JE, Turner JK, Bradbury D, Cantrell A (2017) Why do people choose emergency and urgent care services? A rapid review utilizing a systematic literature search and narrative synthesis. Acad Emerg Med 24: 1137-1149. [crossref]
  20. English W, Bedwani NB, Smith C, Doganay E, Marsden M, et al. (2020) Suspected appendicitis and COVID-19, a change in investigation and management-a multicentre cohort study. Langenbecks Arch Surg 406: 357-365. [crossref]
  21. Fu SJ, George EL, Maggio PM, Hawn M, Nazerali R (2020) The Consequences of Delaying Elective Surgery: Surgical Perspective. Ann Surg 272: e79-e80. [crossref]
  22. Vogel TR, Dombrovskiy VY, Lowry SF (2010) In-hospital delay of elective surgery for high volume procedures: the impact on infectious complications. J Am Coll Surg 211: 784-790. [crossref]
  23. Mowbray NG, Ansell J, Horwood J, Cornish J, Rizkallah P, et al. (2020) Safe management of surgical smoke in the age of COVID-19. Br J Surg 107: 1406-1413. [crossref]
  24. COVID Surg Collaborative (2020) Mortality and pulmonary complications in patients undergoing surgery with perioperative SARS-CoV-2 infection: an international cohort study. Lancet 396: 27-38.
  25. American College of Surgeons. COVID-19: guidance for triage of non-emergent surgical procedures. https://www.facs.org/covid-19/clinical-guidance/triage. Date: March 17, 2020.
fig 3

In Vitro Evaluation of the Abrasiveness of Novel Bioactive Glass Powders (BiominF®) on Ivory Dentine in Air Polishing Procedures Compared to Selected Reference Powders

DOI: 10.31038/JDMR.2021423

Abstract

Objectives: To evaluate the abrasiveness of novel bioactive glass powders (BiominF®) on ivory dentine compared to selected reference powders.

Materials and Methods: Ivory dentine was used as the study sample. Bioactive glasses (Biomin F® and Sylc® Blend) was compared with sodium bicarbonate, glycine, erythritol powders. Particle size analysis and powder output rate were undertaken. The powders were applied for 5 and 10s in a standardized procedure. Evaluation of wear depth on dentine in μm was assessed using White Light Profilometry.

Results: BiominF®, Glycine, and erythritol powders showed similar powder output rates. Bioactive glasses (BiominF® and Sylc® Blend) resulted in significantly deeper wear depth compared to references powders. There were no significant differences in wear depth between sodium bicarbonate, glycine, and erythritol powders.

Conclusions: Bioactive glasses (BiominF® and Sylc® Blend) were significant more abrasive than sodium bicarbonate, glycine, and erythritol powders.

Clinical Relevance: Application of bioactive glasses powder on the root surface should be used with caution despite the desensitizing effect and the promotion of remineralization.

Keywords

Bioactive glass, Air-polishing, Sodium bicarbonate, Glycine, Erythritol, Subgingival root debridement, Ivory dentine, Particle size analysis, White light profilometry

Introduction

Periodontitis is defined as a chronic multifactorial inflammatory disease associated with dysbiosis plaque biofilms and characterized by progressive destruction of tooth-supporting apparatus [1]. The control of the dental biofilm remains the cornerstone for periodontal treatment and the prevention of disease recurrence during supportive periodontal care (SPC). The repeated instrumentation by conventional techniques (hand curettes and/or ultrasonic instruments) may cause some degree of tooth structure loss which increases patient discomfort and dentine hypersensitivity [2,3]. An air-polishing device has been introduced as an alternative method to remove the dental biofilm. Several clinical studies have demonstrated that the application of air-polishing could result in similar outcomes in biofilm removal as well as in clinical parameters with less discomfort and operator time compared to conventional methods [4-6]. Recently, the application of air-polishing has been extended to surface decontamination during periodontal surgery [7].

Different powders are being used for periodontal treatment including; sodium bicarbonate, glycine, erythritol, and recently, bioactive glasses powders. Glycine powder has been shown to be less invasive to both root cementum and dentine compared to sodium bicarbonate as well as providing an equally effective biofilm removal [8,9]. The application of glycine powder resulted in less patient discomfort compared to hand instrumentation [10]. It was concluded that glycine powder may be safely applied to root surfaces and gingiva [11]. Erythritol was shown to be safe when used for subgingival application and achieved similar clinical outcomes in periodontal pocket reduction compared to ultrasonic debridement [6].

Bioactive glasses have been introduced for air-polishing applications. The main benefit is the ability of these powders to react with oral fluid leading to the formation of apatite to occlude dentinal tubules. The occlusion of these powders could reduce dentinal hypersensitivity and improved patient comfort during periodontal treatment. The application of bioactive glasses in the air-polishing procedure resulted in the reduction of dentine permeability by creating dentine surfaces that are more resistant to acid attack [12]. It has been confirmed in a clinical study that using bioactive glasses for air- polishing applications offered additional effects with a desensitizing effect and better patient acceptance [13]. BiominF® is a novel bioactive glass that contains fluorine in addition to calcium and phosphate which results in the precipitation of a more acid-resistant fluorapatite. A previous study showed that this powder is more conservative than both sodium bicarbonate and glycine powder as well as demonstrating tubular occlusion on the dentinal tubules [14].

A direct comparison between currently available polishing powders using in a standardized method is still lacking. Thus, the aim of the study was to evaluate the abrasiveness of novel bioactive glass powders (BiominF®) on ivory dentine compare to the reference powders. The null hypothesis would be that all polishing powders will result in no statistically change in dentine loss.

Materials and Methods

Sample Size Preparation

Ivory dentine obtained from UK airport customs which was delivered to Queen Mary University of London for research purposes y and used as the study sample. The dentine was sectioned with a hacksaw to obtain 15 mm thick section of flat surfaces. The outer layer of the cementum was removed. The samples were polished using a Kemet 3000 LVAC (Kamet International Ltd, Maidstone, Kent, UK) with polishing discs incrementally from 360 Grits up to 4000 Grit. 1 cm x 1cm area was demarcated for the tested area for each sample. The samples were stored in an airtight container prior to use.

Powder Preparation

BiominF® bioactive glass (Biomin Technology Ltd, London) was mixed with 1% by weight Aerosil® R 974 with Turbula® T2F shaker mixer (WAB, Switzerland) at a speed of 101 rpm for 30 minutes to improve the flowability of the powder. References powders include Sylc® Blend bioactive glass (Osspray Ltd., London, UK), AIR-flow® CLASSIC powder; Sodium bicarbonate (EMS Corp., Nyon, Switzerland), AIR-flow® PERIO powder; Glycine (EMS Corp., Nyon, Switzerland), and AIR-flow® PLUS powder; Erythritol (EMS Corp., Nyon, Switzerland) were used as supplied.

Particle Size Analysis

All tested powders were analyzed using a Malvern/E MASTERSIZER 3000 (Malvern instruments, UK). Five measurements were taken of each powder and the results were expressed as percentiles D (10), D (50), and D (90).

Powder Output Test

To determine the powder output rate of each powder in grams per minute, the NSK’s Prophy-Mate neo handpiece (Nakanishi INC., Japan) was used with the air pressure set at 0.4 MPa (58.0151 psi) for 120 s without application of water. The powder was checked and filled with 11 g of each tested powder. The powder in the chamber was weighed before and after the application using a Metteler HK160 digital scale (Mettler Toledo, UK) with an accuracy of 0.0001 g. The measurement of each powder was repeated 5 times.

Air-Polishing Test

A Prophy-Mate neo polishing system from NSK (Nakanishi INC., Japan) was used in the experiment. The standardized protocol was followed with a distance of 5 mm at 90 degrees from the surface, and the air pressure was set at 0.4 MPa (58.0151 psi). The powder chamber was checked and filled to the same level before the application without any water. Each test powder was applied for 5 and 10 seconds.

White Light Profilometer Analysis

A non-contact white light profilometry (Proscan® 2000, Scantron, Taunton, UK) was used to quantify the surface loss due to the air- polishing application. A S13/1.2 chromatic sensor with 25 nm vertical resolution was used. A dark reference background was checked prior to scanning to ensure optimum sensitivity. An area of 3.5 x 3.5-mm dimension was scanned for each sample. Scanning was performed with a step size of 20 µm. Proscan 2000 ver. 2.1.1.8+ (Scantron industrial products Ltd, Taunton, UK) was used to quantify surface loss. The software generated three-dimensional images combining the height of focus points with the location in x-axis and y-axis linear position. The depth evaluation was performed by calculating the changes in z-axis relative to unaffected reference points. Five random depth of wear areas were chosen for each sample for the depth evaluation.

Statistical Analysis

The mean wear depth and standard deviation of each group were calculated. To test for differences between groups, one-way ANOVA was performed followed by a Tukey’s post hoc test. The independent samples t-test was used to compare means of wear depth between 5 s and 10 s application time. The level of significance was set at 0.05. All statistical analysis was performed using IBM SPSS statistical software package (version 27.0 Inc., New York, NY, USA).

Results

Particle Size Analysis

The particle size distribution (in micrometers; μm) of all powders is shown in Table 1. The numerical values are shown as percentiles of D10, D50, and D90, indicating the portion of particles with diameters below this value in μm is 10%, 50%, and 90%, respectively.

Table 1: Particle size distribution of all tested powders.

Powders

Particle size (μm)
  D10 D50

D90

BiominF®

2.86

13.2

39.4

Sylc® Blend

11.7

52.1

113

Sodium bicarbonate

12.5

49.4

120

Glycine

5.99

21.3

51.5

Erythritol

5.1

17.6

38.2

Powder Output Rate

The mean ± standard deviations of all powders are presented in Figure 1. The mean weight of powder output is presented in Figure 1. One-way ANOVA indicated there was a significant difference in power output rate between powders (p<0.001). A Tukey’s post hoc test showed that there were statistically significant differences between the Sylc® blend and sodium bicarbonate powders compared to the remaining powders (p<0.05). No significant  differences were detected between BiominF®, glycine, and erythritol powders (p>0.05).

fig 1 new

Figure 1: Comparison of mean powder output rate+ SD between different powders.

White Light Profilometer Analysis

The  mean  wear  depth  of  BiominF®,  Sylc®  Blend,  sodium bicarbonate, glycine, and erythritol in 5s and 10s application time is presented in Figure 2. There were statistically significant differences between groups as determined by one-way ANOVA (p<0.001) for both application times. Overall, the wear depth of bioactive glass powders (BiominF® and Sylc® blend) were significantly higher than reference powders (sodium bicarbonate, glycine, and erythritol (p< 0.05) for both application times. A Tukey’s post hoc test revealed deeper  wear  depth  in  both  BiominF®  and  Sylc®  Blend  powders compared to the other powders for both application times. The mean wear depth of BiominF® was significantly higher than Sylc® Blend after 5 s application, but not for the 10 s application. There were no significance differences between sodium bicarbonate and glycine, sodium bicarbonate and erythritol, and erythritol and glycine in both application times. The 10 s application time resulted in statistically significant deeper wear depth in BiominF®, Sylc® Blend, and glycine powders (p <0.05). Representative profilometer scanned surfaces of ivory dentine are shown in Figure 3 after air-polishing with the powders for 5s and 10s.

In summary, the null hypothesis was rejected, bioactive glass powders resulted in greater wear depth compared to the reference powders.

fig 2 new

Figure 2: Mean wear depth in micrometers (μm) of different powders for 5s and 10s application time.

fig 3

Figure 3: Representative profilometer scanned surfaces of ivory dentine after air-polishing for 5 s and 10s. (a, f) BiominF®, (b, g) Sylc® Blend, (c, h) sodium bicarbonate, (d, i) glycine, and (e, j) erythritol.

Discussion

BiominF®  is  a  novel  bioactive  glass  that  has  the  advantage  in promoting remineralization and has a desensitizing effect by the formation of fluorapatite to occlude dentinal tubules. There is limited information regarding the safety of using this powder as a polishing powder for debridement on the dentine surface compared to other commercially available powders. A previous study showed that this powder was significantly less abrasive than either sodium bicarbonate or glycine [14] using a different type of handpiece. On the contrary, the main finding of the present study revealed that bioactive glasses (BiominF® and Sylc® Blend) were to be significantly more abrasive than the reference powders (sodium bicarbonate, glycine, and erythritol). Unlike the previous study, the present study also evaluated the powder output rate. Despite the small particle size of BiominF®, the greater damage observed on the dentine surface indicated that other factors may play a significant role in determining the abrasiveness of powders. It was shown that the rate of dentine loss increased with increasing exposure time [9,15]. The findings of this study also a showed deeper wear depth with increased application time (5s vs 10 s) in the BiominF®, Sylc® Blend, and glycine powder.

Bioactive glasses were first developed as a bone replacement material [16] and has since expanded its application for regenerating dental hard tissue [17]. Its application has extended to being used as an abrasive agent for dental prophylaxis [13] air abrasion for caries removal [18,19] and residual orthodontic adhesive removal [20]. The first large scale commercial use of a bioactive glass was for the treatment of dentine hypersensitivity. The addition of fluoride to bioactive glasses enables the formation of fluorapatite to occlude dentinal tubules, when in contact with oral fluids. Fluorapatite is more acid-resistant than carbonated hydroxyapatite [21] to an acidic attack. Fluorapatite is beneficial in the prevention of dental caries, enhancing remineralization, and treating dentine hypersensitivity. A clinical trial reported that the use of bioactive glass toothpaste containing 5% Fluoro-calcium phospho-silicate resulted in a more effective reduction of dentine hypersensitivity compared to arginine and calcium carbonate-based products [22]. The primary aim of using bioactive glass as an air polishing powder is to debride root surfaces simultaneously with occluding in dentinal tubules by depositing calcium phosphate ions onto the tooth surface. The use of bioactive glass with an air-polishing system has been demonstrated to be the most effective approach to create a dentine surface resistant to acid attack and reduce dentine permeability [12]. A clinical trial reported that this bioactive glass was more effective in the removal of extrinsic strain and offered a longer desensitizing effect compared to sodium bicarbonate [13]. The fact that this powder was more efficient in stain removal could be due to its greater powder density which may be a concern regarding the safety when applying the powder on the root dentine surface.

Sultan et al. (2019) investigated the use of bioactive glass, BiominF®, on dentine surfaces and showed that this powder was more conservative in terms of abrasivity compared to either sodium bicarbonate or glycine powders. In the present study, a NSK’s Prophy-Mate neo handpiece was used, instead of the Aqua Care air abrasion system used in a previous study, to facilitate the powder output rate determination by adding a pyrogenic silica as a flow aid. The results of the present study showed that both bioactive glasses, Sylc® Blend and BiominF®, were significantly more aggressive compared to the other powders. A significant amount of dentine loss, up to 250 μm, was created in a relatively short application time, thus great caution must be exercised before using these powders on dentine surfaces. Considering that the thickness of cementum around the cervical region ranged from 50 to 200 μm [23], the repeated application of these powders should be avoided. Comparing the findings of the present study, the amount of root surface loss due to the bioactive glass powders were comparable to those root surfaces instrumented with curettes when applying 12 working stokes with an applied force of 500-1000 p [2]. On the other hand, the application of a high sodium content fluoride-containing bioactive glass in air abrasion on the enamel surfaces was showed to be effective in the removal of residual orthodontic adhesive without causing significant enamel damage when compared to 45S5 (Sylc®) bioactive glass and a tungsten carbide bur. This was in all probability due to the hardness of the glass which was harder than the orthodontic adhesive but softer than the enamel surface. Apatite formation from BiominF®, which occurs earlier than 45S5 (Sylc®), provided an additional benefit in promoting enamel remineralization [20].

Sodium bicarbonate, glycine, and erythritol were shown to be much more conservative powders when applying to the dentine surface without causing significant differences. In this present study, sodium bicarbonate produced only slightly deeper wear depth compared with glycine and erythritol. This contradicts a previous study showing that glycine powder resulted in significantly less substance loss when compared with sodium bicarbonate [8]. Also, the finding of this study showed no significant difference in the wear depth between glycine and erythritol, which is in accordance with a previous study indicating that these powders have a similar smaller surface-damaging potential [24].

The abrasiveness of an air-polishing application is determined by various factors including particle size and particle size distribution [25], the shape of the particles [26], hardness of the particle forming the powder, power and water setting, working distance, application time [9]. It was shown that the abrasivity effect of air abrasion is correlated with the D90 particle size in the distribution [27]. Despite the smaller particle size of BiominF®, the greatest wear depth was produced by BiominF®. This could be explained by the greater hardness of bioactive glasses compared to the reference powders. Mohs hardness index of bioactive glasses are significantly higher than those of sodium bicarbonate, glycine, and erythritol [28]. The Vickers hardness of BiominF® and Sylc® was 4.5 GPa and 4.63 GPa, respectively [20].

It has been demonstrated that a mean particle size below 12 μm would have limited flowability due to greater Van der Waals forces between particles that resulted in the tendency of particles to stick together rather than flow freely from the handpiece [29]. Hydrophobic fumed silica (Aerosil® 974), which has an anti-caking property, was added to BiominF® to improve the flowability. Aerosil® 974 coated the surface of small particles, creating space between them thus allowing particles to flow freely. The powder output rate of BiominF® with the addition of 1% by weight of Aerosil® 974 resulted in a comparable flowability to glycine and erythritol and significantly greater than Sylc® Blend and sodium bicarbonate. The low standard deviation of powder output may indicate that BiominF® could transport reproducibly and reliably. A previous study showed that BiominF® is less abrasive than Sylc® of similar particle size [27]. It is important to note that in this study, no information regarding powder output rate was provided [14]. In the present study, BiominF® and Sylc® blend showed similar abrasiveness as represented in comparable wear depth despite the significantly  higher  powder  output  rate  of  BiominF®.  The  greater powder output rate of BiominF® may result in an increased kinetic energy and damage transferred to the tooth surface.

Various tooth substitute materials have been utilized to reduce variability arising from the different tooth samples. The enamel analogue, Macor®, was used as a substrate in previous air-abrasion studies to minimize unwanted physical variables [27,30]. Ivory dentine was introduced for evaluating surface changes due to air- polishing application as the model offered a reduction in the variation compared to human dentine by providing a large flat surface area ideal for laboratory investigation [14,18]. A slightly lower hydroxyapatite content has been observed for ivory dentine compared to human dentine resulting in a lower bending strength. Nevertheless, the size and shape of dentinal tubules of ivory dentine and its modulus and presumably its hardness are comparable to that of human dentine [31]. No direct comparison of ivory dentine and the tooth surface for air polishing application was assessed in the present study which may limit extrapolation of any findings to human dentine.

A non-contact optical profilometer is an optical device utilizing either laser or white light to quantify the mineral loss of hard tissue and measure the surface roughhouses and functions by comparing different height differences using a spectrometer. White light profilometer, used in the present study, is a non-invasive method to analyze the surface topography without any physical contact with the sample [32]. This technique was shown to provide a reliable method for quantifying surface loss with a similar level of precision compared to other measuring methods [33].

The present study provides a comprehensive investigation regarding the abrasiveness of available powders. A previous study only assessed the effect of different commercially available powders on enamel surfaces only [34].

It is important to note that comparison of the findings from this present study to other studies is difficult due to differences in the experimental protocols. For instance, water was not added in the study because water films coated on the surface may dampen the impact of the abrasive particles [35] as well as influence the wear depth [9]. A standardized experimental protocol, therefore, needs to be established when evaluating the abrasiveness of air polishing powders.

Further improvement in bioactive glass as a potential air polishing powders on the root surface is still required. It was shown that increasing Na2O can cause a pronounced decrease in bioactive glass hardness [26]. The question as to whether usingan air polishing device with a reduced pressure would be beneficial in reducing the abrasivity of bioactive glass powders should also be investigated. A previous study showed that the debridement efficacy of a glycine powder after 5 s application as represented by a stain-free area was only observed in around 45% of periodontal pockets with various depths [36]. It is still unknown if a more abrasive powder would result in more effective biofilm removal, and whether or not the presence of the dental biofilm could limit any potential damage to the dentine. The effect on the soft tissue a bioactive glass powder should also be further investigated.

Conclusion

Bioactive glasses (BiominF® and Sylc® Blend) were significantly more abrasive than sodium bicarbonate, glycine, and erythritol powders. The abrasiveness of bioactive glasses should be reduced to minimize the loss of root dentine to take advantage of the desensitizing effect and promotion of remineralization of these glasses. Further studies are required to improve the powder characteristics for a safe and effective mean to debride root surfaces.

Funding

KJ was awarded a financial sponsorship by the Thai Government to study for a DClinDent Degree in Periodontology at Queen Mary University of London which included a research component and report.

References

  1. Papapanou PN, Sanz M, Buduneli N, Dietrich T, Feres M, Fine DH, Flemmig TF, Garcia R, Giannobile WV and Graziani F (2018) Periodontitis: Consensus report of workgroup 2 of the 2017 World Workshop on the Classification of Periodontal and Peri‐Implant Diseases and Conditions. Journal of Periodontology 89: S173-S182. [crossref]
  2. Ritz L, Hefti AF and Rateitschak KH (1991) An in vitro investigation on the loss of root substance in scaling with various instruments. Journal of Clinical Periodontology 18: 643-647. [crossref]
  3. Zappa U, Smith B, Simona C, Graf H, Case D and Kim W (1991) Root substance removal by scaling and root planing. Journal of Periodontology 62: 750-754. [crossref]
  4. Moëne R, Décaillet F, Andersen E and Mombelli A (2010) Subgingival plaque removal using a new air‐polishing device. Journal of Periodontology 81: 79-88. [crossref]
  5. Wennström JL, Dahlén G and Ramberg P (2011) Subgingival debridement of periodontal pockets by air polishing in comparison with ultrasonic instrumentation during maintenance therapy. Journal of Clinical Periodontology 38: 820-827. [crossref]
  6. Müller N, Moëne R, Cancela JA and Mombelli A (2014) Subgingival air‐polishing with erythritol during periodontal maintenance: Randomized clinical trial of twelve months. Journal of Clinical Periodontology 41: 883-889. [crossref]
  7. Cosgarea R, Jepsen S, Fimmers R, Bodea A, Eick S and Sculean A (2021) Clinical outcomes following periodontal surgery and root surface decontamination by erythritol-based air polishing. A randomized, controlled, clinical pilot study. Clinical Oral Investigations 25: 627-635. [crossref]
  8. Petersilka GJ, Bell M, Häberlein I, Mehl A, Hickel R and Flemmig TF (2003) In vitro evaluation of novel low abrasive air polishing powders. Journal of Clinical Periodontology 30: 9-13. [crossref]
  9. Petersilka GJ, Bell M, Mehl A, Hickel R and Flemmig TF (2003) Root defects following air polishing: An in vitro study on the effects of working parameters. Journal of Clinical Periodontology 30: 165-170. [crossref]
  10. Petersilka GJ, Steinmann D, Häberlein I, Heinecke A and Flemmig TF (2003) Subgingival plaque removal in buccal and lingual sites using a novel low abrasive air‐polishing powder. Journal of Clinical Periodontology 30: 328-333. [crossref]
  11. Bühler J, Amato M, Weiger R and Walter C (2016) A systematic review on the effects of air polishing devices on oral tissues. International Journal of Dental Hygiene 14: 15-28. [crossref]
  12. Sauro S, Watson TF and Thompson I (2010) Dentine desensitization induced by prophylactic and air-polishing procedures: an in vitro dentine permeability and confocal microscopy study. Journal of Dentistry 38: 411-422.
  13. Banerjee A, Hajatdoost-Sani M, Farrell S and Thompson I (2010) A clinical evaluation and comparison of bioactive glass and sodium bicarbonate air-polishing powders. Journal of Dentistry 38: 475-479. [crossref]
  14. Sultan D, Hill R and Gillam D (2019) The use of a Novel Bioactive Glass in Air Polishing. Adv Dent & Oral Health.
  15. Galloway S and Pashley DH (1987) Rate of removal of root structure by the use of the Prophy‐Jet device. Journal of Periodontology 58: 464-469. [crossref]
  16. Hench LL and Paschall H (1973) Direct chemical bond of bioactive glass‐ceramic materials to bone and muscle. Journal of Biomedical Materials Research 7: 25-42. [crossref]
  17. Brauer DS (2015) Bioactive glasses—structure and properties. Angewandte Chemie International Edition 54: 4160-4181. [crossref]
  18. Tan MH, Hill RG and Anderson P (2015) Comparing the air abrasion cutting efficacy of dentine using a fluoride-containing bioactive glass versus an alumina abrasive: An in vitro study. International Journal of Dentistry 2015.
  19. Banerjee A, Pabari H, Paolinelis G, Thompson ID and Watson TF (2011) An in vitro evaluation of selective demineralised enamel removal using bio-active glass air abrasion. Clinical Oral Investigations 15: 895-900. [crossref]
  20. Taha AA, Hill RG, Fleming PS and Patel MP (2018) Development of a novel bioactive glass for air-abrasion to selectively remove orthodontic adhesives. Clinical Oral Investigations 22: 1839-1849. [crossref]
  21. Brauer DS, Karpukhina N, O’Donnell MD, Law RV and Hill RG (2010) Fluoride-containing bioactive glasses: effect of glass design and structure on degradation, pH and apatite formation in simulated body fluid. Acta Biomaterialia 6: 3275-3282.
  22. Patel VR, Shettar L, Thakur S, Gillam D and Kamala DN (2019) A randomised clinical trial on the efficacy of 5% fluorocalcium phosphosilicate‐containing novel bioactive glass toothpaste. Journal of Oral Rehabilitation 46: 1121-1126. [crossref]
  23. Yamamoto T, Hasegawa T, Yamamoto T, Hongo H and Amizuka N (2016) Histology of human cementum: Its structure, function, and development. Japanese Dental Science Review 52: 63-74. [crossref]
  24. Janiszewska-Olszowska J, Drozdzik A, Tandecka K and Grocholewicz K (2020) Effect of air-polishing on surface roughness of composite dental restorative material–comparison of three different air-polishing powders. BMC Oral Health 20: 1-7. [crossref]
  25. Tada K, Kakuta K, Ogura H and Sato S (2010) Effect of particle diameter on air polishing of dentin surfaces. Odontology 98: 31-36. [crossref]
  26. Farooq I, Tylkowski M, Müller S, Janicki T, Brauer DS and Hill RG (2013) Influence of sodium content on the properties of bioactive glasses for use in air abrasion. Biomedical Materials 8: 065008. [crossref]
  27. Masood H, Gillam D and Hill R (2020) The Effect of Bioactive Glasses in Air Abrasion Procedures. Journal of Orthodontics and Craniofacial Research.
  28. Barnes CM, Covey D, Watanabe H, Simetich B, Schulte JR and Chen H (2014) An in vitro comparison of the effects of various air polishing powders on enamel and selected esthetic restorative materials. J Clin Dent 25: 76-87. [crossref]
  29. Haeberlein IR, Schmid B and Pfarrer AM (2016) Powder composition for air polishing the surface of hard dental tissue. S. Patent 9,358,185.
  30. Paolinelis G, Banerjee A and Watson TF (2009) An in vitro evaluation of the efficiency of an air-abrasion system using helium as a propellant. Dental Materials 25: 1442-1445. [crossref]
  31. Liaqat S, Aljabo A, Khan MA, Nuba HB, Bozec L, Ashley P and Young A (2015) Characterization of dentine to assess bond strength of dental composites. Materials 8: 2110-2126.
  32. Baysan A, Sleibi A, Ozel B and Anderson P (2018) The quantification of surface roughness on root caries using Noncontact Optical Profilometry—An in vitro study. Lasers in Dental Science 2: 229-237.
  33. Paepegaey A-M, Barker ML, Bartlett DW, Mistry M, West NX, Hellin N, Brown LJ and Bellamy PG (2013) Measuring enamel erosion: a comparative study of contact profilometry, non-contact profilometry and confocal laser scanning microscopy. Dental Materials 29: 1265-1272. [crossref]
  34. Sinjari B, D’Addazio G, Bozzi M, Santilli M, Traini T, Murmura G and Caputi S (2019) SEM Analysis of enamel abrasion after air polishing treatment with erythritol, glycine and sodium bicarbonate. Coatings 9: 549.
  35. Clark HM and Burmeister L (1992) The influence of the squeeze film on particle impact velocities in erosion. International Journal of Impact Engineering 12: 415-426.
  36. Flemmig TF, Hetzel M, Topoll H, Gerss J, Haeberlein I and Petersilka G (2007) Subgingival debridement efficacy of glycine powder air polishing. Journal of Periodontology 78: 1002-1010. [crossref]
fig 8

Zooplankton Research in Lake Kinneret: A Review

DOI: 10.31038/AFS.2021341

Abstract

The ecological status of the zooplankton compartment and its complex interactions in Lake Kinneret are here reviewed with respect to regional climate change. Food web and thermal structure modifications resulting from climate change affected the zooplankton community. Nutrient dynamics and the structure of phytoplankton assemblages were modified. The dominant representative genus Peridinium of the Pyrrhophyta was replaced by Cyanobacteria, accompanied by Bacillariophyta and Chlorophyta proliferation. As a result of limitation constraints on the fish market, the Bleak (Mirogrex terrae-sanctae, Acanthobrama lissneri) stock in the lake was enhanced, with resulted in a decline in zooplankton biomass. The zooplankton biomass reduction could be attributed to the top-down cascading enhanced pressure which, together with the increase in Total Phosphorus, resulted by climate change as a result of internal and external impact conditions, supported the increase in nano-phytoplanktonic biomass.

Keywords

Kinneret, Zooplankton, Cyanobacteria, Bleak, Climate Change

Introduction

Lake Kinneret is a warm monomictic lake which is the only one natural freshwater lake located below sea level in Israel. Enclosed some Hydro-Morphometrical information of Lake Kinneret under maximum permitted Water

Level- 208.8 meter below sea level (mbsl)

Water level fluctuation: 214.87-208.20 mbsl

Water surface area – 169.5 Km2

Maximum depth – 48 m

Altitude of deepest bottom area – 256 mbsl

Mean depth – 26 m

The raion between mean and maximum depths – 0.54

Total Lake Volume – 4.471 km3

Shore line length – 55 km

Lake Maximum length – 21 km

Lke Maximum width – 12 km

D value for Lake Kinneret – 1.19

D value is the ratio between actual shoreline length and perimeter of geometric cycle which has the same area of the lake.

The food web structure in Lake Kinneret, like in any other lake, comprises of different compartments, including a zooplankton compartment. Nevertheless, not as commonly considered, the role of each has different impact in the food-web. The status of each natural compartment of a system is related to its quantitative significance, surplus, deficiency or sufficiency level. The optional capability of significant anthropogenic successful management depends on thorough knowledge of the eco-physiological features of each compartment. Management achievement is rated by water quality. This is the concept of Kinneret zooplankton research in the past, present and for the future. The far history approach to zooplankton research was mostly based on taxonomy, physiology, diurnal vertical migration and spatial bathymetrical distribution, as well as fish and invertebrate predation densities. Nevertheless, future perspectives on zooplankton research are aimed at its status within the entire food web structure. Moreover, modeling development defines the impact of zooplankton on the flow pattern of energy, carbon or any other key element throughout the food web structure.

The recent 20 years represent changes in climate conditions accompanied by modifications in nutrient dynamics and the phytoplankton community structure in the lake and its drainage basin. Modification or additional research approaches such as a change of the routine methods might be resulted by loose of informative data and continuity of the record. Therefore, deviation from the routine methodology of zooplankton research might cause cut of data flow between past and present which are critical for future studies and require comparative indications.

Background

Physical features of Lake Kinneret and its drainage basin are given partly given here but widely presented in [1-4]. Lake Kinneret, the only natural freshwater lake in Israel, is a warm Monomictic lake which is stratified from May through mid-December (anoxic Hypolimnion) and totally mixed from mid-December through April. Due to its high temperature of seasonal and Bathymetrical mean range of 15-33°C, the thermal stratification is stable and separates the lake into two thermal compartments of Epilimnetic 0-20 m depth and Hypolimnetic thickness 24 m (20 m – bottom). The Epilimnion is rich in oxygen and poor in other nutrients. Oxygen is completely absent in the Hypolimnion, which is rich in ammonia, sulfides and CO2. Due to the stability of the thermal structure, there is a steep gradient of substances in the thin Metalimnion layer, indicating a slow rate of nutrient exchange between the Epilimnetic and Hypolimnetic layers [3-4].

Regional climate conditions of temperature and precipitation ranges are subtropical with high levels in winter and low in summer. The high difference between summer and winter temperatures create separation between the Epilimnion and the Hypolimnion, resulting reductive and anoxic Hypolimnetic waters. As a result during the summer stratification period there are high concentrations of dissolved Phosphorus, Ammonium, Sulfides and CO2 in the Hypolimnion whilst deficiency of nutrients in the Epilimnion.

The Lake Kinneret Watershed

The hydrological management of the Lake Kinneret volume capacity and, consequently, water level (WL) is a rainfall regime dependent and the demands for water supply. The amplitude of WL fluctuation is a legislated limit of 208.80-213.00 meters below sea level (MBSL) but actually the amplitude was larger. The Lake Kinneret ecosystem has undergone significant changes during the last 70 years of the Anthropocene Era. Anthropocene period is dating from the commencement of human impact on the ecosystem; approved (March 2021) by International Commission on Stratigraphy (ICS) and International Union of Geological Sciences (IUGS). Some of the changes include: water level changes within 6.7 m amplitude, high range of inflow discharges between >109 m3 and <260 x 106 m3 per annum, precipitation range of 333-1060 mm/y, and changes in fish stock, Epilimnetic temperatures, phytoplankton density and species composition, zooplankton biomass density and body size composition, and nutrient concentrations [4]. The high numerical density of small Rotifera (>100 Ind./l) [5-15] in Lake Kinneret in winter is the result of river floods containing reservoir and fishpond effluents with also Cladocera (Daphnia spp.), and the counterpart Copepoda (Eucyclops serrulatus) and Diaptomida (Eudiaptomus gracilis) which are intensively preyed upon by fish at the river mouth region. Zooplankton predators accumulate within the river mouth zone and therefore, the densities of large body zoopllanktonic organisms in the lake pelagial is extremely low (<5 ind./l) [15]. River floods in winter enrich the lake fauna mostly with small rotifers.

The concept of this paper is re-evaluation of zooplankton status under the recent climate and anthropogenic changes within the complex interaction of the Lake Kinneret food web. An attempt is made at predicting how natural and anthropogenic environmental changes influence the zooplankton status.

Historical (1969-2020) Remarks on the Kinneret Zooplankton Research [Biomass Decline: >50 to <20 g(ww)/m2) Decline]

The continuity of zooplankton research in Lake Lake Kinneret was slightly modified beyond the 2000`s when the increase of small size organisms was recorded. The zooplankton research prior to the 2000`s is considered as a cornerstone of Lake Kinneret limnological research. In the early 2000s, annual reports of both biomass (g(ww)/m2) and numerical data (No/L) were published. The routine monitoring data that were published annually during 2003-2005 by the Kinneret Limnological Laboratory (KLL) of the Israel Limnological and Oceanographic Research Company Ltd (IOLR) [1] included information on total zooplankton biomass density within the range of 20-24 g(ww)/m2, which is similar to earlier common ranges reports. Later on enhancement of increasing portion of small organisms was reported. The contribution of the biomass of Rotifera was much higher, contributing 15-43% of the total biomass, with Cladocera contributing 35-53%. Such a difference might be due to the change in the routine of sampling programs, as well as sorting and microscopic counting technologies. The long-term trend in changes, either expressed as numerical data or biomass, was confirmed and analyzed as mostly affected by Bleak [Mirogrex terraesanctae terraesnctae, (Steinitz 1952); Acanthobrama lissneri (Tortonese, 1952);common name: Lavnun, Sardine or Bleak].

Materials and Methods

Results given in this paper are the outcome of a long-term study of the distribution and physiology of zooplankton in Lake Kinneret. The experimental methods and sampling program had been documented and published earlier [6,10-12,14-16]. The physiology of Copepoda, Cladocera and Rotifera organisms were experimentally measured in cultures of single individuals in three common Epilimnetic temperatures: 15°C in winter, 22°C in spring and fall and 27°C in summer A brief summarized compilation of previously collected information is re-evaluated here. Consequently, only the data sources and statistical methods are given in this section.

The evaluation of the routinely collected data was done as follows: Weekly sampling results of Nutrients, temperature, phytoplankton, and zooplankton were monthly averaged whilst, Fish Population Size was monitored by Bi-monthly Echo-Survey calculated for the entire lake. For some of the long-term analysis annual means were computed.

Data Sources

The long-term datasets (1970-2018) of Lake Kinneret and its watershed, including data on the water and air temperature, precipitation, nutrient (mostly forms of N, P, and C concentrations) dynamics, lake plankton community structure, lake water level (WL) control (Dam management and pumping rate), and river discharges [1-5], were statistically evaluated. Data were obtained from the following sources: Kinneret Limnological Laboratory, annual the Israeli National Meteorological Service, the Israeli National Hydrological Service (National Water Authority). Other data sources were MIGAL, Hula Project Service [3], Mekorot Watar Supply Company Ltd., Monitoring Unit Jordan District, Agriculture Ministry Northern Branch – Upper Galilee Office, and TAHAL Water Planning for Israel (Table 1).

Table 1: Parameters.

Parameter

Units

Time Span Sampling Interval Number of Sampling Stations Number of Sampling Depths

Number of Points X103

Temperature

°C

1970-2018 Weekly 7 15

260

Nutrients

Ppm & ton/lake

1970-2018 Weekly 5 13

12.5

Phytoplankton

g(ww)/m2

1970-2018 Bi-weekly 1 13

16

Zooplankton

g(ww)/m2&No/L

1970-2018 Bi-weekly 4 13

1.2

Fish Landing

Ton/Year

1959-2016 Annual Lake 57

67

Fish Population Size

106/lake

1987-2016 Bi-monthly 14 Transects 2m Bottom

174

Statistical Methods

Statistical analyses by fractional polynomial regression, linear regression with 95% confidence interval indication, simple averages, and line scatter plot were carried out using STATA 9.1.

The statistical significance of the fractional polynomial test is increasing the flexibility of the conventional polynomial models.

List of Abbreviations in Full:

BCM – 109 m3

HFCB – Harmful Cyanobacteria;

WL – (lake) Water Level;

FP – Fractional Polynomial Regression;

SPI – Standard Precipitation (rainfall) Index;

RT – Residence Time;

MBSL – Meters Below Sea Level;

WW – Wet Weight;

DW – Dry Weight;

No/L – Number of organisms per Liter;

YOY – Young of the Year (fish);

TC – Total Carbon;

TN – Total Nitrogen;

TP – Total Phosphorus;

P/B – Production per Biomass ratio;

C/B – Consumption per Biomass ratio;

P/C – Production per Consumption ratio (production efficiency);

PE – Peridinium Era;

ME – Microcystis Era;

TN/TP – Total Nitrogen per Total Phosphorus ratio

PP – Particulate Phosphorus;

SP – Soluble Phosphorus;

PN – Particulate Nitrogen;

PNz – Nitrogen contained in zooplankton particles

PPz – Phosphorus contained in zooplankton particles;

Results

The impact of climate change on the Thermocline deepening as related to the water level (WL) changes and warming are shown in Figures 1-3. The minor changes of zooplankton biomass density (g/m3) in the Epilimnion with respect to the depth of the Thermocline is presented in Figure 4. The Bathymetrical distribution of Zooplankton density indicates high densities at 5-17 m depth irrespective to the vertical performance of algal Primary Production. The long-term decline of fish landing (Total and Bleak: Mirogrex sp. Acanthobrama sp.) whilst fish population size enhancement are clearly indicates in Figures 6 and 7 respectively. The long –term decline (1970-mid-1990`s) and elevation afterwards of zooplankton (Copepoda, Cladocera, Rotifera) biomass and numerical densities are shown in Figures 8. The insufficient algal food supply for herbivore zooplankton during 1970-mid 1990`s and luxury of availability of edible algal later on is presented in Figure 9. The linear regression between potential prey (Cladocera, Rotifera, herbivore Copepoda) for predator Copepoda and their density is shown in Figure 10. Figure 10 also indicates long-term increase of the ratio between small and large body size of Cladocera. A significant symptom of climate change followed by precipitation and river discharge decline influenced Total Nitrogen and Total Phosphorus dynamical changes: Total Nitrogen decline and relative slight increase of Total Phosphorus therefore decreased the TN/TP mass ratio (Figures 11 and 12). The consequent modification of algal bloom domination where Cyanobacteria replaced Peridinium are presented in Figures 12 and 14.

fig 1

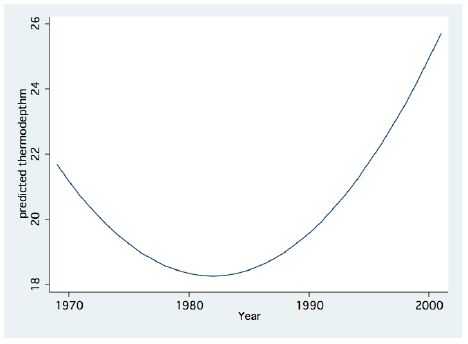
Figure 1: Fractional Polynomial regression between the Thermocline depth and years.

fig 2

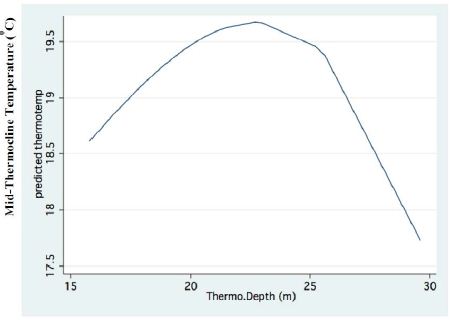
Figure 2: Fractional Polynomial regression between the mid-Thermocline temperature and years.

fig 3

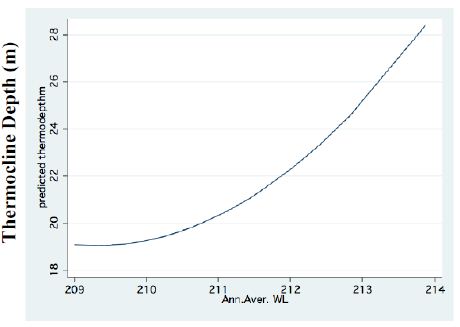
Figure 3: FP regression between Thermocline depth and Water.

fig 4

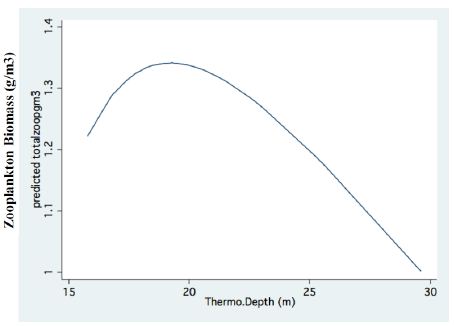
Figure 4: Fractional Polynomial regression between Epilimnetic total biomass of zooplankton concentration (g/m3) and Thermocline depth (m).

fig 6

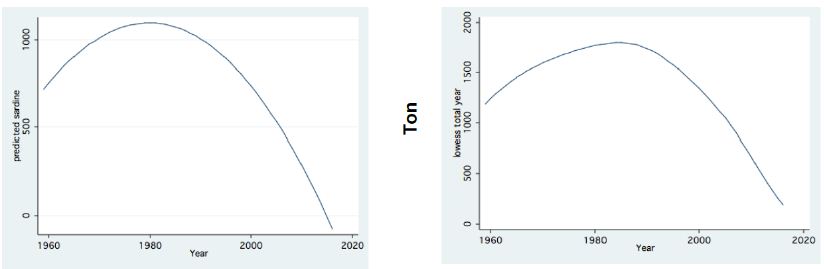
Figure 6: Trend of Changes (LOWESS; 0.8) of Annual Fish landings (ton) in Lake Kinneret (1959-2016); Left: Sardines Right: Total catches.

fig 7

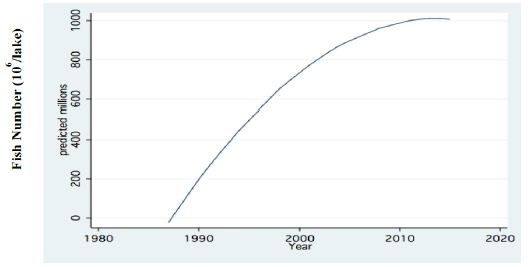
Figure 7: Fractional Polynomial regression between Annual Means of total fish number (106), (all sizes), acoustically recorded in Lake Kinneret during 1987-2016.

fig 8

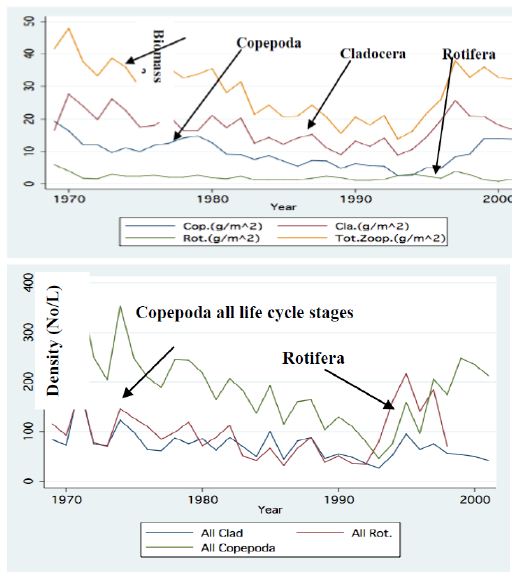
Figure 8: Line Scatter plot of Annual means of monthly averages of Zooplankton densities: Copepoda, Cladocera, Rotifera and total). A – Biomass (g/m2) B – No/l (Copepoda all life cycle stages).

fig 9

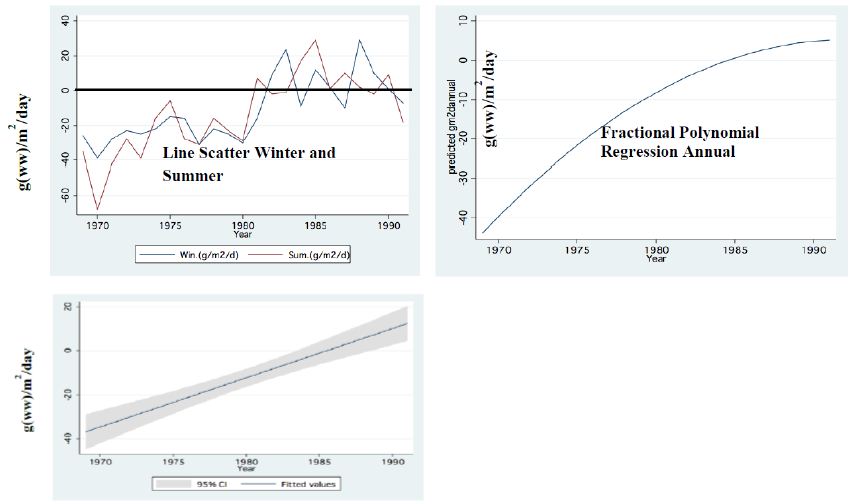
Figure 9: Food Requirement by Zooplankton related to Nano-Phytoplankton availability (g (ww)/m2/day) during Peridinium Era (PE). Zero level mean food is equal to requirement <zero=insufficient food>Zero=Sufficient food (Food exceed requirement).

fig 10

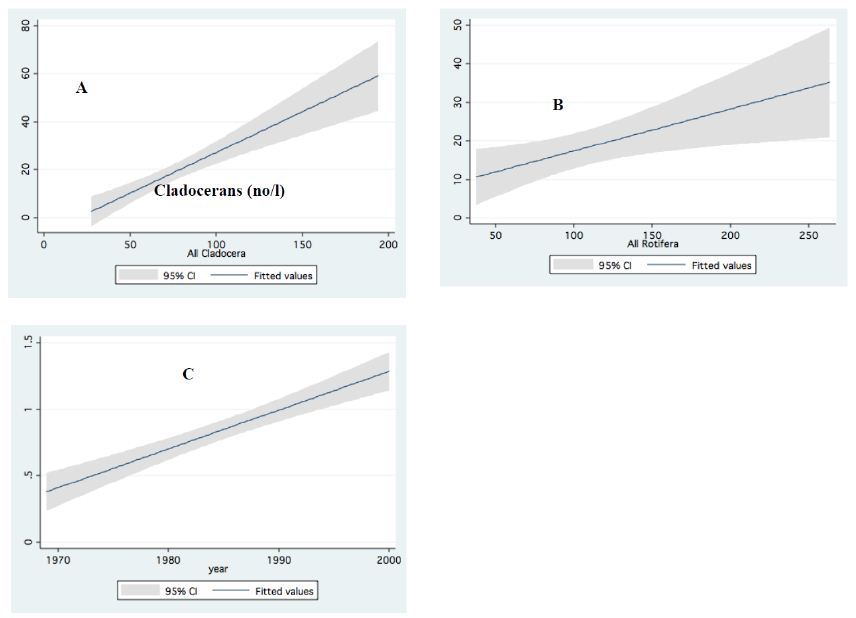
Figure 10: Linear regressions (95% ci) between: A – Predator cyclopoids and cladoceran; B – Predator cyclopoids and rotifers. C – Large and small cladocerans; Data (No/L) are annual means of monthly averages.

fig 11

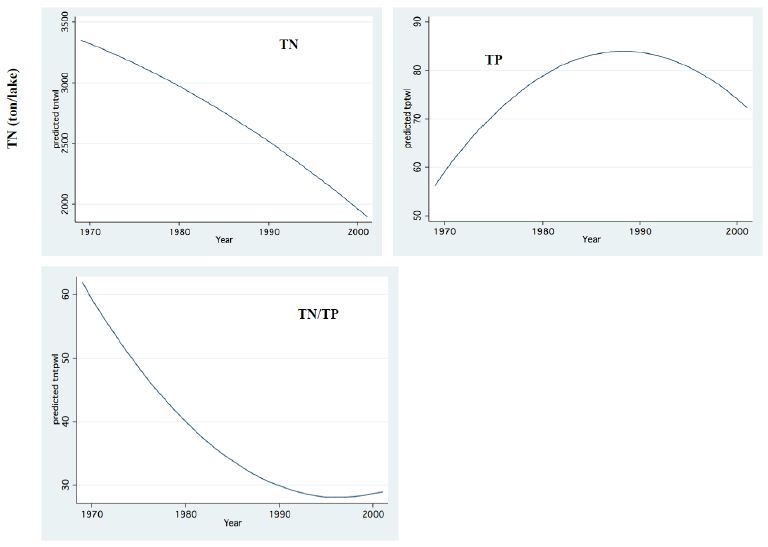
Figure 11: Whole Lake Standing stocks (Ton) of Total Nitrogen (TN), Total Phosphorus (TP) and TN/TP mass Ratio.

fig 12

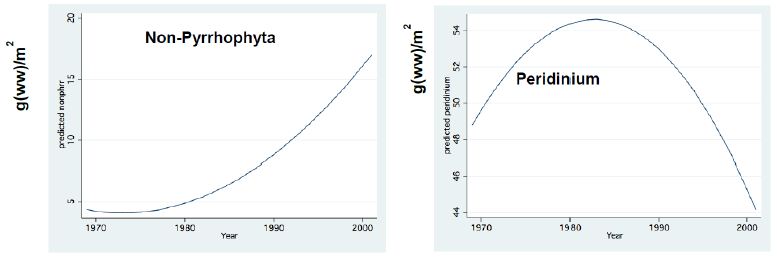
Figure 12: Fractional Polynomial Regression Between: Peridinium and Non-Pyrhophyta monthly means Biomass (g (ww)/m2) and Years; Non-Pyrrhophyte include: Chlorophyta, Diatoms, Cyanobacxteria.

fig 14

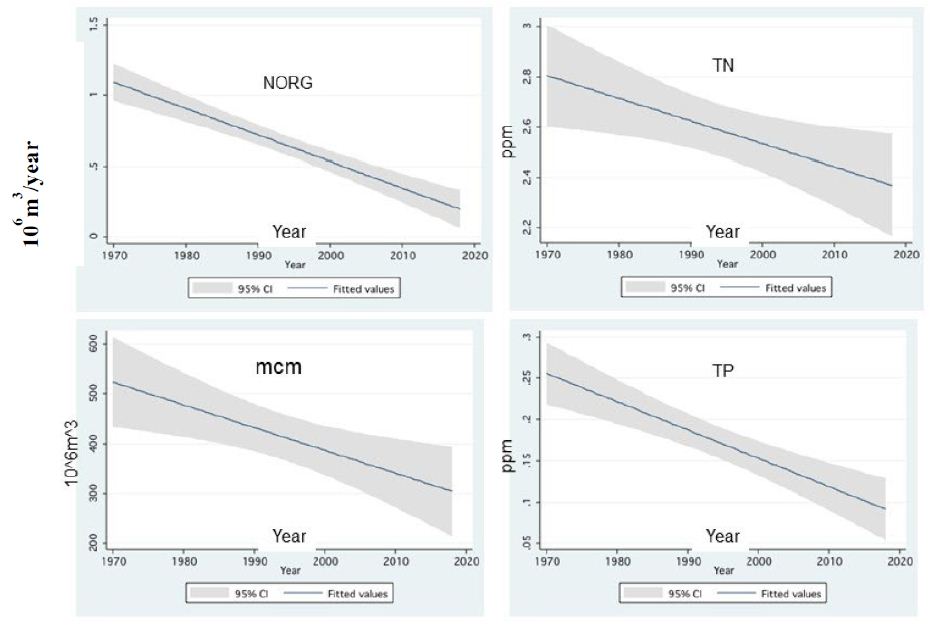
Figure 14: Linear Prediction (w/95% Ci) between annual averages of Total Nitrogen (TN), Organic Nitrogen (NORG), Total Phosphorus (TP) and annual discharge of River Jordan (mcm, 106 m3) and Years (1970-2018).

The average biomass density of the zooplankton groups (Copepoda, Cladocera, Rotifera) is given in Table 2.

Table 2: Averages of annual (1969-2001) means and Max-Min ranges of zooplankton groups (Copepoda, Cladocera, Rotifera, and Total Zooplankton) WW-biomass (g(ww)/m2).

Group

Average (g(ww)/m2) (%)

Max-Min Range (g(ww)/m2)

Copepoda

9.0 (33)

2.3-17.7

Cladoceraa

15.9 (59)

8.8-25.1

Rotifera

2.1 (8)

0.9-5.2

Total

27.0

12-48

The numerical density of small and large body size of zooplankton and the ratio between them in Lake Kinneret is given in Table 3 as multi-annual (1970-2001) averages; Small size include: nauplii and 1-4 Copepod copepodite stages, 1-3 Cladocera neonates and Rotifera (exclude Asplanchna spp); Large size zooplankton include: 4-5 copepodite stages and adult Copepoda, 3-4 neonates of Cladocera and Asplanchna spp (Table 3).

Table 3: Multiannual averages of annual means of zooplankton group (Copepoda, Cladocera, Rotifera, Total) concentrations (No/L) sorted by body size (L=large, S=small); Ratios of S/L are indicated.

Group/Size

No/L

L/S Ratio

Copepoda-S

136

0.26

Copepoda-L

36

Cladocera-S

40

0.75

Cladocera-L

30

Rotifera-S

83

0.16

Rotifera-L

13

Total-S

259

0.36

Total-L

92

The physiological parameters that were measured experimentally on individual animals under 3 temperatures were employed for field data of density by species sorting and respective temperature. Monthly and annual and multi-annual means were computed and physiological parameters were calculated (Walline et al 1993). Summary is given in Table 4.

Table 4: Metabolic parameters of Kinneret Food=Web compartments (Walline et al. 1993).

Food Web Compartment

P/B: Production/Biomass Ratio

C/B: Food-Consumption/Biomass Ratio

P/C: Production/Food consumption

Bacteria and Protozoa

360

750

48

Small Zooplankton

57

280

19

Large Zooplankton

35

300

12

Zooplanktivore Fishes

0.9

9

10

Phytoplanktivore fishes

1.2

10

12

The summary of the study of food source of predator Cyclopoida that was analyzed microscopically is given in Table 5.

Table 5: Number (%) of Copepoda intensines (freshly collected and immediately analyzed), identifiable food items were indicated and documented.

Fragments of

Number of predators included prey items (%)

Ceriodaphnia spp.

170 (36.8)

Diaphanosoma sp.

110 (23.8)

Cyclopoids

32 (6.9)

Bosmina spp.

3 (0.6)

Grey-grained matter

133 (28.7)

Algae

15 (3.2)

Total analyzed

463

The linear statistical regression results between edible algal groups (Chlorophyta, Diatoms) and herbivore zooplankton groups are presented in Table 6.

Table 6: Statistical parameters (r2, all probabilities were <0.0001) of multi-annual regression between monthly values of Phytoplankton (Chlorophyta, Diatoms) and Zooplankton (Copepoda, Cladocera, Rotifera) wet biomass (LKDB 1970-2020).

Plankton Groups

Regression Index (r2)

Chlorophyta-Vs Copepoda

0.66

Chlorophyta-Vs Cladocera

0.55

Chlorophyta Vs Rotifera

0.27

Diatoms Vs Copepoda

0.40

Diatoms Vs Cladocera

0.43

Diatoms Vs Rotifera

0.44

Experimented temperatures used for the measurements of the zooplankton physiological features were 15°C, 22°C, 27°C, The zooplankton biomass density (g(ww)/m2) was calculated as seasonal mean and results are given in Table 7 with respect to presented temperatures.

Table 7: The mean biomass (g(ww)/m2) of zooplankton groups in three seasons with presented temperatures.

Season

Herbivore Copepoda

Predator Copepoda Cladocera

Rotifera

January-April (15°)

7.4

8.6 26

6

May; November-December (22°)

5.5

6.5 24

3

June-October (27°)

6.0

7.0 22

1

As part of the long-term changes of nutrient dynamics in Lake Kinneret the analysis of climate change impact on nutrient migration through River Jordan discharge was carried out. The linear regression between organic Nitrogen, Total Nitrogen and Total Phosphorus annual concentration in the River Jordan Water and the discharge was carried out. The results are given in Table 8.

Table 8: Linear Regression (r2 and p values are given) between Jordan River discharge capacity (<600 mcm/y) and the concentrations of Organic Nitrogen, Total Nitrogen and Total Phosphorus in Jordan waters.

Nutrient

r2

Probability (p) (S=significant)

Organic Nitrogen

0.1903

0.0039 (S)

Total Nitrogen

0.2108

0.0022 (S)

Total Phosphorus

0.3567

<0.0001 (S)

Metabolic features of Lake Kinneret Zooplankton

Results from previous field monitoring and experimental studies [6] supplied information about the seasonal and long-term temporary density (no/L) distribution of numerical and biomass density distribution, and zooplankton metabolic (production, respiration, food consumption) activity. The evaluation presented here is an attempt at tentative interlocking of separated chains into a unified ecological web. The following metabolic data were incorporated:

Mean biomass in µg (ww)/individual [6,11-13]:

Herbivore Copepoda (nauplii, copepodites 1-4 stages) – 3.2; 46% of total Copepoda;

Predator Copepoda (copepodite 5, adults) – 14; 54% of total Copepoda;

Cladocera – 21.9; small Rotifera – 1.0;

The conversion of wet biomass to carbon content was based on the following: Dry weight (DW) is 10% of wet weight (WW) and carbon content is 44% of DW [6,8,13].

A full-year cycle was divided into three seasons based on commonly monitored Epilimnetic temperatures [1,6]:

January-April: 15-20°C; May and November-December: 20-24°C; and June-October: 24-28°C.

The long-term record of the mean biomass measured in three seasons of the zooplankton groups is given in Table 6.

Discussion

Climate Change

Long-term Dynamics of Thermal Structure, and Plankton

The Israeli climate conditions vary from the desert climate in the south to the subtropical climate in the north (Lake Kinneret and its watershed included) and the wet and mild Mediterranean climate in the center. Rain distribution over Israel (total 7.9 BCM/y) varies between 1300 (north) and less than 100 mm/y (southern desert). The total national water supply is 2.11 BCM, of which 0.55 BCM comes from the Lake Kinneret–Jordan ecosystem 0.7 BCM are desalinated, and the rest are taken from Aquifers, regional drainage basins and reuse. Consequently, the Lake Kinneret water quality is a national concern, and zooplankton features as part of the energy flow system within the food web are essential.

The climate change in dryness trend was expressed as an increased frequency of negative SPI (standard precipitation index) values, periodic prolongation of the drought season, and irregularities in the rainfall pattern. There was a decline in total rainfall volume, river discharge, and water input, which was accompanied by a decline in the lake WL. The entire symptom of climate change was progressive. Dryness expressed as the enhanced frequency of drought seasons initiated an elevation of lake water salinity and consequent reduction in lake water exchange and prolongation of water residence time (RT) from 5 to 18 years [3]. The RT elongation also enhanced change in nutrient dynamics, such as salt accumulation and decline in Epilimnetic nitrogen availability. The lack of Epilimnetic nitrogen caused Peridinium decline [3] but no significant change in potential zooplanktonic food resources. Ecological response to these climate changes in the lake was probably zooplankton eco-physiological behavior, such as enhancement in growth rate, or physical changes, such as modifications in thermal structure [6-8]. Cyanobacteria growth was enhanced by change in nutrient dynamics and increase in temperature. Cyanobacteria are regarded as competitors to other algal groups, such as Pyrrhophyta under the temperature elevation process and the decline of Nitrogen. Temperature increase also affected the zooplankton populations. The impact of temperature on the metabolic trait of zooplankton was documented [6]. Moreover, the sensitivity of the simulated model outputs established that the most sensitive parameters (over the full parameter space) were related to the zooplankton grazing rate, temperature responses, and food limitation [9]. The impact of Cyanobacterial bloom formation on water quality includes toxin production, which negatively affects vertebrate and invertebrate organisms. All these ecosystem changes are recognized as symptoms of the Eutrophication trend.

The reduction in water inputs caused a decline in the lake’s nitrogen supply, creating Epilimnetic insufficiency of nitrogen, which caused the disappearance of the long-term (1960-1995) documented Peridinium bloom formation. The Peridinium bloom was replaced, among other genera of Cyanobacteria, by HFCB (toxic), N2 fixers, and non-N2 fixers.

A significant result of climate change was changes in the depth and the temperature of the Thermocline. Figures 1-3 indicate the following: since early 1980s, the Thermocline has deepened by app. 8 meters (Figure 1); Thermocline deepening from 22 m to 28 m was accompanied by a temperature drop of about 2°C (Figure 2). Moreover, the decline in lake water level (WL) from 210 to 214 mbsl was accompanied by Thermocline deepening by app. 8 m (Figure 3). These climate change conditions were comparatively tested against zooplankton density (Figure 4) [10]. The monthly means of biomass concentrations in g(ww)/m3 (volumetric) were converted to densities per m2 (aerial). A multi-annual (1970-2001) total average summary of the vertical distribution of zooplankton as related to the Thermocline deepening, in terms of g/m3 and g/m2, indicated minor changes: 1.35-1.05 g(ww)/m3 and 27-30 g/m2. Nevertheless, seasonal as well as diurnal fluctuations were significant. Several studies documented the diurnal vertical migration of zooplankton. High concentration of zooplankton at the upper part of the Thermocline during the stratification period was documented (Figure 5). Bruce et al. [7] concluded that the relative contribution of zooplankton to the Epilimnetic inorganic stock of nutrients varied seasonally in response to the thermal cycling of stratification/mixing periods. Moreover, zooplankton Epilimnetic excretions were highest (62%) during summer stratification and lowest (2%) during the winter turnover periods [6].

fig 5

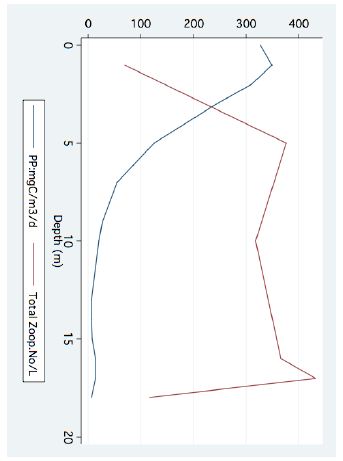
Figure 5: Line scatter of Bathymetric distribution of total zooplankton densities (no/l) and Primary Production (mgC/m3/day) (August 1977).

The Role of Zooplankton in the Lake Kinneret Ecological Services: Fishery

The zooplankton research was focused on the pelagic zone. The Lake Kinneret littoral volume is estimated to be less than 10% of the Epilimnion volume. Nevertheless, the littoral function as a fish nursery space is significant. The eco-physiological trait of zooplankton discussed here is due to the pelagic zone. A similar consideration is also attributed to the benthic fauna, which is active in recycling sediments but less involved in the eco-physiological activity within the water column.

The ecological involvement of zooplankton within the Lake Kinneret service objectives obviously has to do with the interrelationship with fish. Nevertheless, the Lake Kinneret ecological services are much wider as multi-targets: water supply, aquatic recreation, tourism, nature protection and commercial fishery. The aquatic recreation service is correlated with the protection of fish reproduction grounds (spawning, display, and young of the year (YOY) fish training), and zooplankton availability was partly damaged by both WL decline, beach vegetation dispersal and littoral suitability, as well as water quality deterioration. The availability of zooplankton prey density for the new born fingerlings is significant for the renewal of the pelagic fish community by the young generation emerging from the littoral zone. Consequently, the impact of the Cyanobacterial bloom dominance has an economic implication for the utilization of Lake Kinneret.

The zooplankton body size included in this study fell between 0.1-2.0 mm. Although most of the free-swimming freshwater zooplankton organisms belong to the small-size invertebrate taxa of Cladocera, Copepoda and Rotifera, there are more, including (among others) Ciliata, Flagellata, Turbelaria, Nemertea, Gastrotricha, Nematoda, Nematomorpha, Ostracoda, Isopoda, Amphipoda, and Hydracarina. Zooplankton research in Lake Kinneret always aimed at ecological aspects which are critical for good water quality. Therefore, this paper is focused on the dominant pelagic organisms.

Zooplankton Densities

The term (1969-2001) averages of zooplankton biomass (WW) density in Lake Kinneret are given in Table 1 as averages and ranges (max-min) of annual means.

Zooplankton concentration (No/L) density, expressed as the number of individuals per liter sorted by body size (small and large classes), is given in Table 2.

Results in Tables 1 and 2 indicate that the majority of zooplankton biomass are adult Copepods and Cladocerans, although young Copepoda stages (nauplii) and Rotifers are most numerous.

The body size ratio (large/small) of the zooplankters indicates the dominance of visual particulate fish feeding habits maintained by YOY of Bleaks and Tilapias. The larger organisms are more visible and therefore more vulnerable to predators. The higher number of young instars than adults throughout the life cycle is common in nature and ensures the sustainability of the organism. The impact of intensified visual-attack predation pressure by Bleak fishes on large-bodied adults enhances this situation: adult (large body size) elimination boosts the number of young instars, making them more abundant. It has been observed that the fingerlings of most of the Lake Kinneret fish species populating the shallows are filter feeders that do not discriminate prey by size. The information given in Tables 1 and 2 considers the pelagic zone populations, where bleaks are the majority.

The impact of the body size of zooplankters on the functional trait of the whole community is significant (Table 3). Biomass measure is affected by body size and large organisms contribute more than small ones. Nevertheless, specific activities like food consumption, excretion, respiration, reproduction, mortality, and population turnover time of small organisms are higher than those of large organisms. It is noticeable that such a comparative attitude is limited to different body sizes of adult or offspring stages of the same species. The most common Copepod in Lake Kinneret, Mesocyclops oggunus, maintains 10 life cycle stages that are dissimilar in morphology, size and physiological trait, including nauplius, copepodite instars and adult. Moreover, the differences in instars also include differences in swimming behavior and vulnerability to predators.

Total Load of Zooplankton Biomass

Daily fish consumption is about 5-20% of their body wet weight whilst zooplankton – 80-110% [8], the reproduction rate (population turnover time) of fishes is scaled annually whilst that of zooplankton is measured in week-months measure. The role of Bacteria, Protozoa, Zooplankton and fish food web compartments are presented in Table 3.

The min-max ranges of lake nutrient (TC, TN, TP) stocks (ton), as commonly documented in Lake Kinneret during the winter mixing period, are as follows:

TC: 16564-26476 ton

TN: 2032-4092 ton

TP: 44-128 ton

The TC, TP, and TN content ranges (max. during winter-spring bloom – min. when no bloom in summer) (ton/lake) within the food web compartments are given below [11]:

Zooplankton: 302 t

Fish: 1478 t

Phytoplankton (max-min): 4536-504 t

Particulate organic carbon (max-min range): 14280-20160 t

Dissolved organic carbon (maximum bloom level): 17136 t

Detritus and dissolved forms were responsible for the majority (76-86%) of the Carbon content, whilst living organisms (zooplankton, fish, phytoplankton) contain a minor part of the standing stock of Carbon in the Lake Kinneret ecosystem. The standing stock ranges (max-min) of TC, TN and TP in Lake Kinneret are 16564-26476, 2032-4092, and 44-128 ton, respectively. Based on data shown previously, the P and N content percentage in the Lake Kinneret fish and zooplankton is lower than 1%, and in phytoplankton is 3-17%. In other components, the P and N content is due to particulate and dissolved organic matter. When a similar evaluation was carried out for bacteria and protozoa, the results indicated even lower measures. The role of the food web compartment in the energy flow pattern through the ecosystem material cycling and turnover time was documented by Serruya et al. [8] and Walline et al. [9], and later modeled by Bruce et al. [9] and Gal et al. [10]. The turnover time of phytoplankters is measured in days, of Bacteria and Protozoa in hours, of Zooplankton in weeks, and of fish in years. Conclusively, the impact of zooplankton is probably higher than that of fish and lower than that of phytoplankton, Bacteria and Protozoa. Bruce et al. [7] indicated that about 51% of photosynthetic Carbon is consumed by zooplankton and the excretion of dissolved nutrients by zooplankton accounts for 3-45% and 5-58% of P and N uptake by phytoplankton, respectively. The following parameters represent the metabolic trait of the Lake Kinneret food web compartment: P/B – the ratio of production to biomass; C/B – the ratio of food consumption to biomass; P/C – the percentage of production efficiency, which is the ratio of production to food consumption. These metabolic parameters were calculated for Phytoplankton, Bacteria and Protozoa, small Zooplankton (herbivores), large Zooplankton (predators), known zooplanktivore fishes (Bleaks), and in general planktivore fishes (Tilapia); the results are given in Table 3 [11].

Information given in Table 4 indicates very high production and nutrient consumption by bacteria and Protozoa. Therefore, it is suggests that most of their production is utilized by consumers at a higher food web level. Zooplankton is preyed upon by fish (all zooplankton stages are consumed by fish) and a minor part by invertebrate predator (adult Cyclopoid). It should be noted that the zooplanktivore fishes (Bleaks) are dominant (>90% by biomass and number) in the Lake Kinneret fish community. This may be an indication why about 80% of the zooplankton biomass is transferred to a higher food web level [12,13] (Figure 10).

Fish-Zooplankton Community Interrelationships

Two major changes were documented within the Lake Kinneret fishery and consequently in fish communities: A) The fishery of Bleaks diminished close to a zero level due to the loss of market demands initiated by the absence of motivation for fishing them (Figure 6). As a result, Bleak stock size increased significantly (Figure 7). The proliferation of Bleaks undoubtedly intensified zooplankton suppression. B) Tilapia (mostly S. galilaeus) fishery crashed from the normal landing of 250-350 tons to less than 10 tons of annual fishery. Nevertheless, this decline in Tilapia fishery was naturally rehabilitated, but due to Peridinium elimination, Tilapia slightly shifted to prey on zooplankton for part of their diet. The outcome given in Figures 6-9 is a classical event of complex interactions in lake communities. Bleak fishery diminished as a result of reduction in market demand, leading to an increase in Bleak population (Figures 6 and 7) and, consequently, intensifying the pressure on zooplankton population, which caused a decline in the zooplankton density (Figure 8). The elevation of zooplankton stock biomass from the mid-1990s was due to the implementation of the subsidized Bleak fishery program. Between 1995 and 2002, more than 5000 tons of unwanted large- and small-sized Bleak fishes were removed, partly to garbage dump and partly marketed. The change in the Phytoplankton community structure (Peridinium replacement by Cyanobacteria) enhanced the predation of zooplankton by Bleaks and Tilapias. The ecological events within the lower level of the trophic pyramid (zooplankton-nano-phytoplankton) are shown in Figure 9. The total food requirement was calculated [8] and balanced with the available nano-phytoplankton stock biomass. These relations were evaluated by two regression methods between food requirement and years (Figure 9): Fractional polynomial regression (annual means of g/m2/d) and linear regression (95% confidence Interval); the line scatter is shown in Figure 9. Results in Figure 9 indicate that before 1985, when Peridinium was dominant, food algal resources were insufficient to meet zooplankton demands and other sources (detritus, Protozoa, Bacteria) were probably utilized, but later on (1985-1990) algal sources became sufficient. It is suggested that algal food sufficiency resulted from both the decline in zooplankton stock biomass and slight enrichment in phosphorus in the Epilimnetic resources (Figure 11).

The Role of Invertebrate Predation

The absence of significant predator invertebrates in Lake Kinneret has been previously confirmed [8]. The only known carnivorous zooplankter is the adult stages of cyclopoid copepods (Mesocyclops oggunus), which are commonly present as a mixed-age copepod population throughout a full-year cycle. Earlier studies documented the predatory habits of the adult copepods [11-13]. A combination of gut content analysis and experimental study has yielded results that confirmed the predation of Ceriodaphnia spp. and Diaphanosoma sp. and cannibalism; however, the very common Bosmina spp were not preyed upon. The results of gut content analysis of large-body Copepoda (copepodite 4 & 5 and adult males and females) [11] are given in Table 4.

Results in Table 5 represent a combined investigation of feeding trials of live organisms and microscopic observations of animal feeding behavior. The limited impact of invertebrate predation on zooplankton density was confirmed. Nevertheless, Gal et al. [10] presented a data-driven model of zooplankton dynamics and indicated that the abundance of predatory Copepoda determines the population size of herbivores and micro-zooplankton rather than their food sources. In other words, the top-down cascading effect is dominant. That is, predator Copepoda control the population size of herbivore Cladocera and rotifers. Copepoda gut content, as studied by direct microscopic observations and experimental research, confirmed the dominant top-down effect achieved mostly by zooplanktivore fish. That is a scientific disputed meeting between modeling and solid observed results. The impact of vulnerability was also indicated, where the fast swimmer, Diaphanosoma, was preyed upon by Bleaks less than slower than Diaphanosoma-moving Ceriodaphnia. Moreover, no preyed items (trophy, lorica plates etc.) of Rotifera and residuals of Bosmina spp. were found in the cyclopoid gut contents. On the contrary, food resources for Bleak and young fish stages (YOY, fingerlings) of most of the Lake Kinneret fish species were confirmed (by gut content analysis and experimental studies) as many zooplankton species. The conclusion by Gal et al. [10] about intraguild predation of zooplankton by both fish and invertebrates is incomplete, as confirmed by experimental study and microscopic observations. The Lake Kinneret food web includes both visual-attacker fish predators, which prefer large-body invertebrates and slow swimmers (zooplankters), and filter-feeder fish, which ingest zooplankton of all sizes. It is therefore concluded that the impact of zooplankton predation on the entire invertebrate community is minor and free-swimming small animals are preyed upon mostly by fish (cascading top-down eco-force) (Figure 10).

Zooplankton-Phytoplankton Interactions

The long-term record of the River Jordan-Lake Kinneret ecosystem indicates, a reduction in Total Nitrogen and a slight increase in Total Phosphorus input and in the Lake Kinneret Epilimnion (Figure 11). These changes also induced a decline in the TN/TP mass ratio, in the Lake Kinneret Epilimnioin which was favored by Cyanobacteria. Rachamim et al. [14] suggested the influence of WL decline on the nutrient content in particulate matters. The decline in headwater discharges, followed by the decline in the lake WL, enhanced the prolongation of residence time (RT) followed by Nitrogen input decline, accompanied by outsourced Phosphorus (dust deposition, bottom sediments) slight increase. As a result of temperature elevation and Nitrogen deficiency, there was significant reduction in the biomass of Peridinium spp, which was replaced by non-phyrrhophyte species, mostly Cyanobacteria but also Chlorophyta and Diatoms (Figures 13 and 14). It is suggested that the changes in the phytoplankton community structure are due to regional climate changes. A long-term record of the Lake Kinneret phytoplankton [1,2] revealed significant modification in the algal community since the 1990s. Consequently, the phytoplankton-zooplankton interaction is include two periodic eras: the “Peridinium Era” (PE) before the 1990s and the “Microcystis Era” (ME) afterwards. Results given in Tables 1 and 3 are accounted for by PE conditions. The biomass density of non-phyrrhophytes in summer months was significantly elevated during the PE: Statistical regressions of monthly (May, June, July) density vs. Time (month) resulted in the following ranges: p=0.02-0.03 and r2= 0.46-0.52, indicating significant summer increase. Although available food biomass was significantly elevated, it was insufficient due to the summer temperature elevation which enhanced the zooplankton demand. These are the common summer conditions which represents the “Lake Kinneret Summer Paradox of Steady State” (Figures 9 and 13) [8]. The geographical climate zone of the Lake Kinneret drainage basin region is defined as subtropical, and therefore the summer season is dry, long and hot, causing a lack of nutrients when the food requirements of all food web compartments are maximal. Nutrients required by algae are accompanied by a high level of animal metabolism, resulting in insufficient supply of energy. The food requirements of the primary (zooplankton) and secondary (fish) consumers are maximal but resources are minimal, leading to insufficient food supply to herbivore and predator zooplankton and fish compartments. Zooplankton predation by fish is enhanced by the mobilization (swimming) capabilities of fish, following downwards the zooplankton migrating towards the top of the thermocline. On the other hand, the diurnal vertical migration of zooplankters enables them to locate, as refuge, darker depths at the top of the thermocline, or upper Epilimnetic layer at night, as well as particle-enriched layers for feeding.

fig 13

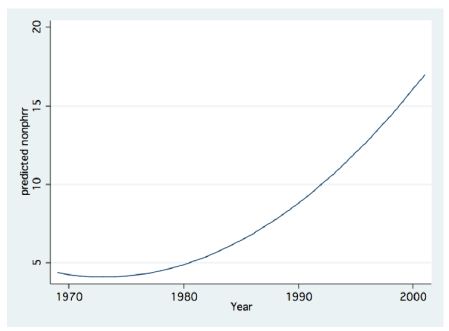
Figure 13: Fractional Polynomial regression between Non-Pyrhophyta Biomass (g/m2) and Years.

The relative abundance of algal cells in the digestive tracts of Cladocerana (Bosmina spp, Ceriodaphnia spp, Diaphanosoma sp) was seasonally monitored [11-13], and the results indicated a nano-phytoplanktonic preference. Scenedesmus spp, Tetraedron spp, Cosmarium sp, Chodatella sp, Oocystis sp, Pediastrum spp, and Coelastrum sp were the most common algal species in the Crustaceans gut content.

The ratios of monthly changes of edible phytoplankton (Chlorophyta, diatoms) biomass to monthly biomass changes of zooplankton (Copepoda, Cladocera, Rotifera) during the PE represent a relative increase in phytoplankton densities (Table 5). Considering the indirect relation between algal food resources and zooplanktivore fishes, the results in Table 6 indicate the following: long-term zooplankton biomass suppression by fish alleviated feeding pressure on phytoplankton resulting in algal biomass enhancement. It is therefore suggested that the zooplankton suppression was due to fish predation (Bleaks) and nano-phytoplankton was probably affected by an additional factor such as nutrient (most probable Phosphorus) availability. Combined data given in Tables 1 and 3, accompanied by field data from the PE, indicate that there was insufficient algal food for zooplankton in the earlier part of the PE and excess food availability afterwards. Insufficient algal food availability in the early PE and, later, excess algal food availability to zooplankton in summer and winter seasons are shown in Figure 9. Consumption of other food sources, such as Bacteria, Protozoa and detritus, was likely enhanced earlier, but reduced later, in the PE. Considering that zooplankton function as a preventive agent against water quality deterioration within a complex interaction, zooplankton mortality was enhanced by bleak fishes, grazing pressure on nano-phytoplankton was reduced, algal growth was enhanced, and food availability was improved. Furthermore, non-algal food resources for zooplankton probably flourished: Pico-Phytoplankton, Bacteria, Protozoa, and detrital particles resulted in the disintegration of the heavy biomass of Peridinium bloom and consequently fish feces. High Nano-Phytoplankton, Bacterial, Protozoa and detrital densities are widely considered as symptoms of eutrophication, i.e.water quality deterioration.

Zooplankton-Nutrient Relationships

The impact of zooplankton on the distribution of nutrients (N, P) within the Lake Kinneret ecosystem during the PE was mostly controlled by the following parameters: zooplankton homeostasis (stoichiometry), algal food resource growth rate and consequent availability, geochemical properties of the Lake Kinneret waters, and thermal structure (stratification stability). It has been documented [8,15] that 71% and 29% of the Lake Kinneret nitrogen stock in the water column exist as suspended particles (plankton and detritus) and as dissolved forms, respectively. About 57% of P in the Lake Kinneret water column stock exists as suspended particles (Plankton, Detritus) and 43% in dissolved forms. Moreover, in the top layer (1 cm) of the bottom sediments, there is a stock of 900 t and 700 t of N and P, respectively. The Lake Kinneret habitat was P-limited throughout the entire PE period. The reason is the high pH and formation of undissolved complexes of Phospho-Carbonates due to high Ca++ content. Such a bio-geochemical background of biomass reduction by fish predation enhanced the significance of the function of zooplankton homeostatic capability. Incorporating information documented by Andersen and Hessen [16] for the Lake Kinneret biota compartments resulted in P content (%) in zooplankton, total phytoplankton and non-phyrrhophyte of 15%, 13%, and 4%, respectively. The low P content in the preferred algal food source (4% of total) relative to the high P content in the zooplankton stock (15% of total) compartment indicates that P cycling by zooplankton is a significant non-algal source. Nishri [1] approximated equal stocks of particulate (PP) and dissolved (SP) Phosphorus in Lake Kinneret. Consequently, about 30% of the P standing stock is PP and 30% SP. The following changes in the ecosystem were observed during the PE: zooplankton reduction enhanced nano-phytoplankton growth rate and consequently increased biomass density and independent P stock. Consequently, it is suggested that the enhancement of P flux through zooplankton homeostatic recycling led to the appropriate supply of P required by enhanced nano-phytoplankton. Available sources of additional P demands were likely detritus, Bacteria, and Protozoa. These were the dynamic results of maintaining a balanced pattern of the energy flow through existing channels of an ecosystem under quantitatively and not qualitatively, changed conditions. Nevertheless, those modifications also resulted in the partial transfer of P from the homeostatic zooplankton to the phytoplankton [19-21]. These shifts were followed by an independent event of Nitrogen decline in the Lake Kinneret suspended particles. These modifications resulted in an increase in the P content and a decline in the N content, and the TN/TP mass ratio was, therefore, decreased in the Lake Kinneret suspended particles, especially in the algal cells. The impact of homeostasis caused P excretion, which afterward enhanced Cyanobacteria (CE). Conclusively, despite the removal of about 25-30 ton of P through fish landings and water withdrawal (pumping), the partial transfer of P from zooplankton to phytoplankton compartment constitutes partial enrichment of the Lake Kinneret water by P, and the prevention of zooplankton reduction is beneficial for the lake management aimed at water quality protection. The long-term (1969-mid-1990s) decline in zooplankton density in Lake Kinneret and the subsequent increase are shown in Figure 8. The enhancement of zooplankton densities in the mid-1990s could be attributed to the implementation of the recommended subsidized Bleak fishery (“Bleak Dilution Project”, BDP), which continued for 6 years, when about 5500 tons of Bleaks were removed. The objective of the BDP was to reduce zooplankton predation and increase the grazing pressure on non-pyrrhophytes in order to improve the water quality. Nevertheless, such an objective might have been considered successful if the increase in zooplankton grazing pressure was accompanied by phosphorus decline, but the opposite occurred (Figure 11). Due to zooplankton enhancement as well as the high level of available phosphorus (Figure 11), algal biomass increased (Figure 12). Phosphorus availability were slightly improved as a result of continuous external and internal inputs [19-21]. Rachamim et al. [14] documented a drastic change in the Nitrogen content of zooplankton particles (PNz) and Phosphorus content of zooplankton particles (PPz) with water level (WL) fluctuations; these changes were lowest for high WL and highest for low WL. The same authors [14] suggested that a decline in zooplankton contribution to Epilimnetic Particulate P (PP) and Particulate Nitrogen Particles N (PN) during winter flood seasons could be attributed to the intensification in zooplankton predation by fish. Nevertheless, information about seasonal fish feeding habits in Lake Kinneret confirmed low rates of fish feeding in winter, probably in response to low temperatures. Tilapia are tropically originated and therefore exhibit the lowest activity in winter, which is the reproductive season of the Palaearctic-originated Bleak fishes, accompanied by a reduction in feeding rates.

Synopsis: Future Perspective of Zooplankton Research in Lake Kinneret

This paper is an attempt at establishing the central status of the zooplankton compartment in the Lake Kinneret ecosystem structure. The build-up to the hypothesis is supposed to have grown from a data-driven infrastructure. The eco-structure research growth has three optional directive concepts: 1) pure and solid data (field and experimental sources) and consequent evaluation; 2) data-driven modeling; and 3) a combination of (1) and (2). Einstein opinion on Modeling was define as “Doit as simple as possible but not simpler”. Moreover, as part of J. Lovelock’s “Gaia Philosophy” attempted to disprove the claim that the Gaia hypothesis is not scientific because it is impossible to test it by controlled experiments. It is possible that models were advanced before observation and measurement. The present Lake Kinneret research is probably too close to the point where modeling comes before observation and measurement, and modeling is a threat to scientific foundation. Nature is always the final determinant and the hypothesis should be examined by observation and experiment as indicated by Lovelock. How do models of processes and phenomena relate to reality?

The history of Lake Kinneret research indicates two periods: Until the 2000s, the Lake Kinneret limnological data were collected and evaluated as solid information that was incorporated into an up-to-date complex food web interaction eco-structure. Later on, modeling with future perspectives became a major aspect of the entire concept of scientific research in Lake Kinneret. In this paper, I have presented a combination of field data and experimental studies, besides the precaution of misleading results of modeling evaluation.

Zooplankton is under two directive eco-forces: A) Cascading top down pressure by zooplanktivore fishes, but invertebrate predation is negligible, and increase in the Bleak population in the lake was documented [22-25]; B) Bottom-up through nutrients controlling the available algal density and likely the zooplankton is significantly affected by temperature and temperature elevation due to climate change (Figure 14) [4,5] also supported the forceful impact on metabolic activity. This paper has focused on the relation between climate change and Zooplankton ecology. A consequence of zooplankton density significant change to climate change was not documented. Climate change conditions enhanced the decline in the TN/TP mass ratio (Figure 11) which favored Cyanobacteria and enhanced their density. The long-term reduction in zooplankton density between 1969 and the mid-1990s changed to moderate elevation due to the intensification of subsidized Bleak fishery; nano-phytoplankton biomass density increased as a result of stable and slightly higher Epilimnetic availability of Phosphorus. During 1970-2000 a slight Eutrophication development in the Lake Kinneret ecosystem was indicated due mostly to climate change. Phytoplankton assemblages were modified in Lake Kinneret and consequently, fish and zooplankton community structures were supposed to be modified as well. Whereas recent reports [1] confirmed the essential linkage between zooplanktivorous predation pressure by enhanced population resulted by low marketing, of Bleaks on zooplankton (Figures 13 and 14). Unfortunately, results of experimental data on prey preferential habits of predator Copepoda were not incorporated into the newly developed ecological models [13]. It has not been possible to arrive at a comparative conclusions because biomass information and methodological background were not published. Water level fluctuation has probably no direct influence on the pelagic zooplankton fauna. Nevertheless, an indirect impact has been confirmed when Heavy discharge accompanied by WL elevation of above 2 cm per day induced intensive Bleak reproduction accompanied by zooplankton suppression.

Gyllstrom and Hanson et al. (13 more authors) [23] carried out a study on the role of Climate Change in shaping zooplankton communities in shallow lakes. They [23] concluded that TP was found to be the most important predictor of zooplankton biomass and community structure and Climate Change the next most important predictor. They [23] also emphasized the optional impact of Climate Change through top-down regulation by fish, i.e. linkage between food-web dynamics and Climate Change. The zooplankton adaptation capability supported flexibility of their densities and composition in response to the phytoplankton modification. Independently, prediction of changes to lake fishery management might accelerate the shift in zooplankton body size composition [24] due to increase in Bleak population. The elimination of Bleak marketing intensified cascading top-down suppression. Nevertheless, not without minor temporary fluctuations of the zooplankton community structure and the unique central position of its status was unchanged.

Acknowledgment

This paper is a memorial tribute to Prof. Ramesh Gulati

Ethical Statements

The author confirm the following Ethical Statements included in this paper: No ethical malfunction; No plagiarisms; No conflict of interests.

References

  1. LKDB (1970-2020) Lake Kinneret Date Base, Kinneret Limnological Laboratory, IOLR, Annual Reports
  2. Gophen M (1992) Conclusive Multiannual Report on Zooplankton in Lake Kinneret; Kinneret limnonological Laboratory IOLR 72.
  3. Gophen M (2018) Book: Ecological Research in the Lake Kinneret and Hula Valley (Israel) Ecosystems. Scientific Research Publishing Inc. USA 336.
  4. Gvirtzman H (2002) Israel Water Resources, Chapters in Hydrology and Environmental Sciences; Yad Ben-Zvi Press: Jerusalem, Israel, 2002; 287.(In Hebrew).
  5. Givati AT, Guillaume D, Rosenfdeld, Paz D (2019) Climate change impacts on stream flow at the upper Jordan River based on an ensemble of regional climate models. Journal of Hydrology: Regional studies 21: 92-109.
  6. Gophen M, Azoulay B (2002) The Trophic status of zooplankton communities in Lake Knneret (Israel), Verh. Internat. Limnol 28: 836-839.
  7. Gophen M (1972) Zooplankton Distribution in Lake Kinneret (Israel) 1969-1970 Israel J. Zool 21: 17-27.
  8. Easton J, Gophen M (2003) Diel variations in the vertical distribution of fish and plankton in Lake Kinneret: a 24-h study of ecological overlap. Hydrobiologia 491: 91-100.
  9. Bruce LC, Hamilton D, Imberger J, Gal G, Gophen M, et al. (2006) A numerical simulation of the role of zooplanktonin C, N, and P, cycling in Lake Kinneret, Israel. Ecological Modelling 193: 412-436.
  10. Gophen, M. 2016. Population Dynamics of Cyclopoid Copepods in Lake Kinneret (Israel) Open Journal of Modern Hydrology, 6, 212-221, .http://dx.doi.org/10.4236/ojmh.2016.64017
  11. Serruya C, Pollingher U, Gophen M (1980) Lake Kinneret Carbon Flow Pattern and ecosystem management. fHyur drobiologie 88: 265-302.
  12. Walline P, Pisanti S, Gophen M, Berman T (1993) The Ecosystem of Lake Kinneret, Israel, in: V. Christensen and D. Pauly (eds.), Trophic Models of aquatic ecosystems 103-109. Phillipines: ICLARM, Denmark: International council for the exploration of the sea, Denmark: Danida
  13. Gal G, Skerianer M, Tanasova N (2013) Fluctuations in Water Level and the dynamics of zooplankton: A data driven modeling approach. Freshwater Biolgy 58: 800-816.
  14. Gophen M (1977) Food and Feeding Habits of Mesocyclops leuckarti (Claus) in Lake Kinneret (Israel). Biol 7: 513-518.
  15. Gophen M (1978) Chapter: Zooplankton, in: Lake Kinneret Monographiae Biologicae, Vol. 32.Dr. Junk bv Publishers The Hauge-Boston-London 1978 (C. Serruya ed.) 299-311.
  16. Gophen M (1981) The Metabolism of Adult Mesocyclops leuckarti Populations in Lake Kinneret (Israel) During 1969-1978. Int. Verein. Limnol 21: 1568-1572.
  17. Rachamin T, Stambler N, Zohari T, Berman-Frank I (2010) Zooplankton contribution to the particulate N and P in Lake Kinneret, Israel., under changing water levels. Hydrobiologia 655: 121-135.
  18. Serruya C (ed.). (1978) Lake Kinneret Monographiae Biologicae, Vol. 32, Dr W. Junk Publishers The Hague-Boston-London, 501.
  19. Andersen T, Hassen DO (1991) Carbon, Nitrogen, and Phosphorus content of Freshwater Zooplankton. Oceanogr 36: 807-814.
  20. Hessen DO (1992) Nutrient element limitation of zooplankton production. Nat 140: 799-814.
  21. Sterner RW (1990) The ratio of Nitrogen to Phosphorus resupplied by herbivores.: zooplankton and algal competitive arena. The Am. Nat 136: 209-229.
  22. Sterner RW, Smith RF (1993) Clearance ingestion, and release of N and P by Daphnia pulex feeding on Scenedesmus acutus of varying quality. Mar. Sci 53: 228-239.
  23. Sterner RW, Elser JJ, Hessn DO (1992) Stochiometric relationships among producers, consumers, and nutrient cycling in pelagic ecosystems. Biogeochemistry 17: 49-67.
  24. Watanabe Y (1990) C:N:P ratios of size fractionated seston and planktonic organisms in various trophic levels. Internat.Verein. Limnol 24: 195-199.
  25. Makler V, Hipsey MR, Zohary T, Carmel Y, Gal G (2017) Intraguild predation dynamics in a lake ecosystem based on a coupled Hydrodynamic-Ecological model: The example of Lake Kinneret (Israel). MDPI Biology 6: 22.
fig 1

Chemical Characterization, Antioxidant, Anticancer and Hypolipidimic Activities of Chamomile (Matricaria chamomilla L.)

DOI: 10.31038/NRFSJ.2021421

Abstract

Highest grade chamomile is widely cultivated in Egypt and is one of the most important medicinal plants. The current study reported newly specification and characterization of chamomile flower. Results revealed that iron, flavonoid content, total phenolic, total antioxidant capacity, saponins, glucan and mannan were 788 ppm, 467.1 mg/100 g QE, 556.44 mg/100 g GAE, 785.88 mg/100 g ACE, 2.385%, 79.44 g/Kg and 83.65 g/Kg, respectively. GC/MS analysis of chamomile methanolic extract ensured the presence of thirty seven compounds: salinomycin (32.09%), uvaol (5.81%), terpinoline (1.95%), humulene (0.72%) and curcuminol (1.06%). Fatty acid profile indicated the existence of linoleic acid (17.78%) and palmitic acid (15.91%). DPPH and ABTS assays were applied to monitor the antioxidant capacity of chamomile extract. Assessment of antitumor activity of methanolic extract of chamomile flowers were fruitful with recorded IC50 = 15.2 μg/ml and IC50 =33 μg/ml for intestinal (Caco-2) and colon (HCT) carcinoma cell lines.

Aqueous chamomile extract was prepared and screened for its cholesterol lowering property In-vivo. Rats were fed hyperlipidemic diet and administered aqueous chamomile extract for eight weeks. There was a decrease in cholesterol level in chamomile treated rat group comparable to hyperlipidemic group. Chamomile extracts reduced cholesterol and LDL levels. Increase of HDL level was observed in chamomile administered group in comparison with positive control. Non-significant difference in triglyceride level existed between negative and positive controls. Administration of chamomile had no effect in altering triglyceride.

The study presented newly results concerning chamomile regarding its high iron and biologically active phytochemical contents, antitumour potency against two life threatening cancer cell lines and hypocholesterolimic effect.

Keywords

Chamomile flowers, Chemical analysis, Methanolic and aqueous extracts, Antioxidant and antitumor activities, In-vivo study

Introduction

According to the World Health Organization (WHO) over three quarters of the world’s population relies mainly on the use of medicinal plants for their health care. From approximately 250,000 species of higher plants on Earth, research suggests that even two thirds of them have medicinal value [1a,b]. Chamomile or Matricaria chamomilla L., from the family Compositae, was an important medicinal herb in ancient Egypt, Greece and Rome [2]. Chamomile is sometimes known as “the plant doctor”, because it is thought to help the growth and health of many other plants, especially ones that produce essential oils. It is thought to increase production of those oils, making certain herbs, like mints (spearmint, sage, oregano) and basil stronger in scent and flavor [3-5].

Flowers are one of the most important parts of a plant that has polyphenols, carotenoids, and many bioactive compounds. The flowers of many plants are consumed as tea because of their antioxidant properties and their important role in the human diet [6]. Common chamomile is one of the most popular flowers used in different fields (such as cosmetics, food and beverage production, medicine, and aromatherapy). In addition to being used in traditional medicine, it is also used for tea and vitamin supplements [7]. Chamomile plant extracts, one of the most consumed herbal teas, have also been reported to many biological activities [8]. Chamomile is known for it’s as anti-inflammatory, anti-diarrhea [9], antioxidant [10], anti-cancer [11], neuro-protective [12], anti-allergic [13] and antimicrobial [14] effects. It also improves cardiac health [15]. Chamomile is an annual herbaceous plant and is Generally Regarded as Safe (GRAS) because it neither contains toxic compounds nor represents any acute toxicity for humans and animals [16]. Chamomile is known for its richness in phenolic compounds believed to be responsible for its biological activities [17]. It contains phenolic compounds such as the flavonoids apigenin, quercetin, patuletin and luteolin, glucosides and coumarins [18]. As far as could be ascertained, there is no published report in the literature on the hypolipidimic activity of chamomile flower.

The present study has been designed to define chemical constituents of chamomile flowers and monitoring the effectiveness of methanolic and aqueous extracts by In-Vitro and In-Vivo assays.

Materials and Methods

Plant Material

Chamomile was purchased from Beni-Suef governorate, located 120 km south Cairo on the west bank of the Nile River during the year 2020. The plant specimen was identified by the Botany Department,Faculty of Science, Helwan University. The flowers were solar dried in solar energy department of National Research Centre, Giza, Egypt. After drying process, seeds of flowers were separated and grounded to finely coarse powder and kept in plastic bags till the completion of the work.

Nutritional Evaluation of Chamomile Flower Seeds Powder

Ash, silica, fats, fibres, moisture and crude protein were determined according to the [19]. Carbohydrate content was calculated by difference [20]. Minerals measurement of Fe, Zn and Cu was conducted according to the [21]. The amino acids were estimated by the [22] protocol. Total aflatoxin was performed according to [23].

Phytochemical Analysis

Total flavonoid was determined according to [24], total phenolic compounds [25] and total antioxidant capacity [26]. Saponin content was determined by double solvent extraction gravimetric [27] and mannan [28]. HPLC determination of beta-glucan was conducted according to [29].

Methanolic Extract of Chamomile Flowers Powder

Two hundred grams of chamomile flowers powder were exhaustively extracted with two liters of 80% methanol (v/v) using a Turrax mixer set at 11,000 rpm for 20 seconds. After full extraction, the extract was then centrifuged at 3000 rpm for30 minutes to remove the residues [30]. The methanol extract was concentrated in vacuo at 45°C and partitioned with chloroform. Chloroform extract was then evaporated to dryness in vacuo, affording an oily dark brown green extract (15.3 g). Oil stored refrigerated until fatty acid profile, GC/MS analysis, screening of antioxidant activities as well as In-Vitro assays.

Fatty Acid Composition

Fatty acid of methanolic extract was Trans esterified into their corresponding fatty acid methyl esters as described by [31].

GC/MS Identification

Characterizations of methanol extract components by GC/MS technique [32] was performed at the Regional Center for Food and Feed (RCFF) using GC (Agilent Technologies 7890A) equipped with a mass-selective detector operating by HP-5ms capillary column (30 µm x 0.25 mm i.d. and 0.25 µm film thickness). The temperature was increased from 80°C to 230°C with rate of 3°C min-1. Carrier gas was helium at a flow rate of 1 ml min-1.

Identification of secondary metabolites was performed by comparing mass spectra and retention time with those of authentic standards and by matching with the database of National Institute of Standard and Technology (NIST).

Antioxidant Activity

Antioxidant activity of methanolic chamomile flowers extract was measured using 2, 2-Diphenyl-1-picryl-hydrazyl (DPPH) [33] and 2, 2-azino-bis (3- ethylbenzothiazoline-6-sulphonic acid (ABTS) assay [34].

Antitumor Activity

Anticancer study was assessed using SRB method at National Cancer Institute, Cairo, Egypt. Colon (HCT) and intestine (Caco-2) carcinoma cell lines were chosen to monitor anticancer activity of methanolic chamomile extract. Samples were prepared by dissolving 1:1 Stock solution and stored at -20◦C in dimethylsulfoxide (DMSO) at 100 mM. Different concentrations of the drug were used (5, 12.5, 25, 50 µg/ml).

SRB is a protein stain that binds to the amino groups of intracellular proteins under mildly acidic conditions to provide a sensitive index of cellular protein content [35].

Calculation

Percentage of cell survival was calculated as follows:

Surviving fraction = OD (treated cells)/OD (control cells)

The IC50 values (the concentrations of resveratrol required to produce 50% inhibition of cell growth) were also calculated.

Aqueous Extract of Chamomile Flowers Powder

Fifty grams of chamomile flowers powder was extracted in boiled water (1 L) with stirring for 30 min. After cooling, the aqueous solution was filtered to afford aqueous extract about 890 g.

In-vivo Assay

A study was carried out to evaluate the biological impacts for chamomile flowers aqueous extract on lipid profile for rats of hypercholesterolemia. Cholesterol, triglyceride, HDL, LDL and body weight were monitored after eight weeks experimental period.

Experimental Design

Biological experiment lasted for eight weeks was assessed using 27 male albino rats weighing 90±10 g. Rats were divided into three groups of nine each. Control group (I), Hyperlipidemic group (II) and hyperlipidemic with administration of aqueous chamomile extract group (III). The rats were housed in stainless steel cages and maintained at 22-24°C with relative humidity 45-55%. Diet and water were provided ad-libitum. Adaptation time was three days using barley as the sole diet. At zero time, after 4 weeks and at 8- weeks (end of experiment) rats of each group weighted individually and anaesthetized with CO2 and blood samples were collected via the retro-orbital plexus [36,37]. Serum was obtained by centrifuging at 3000 rpm for 15 min [38] separated and kept at 4 ºC until biochemical analysis of triglycerides, cholesterol [39], High Density Lipoprotein (HDL) [40] and Low Density Lipoprotein (LDL) [41].

Diets

Three Types of diets (I, II and III) were Prepared as Follows

Group fed a standard diet (I) served as negative control formulated according to NRC, 1995 [42] and drunk tap water. Treated group (II) “positive control” fed lipid enriched diet included 20% soya bean oil as fat source to prepare high fat diet and drunk tap water, and group (III) fed lipid enriched diet (II) and supplied with freshly prepared aqueous extract of chamomile flowers as the sole source of fluid. All diets were analyzed for moisture, crude protein, fiber, fat and ash [43].

Reagents and Standards

All chemicals and solvents were obtained from Merck and Sigma Aldrich, and they were analytical grade. Ultrapure water was used throughout this study (Millipore Direct Q, Bedford, MA, USA). Calibration graphs were constructed using standard solutions at different gallic acid and trolox levels to determine antioxidant activity and total phenolic content in the samples. BioTek Eon Elisa Microplate spectrophotometer was used for all measurements.

Statistical Analysis

Analysis of variance (Multivariate) and Duncan’s test were conducted using a statistical Analyses software SPSS (2017) [44]. A probability to (P≤0.05) was used to establish the statistical significance.

Results and Discussion

Chemical Composition of Dried Chamomile Flowers Seeds Powder

Proximate Analysis

As shown in Table 1, fat and protein were 7.8% and 15.3% respectively. Chamomile is packed with metal enzymes iron, zinc and copper which play roles in Anemia of Iron deficiency, growth and good cholesterol respectively. Iron valued (788 ppm), zinc (47.5 ppm) and copper (7.96 ppm). The presence of these nutrients was most abundant that reported with [45] and may interpret chamomile flowers as a complement in management of human related ailments and promotion of health. Ash and moisture contents were 9.5 and 9.6%, respectively. It was reported that ash and moisture in chamomile didn’t exceed 13% and 12%, respectively [46]. The results showed that chamomile flower seeds powder are rich with carbohydrate (54.74%). Carbohydrates are the most abundant nutrient in several fruit peels [47].

Table 1: Chemical analysis of chamomile flowers (g/100 g dried flowers seeds powder).

Parameter

Results (%)
Ash

9.5

Fat

7.8
Moisture

9.6

Protein

15.3
Silica

3.06

Total Carbohydrates

54.74
Mineral

(ppm)

Iron

788
Zinc

47.5

Copper

7.96

Amino Acids Profile

Amino acids were determined and presented in Table 2. Proline (1.07 mg/100 g), glutamic (2.08 mg/100 g) and aspartic (1.41 mg/100 g) acids and were the most abundant in the dried flowers seeds powder as compared with obtained with [48]. Essential and non -essential amino acids are detected in the powder.

Table 2: Amino acid profile of dried chamomile flower powder.

Amino acid

Result (mg/100 g)%
Essential amino acids

Hisitidine

0.34
Isoleucine

0.56

Leucine

0.85
Lysine

0.76

Methionine

0.34
Phenylalanine

0.62

Therionine

0.56
Valine

0.72

Total essential amino acids

4.75
Non-essential amino acids

Aspartic

1.41
Serine

0.66

Glutamic

2.08
Proline

1.07

Glycine

0.75
Alanine

0.78

Cysteine

0.25
Tyrosine

0.47

Argnine

0.80
Total non-essential amino acids

8.27

The dried chamomile flower seeds powder was free from aflatoxin and ocratoxin and safety usage for the different assays. Chamomile is an annual herbaceous plant and is Generally Regarded as Safe (GRAS) because it neither contains toxic compounds nor represents any acute toxicity for humans and animals (Tolouee et al., 2010).

Phytochemical Quantification

Total antioxidant capacity, total flavonoid, total phenolic, saponins, β-Glucan and mannan were 785.88 mg/100 g AAE, 467.1 mg/100 g QE, 556.44 mg/100 g GAE, 2.385%, 79.44 g/Kg and 83.65 g/Kg, respectively (Table 3).

Table 3: Phytochemical analysis of chamomile extract.

Parameter

Results
Total antioxidant

785.88 mg/100 g AAE

Total flavonoid

467.1 mg/100 g QE
Total phenolic

556.44 mg/100 g GAE

Saponin

2.385%
β-Glucan

79.44 g/Kg

Mannan

83.65 g/Kg

The total phenolic contents were determined as mg gallic acid/100 g chamomile flowers seeds on comparison with a standard gallic acid curve. The chamomile flowers seeds showed a high total phenolic content (556.44 mg gallic acid/100 g). The total flavonoid content (467.1 mg quercetin/100 g) was determined as mg quercetin/100 g chamomile flowers seeds after comparison with the quercetin calibration curve. The extract also has 2.385% of crude saponin. As per literature, these compounds can be found not only in the eatable part of the fruits but also in the non-eatable portions and have different biological activities such as antioxidant, antihepatotoxic effects and anti-inflammatory activity [48-50a]. Plant secondary metabolites such as polyphenols, play an important role in the defense against free radicals. Medicinal plant parts (roots, leaves, stems, flowers and fruits) are commonly rich in phenolic compounds, such as flavonoids, tannins, stilbenes, coumarins, lignans [50b]. The total antioxidant activity of the chamomile flowers seeds was 785.88 mg Ascorbic Acid Equivalence (AAE)/100 g. The total antioxidant capacity may due to its flavonoids and phenol contents of chamomile flower seeds. The antioxidant properties of polyphenols are due to their redox properties, which allow them to act as reducing agents, hydrogen donators, metal chelators and single oxygen quenchers. Polyphenolics exhibit a wide range of biological effects including antibacterial, anti-inflammatory, antiallergic, hepato-protective, antithrombotic, antiviral, anticarcinogenic and vasodilatory actions; many of these biological functions have been attributed to their free radical scavenging and antioxidant activity [51a]. β-Glucan and mannan were79.44 g/Kg and 83.65 g/Kg, respectively; as shown in Table 3 increase the immunity toward blood diseases [51b].

Fatty Acid Profile of Methanolic Extract

Fatty acid of chamomile extract is presented in Table 3. Linoleic acid (17.78%), palmitic acid (15.91%) and oleic acid (9.64%). Saturated and unsaturated fatty acid existed in chamomile extract (Table 4).

Table 4: Fatty acid of chamomile extract.

Fatty acid

Name

Concentration

C10:0

Capric acid

3.45%

C12:0

Lauric acid 0.73%
C14:0 Myristic acid

4.03%

C16:0

Palmitic acid 15.91%
C16:1 ω9 Palmatolic acid

3.11%

C17:0

Heptadecanoic acid 1.19%
C18:0 Stearic acid

5.40%

C18:1 ω9

Oleic acid 9.64%
C18:1 ω7 Vaccinic acid

0.47%

C18:2 ω6

Linoleic acid 17.78%
C18:2ω4 PUSFA Mixture mixture acid mixture

13.90%

C18:3ω3

Linolenic acid 5.71%
C18:4ω3 Alpha octadecatetraenoic

1.04%

C20:0

Arachidic acid 1.83%
C20:2ω6 PUSFA Mixture

12.41%

C20:3 ω6

Eicosatrienoic acid 0.63%
C20:4 ω6 Arachidonic acid

1.13%

C22:4 ω3

Eicosatrienoic acid 0.59%
C22:0 Behenic acid

1.02%

Non Identified fatty acids

0.03%

GC/MS Identification of Methanolic Extract of Chamomile Seeds Powder

GC/MS chromatogram elucidated the existence of thirty seven compounds: terpinoline, α-bisabolol, salinomycin, uvaol, curcuminol and humulene. Data clarified that most of the identified compounds belonged to the class of sesquiterpenes. Our results are in accordance with WHO (1999) that sesquiterpenes formed up to 50% of chamomile oil (Table 5).

Table 5: GC/MS analysis of chamomile methanolic extract.

NO

RT (min) NAME AREA SUM (%)
1 7.5 Cedrenol

1.53

2

7.7 Terpinolene 1.95
3 7.95 Elemene-ϒ

0.48

4

8.16 -Patchoulene ϒ 0.76
5 8.33 Β-Gurjunene

1,08

6

9.34 Aromandendrene 2.49
7 10.028 (±)-Cadinene

0.95

8

11.006 -Selineneϒ 25.2
9 11.18 7,8-Dihydroxy-4-methylcoumarin-3-actic acid

4.69

10

11.32 Uvaol 5.81
11 12.3 Salinomycin

32.09

12

12.37 Lutein 0.41
13 12.69 Manumycin A

0.41

14

12.93 (+)- Isovalencenol 1.35
15 13.1 Curcumenol

1.06

16

13.3 Geranyl-ᾳ-terpinene 1.21
17 13.45 ᾳ-Vetivol

0.32

18

13.65 Retinal 0.85
19 13.96 Ylangenol

1.1

20

14.17 Geranyllinalool 0.57
21 14.53 -Humuleneβ

0.72

22

14.72 Valerenol 0.53
23 14.94 -Himachaleneϒ

0.58

24

15.18 -3 Arachidonic acid ethyl esterω 3.12
25 15.64 Isovitexin

0.38

26

15.64 -Bisabololα 0.38
27 16.16 Digoxigenin

1.22

28

16.37 (-)-Globulol 3.44
29 17.14 Squalene

0.4

30

17.5 -Iononeα 0.4
31 17.8 All-trans-farnesyl acetate

0.4

32

18.15 -Terpinyl acetateα 0.33
33 18.42 Betulin

0.35

34

18.775 3-Carene 0.74
35 19.1 Phenol,2,3,5-trimethyl

0.41

36

19.23 2΄,3΄-Dimethoxyyflavanone 0.33
37 24.8 Isomyristic acid

1.29

Antioxidant Activity of Chamomile Methanolic Extract by DPPH and ABTS Assays

To assess antioxidant activity of chamomile extract, DPPH and ABTS methods were applied. DPPH is a stable free radical with absorption band at 515 nm. It loses this absorption when reduced by antioxidant such as phenolic compound and plant extracts (Table 6)[52].

Table 6: Antioxidant activity of chamomile extract.

Sample

Concentration (mg/ml) DPPH%

ABTS%

Ascorbic

50

91.219 94.714
25 92.583

94.884

12.5

92.497 94.884
6.25 92.412

94.884

3.125 92.497

96.419

1.562

92.412
0.781 92.327

0.39

84.057
0.195 43.478

Chamomile

50

89.514 91.885
25 89.343

94.918

12.5 68.968

94.344

6.25

36.913 60.327
3.125 20.971

36.065

Ascorbic acid and chamomile were prepared in concentration range of 0.195-50 mg/ml and 3.125-50 mg/ml, respectively. DDPH scavenging activity of chamomile extract ranged between 89.514% at 50 mg/ml to 20.971% at 3.125 mg/ml, While for ABTS scavenging activity ranged between 91.885% at 50 mg/ml to 36.065% at 3.125 mg/ml. it was obvious that the antioxidant activity increased with increase in chamomile concentration.

DPPH and ABTS assays ascertained the antioxidant capacity of chamomile extract as monitored in our results. These findings are consistent with Lim et al. (2007). As a result, antioxidant of chamomile extract may be mainly related to high level of phenol and flavonoid contents [53]. Cited that phenols and flavonoids contributed to antioxidant activity of extracts. An important compound detected in chamomile is terpinoline reputable as antioxidant [54], anti-inflammatory [55] and chemotherapeutic [56]. It exerted effective DPPH-scavenging activity (Kim et al., 2004) and may lower LDL oxidation (Tisserand and Young, 2014). The presence of β-humulene acted as antioxidant in chamomile oil increased the value of this herbal plant packed with naturally occurring sesquiterpenes. Described the antioxidant potential of β-humulene against free radicals [57].

Antitumor Activity of Chamomile Methanolic Extract

Antitumor activity for methanolic extract of chamomile (Table 7 and Figure 1) against human colon (HCT) and intestinal (Caco-2) carcinoma cell lines were tested. Antioxidants, which prevent the oxidative degradation of free radicals in the human body and help, prevent or reduce different diseases such as cancer, cardiovascular, and neurodegenerative diseases, have an important role in protecting human health [58a]. It is known that antioxidants in natural foods with antioxidant potential are safer and more beneficial compared to many synthetic antioxidants. Therefore, the antioxidant potentials of many vegetables, fruits, leaves, roots, spics, and herbs are still being investigated today. In-vitro studies ascertained the impact of chamomile extract on the viability of colon (HCT) and intestine (Caco-2) cancer cells with IC50 of 33 and 15.2 μg/ml, respectively. The viability and survival rates of cancer cell lines decreased as the concentration of chamomile extract increased, proving anti-tumor potency of chamomile that may be due to presence of sesquiterpenes. Activity of chamomile extract may refer to uvaol that affected positively conditions of colonic inflammation by suppressing macrophage infiltration and pro-inflammatory cytokine release In-vivo [58b].

Table 7: Antitumor activity of chamomile extract against intestinal and colon carcinoma cell lines.

Methanolic Extract

CaCo-2

HCT

IC50

15.2

33

fig 2

Figure 1: Antitumour activity of methanolic chamomile extract.

Another article, declared that uvaol, natural triterpene, exerted remarkable selective anticancer effect in human hepatocarcinoma HepG2 cells [59]. An increase in apoptosis rate, down regulation of the AKT/PI3K signaling pathway and reduction in Reactive Oxygen Species (ROS) level in HepG2 cells were observed. The role of uvaol on human astrocytoma line 1321N1 through maximizing rate of apoptotic process via activation of the JNK pathway [60] and stated that uvaol had effect on MCF-7 cells by decreasing reactive oxygen species and cell viability.

Another effective compound in chamomile extract is salinomycin and was cited that salinomycin fight breast cancer stem cells in mice 100 times more than anticancer drug paclitaxel. Due to its ability to targeting cancer stem cells, salinomycin is the key valuable compound in pharmaceutical company [61].

Hypolipidimic Effect of Chamomile Aqueous Extract

Aqueous extract of chamomile flowers dried powder was prepared and screened for its cholesterol lowering property in rats fed hyperlipidimic diet for eight weeks. There was a decrease in cholesterol and LDL levels in chamomile treated group comparable to hyperlipidemic group (Table 8). Increase of HDL level was observed in chamomile administered group in comparison with positive control. Non-significant difference in triglyceride level existed between negative and positive controls. Administration of chamomile didn’t alter triglyceride level. Lowering of cholesterol may be due to existence of curcuminol possessing antioxidant and hypolipidimic properties. Chamomile aqueous extract contained β-glucan considered as water soluble dietary fiber. Lowering of cholesterol level by chamomile extract may be contributed to β-glucan that formed viscous layer in small intestine [62], this layer attenuated and minimized uptake of dietary cholesterol with increased production of bile acid and reduced blood cholesterol level. According to [63], consumption of oat β-glucan lowered blood cholesterol and reduced risk of heart coronary diseases. β-glucan availability is greater when consumed in beverage other than solid matrix [64]. Also, the presence of mannan, another dietary fiber, induced hypolipidemia by modulation of gut microbiota, increasing bile acid excretion and decreasing plasma cholesterol [65].

Table 8: Effect of aqueous chamomile extract on hyperlipidemia.

Parameter

Group Time
Zero time After 4-weeks

After 8-weeks

Cholesterol

I B79.11c±1.52 B91.11b±2.04 B105.78a ± 1.24

II

A90.89c ± 3.04 A103.89b ± 1.83

A118.89a ± 1.79

III A87.56a ± 1.20 C80.89b ± 1.21

C73.00c ± 0.75

HDL

I

A40.89a ± 1.45 B26.78b ± 0.66 B28.44b ± 0.93

II

C22.56a ± 0.50

C16.44b ± 0.53

C14.56b ± 0.73

III B28.11c ± 0.86 A38.11b ± 1.03

A44.44a ± 1.47

LDL

I A42.00c ± 0.41 A44.56b ± 0.99 B48.67a ± 0.37

II

A41.56b ± 0.63 A44.33b ± 1.01

A52.33a ± 1.46

III A42.44a ± 1.14 B38.78b ± 0.55

C33.67c ± 0.53

Triglycerides

I

A186.22b ± 1.33 B181.33b ± 3.27 B211.44a ± 2.89
II B176.00c ± 2.37 B187.22b ± 2.03

B206.22a ± 1.98

III

B172.67c ± 2.13 A203.33b ± 4.00

A232.22a ± 3.17

  • Within the same column, various superscript letters indicate significant differences (Duncan, P<0.05).
  • Capital letters were used to compare three groups vertically.
  • Group I (Control group).
  • Group II (hyperlipidemic group).
  • Group III (hyperlipidemic diet and aqueous chamomile extract).

Body Weight Monitoring of Treated Groups

As shown in (Figure 2), body weight of rat group fed high fat diet and administered aqueous chamomile extract showed decreased weight gain in comparison with positive hyperlipidemic group. Our results are in accordance with [66] who stated that a reduction in weight of hypercholesterolimic rats fed glucomannan compared to control diet may be due to low daily food intake and the presence of insoluble fiber in the gastrointestinal tract.

fig 1

Figure 2: Effect of chamomile aqueous extract on rat body weight

Conclusion

This study could be concluded that Aqueous extract of chamomile flower seeds is a good nutritious source of carbohydrates, protein, crude fiber, essential and non-essential amino acids which are vital for human nutrition and maintains a good health. Chemical characterization of chamomile ascertained for the first time the presence of β-glucan and is appreciable for its lipid lowering properties. This herbal medicine acquired special interest as natural source of important phytochemicals (mannan, Glucan, flavonoids, phenols and sesquiterpines) which play important roles in scavenging the free radicals which strongly needed to fight ailments. Aqueous extract showed very high improving HDL and reducing LDL and total cholesterol profile for hypercholesteremic albino rats. Economic advantages of chamomile tea recommended to be applied in food processing and appear its vital role in therapeutic nutrition especially with hypercholesteremic, heart disease and weight control patients. Chamomile was reported to induce apoptosis in cancer cells Also, chamomile is packed with metal enzymes iron, zinc and copper which play roles in Anemia of Iron deficiency, growth and good cholesterol respectively. Further studies will be conducted to assess the bioavailability of these minerals in a trial to be supplemented as a compliment in malnutrition treatment.

Acknowledgment

This research was funded by the Regional Centre for Food and Feed (RCFF), Agriculture Research Center (ARC), Giza, Egypt and Animal House of National Research Center (NRC).

References

  1. (a) Joy PP, Thomas J, Mathew S, Skaria BP (1998) In Medicinal Plants, Bose TK. (Ed). Naya Prokash publishers India 449-632; (b) Kráľová K, Masarovičová E (2010) Plants for the future. Ecological Chemistry and Engineering 13: 1179-1207.
  2. Srivastava JK, Shankar E, Gupta S (2010) Chamomile: a herbal medicine of the past with bright future. Molecular Medicine Reports 3: 895-901. [crossref]
  3. Omid Beigi R (2000) Produce of the drug plants, 1st edn, Nashr Press 2: 424-430.
  4. Zargari A (1991) Medical plants, 5th edn vol.2, Tehran University Press 942.
  5. Kulisic T, Radonic A, Katalinic V (2004) Use of different methods for testing antioxidative of oregano essential oil. Food Chemistry 85: 633-640.
  6. Sotiropoulou NS, Megremi SF, Tarantilis P (2020) Evaluation of antioxidant activity, toxicity, and phenolic profile of aqueous extracts of chamomile (Matricaria chamomilla L) and sage (Salvia officinalis L) prepared at different temperatures. Applied Sciences 10: 2270.
  7. Al-Snafi AE (2018) Traditional uses of Iraqi medicinal plants. Journal of Pharmacy 8: 32-95.
  8. Zlabur JS, Zutic I, Radman S, Plesa M, Brncic M, et al. (2020) Effect of different green extraction methods and solvents on bioactive components of chamomile (Matricaria chamomilla L) flowers. Molecules 25: 810.
  9. Peña D, de Montes Oca N, Rojas S, Parra A, García G (2006) Anti-inflammatory and anti-diarrheic activity of Isocarpha cubana Blake. Pharmacologyon line 3: 744-749.
  10. Sebai H, Jabri M A, Souli A, Rtibi K, Selmi S, Tebourbi O, et al. (2014) Antidiarrheal and antioxidant activities of chamomile (Matricaria recutita L) decoction extract in rats. J Ethnopharmacol 152: 327-332. [crossref]
  11. Patel D, Shukla S, Gupta S (2007) Apigenin and cancer chemoprevention: progress, potential and promise. Int J Oncol 30: 233-245. [crossref]
  12. Ranpariya V, Parmar S, Sheth N, Chandrashekhar V (2011) Neuroprotective activity of Matricaria recutita against fluoride induced stress in rats. Pharm Biol 49: 696-701. [crossref]
  13. Chandrashekhar V, Halagali K, Nidavani R, Shalavadi MH, Biradar BS, et al. (2011) Anti-allergic activity of German chamomile (Matricariarecutita L) in mast cell mediated allergy model. J Ethnopharmacol 137: 336-340. [crossref]
  14. Silva N, Barbosa L, Seito L, Fernandes Junior A (2012) Antimicrobial activity and phytochemical analysis of crude extracts and essential oils from medicinal plants. Nat Prod Res 26: 1510-1514. [crossref]
  15. Gould L, Reddy CR, Gomprecht RF (1973) Cardiac effects of chamomile tea. J Clin Pharmacol 13: 475-479. [crossref]
  16. Tolouee M, Alinezhad S, Saberi R, Eslamifar A, Zad SJ, et al. (2010) Effect of Matricaria chamomilla L. flower essential oil on the growth and ultrastructure of Aspergillus niger van Tieghem. International Journal of Food Microbiology 139: 127-160. [crossref]
  17. Guimarães R, Barros L, Dueñas M, Calhelha RC, Carvalho AM, et al. (2013) Infusion and decoction of wild German chamomile: bioactivity and characterization of organic acids and phenolic compounds. Food Chemistry 136: 947-954. [crossref]
  18. McKay DL, Blumberg JB (2006) A review of the bioactive and potential health benefits of chamomile tea (Matricaria recutita L). Phytotherapy Research 20: 519-530. [crossref]
  19. AOAC (1995) Association of Official Agriculture Chemists. Official Methods of Analysis. 16th ed., Washington D.C. USA.
  20. Sara YH, Nafisa MEH, Amro BH, Mohamed ME, Elfadil EB (2008) Nutritional evaluation and physicochemical properties of processed pumpkin (Telfairia ocidentalis Hook) seed flour. Pakistan J of Nutr 7: 330-334.
  21. AOAC Association of Official Agriculture Chemists (2002) Official Methods of Analysis. 17th ed., Washington D.C. USA 1: 40-41.
  22. AOAC (2005) Association of Official Agriculture Chemists. Official Methods of Analysis. 18th ed., Washington D.C. USA.
  23. AOAC (2012) Official Method of Analysis, Association of official Analytical Chemistry. International No.994.12.chapter 4, P.9-13.19th Edition.
  24. Arvouet-Grand A, Vennat B, Pourrat A, Legret P (1994) Standardization dun extrait de propolis et identification des principaux constituants. Journal de Pharmacie de Belgique 49: 462-468. [crossref]
  25. Singleton VL, Orthofer R, Lamuela-Raventos RM (1999) Analysis of total phenols and other oxidation substrates and antioxidants by means of Folin–Ciocalteu reagent. Methods in Enzymology 299: 152-178.
  26. Gioda Alain, Maria del Rosario Prieto (1999) HISTOIRE DES SÉCHERESSES ANDINES POTOSI, EL Nrfio Er LE PETIT ÂGE GLACIAI. La Météorologie 8’ série – no 27.
  27. Obdoni BO, Ochuko PO (2002) Phytochemical studies and comparative efficacy of the crude extracts of some Homostatic plants in Edo and Delta States of Nigeria. Global J Pure Appl Sci 8b: 203-208.
  28. Moreira LRS, Filho EXF (2008) An overview of mannan structure and mannan degrading enzyme systems. Appl Microbiol Biotechnol 79: 165-178. [crossref]
  29. Pérez-Vendrell AM, Guasch J, Francesch M, Molina-Cano JL, Brufau J (1995) Determination of beta-(1-3),(1-4)-D-glucans in barley by reversed-phase. J Cromatogr A 718: 291-297. [crossref]
  30. Medina-Medrano JR, Almaraz-Abarca N, González-Elizondo MS, Uribe-Soto JN, González-Valdez LS, et al. (2015) Phenolic constituents and antioxidant properties of five wild species of Physalis (Solan aceae). Bot Stud 56: 24. [crossref]
  31. AOAC (2012) Association of Official Agriculture Chemists. Official Methods of Analysis. 17th ed., Washington D.C. USA. Chapter 4. 969.3 and 991.39 fatty acids in Oils and Fats preparation of Methyl Esters Boron Tri- Flouride- AOAC-IUPAC Method Codex- Adopted- AOAC Method 41: 19-20.
  32. Patricia MS, Migdalia M, Juan AP, Mario S, Víctor H, et al. (2013) Gas Chromatography-Mass Spectrometry Study from the Leaves Fractions Obtained of Vernonanthura patens (Kunth) H. Rob. Int J of Org Chem 3: 105-119.
  33. Lee Chang Y, Dae-OkKim, Seung Weon Jeong (2003) Antioxidant capacity of phenolic phytochemicals from various cultivars of plums. Food Chemistry 81: 321-326.
  34. Tagliazucchi D, Ahmed Helal, Elena Verzelloni, Angela Conte (2016) Bovine milk antioxidant properties: effect of in vitro digestion and identification of antioxidant compounds. Dairy Science & Technology 96: 657-676.
  35. Vichai V, Kirtikara K (2006) Sulforhodamine B. colorimetric assay for cytotoxicity screening. Nat Protoc 1: 1112-1116. [crossref]
  36. Saka WA, Akhigbe RE, Popoola OT, Oyekunle OS (2012) Changes in serum electrolytes, urea, and creatinine in Aloe vera-treated rats. Journal of Pharmacology 4: 78-81. [crossref]
  37. Sherif EA Badr, Eman S Ramis, Ola A Wahdan, Dina M Sakr, Hanan MA Elghandour (2017) Evaluation of protein quality, phytochemical characterization and the effect of soaking and roasting process on raw apricot kernels. The first international conference of Nutrition, Hurghada, the Egyptian Nutrition Society 253-287.
  38. Akhigbe RE, Azeez OM, Ige SF, Oyeyipo IP, Ajao FO, et al. (2008) Hemorheological effect of long-term administration of oral contraceptive in rats. Int J Pharmacol 4: 403-406.
  39. Walter GG, Narayanan S, Wisser H, Zawta B (2001) Samples from the patient to the laboratory: the impact of preanalytical variables on the quality of laboratory results. 2ed edition. Wiley-VCH Verlag GmbH & Co. KGaA, Weinheim.
  40. Friedewald WT, Levy RI, Fredrickson DS (1972) Estimation of the con centration of low-density lipoprotein cholesterol in plasma, without use of the preparative ultracentrifuge. Clin Chem 18: 499-450. [crossref]
  41. Levy RI (1981) Review: cholesterol, lipoproteins, approtreins and heart disease, present status and future prospects. Clin Chem 27: 653-662. [crossref]
  42. NRC (1995) National Research Council. Nutrient requirements of laboratory animals, 5th ed. Chapter 3, PP 80-102. National Academy Press, Washinngton, DC.
  43. AOAC (2005,2007) Association of Official of Analytical Chemists, Of ficial method of analysis 18th Ed., Association of Official Analytical
  44. Chemists, Arlington, VA. SPSS (2017) SPSS/PC+V.25.0, Base Manual for IBM PC/XT/AT and PS/25. Marija and Morusis, Chicago, IL, Soil Science Society of America, Inc.
  45. Suaad Abd Al-Mahdi Abd Noor (2020) Studying the Pharmaceutical; Elements and Bio-Effect of the Chamomile Plants as a Medicinal Plant. Systematic Review Pharmacy 11: 733-741.
  46. World Health Organization (WHO) monographs on selected medicinal plants (Volume 1). Geneva, 1999.
  47. Maniyan A, John R, Mathew A (2015) Evaluation of Fruit Peels for Some Selected Nutritional and Anti-Nutritional Factors. Emer Life Sci Res 1: 13-19.
  48. Aboul-Enein AM, Salama ZA, Gaafar AA, Aly HF, Abou-Elella FA, et al. (2016) Identification of phenolic compounds from banana peel (Musaparadaisica L) as antioxidant and antimicrobial agents. J Chem Pharm Res 8: 46-55.
  49. Suttirak W, Manurakchinakorn S (2014) In vitro antioxidant properties of mangosteen peel extract. J Food Sci Technol 51: 3546-3558. [crossref]
  50. a) Wu SJ, Tsai JY, Chang SP, Lin DL, Wang SS, et al. (2006) Super critical carbon dioxide extract exhibits enhanced antioxidant and anti-inflammatory activities of Physalis peruviana. J Ethnopharmacol 108: 407-413. [crossref] b) Cai YZ, Luo Q, Sun M Corke H (2004) Antioxidant activity and phenolic compounds of 112 Chinese medicinal plants associated with anticancer. Life Sci 74: 2157-2184. [crossref]
  51. a) Soobrattee M, Neergheen VS, Luximon-Ramma A, Aruoma OI, Bahorum T (2005) Phenolics as potential antioxidant therapeutic agents: Mechanism and actions. Mut Res 579: 200-213. [crossref] b) Eken A, Ünlü-Endirlik B, Baldemir A, İlgün S, Soykut B. (2016) Antioxidant capacity and metal content of Physalis peruviana L. fruit sold in markets. J Clin Anal Med 7: 291-294.
  52. Lim YY, Quah EPL (2007) Antioxidant properties of diferent cultivars of Portu laca oleracea. Food Chem 103: 734-740.
  53. Formisano C, Delfine S, Oliviero F, Tenore GC, Rigano D, et al. (2015) Correlation among environmental factors, chemical composition and antioxidative properties of essential oil and extracts of chamomile (Matricaria chamomilla L) collected in Molise (south-central Italy). Industrial Crops and Products 63: 256-263.
  54. Kim HJ, Chen F, Wu C, Wang X, Jin Z (2004) Evaluation of antioxidant activity of Australian tea tree oil and its components. J Agric Food Chem 52: 2849-2854. [crossref]
  55. Tisserand R, Young R (2014) Essential Oil Safety, 2nd ed.; Elsevier: Edinburgh, UK.
  56. Sawamura M, Sun SH, Ozaki K, Ishikawa J, Ukeda H (1999) Inhibitory effects of Citrus essential oils and their components on the formation of N-nitrosodimethylamine. J Agric Food Chem 47: 4868-4872. [crossref]
  57. Gunawan IWG, Bawa-Putra AA, Widihati IAG (2016) The response to oxidative stress humulene Hibiscus L. leaf on the activity of 8-OHdG levels pancreatic β- cells in diabetic rats. Biomedical and Pharmacology 9: 433-441.
  58. a) Kurt BZ, Gazioglu I, Sevgi E, Sonmez F (2018) Anticholinesterase, antioxidant, antiaflatoxigenic activities of ten edible wild plants from Ordu area, Turkey. Iranian Journal of Pharmaceutical Research 17: 1047-1056. [crossref]. b) Shi-yun Du, Hei-feng Huang, Xian qian Li, Hai-tao Xiao (2020) Anti-inflammation properties of uvaol on DSS-induced colitis and LPS-stimulated macrophages. Chin Med 15: 43.
  59. Bonel-perez, Gloria C, perez-jimenez, Amalia, Rufino-Palomares Eva E, Gris-Cardenas Isabel, et al. (2020) Antiproliferative and pro-apoptotic effect of uvaol in human hepatocarcinoma HepG2 cells by affecting G0/G1 cell cycle arrest, ROS production and AKT/PI3K signaling pathway. Molecules 25: 4254. [crossref]
  60. Allouche Y, Warieta F, Campos M, Beltran G, Gaforio JJ (2011) Antioxidant, antiproliferative and pro-apoptotic capacities of pentacyclic triterpenes on MCF-7 human breast cancer cells and their effects on DNA damage. J Agric Food Chem 59: 121-130. [crossref]
  61. Gupta P, Onder Tamer T, Jiang Guozhi, Lander, Eric S (2009) Identification of selection inhibitors of cancer stem cells by throughout screening Cell 138: 645-659. [crossref]
  62. Rondanelli M, Oppizzi A (2009) The biological activity of beta glucan. Minerva Med 100: 237-245. [crossref]
  63. EFSA (2010) Scientific opinion on the substantiation of a healthy claim related to oat Betaglucan and lowering blood cholesterol. EFSA Journal 8: 1885.
  64. Queenan KM, Stewart ML, Smith KN, Thomas W, Fulcher RG, et al. (2007) Concentrated oat beta glucan lowers cholesterol in a randomized controlled trial. Nutr J 6: 6. [crossref]
  65. Lisa H, Saeed K and Vaneesa VH (2018) Dietary mannan oligosaccharide modulates gut microbiota, and decrease cholesterol and atherosclerosis development. Mol Nutr Food Res 62: 1700942. [crossref]
  66. Gallaher CM, Munion J, Hesslink R, Wise J, Gallaher DD (2000) Cholesterol reduction by glucomannan and chitosan in rats. J Nutr 130: 2753-2759. [crossref]

Impact of Planned Teaching Program on Staff Nurses Regarding Prevention of Urinary Tract Infection

DOI: 10.31038/IJNM.2021233

Abstract

Introduction: Application of indwelling catheter can` lead to complications. Most commonly catheter is associated with urinary tract infections. Duration of catheterization is the major risk factor. The present study was conducted with aim to evaluate the effectiveness of planned teaching program in terms of knowledge of staff nurses regarding prevention of urinary tract infection in patients with indwelling catheter.

Methodology: Quantitative research approach and quasi-experimental design with one group pre-test and post-test were adopted for the study. The study was carried out among 60 staff nurses at B.M.C.H.R.C., Hospital, Jaipur.

Results: The findings highlighted that during pre-test, majority of the nurses (83%) having average knowledge while after implementation of PTP, most of the nurses (86%) have good level of knowledge regarding prevention of UTI. Pre-test knowledge score was 13.50 ± 3.735 and posttest knowledge score was 23.32 ± 4.446. The obtained value (11.742) was higher than the tabulated value (1.97), which indicates that intervention was significant at 0.05 level of significance.

Conclusion: Pre-test findings showed that knowledge of nurses regarding prevention of UTI was average. While, the administration of Plan teaching program helped the staff nurses to understand more regarding prevention of UTI infection.

Keywords

Effectiveness, Planned teaching program, Knowledge, Staff nurses, Prevention of UTI

Introduction

Understanding the different classifications of UTIs is necessary when considering their epidemiology. Broadly, UTIs are classified based on their location in the urinary tract, the presence of relevant complicating factors, and the presence or absence of symptoms [1]. A urinary tract infection (UTI) is a bacterial infection that affects any part of the urinary tract. The main etiologic agent is Escherichia coli. Although urine contains a variety of fluids, salts, and waste products, it does not usually have bacteria in it. When bacteria gets into the bladder or kidney and multiply in the urine, they may cause a UTI [2]. Bladder infections are most common in young women with 10% of women getting an infection yearly and 60% having an infection at some point in their life. Pyelonephritis occurs between 18-29 times less frequently [3]. Urinary tract infection are most common nosocomial infection. Responsible for 20-30% of nosocomial infection in medical or surgical intensive care unit. The overall incidence density of ICU nosocomial UTI as high 32%, 17% those in medical ward or 9% in rehabilitation unit, 7% in nursing home. catheter acquired UTI is one of the most common health care acquired infection 70-80% of these infection are attributable to use of an indwelling urethral catheter [4]. One of the most common types of hospital-acquired infection is urinary tract infection (UTI), accounting for more than 40% of all nosocomial infections. Virtually, all health-care-associated UTIs (CAUTIs) are caused by instrumentation of the urinary tract. CAUTI has been associated with increased morbidity, mortality, hospital stay, and treatment cost. The daily risk of bacteriuria with catheterization is 3-10% [5]. Globally UTI is most common female infection accounting for an estimated 1.4 million cases each year with more than half of the 4.5 lakh UTI death occurring in low- and middle-income countries. UTI account 40% of all hospital acquired infection [6]. Use of indwelling catheter can lead to complications. Most commonly catheter is associated with urinary tract infections. Duration of catheterization is the major risk factor. These infections can result in sepsis, prolonged hospitalization, additional hospital costs and mortality [7]. Prevention starts with the health care provider, except in special circumstances, all urinary catheters should place in a sterile way. Insertion of non-sterile catheter or using a non-sterile technique is much more likely to result in a urinary tract infection.

Methodology

In the present study, quantitative research approach was adopted to conduct the study. Quasi-experimental design with one group pre-test and post-test was selected for the research work. The study was carried out among 60 staff nurses at B.M.C.H.R.C., Hospital, Jaipur. After obtaining permission from concerned authority the pilot study was conducted from 01-07-2017 to 07-07-2017 at B.M.C.H.R.C. Jaipur. The samples choose were similar to population under study. The investigator used purposive sampling technique to select the samples from the total population. Structured knowledge questionnaire was developed for the study to collect the data from staff nurses to assess their knowledge regarding hand hygiene for prevention of infection in cancer patients. There were 30 questions in the questionnaire. A pre-test was conducted by administering questionnaire then it was followed by administering Plan Teaching Program on prevention of UTI. The pre-test was administered for each staff nurses. On the 7th day a post test was administered by using the same tool which was used in pre-test.

Results

As per Table 1, in gender wise distribution the majority (71.66%) of the sample were female. In age wise distribution the majority (38.10%) of sample belongs to the age group 31-40 years. Information acquired wise distribution reveals that most of sample (33.33%) had knowledge during professional qualification. Formal education wise majority (40.00%) of samples qualification was Post Basic B.Sc. Nursing. In working experience wise distribution, the majority (35%) having age group 1-3 years experience. Infrequency of UTI patient in the ward wise the majority (41.66%) belongs to ICU ward. One third of the participants have previous knowledge due to professional qualification. Table 2 revealed that the findings of the study reveal that during pre-test majority 15.00% knowledge is poor, 83% of samples having average knowledge regarding prevention of UTI. During post-test majority 86% of staff nurses knowledge level is good. Only 14% of staff nurses have average knowledge. According to Table 3, Pre-test knowledge score was 13.50 ± 3.735 and posttest knowledge score was 23.32 ± 4.446. The obtained value (11.742) was higher than the tabulated value (1.97), which indicates that intervention was significant at .05 level of significance. As per date presented in Table 4, revealed that there is a not significant association between the knowledge of the prevention of UTI with their Age, gender, professional qualifications, years of experience and working area, as the calculated Chi-square value was less than the tabulated value. While Previous source of knowledge was significantly associated with UTI knowledge, as the calculated Chi-square value 7.98 was greater than the tabulated value 7.81 at p>0.05 (Tables 1-4).

Table 1: Frequency and percentage distribution of demographic variables, n=60.

table 1

Table 2: Distribution of frequency and percentage of levels of knowledge regarding prevention of UTI, n=60.

table 2

Table 3: Compression of pre and post group on knowledge regarding prevention of UTI, n=60.

table 3

(0.05 level of significance)

Table 4: Association between demographic variables and level of knowledge regarding prevention of UTI, n=60.

table 4

(0.05 level of significance)

Discussion

The insertion of an indwelling urethral urinary catheter is an invasive procedure that is commonly undertaken in healthcare settings7. However, there are several risks and potential complications associated with these devices, so their use should be avoided where possible. It is important that nurses are equipped with the necessary knowledge and skills not only to assess if a patient requires a catheter, but also to minimize the risk of associated complications and to understand how these can be managed. The present study was conducted with aim to evaluate the effectiveness of planned teaching program in terms of knowledge and practice of staff nurses regarding prevention of urinary tract infection in clients with indwelling catheter. The finding of the study reveals that during pre-test, majority of the nurses (83%) having average knowledge while after implementation of PTP, most of the nurses (86%) have good level of knowledge regarding prevention of UTI. In this context, Purbia Vijay et al (2014) stated that in pre-test out of 90 respondents only 26 respondents (28.88%) belongs to adequate knowledge regarding prevention of urinary tract infection among patient with indwelling catheter. In post-test 60 (66.66%) respondents belongs to moderate knowledge and 30(33.33 %) respondents belongs to adequate knowledge [8]. In another study, Ranjita Jena et al (2020) stated that most of the nurses (61.2%) average knowledge towards prevention of UTI among patients with an indwelling catheter [9]. In this contrast, present study explored that 62.1% nurses had average knowledge towards prevention of UTI. Jicy Shahji indicated that the staff nurses knowledge on catheter associated urinary tract infections was not adequate [10]. In different study, Atul Sharma et al revealed that the mean post-test knowledge score (21.53) was higher than the mean pre-test score (11.13). Similarly in our study, pre-test knowledge score was 13.50 ± 3.735 and posttest knowledge score was 23.32 ± 4.446 [11]. Additionally, in our study the obtained t-test value (11.742) was higher than the tabulated t-test value (1.97), which indicates that the intervention was significantly effective at .05 level of significance. In this support, Purbia Vijay et al highlighted that mean score of post-test knowledge 21.53 was apparently higher than the mean score of pre-test knowledge 13.51, suggesting that the planned teaching program was effective in increasing the knowledge of the staff nurses regarding prevention of urinary tract infection among patients with indwelling catheter [8]. In another study, Atul Sharma et al highlighted that the mean difference pre-test score (8.02) of knowledge of significant at 0.05% level at the “t”=17.06. p value 0.05. This indicates the planned teaching program was effective in increasing the knowledge of staff nurses on the prevention of UTIs among patient with an indwelling catheter [11]. This finding was in support of our research finding. Furthermore, Jicy Shahji also communicated that structured teaching program on catheter associated urinary tract infections was significantly effective to increase the knowledge the knowledge of the staff nurses [10]. In context to association, the present study revealed that there was no significant association between the levels of knowledge of the prevention of UTI with their Age, gender, professional qualifications, years of experience and working area. While Previous source of knowledge was significantly associated with UTI knowledge, as the calculated Chi-square value 7.98 was greater than the tabulated value 7.81 at p>0.05. There was no study available to compare the current findings. The intervention was effective to enhance the knowledge of nurses regarding prevention of UTI infection.

Conclusion

The present study concluded that the Pre-test findings showed that knowledge of nurses regarding prevention of UTI was average. While, the administration of Plan teaching program helped the staff nurses to understand more regarding prevention of UTI infection. Most of staff nurses were having good knowledge after administration of Plan teaching program. The Plan teaching program is proved to be very effective method of enhance knowledge.

References

  1. Medina M, Castillo-Pino E (2019) An introduction to the epidemiology and burden of urinary tract infections. Ther Adv Urol 11. [crossref]
  2. Flores-Mireles AL, Walker JN, Caparon M, Hultgren SJ (2015) Urinary tract infections: epidemiology, mechanisms of infection and treatment options. Nat Rev Microbiol 13: 269-284.
  3. Minardi D, d’Anzeo G, Cantoro D, Conti A, Muzzonigro G (2011) Urinary tract infections in women: etiology and treatment options. Int J Gen Med 4: 333-343. [crossref]
  4. Dasgupta S, Das S, Chawan NS, Hazra A (2015) Nosocomial infections in the intensive care unit: Incidence, risk factors, outcome and associated pathogens in a public tertiary teaching hospital of Eastern India. Indian J Crit Care Med 19: 14-20. [crossref]
  5. Mudgal SK (2018) Assess the Effectiveness of Educational Program on Practice Regarding Indwelling Catheter Care among Staff Nurses at Selected Hospitals in Udaipur. Int J Nurs Med Invest 3: 89-91.
  6. Foxman B (2002) Epidemiology of urinary tract infections: incidence, morbidity, and economic costs. Am J Med 113 Suppl 1A: 5S-13S. [crossref]
  7. Nicolle LE (2014) Catheter associated urinary tract infections. Antimicrob Resist Infect Control 3.
  8. Purbia V, Himanshu V, Maneesh KS, Devashri R (2014) A study to assess the effectiveness of planned teaching programme on knowledge of staff nurses regarding prevention of urinary tract infection among patients with indwelling catheter. Int J Sci Res Pub 4: 1-5.
  9. Ranjita Jena, Uma Mandal, Gurmanpreet Kaur, Suranjakhi Dash, Tiyasha Das (2020) Knowledge and practice of staff nurses on prevention of UTI among patients with an indwelling catheter in selected hospital Bhubaneswar. European J Mole Clin Med 7: 5070-5080.
  10. Jicy Shahji (2016) A Study to Assess the Effectiveness of Structured Teaching Programme (STP) on Knowledge and Practice Regarding Indwelling Catheter Associated Urinary Tract Infection Among the Staff Nurses at J.K. Hospital And Research Center, Bhopal (M.P.). Int J Emerg Trauma Nurs 1: 5-16.
  11. Atul Sharma Jitendra Sharma, Dinesh Kumar Sharma (2018) Effectiveness of planned teaching programme on knowledge regarding prevention of urinary tract infection in patients with indwelling catheter. Inno J Nur Health 4: 89-94.
Featured Image2

Phosphorus Outsourcing to Lake Kinneret (Israel) is Significantly Affected by Climate Conditions

DOI: 10.31038/GEMS.2021342


Long-term records [1-4] in the drainage basin of Lake Kinneret has indicated that since the mid-1980`s, significant changes in climate conditions have occurred, and trends of dryness in the Kinneret drainage basin have been documented, including a temperature increase and precipitation decline. The precipitation decline and consequently the reduction in river discharge resulted in a decrease in TP flux into Lake Kinneret. The known external TP sources are natural bedrock erosion, dust deposition, and anthropogenic intervention in the drainage basin, as well as soil degradation and agricultural-eco-tourism developments within the Hula Valley. Among internal sourcing of Phosphorus in Lake Knneret, reductive conditions and microbial activity in the anoxic hypolimnion sediments are significant during the 8th month of stratification period. The major contribution within the external TP inputs is due to the erosive action which is dependent on river discharge. The TP concentrations in the Jordan River were found to be significantly related to the discharge ranges. The river discharge has been a consequence of climate conditions, of precipitation. During the 1950`s the Hula natural wetlands and old Lake Hula (part of the Kinneret drainage basin) was drained and the land was converted to agricultural development and consequently the ecological features of the Hula Valley were modified. Nutrient fluxes downstream into lake Kinneret were predicted. The significance enhancement of the impact of precipitation and discharge fluctuations on TP outsourcing through erosive action was documented: higher and lower discharge enhances and reduces TP load, respectively. The total TP flushing range from the Hula Valley peat soil through the subterranean channels where TP is migrated are not precisely known but probably Lake Kinneret as collectors of those is excluded. Long-term records of TP concentrations in headwaters and potential resources in the Hula Valley confirmed the significant influence of climate conditions on the outsourcing of TP. The impacts of agricultural development, external fertilizer loads and migratory cranes in the winter (50,000 during 5 months) are probably insignificant. As a result of the old lake Hula and wetland drainage, the unique natural composition of exceptionally diverse fauna and flora was devastated. The newly created arable land became a source of income to the residents of northern Israel. For 40 years, it was successfully cultivated, agricultural products (mostly cotton, corn, alfalfa, and vegetables) were economically produced, and nutrient flux into Lake Kinneret did not threaten the lake’s water quality. Nevertheless, as a result of inappropriate management, enhancement of dust storms devastating fresh sprout-germinates and blocking of drainage canals, irrigation methods were not appropriate for optimal soil moisture management, soil fertility decreased and Ground Water Table (GWT) was lowered. The soil structure of the upper layer became oxidized and deteriorated, heavy dust storms became frequent, and the soil surface subsided (7-10 cm/year). Underground fires occurred often. increased rodent population outbreaks which caused severe damage to agricultural crops and to the stability of drainage canal banks. Moreover, agricultural cultivation of 8% in the middle of Hula Valley land was gradually abandoned. Therefore, during 1990-1997, the entire drainage area underwent a reclamation project, Hula Reclamation Project (HRP). The project was aimed primarily at decreasing the nutrient fluxes from the Hula Valley soil while implementing modern irrigation methods and innovation of economical land use accompanied by integrate eco-tourism. The HRP comprised several operational stages: increasing the soil moisture by elevating the GWT, changing the irrigation method, renewing the drainage system in the entire valley, and creating a new shallow lake namely ‘Agmon-Hula’. This shallow lake was designed to be a collector for the entire valley and to provide an appropriate service for eco-tourism. A plastic sheet (4-mm thickness) was placed vertically (0-4.5 m) along 2.8 km, crossing the valley in an east-west position, to partition the southern part of the valley aimed at prevention of underground leakage of pollutants into Lake Kinneret. Lake Agmon was proposed to support sufficient volume for the collection of peat soil-drained-nutrient-rich water effluent and was also mixed with fresh Jordan River water to prevent deterioration of water quality. Nutrient-rich polluted water from Lake Agmon-Hula was transferred for irrigation usage outside the Kinneret drainage basin. Natural attractions (migratory Cranes) were designed for observational touring of the aquatic vegetation landscape, bird watching and sport fishing recreation. The original design was successfully implemented, and crane wintering provided an attractive experience for tourists.

Conclusive Remarks

The Kinneret region has undergone changes in climate conditions, prominently dryness. These changes enhanced processes of decline in rainfall-river discharge, and were accompanied by changes in nutrient dynamics and decreases in input concentrations. These modifications in nutrient dynamics were not likely to have been affected by the presence of Cranes in the Hula Valley. The seasonal changes in TP concentration of the Agmon-Hula effluent are due to the onset and offset of submerged macrophytes. The fate of prominent part of the movable phosphorus produced in the Hula Valley ecosystem is unclear. Phosphorus input into Lake Kinneret through river discharge is affected primarily by climate change. The concentration and consequently total load of phosphorus in the outflow of Lake Agmon-Hula by is significantly affected by submerged macrophytes and, to a lesser extent by cranes.

References

  1. Gophen M, Levanon D (eds) (1993-2006) Hula Project, Annual Reports: Migal-Sientific Research Institute, Jewish National Fund (Keren Kayemet LeIsrael), US Forestry Service International Project, Israeli Water Authority.
  2. Gonen E (ed) (2007) Hula Project Annual Report, Jewish National Fund (Keren Kayemet LeIsrael) Migal-Scientific Research Institute and Israeli Water Authority, pg: 133.
  3. Barnea I (ed) (2008) Hula Project Annual Report, Jewish National Fund (Keren Kayemet LeIsrael) Migal-Scientific Research Institute and Israeli Water Authority pg: 159.
  4. Barnea I (ed) (2008-2018) Hula Project Annual Report, Jewish National Fund (Keren Kayemet LeIsrael) Migal-Scientific Research Institute and Israeli Water Authority pg: 232.
fig 1

Bee Pollen Production, Physicochemical and Bio-functional Properties, and Safety Utilization: A Review

DOI: 10.31038/NRFSJ.2021415

Abstract

Pollen is a fine to coarse astonishing natural product that plays a critical role in plant reproduction. Pollen is collected when the worker bees visiting flower’s blossom and their bodies touch the stamen. Pollen is collected with a pollen trap, made out of a grid, and placed on the entrance of the beehive. Beebread is bee collected pollen that stored in the honey combs and it is fermented and naturally preserved. The quality of the pollen is influenced by the harvesting techniques, technologies used, and post-harvest handling, drying and storage situations. Properly dried bee collected pollen that stored in a cool, dry and dark place keeps its sensory and microbiological quality for a storage period of two years.

Bee collected pollen is very rich in protein, fatty-acids, free sugars, carbohydrates, and it contains trace amounts of minerals, phenolic acids, flavonoids and vitamins. Pollen can be regarded as a promising therapeutic and natural food supplement. Bee collected pollen is defined as a valuable food however, due to the small quantities that are required and consumed it should be rather regarded as a supplement functional food. Its functional biological property is due to the high content of flavonoids, polyphenols and considerable radical scavenging capacity. As a functional food pollen can strengthen immunity and help the body to fight bacteria, and make the body to perform a quality tissue repair. Recently, due to the increased awareness of consumers the consumption of functional foods can improve their health and pollen began to be considered as a functional food ingredient. Pollen as bee hive product is not a widely commercialized product in Ethiopia. Having diversified natural vegetation cover that are used as a pollen source, there is a large untapped potential to produce this valuable products and then promoting and supporting pollen production and commercialization shall be the priority area of intervention in Ethiopia. The purpose of this review work is to understand and summarize the current knowledge on nutritional, bio-functional and health benefits of bee collected pollen and to set conclusion and recommendations. The review work is conducted through methods of setting the outline, reading and understanding the current articles, summarizing the relevant information’s and finally set conclusion and point out recommendations.

Keywords

Flavonoids, Pollen, Beebread, Antioxident, Bioavailability, Fermentation, Pelle

Introduction

Background

Pollen is a fine to coarse powdery substance that encompasses pollen grains. Pollen grains are highly dynamic micro-scale structures with a hard coat that protects the gametophytes during the process of their movement from the stamens to the pistil of flowering plants [1]. According to pollen is an astonishing natural material that plays a critical role in plant reproduction and transfers viable cellular material between different reproductive parts of plants [2,3]. Pollen is collected when the worker bees visiting flower’s blossom and their bodies touch the stamen. Bees can use the pollen for the feeding and development of the bee brood. According to pollen contains high protein that is necessary for the nourishment of honey bee broods inside the beehives [4]. Moreover, it is also the source of nutritional and mineral substances for royal jelly produced by worker bees. The average amount of pollen that a bee colony needs is estimated at 13.4 to 17.8 kg per year. Sufficient amount of pollen is important for colony maintenance and to increase production and productivity [5].

The pollen is compress into the pollen basket by using their hind legs. The bees moistens the pollen with secretion from its mouth which helps the pollen stick together and to the basket hairs. The bees enrich the pollen with their own substances and made a pollen pellets. The secretion from the bees contains different enzymes like. Amylase and Catalase. A pollen load contains up to 10 percent nectar, which is necessary for packing [6].

According to bee collected pollen is the main source of nutrients to the development of bee colonies [7,8]. Pollen is a very important factor for the development of the bee brood and supplies the necessary foods like proteins, lipids and minerals [7]. Moreover, bee pollen has gained increasing attention for its antioxidant capacity and has been used as food supplement and additives contributing on the health benefits of human [9]. On this understanding the Egyptians describe the pollen as a life-giving dust.

Pollen production allows beekeepers to diversify their sources of revenue, mitigating the effects of fluctuations in honey price and enabling beekeepers to diversify their products (Shelley et al., 2018). Pollen is collected with a pollen trap, made out of a grid, placed on the entrance of the hive. Based on the floral variety, pollen composed a complex chemical composition and bioactive compounds. According to bee collected pollen is the main source of protein and provides with essential amino acids that are important for brood rearing and queen feeding [10,11]. Bees can collect, conserve and store pollen in the hexagonal cell of the honey comb and mixing it with nectar and glandular secretions and transform into a product known as “bee-bread”. It is a partially fermented pollen mixture that stored in the honey combs. Based on the study of bee pollen that stored in the honey comb can undergo transformation processes [12]. The transformation process can use to prolong the shelf life of the beebread and to improve the nutritional and functional properties. The biochemical transformation process is mediated by lactic acid bacteria and made a beebread [13]. The composition and nutritional value of the bee bread is different than pollen pellets. Compared to bee-pollen, bee-bread may be better tolerated by the human digestions [14].

According to the study of they characterized the bee bread as a higher nutritional value than pollen and better digestibility and richer in chemical compositions [15]. Moreover, since the components of bee bread are partially fermented it is better absorbed by the human body than pollen and is more easily assimilated [13]. On the hand the presence of high lactic-acid levels in beebread can affect storage and being a food with a short shelf life [16].

Pollen is collected when the bees pass through the openings of pollen traps on the entrance of beehives. The pollen pellets are removed and subjected to further processing and drying processes for prolonging the shelf-life. The color of pollen loads is sometimes variable and reflects the diversity of plant species that the pollen is collected [17]. According to bee collected pollen and bee bread have a high nutritional value and include bioactive compounds and regarded as functional foods [18]. The significant number of bioactive compounds, carbohydrates, enzymes, vitamins, fatty acids, essential amino acids or carotenoids depends on the botanical and geographical origin. Bee collected pollen can be regarded as a promising therapeutic and natural food supplement. Its functional biological property is due to the high content of flavonoids, polyphenols and considerable radical scavenging capacity

Objectives

General Objectives

The objectives of this review work is to understand and summarize the current knowledge, the source, production and post-harvest process, nutritional and functional benefits of bee collected pollen and to summarize the present research information’s.

Specific Objectives

The Specific objective of this paper were to review

  • On the current production of bee pollen.
  • On physicochemical properties of bee pollen.
  • On bio-functional properties and health benefits of bee pollen
  • On proper utilization and handling practices of bee pollen

Literature Review

Bee Pollen Production and Harvesting

Production

Foraging bees visit different plant species to collect pollen and nectar and bring back to the beehives. According to the bees can carry the pollen by their hind legs as pollen pellets and store in the cell of honey combs [19]. During this process, the bees mix the pollen with nectar and salivary secretions and become the “bee bread,” The beebread is representing a main food reserve for the development of beehive colony [20]. The quality of the pollen is influenced by the harvesting techniques, technologies used, and post-harvest handling, drying and storage situations. The humidity in pollen is an ideal culture medium for micro-organisms like bacteria and yeast. To preserve and to control the spoilage of pollen daily harvest and immediate placement in a freezer is fundamentally important to maximum the quality of pollen. Moreover, fresh bee pollen should be kept in an airtight container and should not clump together (Figures 1-6) [21].

fig 1

Figure 1: Bee collecting the pollen and pollen dusts on the body of the bees [62]. Source: Bogdanov (2016).

fig 2

Figure 2: Bee Bread in honey comb.

fig 3

Figure 3: Pollen produced from EMDIDI demonstration site (2020).

fig 4

Figure 4: (a) Pollen tray fixed on the beehive (b) Harvested pollen with pollen trap.

fig 5

Figure 5: Dried pollen pellets. Source: Bogdanov (2016).

fig 6

Figure 6: Commercially processed and packed pollen.

According to pollen collection has received relatively little attention when compared to honey, royal jelly, and propolis [14,21]. However, bee-collected pollen is an important source of essential amino acids, antioxidants, flavonoids minerals, vitamins, and lipids [22]. Beekeepers can fix the pollen traps in the hive entrance through which the worker bees cannot pass easily with both legs carrying pollen pellet so they are forced to drop them onto trays. The collected pollen is periodically removed from the trapping trays [23]. The pollen pellets are removed and subjected to further processing and drying processes for prolonging the shelf-life. Currently, there are only few countries like, (Spain, China, Hungary, Argentina and Brazil) where commercially produce pollen with significant contribution on national economically. Countries such as Brazil, Argentina, Switzerland, Spain and Mexico have established official quality standards and recognized pollen as a food product.

Based on the study of beebread is produced from the pollen [13]. The bees are adding honey and enzymes and transform the bee pollen to beebread. Pollen transformation in beebread occurs as a result of successive interventions of different enzymes, and some species of microorganisms, that are naturally present in pollen. According to during the fermentation process, the wall of the pollen is disrupted and makes the beebread has a better bioavailability than pollen pellets [12]. Comparatively with the pellets of bee pollen, beebread is better tolerated by the human organism and has a lower pH (3.8-4.3) [4].

Ethiopia has a huge potential to produce beehive products because of its endowment with diversity bee flora vegetation resources and climate. According to Gemechis (2014), more than 400 plant species are already identified as major bee flora plants that the bees can collect pollen and nectar. A sample of bee pollen was collected from the demonstration site of Ethiopia meat and dairy industry development institute.

According to the pollen is removed and collected from the bees by pollen traps before the bees enter in the hives [24]. Depending on, ease of cleaning, installation and harvesting there are different designs of pollen traps. Pollen should be collected daily in humid climates but less frequently in drier climates. According to avoid deterioration of the pollen and growth of bacteria, moulds and insect larvae, pollen should be air dried immediate after harvest [25]. Bees can collect about 15 to 40 kg of pollen per year [26]. Foraging bees carry the pollen to the hive in the form of pollen loads. Global production of the pollen is around 1500 tons per year. Depending on the pollen source plant species, the pollen grains differ in shape, color, size, and weight. The color of pollen varies, ranging from bright yellow to black.

Harvesting

Bee pollen is collected by beekeepers with the use of pollen traps, devices that fit over the entrance to a hive and contain openings just big enough for a returning forager to squeeze through [27]. In the process of squeezing through the opening in the trap, the pollen carried on the hind legs of the bee are knocked off and falls through a screen into a drawer where it is collected by the beekeeper. Pollen is collected when the bees pass through the openings of pollen traps on the entrance of beehives. The pollen stuck to the bodies of the bees falls on the trapping tray. Human intervention starts at this stage that collect, preserve, sort, purify, dry, pack and marketing for human consumption [25].

To prevent additional contamination and bacterial replication, frequent collection of pollen from pollen traps and can be need immediate air drying, processing and preservation [25].

Handling and Processing

Drying and Processing. Fresh pollen typically contains 10- 12 percent water, while the moisture content of dried pollen is around 4 percent. According to Anderson et al., drying the pollen in the sun may decrease the potency of pollen by as much as 50 percent due to oxidation of natural antioxidants in the pollen [10]. As a result, the best way to preserve pollen once it is collected is to freeze it immediately after harvest. According to some international standards of bee pollen, the maximum drying temperature is 42°C, and water content is about 6 percent [25]. As per current Bulgarian norms, the fresh pollen, collected from apiaries, should be dried at temperatures up to 45°C and should have residual water content not higher than 12 percent.

The color of pollen loads is sometimes variable and reflects the diversity of plant species that. the pollen is collected [17]. The color is usually in various shades of yellow, gray-white, orange, reddish, greenish and blue. Depending of the plant species pollen grains differ in shape, color, size, and weight. The color identification of bee collected pollen pellets showed an evident variability of the botanical origin.

Preservation and Storage. Based on the data of available literature Parvanov and Dinkov (2017), the more specific requirements to the processing, storage and labeling of bee pollen as a food product are proposed with regard to food safety. Moreover, preservation of its natural physical, chemical and organoleptique characteristics can be fundamentally important aspects of pollen quality. Experience in Switzerland showed that from a microbiological and sensory point of view pollen remains stable until 1.5 years of storage at room temperature. On the other hand, according to pollen that stored in a cool, dry and dark place keeps its sensory and microbiological quality for a storage period of 2 years [28]. Besides, freezing the pollen at -20°C in pure nitrogen can preserve its highest biological activities.

Beebread is a product of the hive obtained from pollen collected by bees, the bees add honey, digestive enzymes and then carried in the hive and preserved in the honey combs. According to the study of Adriana et al., and Denisow, beebread is the fermented and naturally preserved pollen that gathered by bees and mixed with its own digestive enzymes [20,28]. According to there is a significant antioxidant activity in beebread and a significant correlation between the biological activity and its botanical origin [29]. As functional food pollen is one of the main health enhancing properties, it is due to its strong antioxidant activity. However, pollen can lose a considerable amount of its antioxidant activity (about 59%) after one year duration. This loss might be due to the decrease of phenolic compounds.

Nutritional and Functional Benefits

Nutritional Importance and Quality Aspects of Pollen

Pollen could be considered as valuable food due to its nutritional compounds like (high amounts of lipids, proteins, carbohydrates) and minerals like (Ca, Mg, Fe, Zn, Cu). Moreover, bee collected pollen is very rich in protein, fatty-acids, free sugars, carbohydrates, and it contains trace amounts of minerals, phenolic acids, flavonoids and a range of vitamins [30,31]. According to bee collected pollen and bee bread have a high nutritional value and include bioactive compounds and regarded as functional foods [18]. Moreover, pollen is rich in proteins, simple sugars, essential amino acids and omega fatty acids. According to Leila, bee pollen extract is used as beef burger fortification and also has a great inhibitory effect on lipid oxidation in beef burger [32]. It is proposed as alternative raw material to substitute a synthetic antioxidant in beef burger production. The combination of antioxidant properties with nutritive value and health-promoting effects of bee pollen suggests its potential application as food ingredient in meat products. Consequently, the need to strengthen the beekeeping productive chain, particularly in aspects related to innovation and new product development.

Current literature Adriana et al., suggests that beebread is a good source of Polyunsaturated Fatty Acids (PUFAs) that are crucial for human nutrition [28]. Beebread helps to regulate the lipid metabolism and exerts a positive effect on the immune system of patients suffering from chronic arthritis. Due to its rich biochemical and physicochemical composition bee pollen is preferred as a natural food supplement [33]. Bee pollen is considered an increasingly popular food supplement. Pollen consumption and marketing has recently developed. However, according to Fuenmayor et al., bee collected pollen is practically unrecognized as a food product for a long time [19]. On the other hand, chemical composition and physical parameters of bee collected pollen are primarily influenced by its floral source and geographical origin. At present there are only few countries like (Spain, China, Hungary, Argentina and Brazil) where commercially produce pollen. Moreover, countries such as Brazil, Argentina, Switzerland, Spain and Mexico have established official quality standards and recognized pollen as a food product [34].

According to there are only a few countries have established microbiological criteria for dried pollen [35]. Moreover, Switzerland, Argentina, and Brazil are the first countries that implemented official quality regulations. However, there is no specific international agreement regarding the quality of bee collected pollen (DeMelo et al., 2015). Moreover, to keep the beneficial dietary and therapeutic properties of pollen, its quality must be monitored and should be regulated [35].

Bee pollen is normally acidic, with a pH between 3.4 and 5.1, and composed of 15 percent proteins including essential amino acids. The nutritional and nutraceutical quality of pollen is decreased with subjected to storage conditions. However, pollen can be considered as an excellent source of polyphenols and flavonoids, considering its average content of about 1.6 g/100 g and 1.4 gm/100 g, respectively [36].

Bee pollen is defined as a valuable food however, due to the small quantities that are consumed and required, it should be rather regarded as a supplement functional food. On the other hand, even though some countries have national standard, there is no international quality and regulatory standards that defining the compositional requirements of bee collected pollen [37].

According to Bogdanov (2017), the old Egyptians describe pollen as a nurturing food. Moreover, it is known as the main exceptionally complete nourishment natural food product. Pollen provision is conveyed worldwide for dietary purposes and as diet supplement. On the other hand, the nutritional content of bee pollen may be partly released by digestive systems and only a proportion of bee pollen constituents are assimilated by humans.

The nutritional value of pollen is often evaluated by the protein and carbohydrate concentration, flavonoids and lipids content as well as the presence and quantity of essential amino acids. Bee pollen is characterized by very high protein content, but it varies greatly from 7-35 percent depending on the plant source. According to Marek, pollen can contains over 25 different micro and macro elements such as iron, calcium, phosphorus, potassium, copper, zinc, selenium, and magnesium [38]. The presence of adequate levels of macro and microelements is very important for the proper course of different metabolic processes. Moreover, mineral components are necessary for proper regulation of metabolic pathways and physiological processes [8]. Their adequate intake is essential for the maintenance of homeostasis, cell protection, functionality, and health.

The activity of pollen like vitamins and enzymes is deteriorated after two or three months of storage [13]. Scientists from the International Honey Commission (IHC), was proposed quality criteria and international standards of pollen quality. The standard is recommend the limits for the number of aerobic microorganisms (<10 cfu/g), yeast and mold (<5.104 cfu/g), Enterobacteriaceae (max 1.102 cfu/g), E. coli (absent in 1 g), Salmonellaspp (absent in 10 g), and Staphylococcus aureus (absent in 1 g) (Campos et al., 2008) [39].

Pollen as a Functional Food

Bee collected pollen and bee bread have a high nutritional value and rich in proteins, simple sugars, essential amino acids and omega fatty acids include bioactive compounds. Thus, compounds have a positive effect on human health and regarded as functional foods. These features strengthen immunity and help the body to fight bacteria, which will keep the body healthy and can perform a quality tissue repair of the body [40]. Furthermore, according to Margaoan et al. Bee-collected pollen and beebread are appreciated mainly for their high nutritional value [41]. Both products are rich in proteins, essential amino acids, sugars, fatty acids (including omega 3 and omega 6 fatty acids), vitamins, macro and microelements. Moreover, regarded as functional foods because they are rich in polyphenolic compounds and exhibit significant antioxidant properties [36].

Bee pollen is a valuable product greatly appreciated by the natural medicine because of its potential medical and nutritional applications [42]. It applied to antifungal, antimicrobial, antiviral, and anti-inflammatory treatments. According to strong medical effect of bee pollen is originates from the richness of bioactive compounds [43]. The significant number of bioactive compounds, carbohydrates, enzymes, vitamins, fatty acids, essential amino acids or carotenoids depends on the botanical and geographical origin of the pollen. High amounts of phenolic acids and flavonoids acid stimulate antioxidant, antimicrobial, anticarcinogenic, antiviral and anti-inflammatory activities [44]. This natural product owing to its biochemical diverse could be used for immunity system enhancement, regulation of the function of digestive system, and antimicrobial, anti-aging and anti-anemic activities.

Antimicrobial effects of bee pollen are well known, possibly mediated by glucose oxidase activity, deriving from honeybee secretion, while plant phenolics and flavonoids could also be involved [20]. According to Marek et al., bee collected pollen remains a good source of energy having 1692 kJ (404.3 kcal) in 100 g and referred as a perfect complete foodstuff [38]. Besides, because of its unique composition, it remains termed as a super foodstuff. Recently, there has been a renewed interest in the research of the composition as well as biological properties of bee collected pollen [18].

Bioactive Constituents and Health Benefits of Bee Pollen

Bioactive Constituents

According to Afra et al., bee pollen can be regarded as a promising therapeutic and natural food supplement [45]. Its functional biological property is due to the high content of flavonoids, polyphenols and considerable radical scavenging capacity. However, further experimental research and clinical studies will be required to verify the effectiveness of bee pollen extracts. Various pollen products can be found on the market in the form of granules, capsules, tablets, pellets, and powders.

According to the most important bioactive substances in bee collected pollen are phenolic compounds and carotenoids [45]. The phenolic compounds are responsible for the color of the pollen grains and for the bitter taste characteristic of pollen. Carotenoids are particularly important for biological functions, such as antioxidant activity. Moreover, pollen contains more than 100 enzymes and coenzymes, 16 fatty acids, all known vitamins. Furthermore, flavonoids, carotenoids, trace elements, and antioxidants are compounds that contribute to the potential bioactivities properties of bee collected pollen [6]. The presence of more than 250 substances with high biological activity was determined in the pollen from different plant species [42].

Health Benefits

Apitherapy is becoming more and more recognized among contemporary and conventional treatment methods as it uses therapeutic effect of standardized, pharmacologically active fractions obtained from bee products [42]. The extracts of bee pollen collected from flowers of different angiosperms can be regarded as a promising therapeutic food supplement. Its functional biological property is mainly due to the high content of flavonoids and polyphenols [45]. Flavonoids and phenolic acids are the main phenolic compounds of bee-pollen and have a role in reduction of the scavenging of free radicals that harm our cells [19].

Bee collected pollen and bee bread are rich in proteins, simple sugars, essential amino acids and omega fatty acids which have a positive effect on human health. It strengthens immunity and helps the body to fight bacteria, which will keep the body healthy, and can perform a quality tissue repair [4]. According to Nemat et al., the bee collected pollen can protect the body against potentially harmful molecules called free radicals [46]. The damage the body tissue by free radicals is linked to chronic diseases such as cancer and type two diabetes.

The studies of the past few years suggest that the biologically active substances found in bee pollen can act as strong antimicrobial, antioxidant and anticarcinogenic properties [43]. On the other hand, bee pollen can demonstrate a wide range of healing effects and increase the level of (Adenine Tri phosphate) ATP, and consequently neutralize an effect of many toxic agents, besides increase immunity and improve the energy balance of the tissues [38]. Moreover, antioxidants in bee pollen may protect lipids from oxidizing. The oxidization of lipids can restrict blood vessels and raising heart disease risk [47]. On the other hand, bee collected pollen may boost the immune system and help to avoid illnesses and unwanted reactions in the body and kill potentially harmful bacteria such as E. coli, Salmonella, Pseudomonas aeruginosa [48]. Strong medical benefits of this bee product originate from the richness of bioactive compounds.

According to the diversity of active natural metabolites, especially vitamins, carotenoids, and polyphenols, in pollen has valued significant biological activity [49]. Moreover, pollen can be expressed as the antioxidant, antibacterial, and anti-carcinogenic activity. According to the beneficial effect of bee pollen in the human diet, is considered as a health-promoting food [50]. Pollen has a great role in the protection of vital cell components from oxidative damage of free radicals. Pollen can neutralize the free radicals and prevent incidence of various diseases such as cancer and cardiovascular and neurodegenerative diseases [49]. Due to the high nutritional value and pronounced health-promoting properties, and the potential use as a supplement to the human diet, bee-pollen represents a valuable natural product. Pollen remains perceived as a society drug in China and Germany as a result of having a few important phytochemicals, flavonoids and carotenoids [51].

Physicochemical Characteristics and Chemical Compositions

Physicochemical Characteristics

Physicochemical characteristics of bee pollen depend on its botanical origin and the nutritional composition has some variations among different countries (Tables 1 and 2). There are plenty of studies that focus on the characterization of physical-chemical properties of bee-pollen. According to Leila, bee pollen is studied as potential treatments that suit to enhanced nutritional and bioactive value for humans. The physicochemical properties of bee-collected pollen can be affected both by processing techniques Ranieri et al., and storage conditions [52]. Freshly collected pollen contains from 15% to 30% of water. Consequently, it needs to be promptly processed to boost its physicochemical stability and avoiding microbial development [53].

Table 1: Bee pollen regulatory standards of some countries.

Quality Parameters

Regulatory Specifications

Argentina Brazil

Mexico

1 PH

5.00

5.00

5.00

2 Moisture gm/100gm maximum

8.00

4.00

8.00

3 Ash gm/100gm maximum

4.00

4.00

2.20

4 Lipid gm/100gm maximum

6.00

5.00

6.50

5 Proteins gm/100 minimum

15.00

8.00

12.00

Source: Enero (2014)

Table 2: Pollen and bee bread in reference to human nutritional requirements.

No

Component

Bee Pollen Bee Bread RDI for 15 g

References

1 Proteins

7-40%

14-37%

5-22%

Kaškonienė 2015; Fuenmayor et al., 2014; Hoffman et al., 2013; Zuluaga et al., 2015
2 Carbohydrates

24-60%

24-34%

1-4.6%

 Barene et al., 2015
3 Lactic acid

0.56%

3.2%

Barene et al., 2015
4 Lipids

1-18%

6-13%

0.1-4%

Campos et al., 2016
5 Flavonoids

0.2-2.5%

0.03%

Komosińska et al., 2015

According to Urcan et al., the chemical composition of bee collected pollen depends strongly on botanical and geographic origin, climate, soil type and season [54]. The bees are very selective when gathering pollen and that the bulk of the collected pollen comes from few plant species. On the other hand, the identification of botanical origin of both pollen and beebread is of paramount importance since their biological, nutritional, antioxidant and antibacterial properties are directly related to their composition [55].

Chemical Composition

According to Sattler et al., the chemical composition of bee collected pollen is fundamentally influenced by the botanical diversity from which it was collected [7]. On the other hand, the botanical contribution, storage time, nutritional status of the plant and environmental conditions in the phase of pollen collection are also influence the composition. Pollen is rich in biologically active substances and composed of about 200 substances [42]. The basic chemical substances are proteins, amino acids, carbohydrates, lipids and fatty acids, phenolic compounds, enzymes, and coenzymes as well as vitamins and bio-elements.

Small differences among composition of bee pollen could results in gathering area or season in floral species, environmental conditions including soil type, however, the major differences are mainly attributed to botanical origin [56]. According to Silva et al., the chemical composition of bee pollen depends strongly on the plant source and geographic origin [57]. Based on the study of Komosinska et al., bee pollen is normally acidic, with a pH between 3.4 and 5.1, and composed of 20% proteins (including essential amino acids) such as methionine, lysine, threonine, histidine, leucine, isoleucine, valine, phenylalanine, and tryptophan [42]. Moreover, bee collected pollen contains 55% total carbohydrates with 25% of reducing sugars (primarily fructose and glucose), 5% lipids, 1.6% phenolic compounds, 0.7% vitamins, and 1.6% bio chemical-elements [19].

According to proline and glutamic acid content of bee pollen is associated with bee pollen quality [58]. Moreover, concentration glutamic acid greater than 20 mg/g indicates the freshness, whereas lower proline value indicates aging and technological process. Amylase, phosphatase and glucose-oxidase are the functional enzymes that found in beebread [13]. Additionally, beebread contains largest quantity of amino acids like glutamic acid, aspartic acid and proline.

The study conducted by Adriana et al., conclude that beebread is categorize as a valuable special foods, that contains proteins, essential amino acids, fatty acids, carbohydrates, minerals and bioactive compounds [28]. The calcium content of Ethiopian Zea mays pollen investigated by Admassu was higher than potassium content a different situation comparative with previous scientific basis [59]. The pollen composition varies greatly according to its botanical origin. Table 3 presents average bee-pollen composition as well as the data of Brazilian, Hungary, Poland, Slovenia, India, Romania, Spain, China and Bulgaria. And Table 1 represents the quality parameters and regulatory specifications of pollen from Argentina, Brazil and Mexico.

Table 3: Physicochemical composition of commercial bee collected pollen from different countries.

No

Parameters

Countries
Hungary Poland Slovenia India Romania Spain China

Bulgaria

1 pH

4.40

4.50 5.40 4.30 4.90 4.40 5.00

4.40

2 Free acidity (meq-kg)

243.00

332.00 207.00 383.00 237.00 241.00 351.00

310.00

3 Moisture (gm/100 gm)

4.90

4.00 5.90 9.10 5.10 5.20 2.00

4.60

4 Ash (g/100 g)

1.70

2.60 2.40 3.30 2.30 1.60 4.30

1.80

5 Lipids (gm/100 g)m

4.90

5.70 5.90 8.00 4.90 5.00 5.20

5.60

6 Protein (gm/100 gm)

16.30

25.60 21.40 26.10 22.30 20.80 17.60

19.20

7 Sodium (mg/kg)

219.00

236.00 240.00 113.00 84.00 379.00 125.00

199.00

8 Potassium (mg/kg)

3607.00

5797.00 5244.00 4794.00 4869.00 3622.00 9542.00

4608.00

9 Calcium (mg/kg)

1461.00

1654.00 1462.00 2376.00 1657.00 589.00 1620.00

665.00

10 Iron (mg/kg)

40.90

56.20 42.10 197.00 89.40 57.70 63.30

47.40

11 Magnesium (mg/kg)

635.00

1194.00 1135.00 1430.00 865.00 484.00 2636.00

577.00

12 Zinc (mg/kg)

34.30

53.20 44.30 31.30 48.70 44.30 31.40

51.90

13 Insoluble Dietary fiber (gm/100 gm)

9.60

5.70 0.00 12.80 8.00 8.60 0.00

5.90

14 Soluble Dietary fiber (gm/100 gm)

0.80

2.30 0.00 1.70 0.90 3.20 0.00

2.00

15 Total dietary fiber (gm/100 gm)

10.50

8.10 0.00 14.60 9.00 11.90 0.00

7.90

Source; Fuenmayor (2014)

The study on Rodica et al., is discover that the bee collected pollen and bee bread have a high nutritional value including bioactive compounds, which have a positive effect on human health [4]. These products are rich in proteins, simple sugars, essential amino acids and omega fatty acids. Beebread, that a product of bee collected pollen has become lately a product of high commercial value and a fair evaluation of chemical composition is needed to guarantee the quality.

Utilization and Handling Practices of Bee Pollen

The crude nutrients measurement in bee collected pollen and bee bread cannot accurately determine their nutritional and functional value. Consequently, the nutrients are encapsulated inside the hard to crack pollen grains that affect the digestibility and bioavailability the nutrients in the pollen. Moreover, according to Zuluaga et al., pollen is partially digested in human body on average about 60 percent of proteins in the pollen is digested, while the digestibility of protein in beebread is about 94.7 percent [26]. The digestibility and bioavailability of pollen is directly related to the morphological characteristics of the outer wall of the pollen [34].

The outer layer of the pollen is partly fractured during the natural fermentation and transformation process in beebread. Thus, makes beebread a better bioavailability than pollen and therefore, the functionally and energetically rich content of pollen can be assimilated and used easier by the human body (Mutsaers et al., 2005). The quality of bee pollen, in terms of nutrition, depends mainly on its digestibility and bioavailability.

According to Fan et al., pollen grain outer walls consist of two layers: the outermost (exine) and the inner surface (intine), thus layers are affect the bioavailability of nutrients in the pollen and hence, before consumption further softening process and treatment is important [3]. In order to increase the digestibility, pollen grains are crushed or dissolved in warm water and the pollen grains crack after 2-3 h, and leads to the release of nutrients. In addition, pollen may be mixed with many other food products, for example, with honey, yogurt, and jams [40]. Pollen shall need to chew thoroughly because in raw form of pollen only 10%-15% the nutrients are used however, the mechanical grinding process, improve the bioavailability of this product’s by 60-80% [42].

Based on the study of Aleksandar et al., pollen is recognized as an excellent dietary supplement for human nutrition [49]. Moreover, pollen as food supplement sources can be found in different forms on the market (granules, capsules, tablets, pellets, and powders). However, the digestibility of pollen’s nutrients is strongly affected by the presence of a pollen shell. The shells of the pollen grain can decrease the bioavailability of nutrients by 50% and more. Dried grains of pollen have a hard shell (intine and exine) that can significantly affect the penetration of the digestive enzymes into the pollen pellets. The hard shell can affect the biodegradability, bioavailability and absorption of the important nutrients. In order to increase the digestibility and the functionality, the pollen grains should be ground and dissolved in warm water, whereby the accessibility of nutrients increases to 60-80% [16].

Recently, due to the increased awareness of consumers the consumption of functional foods can improve their health and pollen began to be considered as a functional food and feed ingredient [16].

Moreover, a number of fermented pollen-based food products have been developed. Based on the study of adding bee collected pollen as food additives and supplementation can improve the food products and thus, significantly increased the content of sugars, proteins, ash, fibers, and polyphenols, and the antioxidant potential of the final products [60].

The thermal properties of pollen are very important, especially when pollen is used as a supplement in the products that require thermal treatment or roasting at higher temperatures may decompose the nutritional and functional constituents of pollen [60]. In recent years, bee pollen is considered to be one of the most bioactive products for human consumption. However, related to the construction of the chemical structure of pollen, it reduced the availability of adequate nutrients and bioactive compounds. Hence, before consumption, of bee pollen should be subject to the process of transformation [26].

According to Carlos et al., bee pollen has had a growth in consumption in recent years due to the recognition of its nutritional and bioactive potential. However, several reports have shown that the external structure of the grain limits the absorption of nutrients in the human gastrointestinal tract [61-63]. However, pollen grains structural modification could be achieved through fermentative processes, and favoring the release of compounds found in the pollen. Moreover, literature mentions that this natural modification improves the nutritional and bioactive characteristics of bee pollen [34]. The potassium, protein, dietary fiber and lipids levels in bee collected pollen indicated the possibility of using pollen as a dietary supplement. Moreover, further analysis focused on bioactive components and properties and characterizing the volatile fraction and sensory characteristics are recommended for fully characterizing Ethiopian bee pollens.

Conclusion and Recommendations

Conclusion

The quality of pollen is influenced by the harvesting techniques, technologies used, and post-harvest handling, drying and storage situations. Even though, some countries have national standard, there is no international standards that defining the compositional requirements of bee collected pollen. The chemical structure of pollen can reduced the bioavailability of adequate nutrients and bioactive compounds, in order to increase the digestibility and bioavailability pollen grains and therefore, further softening process and treatment is essentially important to crushed and dissolve the pollen grains. Compared to other food products, pollen and bee bread have a significant amount of biologically active nutrients that meet the human body needs to a good functioning of the immune system and resistance against illnesses, as well as supporting the healing processes.

Due to the small quantities that are consumed and required, pollen should be rather regarded as a supplement functional food. Application of bee collected pollen in the formulation of functional food products is in progress, and pollen’s addition to a food matrix generally improves the nutritional, functional, techno-functional, and sensory properties of the newly formulated food products. Having diversified natural vegetation cover that used as a pollen source and having a large bee colony population in Ethiopia, pollen production is not a widely commercialized product. Therefore, promoting and supporting pollen production, postharvest handling and quality standard development, and commercialization aspects shall be the priority area of intervention.

Recommendations

  • Bee collected pollen and bee bread are becoming a valuable and pronounced foods, however, further detailed studies on assimilation and bioavailability of the ingredients, health claims and applications shall be considerable areas of research.
  • Assessing the nutritional composition and bio-functional properties of pollens produced at different agro ecological area of Ethiopia shall be fundamentally important area of consideration.
  • Commercializing production and promoting the bio-functional properties and health benefits of pollen can be a considerable area of apiculture industry development intervention in Ethiopia.

References

  1. Srivastava P (2019) Status Report on Indian bee keeping and honey processing. J Multi sweet Group 2-6. Birks H, Birks H, Ammann B (2016) The fourth dimension of vegetation. J Science 354: 412-413. [crossref]
  2. Teng F, Soohyun P, Qian S, Xingyu Z, Qimin L, et al. (2020) Transformation of hard pollen into soft matter. J Nature Communications 11: 1-10.
  3. Rodica M, Mirela S, Alina V, Erkan T, Banu Y, et al. (2019) Bee Collected Pollen and Bee Bread: Bioactive Constituents and Health Benefits. J Antioxidents 8: 568-578. [crossref]
  4. Avni D, Hendriksma HP, Dag A, Uni Z, Shafir S (2014) Nutritional aspects of honey bee-collected pollen and constraints on colony development in the eastern Mediterranean. J Insect physiology 69: 65-73. [crossref]
  5. Bogdanov S (2015) Pollen: Production, Nutrition and Health: A Review. J American College of Nutrition 1-30.
  6. Sattler J, Melo D, Granato E, Araújo A, Freitas O, et al. (2015) Impact of origin on bioactive compounds and nutritional composition of bee pollen from Southern Brazil: A screening study. J Food Research International 77: 82-91.
  7. Melo A, Estevinho J, Sattler B, Souza A, Freitas O (2016) Effect of processing conditions on characteristics of dehydrated bee collected pollen and correlation between quality parameters. J Food Science and Technology 65: 808-815.
  8. Ares A, Valverde J, Bernal M, Nozal J, Bernal (2018) Extraction and determination of bioactive compounds from bee pollen. J Pharmaceutical and Biomedical Analysis 147: 110-124. [crossref]
  9. Anderson K, Carroll M, Sheehan T, Mott B, Maes P, et al. (2014) Hive-stored pollen of honey bees: many lines of evidence are consistent with pollen preservation, not nutrient conversion. Mol Ecol 23: 5904-5917. [crossref]
  10. Pierre L, Vaughn B, James D, Zachary Y, Huang J, et al. (2019) Seasonal variation of pollen collected by honey bees (Apis mellifera) in developed areas across four regions in the United States. J Plose One 14: 1-24. [crossref]
  11. Dhananjay V, Snehal K, Dhananjay M (2019) Solid State Fermentation of Bee-Collected Pollen. J Current Microbiology and Applied Sciences 8: 1557-1563.
  12. Barene I, Daberte I, Siksna S (2015) Investigation of bee bread and development of its dosage forms. J Medicine 21: 16-22.
  13. Tomás A, Falcão S, Russo P, Vilas M (2017) Potentialities of beebread as a food supplement and source of nutraceuticals: Botanical origin, nutritional composition and antioxidant activity. J Apic Res 56: 219-230.
  14. Habryka C, Kruczek M, Drygas B (2016) Bee products used in apitherapy. World Scientific News 48: 254-258.
  15. Kieliszek M, Piwowarek K, Kot A, Chlebowska A (2018) Pollen and bee bread as new health-oriented products; A review. J Trends in Food Science and Technology 71: 170-180.
  16. Deveza M, Keller K, Lorenzon M, Nunes L, Sales É, et al. (2015) Mycotoxicological and palynological profiles of commercial brands of dried bee pollen. Brazilian. J Microbiology 46: 1171-1176. [crossref]
  17. Kaškonienė V, Kaškonas P, Maruška A (2015) Volatile compounds composition and antioxidant activity of bee pollen collected in Lithuania. J Chemical Papers 69: 291-299.
  18. Fuenmayor B, Zuluaga D, Díaz M, María C, Saverio M (2014) Evaluation of the physicochemical and functional properties of Colombian bee pollen. J MVZ Córdoba 19: 4003-4014.
  19. Denisow M (2016) Influence of the commercial processing and floral origin on bioactive and nutritional properties of honey bee-collected pollen. J Sci Food Agric 96: 4303-4309.
  20. Canale A, Benelli G, Castagna A, Sgherri C, Poli P, et al. (2016) Microwave-assisted drying for the conservation of honeybee pollen. J Materials 9: 363.
  21. Ranieri A, Benelli G, Castagna A, Sgherri C, Signorini F, et al. (2019) Freeze-drying duration influences the amino acid and rutin content in honeybee-collected chestnut pollen. Saudi J Biol Sci 26: 252-255. [crossref]
  22. Carlos B, Carlos D, Consuelo M, Marta C, María C, et al. (2014) Evaluation of the physicochemical and functional properties of Colombian bee pollen. J Revista MVZ Córdoba 19: 4003-4014.
  23. Vaida A, Vilma K, Paulius K, Karolina B, Audrius M (2019) Comparison of Physicochemical Properties of Bee Pollen with Other Bee Products. J Biomolecules 9: 819. [crossref]
  24. Parvanov P, Dinko D (2017) Proposals for desiccated bee pollen production and labeling. J Nutr Hum Health 1: 13-16.
  25. Zuluaga C, Serrato J, Quicazan M (2015) Chemical, nutritional and bioactive characterization of colombian beebread. J Chemical Engineering Transactions 43: 175-180.
  26. Fernandes P, Serrão J (2000) Nutritive value and apparent digestibility of bee-collected and bee-stored pollen in the stingless bee. J Apidologie 31: 39-45.
  27. Adriana U, Liviu Al, Daniel S, Carmen I (2017) Chemical Composition and Biological Activities of Beebread Review. J Bulletin of University of Agricultural Sciences and Veterinary Medicine 74: 1-9.
  28. Markiewicz R, Naliwajko SK, Bartosiuk E, Moskwa J, Isidorov V, et al. (2013) Chemical composition and antioxidant activity of beebread, and its influence on the glioblastoma cell line (U87MG). J Apiculture Science 57: 147-157.
  29. Campos M, Olena L, Anjos O (2016) Chemical composition of bee pollen. Chemistry, biology and potential applications of honeybee plant-derived products. Bentham eBooks 67-88.
  30. Anjos O, Santos A, Dias T, Estevinho L (2017) Application of FTIR-ATR spectroscopy on the bee pollen characterization. J of Apicultural Research 56: 210-218.
  31. Leila F, Daiane P, Bianca R, Ligia B, Almeida M, Solange T (2019) Fortification of beef burger with the addition of bee pollen from Apis J Food and Agriculture 31: 895-901.
  32. GENÇAY Ç, Nezahat P (2017) Protein Analysis of Anzer Bee Pollen by Bradford Method. J Food Chemistry 17: 21-32.
  33. Bogdanov S (2011) The Bee Pollen Book. Muehle thurnen, Switzerland: J Bee Product Science 1-14.
  34. Estevinho M, Afonso S (2011) Antifungal effect of lavender honey against Candida albicans, Candida krusei and Cryptococcus neoformans. J Food Science and Technology 48: 640-643. [crossref]
  35. Antonella C, Giovanni B, Giuseppe C, Cristina S, Francesca S, et al. (2020) Drying Techniques and Storage: Do They Affect the Nutritional Value of Bee-Collected Pollen. J Molecules 25: 1-15. [crossref]
  36. Maria G, Campos Bogdanov S, Chirstian Frigerio (2010).What is the future of Bee-Pollen. J Api-Product and Api-Medical Science 2: 131-144.
  37. Marek K, Kamil P, Anna M, KotS, Anna C (2018) Pollen and bee bread as new health-oriented products: A review. J Trends in Food Science & Technology 71: 170-180.
  38. Melo A, Estevinho M, Almeida L (2015) A diagnosis of the microbiological quality of dehydrated beepollen produced in Brazil. J Applied Microbiology 61: 477-483. [crossref]
  39. Bobis O, Marghitas I, Dezmirean D, Morar O, Bonta V, et al. (2010) Quality Parameters and Nutritional Value of Different Commercial Bee Products. J Sci Biotechnol 67: 1-2.
  40. Margaoan R, Strant M, Varadi A, Topal E, Yücel B, et al. (2019) Bee Collected Pollen and Bee Bread: Bioactive Constituents and Health Benefits. J Antioxidants 8: 568.
  41. Komosinska K, Olczyk P, Kaźmierczak J, Mencner L, Olczyk K (2015) Bee pollen Chemical composition and therapeutic application. Evidence based Complementary and Alternative Medicine J Hindawi 2015: 297425. [crossref]
  42. Koroglu A (2018) Bee pollen and its pharmacological properties. J Bio-molecules 27: 93-97.
  43. Ivanisova E, Kacaniova M, Francakova H, Petrova J, Hutkova J, et al. (2015) Bee bread perspective source of bioactive compounds for future Scientific Journal for Food Industry 9: 592-598.
  44. Afra M (2018) Bee pollen properties: uses and potential pharmacological applications-a review. J Analytical and Pharmaceutical Research 7: 513-515.
  45. Nemat K, Yadollah S, Mahdi M (2009) Chronic inflammation and oxidative stress as a major cause of age-related diseases and cancer. J National Library of Medicine 3: 73-80. [crossref]
  46. Anna R, Agata K, Robert K., Krzysztof J, Maciej K, et al. (2018) Protective Effect of Polyphenol-Rich Extract from Bee Pollen in a High-Fat Diet. J Library of medicine 23: 805. [crossref]
  47. Nanias P, Sandra R, Alfredo T, Xesus F, Leticia M (2014) Biological activities of commercial bee pollens: antimicrobial, antimutagenic, antioxidant and anti-inflammatory. J Food Chemistry Toxicol 63: 3-9. [crossref]
  48. Aleksandar Ž, Danijel D, Miroljub B, Mohammad A, Mirjana B (2020) The Application of Pollen as a Functional Food and Feed Ingredient;-The Present and Perspectives. J Biomolecules 10: 2-36. [crossref]
  49. Mirjana M, Jelena T, Irena V, Branko Š, Dušanka M (2019) Phenolic Composition Influences the Health-Promoting Potential of Bee-Pollen. J Bio-molecules 9: 783. [crossref]
  50. Avsar C (2016) Phenolic Composition, Antimicrobial and Antioxidant Activity of Castanea sativa Mill. Pollen Grains from Black Sea Region of Turkey. J International Food Research 23: 1711-1716.
  51. Arruda V, Pereira A Estevinho L, Almeida L (2013) Presence and stability of B complex vitamins in bee pollen using different storage conditions. J Food Chem Toxicol 51: 143-148. [crossref]
  52. Di Cagno R, Filannino P, Cantatore V, Gobbetti M (2019) Novel solid-state fermentation of bee-collected pollen emulating the natural fermentation process of bee bread. J Food Microbiol 82: 218-230.
  53. Urcan A Marghitas L, Dezmirean D, Bobis O, Bonta V, Mure C, et al. (2017) Chemical Composition and Biological Activities of Beebread Review. J Sci Biotechnol 7: 4-6.
  54. Velásquez P, Rodríguez K, Retamal M, Giordano A, Valenzuela L, et al. (2017) Relation between composition, antioxidant and antibacterial activities and botanical origin of multifloral bee pollen. J Appl Bot Food Qual 90: 306-314.
  55. Araújo S, Chambó E, Costa M, Cavalcante S, Silva D, et al. (2017) Chemical Composition and Biological Activities of Mono and Hetero floral Bee Pollen of Different Geographical Origins. J National Library Medicine 18: 921. [crossref]
  56. Silva T, Natividade C, Silva F (2014) Identification of sugar, amino acids and minerals from the Pollen of jandaıra stingless bees (Melipona subnitida). J Food and Nutrition Science 5: 1015-1021.
  57. Dominguez D, Bohoyo GD, Herna MT, Gonzalez D (2011) Influence of the commercial processing and floral origin on bioactive and nutritional properties of honey bee-collected pollen. J Food Science and Technology 46: 2204-2211.
  58. Admassu k, Ensermu S, Teshome G, Peter B, Lulsegde M (2017) Proximate composition and antioxidant power of bee collected pollen from moist Afromontan forests in southwest Ethiopia. J Agricultural Science Research 7: 83-95.
  59. Krystyjan M, Gumul D, Ziobro R, Korus A (2015) The fortification of biscuits with bee pollen and its effect on physicochemical and antioxidant properties in biscuits. J Food Sci Technol 63: 640-646.
  60. Carlos M, Zuluaga D, Marta Q (2019) Effect of fermentation on structural characteristics and bioactive compounds of bee-pollen based food. J Apic Sci 63: 1-14.
  61. Bogdanov S (2016) Pollen Collection, Harvest, Composition, Quality The Bee Pollen Book 1-14.
  62. Mărgăoan L, Mărghitas D, Dezmirean C, Mihai O (2010) Bee Collected Pollen General Aspects and Chemical Composition, Bulletin USAMV. Animal Science and Biotechnologies 67: 254-259.
fig 1

Application of a Device in Times of Pandemic: Safety for the Patient and Medical Personnel

DOI: 10.31038/IJAS.2021221

Introduction

In Colombia, 500,000 COVID-19 cases and 15,800 deaths have been reported, among which health personnel cases and deaths amount to 5,619, and 43 respectively [1]. Age is an independent risk factor for suffering from a severe disease, with the ages of 65 and over representing the highest risk. In the US, individuals over the age of 65 represent 45% of hospital admissions, 53% of intensive care unit admissions, and 80% of fatalities [2]. In Colombia, the installed capacity of beds in the ICU for the care of COVID-19 increased by 36%, most of them in mechanical ventilation. The increase in life expectancy and the decrease in the birth rate have led to a significant increase in the average age of the population, where probably a third of geriatric patients will undergo a surgical procedure [3]. From the anesthetic point of view, this has implications in airway management due to an increase in the difficulty of positive pressure ventilation.

On the other hand, the highest viral load of SARS-CoV-2 has been reported in sputum and secretions of the upper respiratory tract, especially nasal [4]. However, tracheal intubation is considered a high-risk procedure for health personnel due to the risk of exposure by aerosolization [5]. For this reason, in airway management, the most experienced professional should be chosen, simulation exercises of personal protective equipment protocols implemented, adequate spaces to manage the airway allocated, airway management equipment for patients diagnosed with or suspected of having COVID-19 made available, necessary or potentially necessary medications guaranteed, airway management guidelines in times of pandemic developed further, and the situations that lead to potential aerosolization avoided or reduced.

Device Description

In 2017, the authors first published the description of a new device for the ventilation of edentulous patients called NIPARA, (NI) Niño, (PA) Pauwels, (R) Raffan, and (A) Arango, demonstrating a significant improvement in the coupling of the face mask by an increase in positive pressure ventilation and a decrease in the loss of escape volume between the mask and the patient, which in theory reduces the potential aerosolization of this intervention.

The device consists of an intraoral extended U-shaped plastic plate, latex-free plastic materials (4.6 inches x 1.4 inches) with right and left side extensions. In the midline, it has a mating surface on both the top and bottom that engages the labial frenulum allowing intraoral retention, and the lateral extensions are placed between the gums and cheeks. The device is inserted using the same insertion technique as conventional oropharyngeal cannulas inserted into the device’s central hole. Once the NIPARA is inserted, the face mask is used as usual by resting it on the patient’s face for manual positive pressure ventilation before the intubation of the patient (Figure 1) [6].

fig 1

Figure 1: NIPARA device.

Discussion

Ventilation with a face mask is a procedure that produces a high degree of aerosolization, and all the strategies that decrease it, such as two-hand ventilation and two operators providing an adequate seal to the face or rapid sequence induction, are indicated in the time of induction of anesthesia. Assessment of the airway’s difficulty in Covid-19 patients can be carried out with the MACOCHA scale before the procedures [7].

This article mainly focuses on the face mask ventilation maneuver in the emergency, resuscitation, surgery, or intensive care setting, where patient and staff protection is essential. Therefore, according to the principles of the Safe Airway Society for the management of the airways and endotracheal intubation for the group of adult patients with COVID-19, it is crucial to follow the rapid sequence intubation protocol, to decrease long periods of high-flow oxygenation or non-invasive ventilation because of its potential aerosol generation. Due to the proximity of the medical staff to the patient’s airway, it is essential to minimize the risk of aerosolization generation with these procedures [8]. Among the predictors of difficult ventilation are edentulous patients, since it is difficult to obtain an adequate seal between the mask and the patient’s face due to the loss of vertical dimension, allowing air leakage [9].

In the first semester of 2020, during the Covid-19 Pandemic, 4,951 patients have been operated on at Foundation Santa Fe de Bogotá University Hospital, Bogotá, Colombia.

Near to 27% were (a group of 1,347 patients) over 60 years of age, for which the possibility of being edentulous according to the National Study of Oral Health of Colombia is approximately 33% which is probably equivalent to 440 patients that required some support of the airway and surely to be ventilated with the safety protocols. Thus, by restoring the vertical facial dimension of edentulous patients with NIPARA, a better adaptation of the facial mask is achieved and lower resistance to ventilation, thus reducing the possibility of particle aerosolization (Figure 2) [10].

fig 2

Figure 2: A patient using and not using NIPARA before ventilation.

Conclusion

This article does not intend to change the safety protocols already established or indicate mask ventilation in all patients. However, if necessary, the NIPARA can be a low-cost device, a useful, easy-to-use, and safe tool taking into account that the population older than 65 represents a high percentage of patients who go to hospitals and require ventilation either in endoscopy procedures, surgery, intensive care unit or in an emergency room. Additionally, they present total edentulism, making it difficult to seal between the marking and the patient’s face, generating an aerosol outlet with a high risk of contamination.

References

  1. https://covid19.minsalud.gov.co/
  2. Enfermedad de Coronavirus 2019 (Covid-19). BMJ. Best Practice, Agosto 10, 2020.
  3. Nazar C, Zamora HM, Fuentes HR, Lema FG (2015) Paciente adulto mayor y cirugía no cardíaca: ¿qué debemos saber? Rev Chil Cir 67: 309-317.
  4. Wang W, Xu Y, Gao R, Lu R, Han K, et al. (2020) Detection of SARS-CoV-2 in Different Types of Clinical Specimens. JAMA 323: 1843-1844. [crossref]
  5. Wu Z, McGoogan JM (2020) Characteristics of and Important Lessons from the Coronavirus Disease 2019 (COVID-19) Outbreak in China: Summary of a Report of 72 314 Cases from the Chinese Center for Disease Control and Prevention. JAMA 323: 1239-1242. [crossref]
  6. Niño MC, Pauwels A, Raffan F, Arango E, Romero DJ, et al. (2017) Efficacy of a new device to optimize positive pressure ventilation via face mask in edentulous patients: a randomized trial. Expert Rev Med Devices 14: 315-320. [crossref]
  7. Joint statement: Supporting doctors in the event of a Covid-19 epidemic in the UK. 2020. Chief Medical Officers of Wales, Scotland, Northern Ireland, England, National Medical Director NHSE/I, General Medical Council.
  8. Brewster DJ, Chrimes N, Do TB, Fraser K, Groombridge CJ, et al. (2020) Consensus statement: Safe Airway Society principles of airway management and tracheal intubation specific to the COVID-19 adult patient group. Med J Aust 212: 472-481. [crossref]
  9. Racine SX, Solis A, Hamou NA, Letoumelin P, Hepner DL, et al. (2010) Face mask ventilation in edentulous patients: a comparison of mandibular groove and lower lip placement. Anesthesiology 112: 1190-1193. [crossref]
  10. Estudio Nacional de Salud Bucal IV, Ministerio de Salud y Protección Social 2013-2014.
fig 5

How Reliable is Galectin-3 Immunohistochemical Expression for Differentiation between Metastatic and Benign Thyroid Neoplasms?

DOI: 10.31038/EDMJ.2021532

Abstract

Background: Galectin-3 has been reported to have substantial accuracy in detection or excluding malignant nodules with prior indeterminate FNAC and per operative findings. Keeping this fact in mind, Thus, Galectin-3 can have a pivotal role in separating benign from the malignant thyroid neoplasms.

We aim to determine the frequency and intensity of Galectin-3 immunohistochemical expression studied in the benign and malignant thyroid neoplasms confirmed on histopathology.

Materials and Methods: This descriptive, observational, cross-sectional study was conducted from 5th November 2017 to 4th May 2018 in the Department of Histopathology, Foundation University Medical College, Islamabad Campus & Department of Surgery, Fauji Foundation Hospital, Rawalpindi.

We studied 78 thyroid specimens diagnosed with thyroid neoplasms on histopathology. Out of these 39 were benign cases (follicular adenoma and hurthle cell adenoma) and 39 were malignant cases (papillary thyroid carcinomas, follicular carcinoma, medullary carcinoma and poorly differentiated carcinoma). Each specimen was examined grossly and microscopically and checked for immunohistochemical staining pattern of Galectin-3 under the microscope.

Results: Age range in this study was from 15 to 65 years with mean age of 44.97 ± 10.78 years. Out of these 78 patients, 17 (21.79%) were male and 61 (78.21%) were female with male to female ratio of 1:3.6. Frequency of positive Galectin-3 immuno histochemical expression among thyroid neoplasms was found in 32 (41.03%) cases with Galectin-3 showing positive staining in 21 (53.85%) of all malignant and 11 (28.21%) of all benign cases. Among the malignant neoplasms,  positivity was seen most frequently in papillary thyroid carcinomas as compared to the other malignancies.

Conclusion: This study concluded that positive Galectin-3 immunohistochemical expression is seen both in benign and malignant thyroid neoplasm, but its expression is more in malignant thyroid neoplasms (53.85%) as compare to the benign lesions (28.21%). Therefore, we recommend that Galectin-3 immunohistochemical marker cannot be used alone for the routine diagnosis of malignant thyroid lesions as it has shown less sensitivity and specificity. Moreover it also has shown no significant role in differentiating between the benign and the malignant thyroid neoplasms.

Keywords

neoplasm, marker, malignant, benign, expression

Introduction

Thyroid gland is an important part of the endocrine system located at the base of the neck. It is chiefly composed of two types of cells, follicular and parafollicular cells. The follicular cells make thyroxine, which has important functional impacts on various systems and general metabolism. The parafollicular cells, also known as C cells arise from the neural crest and are involved in the calcitonin production, which has vital role in maintaining calcium homeostasis [1].

Thyroid neoplasms including both benign and malignant lesions are common entities encountered in daily clinical practice. Most of the lesions (95%) arise from the follicular epithelial cells of the thyroid gland [2].

Thyroid cancer is the most common among the endocrine tumors and its incidence has been increasing in the last three decades [3]. An estimated mortality rate of thyroid cancer is 0.5 to 10 cases per 100,000. The annual male and female percentage is 6.3% and 7.1% for white population, 4.3% and 8.4% for blacks and for Asian population patients it is 3.4% and 6.4% respectively.3These tumors can clinically present as a solitary nodule along with the normal thyroid gland or as a dominant nodule in the background of a multinodular goiter. 5% of the solitary thyroid nodules are found to be neoplastic [4].

In Pakistan, thyroid neoplasms are common especially in the northern areas, which are mainly attributable to the iodine deficiency or excess. Thyroid cancer accounts for 1.2% of all the malignancies diagnosed in our country with the papillary thyroid carcinoma being most common. The female to male ratio in Pakistan is  reported as 2.2:1 [5].

Patients can present with both the features of hyper and hypothyroidism in both benign and malignant lesion. This makes it clinically difficult to diagnose the exact underlying cause. Here comes the role of histopathology, which can correctly diagnose the lesion, but there are some neoplasms that have very confusing morphological details and these cannot be exactly categorized into benign or malignant, only on the basis of histopathology. This scenario is mostly seen in the follicular and the Hurthle cell neoplasms. The gross appearance and the microscopic details are perplexing for a pathologist. Moreover, the cytological details are also much overlapping in various benign versus malignant lesions [2].

The final diagnosis of the lesion being benign and malignant has profound effects on the clinical outcome and prognosis of the patient. Several articles have reported the significance of immnohistochemical markers to solve this problem. Galectin-3, p63 and Ki67 have been reported quite accurate to detect or exclude malignancy in nodules with prior indeterminate FNAC and per operative findings [6].

In this study, role of Galectin-3 will be quantified to differentiate and classify the thyroid lesions into benign and malignant categories. Galectin-3 belongs to the family of lectins. Galectin-3 is synthesized in both the nucleus and cytoplasm, and also expressed at the cell surface. It is also found extracellularly in the general circulation. Galectin-3 specifically binds to the beta galactoside containing intracellular, extracellular and cell surface associated glycol conjugates so it is over expressed in oncogenic pathology of thyroid [7-8].

In Pakistan, limited data is available regarding the role of galectin-3 as a diagnostic tool to differentiate malignant thyroid neoplasms from benign lesions. So, this study can have beneficial effects in the diagnostics and further treatment of such lesions.

Materials and Methods

There was a total of 78 thyroid specimens included in this study (39 benign and 39 malignant neoplasms). All of these patients were operated at the Department of Surgery, Fauji Foundation Hospital Rawalpindi during a period of six months from 5th November 2017 to 4th May 2018. The specimens were processed in the department of Histopathology, Foundation University Medical College Islamabad. The benign conditions included Follicular adenoma and Hurthle cell adenoma. The malignant conditions included Papillary thyroid carcinoma (both classic type and follicular variant), Follicular thyroid carcinoma, Medullary thyroid carcinoma and poorly differentiated carcinoma.

The hospital ethical committee granted the approval for data collection.  The data included patient’s demographic details, clinical presentation, previous laboratory test record and clinical suspicion. The specimens were examined both grossly and microscopically in the laboratory. The thyroid specimens were fixed in 10% formalin and were sliced properly. The representative sections were processed in the tissue processor (SAKURA TISSUE TEK-R TEC5 MODEL 220-240) for the paraffin sectioning. After this step, 4-5µm thick sections were cut using rotatory microtome (SAKURA ACCU-CUT MODEL SRM 200 CW). Hematoxylin and eosin stain (H&E) was used for staining the slides and get them ready to see under the microscope.

For the immunohistochemistry, representative histological sections of the thyroid neoplasm were used. The sections were deparaffinised by xylene and then were rehydrated by ethanol. Tri-sodium citrate buffer (pH 6.0 to 6.2) was used for the antigen retrieval. When the slides came back to room temperature, endogenous peroxidase activity was blocked by 0.6% H2O2. After this step lyophilized mouse monoclonal Galectin-3 antibody in the dilution of 1:100 was applied for an hour. Washing was done with tris- buffered saline (TBS). Then for 20 minutes super enhancer was added. Polymer horseradish peroxidase (HRP) was applied for 30 minutes as a secondary antibody and washing was done again with TBS. Subsequently Diamine Benzidine (DAB) chromogen was applied for 5 minutes. Mayer’s Haematoxylin was used for counter staining followed by clearing and mounting. Positive and negative controls were also applied.

Two consultant histopathologists examined the H&E stain and immunohistochemical marker (Galectin-3) under the Olympus light microscope. The sections with the best staining were selected for examination and reported likewise. Morphology and staining was noted and grading of Galectin-3 was done by Weber KB et al and Hermann ME et al guidelines. The intensity and distribution of Galectin-3 staining (cytoplasmic) on a scale of 0 to 3 was done as follows:

0 No staining

1+ Weak/slight staining

2+ Moderate staining

3+ Intense staining

The proportion of stained cells was interpreted as;

1+ < 5% of cells

2+ 5% to 50% of cells

3+ >50% of cells

The lesions with the particular cytoplasmic staining of more than 5% ofthe tumor cells was taken as positive for Galectin-3 regardless of its intensity.

Results

Age range in this study was from 15 to 65 years with mean age of 44.97 ± 10.78 years as shown in Table- I. Out of these 78 patients, 61 (78.21%) were female and 17 (21.79%) were male with female to male ratio of 3.6:1 (Figure I). On the basis of histopathological diagnosis half (39) cases belonged to benign neoplasms and other half (39) were diagnosed as malignant neoplasms as shown in Figure II.

Table 1: Age distribution of patients (n=78), having Mean ± SD = 44.97 ± 10.78 years.

Age (in years)

No. of Patients %age
15-40 27

34.62

41-65

51 65.38
Total 78

100.0

fig 1

Figure 1: Distribution of patients according to Gender (n=78)

fig 2

Figure 2: Distribution of patients according to histopathological features (n=78)

Frequency of positive Galectin-3 immunohistochemical expression among thyroid neoplasms was found in 32 out of 78 (41.03%) cases while 46 out of total 78 (58.97%) were showing negative galectin-3 staining (Figure III).

fig 3

Figure 3: Frequency of Galectin-3 immunohistochemical expression among thyroid neoplasms confirmed on histopathology (n=78)

A detailed look at the further breakdown of galectin-3 staining among benign neoplasms reveal that 11(28.1%) among 39 benign cases were positive for the stain. For the malignant neoplasms, total 21(53.85%) among 39 cases were positive. On the other side 28(71.79%) benign cases and 18(46.15%) malignant cases showed negative galectin-3 staining. The p-value calculated was 0.021 which is not significant (Table- II)

Table 2: Stratification of Galectin-3 immunohistochemical expression among benign and malignant thyroid neoplasms


Galectin-3 immunohistochemical expression


p-value

Positive

Negative

Benign

11 (28.21%) 28 (71.79%)  

0.021

Malignant 21 (53.85%)

18 (46.15%)

The Stratification of Galectin-3 immunohistochemical expression with respect to age groups showed total 27 cases within the age range of 115- 40 years out of which 10 cases were positive. Total 51 cases belonged to the age range of 41-65 years out of which 22 showed positive galectin-3 staining. The p-value calculated was 0.602 which is again insignificant (Table- III)

Table 3: Stratification of Galectin-3 immunohistochemical expression with respect to age groups


Galectin-3 immunohistochemical expression


p-value

Positive

Negative

15-40 years

10 17  

0.602

41-65 years 22

29

Similarly Table IV shows the breakdown of the cases according to gender. Total 8 out of 17 cases among male patients were positive for Galectin-3 and 24 out of 61 cases of female patients were showing the positive staining. The p-value calculated was 0.567 which is again insignificant.

Table 4: Stratification of Galectin-3 immunohistochemical expression with respect to gender

Galectin-3 immunohistochemical expression


p-value

Positive

Negative

Male

08 09 0.567
Female 24

37

The breakdown of Galectin-3 positivity in the various histological types of malignant and benign thyroid neoplasms is also shown in figure IV & V respectively.

fig 4

Figure 4: Galectin-3 staining in various histological types of Thyroid carcinomas

fig 5

Figure 5: Galectin-3 staining in various histological types of Thyroid adenomas

Discussion

Immunohistochemical markers have been extensively investigated for their potential diagnostic and prognostic utility in different thyroid tumors. Among these, they have deduced Galectin-3 to be a promising marker. Galectin-3 belongs to lectin family [9]. And a constellation of other normal tissues and tumors masses express Galectin-3 [10]. An intense nuclear localization of galectin-3 in tumors is seen in malignant transformation of thyroid tissue [11]. Research studies suggest Galectin-3 expression may serve as a potential diagnostic and prognostic marker of some cancers [12]. However, galectin-3 has not been established as a  universal and specific marker of thyroid neoplasia. Yet it can serve as a parameter in diagnostic approach for these tumors and for possible potential therapeutic target [13-16].

In 2015 a study was conducted in India regarding the staining pattern of Galectin-3 in thyroid neoplasms. The results showed 86% sensitivity and 85% specificity, with Galectin-3 showing positive staining in 87% of all malignant and 15% of all benign cases [2] In 2016, another study was conducted in Italy to check the diagnostic accuracy of the various immunohistochemical stains and they found galectin-3 to be 84.2% sensitive and 94.5% specific in detecting the thyroid neoplasms [7].

In contrast, our study shows less frequency of positive Galectin-3 immunohistochemical expression among thyroid neoplasms i.e. total 32 (41.03%) cases with Galectin-3 showing positive staining in 53.85% of all malignant and 28.21% of all benign cases. In 2002 a study was conducted regarding the staining pattern of Galectin-3 in thyroid neoplasms. The results showed high frequency of staining in papillary thyroid carcinomas only and no significant staining in the other type of carcinomas. Moreover, it also showed positive results in follicular adenomas which made them conclude that galectin-3 is not a sensitive marker if used alone [8] Our study also shows the same results.

A systematic review and meta-analysis on galectin-3 as a biomarker found that it may be a potentially useful immuno-marker to distinguish between patients with papillary thyroid carcinoma (PTC) and patients without PTC. In addition, lymph node metastasis is more frequently seen in PTC patients with positive expression of galectin-3 [17]. Our study also gives us the result that although galectin-3 is sensitive for detecting papillary thyroid carcinomas but it is not much sensitive in detecting other carcinomas from benign lesions (adenomas) as shown in figures IV & V.

Galectin-3, HBME-1, and cytokeratin-19 may be helpful in diagnosis of malignant thyroid tumors as evidenced by a study, although the expression of these markers may be seen in benign lesions as well. However, cytokeratin-19 is investigated for its diagnostic prowess. It was found that the marker and its combinations with other markers have higher sensitivities in accurate diagnosis of papillary carcinoma than the other combinations. But these immunohistochemical markers have limited role in differentiation between benign and malignant lesions [18].

Another important point which was noted in this study was that the carcinomas showing positive galectin-3 gave mostly focal positivity rather then the diffuse strong positivity in comparison to the results of the study done by Manivannan et al [18] . That study, which was done in 2012, demonstrated that galectin-3 staining pattern is significant in differentiating benign from malignant follicular neoplasms as well as follicular variant of papillary thyroid carcinoma. Diffuse positivity for galectin-3 was associated with malignant thyroid follicular neoplasms while focal weak positivity favours adenomas. On the other hand, a previous study have demonstrated that there was no marked difference in the staining intensity for intra cytoplasmatic or intranuclear expression of galectin-3 in benign and malignant thyroid neoplasms [19].

Thin-Prep fine needle aspiration cytology  showing increased expression levels of galectin-3 were seen with cellular hyperproliferation, hypertrophy, and pathophysiological situations associated with adenomas and thyroid carcinomas [20-21]. A comparison of glypican-3 (a member of the glypican family of heparan-sulfate proteoglycans bound to the plasma membrane) with galectin-3 demonstrated that galectin-3 had higher sensitivity in diagnosing thyroid carcinoma; however, specificity is low for differentiating follicular-patterned neoplasm [22]. These markers have also been investigated preoperatively and postoperatively, the preoperative serum galectin-3 level showed potential diagnostic value, as it was significantly higher in the cancer patients than in the control subjects (p < 0.05). [23]

Galectin-3 is also used in combination with other biomarkers for a differential diagnosis of thyroid lesions. The most commonly combined biomarkers are Hector Battifora mesothelial epitope-1 (HBME-1) and cytokeratin-19 [24-27]. However galectin-3 may not be used as single discriminators between follicular thyroid adenoma and carcinoma [24-27].  Some studies show that galectin-3 and HBME-1 have an excellent sensitivity and specificity for malignant thyroid lesions (100 and 89.1%, respectively) [26]. Despite core needle biopsies leading to the diagnosis of the majority of thyroid nodules, the accuracy is increased by also observing the galectin-3, cytokeratin-19 and HBME-1 panels, indicating their additional diagnostic value when combined with routine histology and not when used alone [24-27].  It was also reported that galectin 3, cluster of differentiation (CD) and, to an extent, HBME-1, are useful immunocytochemical parameters with the potential to support the fine needle aspiration cytology diagnosis of PTC, particularly in situations where the differential diagnoses is complicated [28].

Studies have noted variable Galectin-3 expression in poorly differentiated thyroid cancers also [29]. However, in majority of cases (75% to 100% of reported cases) of anaplastic thyroid carcinoma, Galectin-3 positivity was identified suggesting that differentiated thyroid carcinoma can progress or undergo anaplastic transformation [26,29]. In the present study and study by Herrmann et al., small number of cases of MTC and poorly differentiated carcinoma are reported with inconsistent Galectin-3 expression, making diagnostic application of Galectin-3 in these rare histological subgroups unlikely [30].

Zhu et al. reported several markers expression like HBME-1, CK-19, Galectin-3, and RET in several papillary thyroid carcinoma. The expression was found to be higher in papillary thyroid carcinoma as compared to benign neoplasia. However, they did not report any of these as specific markers for papillary thyroid carcinoma [31].

Conclusion

Galectin-3 immunohistochemical expression is found in the cases of both benign thyroid tumors and malignant neoplasms although more  commonly seen in malignant ones. So, it cannot be used alone for the routine diagnosis of malignant thyroid lesions as it shows less sensitivity and specificity. It also has expressed limited role in differentiating between the benign and the malignant thyroid neoplasms.

References

  1. Braverman LE, Cooper D. (2012) Werner & Ingbar’s The Thyroid: A Fundamental and Clinical Text. 10th Philadelphia: Lippincott Williams & Wilkins. p. 10.
  2. Sumana BS, ShaShidhar S, Shivarudrappa AS, (2015) Galectin-3 Immunohistochemical Expression in Thyroid Neoplasms. Journal of Clinical and Diagnostic Research 9:EC07. [crossref]
  3. Pellegriti G, Frasca F, Regalbuto C, Squatrito S, Vigneri R. (2013) Worldwide Increasing Incidence of Thyroid Cancer: Update on Epidemiology and Risk Factors. Journal of Cancer Epidemiology. [crossref]
  4. Dwivedi SS, Khandeparkar SG, Joshi AR, Kulkarni MM, Bhayekar P, Jadhav A, et al. (2016) Study of Immunohistochemical Markers (CK-19, CD-56, Ki-67, p53) in Differentiating Benign and Malignant Solitary Thyroid Nodules with Special Reference to Papillary Thyroid Carcinomas. Journal of Clinical and Diagnostic Research 10:EC14-9. [crossref]
  5. Asif F, Ahmad MR, Majid A. (2015) Risk Factors for Thyroid Cancer in Females Using a Logit Model in Lahore, Pakistan. Asian Pacific Journal of Cancer Prevention 16:6243-7. [crossref]
  6. Fortuna-Costa A, Gomes AM, Kozlowski EO, Stelling MP, Pavão MS. (2014) Extracellular Galectin-3 in Tumor Progression and Metastasis. FrontOncol 4:138. [crossref]
  7. Trimboli P, Guidobaldi L, Amendola S, Nasrollah N, Romanelli F, Attanasio D, et al. (2016) Galectin-3 and HBME-1 Improve the Accuracy of Core Biopsy in Indeterminate Thyroid Nodules. Endocrine 52:39-45. [crossref]
  8. Fukumori T, Kanayama H, Raz A. (2007) The Role of Galectin-3 in Cancer Drug Resistance. Drug Resistance Updates 10:101-8. [crossref]
  9. Hirabayashi J, Kasai K. (1993) The Family of Metazoan Metal-Independent Beta-Galactoside-Binding Lectins: Structure, Function and Molecular Evolution. Glycobiology 3:297-304. [crossref]
  10. Dumic J, Dabelic S, Flogel M. (2006) Galectin-3: An Open-Ended Story. Biochimica et Biophysica Acta 1760:616-35. [crossref]
  11. Paron I, Scaloni A, Pines A, Bachi A, Liu FT, Puppin C, Pandolfi M, Ledda L, Di Loreto C, Damante G et al. (2003) Nuclear Localization of Galectin-3 in Transformed Thyroid Cells: A Role in Transcriptional Regulation. Biochemical and Biophysical Research Communications 302:545-53.
  12. Danguy A, Camby I, Kiss R. (2002) Galectins and Cancer. Biochimica et Biophysica Acta 1572:285-93. [crossref]
  13. Van den Brule F, Califice S, Castronovo V. (2004) Expression of Galectins in Cancer: A Critical Review. Glycoconjugate Journal 19:537-42. [crossref]
  14. Johnson KD, Glinskii OV, Mossine VV, Turk JR, Mawhinney TP, Anthony DC, et al. (2007) Galectin-3 As a Potential Therapeutic Target in Tumors Arising from Malignant Endothelia. Neoplasia 9:662- 70. [crossref]
  15. Sawangareetrakul P, Srisomsap C, Chokchaichamnankit D, Svasti J. (2008) Galectin-3 Expression in Human Papillary Thyroid Carcinoma. Cancer Genomics & Proteomics 5:117- 22. [crossref]
  16. Nangia-Makker P, Nakahara S, Hogan V, Raz A. (2007) Galectin-3 in Apoptosis, a Novel Therapeutic Target. Journal of Bioenergetics and Biomembranes 1:79- 84.
  17. Tang W, Huang C, Tang C, Xu J, Wang H. (2016) Galectin-3 may serve as a Potential Marker for Diagnosis and Prognosis in Papillary Thyroid Carcinoma: A Meta-Analysis. OncoTargets and Therapy 9:455–60. [crossref]
  18. Manivannan P, Siddaraju N, Jatiya L, Verma SK. (2012) Role of Pro-Angiogenic Marker Galectin-3 in Follicular Neoplasms of Thyroid. Indian Journal of Biochemistry and Biophysics 49:392–4. [crossref]
  19. Sumana BS, Shashidhar S, Shivarudrappa AS. (2015) Galectin-3 Immunohistochemical Expression in Thyroid Neoplasms. Journal of Clinical and Diagnostic Research 9:EC07–11. [crossref]
  20. Papale F, Cafiero G, Grimaldi A, Marino G, Rosso F, Mian C, Barollo S, Pennelli G, Sorrenti S, De Antoni E, Barbarisi A. (2013) Galectin-3 Expression in Thyroid Fine Needle Cytology (t-FNAC) Uncertain Cases: Validation of Molecular Markers and Technology Innovation. Journal of Cellular Physiology 228:968–74. [crossref]
  21. Salajegheh A, Dolan-Evans E, Sullivan E, Irani S, Rahman MA, Vosgha H, Gopalan V, Smith RA, Lam AK. (2014) The Expression Profiles of the Galectin Gene Family in Primary and Metastatic Papillary Thyroid Carcinoma with Particular Emphasis on Galectin-1 and Galectin-3 Expression. Experimental and Molecular Pathology 96:212–8. [crossref]
  22. Al-Sharaky DR, Younes SF. (2016) Sensitivity and Specificity of Galectin-3 and Glypican-3 in Follicular-Patterned and other Thyroid Neoplasms. Journal of Clinical and Diagnostic Research 10:EC06–10. [crossref]
  23. Yilmaz E, Karsidag T, Tatar C, Tüzün S. (2015) Serum Galectin-3: Diagnostic Value for Papillary Thyroid Carcinoma. Ulus Cerrahi Derg 31:192–6. [crossref]
  24. Paunovic I, Isic T, Havelka M, Tatic S, Cvejic D, Savin S. (2012) Combined Immunohistochemistry for Thyroid Peroxidase, Galectin-3, CK19 and HBME-1 in Differential Diagnosis of Thyroid Tumors. APMIS 120:368–79. [crossref]
  25. Abd-El Raouf SM, Ibrahim TR. (2014) Immunohistochemical Expression of HBME-1 and Galectin-3 in the Differential Diagnosis of Follicular-Derived Thyroid Nodules. Pathology, Research and Practice 210:971–8. [crossref]
  26. Trimboli P, Guidobaldi L, Amendola S, Nasrollah N, Romanelli F, Attanasio D, et al. (2016) Galectin-3 and HBME-1 Improve the Accuracy of Core Biopsy in Indeterminate Thyroid Nodules. Endocrine 52:39–45.
  27. Durry MF, Miskad UA, Leiwakabessy WN, Cangara MH. (2016) Diagnostic Value of Galectin-3 and Hector Battifora Mesothelial Epitope (HBME)-1 as a Marker for Malignancy in the Diagnosis of Thyroid Lesions. Pathology International 48:S122–3.
  28. Das DK, Al-Waheeb SK, George SS, Haji BI, Mallik MK. (2014) Contribution of Immunocytochemical Stainings for galectin-3, CD44, and HBME1 to Fine-Needle Aspiration Cytology Diagnosis of Papillary Thyroid Carcinoma. Diagn Cytopathol 42:498–505.
  29. Bartolazzi A, Gasbarri A, Papotti M, Bussolati G, Lucante T, Khan A, et al. (2001) Application of an Immunodiagnostic Method for Improving Preoperative Diagnosis of Nodular Thyroid Lesions. Lancet 357:1644–50. [crossref]
  30. Herrmann ME, LiVolsi VA, Pasha TL, Roberts SA, Wojcik EM, Baloch ZW. (2002) Immunohistochemical Expression of Galectin-3 in Benign And Malignant Thyroid Lesions. Archives of Pathology & Laboratory Medicine 126:710–13. [crossref]
  31. Zhu X, Sun T, Lu H, Zhou X, Lu Y, Cai X, Zhu X. (2010) Diagnostic Significance of CK19, RET, galectin-3 and HBME-1 Expression for Papillary Thyroid Carcinoma. Journal of Clinical Pathology 63:786-9. [crossref]