Monthly Archives: September 2021

Comparison of Postoperative Opioid Use in Mothers with Neonates in the Neonatal Intensive Care Versus in the Regular Nursery or Rooming In

DOI: 10.31038/IGOJ.2021432

Abstract

Objective: To evaluate if post cesarean section opioid usage is greater for mothers with neonates in the Neonatal Intensive Care Unit (NICU) versus in mothers with neonates in the well born nursery who were encouraged to “room in” with their mothers (WBN).

Methods: This was a retrospective chart review that analyzed 8136 records of women delivering at an urban academic institution. The study period was from January 1, 2013, through December 12, 2018. Daily post-operative opioid usage was assessed. Chi-square analysis was used to evaluate for differences between the groups.

Conclusions: Post-operative mothers with neonates in the NICU did not have greater opioid usage versus those with neonates in the WBN. However, post cesarean section mothers with neonates who required major surgery for life threatening diagnoses had significantly greater opioid usage.

Clinical Trial Registration: “Opioid use by Postpartum Mothers” (s19-01134).

Keywords

Opioid, Postpartum, Neonates, NICU

Introduction

The prevalence of opioid abuse disorder has markedly increased over the past years, having doubled in occurrence between 1988 to 2011 [11]. It has now become a national emergency [2,20] leading to multiple organizations and institutions focusing on with how to prevent, diagnose and treat this crisis [12,20].

Post-operative opioid use presents pain management dilemmas for mothers as it affects their ability to be alert and engaged in order to nurture their newborns. Mothers with neonates in the NICU may have additional stresses and thus desire “round the clock” pain management as opposed to “as needed” as a means to avoid the distractor of postpartum pain.

Although other areas of opioid use have been extensively studied including those at greater risk for substance abuse [1,2,4,7,8,10,11,14,20,30] and provider prescription patterns [14-16,19,22], no research to date has focused on whether there is a difference in postoperative opioid use in women with neonates in the NICU versus the WBN.

The aim of our study is to determine whether neonatal NICU admission poses an additional stressor for post-operative mothers and results in increased use of opioids during this vulnerable period.

Methods

After receiving IRB approval, a retrospective chart review of 8136 women who delivered at an urban academic institution from January 2013-December 2018 was performed. Information regarding daily post-operative opioid use as well as the location of the neonate (NICU versus WBN) was collected. Post-operative opioid usage for mothers with neonates in WBN (Group A) was compared to usage in mothers with neonates in the NICU (Group B). Opioid usage was stratified into 24-hour blocks. Substance abusers and chronic opioid users were excluded.

A subgroup analysis was performed for the indication of the NICU admission. Chi-square was used to analyze the data.

Results

All post-operative patients (n =8136, comprised of 6509 patients in group A [WBN] and 1627 patients in group B [NICU]) were prescribed both opioids and non-narcotic analgesics. Both agents were used by 84% of mothers while 16% used only non-narcotic analgesics. No patients exclusively used opioids alone.

During each 24 hour block, there were no statistically significant differences in opioid usage between the mothers with babies in the NICU versus the WBN (43% vs 45%, Post-Operative Day (POD) 1, 81% vs 80%, POD2, 72% vs 70%, POD3, 20% vs 23%, POD4) (Table 1).

Table 1: Opioid usage between Groups A and B.

Hospital days

Group A (n=6509) Group B (n=1627)

P-value

POD1

 43% (n=2799)

45% (n=732)

0.184

POD2

 81% (n=5272)

80% (n=1302)

0.144

POD3

 72% (n=4686)

70% (n=1139)

0.112

POD4

 20% (n=1302)

23% (n=372)

0.142

Group A: mothers with neonates in the regular nursery.
Group B: Mothers of infants in NICU.

The most common indications for NICU admissions included prematurity (12%), sepsis (4%), and neonates requiring major surgery for life threatening anomalies (3%) while other diagnoses included hypoglycemia, transient tachypnea of newborn, meconium aspiration and observation for other benign conditions represented smaller proportions (Table 2).

Table 2: Indications for admission and Opioid usage in Group B.

POD1

POD2 POD3

POD4

Prematurity

39%(n=76)

79%(n=154) 65%(n=127)

19%(n=37)

12%(n=195)
Sepsis

41%(n=27)

74%(n=48) 67%(n=44)

22%(n=14)

4%(n=65)
Serious problems

58% (n=28)

89%(n=44) 81%(n=40)

32%(n=16)

3%(n=49)
Other

43% (567)

78%(n=1028) 68%(n=896)

21%(n=277)

81%(n=1318)

Other: Hypoglycemia, meconium aspiration, mild respiratory distress, r/o infection

Mothers of NICU neonates (Group B) with life-threatening anomalies and who required corrective surgery (Group B1) had increased opioid usage on POD 1 and 4 when compared to those in Group A; this trend was also seen when compared to mothers whose babies were in the NICU but who did not have life threatening conditions on POD 1-4. (Group B2) (Tables 3 and 4).

Table 3: Opioid usage between Groups A and B1.

Hospital days

Group A (n=6509) Group B1 (n=49)

P-value

POD1

 43% (n=2799)

58% (n=21)

0.004

POD2

 81% (n=5272)

89% (n=44)

0.113

POD3

 72% (n=4686)

81% (n=40)

0.134

POD4

 20% (n=1302)

32% (n=16)

0.027

Group A: mothers with neonates in Well Born Nursery.
Group B1: Mothers of Infants with Serious problems.

Table 4: Opioid usage between Groups B1 and B2.

Hospital days

Group B1 (n=49) Group B2 (n=195)

P-value

POD1

 58% (n=21)

39% (n=76)

0.0215

POD2

 89% (n=44)

79% (n=154)

0.0833

POD3

81% (n=40)

65% (n=127)

0.026

POD4

32% (n=16)

19% (n=37)

0.0379

Group B1: Mothers of Infants with Serious problems.
Group B2: Mothers of infant’s prematurity.

At the time of discharge, all mothers received a prescription for narcotics, regardless of their choice of analgesics during the hospitalization, i.e. combinations of narcotics and non-narcotics, or only non-narcotics.

Discussion

Opioid use often starts with the treatment of acute pain [6,10,12] and it has been well documented that a single exposure can lead to persistent dependence [19]. For many women, their first exposure to opioids follows childbirth. Approximately 1 in 10 women suffer severe postpartum pain within the first 36 hours after delivery. Opioids are generally the mainstay of treatment at this time [14]. Multiple studies have documented inpatient use of opioids rates up to 58% for vaginal deliveries and 100% for cesarean sections [22] with 24% of patients continuing to use opioids even in the last 24 hours of hospitalization [2].

As many patients’ first exposure to opioids likely occurs during the post-operative period, our study sought to better understand opioid use in mothers who would be expected to undergo additional stresses due to their neonates being separated from their babies while admitted to the NICU. Interestingly, we did not find that these mothers had increased post-operative narcotic usage unless they were in the small subgroup of women whose babies were undergoing surgery for life threatening conditions.

Strengths of our study included the large sample size from a single academic institution with an existing standardized postpartum order set. Limitations of our study include lack of analysis of opioid use for women whose babies were briefly in the NICU but were transferred to the well-baby nursery or roomed in prior to mother’s discharge as well as an overall small sample size of mothers with neonates with “life threating” issues.

Conclusion

To our knowledge, this is the first study focusing on comparison of opioid use in mothers with neonates in the NICU versus in the newborn nursery or rooming in. This study illustrates that despite the perceived greater stresses of being separated from their neonates, only those mothers whose neonates had severe life-threatening conditions needing corrective surgery used more opioids on a “round the clock” basis. Given the findings that all patients received a narcotic prescription at discharge, even though 16 % had never used a narcotic during the hospitalization, further attention should be paid towards avoiding arbitrary prescribing narcotics in these circumstances. These findings should inform post-operative pain management plans in that mother whose babies are in the NICU may not require additional narcotics unless the neonates are undergoing corrective surgery for life threatening conditions. In addition, if mothers of neonates admitted to the NICU have not utilized narcotic prescriptions during the post-operative period they should not receive such prescriptions at discharge, as this will help to avoid the occurrence of chronic substance abuse.

References

  1. Ailes EC, Dawson AL, Lind JN, Gilboa SM, Frey MT, et al. (2015) Centers for Disease Control and Prevention (CDC). Opioid prescription claims among women of reproductive age–United States, 2008-2012. MMWR Morb Mortal Wkly Rep 64: 37-41. [crossref]
  2. Badreldin N, Grobman WA, Yee LM (2018) Inpatient opioid use after vaginal delivery. Am J Obstet Gynecol 219: 608.e1-608.e7. [crossref]
  3. Baker DW (2017) History of the Joint Commission’s Pain Standards: Lessons for Today’s Prescription Opioid Epidemic. JAMA 317: 1117-1118. [crossref]
  4. Bateman BT, Franklin JM, Bykov K, Avorn J, Shrank WH, et al. (2016) Persistent opioid use following cesarean delivery: patterns and predictors among opioid-naïve women. Am J Obstet Gynecol 215: 353.e1-353.e18. [crossref]
  5. Becker NV, Gibbins KJ, Perrone J, Maughan BC (2018) Geographic variation in postpartum prescription opioid use: Opportunities to improve maternal safety. Drug Alcohol Depend 188: 288-294. [crossref]
  6. Carvalho B, Butwick AJ (2017) Postcesarean delivery analgesia. Best Pract Res Clin Anaesthesiol 31: 69-79. [crossref]
  7. Centers for Disease Control and Prevention (CDC) (2010) Adult use of prescription opioid pain medications – Utah, 2008. MMWR Morb Mortal Wkly Rep 59: 153-157. [crossref]
  8. Deyo RA, Hallvik SE, Hildebran C, Marino M, Dexter E, et al. (2017) Association Between Initial Opioid Prescribing Patterns and Subsequent Long-Term Use Among Opioid-Naïve Patients: A Statewide Retrospective Cohort Study. J Gen Intern Med 32: 21-27. [crossref]
  9. Ko JY, Tong VT, Haight SC, Terplan M, Snead C, et al. (2020) Obstetrician-gynecologists’ practice patterns related to opioid use during pregnancy and postpartum-United States, 2017. J Perinatol 40: 412-421. [crossref]
  10. Komatsu R, Ando K, Flood PD (2020) Factors associated with persistent pain after childbirth: a narrative review. Br J Anaesth 124: e117-e130. [crossref]
  11. Maeda A, Bateman BT, Clancy CR, Creanga AA, Leffert LR (2014) Opioid abuse and dependence during pregnancy: temporal trends and obstetrical outcomes. Anesthesiology 121: 1158-1165. [crossref]
  12. Mills JR, Huizinga MM, Robinson SB, Lamprecht L, Handler A, et al. (2019) Draft Opioid-Prescribing Guidelines for Uncomplicated Normal Spontaneous Vaginal Birth. Obstet Gynecol 133: 81-90. [crossref]
  13. Nørgaard M, Nielsson MS, Heide-Jørgensen U (2015) Birth and Neonatal Outcomes Following Opioid Use in Pregnancy: A Danish Population-Based Study. Subst Abuse 9: 5-11. [crossref]
  14. Osmundson SS, Min JY, Grijalva CG (2019) Opioid prescribing after childbirth: overprescribing and chronic use. Curr Opin Obstet Gynecol 31: 83-89. [crossref]
  15. Osmundson SS, Raymond BL, Kook BT, Lam L, Thompson EB, et al. (2018) Individualized Compared With Standard Postdischarge Oxycodone Prescribing After Cesarean Birth: A Randomized Controlled Trial. Obstet Gynecol 132: 624-630. [crossref]
  16. Osmundson SS, Wiese AD, Min JY, Hawley RE, Patrick SW, et al. (2019) Delivery type, opioid prescribing, and the risk of persistent opioid use after delivery. Am J Obstet Gynecol 220: 405-407. [crossref]
  17. Patrick SW, Schumacher RE, Benneyworth BD, Krans EE, McAllister JM, et al. (2012) Neonatal abstinence syndrome and associated health care expenditures: United States, 2000-2009. JAMA 307: 1934-1940. [crossref]
  18. Porter J, Jick H (1980) Addiction rare in patients treated with narcotics. N Engl J Med 302: 123. [crossref]
  19. Rogers RG, Nix M, Chipman Z, Breen M, Dieterichs C, et al. (2019) Decreasing Opioid Use Postpartum: A Quality Improvement Initiative. Obstet Gynecol 134: 932-940. [crossref]
  20. Shah A, Hayes CJ, Martin BC (2017) Characteristics of Initial Prescription Episodes and Likelihood of Long-Term Opioid Use – United States, 2006-2015. MMWR Morb Mortal Wkly Rep 66: 265-269. [crossref]
  21. Tobon AL, Habecker E, Forray A (2019) Opioid Use in Pregnancy. Curr Psychiatry Rep 21: 118. [crossref]
  22. Sanchez Traun KB, Schauberger CW, Ramirez LD, Jones CW, Lindberg AF, et al. (2019) Opioid prescribing trends in postpartum women: a multicenter study. Am J Obstet Gynecol MFM 1: 100055. [crossref]

Rivaroxaban Failure in a SARS-CoV-2 (COVID-19) Positive Patient

DOI: 10.31038/JPPR.2021433

Introduction

Atrial fibrillation is the most common sustained arrhythmia in clinical practice. Patients with atrial fibrillation are at increased risk of hospitalization, death, heart failure, and thromboembolic event [1]. Development and embolization of thrombus can occur with atrial fibrillation. Ischemic stroke is most common location of embolization of thrombus, although it can embolize to other locations [2]. Chronic oral anticoagulation is recommended in most of the valvular and non-valvular atrial fibrillation and should be started after careful consideration for embolic risk, bleeding risk and overall risks verses benefit should be assessed. Novel anticoagulants (NOAC) such as rivaroxaban, apixaban, dabigatran is recommended and are being increasingly used over warfarin for patients with non-valvular atrial fibrillation [3].

Case Presentation

This patient is an 85-year old female with an extensive past medical history of atrial fibrillation on rivaroxaban, breast cancer status post-mastectomy, dementia and hypertension presented to the ED from an assisted living facility with slurring of speech that started about 4 hours prior to presentation associated with confusion. Upon arrival to the emergency department, she was saturating 97% on room air and later required 2L nasal cannula to maintain oxygenation above 92%, heart rate of 70 beats per minute with an irregular rhythm, blood pressure of 147/63 mmHg was noted. On physical examination, she was alert, oriented to person and place but not time. She was not in any acute respiratory distress. Dry oral mucosa was noted. Lungs were clear to auscultation and S1 and S2 were heard. National Institute of health and stroke scale (NIHSS) score was 4 with not answering any questions scoring 2, dysarthria as 1, and right finger to nose dysmetria of 1. Cranial nerves and reflexes were grossly intact. Code stroke was activated, and the patient was immediately taken for a non-contrast Computer tomography (CT) scan of the head which revealed chronic microvascular and atrophic changes. Computer Tomography Angiography (CTA) was unable to be performed due to the infiltration of IV during the scan. The patient was deemed not a candidate for tissue plasminogen activator because she was out of the therapeutic window and no neurosurgical intervention was indicated because the patient was already on anticoagulation with rivaroxaban. Her white blood cell count was 14 K/CMM with no neutrophilia or bands, Prothrombin time was 16 and the International normalized ratio (INR) was 1.4. Blood chemistry was within normal limits. Urinalysis was negative for leukocyte esterase or nitrites but positive for (+) 5700 bacteria. SARS-COV-2 PCR assay was positive. The patient was subsequently admitted to the medical floor. She was treated with ceftriaxone for 5 days for UTI. Magnetic Resonance Angiogram (MRA) of the brain revealed acute infarction of the left corona radiata and right frontal white matter. She was shifted from rivaroxaban to apixaban therapeutic dose for secondary prevention of stroke. Further hospital course remained uneventful and the patient was discharged back to assisted living. Follow-up after 2 months via phone call revealed that patient had no further episodes of stroke and her speech abnormality via therapy was gradually improving.

Discussion

Coronavirus (SARS-CoV-2) is a global health emergency affecting 33 million population with more than 1 miilion deaths. Despite rapidly growing literature on COVID-19 inducing clinical pro-coagulant effect causing arterial and venous thromboembolism [4], exact pathophysiology of derangements in hemostatic system is not well elucidated. There is no evidence of intrinsic procoagulant effect of SARS-CoV-2. Most reasonable hypothesis is the inflammatory cascade activating coagulation pathway, similar to that observed in sepsis [5]. The mechanism of rivaroxaban failure in COVID positive patients is not well understood. Mechanism of action of rivaroxaban is dose dependent and compliance of medication, especially taken with food is increases the bio-availability especially at higher doses [6]. This patient was compliant with the medication and it was confirmed with the assisted living facility staff. Rivaroxaban is a competitive inhibitor of factor Xa, it binds directly and reversibly to factor Xa. It is metabolized through hepatic cytochrome system via CYP 3A4/5 and CYP2J2. One of the proposed mechanisms of rivaroxaban failure is coadministration of cytochrome inducers and thus reducing the bioavailability of the medication, resulting in treatment failure [7]. Mechanism of rivaroxaban failure in SARS CoV-2 is not well understood. There has been studies which has proved the apixaban is more effective in prevention of stroke in patients with atrial fibrillation [8]. Lack of laboratory availability to quantitatively measure rivaroxaban levels makes it difficult to determine the efficacy in this patient. Further research is required to develop a standard laboratory marker as either drug level or coagulation profile to identify the therapeutic level of the drug. There are no definite guidelines for treatment of patients with novel anticoagulation failure, further research is required to assess if switching to a different NOACs or different class of anticoagulation such as warfarin would be beneficial.

Conclusion

Rivaroxaban failure in patients with atrial fibrillation and COVID-19 positive should be recognized. Apixaban can be used as an alternative for secondary prevention of stroke.

Financial Support and Sponsorship

Nil

Conflict of Interest

None declared.

References

  1. Benjamin EJ, Wolf PA, D’Agostino RB, Silbershatz H, Kannel WB, et al. (1998) Impact of atrial fibrillation on the risk of death: the Framingham Heart Study. Circulation. 98: 946-952. [crossref]
  2. Wolf P A, Abbott R D, Kannel W B (1991) Atrial fibrillation as an independent risk factor for stroke: the Framingham Study. Stroke 22: 983-988. [crossref]
  3. Heidbuchel H, Verhamme P, Alings M, Antz M, Diener H-C, et al. (2015) Updated European Heart Rhythm Association Practical Guide on the use of non-vitamin K antagonist anticoagulants in patients with non-valvular atrial fibrillation. Europace 17:1467-1507. [crossref]
  4. Bikdeli B, Madhavan MV, Jimenez D, Chuich T, Dreyfus I, et al. (2020) COVID-19 and Thrombotic or Thromboembolic Disease: Implications for Prevention, Antithrombotic Therapy, and Follow-Up: JACC State-of-the-Art Review. Journal of the American College of Cardiology. 75: 2950-2973. [crossref]
  5. Iba T, Levy JH (2018) Inflammation and thrombosis: roles of neutrophils, platelets and endothelial cells and their interactions in thrombus formation during sepsis. Journal of Thrombosis and Haemostasis. 16: 231-241. [crossref]
  6. J S, D K, M B, W M (2013) The effect of food on the absorption and pharmacokinetics of rivaroxaban. Int J Clin Pharmacol Ther. 51: 549-561. [crossref]
  7. Kaur J, Rizvi S, Tewari P, Tamer S, Nafsi T (2016) Rivaroxaban Treatment Failure From Possible Drug Interaction: A Case Report. CHEST 149.
  8. Fralick M, Colacci M, Schneeweiss S, Huybrechts KF, Lin KJ, et al. (2020) Effectiveness and Safety of Apixaban Compared With Rivaroxaban for Patients With Atrial Fibrillation in Routine Practice. Annals of Internal Medicine. 172: 463-473. [crossref]
fig 1i

An End of the COVID-19 Pandemic in Sight?

DOI: 10.31038/IDT.2021222

Abstract

We have set out to assess the data on the intensity of the COVID-19 pandemic with a view to making plausible predictions of its decline. A plot of “% COVID-19 Associated Death per Day” versus the timing and extent of the roll out of national vaccination campaigns in Sweden, Denmark, Netherlands, United Kingdom, France, Germany, Italy and USA shows that the decline in the severity of the COVID-19 pandemic was well advanced noticeably before vaccinations began or could have become a significant contributory factor. Israel is an outlier in its manifest decline pattern, yet the data also demonstrate that vaccination has had no discernible impact at all on % Deaths per Day in Israel.

Human societies throughout recorded history have been ravaged by suddenly appearing regional epidemics and in more recent centuries by epidemics that have been observed to spread globally [1,2]. The COVID-19 pandemic caused by coronavirus SARS-CoV-2 has caused serious global health emergencies and associated social and economic destruction on the citizens of many countries on a hitherto unprecedented scale. The disease emerged suddenly in Oct-Nov 2019 in Hubei region of Central China [3].

Pandemics as always emerge without any warning, cause their toll havoc and then predictably subside. They usually last in a severe form no more than a few years – as the data relating to the “Spanish Flu” of 1918-1919 clearly attests. The termination process of pandemics is not clearly understood, but it is generally assumed to be a combination of herd immunity, attenuation of the pathogen (leading to ill-defined mechanisms of endemicity) and its degradation in the physical environment. Thus, there are likely to be a wide range of factors in varying from country to country that contributes to the decline in disease severity and eventual its disappearance. We have attempted in this note to quantitatively measure the progress of the COVID-19 pandemic in a number of Northern Hemisphere countries from available public data from the time of its onset to the present day (August, 2021). We chose “% COVID-19 Associated Death per Day” as an objective end-point of the measure of severity of SARS-Co-V-2 induced disease. Such an index may reasonably allow a comparison across countries over and above country specific variable factors such as country-and region-specific technical and demographic variations in the application of the diagnostic PCR genomic test as a primary indicator of infection.

We report here a simple observation on the current status of the COVID-19 pandemic (as 15 Aug 2021) that could have a bearing on the timing of the likely end of the pandemic. We chose two straightforward metrics from data that are publicly available at Coronavirus websites (see Source Data URL links below). We selected those countries where much new Cases per Day data are available and where the Vaccination Campaign is ostensibly substantially advanced. The Cases (and Deaths) per Day by Country are at Google: Search “Coronavirus disease statistics”. Vaccination Rates by Country are Google Search “COVID-19 vaccination rates by country”. We largely chose key time points associated with the clear successive rolling epidemic peaks of new Cases per Day in each country. We then assumed a 14-day lag at that time point before the severe COVID-19 outcome of “Death” as an objective response rate (ORR) metric. These key time-point data were entered into an Excel spread sheet and primary graphic plots were developed for each country, and resulting figure of % Death per day versus % Population Vaccinated generated by standard Excel software. These primary plots were then adjusted for scale (mainly on the Y-axis for % Vaccination rate in that country) to allow a visual comparison with the % COVID-19 associated Death rate per Day at that time point.

Thus, the reference date along the X-axis in the summary country plots in Figure 1 (below) refers to the time point for new Cases per Day. The reader can draw their own conclusions but a clear trend is evident in all the data – the decline in % COVID-19 associated reported deaths was manifestly well advanced before the roll out of the intra-muscular mRNA expression vector vaccine program was begun or had become substantially advanced (e.g. significant in impact, say >20% population vaccinated). The USA is a vast country and its data may need to be analyzed State-by-State for granular trends in localized regions to become better apparent-like the countries of Europe chosen here. Israel is also a clear outlier in the basic trend – as that country did not suffer the same levels of % COVID-19 associated deaths as the others, even in the first wave in March-April 2020. However, the vaccination program on the basis of this data appears to have had no discernible impact at all on % Deaths in Israel. In many cases the waning of the death rates are seen to have progressed before the vaccination rates rose to substantial levels, probably pointing to the development of natural herd immunity as the most reasonable principal cause.

fig 1a

fig 1b

fig 1c

fig 1d

fig 1e

fig 1f

fig 1g

fig 1h

fig 1i

Figure 1: %COVID-19 Deaths per Day versus % Full Vaccination by Country at key times during the epidemic waves.

We refrain from further discussion of the many likely factors and variables that would need to be considered in a more exhaustive analysis. To conclude we leave the reader with two crucially important questions that urgently need to be dispassionately addressed. What do these plots mean for possibly heralding the termination of the pandemic? Is the long-awaited end really in sight across the world in mid-August 2021? And does a new world order beckon?

Source Data

COVID-19 Cases per Day, Deaths, Vaccination Rates 15 August 2021

Cases and Deaths per Day site.

Google: “Coronavirus disease statistics” URL is

shorturl.at/cdQS9

This gives you the “Australia” dashboard (from there you can choose your country in the menu bar scroll)

Vaccination Rates by Country Google “covid-19 vaccination rates by country”

shorturl.at/oFJS4

This gives you the “Australia” dashboard (from there you can choose your country in the menu bar scroll).

References

  1. Creighton C (1891) History of Epidemics in Great Britain. Cambridge University Press.
  2. Beveridge WIB (1977) The Last Great Plague. W. Heinemann, London.
  3. Pekar J, Worobey M, Moshiri N, Scheffler K, Wertheim JO (2021) Timing the SARS-CoV-2 index case in Hubei province. Science 372: 412-417.
fig 1

Hydatid Disease during Pregnancy, the Challenging Management: Case Report and Review of Literature

DOI: 10.31038/IGOJ.2021431

Abstract

Human echinococcosis is a parasitic infestation of human by a tapeworm called Echinococcus granulosus. It can affect pregnant women at a low incidence. Mainly asymptomatic, it has a variety of presentations. Its main location is in the liver. Hydatid disease requires multidisciplinary care especially in pregnant patients. It can be treated medically or surgically according to each case.

We present a case of 27-year-old woman, G4 P3 with three previous cesarean sections, known to have hydatid cyst disease, presenting at 32 weeks of gestation, complaining of intermittent crampy right upper quadrant abdominal pain. Abdominal ultrasound done at 11 weeks of gestation, showed hepatomegaly along with a 9 cm × 6 cm mass suggestive of hydatid cyst that was followed by ultrasounds frequently. The patient was followed by a multidisciplinary team when she was then started on Albendazol 400 mg twice daily starting 32 weeks until delivery, then for two days post operatively. She did well and was discharged home in good condition.

Hydatid disease has a special consideration when associated with pregnancy. Many cases have been reported in literature yet only few reviews of literature and one meta-analysis have been reported. Management decision is quite meticulous. It depends on cystic nature and activity on one side and on the clinical picture of the patient on the other side. In all cases, cesarean section is advised. In spite of all recommendations, further prospective studies using larger samples are needed for clear-cut algorithmic guidelines for hydatid disease management in pregnancy.

Introduction

Human echinococcosis, or hydatid disease, also known as “cyst full of water” as described by Hippocrates, is a parasitic infestation of human by a tapeworm called Echinococcus granulosus [1-4]. This disease can be seen in all population including pregnant women [5,6]. Despite that, it is currently classified among the most neglected parasitic disease [1,5]. Hydatid cyst has a variety of presentations. It may remain asymptomatic for many years and may be discovered incidentally by radiography [3,4]. The most common site of hydatid cyst is the liver [4,6]. It might be found also in any part of the body including lungs, bones and soft tissues [3,5,7]. Hydatid cyst in pregnancy is rare, and usually affects the liver [3,6]. Its diagnosis in pregnancy might not be difficult, but the management is problematic [4]. It requires multidisciplinary care [2]. Both medical and surgical treatment are available but each case should be individualized due to the limited experience, lack of standardized consensus and paucity of information in the literature as only data from case reports are available [6]. For that, obstetricians should be more aware of the clinical features, diagnosis and treatment of this unusual disease [2].

Here we present a case of a pregnant woman with a huge liver hydatid disease.

Case Presentation

A 27-year-old woman G4 P3 with previous three cesarean sections, known to have hydatid cyst disease, presented to the outpatient department at 32 weeks of gestation with an intermittent crampy right upper quadrant abdominal pain, not related to oral intake, not relieved by any position, and not associated with any nausea or vomiting, anorexia, jaundice, or pruritis. She was diagnosed recently with recurrent hydatid cyst disease during pregnancy, for which she was referred to “high risk pregnancies clinic” [8-10].

Her history of hydatid disease goes back to her second pregnancy, at 6 weeks gestational age; when she underwent a laparotomy for excision of hepatic hydatid cyst, after which she didn’t receive any medical treatment. Four years later, the patient had recurrent disease which was managed by cystectomy in segments IV and VII of the liver in addition to lung cystectomy. Post operatively, the patient received Albendazole that was continued for 2 months.

Beside the hydatid disease, she was having a smooth course of pregnancy. During this pregnancy the patient was followed at an outside clinic, where serology of Echinococcus granulosus (IgG and IgM) was requested in the first trimester and came back negative. Serial abdominal ultrasounds were done. The first one, done at 11 weeks of gestation, showed a 9 cm × 6 cm lobulated cystic formation at the level of segment IV of the liver and having small wall calcifications. Repeated at 13+6 weeks of gestation, it showed: two contiguous lobulated cystic structures, at the level of the dome of the liver. The first cyst in segment VIII was extending to segment IV: 3.4 cm in transverse diameter, demonstrating peripheral hyperechoic rim that was not associated with post attenuation and most likely not corresponding to calcification. In addition, hyperechoic content was identified in the first cyst corresponding to post enhancement. It was concluded that the hyperechoic content could represent hydatid sand, and thus, this cystic structure in the context of hydatid disease was classified as CE1 according to WHO classification. The presence of a larger cyst with lobulated contours in segment VII and VIII was also noted measuring 6.5 cm × 6.5 cm with identification of anechoic content and few septations in the periphery particularly at its posterior aspect. The clear pattern of daughter cyst could not be identified thus a CE2 cyst couldn’t be suggested with certainty. The third US, done at 22 weeks of gestation, showed that the largest cyst previously seen in segment VIII was stable in size, demonstrating internal septations with identification of daughter cyst-like structures posteriorly. Moreover, when compared to previous report, the other lobulated cyst in segment VIII and IV having lobulated contours increased in size to 5 × 3.4 cm (compared to 3.4 × 3.2 cm). It was still showing a sand-like hyperechoic content, and demonstrating peripheral hyperechoic rim with posterior enhancement. The liver was enlarged to 17 cm in size.

Upon presentation, the patient had unremarkable vital signs. Her physical exam was limited due to obesity. It showed, however, right subcostal incision scar upon inspection, hepatomegaly with dullness but soft and non-tender abdomen.

The case was discussed by the multidisciplinary team members including the obstetrician, the maternal medicine, and the infectious diseases specialists. A decision to start Albendazol 400 mg twice daily till delivery (for three) weeks, was taken. Abdominal ultrasound was repeated just before cesarean section that showed three liver hydatid cysts, one of them decreasing in size from 6 cm to 5 cm, and two other stable cysts of 3 cm. Nevertheless, we couldn’t confirm if the cysts are stable or in active phase. There was no indication to operate those cysts at the time of C-section.

The patient continued medical treatment till cesarean delivery scheduled at 37 weeks; and for two days post operatively. She was did well post op and was discharged home on day two postop. The patient was seen one-week thereafter and was doing well. She continued to be followed by ID team and was planned to repeat abdominal US 6 months after delivery.

Discussion

As previously mentioned hydatid cyst disease is a parasitic infestation by a tapeworm most commonly by Echinococcus granulosus [10-15]. Contaminated food and water by feces of definitive infective host or poor hygiene in infestation areas are the main roots of exposure. The occurrence of this disease in pregnancy is low with a prevalence of 1/20,000 to 1/30,000.

Hydatid disease is mostly asymptomatic [10] but affected individuals can present with abdominal pain, abdominal mass or vague abdominal symptoms [11,14] which may mimic the usual symptoms occurring in pregnancy.

It is important to note that blood tests are nonspecific. Many serologic tests are available mainly IgG ELISA test and Indirect Hemagglutination Test [10,14], yet negative tests cannot rule out the disease.

Ultrasound is the primary diagnostic imaging tool. However, it cannot distinguish a benign cystic form from an abscess [9,11]. CT scan is the best imaging modality, being able to determine accurately the anatomical location and assess other [9,11,14].

There are five subtypes of cystic echinococcosis according to the WHO and Gharbi classification systems (Table 1).

Table 1: WHO and Gabri classification system for cystic echinococcosis cysts.

WHO-IWGE 2001

Gharbi 1981 Description

Stage

CE1 Type I Unilocular unechoic cystic lesion with double line sign Active
CE2 Type III Multiseptated, “rpsette-like” “honeycomb cyst Active
CE3 A Type II Cyst with detached membranes (water-lily-sign) Transitional
CE3 B Type III Cyst with daughter cysts in solid matrix Transitional
CE4 Type IV Cyst with heterogenous hypoechoic/hyperechoic contents. No daughter cysts Inactive
CE5 Type V Solid cyst with calcified wall Inactive

There are three management modalities depending on the activity of the cyst [11]. The first one is the surgical management requires opening the cyst, injecting a solicidal agent, evacuating the cyst and pericystectomy. It is best used for ruptured cysts, cysts with biliary fistulae, cysts compressing vital structures, cysts with secondary infection or hemorrhage, or cysts with multiple daughter cysts [11,14]. Other indications include cysts larger than 10 centimeters and superficial cysts which carry a risk of rupture [14]. Preoperative and postoperative use of Albendazole decreases the viability of cysts at the time of surgery and significantly reduces the chances of cyst recurrence. Albendazole for three 28-day courses of 10 mg/kg/day in divided doses separated by 2-week intervals post operatively is usually used [11-14]. Surgical management carries 2-25% risk of recurrence.

The second therapeutic modality is the percutaneous treatment is based on destroying the germinal layer with a solicidal agent, a process that requires puncture, aspiration, injection and reaspiration [11,14]. This method is done under CT or ultrasound guidance for CE1 and CE3-A cysts which do not contain daughter cysts [11,14]. It is avoided in complicated or superficial cysts due to the risk of rupture [11]. The last modality is the medical treatment based on Albendazole administration.

Hydatid disease has a special consideration when associated with pregnancy. Many cases have been reported in literature yet only few reviews of literature and one meta-analysis have been reported.

Hydatid disease in pregnancy is a rare condition occurring in parts of the world. It is usually diagnosed incidentally during an obstetrical ultrasound [8].

A pregnant patient may complain of abdominal discomfort and pain in the right upper quadrant area. In large cysts cases, nausea, vomiting and early satiety may be felt due to a mass effect [8].

The main challenge in pregnancy is in regards to treatment modality which is affected by cyst classification. Types 1 and 2 are usually treated by ultrasound guided percutaneous aspiration [8]. Types 3 and 4, with the exception of calcified cysts are mainly surgically treated [8]. However, due to scarcity of data, there is no standardized approach. Below, an algorithm will be stated for managing hydatid disease in pregnancy based on the only meta-analysis published on 2018 (Figure 1) [8].

fig 1

Figure 1: Approach and treatment algorithm for pregnancy complicated with Hidatid disease. HD Hydatid Disease; b HCG beta-human chorionic gonadotropin;*Ultrasound-based classification of cyst hydatid according to Gharbi et al.; PAIR percutaneous aspiration irrigation and re-aspiration (8).
Celik, S. et al. Archives of Gynecology and Obstetrics 298 (2018): 103-110.

The main medical therapy for echinococcal cysts is based on Benzimidazole, namely Albendazole. It acts on inhibiting glucose uptake by the parasite, thus generating metabolic and structural alteration leading to parasitic death. It is categorized as category C by the FDA [8]. Thus, it is not recommended for use in first trimester [8,14], yet it can be used afterwards.

According to Celik et al. a thin walled, large, peripherally located cyst in the liver is more likely to rupture than a small, centrally located cyst. Therefore, women with cysts characterized as at high risk of rupture should be referred at some point for intervention (surgery or PAIR) [8]. If no intervention is to be performed, then delivery by cesarean section is preferred. In optimal condition, a monthly close follow up is recommended. If conditions are worsened, intervention is considered after 20-24 weeks of gestation to allow for fetal maturation [8].

Concerning our patient, she started Albendazole 400 mg per os twice daily three weeks before her scheduled repeat cesarean section at 37 weeks of gestation. Her repeat ultrasound showed three cysts, one cyst decreased in size from 6 to 5 centimeters, the other two cysts were stable in size at 3 centimeters, yet nature could not be confirmed. Plan was to omit hydatid cystectomy due to stability of the patient and to continue same dose of Albendazole till delivery. She had smooth cesarean delivery and medical management was stopped two days after delivery. The patient did not manifest any symptoms afterwards.

Conclusion

In conclusion, hydatid disease is rarely combined with pregnancy. It can be primarily manifested incidentally on obstetrical ultrasound or due to abdominal pain from compression of a gravid uterus. It poses a challenge in regards to management during pregnancy. There are three modalities of management. Medical therapy using Albendazole is advised following the first trimester [8,14] either alone for stable, deep cysts or for those decreasing in size, or in conjunction with intervention aiming to shrink the mass. Percutaneous treatment is used mainly for cysts which do not have daughter cysts. Finally, surgical excision is reserved for ruptured cysts, cysts with biliary fistulae, cysts compressing vital structures, cysts with secondary infection or hemorrhage, or cysts with multiple daughter cysts. Management decision is quite meticulous. It depends on cystic nature and activity and on the stability of the patient. In all cases, cesarean section is advised [8]. In spite of all recommendations, further prospective studies are needed to put clear-cut algorithmic guidelines for hydatid disease management in pregnancy.

References

  1. Ahmed Al-Ani, Abdul-Naser Elzouki, Rashid Mazhar (2013) An Imported Case of Echinococcosis in a Pregnant Lady with Unusual Presentation. Case Reports in Infectious Diseases 2013: 753-848. [crossref]
  2. Thompson A, Chiodini PL, Stewart F (2012) Hydatid liver cyst in pregnancy: a case report. British Medical Journal 97: A65.
  3. Anandita, Shweta, Bhardwaj S, Sehra A (2015) Pregnancy with Hydatid Cyst of Liver. JCR 5: 542-545.
  4. Ghosh JK, Goyal SK, Behera MK, Dixit VK, Jain AK (2014) Hydatid Cyst of Liver Presented as Obstructive Jaundice in Pregnancy; Managed by PAIR. Journal of clinical and experimental Hepatology 4: 366-369. [crossref]
  5. Maria A Grácio, António J Santos Grácio (2019) Hydatid Disease and Pregnancy: A Short Note. Integr Gyn Obstet J 2: 1-2.
  6. Akbaş A, Daşıran F, Dagmura H, Daldal E, Özsoy Z, et al. (2019) Primary hydatid cyst localized in soft tissue during pregnancy. J Surg Case Rep 2019: rjy324.
  7. Ünalp H, Aydin Ç, Yavuzcan A, et al. (2008) Surgical treatment of hepatic hydatic disease during pregnancy: report of two cases. Gynecol Surg 5: 243-245.
  8. Celik S, Okyay O, Karaman E, Sert ÖZ, Cim N, et al. (2018) Analysis of factors affecting outcomes of pregnancy complicated by Echinococcus: an algorithm for approach and management. Arch Gynecol Obstet 298: 103-110. [crossref]
  9. Pedrosa I, Saíz A, Arrazola J, Ferreirós J, Pedrosa C (2000) Hydatid Disease: Radiologic and Pathologic Features and Complications. Hydatid Disease: Radiologic and Pathologic Features and Complications, The Journal of continuing medical education in radiology 20: 795-817. [crossref]
  10. Cennet O, Tirnaksiz MB, Dogrul A, Abbasoglu O (2019) Surgical treatment of cyst hydatid disease of the liver in the era of percutaneous treatment, HPB 21: S568eS676.
  11. Sozuer E, Akyuz M, Akbulut S (2014) Open surgery for hepatic hydatid disease. Int Surg 99: 764-769. [crossref]
  12. Shams-Ul-Bari, Arif SH, Malik AA, Khaja AR, Dass TA, et al. (2011) Role of albendazole in the management of hydatid cyst liver. Saudi J Gastroenterol 17: 343-347. [crossref]
  13. Horton RJ (1989) Chemotherapy of Echinococcus infection in man with albendazole. Trans R Soc Trop Med Hyg 83: 97-102. [crossref]
  14. Dandan I, Soweid A, Abiad F (2019) Hydatid Cysts. Medscape.
  15. Pedro M (2019) Clinical Manifestations and Diagnosis of Echinococcus.

Automated Hand Hygiene Monitoring Systems: Current Issues, Developments and Perceived Benefits

DOI: 10.31038/MIP.2021214

Abstract

Healthcare-Associated Infections (HCAIs) are among the leading causes of death in the United States affecting about one in every 20 hospitalised patients [1]. Furthermore, at least 50% of these infections are preventable [2]. Healthcare Workers (HCWs) practicing good Hand Hygiene (HH) is fundamental to preventing HCAI transmission, as HH compliance and HCAI rates are closely linked [3]. Though this association is well established, maintaining high levels of HH compliance is a perennial problem in all healthcare settings. When independently audited, HH compliance has been shown to be in the region of 50% at best [4]. Compliance is particularly poor when staff are busy and experiencing burnout [5] which has been mirrored in a recent report that found hospital transmission of COVID-19 accounted for 20-25% of cases [6]. Stressed and overworked HCWs perform less HH, thereby inadvertently increasing the risk of COVID-19 transmission and other HCAIs. Simply blaming HCWs is not the answer. Though maintaining adequate patient to staff ratios is essential, providing staff with unbiased and opportunistic feedback on their HH practice is also key to mitigating HCAI risk.

Accurately monitoring HH compliance is an important quality improvement and patient safety control strategy. Good HH compliance should be rewarded and celebrated. Equally, areas for improvement must be identified and educational resources allocated accordingly. The World Health Organisation (WHO) currently recommends that the gold standard for monitoring HH is by direct observation (DO) of HCWs using trained, independent auditors. In its technical manual, the WHO provides detailed guidance on the audit process stressing the value of immediate personalised feedback to HCWs [7]. Whilst DO is widely accessible and requires minimal financial investment, it is labour intensive and yet only produces small quantities of data [8]. A plethora of evidence demonstrates that the quality of DO data is impeded by the Hawthorne effect as well as observer and selection bias [9]. It has been estimated that the full hand hygiene audit cycle, including data input and feedback, can cost £28,800 per year in staff time using DO [10]. This could be considered a high price to pay for low quality data that ultimately gives Infection Prevention and Control (IPC) teams an unclear picture of the HCAI risk in their organisation. Whilst these issues are widely acknowledged in the IPC community, HCWs are also cognisant of the problems with DO. A survey conducted in 2020 found that 58% of 1,120 staff questioned did not strongly endorse DO as a method of monitoring HH [11]. “The Hawthorne Effect” was cited by HCWs as one of the reasons for not trusting HH data presented to them [11]. However, the same respondents were open to the introduction of innovative HH technologies. Though staff attitudes to new HH monitoring technologies have not always been reported to be so positive, other surveys have typically involved very small staff numbers and have not represented all staff groups [12,13]. Staff does appear to recognise that they change their HH behaviour when they are aware they are being audited by DO. Hence, if staff does not believe that HH compliance data reflects the real clinical environment they are working in, it then becomes easy to dismiss such skewed data and thus positive behavioural change is never achieved. Equally, getting front-line workers to buy-in to new approaches to HH monitoring, addressing their concerns about the accuracy of novel technologies and how this data will be used are also recognised as difficult challenges [14].

A number of automated hand hygiene monitoring systems (AHHMS) have been commercially developed to address these issues [15]. These systems use sensor technology to remotely monitor HH compliance, therefore reducing the need for human auditors, instead capturing large volumes of non-judgemental quantitative data. This benefit has already been realised by healthcare organisations that use AHHMS. One healthcare system was able to capture 35 million hand hygiene opportunities within the first six months of the COVID-19 pandemic [16]. The authors reported that their rich dataset allowed them to understand when changes in HH behaviour occurred and how long improvements in HH were sustained. Such robust data in similar quantities would not be achievable with DO alone, particularly when IPC staff resources were likely being diverted to COVID-19 containment measures.

There are three broad categories of AHHMS: group monitoring systems, badge-based systems, and video monitoring systems [8]. Group monitoring systems track usage of HH dispensers (soap and gel) to give an idea of HH events in a given location. Data produced from these systems can ‘nudge’ groups of staff to increase their usage of HH dispensers, but they cannot provide the personalised feedback that empowers HCWs to change their own practice [17]. Badge-based monitoring systems typically require HCWs to wear an additional tracking device that communicates with dispenser-based sensors. This extra layer of data is able to provide personalised feedback on HH behaviour both to the individual HCW, but also to managers and IPC teams. Implementing these types of AHHMS can be challenging because, due to their very nature, staff are required to wear an extra piece of equipment, which ultimately places an additional demand on staff to change their behaviour. In a study by Levin et al. [18], 44% of staff reported that wearing an additional tracking device was “inconvenient” to them. Both group monitoring and badge-based systems are usually unable to determine which WHO HH moment is being performed. They typically identify WHO moments one and four (before touching a patient and after touching a patient) [19]. This may be a useful surrogate in hospitals that have a high proportion of single rooms, however in many healthcare institutions (e.g. the National Health Service in the United Kingdom (UK)) this is not the case. Therefore, even where there is a successful implementation of an AHHMS, the continuous monitoring of HH events should be complemented by targeted DO to provide further qualitative insights into HCW HH behaviour; such as hand washing technique and types of HH opportunities missed.

Thirdly, video camera-based AHHMS can provide video footage that serves to replace human auditors. Video footage enables observation of all WHO five moments of hand hygiene and hand washing technique; however these systems have largely been confined to research rather than used commercially [20]. We expect this is due to patient privacy issues that may arise when video footage captures HH events in close proximity to patients. These privacy concerns could be alleviated through automated video auditing (AVA) which does not require storage or transfer of video data for analysis [21].

To our knowledge, there are currently 29 commercially available AHHMS, 75% of which are manufactured by companies based in the USA [15]. Over the last 10 years, uptake of these systems has remained stable, yet low, at around 4% [22,23]. A small survey of Directors of Infection Prevention and Control (DIPCs) in the UK found that these systems were perceived to be expensive and not guaranteed to produce a return on investment [15]. In order for an IPC intervention to be considered cost-effective, it should reduce HCAI incidence by 15% [24]. Therefore, evidence is needed to demonstrate that AHHMS are able to reduce HCAI rates before these systems are likely to be adopted more widely. A recent survey on this issue found that only one AHHMS has randomised control trial (RCT) level evidence supporting its ability to reduce HCAI rates [15]. Here, a group monitoring AHHMS used a specialised stepped wedge cluster RCT (SWCRCT) study design to demonstrate a significant reduction in healthcare-associated methicillin-resistant Staphylococcus aureus rates when implemented as part of a multimodal IPC strategy [25]. Other infection types showed no significant change during the study. As this was a group-based monitoring system, it could be argued that improvements in HCAI rates were limited by the inability to provide personalised feedback to HCWs. Individualised feedback, whether given publicly or privately, has been repeatedly shown to improve HH compliance [26,27]. Whilst this particular SWCRCT was a promising start, more are needed where the AHHMS is a single intervention being investigated. This will hopefully provide the evidence needed to determine whether an AHHMS is likely to be a cost-effective method of driving down HCAI rates.

Alternatively, an AHHMS can be evaluated by assessing its impact on HH compliance as a primary end-point. A 2019 review of AHHMSs found that only one system has RCT-level evidence demonstrating its ability to increase HH compliance [28]. When this badge-based system was implemented it led to a small 6.8% increase in HH compliance [29]. Non-adherence to badge-wearing was, again, an issue in this study, with 21% of participants not wearing their device as required.

Whether improved HH compliance or reduced HCAI rates (or both) are the desired end-points for such systems, more RCT-level evidence is needed for each of the 29 systems currently available in the marketplace [30]. We expect that uptake of such systems will remain patchy until the evidence base improves.

In summary, the importance of both staff consultation on new approaches to improving HH compliance, and immediate personalised feedback to staff with individualized action planning cannot be overemphasized [27,31]. Furthermore, we would suggest that goal setting with reward incentives are incorporated into HH improvement strategies if they are to effect behavioural change [32]. AHHMSs are useful tools and well placed to achieve these aims as they can provide large volumes of quantitative data offering insights to IPC teams on HCW HH behaviour. Badge-based systems promise to deliver personalised feedback to staff on their performance, yet repeated studies have shown staff to be reluctant to wear said extra badges due to the inconvenience they cause. However, new developments in AHHMS need to ensure that they have no impact on staff workflow and that personalized staff feedback on HH performance becomes the norm. In addition, more RCT-level studies are required to demonstrate the efficacy of individual AHHMSs in reducing HCAIs. This will allow IPC professionals to make informed, evidence-based procurement decisions on whether a system is likely to be cost-effective for their organisation. Overall, there should be optimism about new developments in AHHMSs provided these can be aligned with an improved research and development supporting programme.

Keywords

Hand hygiene, Automated monitoring systems, Issues, Benefits

References

  1. US Department of Health and Human Services (2013). National action plan to combat healthcare acquired infections-a road to elimination. Chapter 8: Long-Term Care facilities.
  2. Zimlichman E, Henderson D, Tamir O, Franz C, Song P, et al. (2013). Health care–associated infections. A meta-analysis of costs and financial impact on the US healthcare system. JAMA Internal Medicine 173: 2039-2046. [crossref]
  3. Sickbert-Bennett EE, DiBiase LM, Willis TMS, Wolak ES, Weber DJ, et al. (2016) Reduction of Healthcare-Associated Infections by Exceeding High Compliance with Hand Hygiene Practices. Emerging Infectious Diseases 22: 1628-1630. [crossref]
  4. Pan, SC, Tien, KL, Hung, IC, Lin, YJ, Sheng WH, et al. (2013) Compliance of Healthcare Workers with Hand Hygiene Practices: Independent Advantages of Overt and Covert Observers. PLoS ONE 8: 53746. [crossref]
  5. Manomenidis G, Panagopoulou E, Montgomery A. (2017) Job Burnout Reduces Hand Hygiene Compliance Among Nursing Staff. Journal of Patient Safety 15: 70-73. [crossref]
  6. Scientific Advisory Group for Emergencies (2021) PHE and LSHTM: The contribution of nosocomial infections to the first wave.
  7. World Health Organisation. (2009) Hand Hygiene Reference Technical Manual. Geneva, Switzerland: World Health Organisation.
  8. Boyce JM. (2019) Current issues in hand hygiene. American Journal of Infection Control 47: 46-52. [crossref]
  9. ‌Jeanes A, Coen PG, Gould D, Drey NS (2019) Validity of hand hygiene compliance measurement by observation: A systematic review. American Journal of Infection Control 47: 313-322. [crossref]
  10. Jeanes A, Coen PG, Wilson AP, Drey NS, Gould DJ. (2015) Collecting the data but missing the point: validity of hand hygiene audit data. Journal of Hospital Infection 90: 156-162. [crossref]
  11. Cawthorne KR, Cooke RPD. (2020) Healthcare workers’ attitudes to how hand hygiene performance is currently monitored and assessed. Journal of Hospital Infection 105: 705-709. [crossref]
  12. Blomgren P-O, Lytsy B, Hjelm K, Swenne CL. (2021) Healthcare workers’ perceptions and acceptance of an electronic reminder system for hand hygiene. Journal of Hospital Infection 108: 197-204. [crossref]
  13. Tarantini C, Brouqui P, Wilson R, Griffiths K, Patouraux P, et al. (2019) Healthcare workers’ attitudes towards hand -hygiene monitoring technology. Journal of Hospital Infection 102: 413-418.
  14. Conway LJ. (2016) Challenges in implementing electronic hand hygiene monitoring systems. American Journal of Infection Control 44: 7-12. [crossref]
  15. Cawthorne K-R, Cooke RPD. (2021) A survey of commercially available electronic hand hygiene monitoring systems and their impact on reducing healthcare-associated infections. Journal of Hospital Infection 111:40-6. [crossref]
  16. Moore LD, Robbins G, Quinn J, Arbogast JW. (2021) The impact of COVID-19 pandemic on hand hygiene performance in hospitals. American Journal of Infection Control 49(1):30–3. [crossref]
  17. ‌Hysong SJ, Best RG., Pugh JA. (2006) Audit and feedback and clinical practice guideline adherence: Making feedback actionable. Implementation Science 1(1). [crossref]
  18. ‌Levin PD, Razon R, Schwartz C, Avidan A, Sprung CL, et al. (2019) Obstacles to the successful introduction of an electronic hand hygiene monitoring system, a cohort observational study. Antimicrobial Resistance & Infection Control 8(1).
  19. Cheng VCC, Tai JW, Ho SK, Chan JFW, Hung KN et al. (2011) Introduction of an electronic monitoring system for monitoring compliance with Moments 1 and 4 of the WHO “My 5 Moments for Hand Hygiene” methodology. BMC Infectious Diseases 11.
  20. Mckay KJ, Shaban RZ, Ferguson P. (2020) Hand hygiene compliance monitoring: Do video-based technologies offer opportunities for the future? Infection, Disease & Health 25(2):92–100. [crossref]
  21. Lacey G, Zhou J, Li X, Craven C, Gush C. (2020) The impact of automatic video auditing with real-time feedback on the quality and quantity of handwash events in a hospital setting. American Journal of Infection Control 48: 162-166. [crossref]
  22. Braun BI, Kusek L, Larson E. (2009) Measuring adherence to hand hygiene guidelines: A field survey for examples of effective practices. American Journal of Infection Control 37: 282-288. [crossref]
  23. Durant DJ, Willis L, Duvall S. (2020) Adoption of electronic hand hygiene monitoring systems in New York state hospitals and the associated impact on hospital-acquired C. difficile infection rates. American Journal of Infection Control 48: 733-739. [crossref]
  24. Guest JF, Keating T, Gould D, Wigglesworth N. (2019) Modelling the costs and consequences of reducing healthcare-associated infections by improving hand hygiene in an average hospital in England. BMJ Open 9: 029971.
  25. ‌‌Leis JA, Powis JE, McGeer A, Ricciuto DR, Agnihotri T et al. (2020) Introduction of Group Electronic Monitoring of Hand Hygiene on Inpatient Units: A Multicenter Cluster Randomized Quality Improvement Study. Clinical Infectious Diseases 71: 680-685. [crossref]
  26. Fish L, Bopp D, Gregory D, Kerley KD, Gakhar S et al. (2021) Hand hygiene feedback impacts compliance. American Journal of Infection Control 49: 907-911. [crossref]
  27. Stone SP. (2018) Time to implement immediate personalised feedback and individualized action planning for hand hygiene. JAMA Network Open 1: 183422. [crossref]
  28. Meng M, Sorber M, Herzog A, Igel C, Kugler C (2019) Technological innovations in infection control: A rapid review of the acceptance of behavior monitoring systems and their contribution to the improvement of hand hygiene. American Journal of Infection Control 47: 439-447. [crossref]
  29. Fisher DA, Seetoh T, May-Lin HO, Viswanathan S, Toh Y, et al. (2013) Automated Measures of Hand Hygiene Compliance among Healthcare Workers Using Ultrasound: Validation and a Randomized Controlled Trial. Infection Control & Hospital Epidemiology 34: 919-928. [crossref]
  30. Cawthorne K-R, Cooke RPD. (2020) Are electronic hand hygiene monitoring systems cost-effective? Stepped wedge cluster randomized controlled trials are needed to assess their impact on reducing healthcare-associated infections. Journal of Hospital Infection 106: 200-201. [crossref]
  31. Cooke RPD, Corke C. (2020) Staff surveys will unlock the key to better hand hygiene performance. Lancet Infectious Diseases 20: 167-168. [crossref]
  32. Luangasanatip N, Hongsuwan M, Limmathurotsakul D, Lubell Y, Lee AS, et al. (2015) Comparative efficacy of interventions to promote hand hygiene in hospital: systematic review and network meta-analysis. BMJ 351: 3728.
fig 2

AGP Related Evaluation of Medical Nutrition Therapy for Diabetes Management (AMEND) – A Real World Observation Study

DOI: 10.31038/EDMJ.2021522

Abstract

Purpose: To evaluate 24 hour glycaemic profile using AGP in patients with type 2 diabetes who are eligible for meal replacement therapy over a period of 14 days.

To assess whether a precise meal replacement plan as an add on to standard of care will make a difference in smoothening out post-prandial peaks and increasing time spent in the desired (70 mg/dl-180 mg/dl) range compared to baseline time in range and post-prandial blood glucose level.

Methods: Patients were mounted with AGP asked to follow the regular diet for 6 days. On the 7th day, based on the AGP report, the most troubled meal was replaced with protein rich, calorie counted, low-carb and fiber enriched meal supplement for the next 6 days. On day 14, the AGP data were collected.

Results: The analysis of full cohort (n=566) showed reduction in eA1c and eAG by 11.9% (from 7.84% to 6.90%) and 15.10% (from 178.41 mg/dL to 151.47 mg/dL), respectively when regular meal diet was compared with the replaced meal diet. The average TIR was improved by 23.56% (from 41.38 to 51.13) in full cohort, post-intervention with replaced meal.

Conclusion: The glycemic profile of patients with type 2 diabetes was improved by meal replacement therapy over period of 14 days.

Keywords

Medical nutrition therapy, Meal replacement, Diabetes, Protein supplement

Introduction

Diabetes mellitus is a non-communicable, complex and chronic lifestyle-related disorder. It demands continuous medical care with voracious risk-reduction strategies beyond modest glycaemic control. In terms of the sheer prevalence and incidence globally, it may be called a “pandemic”, although it is obviously not contagious. Malnutrition, both under- and over-nutrition, is another pandemic and the two co-exist making this a syndemic. Add to this the current COVID-19 pandemic which is more severe in uncontrolled diabetes patients and in those who are overweight or obese.

The recent IDF-2019 report shows that there were ~ 463 million adults (20-79 years) living with diabetes; by 2045 this will rise to 700 million [1]. This shows that the incidence of type 2 diabetes mellitus (T2DM) is increasing by leaps and bound across the world. In India, there were >77 million people living with diabetes in 2019, which is expected to be 101.5 million by 2030 and 134.2 million by 2045 [2]. Moreover, according to a 10-Year Follow-up of the Chennai Urban Rural Epidemiology Study (CURES), among individuals with normal glucose tolerance (NGT), the rate of conversion from prediabetes to diabetes was recorded highest at 18% [3], indicating that India may overtake China in the near future and become the diabetes capital of the world.

Since, diabetes is a metabolic disorder, food and lifestyle changes play major role in management of diabetes. Even textbooks and standard guidelines have always mentioned that lifestyle modification needs to be attempted even before metformin, and of late, medical nutrition therapy (MNT) has become a discipline by itself in the management of diabetes.

DiRECT study was the first to provide evidence from a randomised trial of a dietary and lifestyle intervention where type 2 diabetes remissions were the primary outcome [4]. The recent EASD-ADA consensus document released at the EASD meeting in Berlin in October 2018 [5] gives a lot of emphasis on MNT even before metformin.

The Ministry of Health and Family Welfare (MOHFW) has published data that Indians on an average are protein deficient (11% protein in their diet as against the requisite 15-20%, carbohydrate content in diet is >65% as against the needed 55-60%) [6].

Many studies have shown that increasing protein intake particularly by whey protein and following portion control with meal replacement plans will benefit diabetes patients by reducing postprandial blood glucose and HbA1c [4,7,8].

Whey protein has essential amino acids that improve insulin secretion as well as sensitivity and when digested, bioactive peptides are formed which have effects on the incretin axis (GLP-1, GIP), they suppress the only orexigenic hormone, Ghrelin, and increase gut anorexigenic hormones such as CCK, NPY and Peptide YY, all of which induce satiety [8-15].

The study was based on the hypothesis that when diabetic patients (uncontrolled with oral anti-diabetic drugs/insulin) were put on protein enriched, low calorie and carbohydrate counted meal replacement plan, will come towards goal HbA1c with reduction in average blood glucose, reduction in estimated A1c (glucose management indicator), and increase in time in range (TIR).

The aim of the study was to carry out a real world evaluation of Medical Nutrition Therapy (MNT) in Patients with Type 2 Diabetes (AMEND – AGP related evaluation of MEdical Nutrition therapy for Diabetes management).

The primary objective was to evaluate 24 hour glycaemic profile using AGP in patients with type 2 diabetes who are eligible for meal replacement therapy over a period of 14 days. The secondary objective was to assess whether a precise meal replacement plan as an add on to standard of care will make a difference in showing how it smoothens out post-prandial peaks and increases time spent in the desired (70 mg/dl-180 mg/dl) range compared to baseline time in range and post-prandial blood glucose level.

Subjects

The study enrolled patients with diabetes who were 18 years old male or female and preferably overweight (BMI ≥24 or metabolically obese normal weight). The newly diagnosed patients with type 2 diabetes or patients already on treatment were also eligible. Participating participants were physically and mentally able to give valid informed written consent form.

The exclusion criteria for subjects were as below. 1) HbA1c >10%, BMI >38, EGFR <45 (any one of this will not allow participants to be eligible for the study). 2) Participants suffering from any acute illness, CVD, renal complications, bowel disorders or eating disorders like anorexia or bulimia. 3) Participants who are consuming anti-psychotics, steroids or GLP-1 analogues.4) Participant whose diabetes was diagnosed > 10 years ago or who has undergone bariatric surgery. 5) Participants who are unable or unwilling to take prescribed precise meal replacement plan and/or not willing to sign the informed consent form. 6) Pregnant or lactating women, cancer patients. 7) Participants who are already on some diet plan or following fast during the study or consuming protein supplements or consuming alcohol on daily basis or are allergic to the ingredients of the Simetri meals or Prototal. 8) Participants are not allowed to make any significant change in the daily routine or physical activities.

Materials and Methods

In a real world setting, when the patient with type 2 diabetes visited the doctor, after taking the consent, they were enrolled in the routine evaluation. After completion of all screening assessments (i.e., demographic, anthropometric and clinical data) and obtaining signed informed consent forms, eligible patients were mounted with flash glucose monitoring system (Free Style Libre from Abbott  for 14 day) to check their Ambulatory Glucose Profile (AGP). Patients were given a food log sheet and asked to fill the same for the next 14 days.

The first 6 days were considered as a baseline phase where patients continued on their regular food without any major changes. The 7th day was the meal replacement phase when the patient visited the doctor and on the basis of the AGP report, investigator replaced – the most troubled meal (the one which was associated with the most post-prandial glycaemic excursions) – regular food with a customized meal replacement diet which included Simetri meals (From Eris Lifesciences – a calorie counted, protein enriched, ready to eat meal – details in supplement material) and or ProTotal (From Eris Lifesciences – a whey protein supplement – 14 gm whey protein, 6.6 gm of fibre with other macro and micronutrients). The most troubled meal was identified as the maximum post-prandial peak seen in the AGP report on day 7th. Patients were asked to consume Simetri and/or ProTotal for the next 7 days (replaced meal phase) without any change in their medications. Here, the same patient has served as the control for himself which could be more accurate than a parallel group design (inter-individual variation). Throughout the study period (14 days) the investigator did not make any change in the pharmacological treatments.

AGP device was mounted on subject by investigator on day 1 of the study. The AGP device has been carried by the subject till day 14 of the study. The data was extracted from the device by investigator in a timely manner, i.e., on day 7 and day 14.

Given the observational nature of the study, no sample size estimation was done. Statistical analysis was carried out as and when required. The level of significance was 0.05. P values of less than 0.05 were considered as a statistically significant difference.

Ethical Conduct of the Study

The clinical study protocol (Dated 01/02/2019), informed consent form, subject diary (Version No. 00,Dated 12 Apr 2019) and all other relevant study documentation were reviewed and approved by the responsible ethics committee.

The study commenced only after a written approval was obtained from the ethics committee. The study was conducted in accordance with the protocol, International Council for Harmonisation (ICH) (Step 5) ‘Guidance on Good Clinical Practice’ (E6) and ‘Declaration of Helsinki’. All associates assisting in the conduct of study were informed regarding their obligations.

Results

There were total 660 patients enrolled and out of them 566 patients were involved in the final analysis. We have divided patients in various groups for the purpose of better analysis.

Total 94 (14.24%) non-adhered patients were excluded from efficacy analysis. Non-adherent patients were defined as the one who had consumed the provided replaced meal (Simetri and Prototal) for ˂4 days. The adherence to diet was observed in 85.76% of total 660 patients.

In all patients age was found to be in a range of 20-86 years with a mean of 53.49 ± 11.80 years, mean weight was 73.77 ± 14.33 kg, and mean BMI was 27.81 ± 5.52 kg/m2. The mean HbA1c was 9.10 ± 1.66%.

a. Full cohort

The analysis of full cohort (n=566) showed reduction in average eA1c (Figure 1) from 7.84 on regular diet to 6.90 on replaced diet, indicating an eA1c (estimated A1c  – it was estimated because the total duration is only 14 days) reduction by 11.99%, p<0.001. Similarly, estimated average glucose (eAG) on regular diet was 178.41 mg/dL which reduced to an avg. of 151.47 mg/dL after following replace diet, indicating reduction by 15.10%, p<0.001. The average TIR on regular diet was 41.38 which improved to an avg. of 51.13 after following replace diet, indicating an improvement by 23.56% (Figure 2). This improvement showed statistical significant change (p ˂0.001).

fig 1

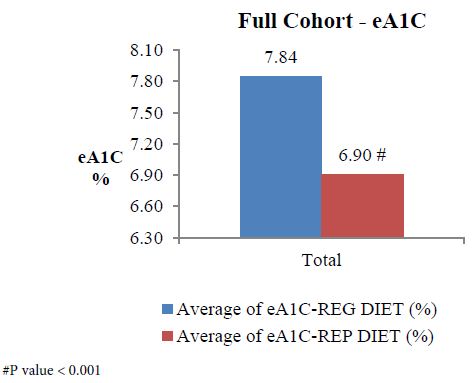
Figure 1: Full cohort analysis of eA1c.

fig 2

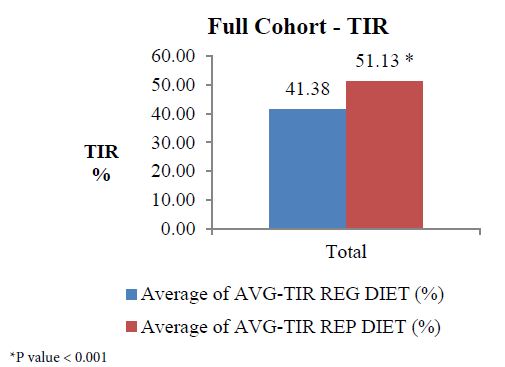
Figure 2: Full cohort analysis of TIR.

b. Sub-group analysis

The age group analysis (Table 1) showed that patients >60 years had better improvement in eAG and eA1c -16.73% and 13.10% respectively when compared to age group of <40 years and 40-60 years (14.35% and 11.46% vs. 14.47% and 11.54%, respectively)

The sub-group analysis for various BMI indicated that group of patients with BMI between 25 to 29.9 kg/m2 had 15.02% and 11.88% reduction in eAg and eA1c when replaced meal was consumed whereas patients with BMI ˃30 kg/m2 had comparatively less improvement in eAG (11.09%) and eA1c (8.79%) on replaced meal where p< 0.001, as shown in Table 1. However, improvement in TIR was slightly greater in patients with higher BMI (23.19% vs. 21.58%).

Analysis was also carried out based on the duration of diabetes. Patients with diabetes duration between 1 to 6 years and > 6 years showed better improvement than patients with diabetes duration <1 year. Improvement in eAG, eA1C and TIR was 15.54%, 12.33% and 24.46% respectively in patients with diabetes duration 1 to 6 years, while in patients with >6 years the improvement was by 15.46%, 12.36% and 25.82% respectively (Table 1).

When patients were divided based on the avg. baseline HbA1c < 7.5% and >7.5%, the result showed that patients whose avg. baseline HbA1c was <7.5% there was decrease in eAG from 144.25 mg/dL on regular diet to 117.27 mg/dL on replaced diet  indicating a decrease by 18.70%. In the same group, eA1c decreased by 14.14%, p<0.001. On the other hand, patients’ whose avg. baseline HbA1c was >7.5% also showed significant improvement with p<0.001 in eAG and eA1c (14.85% and 11.82% respectively).

As it was a real world study, a few of the patients were consuming either Simetri or ProTotoal and most of them were consuming both Simetri and ProTotal. There was also a small group of patients who were consuming more than two replaced diet in a day. The analysis was carried out to observe the effect of single meal replacement vs. two meal replacements in a day. As shown in the Table 1, patients consuming two replaced diets in a day showed better results in terms of all the evaluated parameters.

Table 1: eAG, e1c and TIR values of various sub-group analysis.

Subgroup

No. of subjects

eAG (mg/dL) TIR (%) eA1c (%) p value
Regular diet Replaced diet Regular diet Replaced diet Regular diet

Replaced diet

BMI<24.9 kg/m2

161

185.62 151.93 37.79 48.09 8.09 6.92

<0.001

BMI=25-29.9 kg/m2

242

173.13 147.12 43.42 52.79 7.66 6.75

<0.001

BMI > 29.9 kg/m2

151

175.46 156.01 43.25 53.28 7.74 7.06

<0.001

< 40 years

71

181.13 155.13 44.37 53.81 7.94 7.03

<0.001

40-60 years

326

181.99 155.65 39.41 48.84 7.97 7.05

<0.001

>60 years

169

170.36 141.86 43.94 54.41 7.56 6.57

<0.001

DD<1 year

28

128.99 113.63 64.43 73.39 6.12 5.59

<0.001

DD 1-6 years

179

179.19 151.34 42.32 52.67 7.87 6.9

<0.001

DD > 6 years

343

183.08 154.78 38.62 48.59 8.01 7.02

<0.001

eA1c reg diet<7.5%

295

133.97 118.46 62.06 66.27 6.3 5.75

<0.001

eA1c reg diet>7.5%

271

226.78 187.41 18.88 34.65 9.53 8.16

<0.001

One meal replacement

170

166 144.76 45.48 54.21 7.41 6.67

<0.001

Two meal replacement

392

183.82 154.28 39.74 49.96 8.03 7

<0.001

DD: Diabetes Duration.

We also evaluated patients whose one replaced meal was ProTotal to see the benefits of whey protein on eAG, eA1c and TIR. The results are presented in Table 2.

Table 2: Evaluation parameters when single replaced meal is ProTotal.

Parameters

One meal replacement with ProTotal (N=64)

eAG difference

16.68 mg/dL

% Reduction in eAG

10.23%

eA1c difference

0.17

% Reduction in eA1c

2.33%

TIR improvement

18.82%

P value

<0.001

Discussion

From the latest figures of IDF we know that India ranks second highest among people with diabetes after China [2]. The worrisome part is that as per the National Results of the SITE (Screening India’s Twin Epidemic) study, of the diabetic population already aware of their condition, almost two-of-every three (70%) had ‘uncontrolled’ diabetes (Hba1c levels >7%) [16].

This figure raises a question that in spite of availability of a vast range of pharmacological treatments, why does a patient has uncontrolled diabetes and what is the missing link? The answer can be obtained from the STARCH study [17] and PRODIGY survey [18] which showed that protein intake in India is very less and there hardly any difference exists between diets of a non-diabetic patient to that of a diabetic patient. It was observed that around 9 out of 10 consumers had a diet deficient in proteins. This was regardless of the gender and the socio-economic group [18]. Even the MoHFW (Ministry Of Health and Family Welfare) stated that Indians on an average are protein deficient (11% protein in their diet as against the requisite 15-20%) [5].

As diabetes is a metabolic and lifestyle related disease, controlling patients’ diet is one of the key success factors. In fact, lifestyle modification including MNT should be started even before metformin. Unfortunately by the time patients get diagnosed for diabetes, they have already lost 50-80% beta cell function [19]. Therefore, in this study, we asked patient to replace one or two of their meals with the specially designed, protein-enriched, carbohydrate-counted meal, without changing any pharmacological treatment.

The study enrolled a total of 660 patients. Based on the AGP report at the end of first 6 days, patients were asked to replace the most troubled meal with either Simetri or ProTotal or both for the next 7-8 days. Out of these 660 patients, 94 patients did not follow the study protocol and consumed replaced diet only for a period of <4 days. These 14.24% patients were not included in the analysis. This showed that rate of adherence to diet change was 85.76%. As diet is the hardest thing to change, the significant adherence to given product suggested that the palatability and ease of consumption for Simetri and ProTotal is very high. As it was a real world observation study, there was no control over patients’ lifestyle (food choice, exercise pattern, sleeping pattern etc.). The only change was replacing one or two meal with either ProTotal or Simetri or both and there was no strict control over what the patients consume in the entire day.

In the full cohort, eA1c was reduced by 0.94% (from 7.84% to 6.90%; % improvement 11.99%, p<0.001). The results were similar to that obtained with GLP-1 agonist in AMIGO study where exenatide 10 μg resulted in a mean HbA1c reduction of -0.8% to -0.9% [20]. As whey protein also improves GLP-1 secretion, it can mimic the action of GLP-1 agonist [8]. This indicates that, even a small change in a diet for only a short duration of 7 days has very positive impact on eA1c and if patient continues following the suggested meal replacement plan it will serve like a pharmacological therapy. Even the UKPDS study has shown that intensive glucose control can significantly reduce any diabetes related end-point [21].

As per the recommendations from the international consensus on time in range (TIR), adults with type 1 or type 2 diabetes should have >70% of TIR. In our study, when patients were on regular diet and average TIR was only 41.38% which increased to 51.13% after consuming replaced diet. This indicates that, if patients continue following the replaced diet there will be much improvement in TIR. Though in the current study, patient consumed replaced diet only for 7 days, still an increase in TIR is really significant (relative % improvement of 23.56%, p< 0.0001).

The replace diet not only improved TIR but also decreased the eAG from 178.41 mg/dL to 151.47 mg/dL, p< 0.001 in a full cohort.

The similar result were obtained when different sub-group analysis were carried out, i.e., based on the BMI, baseline HbA1c and the number of replaced meals.

There was no difference seen in male and female patients with reference to improvement. It means the replaced diet causes the similar effect on both the gender. The meal replacement period was only for short duration of days hence change in weight was not included in the evaluation parameter and measuring HbA1c was also not possible.

The results from DiRECT and DiRECT 2 studies support that total diet replacement for initial 12-20 weeks followed by gradual food reintroduction and then support for weight loss maintenance has helped type 2 diabetes patients to achieve remission and sustained it at 24 months for more than a third of people with type 2 diabetes [22].

The AMEND study results were also in line with these studies. Although the study duration was very short and hence measuring a change in body weight was not feasible, the eAG, eA1c and TIR results suggested that if the treatment was continued for longer duration, there are chances that blood glucose and HbA1c will be in the controlled range.

AMEND study results were also supported by David King (2018) study which concluded that whey protein before meals improved post-prandial glycemia, stimulated insulin release, and increased satiety in men with type 2 diabetes [23].

The protein quantity and quality of foods are contributing factors to their effects on glucose control, but foods are much more complex than a single nutrient, or even the sum of their individual nutrients. Many dietary factors, nutritive and/or bioactive, mediate the relationship between food intake and health. Lastly, in order to optimize protein intake for glucose regulation, the amount, source, and type of food product or supplement should be personalized to match to the individual’s lifestyle, medications, gluco-regulatory abilities, and disease status.

Conclusion

This AMEND study showed that the efficacy of replaced diet for calorie restriction remains a significant in humans. Although this data was only for 14 days, the study can give significant and detailed data on effect of replaced diet in patients with diabetes if therapy continues for longer period of time. Improving diet of a patient will not only help them in better management of a disease but will also be cost-effective for the country [24].

Therefore, it can be concluded from the present study that, replacing a diet with protein enriched, calorie counted meal does not only improve the blood glucose level and TIR but can also decrease eA1c significantly.

Acknowledgement

We would like to thank all physicians who have helped in the study. We would also like to extend our gratitude to CRO – Ethicare for their help in data analysis.

Declaration

Funding

Eris Lifesciences Pvt. Ltd

Conflicts of Interest/Competing Interests

Not applicable

Ethics approval

Approved. Aastha Ethics Committee has given the approval.

Informed Consent

Informed consent was obtained from all individual participants included in the study.

Consent for publication

Each author has given their consent for publication.

Availability of data and material

Not applicable.

Code availability

Not applicable.

References

  1. IDF Diabetes Facts and Figures. IDF Diabetes Atlas Ninth edition 2019. https://www.idf.org/aboutdiabetes/what-is-diabetes/facts-figures.html. Accessed 17 June 2020.
  2. IDF Diabetes Atlas 9th edition, 2019. https://diabetesatlas.org/en/sections/demographic-and-geographic-outline.html. Accessed 17 June 2020.
  3. Ranjit A, Coimbatore R, Mohan D, Rajendra P, Vasudevan S, Haridas N, et al. (2015) Incidence of diabetes and prediabetes and predictors of progression among asian indians: 10-year follow-up of the Chennai Urban Rural Epidemiology Study (CURES). Diabetes Care 38(8): 1441-8. [crossref]
  4. Michael L, Wilma L, Alison B, Naomi B, George T, Lousie M, et al. (2018) Primary care-led weight management for remission of type 2 diabetes (DiRECT): an open-label, cluster-randomised trial. Lancet 391: 541-551. [crossref]
  5. Melanie Davies, David D, Judith F, Walter K, Chantal M, Geltrude M, et al. (2018) Management of hyperglycaemia in type 2 diabetes. A consensus report by the American Diabetes Association (ADA) and the European Association for the Study of Diabetes (EASD), Diabetologia, Springer Publications, EASD and ADA. Diabetologia 61: 2461-2498. [crossref]
  6. Press Information Bureau Government of India Ministry of Health and Family Welfare, Nutritional Level. 13-March-2015.
  7. Bhatt A, Choudhari K, Mahajan R, Sayyad G, Pratyush D, Hasan I, et al. (2017) Effect of a low-calorie diet on restoration of normoglycemia in obese subjects with type 2 diabetes. Indian J Endocr Metab 21: 776-80. [crossref]
  8. Linda M, Tongzhi W, Michael H, Christopher R (2015) Whey protein: The “whey” forward for treatment of type 2 diabetes? World J Diabetes 6(14): 1274-84.
  9. Hall L, Millward J, Long J, Morgan M (2003) Casein and whey exert different effects on plasma amino acid profiles, gastrointestinal hormone secretion and appetite. Br J Nutr 89: 239-48. [crossref]
  10. Nilsson M, Holst J, Björck M (2007) Metabolic effects of amino acid mixtures and whey protein in healthy subjects: studies using glucose-equivalent drinks. Am J Clin Nutr 85(4): 996-1004. [crossref]
  11. Salehi A, Gunnerud U, Muhammed J, Ostman E, Holst J, Björck I, et al. (2012) The insulinogenic effect of whey protein is partially mediated by a direct effect of amino acids and GIP on β-cells. Nutr Metab 9: 48. [crossref]
  12. Kevin C, Gonca P (2016) Emerging evidence for the importance of dietary protein source on glucoregulatory markers and type 2 diabetes: different effects of diary, meat, fish, egg and plant protein foods. Nutrients 8: 446. [crossref]
  13. Nicole K, Melinda C, Gayle S, Christopher R (2014) Effect of dietary prebiotic supplementation on advance glycation, insulin resistance and inflammatory biomarkers in adults with pre-diabetes: a study protocol for a double-blind placebo-controlled randomised crossover clinical trial. BMC Endocrine Disorders 14: 55. [crossref]
  14. Cristina T, Harriët S, Timothy D, John C (2017) The microbiota-gut-brain axis in obesity. Lancet Gastroenterol Hepatol 2(10): 747-56. [crossref]
  15. Blaak E, Antoine M, Benton D, Björck I, Bozzetto L, Brouns F, et al. (2012) Impact of Postprandial Glycaemia on Health and Prevention of Disease. Obesity Reviews 13(10): 923-84. [crossref]
  16. National results of nearly 16, 000 patients surveyed for Sanofi’s SITE study show that 70% of the known diabetic population have uncontrolled diabetes. Media release by Sanofi India on 7 November 2011.
  17. Shashank J, Anil B, Sarita B, Subodh B, Mala D, Shachin G, et al. (2014) Results from a dietary survey in an Indian T2DM population: a STARCH study. BMJ Open 4(10): e005138. [crossref]
  18. Manish Mahajan (2015) Protein Consumption in Diet of Adult Indians: A General Consumer Survey (PRODIGY). Indian Medical Gazette 149-50.
  19. Baptist Gallwitz (2006) The Fate of Beta-cells in Type 2 Diabetes and the Possible Role of Pharmacological Interventions. Rev Diabetic Stud 3(4): 208-16. [crossref]
  20. Dilip S, Suril V, Shivani V, Kiran K, Vinod T (2018) Recent updates on GLP-1 agonists: Current advancements & challenges. Biomed Pharmacother 108: 952-962. [crossref]
  21. Paromita K, Ian P, Richard D (1999) The UK Prospective Diabetes Study (UKPDS): clinical and therapeutic implications for type 2 diabetes. Br J Clin Pharmacol 48(5): 643-8. [crossref]
  22. Michael L, Wilma L, Alison B, Naomi B, George T, Louise M, et al. (2019) Durability of a primary care-led weight-management intervention for remission of type 2 diabetes: 2-year results of the DiRECT open-label, cluster-randomised trial. Lancet Diabetes Endocrinol 7(5): 344-55. [crossref]
  23. David K, Mark W, Matthew C, Leigh B, Emma S, Daniel W (2018) A small dose of whey protein co-ingested with mixed-macronutrient breakfast and lunch meals improves postprandial glycemia and suppresses appetite in men with type 2 diabetes: a randomized controlled trial. Am J Clin Nutr 107(4): 550-7. [crossref]
  24. Lee Y, Mozaffarian D, Sy S, Huang Y, Liu J, Wilde PE, et al. (2019) Cost-effectiveness of financial incentives for improving diet and health through Medicare and Medicaid: A microsimulation study. PLoS Med 16(3): e1002761. [crossref]

About Climate, Flooding and Underwater Technologies

DOI: 10.31038/GEMS.2021335


Waters enclosed in reservoirs in front of hydroelectric power plants are also devoid of natural functions – they evaporate from the surface, bloom with algae, but most of it breaks on turbine blades. The destroyed and unused structure of water evaporates into the atmosphere without fulfilling its mission. These vapors are supplemented by all waters taken from nature for irrigation, technological and communal processes. There is more evaporation of such waters than evaporation from biota. The fumes emanating from other than biota can be called artificial. Their volumes, evaporation rate and quality become commensurate with natural fumes or fumes from plants and living organisms. Therefore, the climate is changing and natural disasters occur. Flood spills are a major source of artificial evaporation. How do we feel about rivers? Within the boundaries of cities and towns, we straighten the banks, cover the river beds with concrete and stones. We dump garbage and waste into the water. By their nature, rivers must regularly affect the banks – meandering or interacting with the soil. This is necessary in order to dissolve minerals, organics in water and supply them to animals and plants. Everything dissolved in water is a building material for biota. Water trapped in concrete banks loses its function. It cannot dissolve minerals from the soil in itself and convey it to the consumer. We do the greatest harm to the river by dumping waste and garbage into it. The volumes of discharges raise the river bottom quite strongly. Especially downstream of settlements. It is this circumstance that leads to the overflow of water from the coast during abnormal precipitation, devastating floods and extensive spills. To maintain the carrying capacity of the river bed, it is necessary to periodically clean the bottom of sediments or maintain the historical depth.

The existing technology of deepening the river bottom with dredges and various dredgers is quite metal-consuming, requires significant expenditures of energy, funds and pollution of coastal areas. The main energy required with these methods is spent on holding the agent itself against the current. Considering the possibility of impact on the bottom of the rivers, it is possible to find the moments when gullies and depressions are formed around the sunken ship. Is it possible to use the forces of the movement of the water itself. If we take this principle as a basis, then the simplest special device arises that will clean and deepen the bottom of the river. An ordinary parallelepiped without a bottom and ends, installed at the bottom of the river, will have almost no effect on the flow. Water freely enters one end and exits through the other. But, if a damper is installed inside it to turn the water flow to the bottom, then it becomes possible to displace the bottom particles along the flow. Moving the device downstream, these particles move further. If the device is moved forward and backward by means of a cable, an underwater longitudinal channel can be obtained. By moving it from coast to other coast, it is possible to move bottom sediments into the transverse shaft. If necessary, the shaft can be lifted to the surface. By reducing the movement of water across the entire width of the river, and by increasing the underwater channel, it is possible to increase the carrying capacity of the entire river. By diverting the main stream away from the collapsing coast, this collapse can be excluded. Thus, influencing the water flows, it becomes possible to change the river bed according to the given parameters. To preserve water for the summer, it is enough to keep the existing ratios of rifts – rapids and reaches – depressions. An increase in these volumes is achieved by a corresponding deepening of the bottom in these places. To increase the speed of the recess, a lead screw can be added to increase the flow of the impact to the bottom. Deepening to the design depth will not allow water to overflow the banks with maximum precipitation. The simplest device can prevent floods. The shown device is primitive in execution, does not require a lot of metal and is not energy intensive. The power to drive the lead screw is hundreds of times less than on dredges. Thus, the manufacture of the device is available to any coastal economy. The idea of ​​impacting the bottom by the current itself goes far beyond a simple deepening. For large river depths, it is possible to manufacture a device with a small power plant, a lead screw, autonomous control, and an underwater life support cabin. A device or Underwater Universal Machine (PUM) has been developed. The uplift and transfer of bottom sediments makes it possible to create new technologies for underwater operations. For example, gold mining. Sorting and disintegration can be carried out directly in the shown closed cavity without bringing the materials to the air. Of course, designers will have to work hard to develop new devices for such work. It becomes possible to search for and recover sunken objects goods without destroying the bottom surface. Conversely, it is possible to remove the bottom layer and transport it to the surface, for example, to obtain sapropel. Repair of underwater structures, such as pipelines, is possible. With completely closed dampers at the ends, it becomes possible to completely stop the movement of water and create an air bell. The version with a lead screw can be used for reservoirs with stagnant or sedentary water – lakes, swamps, seas.

Keywords

Artificial evaporation, Water functions, Deepening of the bottom, New technology, Underwater work.

fig 1

Earth Science Needs Thorough Introspective Analysis and Renovation

DOI: 10.31038/GEMS.2021334

Abstract

Despite several breakthrough discoveries, earth science needs modification especially related to its deeper parts of the planet where temperature and pressure have been presumed to be high. Based on the concept of earth’s expansion, the author considers that the mantle of the unexpanded ocean-less earth was considerably fluid owing to incorporation of ocean-forming water. In such a globe gravitational pull from an extraterrestrial planetary body would cause expansion triggered by swelling up of the semi-fluid mantle and consequent formation of a number of expansion cracks on the crust. Through these cracks or mid-oceanic ridges extensive molten magma would expel out and deposit on both sides of the crack to form ocean basins. Matching thickness of the earth’s fluid outer core with the extent of expansion points out that owing to massive expansion original core-mantle conjunction of the planet was ruptured along which a void zone, identified as outer core of the prevalent concept, was gradually opened up. Such disposition of occurrence of two discrete geospheres separated by a virtually void zone would give rise to the phenomenon of reverse gravity in the deep interior of the planet thereby sustaining a low pressure and low temperature zone at depth.

Introduction

The author of this article, who is a geologist by love, education and commitment, while studying various features of earth science noticed that certain aspects of the studies call for introspective analysis and revamping and in a few cases rejection. Authur’s study was conducted covering right from the crustal layer of the planet to its deepest part, including the enigmatic outer core. When the first authentic map of the globe was prepared in 1570 by Abraham Ortilius [1], which conspicuously exhibited parallel shore lines between Africa and South America. The pioneer cartographer not only noted this remarkable feature, but also for the first-time proposed occurrence of continents in the past in a conjoined manner. After that several observers, such as Antonio Snider-Pellegrini [2] of France as well as Alfred Wegener [3] of Germany and several other geologists attempted for continental adjustment. However, all such models were found to be untenable from the point of strict scientific study as they had liberally distorted the boundary of the relevant continents. I. O. Yarkovskii [4] of Russia for the first-time suggested Earth’s expansion in 1888 while after that many scientists, some of them independently, conceived the idea of expansion of the Earth. In contrast to the adjustment done in an unaltered dimension of the earth, Hilgenberg [5] of Germany in 1933 showed that in a model of earth reduced to two/third of its original dimension perfect adjustment of continents could be achieved (Figure 1). This information evidently supports earth expansion theory to be a genuine concept suitable for explaining major global phenomena, while, for explaining such phenomena in a globe of unchanged dimension throughout the past geological ages requires several fabricated assumptions.

fig 1

Figure 1: O. C. Hilgenberg of Germany in 1933 showed that if the radius in a model of Earth could be reduced to two-third of its radial thickness, all the continental blocks could be adjusted in a perfect manner. It can be noted that in the primordial small Earth, there were no oceans although lakes were present. Hence, it can be conceived that at that time the ocean-forming water was associated with the Mantle turning it considerably fluid and predominantly suitable for expansion (Sen, 1984-2007).

All the World Loves a Fairytale

In “The Problems of Philosophy” Bertrand Russell [6] expressed:

“Is there any knowledge in the world which is so certain that no reasonable man could doubt it? When we have realized the obstacles in the way for a straightforward and confident answer, we shall be well launched on the study of philosophy – for philosophy is merely the attempt to answer such ultimate questions, not carelessly and dogmatically as we do in ordinary life and even in the sciences, but critically after exploring all that makes such questions puzzling, and after realizing all the vagueness and confusion that underlies our ordinary ideas”. Regarding apparently unquestionable notions, Sir Bertrand further pointed out that “Yet, all these may be reasonably doubted and all of it requires much careful discussions before we can be sure that we have stated it in a form that is wholly true.” The present author considers that many of our concepts and axioms which are extensively been applied in earth sciences for a long time as authentic and of paramount importance, require sensible evaluation, and, if necessary, modification. The author would be satisfied if he can utilize the rich scientific heritage developed through protracted studies by the scientists from all over the globe in an honest and meaningful manner avoiding fairy tale-like imagination and dogma. Since the view of constant dimension earth throughout the past geological time has been rejected as per the reasoning earlier mentioned, the concept of plate tectonics would also be automatically discarded. However, plate tectonics [7] happen to be one of the most popular views – or, perhaps the most remarkable concept ever developed in earth science that enjoys support from a large section of geo-scientists. Hence, for rejecting such a popular view it is necessary to discuss the drawbacks of the concept. Essentially plate tectonics is based on the concept of uniform earth dimension or unchanged dimension of the globe throughout the past geological ages and requires several fabricated assumptions for explaining only a few features of the earth system, restricted mainly to the crust of the planet. The concept does not convey any idea regarding the origin of continents or oceans, neither it gives information on interior of the planet. To keep the dimension of the planet constant it views that while a plate or solid continental fragment plunges into another solid part of the earth in a smooth conveyer belt like manner, in another part of the planet new plates are emerged, defying basic principles of physics. The process is operated owing to a convection current that occurs in the mantle which is solid and rigid as confirmed by propagation of seismic waves. The movement, though occurs in extremely slow manner, is capable of drifting the continents to great distances, concurrently driving a geo-dynamo, responsible for magnetic features of the planet.

Unified Global Tectonics

The concept of unified global tectonics (Sen, 1984, 1986, 2003, 2007) [8-11] has been developed based on the earth expansion theory of Hilgenberg (1933) [5] which envisages that if we could reduce the radius of the earth to two-third of its present thickness, all the continental blocks would be perfectly adjusted in the resultant small globe. Such small globe would be devoid of ocean basins although a few epicotinental seas or lakes were present. Therefore, it can be deduced that the ocean-forming water at that stage must have been associated with the mantle. Under such a set up, the original mantle material would be considerably fluid and consequently highly suitable for the manifestation of expansion, leading to continental fragmentation and various related features. The view is based on the results of experimental studies conducted by Roy and Tuttle (1961) [12] confirming depression of melting point of silicate rocks under hydrothermal and high pressure condition. As evidenced by the tidal pull of Moon, it is rational to conclude that the reason of the earth’s expansion is the gravitational pull exerted by the Moon causing periodical bulging of the semi-fluid mantle. However, with progress of the process due to escape of volatiles from the mantle consisting chiefly of water, the ocean basins would be filled up with water simultaneously reducing the fluidity of the mantle which would eventually turn into a rigid geosphere. As explained above, the Moon – responsible for causing earth’s expansion by exerting tidal pull – was originally an independent small planet which was captured by the earth when it was approaching the latter. Initially due to the Moon’s magnetic influence exerted over the magnetic core of the earth, the latter’s spatial orientation was drastically changed, causing major alteration in earth’s climatic features. It has been conceived that originally in the small earth the solid iron core and mantle – initially which was adequately fluid – were juxtaposed to each other. As has been discussed, an appropriate gravitational force from an extra-terrestrial planetary body – the Moon – was responsible for the earth’s expansion by bulging up of the semi-fluid mantle causing rupture of the original core-mantle conjunction. Also, due to such bulging of the semi-fluid mantle a number of expansion cracks – that eventually turned into mid-oceanic ridges – were produced over the solid sialic crust through which large quantum of basic magma disgorged and spread on both sides of the cracks to form ocean basins. Matching thickness of the fluid outer core with that of the extent of expansion, strongly supports the view that in consequence of prolonged expansion, along the ruptured core-mantle conjunction a void zone, identified as outer core in the prevalent concept, was gradually opened up. In due course the void zone would turn into a pseudo-fluid or virtually void geosphere owing to influx of fine particles from the adjoining mantle. The above mentioned arguments lead us to envision that two rocky and metallic geospheres separated by a non-solid and virtually void zone occur in the deep interior of the planet (Figure 2). This sort of internal setup would give rise to the phenomenon of reverse gravity generating low temperature and low pressure zones in the earth’s deep interior. This simple and down to earth concept explained here is in complete agreement with all the major fundamental features, including several hitherto unexplained ones encountered in the planetary interior. Evidences of low temperature and low pressure zones in the planet’s deep interior are exhibited in meteorites which are considered to be broken fragments of a pre-existing planet. These evidences include strong magnetic nature of some meteorites, texture of iron meteorites, presence of minerals with hydrocarbons, amino acid and water in some rocky meteorites, as well as, globular shape of chondrules – all of which unmistakably confirm low temperature and low pressure condition in the deep interior of the planet. With the new concept the picture that emerges on the interior of the earth is this that during the Precambrian era, when the planet’s core and mantle were juxtaposed to each other, extra-terrestrial magnetic influence caused movement of the iron-core, as a result of which the planet as a whole was tilted or deflected in space. Because of such alteration in spatial orientation of the planet, remarkable changes in the geographical features in various parts of the globe occurred, signatures of which, like the polar region revamping in to a hot zone and vice-versa, are documented over the global surface (Figure 3b). In contrast, when the pseudo-fluid or void geosphere attained adequate thickness due to prolonged expansion, (Figure 3d), instead of deflection of the entire earth, only its magnetic iron core started to execute smooth and secular movements, including reversal of the poles, which are precisely documented over the surface rocks (Figure 3). It is understandable that in case of expansion, the sialic super-continent would be fragmented because of development of a number of expansion cracks, followed by widespread expulsion of basaltic magma through the cracks that would occupy the new space generated along the cracks forming rudimentary ocean basins. Under such circumstances instead of collision, the fragmented parts would tend to move away from one another causing enhancement of the ocean basins. Geological records, on the other hand, confirm collisions of continental plates have actually occurred at certain places during the past geological periods. In unified global tectonics this has been attributed due to the force generated by rotation of the planet along its axis of rotation which would be maximum around the equator and minimum near the poles. This sort of force generated due to rotation or spin of the planet was not only responsible for continental collision forming colossus structures like the Himalayas but also caused major revamping of the continental fragments and ocean basins.

fig 2

Figure 2: Overall structure of the earth (not to scale) showing trend of gravitational attraction on surface and interior of the planet. At the centre of the planet the trend of gravitational attraction would be oppositely directed. With separation of original semi-fluid mantle from the iron core due to planetary expansion and formation of a virtually void zone in between – the so called outer core of the prevalent view -, it is reasonable to conceive that around the inner core oppositely or reversely directed force of gravitational attraction would prevail forming a low pressure low temperature zone at depth.

fig 3

Figure 3: Before expansion of the planet, the solid iron core and semi-fluid mantle were juxtaposed to each other (Figure 3a). Due to expansion the original core-mantle conjunction was ruptured (Figure 3b) and along the ruptured surface a void zone was developed which gradually grew into a pseudo-fluid geosphere, i.e., the earth’s fluid outer core (Figure 3c). This view supports that two geospheres of rocky and metallic composition, separated by a non-solid and virtually void zone, occur in the deep interior of the planet. Such disposition of the planet would give rise the phenomenon of reverse gravity in the planet’s deep interior and core generating low temperature and low pressure zones in the earth’s core and deeper parts. After development of the broad pseudo-fluid or virtually void geosphere (Figure 3d), the iron-core would remain within it in a suspended condition. Hence at this stage, pertaining to younger geological periods, in response to extra-terrestrial magnetic influences, new geomagnetic phenomena, like, polar wandering, pole reversal and west-ward drift could take place.

Remarks and Conclusions

The author in the book “Earth – Planet Extraordinary” has advanced the following new concepts:

  1. The globe in its present outward appearance shows occurrence of continents in disjointed form which cannot be adjusted in appropriate manner whereas in a smaller globe, reduced to two-third of its present radial dimension (Hilgenberg, 1933), proper fitting of the continents can be achieved. This unmistakably demonstrates that the earth is an expanded planet, though in case of solid and rigid condition of the mantle planetary expansion and continental drift would not be possible.
  2. The author has pointed out that since the small earth of unexpanded stage was devoid of oceans, the mantle at that stage must have been sufficiently fluid or semi-fluid owing to incorporation of ocean-forming water – an essential requirement for earth’s expansion or continental drift. The view has been developed based on the work of Roy and Tuttle (1961) [12] who showed that melting point of a silicate rock under hydrothermal and high pressure condition would be depressed or, in other words, it would develop considerable fluid characteristic.
  3. It has been postulated that a planetary body came near the earth and was eventually captured by the latter, thereby turning the former a solitary satellite of the earth, the Moon. Since then the Moon started to rotate around the earth and due to its gravitational attraction on the earth, chiefly affecting the semi-fluid mantle, caused its expansion. As the Moon was revolving around the earth and the Moon too was rotating around its own axis of rotation, the earth’s expansion was manifested in a uniform manner.
  4. It was owing to expansion earth’s solid sialic crustal cover developed a number of long sinuous cracks along which the planet’s super-continent was fragmented forming several units of continents.

References

  1. Ortelius Abraham (1570) Thesaurus Geographicus (in Latin) 3rd Edition, Antwerp Plantin. OCLC 214324616.
  2. Snider-Pellegrini Antonio (1858) La Creation et ses Mysters Devoiles, Librarie A. Franck & Dentu, Paris.
  3. Wegener Alfred (1912) Die Entstehung der kontinente, Petermann Mitteilungn, 185-195,253-256,305-309.
  4. Yarkovsky, Ivan Osipovich (1888) Hypothese cinetique de la Gravitation universelle et connexion avec la formation des elements chimiques, 134p, Moskau.
  5. Hilgenberg OC (1933) Vom Wachsenden Erdball, Berlin: Giessmann & Bartsch.
  6. Russell, Bertrand (1912) The Problems of Philosophy, Home University Library, Oxford University Press paperback, 1959 Reprinted, 1971-1972.
  7. Dietz Robert S (1977) Plate tectonics: A revolution in geology and geophysics. Tectonophysics. 38: 1-6.
  8. Sen Subhasis (1984) Unified global tectonics – a new qualitative approach in Earth sciences, Indian Science Congress, Geology and Geography Section, Ranchi, January 3-8, 71st Session, Abstract, p.23-24,.Also in Jour. Met. & Fuels 32: 20-22.
  9. Sen Subhasis (1986) A new concept on the Earth’s interior, geomagnetism and crustal fragmentation, International Symp. on Neotectonics in South Asia, Survey of India, Dehra Dun, Feb.18-21, Proceedings, p.83-94.
  10. Sen Subhasis (2003) Unified global tectonics: structure and dynamics of the total Earth system, Indian Science Congress, Earth System Sciences, Bangalore, January 3-8, 2003, 90th Session, Abstract, p.57-58,. Also in Jour. Met. & Fuels 51: 351-355.
  11. Sen Subhasis (2007) Earth – The Planet Extraordinary, Allied Publishers Ltd., New Delhi, 232.
  12. Roy R, Tuttle OF (1961) Investigation under hydrothermal conditions, In Ahrens, I.H., Rankama, A.K. and Runcorn, SK (eds.) Physics and Chemistry of the Earth 1: 138-180 Pergamon Press, New York.