DOI: 10.31038/IDT.2021222
Abstract
We have set out to assess the data on the intensity of the COVID-19 pandemic with a view to making plausible predictions of its decline. A plot of “% COVID-19 Associated Death per Day” versus the timing and extent of the roll out of national vaccination campaigns in Sweden, Denmark, Netherlands, United Kingdom, France, Germany, Italy and USA shows that the decline in the severity of the COVID-19 pandemic was well advanced noticeably before vaccinations began or could have become a significant contributory factor. Israel is an outlier in its manifest decline pattern, yet the data also demonstrate that vaccination has had no discernible impact at all on % Deaths per Day in Israel.
Human societies throughout recorded history have been ravaged by suddenly appearing regional epidemics and in more recent centuries by epidemics that have been observed to spread globally [1,2]. The COVID-19 pandemic caused by coronavirus SARS-CoV-2 has caused serious global health emergencies and associated social and economic destruction on the citizens of many countries on a hitherto unprecedented scale. The disease emerged suddenly in Oct-Nov 2019 in Hubei region of Central China [3].
Pandemics as always emerge without any warning, cause their toll havoc and then predictably subside. They usually last in a severe form no more than a few years – as the data relating to the “Spanish Flu” of 1918-1919 clearly attests. The termination process of pandemics is not clearly understood, but it is generally assumed to be a combination of herd immunity, attenuation of the pathogen (leading to ill-defined mechanisms of endemicity) and its degradation in the physical environment. Thus, there are likely to be a wide range of factors in varying from country to country that contributes to the decline in disease severity and eventual its disappearance. We have attempted in this note to quantitatively measure the progress of the COVID-19 pandemic in a number of Northern Hemisphere countries from available public data from the time of its onset to the present day (August, 2021). We chose “% COVID-19 Associated Death per Day” as an objective end-point of the measure of severity of SARS-Co-V-2 induced disease. Such an index may reasonably allow a comparison across countries over and above country specific variable factors such as country-and region-specific technical and demographic variations in the application of the diagnostic PCR genomic test as a primary indicator of infection.
We report here a simple observation on the current status of the COVID-19 pandemic (as 15 Aug 2021) that could have a bearing on the timing of the likely end of the pandemic. We chose two straightforward metrics from data that are publicly available at Coronavirus websites (see Source Data URL links below). We selected those countries where much new Cases per Day data are available and where the Vaccination Campaign is ostensibly substantially advanced. The Cases (and Deaths) per Day by Country are at Google: Search “Coronavirus disease statistics”. Vaccination Rates by Country are Google Search “COVID-19 vaccination rates by country”. We largely chose key time points associated with the clear successive rolling epidemic peaks of new Cases per Day in each country. We then assumed a 14-day lag at that time point before the severe COVID-19 outcome of “Death” as an objective response rate (ORR) metric. These key time-point data were entered into an Excel spread sheet and primary graphic plots were developed for each country, and resulting figure of % Death per day versus % Population Vaccinated generated by standard Excel software. These primary plots were then adjusted for scale (mainly on the Y-axis for % Vaccination rate in that country) to allow a visual comparison with the % COVID-19 associated Death rate per Day at that time point.
Thus, the reference date along the X-axis in the summary country plots in Figure 1 (below) refers to the time point for new Cases per Day. The reader can draw their own conclusions but a clear trend is evident in all the data – the decline in % COVID-19 associated reported deaths was manifestly well advanced before the roll out of the intra-muscular mRNA expression vector vaccine program was begun or had become substantially advanced (e.g. significant in impact, say >20% population vaccinated). The USA is a vast country and its data may need to be analyzed State-by-State for granular trends in localized regions to become better apparent-like the countries of Europe chosen here. Israel is also a clear outlier in the basic trend – as that country did not suffer the same levels of % COVID-19 associated deaths as the others, even in the first wave in March-April 2020. However, the vaccination program on the basis of this data appears to have had no discernible impact at all on % Deaths in Israel. In many cases the waning of the death rates are seen to have progressed before the vaccination rates rose to substantial levels, probably pointing to the development of natural herd immunity as the most reasonable principal cause.
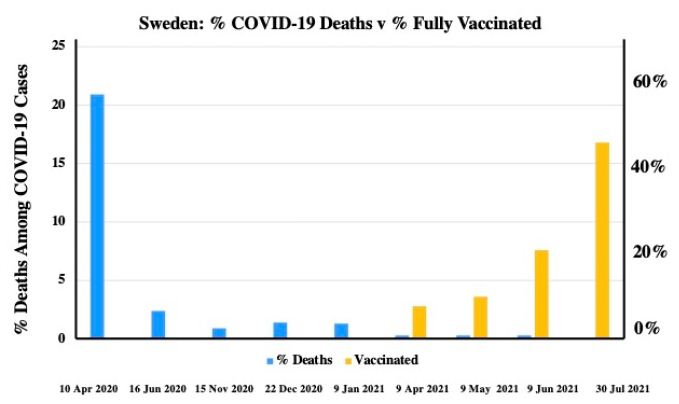
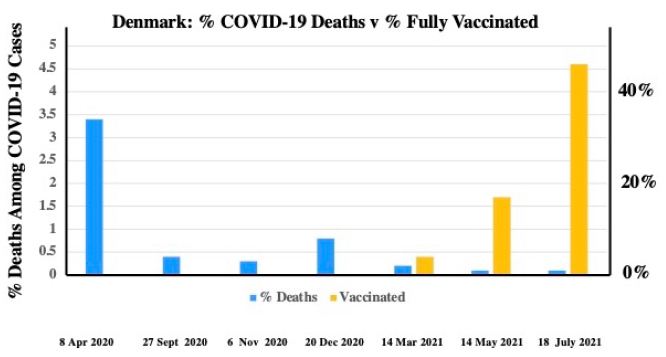
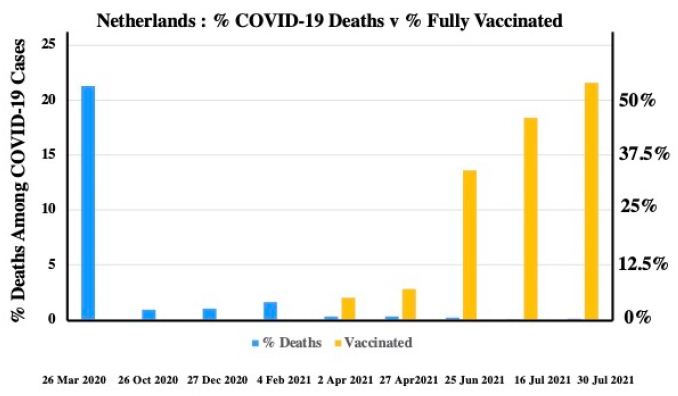
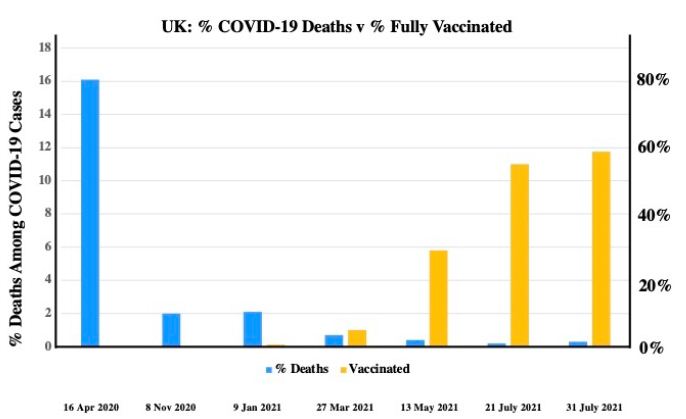
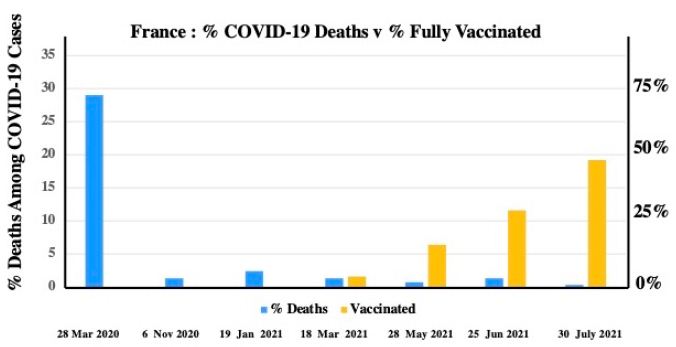
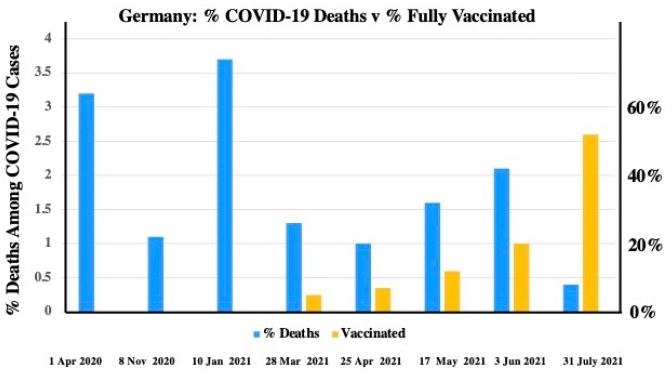
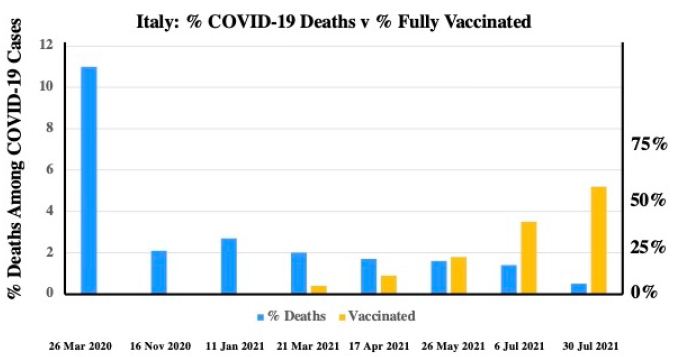
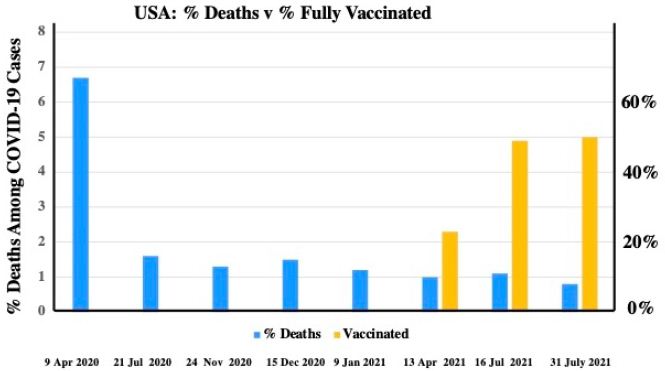
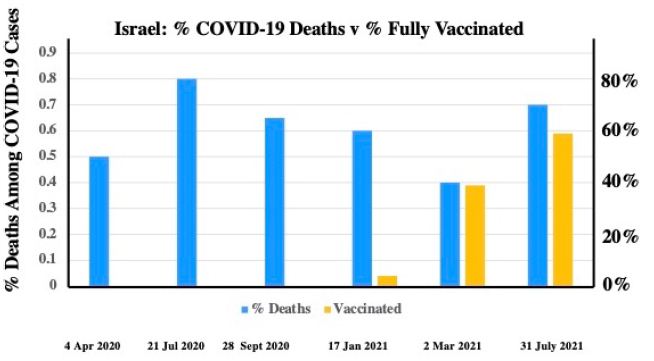
Figure 1: %COVID-19 Deaths per Day versus % Full Vaccination by Country at key times during the epidemic waves.
We refrain from further discussion of the many likely factors and variables that would need to be considered in a more exhaustive analysis. To conclude we leave the reader with two crucially important questions that urgently need to be dispassionately addressed. What do these plots mean for possibly heralding the termination of the pandemic? Is the long-awaited end really in sight across the world in mid-August 2021? And does a new world order beckon?
Source Data
COVID-19 Cases per Day, Deaths, Vaccination Rates 15 August 2021
Cases and Deaths per Day site.
Google: “Coronavirus disease statistics” URL is
This gives you the “Australia” dashboard (from there you can choose your country in the menu bar scroll)
Vaccination Rates by Country Google “covid-19 vaccination rates by country”
This gives you the “Australia” dashboard (from there you can choose your country in the menu bar scroll).
References
- Creighton C (1891) History of Epidemics in Great Britain. Cambridge University Press.
- Beveridge WIB (1977) The Last Great Plague. W. Heinemann, London.
- Pekar J, Worobey M, Moshiri N, Scheffler K, Wertheim JO (2021) Timing the SARS-CoV-2 index case in Hubei province. Science 372: 412-417.