Monthly Archives: September 2020

JDMR fig7

The Influence of Glass Content on the Hydraulic Conductance and Tubule Occlusion of Novel Bioactive GlassToothpastes

DOI: 10.31038/JDMR.2020332

Abstract

Bioactive glasses are widely used as additives in remineralising toothpastes for treating dentine hypersensitivity, which is associated with dentinal fluid flow within exposed dentinal tubules. This study investigates the weight percentage of a fluoride containing bioactive glass in a toothpaste formulation on tubule occlusion and fluid flow of mid coronal dentine discs. Tests were performed after brushing, after immersion in artificial saliva and after a citric acid challenge.

There was a statisticallly significant reduction in fluid flow after application of all the toothpastes but the fluid flow reduction was not statistically significantly above a 5% loading of bioactive glass in the toothpaste. Immersion In artificial saliva after brushing reduced the fluid flow for all loadings but was not statisticaly significant, whilst an acid challenge increased the fluid flow but was again not statistically significant.

SEM observations of mid coronal sections showed improved occlusion of the dentinal tubules up to a 5% loading but minimal further improvement for higher loadings.

In conclusion a 5% loading of bioactive glass is close to optimum for reducing fluid flow and tubule occlusion.

Keywords

Bioactive glass, Glass loading, Hydraulic conductance, Tubular occlusion, Dentine hypersensitivity

Introduction

Dentine Hypersensitivity (DH) is characterized as a sharp dental pain of short duration caused by the reaction of exposed dentine surfaces to stimuli, typically thermal, evaporative, tactile, osmotic or chemical that cannot be associated to any other dental defect of pathology [1]. It is based on the hydrodynamic theory where stimuli applied onto the exposed dentinal tubules cause fluid movement across the dentine, passing them to the intradental pulpal nerves and thereby initiating a painful sensation [2].

DH is known to usually impact on the quality of life of affected individuals by instigating painful sensation during eating and drinking hot and cold food and beverages [3]. The prevalence of DH in UK is estimated at 52% [4]. This figure however drops significantly when the conduct of the study shifted from patients’ self-reported questionnaires to clinical examinations by dentists. In clinical studies, the reported prevalence is 2.8% [5] and 18% [6] respectively.

The hydrodynamic theory is consistent with the observation that when DH is treated with a tubule-occluding agent, this will result in a reduction in DH [7,8]. Occlusion of exposed dentinal tubules is a widely used strategy for treating DH, and many Over-The-Counter (OTC) toothpastes propose tubule occlusion as their mode of action.

Previously, a bioactive glass (NovaMin®, developed originally by NovaMin Technology Inc., Alachua, FL, USA) based on the original 45S5 Bioglass® composition (US Biomaterials Corp. Jacksonville, FL, USA) has been used as a remineralising and occluding ingredient in toothpaste formulations for treating DH [9-17]. This works by precipitating Hydroxycarbonate Apatite (HCA) onto the tooth surface and subsequently occluding the dentinal tubules [12-17]. However, concerns have been expressed over the long-term durability of HCA in the mouth, and formation of Fluorapatite (FAp), rather than HCA is preferable, as it is more resistant to subsequent acid attack and dissolves less readily when exposed to acids (e.g. during consumption of fruit juice and carbonated beverages).

In recent years solid state Nuclear Magnetic Resonance Spectroscopy has been used to understand bioactive glass structure, enabling new bioactive glass compositions to be developed [18,19] with vastly improved bioactivity. Of particular note here are the fluorine containing bioactive glasses developed by Brauer et al. [20,21] and the high phosphate fluorine containing glasses developed by Mneimne et al. [22]. These new glass compositions release fluoride in addition to calcium and phosphate and form fluorapatite and have recently been developed specifically for toothpastes [23-31].

The objective of this paper is to investigate the ability of one of these new fluorine containing glasses to occlude dentinal tubules and to reduce fluid flow as a function of the amount of glass in the paste immediately after treatment, after immersion in saliva and after an acid challenge.

Materials and Methods

The materials and methods consisted of two stages. The first stage involved the preparation of the raw materials to be used for the study whereas the second stage comprised the experimental design, which covered the conduct of the study.

Collection of Teeth

A total of 108 extracted, caries-free human molars were collected from patients attending the walk-in clinic at Tanah Puteh Dental Clinic, Malaysia from May 2016 to August 2016. In accordance with local ethics in the Malaysian clinic verbal consent was obtained from patients who required extraction of their teeth. Following extraction, the teeth were washed and stored in Listerine (Listerine Original) mouthwash solution at room temperature. The collected teeth were then brought to London in September 2016 by SFT under strict health and safety guidelines as required by QMUL. On arrival in the UK laboratory the teeth transferred to a 70% Ethanol solution until the commencement of the study.

Preparation of Mid Coronal Dentine Sections

All the collected human molar teeth were prepared into dentine discs of 1.3 mm thickness using an automatic precision cutting machine (Struers Accutom 5, Denmark). The dentine discs were then ground using a Kemet 4 machine (Kemet Maidstone Kent ME15 9NJ UK) followed by polishing with three different silicon carbide papers in a descending order of abrasive coarseness, starting from carbide paper grade P600, P1000 to P2500. The polishing was considered complete when the discs were polished to the thickness of 1.0 mm. The thickness of the discs was monitored constantly using a digital micrometer to avoid over polishing.

Etching of Dentine Sections

The etching of dentine discs was only performed just before the discs were to be used for the experimental steps. It was undertaken by dipping the discs into 6% w/w citric acid solution for 30 seconds. The purpose of etching was to remove any smear layer on the discs, thereby opening up the tubules [32]. The discs were then ultrasonicated with deionized water in an ultrasonic bath for 30 seconds to remove any residual acid.

Preparation of Artificial Saliva

The artificial saliva is based on a formulation first proposed by Featherstone et al. [32] and consists of 2.24 grams of KCl, 1.36 grams of KH2PO4, 0.76 grams NaCl, 0.44 grams of CaCl2.2H2O, 2.2 grams of porcine Mucin and 0.2 grams of NaN3 (all Sigma-Aldrich, UK) were mixed with 800 grams of deionized water in a 1 litre volumetric flask. The mixture was stirred using a magnetic hotplate stirrer for 30 minutes until all reagents were fully dissolved. The mixture’s pH was then adjusted to 6.5 at room temperature using a pH meter (Oakton, Netherlands) by adding 0.5 M of KOH sequentially until the desired pH was obtained. Separately, 0.5 M of KOH was prepared beforehand by mixing 1.40 grams of KOH (Sigma-Aldrich, UK) in 50 ml deionized water. The final mixture was made up with deionized water to 1 litre. The produced artificial saliva solution was kept in a fridge set at 5°C until required and used within 2 weeks of preparation.

Preparation of Bioactive Glass Toothpaste

The Bioactive Glass BioMinF® was supplied by CDL Ltd Stoke UK and is a fluoride containing bioactive glass. The particle size of the supplied BioMinF® was characterised using a Malvern 3000 Particle Size analyser (Malvern Pananalytical Malvern WR14 1XZ, UK). For comparison a sample of NovaMin® was obtained from 3M (Ceradyne) Seattle USA.

Preparation of the Bioactive Glass Base Paste

This stage involved the preparation of the base paste first, which was then mixed with different loading of bioactive glass. The base paste was made in the laboratory according to the formulation in US Patent US 2009/0324516 [33] with slight modifications. Components such as bioactive glass, fluoride and flavour were omitted. The composition of the active and inactive ingredients required to produce 100 grams of base paste are listed in Table 1. Each ingredient was weighed separately and then mixed together with a metallic mixing spatula in a 100 ml plastic container. The end product was kept in room temperature until use.

Table 1: Composition of active and inactive ingredients required to produce 100 gram of base paste.

Component Function Weight Percentage
Glycerol Humectant 68.75%
Polyethylene Glycol Dispersant and to reduce stickiness 20.83%
K Acesulfame Sweetener 0.48%
Polyacrylic Acid Binder 0.59%
Titanium Oxide Whitener 1.91%
Syloid 63 Silica 7.15%
Sodium Dedecyl Sulfate Surfactant 1.01%


Five 10 grams toothpastes with a different loading of bioactive glass of 0.0%, 2.5%, 5.0%, 7.5%, 10.0% and 15.0% by weight were fabricated manually by using a mortar and pestle technique. The composition for each toothpaste is represented in Table 2.

Table 2: Composition of Bioactive Glass in Various Loading.

Type of Toothpaste                  Materials incorporated into each toothpaste
Base Paste (g) Bioactive glass (g)
0.0% loading 10.00 0.00
2.5% loading 9.75 0.25
5.0% loading 9.50 0.50
7.5% loading 9.25 0.75
10.0% loading 9.00 1.00
15.0% loading 8.50 1.50


To produce a 2.5% bioactive toothpaste, 9.75 grams of base paste were added to a clean mortar. This was followed by adding 0.25 grams of bioactive glass. The two elements were mixed thoroughly for 150 seconds. The same methods were applied to produce 5.0%, 7.5%, 10.0% and 15.0% loading of bioactive toothpaste. All the prepared toothpastes were stored in six separate sealed 50 ml plastic bottles until required.

The experimental design involves two parts:

     a) Comparing the dentine permeability by measuring hydraulic conductance (Lp).

     b) Comparing the occlusive effect of dentinal tubules using SEM.

Hydraulic Conductance Measurement Procedures

A split chamber device based on the design by Pashley and Galloway [34] was used. The total distance travelled by the air bubble in 240 seconds was designated as the baseline flow rate, which was allocated a value of 100% permeability.

Measuring the Dentinal Permeability after Treatment with Toothpaste

0.4 gram of toothpaste was squeezed onto a brush head (Oral-B Floss Action Replacement) and mounted on an electric rechargeable toothbrush (Oral-B Vitality Plus). Without removing the disc from the Pashley cell, it was treated with the toothpaste for 2 minutes. The brush head bristles were applied on to the discs at an inclination of 90 degrees. Immediately after 2 minutes of brushing, the disc was rinsed with deionized water for 10 seconds.

Measuring the Dentinal Permeability Post-treatment with Artificial Saliva

The dentine disc together with the Pashley cell were immersed in 40 ml of artificial saliva at room temperature for 1 hour and then rinsed with deionized water for 10 seconds. The dentine permeability was then measured again.

Measuring the Dentinal Permeability Post-treatment with Artificial Saliva and an Acid Challenge

The disc was next immersed in 30 ml of a 6% citric acid solution for 2 minutes and rinsed with deionized water for 10 seconds. The dentine permeability was then measured for a final time.

A total of 30 dentine discs were used. They were distributed equally into six groups, with each group treated with a different loading of toothpaste. Each toothpaste was dedicated with a specific brush head to avoid contamination with others. Analysis of the dentinal permeability measurement was conducted as follows:

     a) Percentage flow reduction after treatment with toothpaste

f1

     b) Percentage flow reduction after treatment with toothpaste and immersion in artificial saliva

f2

     c) Percentage flow reduction after treatment with toothpaste, immersion in artificial saliva and acid challenge

f3

       where V0 =  Dentine permeability at baseline (after acid etch)

                 V1 = Dentine permeability immediately after toothpaste application

                 V2 = Dentine permeability following immersion in artificial saliva

                 V3 = Dentine permeability following acid challenge

Scanning Electron Microscopy was conducted on separate samples according to the same protocols used for the dentine permeability measurements. The discs were sputter coated with gold prior to examination and examined in a FEI Inspect-F SEM.

Results

Particle Size Analysis

Table 3 gives the D90, D50 and D10 values for the particle size for two commercially available Bioactive Glasses. The particle size of the BioMinF® glass is somewhat smaller than the NovaMin® and is thought to have been optimised for tubule occlusion with a larger proportion of particles being smaller than the size of dentinal tubules.

Table 3: Particle Size of Bioactive Glasses.

BioActive Glass

D90

(μm)

D50

(μm)

D10

(μm)

BioMinF®

23.00 5.92

0.62

NovaMin® 45.55 14.47

1.77

Hydraulic Conductance

Figure 1 shows the percentage reduction in hydraulic conductance or fluid flow reduction (FFR) after brushing the toothpaste on to mid coronal dentine discs. There is a small approximately 20% reduction in hydraulic conductance after applying the 0% BG toothpaste that may be a result of silica particles in the paste occluding the tubules. This increases to approximately 30% for the 2.5% glass loading and to just over 60% for a 5% loading of the glass. Above 5% there is a much more limited reduction in the hydraulic conductance with the 15% loading giving a 70% reduction. Above 5% loading of glass there is no statistical increase in the FFR (Tables 4-7). However the FFR is statistically significant up to a 5% loading of glass.

fig1

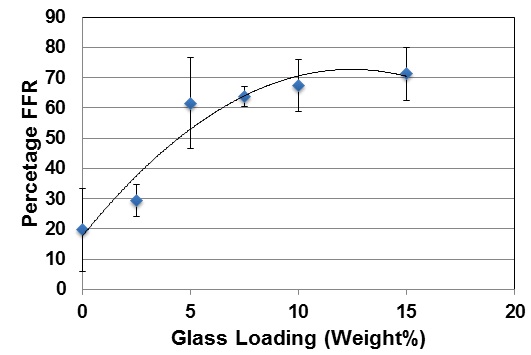
Figure 1: Percentage FFR against BioMinF Loading after Brushing.

Table 4: Statistical Result for Comparison of Percentage Fluid Flow Reduction after Toothpaste Application.

Comparison of Percentage Fluid Flow Reduction after Toothpaste Application
 Statistical Data Bioactive Glass Loading
0% 2.50% 5.00% 7.50% 10.00% 15.00%
Sample Mean (in %), x 19.72 29.37 61.53 63.63 67.39 71.19
Sample sd, s 13.71 5.31 15.02 3.33 8.61 8.77
Sample Size, n 5 5 5 5 5 5
Confidence Interval, CI 1.96 1.96 1.96 1.96 1.96 1.96
Margin of Error 12.02 4.65 13.16 2.92 7.55 7.69
Upper Bound 31.73 34.02 74.69 66.55 74.94 78.88
Lower Bound 7.70 24.72 48.36 60.70 59.84 63.51
Paired t-test Comparing Each Group (P<0.05)
T-test comparing to 0% 0.128529 0.000693 0.001276 0.002087 0.0022316
T-test comparing to 2.5% 0.004738 0.000264 0.000104 3.269E-05
T-test comparing to 5.0% 0.386578 0.238683 0.1454652
T-test comparing to 7.5% 0.246252 0.0712444
T-test comparing to 10.0% 0.2436429

Table 5: Percentage FFR in Comparison to the Baseline Control after treatment with the toothpaste after treatment with the toothpaste and immersion in artificial saliva (AS) and then with an acid challenge.

Bioactive Glass Loading Percentage FFR in Comparison with Baseline/Control (%)
After treatment with toothpaste After treatment with toothpaste and immersion in artificial saliva After treatment with toothpaste, immersion in artificial saliva and acid challenge
0.0% 19.72 22.29 16.11
2.5% 29.37 33.97 26.57
5.0% 61.53 63.83 49.02
7.5% 63.63 64.96 56.63
10.0% 67.39 66.29 55.53
15.0% 71.19 71.53 65.26

Table 6: Statistical Result for Comparison of Percentage Fluid Flow Reduction after Toothpaste Application and Saliva Immersion.

Comparison of Percentage Fluid Flow Reduction after Toothpaste Application and Saliva Immersion
Statistical Data Bioactive Glass Loading
0% 2.50% 5.00% 7.50% 10.00% 15.00%
Sample Mean (in %), x 22.29 33.97 63.83 64.96 66.29 71.53
Sample sd, s 17.14 5.58 18.70 3.85 6.04 13.59
Sample Size, n 5 5 5 5 5 5
Confidence Interval, CI 1.96 1.96 1.96 1.96 1.96 1.96
Margin of Error 15.03 4.89 16.39 3.38 5.29 11.91
Upper Bound 37.32 38.86 80.22 68.34 71.58 83.44
Lower Bound 7.27 29.07 47.44 61.58 61.00 59.62
Paired t-test Comparing Each Group (p<0.05)
T-test comparing to 0% 0.1560 0.0011 0.001758 0.003325 0.0073734
T-test comparing to 2.5% 0.019915 0.000576 0.000312 0.0009269
T-test comparing to 5.0% 0.446936 0.389115 0.2486045
T-test comparing to 7.5% 0.357676 0.182191
T-test comparing to 10.0% 0.1308723

Table 7: Statistical Result for Comparison of Percentage Fluid Flow Reduction after Toothpaste Application, Saliva Immersion and Acid Challenge.

Comparison of Percentage Fluid Flow Reduction after Toothpaste Application, Saliva Immersion and Acid Challenge
 Statistical Data Bioactive Glass Loading
0% 2.50% 5.00% 7.50% 10.00% 15.00%
Sample Mean (in %), x 16.11 26.57 49.02 56.63 55.53 65.26
Sample sd, s 14.39 3.63 20.55 5.17 15.04 10.75
Sample Size, n 5 5 5 5 5 5
Confidence Interval, CI 1.96 1.96 1.96 1.96 1.96 1.96
Margin of Error 12.61 3.18 18.01 4.53 13.18 9.42
Upper Bound 28.72 29.75 67.03 61.16 68.71 74.69
Lower Bound 3.50 23.39 31.01 52.09 42.35 55.84
Paired t-test Comparing Each Group (P<0.05)
T-test comparing to 0% 0.0734 0.0087 0.0006 0.0093 0.0035
T-test comparing to 2.5% 0.0353 5.46E-05 0.0047 0.0005
T-test comparing to 5.0% 0.2447 0.2922 0.0873
T-test comparing to 7.5% 0.4460 0.1220
T-test comparing to 10.0% 0.0952


Table 5 shows the FFR results after immersion in artificial saliva (AS) and then following an acid challenge to mimic the consumption of an acidic drink. In all cases there is an increase in the FFR from 0% to 2.5% to 5% and these differences are statistically significant (Tables 3 and 4). The results mirror the data before immersion in AS.

Above a 5% loading of BAG in the paste there are no statistically significant increases in the FFR. There was also no significant increase or decrease in the FFR values for any given loading from application to immersion in AS to applying an acid challenge. However, for all glass loadings there is a small decrease in the FFR following an acid challenge, but this was not statistically significant in paired t-tests in regard to either the brushed or the brushed with AS treatments.

Tubule Occlusion

The tubule occlusion was followed using scanning electron microscopy mid coronal dentine discs. Figure 2 shows the SEMs after brushing with the 0% BioMinF toothpaste. There is no visual evidence of any tubule occlusion, although there are a small number of fine particles on the treated surfaces. Figure 3 shows the SEMs of the 2.5% BioMinF toothpaste. There is significant tubule occlusion and a marked reduction in their size. The tubules are more obvious following the acid challenge. For dentine discs treated with 5% or more BioMinF loaded toothpastes (Figures 4-8) there is excellent tubule occlusion. There is slight evidence that this might improve slightly after immersion in AS and may deteriorate slightly on exposure to an acid challenge. There may be very slightly better tubule occlusion on increasing the glass loading above 5%.

JDMR fig2

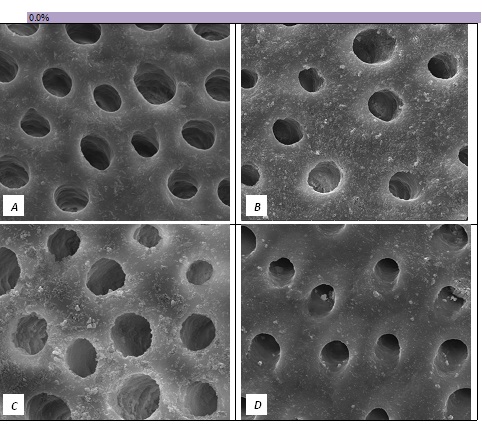
Figure 2: SEM Images seen at x10000 Magnification. (A) Control. (B) After 0.0% Bioactive Glass Toothpaste Application. (C) Following Saliva Immersion. (D) Following Acid Challenge.

JDMR fig3

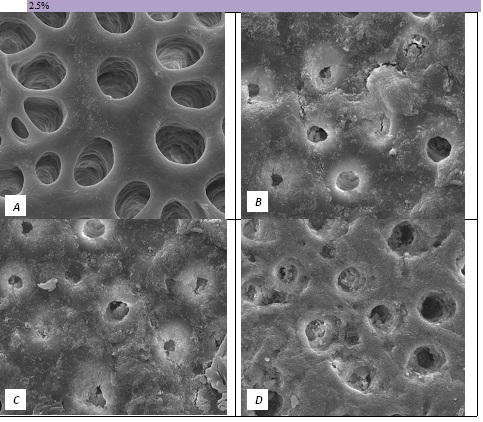
Figure 3: SEM Images seen at x10000 Magnification. (A) Control. (B) After 2.5% Bioactive Glass Toothpaste Application. (C) Following Saliva Immersion. (D) Following Acid Challenge.

JDMR fig4

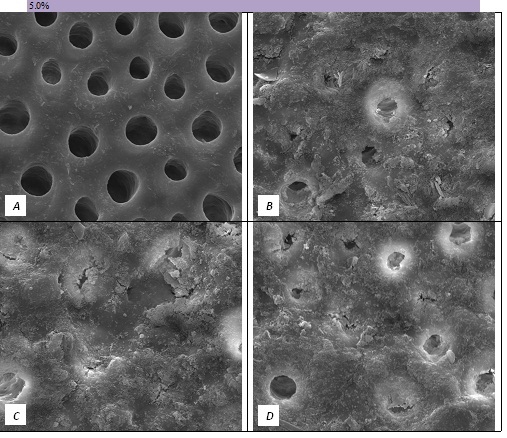
Figure 4: SEM Images seen at x10000 Magnification. (A) Control. (B) After 5.0% Bioactive Glass Toothpaste Application. (C) Following Saliva Immersion. (D) Following Acid Challenge.

JDMR fig5

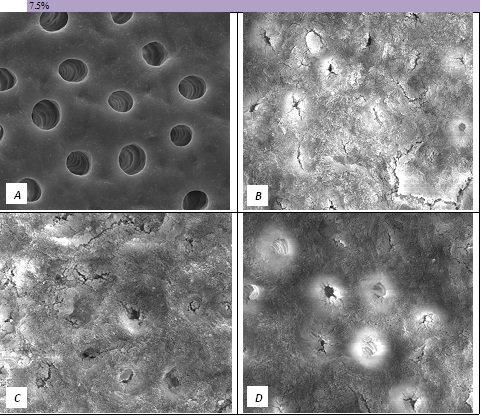
Figure 5: SEM Images seen at x10000 Magnification. (A) Control. (B) After 7.5% Bioactive Glass Toothpaste Application. (C) Following Saliva Immersion. (D) Following Acid Challenge.

JDMR fig6

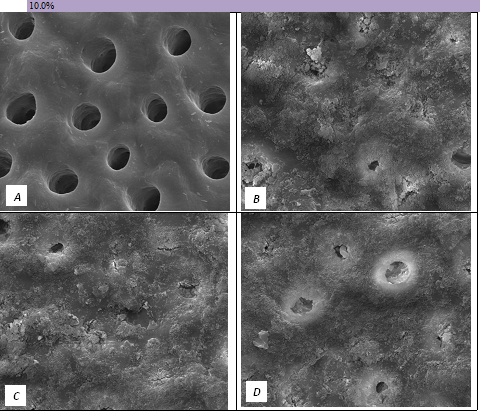
Figure 6: SEM Images seen at x10000 Magnification. (A) Control. (B) After 10.0% Bioactive Glass Toothpaste Application. (C) Following Saliva Immersion. (D) Following Acid Challenge.

JDMR fig7

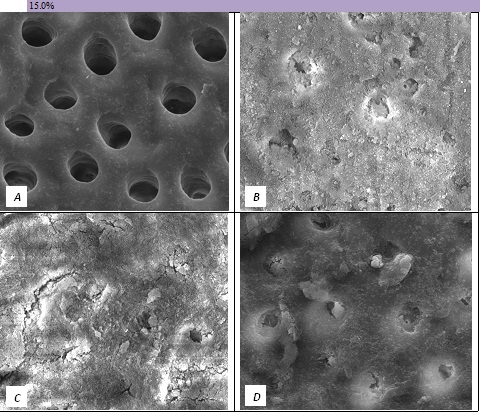
Figure 7: SEM Images seen at x10000 Magnification. (A) Control. (B) After 15.0% Bioactive Glass Toothpaste Application. (C) Following Saliva Immersion. (D) Following Acid Challenge.

JDMR fig8

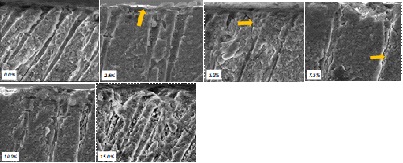
Figure 8: SEM Observation of all bioglass loading(s) following brushing (Cross-Sectional View at x5000 magnification).

At a 0.0% glass loading, there was no crystal formation at the surface or within the tubules. However, at 2.5%, a thin layer of crystal deposit (arrow) was observed covering the surface. As the bioactive glass loading increased, the crystal deposits were observed to extend deeper into the tubules (arrows). At the 15.0% bioactive glass loading, large amounts of crystal deposits were observed at the surface of the dentine disc and within the dentinal tubules.

In general the SEM observations fit well with the hydraulic conductance data and FFR values observed.

Discussion

In the absence of the glass in the toothpaste formulation there is a small reduction in hydraulic conductance and the FFR is about 20%, There may be some tubule occlusion due to the presence of fine particles in the paste, notably silica and titanium dioxide particles. There is no evidence of any significant tubule occlusion when examined by SEM. On incorporating 2.5% glass particles into the toothpaste there is a further approximately 10% increase in FFR. The glass has a D50 of 5.92 μm (Table 3) close to the diameter of the larger dentinal tubules and up to 50% of the glass particles are therefore potentially small enough to enter the dentinal tubules and occlude them. On increasing the loading of glass to 5% there will be twice as many particles present that are small enough to occlude the dentinal tubules and the FFR increases to more than 60%. Figure 3 shows much greater tubule occlusion for the 5% glass loading than Figure 2 for the 2.5% loading. More than 90% of the tubules are occluded with the 5% loading. On increasing the bioactive glass content further there were no statistically significant increases in FFR or any observable increase in tubule occlusion in the SEM micrographs. Above 5% there are probably sufficient numbers of particles smaller than the dentinal tubule diameter to fully occlude the tubules and more glass particles present in the higher loadings do not improve the tubule occlusion.

On immersion in AS all the samples show a small increase in the FFR values, however it is not statistically significant. Bioactive glasses react with physiological solutions to form apatite and in the case of fluoride containing bioactive glasses such as BioMinF® fluorapatite is formed. Fluorapatite formation is desirable because fluorapatite is much more resistant to acids than hydroxyapatite or calcium carbonate used to occlude tubules in other proprietary dentine hypersensitivity toothpastes. The micrographs are all very similar to the ones before immersion in AS.

On immersing the samples in 6% citric acid, to mimic the consumption of an acidic drink in the mouth the FFR values all decrease slightly. However statistically there is no significant reduction. The micrographs do show some evidence of more open tubules following the acid treatment, but the effect is small on tubule occlusion. There seems to be evidence that the material of the surface layer and in the entrances of the tubules is being dissolved but that material deeper within the tubules remains, this phenomenon is most marked in with the 2.5% glass loading. The surfaces of the dentine discs also become noticeably smoother and there is generally a loss of the angular glass particles on the surface that is probably a result of the citric acid dissolving the remaining glass particles. Bingel et al. [35] showed that bioactive glasses dissolve much more rapidly under acidic conditions.

Conclusions

      • A 5% loading of glass is close to being optimal in terms of its effect on FFR reduction immediately after brushing, after immersion in AS and after an acid challenge.
      • There is no statistically significant increase in FFR after immersion in AS and no statistically significant reduction after an acid treatment.
      • There is virtually no tubule occlusion for the 0% glass toothpaste and an obvious increasing tubule occlusion up to 5% after this there may be a very slight increase in tubule occlusion with glass loading, but the effect is small.
      • There is a slight effect of immersion in AS improving tubule occlusion and there may be a slight reduction in tubule occlusion on applying an acid challenge.
      • It is possible that a higher loading of glass would be desirable, but this would involve a significant cost increase.

References

      1. Dowell P, Addy M (1983) Dentine hypersensitivity–a review. Aetiology, symptoms and theories of pain production. J Clin Periodontol 10: 341-350. [crossref]
      2. Brännström M, Åström A (1972) Hydrodynamics of dentine—its possible relationship to dentinal pain. International Dental Journal 22: 219-227. [crossref]
      3. Gillam DG (2013) Diagnosis and management of dentine sensitivity. Dental Nursing 9: 320-327.
      4. Gillam DG, Seo HS, Bulman JS, Newman HN (1999) ‘Perceptions of dentine hypersensitivity in a general practice population’. J Oral Rehabil 26: 710-714. [crossref]
      5. Rees JS, Addy M (2004) A cross-sectional study of buccal cervical sensitivity in UK general dental practice and a summary review of prevalence studies’. Int J Dent Hyg 2: 64-69. [crossref]
      6. Orchardson R, Collins WJ (1987) ‘Clinical features of hypersensitive teeth’. Br Dent J 162: 253-256. [crossref]
      7. Pashley DH, Meara JA, Kepler EE, Galloway SE, Thompson SM, et al. (1984) ‘Dentin permeability. Effects of desensitizing dentifrices in vitro’. J Periodontol 55: 522-5. [crossref]
      8. Pashley D (1986) Dentin permeability, sensitivity and treatment through tubule occlusion. Journal of Endodontics 12: 465-474. [crossref]
      9. Gillam DG, Tang JY, Mordan NJ, Newman HN (2002) The effects of a novel Bioglass® dentifrice on dentine sensitivity: a scanning electron microscopy investigation. J Oral Rehabil 29: 305-313. [crossref]
      10. Burwell A, Jennings D, Muscle D, Greenspan DC (2010) NovaMin and dentin hypersensitivity–in vitro evidence of efficacy. J Clin Dent 21: 66-71. [crossref]
      11. LaTorre G, Greenspan DC (2010) The role of ionic release from NovaMin (calcium sodium phosphosilicate) in tubule occlusion: an exploratory in vitro study using radio-labeled isotopes. J Clin Dent 21: 72-76. [crossref]
      12. Litkowski L, Greenspan DC (2010) A clinical study of the effect of calcium sodium phosphosilicate on dentin hypersensitivity–proof of principle. J Clin Dent 21: 77-81. [crossref]
      13. Salian S, Thakur S, Kulkarni S, LaTorre G (2010) A randomized controlled clinical study evaluating the efficacy of two desensitizing dentifrices. J Clin Dent 21: 82-87. [crossref]
      14. Kanwal N, Brauer DS, Earl J, Wilson RM, Karpukhina N. and Hill R.G (2018) “In-vitro apatite formation capacity of a bioactive glass – containing toothpaste” J Dent 68: 51-58. [crossref]
      15. Greenspan DC (2010) NovaMin and tooth sensitivity-an overview. J Clin Dent 21: 61-65. [crossref]
      16. Earl JS, Ward MB, Langford RM (2010) Investigation of dentinal tubule occlusion using FIB-SEM milling and EDX. J Clin Dent 21: 37-41 [crossref]
      17. Earl JS, Topping N, Elle J, Langford RM, Greenspan DC (2011) Physical and chemical characterization of the surface layers formed on dentin following treatment with a fluoridated toothpaste containing NovaMin. J Clin Dent 22: 68-73 [crossref]
      18. Elgayar I, Aliev AE, Boccaccini AR, Hill RG (2005) Structural analysis of bioactive glasses. Journal of Non-Crystalline Solids 351: 173-183. [crossref]
      19. O’Donnell MD, Watts SJ, Hill RG, Law RV (2009) The effect of phosphate content on the bioactivity of soda-lime-phosphosilicate glasses. Journal of Materials Science: Materials in Medicine 20: 1611-1618. [crossref]
      20. Brauer DS, Karpukhina N, Law RV, Hill RG (2009) Structure of fluoride-containing bioactive glasses. Journal of Materials Chemistry 19: 5629-5636.
      21. Brauer DS, Karpukhina N, O’Donnell M, Law RV, Hill RG (2010) “Fluoride containing bioactive glasses: Effect of glass design and structure on degradation, pH and apatite formation in simulated body fluid” Acta Biomaterialia 6: 3275-3282.
      22. Mneimne M, Hill RG, Bushby AJ and Brauer DS (2011) “High phosphate content significantly increases apatite formation of fluoride-containing bioactive glasses”. Acta Biomaterialia 7: 1827-1834. [crossref]
      23. Lynch E, Brauer DS, Karpukhina N, Gillam DG and Hill RG (2012) “Multicomponent bioactive glasses of varying fluoride content for treating dentin hypersensitivity”. Dental Materials 18: 168-178.
      24. Imran Farooq, Imran Alam Moheet, Emad AlShwaimi (2015) In vitro dentin tubule occlusion and remineralization competence of various toothpastes Archives of Oral Biology 60: 1246-1253. [crossref]
      25. Patel VR, Shettar L, Thakuri S, Gillam D, Kamal DN (2019) A randomised clinical trial on the efficacy of 5% fluorocalcium phosphosilicate‐containing novel bioactive glass toothpaste. J Oral Rehabil 46: 1121-1126. [crossref]
      26. Luiza Pereira Dias da Cruz, Robert G Hill, Xiaojing Chen, David G. Gillam (2018) Dentine Tubule Occlusion by Novel Bioactive Glass-Based Toothpastes. International Journal of Dentistry. [crossref]
      27. Shalini D Aggarwal, Anamika Borkar, Nikhil Borse, Aneesha Acharya (2019) Comparative evaluation of fluoro calcium phosphosilicate, calcium sodium phosphosilicate, and strontium chloride hexahydrate containing dentifrice for the treatment of dentin hypersensitivity: A randomized single-blind study. Journal of International Oral Health 11: 404-411.
      28. Ella A Naumova, Moritz Staiger, Ouafaa Kouji, Jakov Modri, Thessa Pierchalla, et al. (2019) Randomized investigation of the bioavailability of fluoride in saliva after administration of sodium fluoride, amine fluoride and fluoride containing bioactive glass dentifrices. BMC Oral Health 19: 119.
      29. Shaikh K, Pereira R, Gillam DG, Phad S (2018) Comparative evaluation of desensitizing dentifrices containing BioMin®, Novamin® and fluoride on dentinal tubule occlusion before and after a citric acid challenge– A scanning electron microscope in‐vitro study. J Odontol 2: 105.
      30. Saqib Ali, Imran Farooq, Ahmad M Al-Thobity, Khalifa S Al-Khalifa, Khalid Alhooshani and Salvatore Sauro (2019) An in-vitro evaluation of fluoride content and enamel remineralization potential of two toothpastes containing different bioactive glasses. Bio-Medical Materials and Engineering 30: 487-496. [crossref]
      31. Farooq, I, Majeed A, Al Shwaimi, E, Almasc K (2019) Efficacy of a Novel fluoride Containing Bioactive Glass Based Dentifrice in Remineralising Artificially Induced Demineralisation in Human Enamel. Fluoride 52: 447-455.
      32. Matos AB, Palma RG, Saraceni CHC, Matson E (1997) Effects of Acid Etching on Dentin Surface: SEM Morphological Study Braz Dent J 8: 35-41. [crossref]
      33. Muscle DP, Burwell KA, La Torre G. Composition and methods for enhancing fluoride uptake using bioactive glass.
      34. Pashley DH, and Galloway E (1985)The effects of oxalate treatment on the smear layer of ground surfaces of human dentine. Archives of Oral Biology 30: 731-737. [crossref]
      35. Bingel L, Groh D, Karpukhina N, Brauer DS (2015) Influence of dissolution medium pH on ion release and apatite formation of Bioglasss 45S5. Materials Letters 14: 3279-3282.

COVID-19 Infection Presenting as Acute Onset Focal Status Epilepticus in a Nine Year Old Boy

DOI: 10.31038/JNNC.2020322

Abstract

Atypical  presentations of COVID-19 in children, such as new onset seizures must be recognized, and warrant liberal testing to prevent spread of      the disease. We describe the unique presentation of a child with acute onset focal status epilepticus and vomiting, positive for COVID-19. Patient demographics, history, neurological findings, MRI, treatment, and prognosis were reviewed. The literature was reviewed for prior case reports. This nine year old boy had an episode of vomiting followed by acute onset focal status epilepticus. He was able to walk with assistance but could not speak or follow most commands. He had persistent left eye gaze deviation which could not be overcome and loss of motor function in his right arm. He   also developed left arm automatisms. These symptoms lasted for approximately 90 minutes before resolution following administration of lorazepam. Ten hours after the onset of symptoms our patient developed a temperature of 38.6 and began vomiting again. COVID-19 testing was performed and resulted positive. He had no medical history, no known sick contacts, and there was no family history of seizures or epilepsy. Pediatric patients with COVID-19 present with a broader spectrum of symptoms than adults. While fever and cough are the most common presenting symptom in both the pediatric and adult populations, GI symptoms are more common in the pediatric population. It is important to be aware that atypical presentations including neurologic symptoms are being noted in the pediatric population and may indicate the presence of infection rather than another etiology. This is only the second documented pediatric patient in the world to present with seizure and test positive for COVID-19.

Keywords

Children, Novel Corona virus, Status epilepticus

Introduction

Estimates suggest children currently account for 1%-5% of diagnosed COVID-19 cases [1,2]. Available literature focusing on children is limited in comparison to adults but suggests the clinical spectrum of illness in the pediatric population associated with severe acute respiratory syndrome coronavirus 2 (SARS-CoV-2) which causes coronavirus disease 2019 (COVID-19) is distinct from and broader than that in the adults. The most frequently reported symptoms in adults with COVID-19 include fever, dry cough, fatigue, and in severe cases dyspnea is common [3]. Children, when symptomatic, also present with fever and cough, but a significant proportion present with atypical symptoms such as vomiting and diarrhea [4,5]. A large proportion of COVID-19 positive children are asymptomatic or have mild cases of disease [6,7]. This difference in presentation and severity may lead to underdiagnosis in children facilitating spread of the disease [8]. This report documents the first reported case of a COVID-19 positive child presenting with focal status epilepticus.

Case History

On the evening of admission our patient, a healthy 9 year old boy of Brazilian Portuguese descent, was at his aunt’s home for dinner. At 2200 hours he became nauseous and vomited one time. He was given an antacid and driven back to his parents’ house where he arrived at 2300 hrs. He required assistance but was able to walk into his house where his mother noticed fixed eye deviation to the left, inability to move the right arm, and was unable to speak. He was able to follow commands and was even able to take a shower. One hour after symptom onset, he was reaching out with his left hand for objects that were not there. He was also producing clicking sounds with his tongue. His mother became concerned that he was not improving and transported him to the Emergency Department for evaluation where he was able to walk under his own power.

In the Emergency Department, he was afebrile and vital signs were normal for age. There were no signs of meningismus. He had fixed left eye deviation with absent oculocephalic reflexes, 4 mm pupils responsive bilaterally, a fine tremor in the distal right upper extremity, which was not suppressible, and left arm automatisms. He was aphasic. Our patient was given 1 mg lorazepam IV which terminated his gaze deviation, abnormal movements, and aphasia with return to baseline mental status shortly afterwards. He was then loaded with levetiracetam 20 mg/kg. This child had no significant medical history, immunizations were up to date, took no medications, had no drug allergies, had no history of hospitalizations or surgeries, and had no family history of seizures or epilepsy. He had no recent head trauma, no fevers, URI symptoms, GI symptoms, sick contacts, or recent foreign travel.

Clinical Findings

Laboratory evaluations included a glucose level of 147 mg/dl. CBC and Chem10 were normal. LFTs showed a mild transaminitis. Urine toxicology screen and chest x-ray were normal. CT of the head without contrast was normal. LTM vEEG was abnormal due to the presence of nearly continuous delta slowing seen broadly throughout the right hemisphere, indicative of cortical and subcortical dysfunction. No epileptiform features were seen. Following admission overnight, our patient had returned to baseline mental status without any further clinical seizure activity. On the morning following admission, ten hours after his initial onset of symptoms, our patient developed a temperature of 38.6 C and experienced multiple episodes of vomiting. He was given ondansetron for nausea and acetaminophen for fever, after which symptoms resolved. In the setting of the COVID-19 pandemic, the acute onset of fever with GI symptoms suggested possible infection with the coronavirus. A test was obtained and resulted positive later on the day of admission. An MRI of the Brain was planned due to the focal neurological findings but was deferred due to his positive coronavirus test. Due to the highly infectious nature of COVID-19, his MRI would require scheduling during a low volume period with additional time required to disinfect the scanning equipment, in turn prolonging his admission and possibly exposing staff and other patients. Our patient was asymptomatic and had a normal examination. Thus the decision was made to provide pharmacologic coverage for seizure control and discharge to home, with outpatient MRI follow up after quarantine.

Our patient was in optimal health prior to the onset of symptoms. His presentation with acute focal status epilepticus and vomiting was typically concerning for an infectious etiology, intracranial process, or structural abnormality. He was afebrile, without leukocytosis, had no signs of meningismus or encephalopathy, and had no known sick contacts, so a lumbar puncture was deferred and antibiotics were not started. Computed tomography of the head was normal, indicating mass or hemorrhages were unlikely. Resolution of his presenting symptoms with lorazepam suggested seizure as an etiology.

Discussion

Prior to the COVID-19 result, thought was also given to norovirus and rotavirus infections as those two viruses are associated with seizures in children. Benign convulsions associated with mild gastroenteritis (CWG) are associated with norovirus and rotavirus, however, the highest incidence occurs in children 12-24 months, and is characterized by generalized tonic-clonic seizure activity lasting < 5 minutes [9]. This was inconsistent with our patient’s presentation. Our patient was outside of the expected age group for febrile seizures or CWG, and his presenting seizure was prolonged and focal in semiology. Furthermore, his electroencephalogram the following day revealed diffuse and continuous right hemispheric slowing. All of these features were atypical for febrile seizures or CWG. Yet, given his rapid return to baseline neurological functioning the following morning, acute infectious encephalitis and stroke were similarly unlikely.

Our patient was discharged to home quarantine. At his follow up visit two weeks later, our patient reported no further seizure activity and had returned to his baseline excellent health. Magnetic resonance imaging of the brain was normal without any signs for ischemic injury or structural lesions to account for his seizure. Anticonvulsant therapy was continued pending a following EEG. The current COVID-19 literature documents the clinical symptoms of over 3000 children world-wide and the spectrum of disease in children is still emerging. Only one two year-old girl in China has previously been reported to present with fever, convulsions, and GI symptoms and test positive for COVID-19 [10]. By contrast, the adult literature contains a growing number of COVID-19 positive patients presenting with central nervous system symptoms, including encephalopathy and seizures. A recent report describes a 78 year old woman presenting with focal status epilepticus as a unique clinical feature of COVID-19 [11]. While the link between COVID-19 infection and epileptogenesis has not been established yet, there is a physiologically logical hypothesis to propose linking the two. First, infection is by far the leading cause of focal status epilepticus in children, even outside the setting of direct infection of the meninges. Coronavirus is also thought to cause a dysregulated immune response which ultimately causes much of the morbidity and mortality associated with the disease. It is reasonable that an infectious etiology such as COVID-19 may cause seizures through alterations of cytokine responses, which are also implicated as an etiologic factor in febrile seizures. In this time of pandemic, it is important to recognize atypical presenting symptoms of COVID-19 such as new onset seizures, test liberally, and isolate those infected to prevent spread of the disease [12]. If focal status epilepticus is a unique presenting feature of COVID-19, our patients’ full outcome suggests that this rare presentation may portend a favorable prognosis.

Competing Interests

The authors declare that they have no competing interests.

Funding Information

No internal or external funding for this manuscript. The authors have indicated they have no financial relationships relevant to this article to disclose.

References

  1. Tezer H, Bedir Demirdağ T (2020) Novel coronavirus disease (COVID-19) in children. Turk J Med Sci 50: 592-603. [crossref]
  2. Ludvigsson JF (2020) Systematic review of COVID-19 in children shows milder cases and a better prognosis than adults. Acta Paediatr 109: 1088-1095. [crossref]
  3. Rothan HA, Byrareddy SN (2020) The epidemiology and pathogenesis of coronavirus disease (COVID-19) outbreak. J Autoimmun 109: 102433. [crossref]
  4. Cai J, Xu J, Lin D, Zhi Yang, Lei Xu, et al. (2020) A Case Series of children with 2019 novel coronavirus infection: clinical and epidemiological features [published online ahead of print, 2020 Feb 28]. Clin Infect Dis ciaa198. [crossref]
  5. Hong H, Wang Y, Chung HT, Chen CJ (2020) Clinical characteristics of novel coronavirus disease 2019 (COVID-19) in newborns, infants and children. Pediatr Neonatol 61: 131-132. [crossref]
  6. Cruz AT, Zeichner SL (2020) COVID-19 in Children: Initial Characterization of the Pediatric Disease. Pediatrics e20200834. [crossref]
  7. Tan YP, Tan BY, Pan J, Wu J, Zeng SZ, et al. (2020) Epidemiologic and clinical characteristics of 10 children with coronavirus disease 2019 in Changsha, China. J ClinVirol 127: 104353. [crossref]
  8. Chang TH, Wu JL, Chang LY (2020) Clinical characteristics and diagnostic challenges of pediatric COVID-19: A systematic review and meta-analysis. J Formos Med Assoc 119: 982-989. [crossref]
  9. Ma X, Luan S, Zhao Y, Lv X, Zhang R (2019) Clinical characteristics and follow-up of benign convulsions with mild gastroenteritis among children. Medicine (Baltimore) 98: e14082. [crossref]
  10. Tan YP, Tan BY, Pan J, Wu J, Zeng SZ, et al. (2020) Epidemiologic and clinical characteristics of 10 children with coronavirus disease 2019 in Changsha, China. J ClinVirol 127: 104353. [crossref]
  11. Vollono C, Rollo E, Romozzi M, Frisullo G, Servidei S, et al. (2020) Focal status epilepticus as unique clinical feature of COVID-19. a case report, Seizure: European Journal of Epilepsy 78: 109-112. [crossref]
  12. Shen K, Yang Y, Wang T, Dongchi Zhao, Yi Jiang, et al. (2020) Diagnosis, treatment, and prevention of 2019 novel coronavirus infection in children: experts’ consensus statement. World J Pediatr 16: 223-231. [crossref]
fig3

An In Vitro Study for the Detection of Breast Cancer by Computed Tomography Using Targeted Gold Nanoparticles

DOI: 10.31038/NAMS.2020321

Abstract

Breast cancer is the second most commonly diagnosed type of cancer worldwide and one of the leading causes of death in women in developed countries, second only to lung cancer. Standard clinical imaging techniques such as mammography, ultrasound and MRI can readily identify anatomical patterns, tumor location and size, but they cannot distinguish between benign and malignant lesions and are not able to detect metastases smaller than 0.5 cm. We have developed a targeted gold nanoparticle (AuNP) for the CT detection of breast cancer. To enable homing to breast cancer, AuNPs are coated with 2-Deoxy-D-Glucose that facilitates their binding to the Gluocose transporter (Glut-1), a cellular transmembrane receptor linked to the progression of breast cancer. Breast cancer cells MDA-MB-231, macrophages RAW 264.7 and fibroblasts MC 3T3.E1 were scanned using a pre-clinical CT scanner after incubation with AuNPs to analyze for AuNPs uptake. Breast cancer cells showed the most intense signal for 2-DG-AuNPs (916 HU), with almost no signal registered for the bare AuNPs (22 HU) or for the control sample (19 HU). In conclusion, 2-DG-AuNPs are a feasable targeting contrast agents for breast cancer detection, ensuring high contrast enhancement and low toxicity.

Keywords

Gold nanoparticles, Computed tomography, Breast cancer detection, Contrast agents, Glut-1

Introduction

Breast cancer is the second most commonly diagnosed type of cancer worldwide and one of the leading causes of death in women in developed countries, second only to lung cancer [1,2]. Although the overall 5-year survival rate in patients with breast cancer has improved over the past decades, the disease is still a serious public health threat [3,4]. More than 3.5 million women in the United States are living with a history of breast cancer and in 2014 approximately 41,213 deaths caused by this type of cancer were registered [1,2,5].

Despite the undeniable concern posed by this disease, recent advancements in screening and treatment techniques, such as surgery, radiotherapy and adjuvant systemic therapy (endocrine therapy, chemotherapy with anthracyclines and taxanes) have brought little improvement to the life expectancy and quality of life of breast cancer patients [5]. The golden standard for breast cancer imaging is mammography [6]. Early detection and diagnosis strongly correlate with a better outcome and higher survival rates and there is evidence that mammography screening could reduce breast cancer mortality rates in several countries [6,7]. However, in women with dense breasts, the sensitivity of mammography is only 62.9% and the specificity is 89.1%, as opposed to 87% sensitivity and 96.9% specificity in women with fatty breasts. Younger women are more likely to have dense breast tissue and cancer lesions are therefore harder to diagnose with conventional mammography in this patient group [6-8]. Moreover, mammography has a sensitivity of only 55-68% for the diagnosis of locally recurrent breast cancer. This is particularly due to the post-operative benign changes that appear after Breast Conserving Surgery (BCS), such as edema, calcifications, asymmetry and skin thickening [8,9]. Another disadvantage would be the discomfort caused by the compression of the breasts and the exposure to high doses of ionized radiation [8].

Standard clinical imaging techniques such as mammography, ultrasound and MRI are classified as structural imaging modalities because although they can readily identify anatomical patterns and tumor location and size, they cannot distinguish between benign and malignant lesions and are not able to detect metastases smaller than 0.5 cm [10]. Due to these limitations, a new field of imaging has been raising interest in recent years: nanoimaging.

Nanoparticles have unique physiological, optical and magnetic characteristics which bring new possibilities to the field of imaging [11,12]. Their size usually ranges between 1-100 nm and they can have different properties depending on shape, size and surface chemistry [10,13,14]. They can be used for imaging specific receptors, vascular abnormalities and even innate immune responses [13].

Gold nanoparticles (AuNPs) are attractive nanoparticles to study as Computed Tomography (CT) contrast agents [14-16]. Computed Tomography is one of the most common imaging modalities in hospitals as a diagnostic tool, having the advantages of providing superior tissue penetration and spatial resolution [6,17,18]. CT works by visualizing differences between tissue densities, which results in clear anatomical images. However, in order to see the differences between diseased and normal tissues, specific contrast agents need to be used. Radiopaque X-ray contrast agents are usually injected intravenously and exhibit non-specific penetration and binding, as well as rapid renal excretion [19]. These limitations have determined a surge in the research of targeting agents and cellular imaging, using metal-based agents instead of the traditional iodinated ones, such as Omnipaque or Visipaque [17,18,20].

Gold has proven to be an attractive alternative to conventional contrast agents, having a higher atomic number and a higher absorption coefficient compared to iodine. Due to these properties, gold nanoparticles offer a 3-fold increase in contrast per unit weight compared to iodine-based contrast agents [18,19,21]. Moreover, imaging gold nanoparticles at 80-100 kV provides lower soft tissue absorption, as well as allowing the reduction of bone tissue interference [19]. Gold nanoparticles can be prepared in various sizes and can be selected to facilitate specific extravasation through angiogenic endothelium such as those present in the leaking vasculature of cancer cells. Safety is an obvious consideration with any contrast agent. There is extensive experience with the use of gold in the treatment of various inflammatory and infective conditions in humans such as rheumatoid arthritis.

Bare gold nanoparticles exhbit rapid renal clearance. The rapid clearance and aggregation of AuNPs can be prevented by using a coating agent such as Polyethylene Glycol (PEG) [18,19,22,23]. The coating can be done using a short-strand PEG derivative, such as PEG-SH and/or a longer one such as OPSS-PEG-SVA (orthopyridyldisulfide-polyethyleneglycol-N-hydroxysuccinimide). OPSS-PEG-SVA is being used for the covalent couple of a highly specific ligand, resulting in a targeting agent specific for one cellular group.

We have developed a biocompatible targeted radiocontrast agent based on goldnanoparticles (AuNPs) which has the advantages of offering 3-fold greater contrast per unit weight than iodine-based x-ray contrast agents. Glucose transporter (Glut) is a cellular transmembrane receptor linked to the progression of various types of cancer. It had been previously demonstrated that MDA-MB-231 and MCF-7 breast cancer cells are characterized by over-expression of Glut-1. It is also known that 2-deoxy-D-glucose (2-DG) are specific ligands for Glut-1 [24,25]. Our imaging platform consists of 2-deoxy-D-glucose covalently coupled to spherical gold nanoparticles to target Glut-1 over-expressed by breast cancer cells.

Material and Methods

Materials

Sodium citrate, gold chloride and Picrosirius Red stain (Direct Red 80, Picric acid solution and Hematoxylin Solution A according to Weigert) were purchased from Sigma-Aldrich (St. Louis, MO, USA). OPSS-PEG-SVA was purchased from Laysan Bio (Arab, AL, USA). PES membranes (3000 MWCO) were purchased from Fisher Scientific. Silver enhancement staining kit was purchased from Structure Probe, Inc. (West Chester, PA, USA). DMEM, Fibroblast Basal Media and Fibroblast Serum-Free Growth kit were purchased from ATCC (Manassas, VA, USA), Primary anti-Glut1 antibody was purchased from Fisher Scientific, Alexa Fluor 288 goat anti-rabbit IgG (H+L) was purchased from AbCam (Cambridge, MA, USA), Vectashield mounting medium with DAPI was purchased from Vector Laboratories Inc. (Burlingame, CA, USA), Phalloidin was purchased from Invitrogen (Carlsbad, CA, USA), MTT assay kit was purchased from Roche Applied Science (Indianapolis, IN, USA), 2-Deoxy-D-Glucose was purchased from VWR, D (+)-Glucosamine hydrochloride was purchased from Fisher Scientific. Highest grade V1 mica discs 12 mm were purchased from Ted Pella, Inc., (Redding, CA, USA).

Gold Nanoparticle Synthesis

AuNPs were prepared by a method involving the reduction of chloroauric acid with a sodium citrate solution. Nanopure water (500 ml) was filtered through 0.22 μm filter and boiled in a 1 L conical flask. 5 ml of Gold Chloride (10%) was added to the boiling water followed by 4 ml of 1% sodium citrate solution. The solution was boiled for about an hour or until 200 ml of solution was left. The solution has a burgundy color. Next, the AuNPs were pegylated with polyethylene glycol derivatives in order to avoid aggregation. The AuNPs were incubated for 1 hour with a 100:1 molar ratio of PEG-SH to prevent aggregation and with 50:1 OPSS-PEG-SVA for the covalent coupling of the 2-DG. After pegylation, the AuNPs were further concentrated by centrifugation at 3270 rpm for 60 min. The AuNPs collected were further concentrated using PES membrane concentrators (MWCO 10,000) to a final concentration of ~40 mg Au/ml. The AuNPs were characterized in terms of size and polydispersity by UV Spectrophotometry and Dynamic Light Scattering (Malvern Nano-ZS Zetasizer, Malvern Instruments Ltd., a Spectris Company; Worcestershire, UK). The particles were also analyzed by Atomic Force Microscopy.

2-Deoxy-D-Glucose-AuNPs Synthesis

A solution of 2-deoxy-D-glucose (2-DG) (4 mg of 2-DG in 2 mL of nanopure water) was added to 2.2 mL of AuNPs solution (6 nM) and left to stir overnight at room temperature. The unbound 2-DG was removed by centrifugation through PES membrane tubes at 3270 rpm, for 1 hour. The 2-DG-AuNPs were reconstituted with 1 mL of nanopure water.

Assessment of Glut-1 Expression in Cells

The cells were grown overnight on 8-chamber slides. They were fixed with 300 µl of 4% formalin for 10 minutes and then incubated with 500 µl of 1% BSA (10% normal goat serum, 0.3M glycine) in 0.1% PBS-Tween for 1 hour to permeabilize the cells and block non-specific protein-protein interactions. The cells were then incubated with 300 µl of antibody (ab652, 1:1000 dilution) overnight at 4ºC. Next, the cells were washed thouroughly with PBS followed by incubation with the secondary antibody, Alexa Fluor® 288 goat anti-rabbit IgG (H+L), used at a 1:1000 dilution for 1 hour at room temperature. The cells were washed with PBS and the slides mounted with DAPI-containing mounting media. Phalloidin was used for staining actin filaments. Fluorescence microscopy was used to determine the Glut-1 expression in cells.

Internalization of AuNPs in Cells

The cells were grown overnight on 8-chamber slides. 50 µl of AuNPs solution was added directly into the media and the cells were incubated for 2, 4 and 24 hours at 37°C and 5% CO2. The cells were then washed three times with warmed PBS and fixated with 300 µl of 4% formaldehyde for 20 minutes at room temperature. The cells were washed three times with PBS and then incubated with 100 µl of Hematoxylin for 15 minutes to stain the nuclei. After the cells were washed again, they were stained for Au with 100 µl of silver staining for 12 minutes. The slides were then washed and dried followed by mounting. Light microscopy was performed to determine the distribution of AuNPs retention in the cells.

Atomic Force Microscopy (AFM) Analysis

Gold nanoparticles were characterized using AFM. Freshly cleaved mica surface was treated with 10 µl of APTES (1 µM in miliQ-water) for 5 min and rinsed with 2 ml of miliQ-water (AP-mica). A drop of 10 µl of AuNPs suspension (to a concentration of 200 µg/ml) was incubated for 15 min at room temperature on functionalized mica (AP-mica) and rinsed with 60 µl of miliQ-water. Excess of liquid was absorbed and let it dry to be immediately scanned after preparation.

Atomic Force Microscopy was conducted at the UT Health – AFM Core Facility using a BioScope II™ Controller (Bruker Corporation; Santa Barbara, CA). This system is integrated to a Nikon TE2000-E inverted optical microscope (Nikon Instruments Inc.; Lewisville, TX). The image acquisition was performed with the Research NanoScope software version 7.30 and analyzed with the NanoScope Analysis software version 1.40 (copyright 2013 Bruker Corporation). High resolution images of AuNPs were obtained using RTESP cantilevers (fo=237-289 kHz, k=20-80 N/m, Bruker Corporation, Santa Barbara, CA). AuNPs size was determined using tapping mode operated in air to a scan rate of 0.5-0.6 Hz. Particle analysis was performed in 2 and 3 µm2 scans.

Computed Tomography Scans

One milliliter of cell suspension (105 cells/mL) was mixed with 1 mL of AuNPs (targeted or non-targeted) and allowed to interact for 4 hours at 37°C. PBS was used as control. Then, the solutions were centrifuged 3 times at 1000 rpm for 5 minutes, to wash out unbound AuNPs. After each centrifugation step the mixture was resuspended in PBS solution (1 mL total volume).

The cell suspensions were then analyzed with computed tomography. CT imaging was performed with a GE Ultra flat panel CT scanner (General Electric, Milwaukee, WI) with the following acquisition settings: 80kVp, 22 mA with 16 s rotation/exposure. Simple back projections were obtained for the 0.154 µm image reconstruction and exported as DICOM images. Image analysis was performed using the OsiriX software.

Results

The gold nanoparticles were synthesized by citrate reduction, using the Turkevich method. All the AuNPs preparations used in this study were analyzed using UV spectrometry, DLS, and atomic force microscopy (AFM). For all the samples, the UV absorbance peaked at 540 nm that corresponds to 60 nm particles. The AFM analysis showed a uniform preparation of AuNPs of 40-50 nm, at 2.0 µm scan zise (Figure 1). The DLS data showed a diameter of 46 nm with a polydispersity index (PDI) value of 0.451 for the bare AuNP samples. 2-DG-AuNPs had a diameter of 43 nm with a PDI value of 0.374.

Colloidal gold has been found to be unstable in a saline environment. The AuNPs were stabilized using a functionalized long chain PEG with a molecular weight of 5 kDa (OPSS-PEG-SVA) to prevent the formation of aggregates and rapid clearance in vivo. Moreover, OPSS-PEG-SVA had functional groups available for covalent bonding which allowed the conjugation via strong gold-thiolate bonds of a specific ligand (a D-glucose analogue).

Glut-1 expression was assessed using immunocytochemistry by staining Glut-1 receptors with green Alexa Fluor® 288 goat anti-rabbit IgG (H+L). Breast cancer cells MDA-MB-231 (image B, Figure 2) and macrophage cells RAW 264.7 (image A, Figure 2) showed Glut-1 receptor expression when compared to fibroblast control cells MC 3T3.E1 (image C, Figure 2). Fibroblasts did not display any Glut-1 expression.

Gold nanoparticle uptake was analyzed after incubating the cells with targeted or non-targeted AuNPs solution for four hours. The gold nanoparticles were stained with silver and appear as small black particles on the light microscopy images (Figure 3).

fig1

Figure 1:AFM amplitude image of gold nanoparticles scaned at 2 µm (X-Y) in tapping mode in air.

fig2

Figure 2:Fluorescence microscopy images of Glut-1 expression in RAW 264.7 macropages (image A), MDA-MB-231 breast cancer cells (image B) and MC 3T3.E1 fibroblasts (image C); scale bar represents 100 µm. Glut-1 expression is observed in RAW 264.7 and MDA-MB-231 breast cancer cells, but not in MC 3T3.E1 fibroblasts (green color).

fig3

Figure 3:Light microscopy images of gold nanoparticle internalization in RAW 264.7 macrophage (A-C), MC 3T3.E1 fibroblast (D-F), and MDA-MB-231 breast cancer cells (G-I) cell lines; scale bar is equal to 100 µm. 2-DG-AuNPs are taken-up by MDA-MB-231 (C) and RAW 264.7 cells (F). Very little non-specific uptake of bare AuNPs is observed in MDA-MB-231 (B) and RAW 264.7 cells (E). No uptake of bare AuNPs (H) or 2-DG-AuNPs (I) is observed in MC 3T3.E1.

Both breast cancer cells MDA-MB-231 and macrophage cells RAW 264.7 displayed AuNPs internalization as compared to fibroblast cells MC 3T3.E1 (Figure 3). Macrophages showed the most uptake of the targeted AuNPs which can be noted because of the presence of darker aggregates inside the cells (image F, Figure 3). Fibroblasts showed no difference in gold nanoparticle uptake between the AuNPs, 2-DG-AuNPs, and control (images G-I, Figure 3).

Breast cancer cells MDA-MB-231, macrophages RAW 264.7 and fibroblasts MC 3T3.E1 were scanned using a pre-clinical CT. The cells were incubated with targeted or non-targeted AuNPs for 4 hours followed by extensive washing. Breast cancer cells showed the most intense signal for 2-DG-AuNPs at 916 HU (Image C, Figure 4) with almost no signal registered for the bare AuNPs at 22 HU (Image B, Figure 4) or the control sample at 19 HU (Image A, Figure 4). No signal was visible on the scan in the control and bare AuNPs sample (Figure 4).

fig4

Figure 4:In vitro CT imaging of AuNPs internalization in MDA-MB-231 (A-C), RAW 264.7 (D-F), and MC 3T3.E1 (G-I) cells. Samples that display a higher uptake signal appear red on the CT images. The intensity of the red spots are quantified in Hounsfield Units (HU) included in each image. Approximately 40-fold higher attenuation and 5-fold higher attenuation is observed for the 2-DG-AuNPs as compared to bare AuNPs for the MDA-MB-231 cells and RAW 264.7, respectively.

For the RAW 264.7 macrophages, the 2-DG-AuNPs sample also displayed the highest radiointensity at 767 HU (Image F, Figure 4), followed by bare AuNPs at 140 HU (Image E, Figure 4). No signal was visible on the scan for the control (image D, Figure 4). Control samples registered 20 HU for fibroblast cells. The MC 3T3.E1 registered baseline values for all the samples analyzed (Images G-I, Figure 4).

Discussion

Medical imaging techniques can be divided into structural and functional imaging. Recently, functional imaging has been gaining interest over more conventional anatomical imaging. This came as a response to the need for earlier detection of malignant tissues and metastases, which were not visible through structural scans. This study proposed a novel approach to functional imaging using gold nanoparticles to target a ligand specific to mesenchymal breast cancer cells and macrophages. The imaging platform consisted of 2-deoxy-D-glucose covalently coupled to spherical gold nanoparticles to target Glut-1 over-expression in breast cancer cells. The feasibility of this platform was examined using CT imaging and histological staining.

One of the advantages of the proposed imaging technique is the use of a novel targeting agent (AuNPs) which provides superior X-ray attenuation over conventional iodine-based contrast agents. Moreover, it provides the specific targeting of cancer cells with a ligand against the Glut-1 overexpressed by breast cancer cells and macrophages. CT imaging offers excellent tissue penetration and spatial resolution as well as rapid image acquisition.

Carcinoma cells have been proven to have a higher metabolic rate as well as faster proliferation, which leads to greater demand of glucose. Such metabolic characteristics can be linked to the over-expression of certain glucose transporters, such as Glut-1 or Glut-4, on malignant cell membranes. Glut-1 has been proved to be expressed by almost all cancerous cell types [24,25]. The receptor binds and transports D-glucose within the cell, which is further metabolized into D-glucose-6-phosphate and 1,2-diphosphate [24]. D-glucose analogues can be transported by Glut-1 or Glut-4 receptors, but cannot be fully metabolized, therefore remaining inside the cells for longer periods before excretion. This property allows analogues such as 2-DG to be used as specific ligands for malignant cells. Positron emission tomography (PET) scans with radioactive Fluorodeoxyglucose (FDG) use the glucose pathway described to successfully target cancerous lesions and metastases, which are not always visible through structural imaging techniques. Targeting a metabolic mechanism instead of a cell membrane receptor is one of the most promising developments in cancer research and could eventually lead to better drug delivery systems and overcoming drug-resistance [24,25].

MDA-MB-231 is a breast cancer cell line that is known to overexpress Glucose transporter 1 (Glut-1). These types of cancer cells have a high risk of metastasis and an intermediate response to chemotherapy [25-28]. Previous studies show that RAW 264.7 cells also overexpress Glut-1 transporters and therefore exhibit increased glucose uptake and metabolism [29,30].

We were able to demonstrated Glut-1 expression by Immunocytochemistry (Figure 2) and ELISA (results not shown). Following staining with Glut-1 antibody (green), MDA-MB-231 cells showed the highest Glut-1 expression (most intense green coloration), followed by RAW 264.7. Fibroblasts MC 3T3.E1 were used as a control group and displayed no Glut-1 expression (Figure 2). A pilot study was first conducted to determine the adequate incubation time with gold nanoparticles. Cells were incubated with AuNPs for 2, 4 and 24 hours and the results were analyzed histologically. It was concluded that 2 hours did not allow sufficient gold internalization, while 24 hours allowed too much time for the clearance of the nanoparticles. Therefore the 4-hour time point was used in the following experiments.

The AuNPs internalization was first observed histologically, using a silver staining to stain the nanoparticles. Silver staining gave AuNPs a dark, almost black coloration. Therefore, when comparing MDA-MB-231 and RAW 264.7 slides to MC 3T3.E1, a darker coloration of the Glut-1 expressing cells can be noted due to small dark aggregates present inside said cells. Moreover, MDA-MB-231 and RAW 264.7 cells which were incubated with PBS confirm these results, displaying a light coloration, with no dark particles visible (Figure 3). When comparing bare AuNPs and functionalized 2-DG-AuNPs, a slight difference could be noted in MDA-MB-231 cells, which displayed higher internalization for functionalized nanoparticles (Figure 3). However, for RAW 264.7 cells, the amount of internalization for bare AuNPs and 2-DG-AuNPs was similar (Figure 3). A reason for this could be the presence of other mechanisms (independent of glucose transporters) for internalization in macrophage cells.

The 2-DG-AuNPs were then tested using a pre-clinical CT. As the cells were washed and centrifuged before scanning, the cells gathered at the bottom of the sample tubes, forming cell pellets. The radiointensity measurements were done in triplicates using values from the bottom of the sample tubes, representative for each cell group. It could be noted that 2-DG-AuNPs displayed the highest radiointensity both when measured with the OsiriX software and visually on the scans for the MDA-MB-231 cells (Images A-C, Figure 4) and RAW 264.7 cells (Images D-F, Figure 4). 2-DG-AuNPs registered values of 916 HU for MDA-MB-231 cells and 767 HU for RAW 264.7 cells. The bare AuNPs registered values of 22 HU for MDA-MB-231 cells and 140 HU for RAW 264.7 cells.The PBS controls showed baseline values of 19 HU and 25 HU, respectively. MC 3T3.E1 cells displayed baseline values 20-32 HU.The attenuation coefficient for the 2-DG targeted AuNPs was approximately 40-fold higher than that of the bare AuNPs for MDA-MB-231 breast cancer cells and 5-fold higher for RAW 264.7 cells. The bare AuNPs registered values of 22 HU for MDA-MB-231 cells and 140 HU for RAW 264.7 cells.The PBS controls showed baseline values of 19 HU and 25 HU, respectively. MC 3T3.E1 cells displayed baseline values 20-32 HU.

The attenuation coefficient for the 2-DG targeted AuNPs was approximately 40-fold higher than that of the bare AuNPs for MDAMB-231 breast cancer cells and 5-fold higher for RAW 264.7 cells.

Breast cancer cells express a high level of GLUT-1 receptors. By harnassing the increased metabolic demand and uptake, tracers such as the functionalized 2-DG-AuNPs is an attractive option to detect the cancer cells. This study was the first attempt at using gold nanoparticles functionalized with 2-deoxy-D-glucose to trace and image breast cancer and tumor-associated macrophages. Functionalized 2-DG-AuNPs proved to be a valid targeting contrast agent for cell lines MDA-MB-231 and RAW 264.7, exhibiting high radiointensity upon CT imaging. Gold internalization was verified with histological and radiological techniques and the positive results indicate a need for further research into this topic, such as testing the concept in vivo in a mouse model of breabt cancer. The targeting agent developed, 2-DG-AuNPs, promises to be a cheap and safe alternative for other types of functional imaging techniques such as nuclear imaging with radioactive fluorodeoxyglucose (FDG).

Acknowledgement

We would like to thank Dr. Xiaohong Bi for her help with the cell work. The CT imaging was conducted at the UT Health-Pre-Clinical CT Core Facility/Department of Internal Medicine using a GE Ultra flat panel CT scanner (General Electric, Milwaukee, WI). Atomic Force Microscopy was conducted at the UT Health – AFM Core Facility using a BioScope IITM Controller (Bruker Corporation; Santa Barbara, CA).

References

  1. Ferlay J, Soerjomataram I, Dikshit R, Eser S, Mathers C, et al. (2015) Cancer incidence and mortality worldwide: Sources, methods and major patterns in GLOBOCAN. International Journal of Cancer 136: 359-386. [crossref]
  2. Siegel RL, Miller KD, Jemal A (2016) Cancer statistics. CA: A Cancer Journal for Clinicians 66: 7-30.
  3. Falagan-Lotsch P, Grzincic EM, Murphy CJ (2017) New Advances in Nanotechnology-Based Diagnosis and Therapeutics for Breast Cancer: An Assessment of Active-Targeting Inorganic Nanoplatforms. Bioconjug Chem 28: 135-152. [crossref]
  4. Berry DA, Cronin KA, Plevritis SK, Fryback DG, Clarke L, et al. (2005) Effect of Screening and Adjuvant Therapy on Mortality from Breast Cancer. N Engl J Med 353: 1784-1792. [crossref]
  5. Freddie B, McCarron P, Parkin MD (2004) The changing global patterns of female breast cancer incidence and mortality. Breast Cancer Research 6: 229-239. [crossref]
  6. Jalalian A, Mashohor S, Mahmud R, Karasfi B, Iqbal Saripan M, et al. (2017) Computer-Assisted Diagnosis System for Breast Cancer in Computed Tomography Laser Mammography (CTLM). J Digit Imaging 30: 796-811. [crossref]
  7. Carney PA, Miglioretti DL, Yankaskas BC, Kerlikowske K, Rosenberg R, et al. (2003) Individual and combined effects of age, breast density, and hormone replacement therapy use on the accuracy of screening mammography. Ann Intern Med 138: 168-175. [crossref]
  8. Ponhold L, Bickel H, Pinker K, Helbich T (2012) Mammography screening and follow-up of breast cancer. Hamdan Medical Journal
  9. Kim SJ, Moon WK, Cho N, Chang JM (2011) The detection of recurrent breast cancer in patients with a history of breast cancer surgery: comparison of clinical breast examination, mammography and ultrasonography. Acta Radiol 52: 15-20. [crossref]
  10. Popovtzer R, Agrawal A, Kotov NA, Popovtzer A, Balter J, et al. (2008) Targeted gold nanoparticles enable molecular CT imaging of cancer. Nano Lett 8: 4593-4596. [crossref]
  11. Polo E, Collado M, Pelaz B, Del Pino P (2017) Advances toward More Efficient Targeted Delivery of Nanoparticles in Vivo: Understanding Interactions between Nanoparticles and Cells. ACS Nano 11: 2397-2402. [crossref]
  12. Zhang Y, Hensel M (2013) Evaluation of nanoparticles as endocytic tracers in cellular microbiology. Nanoscale 5: 9296-9309.
  13. Langer R, Weissleder R (2015) Nanotechnology. JAMA 313: 135-136.
  14. Pillai G, Ceballos-Coronel ML (2013) Science and technology of the emerging nanomedicines in cancer therapy: A primer for physicians and pharmacists. SAGE
  15. Giljohann DA, Seferos DS, Daniel WL, Massich MD, Patel PC, et al. (2010) Gold nanoparticles for biology and medicine. Angew Chem Int Ed Engl 49: 3280-3294. [crossref]
  16. Hornos Carneiro MF, F Barbosa Jr (2016) Gold nanoparticles: A critical review of therapeutic applications and toxicological aspects. J Toxicol Environ Health B Crit Rev 19: 129-148. [crossref]
  17. Chhour P, Naha PC, O’Neill SM, Litt HI, Reilly MP, et al. (2016) Labeling monocytes with gold nanoparticles to track their recruitment in atherosclerosis with computed tomography. Biomaterials 87: 93-103. [crossref]
  18. Danila D, Johnson E, Kee P (2013) CT imaging of myocardial scars with collagen-targeting gold nanoparticles. Nanomedicine 9: 1067-1076. [crossref]
  19. Leung K (2004) Polyethylene glycol-gold nanoparticles. Molecular Imaging and Contrast Agent Database (MICAD) Bethesda (MD).
  20. Reuveni T, Motiei M, Romman Z, Popovtzer A, Popovtzer R (2011) Targeted gold nanoparticles enable molecular CT imaging of cancer: an in vivo study. Int J Nanomedicine 6: 2859-2864.
  21. Connor EE, Mwamuka J, Gole A, Murphy CJ, Wyatt MD (2005) Gold nanoparticles are taken up by human cells but do not cause acute cytotoxicity. Small 1: 325-327. [crossref]
  22. Otsuka H, Nagasaki Y, Kataoka K (2003) PEGylated nanoparticles for biological and pharmaceutical applications. Adv Drug Deliv Rev 55: 403-419. [crossref]
  23. Cai QY, Kim SH, Choi KS, Kim SY, Byun SJ, et al. (2007) Colloidal gold nanoparticles as a blood-pool contrast agent for X-ray computed tomography in mice. Invest Radiol 42: 797-806. [crossref]
  24. Shan XH, Hu H, Xiong F, Gu N, Geng XD, et al. (2012) Targeting Glut1-overexpressing MDA-MB-231 cells with 2-deoxy-D-g1ucose modified SPIOs. Eur J Radiol 81: 95-99.
  25. Venturelli L, Nappini S, Bulfoni M, Gianfranceschi G, Dal Zilio S, et al. (2016) Glucose is a key driver for GLUT1-mediated nanoparticles internalization in breast cancer cells. Sci Rep 6: 21629. [crossref]
  26. Holliday DL, Speirs V (2011) Choosing the right cell line for breast cancer research. Breast Cancer Res 13: 215. [crossref]
  27. Su S, Liu Q, Chen J, Chen J, Chen F, et al. (2014) A positive feedback loop between mesenchymal-like cancer cells and macrophages is essential to breast cancer metastasis. Cancer Cell 25: 605-620. [crossref]
  28. Shroff K, Kokkoli E (2012) PEGylated liposomal doxorubicin targeted to alpha5beta1-expressing MDA-MB-231 breast cancer cells. Langmuir 28: 4729-4736. [crossref]
  29. Green CE, Liu T, Montel V, Hsiao G, Lester RD, et al. (2009) Chemoattractant signaling between tumor cells and macrophages regulates cancer cell migration, metastasis and neovascularization. PLoS One 4: 6713. [crossref]
  30. Freemerman AJ, Johnson AR, Sacks GN, Milner JJ, Kirk EL, et al. (2014) Metabolic reprogramming of macrophages: glucose transporter 1 (GLUT1)-mediated glucose metabolism drives a proinflammatory phenotype. J Biol Chem 289: 7884-7896. [crossref]
IJNUS-2-1-202-g002

The Profile of Clinically Diagnosed New Type 2 Diabetes among Asian Indians

DOI: 10.31038/EDMJ.2020434

Abstract

Aim: To study the clinical and metabolic characteristics of newly diagnosed type 2 diabetes (T2DM) in urban clinics (CDD) and also to compare with the screen detected new diabetes cases (SDD) during an urban population survey.

Methods: Newly diagnosed T2DM (aged 20-60 years, n=741), based on blood glucose and Glycosylated haemoglobin (HbA1c) of ≥6.5% (48 mmol/mol) were selected. Demography, anthropometry, blood pressure, glycaemic and lipids profiles were analysed. Relevant statistical tests were used for group comparisons.

Results: Both groups had young age (45.0 ± 8.6 years) at diagnosis. Fasting blood glucose (p<0.05) and HbA1c (p<0.0001) were higher in CDD. Mean values of HbA1c were 9.1 ± 2.3% (76 ± 20 mmol/mol) in CDD and 8.3 ± 2.4% (67 ± 19 mmol/mol) in SDD (p<0.0001). Values  of HbA1c were higher   than ≥9.0% (75 mmol/mol) in 44.6% of CDD versus 26.4% of SDD (z=4.60, p<0.0001). SDD had higher body mass index (p<0.0001), abdominal obesity (p<0.005), hypertension (p<0.0001), cholesterol (p<0.005) and low density lipoprotein cholesterol (p<0.05) than CDD.

Conclusion: Both groups had young age at diagnosis. CDD had more severe glycaemia than SDD, probably suggesting that the clinic visits were delayed and therefore had longer period of undiagnosed diabetes. In comparison to CDD, SDD had higher metabolic abnormalities although the HbA1c values were lower.

Keywords

Newly diagnosed type 2 diabetes, South Asians, Clinical characteristics, HbA1c, Metabolic abnormalities

Introduction

Many developing countries show a rising trend in the prevalence and also in the incidence of type 2 diabetes T2DM [1-3]. Recently, a systematic review of studies on trends in the incidence of T2DM among adults in developed countries has shown that between 2006 and 2014, 27% of the reported populations had a stable incidence over time, while 36% reported a declining trend and 36% reported an increasing trend in the incidence of T2DM [4]. The declining trend in the incidence has been shown mostly in the developed countries. A huge clinical burden of newly diagnosed T2DM is present in developing countries. There is only limited real-world data describing the clinical characteristics of such patients [5].

The prevalence of diabetes is increasing rapidly in India, which is estimated to be 77 million adults in 2019 [1]. A recent epidemiological study done in urban India showed that, the prevalence and incidence of diabetes have increased significantly in all areas, including the Peri Urban Villages (PUV) of Tamil Nadu [2]. Using the data from the two studies conducted in 2006 [6] and 2016 [2] to estimate the incidence of diabetes, it was noted that, a sharper increase in the incidence occurred in the urban areas when compared with the villages [2]. A similar observation was made in the INdia DIABetes (INDIAB) study conducted in 15 states of India [7] as well as in a cohort study of 10 years follow-up in the urban area in southern India [8].

Several peculiar features are seen among the newly diagnosed South Asian populations with T2DM such as, younger age at onset, delayed clinical diagnosis due to lack of public awareness regarding the disease, reluctance to undergo periodic medical check-up and a long asymptomatic phase of T2DM [3,9]. The diagnosis of diabetes is often delayed, more so in the developing societies. Previous studies have described the characteristics of patients attending the clinics, who are under treatment [3,6,8]. There is sparse data on the profile of clinically diagnosed new T2DM patients in India.

The aim of this project was to study the clinical and metabolic characteristics of newly diagnosed adult T2DM patients from different clinics (CDD). We compared the profile with that of new T2DM identified during an epidemiological screening of urban population (SDD) [2].

Methods and Materials

Study Subjects

This is a study of newly diagnosed adult T2DM from 12 different centres located in four southern states of India. Patients with a previous history of diabetes or had taken anti-diabetes treatment were excluded from the study by the clinicians. Persons with prediabetes were also excluded. Details of men and women in the selected age group, who were treatment naïve were collected and analysed. For comparison, a group of newly detected T2DM subjects from an epidemiological survey of the urban population was taken.

All participants reported on fasting on the day of testing. In the clinics, the diagnosis of diabetes was based on blood glucose (fasting blood glucose ≥7.0 mmol/l and/2 hour Post Prandial Glucose (PPG)≥11.1 mmol/l) [10]. In the epidemiological study, diagnosis was made based on fasting and 2 h Post Blood Glucose (PBG) values. The 2 hour PBG was measured after giving 75 g of glucose load. We selected only patients who had an HbA1c value of ≥6.5% (48 mmol/mol) [11]. The total number of subjects analysed was 741, comprising of 514 from CDD and 227 from SDD; Identifier: NCT03490136 [2].

All centres followed uniform and standardised procedures for metabolic and clinical assessments. The study details and methodology were discussed in a meeting of the investigators, participating physicians and the researchers prior to the commencement of the study.

The Ethics Committee of the India Diabetes Research Foundation and Dr. A. Ramachandran’s Diabetes Hospitals approved the study. A written informed consent was obtained from all participants prior to the enrollment, at all centres. It was also agreed that the identity of the participants would not be disclosed. All study procedures were carried out in accordance to the ethical guidelines.

Clinical Assessments

Age, sex and presence of family history of diabetes were collected. Height was measured to the nearest centimeter using a stadiometer with the patient standing erect. Weight was measured to the nearest 0.1 kg using a digital weighing scale. Body mass index (BMI) was calculated as weight in kilograms divided by the square of height in meters. Generalized obesity was defined as BMI ≥23.0 kg/m2., BMI between ≥23.0 and 24.9 kg/m2 was considered overweight, and BMI≥25.0 kg/m2 was defined as obese. Waist circumference (WC), the smallest girth between the coastal margin and the iliac crest, was measured. Abdominal obesity was indicated by WC of ≥90 cm for men and ≥80 cm for women. Blood pressure was measured in the sitting position using the electronic measuring device (Omron HEM 7132; Omron, Tokyo, Japan). An average of two readings taken at 5-minutes’ interval was recorded. Persons with a history of hypertension and those with newly diagnosed diabetes with blood pressure readings ≥140/90 mmHg were categorized as hypertensive. All the clinical and metabolic details were recorded in a standardised questionnaire.

Biochemical Assessments

Glucose was measured in the respective study centres by the glucose oxidase method. Other biochemical parameters such as HbA1c and lipid profile were estimated at the central laboratory (Dr. A. Ramachandran’s Diabetes Hospitals, Chennai). Glycosylated haemoglobin (HbA1c) was measured by immunoturbidimetry (TINA-QUANT II; Roche Diagnostics Corporation, Germany); a procedure certified by the National Glycohemoglobin Standardization Program. Fasting serum lipid profile was estimated by standard enzymatic procedures using the reagents of Roche Diagnostics, Germany. HDLc was estimated by the direct assay. Samples were shipped to the central laboratory between 2° and 8°C on the same day of collection.

Statistical Analyses

Data are presented as mean ± standard deviation (SD) for continuous variables with a normal distribution, as median with interquartile range for skewed continuous variables and as number and frequency (%) for categorical variables. Independent samples t test, chi-square or Z – test were used to assess group differences for continuous variables and categorical variables respectively. Mann Whitney U test was used for skewed variables. A p value of <0.05 was considered statistically significant. Statistical analyses were performed using SPSS version 21.0.

Results

Table 1 shows the demographic and anthropometric characteristics of the two groups with newly diagnosed T2DM. CDD had higher percentage of men than SDD (p<0.05). Both groups had similar mean age at diagnosis (45.2 ± 8 years). The mean BMI was higher in SDD (p<0.0001). Prevalence of overweight and obesity were similar in both the groups. Women in SDD had higher WC (p<0.005) and the percentage of abdominal obesity (≥80 cm) was also higher in SDD (p<0.05). SDD had higher mean diastolic blood pressure (p<0.0001) and higher percentage of hypertension (p<0.005).

Table 1: Demographic and anthropometric characteristics of the study groups with newly diagnosed type 2 diabetes.


Clinically diagnosed
(n=514)
(CDD)

Diagnosed during screening
(n=227)
(SDD)

Men (n, %)

313 (60.9)*

117 (51.5)

Positive family history of DM (n, %)

175 (34.0)

92 (40.5)

Age (yrs)

45.2 ± 8.6

45.0 ± 8.6

BMI (kg/m2)

25.3 ± 3.7

27.3 ± 4.6$

Nonobese ≤ 22.9 (n, %)

101 (19.6)

39 (17.2)

Overweight & Obese ≥ 23.0 (n, %)

413 (80.4)

188 (82.8)

Waist Circumference (cm)

Men (cm)

91.9 ± 8.9

93.0 ± 9.8

Women (cm)

88.7 ± 10.6

91.8 ± 10.8#

Men ≥ 90 (n, %)

195 (37.9)

73 (32.2)

Women ≥ 80 (n, %)

164 (31.9)

94 (41.4)*

Blood Pressure

Systolic Blood Pressure (mm Hg)

128 ± 13

127 ± 18

Diastolic Blood Pressure (mm Hg)

81 ± 9

86 ± 11$

BP > 140/90 mm Hg (n, %)

54 (10.5)

44 (19.4)#

Data are presented as mean ± SD for continuous variables with normal distribution and as frequency (%) for categorical variables. Independent samples t test and chi-square test or Z test were used to test inter group differences for continuous variables and categorical variables.
CDD vs.SDD=*p< 0.05; #p< 0.005; $p< 0.0001.
CDD, Clinically Diagnosed Diabetes; SDD, Screen Detected Diabetes; BMI, Body Mass Index; BP, Blood Pressure.

Table 2 shows the metabolic profile of the study groups. SDD had lower FBG (p<0.05) and HbA1c (p<0.0001) when compared with CDD. Among the total cohort of 741, 445 (60.1%) had HbA1c values
≥8.0% (64 mmol/mol), of which 289 (39.0%) had values ≥9.0% (75 mmol/mol).

Table 2 Metabolic profile of the study groups with newly diagnosed type 2 diabetes.


Clinically diagnosed
(n=514)
(CDD)

Diagnosed during screening
(n=227)
(SDD)

Glycemic Parameters

Fasting blood glucose (mmol/l)

9.8 ± 3.3*

9.3 ± 3.2

2 hour post blood glucose (mmol/l)

15.4 ± 4.4

15.3 ± 4.2

HbA1c % (mmol/mol)

 9.1 ± 2.3 (76.1± 19.8)$

8.3 ± 2.4 (66.8 ± 19.0)

HbA1c ≥ 8.0% (64mmol/mol) (n,%)

349 (67.9)$

96 (42.3)

HbA1c ≥ 9.0% (75mmol/mol) (n,%)

229 (44.6)$

60 (26.4)

Lipid Profile (n)

 243

222

Triglyceride (mmol/l)

1.8 (1.3 – 2.7)

1.8 (1.3 – 2.8)

Total Cholesterol (mmol/l)

4.8 ± 1.0

5.1 ± 1.1#

LDLc (mmol/l)

3.4 ± 0.9

3.6 ± 1.0*

HDLc (mmol/l)

1.0 ± 0.3

1.0 ± 0.2

Data are presented as mean ± SD for continuous variables with a normal distribution, as median with interquartile range for skewedcontinuous variables and as frequency (%) for categorical variables. Independent samples t test and chi-square test or Z testwere usedto test intergroup differences for continuous variables and categorical variables. Mann Whitney U test was used for skewed variables.
CDD vs.SDD=*p<0.05; #p<0.005; $p<0.0001
CDD: Clinically Diagnosed Diabetes; SDD: Screen Detected Diabetes; HbA1c: Glycosylated hemoglobin; LDLc: Low Density Lipoprotein Cholesterol; HDLc:HighDensity Lipoprotein Cholesterol.

It was observed that a larger proportion of CDD (67.9%) had values of ≥8.0% (64 mmol/mol) versus 42.3% of SDD (z=6.47, p<0.0001). HbA1c values ≥9.0% (75 mmol/mol) were present in 44.6% in CDD versus 26.4% in SDD (z=4.60, p<0.0001). Among the lipid variables, total cholesterol (p<0.005) and Low Density Lipoprotein cholesterol (LDLc) (p<0.05) were higher in SDD.

Discussion

There have been many reports highlighting the differences in the clinical profile of diabetes between South Asians and the western populations [12,13]. But, there is sparse data on the clinical and metabolic characteristics of newly diagnosed T2DM from India. In this communication we report the clinical and metabolic characteristics of newly diagnosed diabetes patients recruited from different centres in southern India (CDD). The group represents the urban population with diabetes. We compared its clinical profile with a group of undiagnosed diabetes detected during an urban epidemiological survey (SDD).

In our study, the mean age of the newly diagnosed T2DM in both the groups was similar (45.2 ± 8.6 and 45.0 ± 8.6 years in CDD and SDD respectively). Another large, multicentre, cross-sectional study among diabetes patients in India also showed that the mean age at onset of T2DM was 45.4 ± 10.9 years which was similar to the observation made in our study [14]. This was significantly lower than that reported among the newly diagnosed T2DM cases in the United States (55.6 ± 13 years) [5]. Similarly, in two large multi-ethnic studies from UK [15,16], the age at diagnosis of T2DM was found to be lower (51.5 ± 10.42 and 52.6 ± 13.5 years respectively) in the South Asian population when compared to the White population (58.9 ± 10.09 and 63.3 ± 13.8 years respectively). South Asians develop T2DM at least a decade earlier.

Lower BMI with higher HbA1c in the CDD compared to SDD could possibly be due to a reduction in weight usually associated with moderate to high levels of undetected hyperglycaemia. In an earlier study, we had observed that more than 20% of the cases had weight loss prior to the clinical diagnosis of T2DM [17]. Among the Asian populations, Indians have a reluctance to undergo regular health check-up and medical consultation is often sought only when the symptoms or related problems arise due to diabetes [9]. Similar observation had been reported earlier in migrant Asian populations in western countries [15,18]. In the UK, a multiethnic South London study mentioned above showed that HbA1c levels were higher in South Asians than in the Europeans at an early period after the diagnosis. This was partially attributed to a delayed diagnosis in the Asians [15]. In our study, the significantly higher FBG and HbA1c observed in CDD could be related to a delay in the diagnosis of diabetes when compared with those diagnosed during an epidemiological screening. There is a higher likelihood of a few CDD patients having taken treatment for hypertension and hyperlipidaemia prior to visiting a diabetes clinic.

In our study, 44.6% of the patients had significantly higher HbA1c ≥9.0% (75 mmol/mol) when compared with 21.7% of the newly diagnosed patients in the clinics in USA [5]. There may be a number of reasons for high HbA1c in newly detected diabetes. One important reason could be longer periods of undetected T2DM in our population, partially due to the delay on the part of the patients to seek medical help. In India, a larger percentage of men report for medical consultation than women. Therefore, the proportion of men was more among the clinically diagnosed cases.

In an earlier study, we had noted that T2DM remains asymptomatic for a longer period of time and many develop complications such as retinopathy even before diagnosis [19]. We did not record the presence of symptoms or complications in this study.

Hypercholestremia seen among the newly diagnosed patients may also be related to the delayed diagnosis of diabetes and higher blood glucose levels. In SDD, screening for diabetes was done among adults with neither a previous history nor the presence of symptoms of diabetes. There is a higher chance of early detection of diabetes among this group than in the clinic diagnosed cases. The likelihood of early detection of hypertension is also higher when screening is done.

Our study describes the clinical and metabolic features of newly diagnosed T2DM in the clinics. The differences with the screen detected diabetes in the population probably indicate late diagnosis in the clinics.

Declarations

Funding

The study was funded by India Diabetes Research Foundation, Chennai.

Conflict of interest

None

Ethics approval

The study was approved by the Ethics Committee of the India Diabetes Research Foundation and Dr. A. Ramachandran’s Diabetes Hospitals.

Consent to participate

A written informed consent was obtained from all participants prior to the enrollment in the respective studies.

Authors’ contributions

Arun R, AR, CS, AN and RV contributed to the study design, developed the protocol, supervised the study, drafted the manuscript and revised it with critical input. AR, CS, Arun R, PS and KS contributed to data preparation and analyses. KS and PS participated and coordinated the field work and data collection. All authors have read and approved the final draft of the manuscript.

Acknowledgements

The authors acknowledge the support rendered by the study physicians of various hospitals for providing the data source of the clinic patients. The help rendered by Mr.M.Karthikeyan and the epidemiology team of the India Diabetes Research Foundation in coordinating the epidemiological screening is greatly acknowledged. We are grateful to all the participants of the study for their co- operation and support.

Abbreviation

BMI: Body Mass Index

CDD: Clinically Diagnosed Diabetes

FBG: Fasting Blood Glucose

HbA1c: Glycosylated Haemoglobin

PBG: Post Blood Glucose

PPG: Post Prandial Blood Glucose

SDD: Screen Detected Diabetes

T2DM: Type 2 Diabetes

WC: Waist Circumference

References

  1. International Diabetes Federation.IDF Diabetes Atlas, 9thedn. Brussels, Belgium: 2019. Available at: http: //www.diabetesatlas.org. Last accessed on 11th March 2020.
  2. Ramachandran A, Snehalatha C, Shaw JE, Susairaj P, et al. (2019)Response to Comment on Nanditha et al. Secular TRends in DiabEtes in India (STRiDE-I): Change in Prevalence in 10 YearsAmong Urban and Rural Populations in Tamil Nadu. Diabetes Care42: 476-485.[crossref]
  3. Misra A, Ramchandran A, Jayawardena R, Shrivastava U, et al. (2014)Diabetes in South Asians. Diabet Med31: 1153-62.[crossref]
  4. Magliano DJ, Islam RM, Barr ELM, Gregg EW, et al. (2019)Trends in incidence of total or type 2 diabetes: systematic review. BMJ 366: l5003. [crossref]
  5. Pantalone KM, Hobbs TM, Wells BJ, Kong SX, et al. (2016)Changes in characteristics and treatment patterns of patients with newly diagnosed type 2 diabetes in a large united states integrated health system between 2008 and 2013. Clin Med Insights Endocrinol Diabetes9: 23-30. [crossref]
  6. Ramachandran A, Mary S, Yamuna A, Murugesan N, et al. (2008)High prevalence of diabetes and cardiovascular risk factors associated with urbanization in India. Diabetes Care 31: 893-898.[crossref]
  7. Anjana RM, Deepa M, Pradeepa R, Mahanta J, et al. (2017)ICMR-INDIAB Collaborative Study Group. Prevalence of diabetes and prediabetes in 15 states of India: results from the ICMR-INDIAB population-based cross-sectional study. Lancet Diabetes Endocrinol 5(8): 585-596.[crossref]
  8. Anjana RM, Shanthi Rani CS, Deepa M, Pradeepa R, et al. (2015)Incidence of Diabetes and Prediabetes and Predictors of Progression Among Asian Indians: 10-Year Follow-up of the Chennai Urban Rural Epidemiology Study (CURES). Diabetes Care38(8): 1441-8.[crossref]
  9. Mohan V (2019)Expanding the concept of ‘Clinical Inertia’ in diabetes. J Diabetol 10: 1-3.
  10. World Health Organization. Definition and diagnosis of diabetes mellitus and intermediate hyperglycaemia: report of a WHO/IDF consultation. Geneva: World Health Organization 2006; 1-50.[crossref]
  11. Use of glycatedhaemoglobin (HbA1c) in the diagnosis of diabetes mellitus. Diabetes Res Clin Pract.93: 299-309.[crossref]
  12. Nanditha A, Ma RC, Ramachandran A, Snehalatha C, et al. (2016)Diabetes in Asia and the Pacific: Implications for the Global Epidemic. Diabetes Care39: 472-85.[crossref]
  13. Mathur R, Palla L, Farmer RE, Chaturvedi N, et al. (2020)Ethnic differences in the severity and clinical management of type 2 diabetes at time of diagnosis: A cohort study in the UK Clinical Practice Research Datalink. Diabetes Res Clin Pract160: 108006.[crossref]
  14. Mohan V, Shah SN, Joshi SR, Seshiah V, et al. (2014)DiabCare India 2011 Study Group. Current status of management, control, complications and psychosocial aspects of patients with diabetes in India: Results from the DiabCare India 2011 Study. Indian J EndocrinolMetab 18: 370-8.[crossref]
  15. Winkley K, Thomas SM, Sivaprasad S, Chamley M, et al. (2013)The clinical characteristics at diagnosis of type 2 diabetes in a multi-ethnic population: the South London Diabetes cohort (SOUL-D). Diabetologia56: 1272-81.[crossref]
  16. Wright AK, Welsh P, Gill J, Kontopantelis E,et al. (2020)Age-, sex- and ethnicity-related differences in body weight, blood pressure, HbA1c and lipid levels at the diagnosis of type 2 diabetes relative to people without diabetes. Diabetologia 63: 1542-1553.[crossref]
  17. Ramachandran A, Snehalatha C, Vijay V, Viswanathan M (1994)Underestimation of obesity in newly diagnosed non – insulin dependent diabetes subjects: A study from South India. Diabetes, Nutrition & Metabolism V7 (4): 251-55.[crossref]
  18. Sattar N, Gill JM (2015)Type 2 diabetes in migrant south Asians: mechanisms, mitigation, and management. Lancet Diabetes Endocrinol 3: 1004-16.[crossref]
  19. Ramachandran A, Snehalatha C, Vijay V, Viswanathan M (1996)Diabetic retinopathy at the time of diagnosis of NIDDM in south Indian subjects. Diabetes Res Clin Pract 32(1-2): 111-4.[crossref]