Abstract
Respondents evaluated unique combinations of messages dealing both with the levels of minimum wage, and reasons for minimum wage, selecting one of five minimum wages that would fit each combination, respectively. The underlying experimental design ensured that each respondent had the appropriate set of vignettes so that it would be possible to create an equation showing the ‘dollar value’ of each of the messages. Regression modeling and clustering analysis revealed three emergent mind-sets, (Government should do the work; Individual should save money; Individual should suffer). The most effective messages to generate higher ratings of minimum wage were those suggesting what the person might do in order to economize, and live within their means. The least effective messages were those talking about what the government should do regarding minimum wages. Respondents paid attention to dollar values of minimum wage primarily for messages which presented additional information, such as the specific state where that minimum wage was the law. The paper shows the potential for creating a new learning and research paradigm for students, incorporating artificial intelligence to suggest questions and answers about a topic (learning phase), coupled with a templated program to acquire the responses to real people to the information provided by AI (experiential learning through research).
Introduction
The topic of minimal wage, often called minimal living wage, continues to draw attention, year after year [1]. Whether the issue is considered from the vantage point of economics [2,3], consumer research (e.g., [4]), or as part of the corpus of topics focused in by social planners and government economists [5], the topic never ceases to draw attention. Indeed, major treatises have been developed by economists relating minimal wage to a variety of other issues in society, both structural and behavior (e.g., [6]). And, of course, the sheer relevance of minimum wage continues to be the topic of numerous popular articles, and op ed letters (e.g., [7])
This paper emerged from the efforts of a student researcher in middle school in the Bronx, New York, the first author, Cledwin Mendoza. The topic was part of the senior author Mendoza’s effort to use Mind Genomics to explore the topic of minimum wage, from the point of view of a student looking at the world of adults, a world that he would soon enter. The underlying strategy was that to better understand the topic of minimum wage, one might explore some aspect of the topic from the point of view of a middle school student, using a combination of artificial intelligence to help frame questions and answers, along with one’s own experience to modify the output of artificial intelligence. The next step would be to understand how other young people would respond to these ideas. The strategy combines learning through questioning with artificial intelligence, and then evaluating what is learned by experiments with real people. The effort is called Mind Genomics, the computer program is BimiLeap, and the effort may be best understood as experimental analysis of topics of the everyday.
The study focuses on the ability of different messages about minimum wage to ‘drive’ estimated dollar values of the minimum wage. That is, the desire was to learn whether there were any types of messages which convinced people to increase the minimum wage that a worker might receive, and to the contrary, what types of messages convinced people to actually lower the minimum wage that a worker might receive.
Mind Genomics and ‘Cognitive Economics’
The approach used in this study is known as Mind Genomics, with a specific variant, known as Cognitive Economics. Mind Genomics is an emerging science focusing on the way we make decisions about the topics of the everyday [8,9]. Mind Genomics was founded on the belief that a strong way to understand people’s decisions is to present them with combinations of features relevant to the decision making (so -called vignette, which combine together elements), instruct the respondent to make a decision (e.g., assign a rating to the vignette), and then after having presented the respondent with an appropriate set of such vignettes, obtain the ratings, and deconstruct the pattern of rating into the contribution or driving power of each message, each element. In other words, combine elements, present combinations, get ratings, deconstruct the response, and create the knowledge base. The paper will explain each of these.
Method
The Mind Genomics approach followed a choreographed process, the steps set up to prepare the data for statistical analysis using OLS (ordinary least-squares) regression. The objective of the analysis is to generate a model, viz., an equation, relating the presence/absence of the raw materials (messages about minimum wage) to a dependent variable. For the study reported here, the dependent variable is a selection of an appropriate minimum wage, based upon how the respondent interprets the messages about minimum wage.
Step 1: Define the Topic, and then Create Both Questions and Answers (Messages) Which Present Information about Minimum Wage
The Mind Genomics process is an exploration, so the researcher need not know anything about the topic of minimum wage to do an experiment and discover how ‘people think about minimum wage.’
This approach of beginning with questions and answers, even in the almost total absence of knowledge, stands in stark contrast to the conventional method which assumes that the research is grounded to answer a specific problem existing in the state of knowledge. The latter is called the hypothetico-deductive system, positing that research should enable one to confirm or to falsify a hypothesis, a hypothesis grounded in one’s knowledge of the topic.
From the beginning researchers may know very little about the topic and need guidance. The Mind Genomics program, www.BimiLeap.com, provides a coaching system, Idea Coach, in which the researcher types in a sentence about the topic, with Idea Coach powered by artificial intelligence (Open AI) returns with 30 questions.
Table 1 presents the query, and two sets of 30 questions about minimum wage returned by the Idea Coach. The important things to note are that the Idea Coach can be used to investigate the topic and/or to select specific questions to use for BimiLeap, thus playing both a teaching role and a direct coaching role for the study. For this study the student researchers used Idea Coach as a teaching aid, and then formulated the questions and answers afterward.
Table 1: Example of two sets of questions about minimum wage generated by Idea Coach
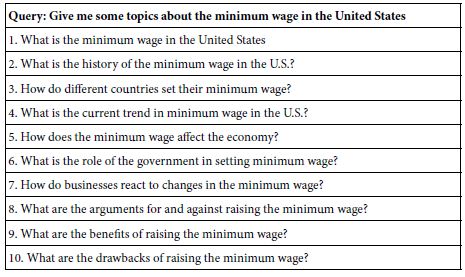
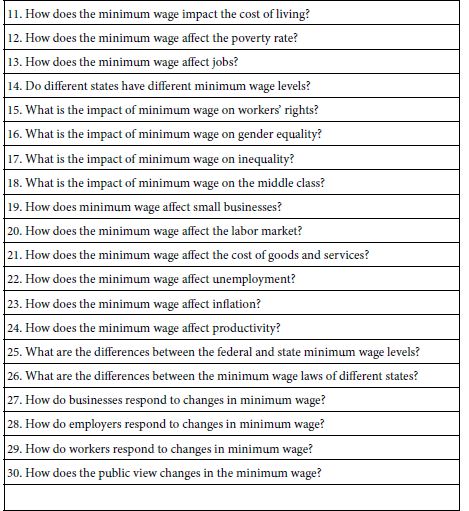
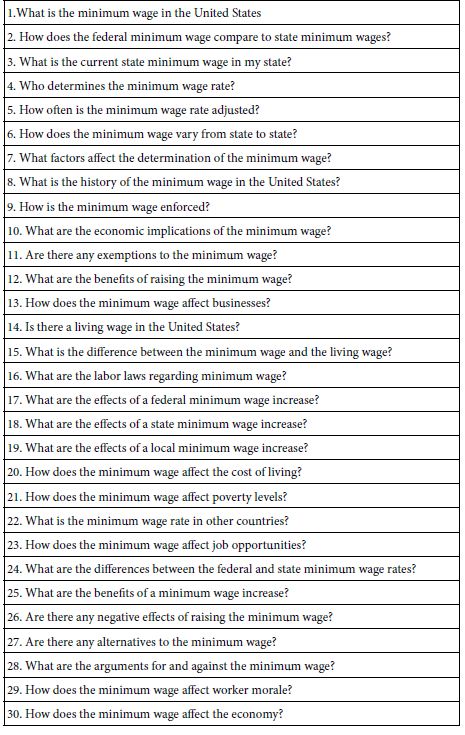
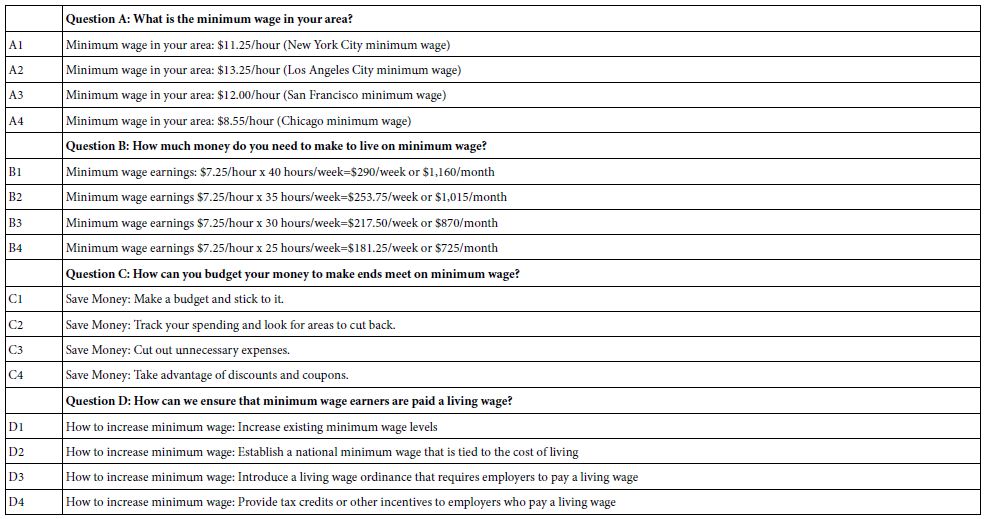
Table 2 shows the four questions and the four answers to each question. The Idea Coach presented these elements as answers to the four questions that the senior author selected. Once again, it is important to note that the questions were not immediately provided by Idea Coach and its AI substructure, but rather emerged after the senior research (Cledwin Mendoza) ‘learned about the topic’ using Idea Coach as an interactive tool to explore different aspects of the topic.
Table 2: The raw material, comprising four questions and four answers to each question
Step 2 – Create Test Vignettes, viz., Combinations of Elements
In a Mind Genomics study, the respondent is instructed to rate combinations of elements, these combinations describing a situation or an offer. The strategy of testing combinations rather than single elements allows Mind Genomics to simulate what might be encountered in the ‘real world,’ which virtually always presents a person with mixtures of features to which the person must react. The notion of isolating the features and then instructing the respondent to evaluate each feature, one feature at a time, comes from the traditional world of science, where isolating a variable allows a deeper study of that variable. With a person, however, presenting a single idea out of context may end up making that single idea meaningless, as is the case for elements A1-A4, and B1-B4 in Table 1. These elements are simple ‘facts’, devoid of deeper meaning when presented alone.
To study these elements Mind Genomics mixes the elements into small combinations, the aforementioned ‘vignettes. A vignette is simply a collection of elements, one element at top of the other, without any effort to connect the elements into a grammatically correct whole. By presenting the vignette as the disconnected combination of elements in this austere format, the researcher ends up making the task easy, because the respondent can ‘graze’ through the elements and make a decision.
The actual design comprises 24 vignettes, each vignette containing two, three, or four elements, respectively. In any vignette, only one element (answer) from a question may appear, preventing a vignette from presenting two elements which may directly contradict each other. Across the 24 vignettes, each element appears five times, and is absent 19 times. Each set of 24 vignettes ensures that the 16 elements are statistically independent of each other, and thus the data from one set of 24 vignettes can be subject to regression analysis. Finally, each respondent evaluates a totally unique set of 24 vignettes. No two respondents evaluate the same set of vignettes, nor even the same vignette. These powerful features allow the researcher to evaluate a great number of combinations, permitting anyone to explore and learn about the topic in an iterative fashion. The approach is called permuted experimental designs [10].
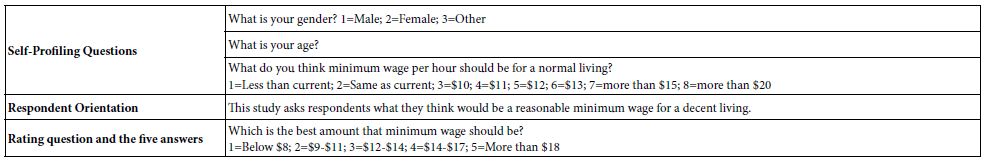
Step 3 – Create Self-profiling Classifications, Introduction to the Study for the Respondent, the Rating Question, and the Rating Scale
Step 3 requires the researcher to think about the type of information she or he wants from the respondent. The self-profiling questionnaire allows the researcher to identify WHO the respondent is, and how the respondent THINKS, both of which can be answered directly by the respondent. The researcher describes the topic of the study, presents a rating question. The researcher creates a rating scale, that scale used by the respondent to describe her or his reaction to the vignette. The rating scale or some transformation of the scale will be used in the analysis to link the elements of the vignette to the respondent’s ‘feeling.’
In this study the researchers used a numerical scale, requiring the respondent to select the most appropriate estimate of a minimum wage after reading a vignette (Table 3). The objective was to see how the different elements would drive the dollar value of the minimum wage. This approach, instructing the respondent to estimate the dollar value of an object or experience, has been previously used in a variety of Mind Genomics studies [11,12], and has been given the name ‘Cognitive Economics’ [13,14]. Cognitive economics deals with the responses framed in money, rather than in emotion, a contrast between homo economicus versus homo emotionalis.
Table 3: Questions which the respondents answer to define who the respondent IS, and how the respondent FEELS about the different vignettes presented in the evaluation.
Step 4: Execute the Study on the Internet
The Mind Genomics procedure is templated, allowing the researcher to follow a series of steps from the creation of the study to its actual implementation. Once the study has been set up in the template, the BimiLeap program requests the researcher to specify the nature of the respondents, including age, gender, education, geography, and so forth. With today’s reach of the Internet finding respondents is straightforward, and in the interests of time preferable to getting volunteers from one’s pool of acquaintances. The study reported here requested 100 respondents, half males, half females, ages 15-21, provided by Luc.id. The 100 respondents were reduced to 78, based upon incomplete data or incorrect qualifications provided by the respondents. The 22 respondents who did not fit were eliminated at the start of the analysis, before any effort was made to analyze the results. It is important to note that a second wave of respondents could have been recruited, but the objective was met with 78 respondents. Finally, the entire effort to set up the study, including Idea Coach, required about 45 minutes, and the field effort took about 2.5 hours from launch to completion. It is this speed and simplicity of process which makes working with an online panel supplier so attractive for both the student researcher and the professional researcher alike.
The field execution required approximately 3-5 minutes for a respondent, from the time the respondent agreed to participate, pressed the link and began, to the time that the session completed. The respondents were members of various online panels in the United State, the country chosen for the study. The respondents were selected to be no older than 21 years. Qualifying respondents were sent an email invitation, the invitation containing the link.
Those respondents who agreed to participate were asked to complete the self-profiling questionnaire, then read the orientation, and finally evaluated the 24 vignettes. The rating scale was a set of dollar values corresponding to the hourly minimum wage. The five wages were set up in increasing order, although in other studies it is often the case that the five rating values (viz., minimum wages here) might be presented in random order. In any case, the respondent had no trouble completing the study in approximately 3-5 minutes.
The BimiLeap program recorded the information about the respondent from the self-profiling questionnaire, the order of evaluation of the vignette (from 01-24), the composition of the vignette in a set of 16 columns coded 1 if element were present, 0 if absent, and then the final two columns recording the dollar rating assigned along with the response time. The response time was defined as the number of tenths of seconds elapsing between the time that the vignette appeared on the respondent’s screen and the time that the respondent pressed the appropriate key for the rating. The foregoing format of the data record ensured that the database emerging from the 78 respondents, each evaluating 24 vignettes, was immediately ready for statistical analysis.
Step 5: Create Equations (models) Relating the Presence/Absence of the 16 Elements to the Dollar Value of the Rating Scale
The equation is expressed as Dollar Value = k1(A1) + k2(A2) … k16(D4). The equation does not contain an additive constant, under the assumption that in the absence of elements there is no minimum wage. The foregoing equation is created at both a group level for all individuals in the specific group (e.g., age group, gender, etc.), and at the level of the individual respondent.
Once the data are ready for regression analysis, a further analysis created 78 individual level models relating the presence/absence of the elements and the dollar rating. These 78 models were then submitted to cluster analysis [15], to generate two and then the different groups, clusters or ‘mind-sets’ in the language of Mind Genomics. These mind-sets were defined as groups of individuals who were most similar to each other, based upon the pattern of their coefficients. The cluster program created the index for dissimilarity (1-Pearson Correlation across corresponding elements), and then attempt to minimize the index of dissimilarity within a cluster or mind-set and maximize the same index across the centroids of the two or three mind-sets. The three mind-set-solution was selected because the data seemed to be more interpretable than the data from the two-mind-set solution.
Finally, the BimiLeap program measures the response time, and created an equation relating the presence/absence of the elements to the measured response time. Once again, the equation was estimated without the additive constant, gain for the same reason; without any elements in the vignette, there would be no response. The equation is now stated as: Response Time = k1(A1) + k2(A2)… k16(D4).
Results
The first analysis looks at the data without considering that the elements themselves have cognitive meaning. For this first analysis we compute the average dollar value assigned by each respondent to the set of 24 vignettes, as well as the standard deviation of these t dollar ratings. Figure 1 shows the distribution of the averages and standard deviations across the 78 respondents. For most of the respondents the average dollar value lies between 10$/hour and $15/hour. Of more interest is the standard deviation for the 24 ratings. Low standard deviations suggest that the respondent does not change her or his selection of a minimum wage. These would be the group with standard deviations between 0 and 1, respectively. Moderate to high standard deviations suggest that the respondent is swayed by what she or he reads. There is a small cohort of respondents with standard deviations of 3 or higher.
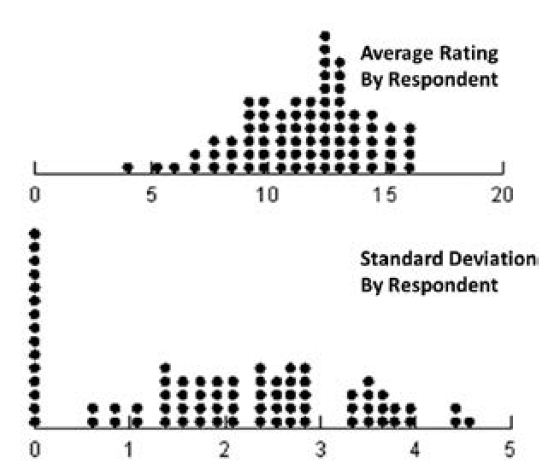
Figure 1: Average rating and standard deviation of ratings for each respondent across the 24 vignettes evaluated by each respondent
Figure 1 represents the type of data that are often obtained in studies. The data themselves are simply points, each point having little ‘cognitive meaning’. The points are responses. The measures, average and standard deviation, tell us something about the respondent, viz., proclivity to assign high versus low dollar values to minimum wage, or likelihood to be swayed by information. Beyond that, however, we know little.
A deeper understanding emerges when the data are subject to OLS regression, to determine the contribution of each of the 16 elements to the dollar value selected for the minimum wage. Each regression analysis incorporates only the data from the relevant group of respondents. The regression analysis provides a deeper understanding of how the respondents integrate the information they read into a selection of minimum. The respondent is presented with 24 vignettes and responds almost ‘automatically’ to each vignette.
Table 4 shows the coefficients for the total panel, gender, age, and then the three mind-sets emerging from the clustering. These coefficients are dollar values. The average coefficient and the standard deviation of the 16 coefficients are shown at the bottom of the table. The table of 16 coefficients is sorted by the value for the Total panel, viz. the estimated coefficient (viz., part-worth dollar value) from the equation for the Total panel, viz., the equation using all 24 vignettes rated by the 78 respondents. All coefficients of 3.6 or higher are shown in shaded cells to call attention to them. These coefficients suggest that the elements are perceived to ‘drive’ a higher minimum wage. The coefficient (viz., part-worth dollar value) of 3.6 was chosen as an arbitrary cutoff-off.
Table 4: Dollar Values of minimum wage attributable to elements in the vignette for subgroups of respondents based upon WHO they are, and their emergent mind-sets from clustering
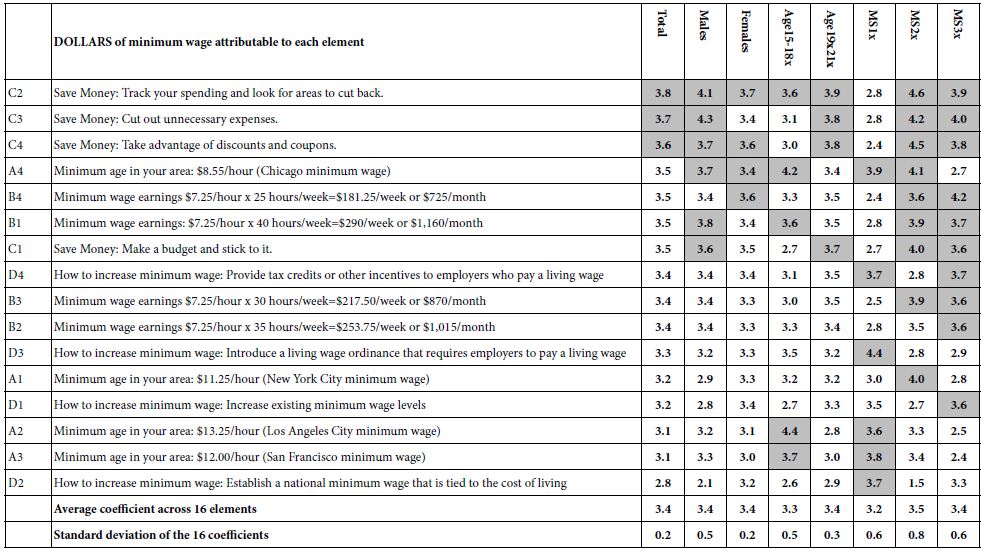
Table 4 suggests a variety of interesting patterns:
- For total panel, the two high coefficients feature recommendations to save money.
- Males react more strongly than do females, meaning that they choose higher dollar values. Males respond far more strongly to this element, with a coefficient denoting 90 cents more: Save Money: Cut out unnecessary expenses.
- Younger respondents (ages 15-18) respond strongly to statements about money. In contrast, older respondents respond strongly to statements about how to save money. This is an important emergent finding, suggesting different ways of processing information.
- Three mind-sets emerged based upon similar patterns of coefficients. Mind Genomics studies again and again show that the greatest differences among comparable groups emerge from clustering people based on their responses to a granular topic. Thus, we should expect to see the largest group to group differences across the three mind-sets, which we do.
Save Money: Track your spending and look for areas to cut back.
Save Money: Track your spending and look for areas to cut back.
Mind=Set 1 feels that the government should do the work, and feels empowered to assign high minimum wages when they read about these wages being actually paid out in Los Angeles and in San Francisco.
How to increase minimum wage: Introduce a living wage ordinance that requires employers to pay a living wage
How to increase minimum wage: Provide tax credits or other incentives to employers who pay a living
How to increase minimum wage: Establish a national minimum wage that is tied to the cost of living wage
Minimum age in your area: $13.25/hour (Los Angeles City minimum wage)
Minimum age in your area: $12.00/hour (San Francisco minimum wage)
Mind-Set 2 feels that it is the job of the individual to make the best of the situation by saving money.
Save Money: Track your spending and look for areas to cut back.
Save Money: Cut out unnecessary expenses.
Save Money: Take advantage of discounts and coupons.
Mind-Set 3 appears to be what one might call penurious and judgmental.
Save Money: Cut out unnecessary expenses.
Minimum wage earnings $7.25/hour x 25 hours/week = $181.25/week or $725/month.
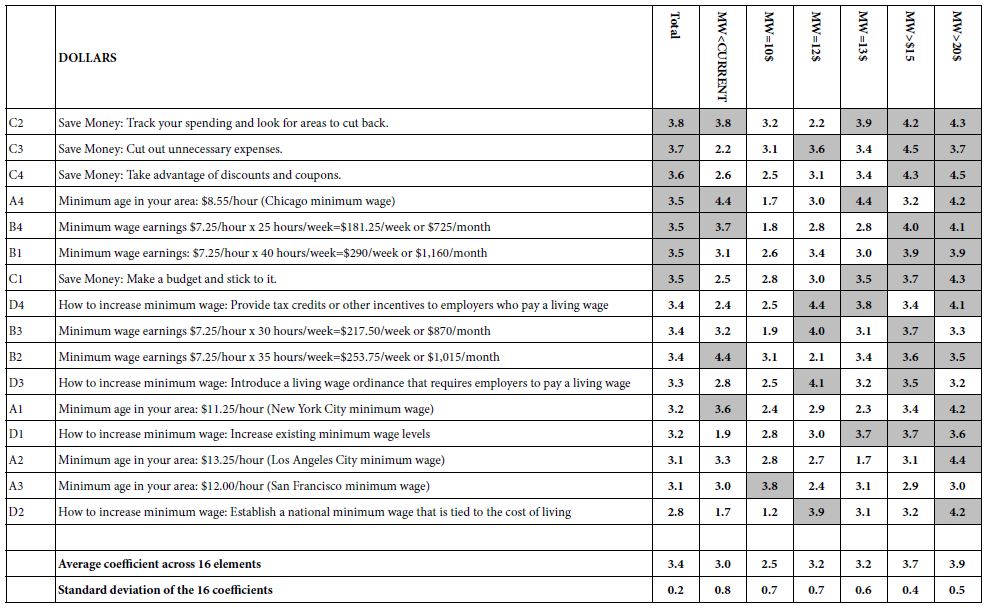
The self-profiling questionnaire at the start of the interview required the respondent to choose an appropriate minimum wage, with eight options, six of which comprised more than 10 respondents, and are thus shown (Table 5). Table 5 shows that the respondents who said that they wanted a higher minimum wage in self-profiling classification ended up generating higher part-worth coefficients for the minimum wage across the different vignettes. The coefficients for this group appear in the right-most column of Table 5. The average estimated dollar value across all 16 elements was $3.90, higher than the average of all the remaining groups.
Table 5: Dollar Values of minimum wage attributable to elements in the vignette for subgroups of respondents based upon their self-stated choice of the minimum wage
Response Time as a Measure
The literature of experimental psychology is replete with papers on response time (RT). RT is assumed to reflect underlying psychological processes, with shorter RT’s representing fewer ongoing cognitive processes, and in contrast, longer RT’s representing more ongoing processes [16,17]. The BimiLeap program measures the RT by measuring the time elapsed between the presentation of the vignette and the response to the vignette. The BimiLeap program ‘assumes’ that a reasonable maximum RT for a native English-speaking respondent should be no longer than 9 seconds, and truncates at RT’s so that 9 seconds ends up as the maximum RT.
Table 6 shows the RT for the elements based on respondents as defined by WHO they are, and their mind-sets. Table 7 shows the RT for the elements based upon respondents as they select the appropriate minimum wage through the self-profiling questionnaire. In both tables the elements are sorted by the RT for the total panel. RT’s of 0.8 seconds or higher is shown by shaded cells. These are elements to which the respondent ‘pays more attention’, whether for reasons of interest, difficulty in understanding and so forth. The response time of 0.8 seconds was chosen as a representatively long response time, based upon the experience of author HRM.
Table 6: Estimated response time for each element (row), and each key subgroup (total, gender, age, emergent mindset (column)
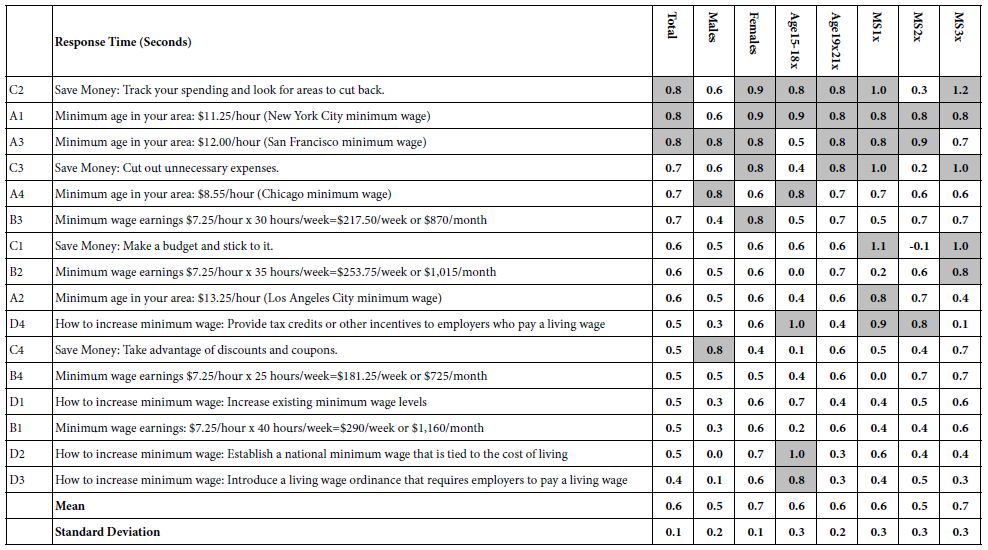
Table 7: Estimated response time for each element (row), and each key subgroup self-defining the appropriate minimum wage (column)
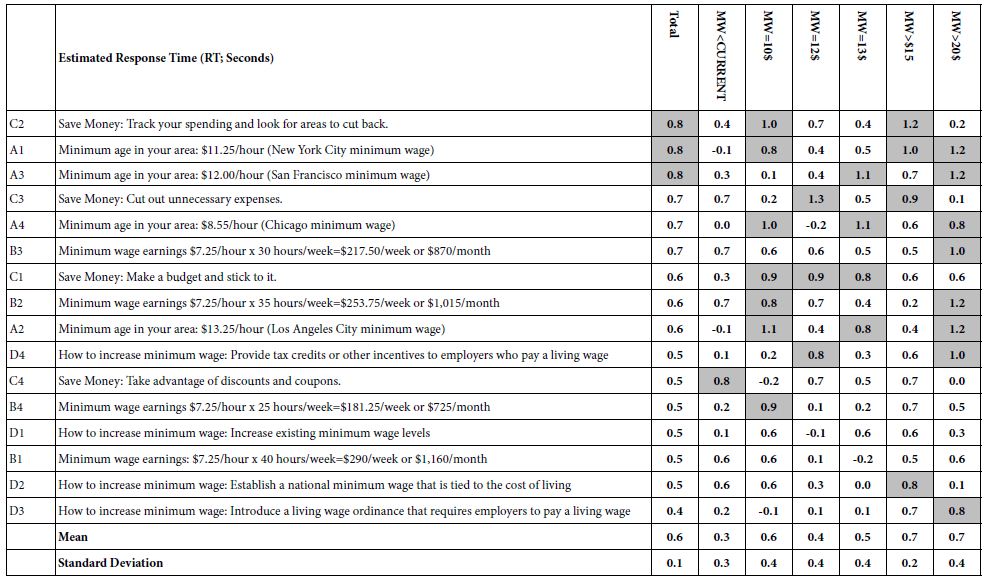
Table 6 shows that the longest response times are those which tell the respondent what to do, as well as information about the minimum wage in New York and in San Francisco.
Save Money: Track your spending and look for areas to cut back.
Minimum age in your area: $11.25/hour (New York City minimum wage)
Minimum age in your area: $12.00/hour (San Francisco minimum wage)
The shortest response time, not surprisingly, comes from an element which might be considered a ‘throw-away,’ viz., and element which seems to convey nothing but a platitude:
How to increase minimum wage: Introduce a living wage ordinance that requires employers to pay a living wage.
In terms of gender, females show longer RT’s than do males for almost all elements, and thus end up with an average response time of 0.2 seconds longer. Females appear to take the time to read the vignettes more slowly, and presumably more carefully.
The two age groups respond similarly as do the three mind-sets. There are differences between and among the groups, but the differences do not create a meaningful pattern that one can interpret.
When we turn to Table 7, the groups defined by the minimum wage that they self-define at the start of the study, we find no elements which generate consistently long response times.
Discussion and Conclusions
The study originated with the question about minimum wage, specifically whether giving minimum wage information was more persuasive than talking about minimum wage in a discursive manner. The study was designed to determine whether the selected value of the minimum wage could be traced to the specific elements. The underlying experimental design allowed the research to deconstruct the selection of a minimum wage into the contributions of each of four types of information; dollar value of minimum wage in four markets, dollar value of four levels of minimum wage; how to survive on the minimum wage; and what the government should do, respectively.
The important observations are quite simple:
- Some messages reach the emotions of the respondent, triggering the selection of a higher minimum wage. These are most likely to be messages about what to do, not informational messages about what is:
- People pay more attention to the meaning of messages rather than to the amount of money stated in the message. We see first and indirectly when we end up with similar dollar values for two ‘parallel’ statements about minimum wages:
- If there is a pattern between dollar value from the coefficient and stated dollar value in the vignette, then the messages most likely also contains a cognitively meaningful and relevant message. The data below suggest that when we provide information to accompany the dollar value (viz., city) a pattern does emerge. Thus the element presenting Chicago ($8.55 minimum wage) generates the highest coefficient (contribution to minimum wage). The coefficient is 3.5. In contrast, the elements presenting Los Angeles and San Francisco (minimum wages stated as $13.25 and $12.00) end up having the lowest value in the group, coefficients of 3.1 for each.
Save Money: Track your spending and look for areas to cut back.
Save Money: Cut out unnecessary expenses.
Minimum wage earnings $7.25/hour x 25 hours/week = $181.25/week or $725/month
Minimum wage earnings: $7.25/hour x 40 hours/week = $290/week or $1,160/month
Minimum age in your area: $8.55/hour (Chicago minimum wage) 3.5
Minimum age in your area: $11.25/hour (New York City minimum wage) 3.2
Minimum age in your area: $13.25/hour (Los Angeles City minimum wage) 3.1
Minimum age in your area: $12.00/hour (San Francisco minimum wage) 3.1
Beyond the specifics of the study is, perhaps, the most important finding of the research effort is the creation of a simple process which makes it easy for students to explore topics of social importance from their point of view, and contribute in a meaningful, serious way to knowledge. The templated Mind Genomics system, featuring Idea Coach empowered by artificial intelligence to help formulate questions and answers, provides a game-like introduction to the world of serious research. Just as important is the ability to ‘test’ the answers through consumer research. Even while having fun and learning, the student can do serious work, and emerge with important results.
There is a structural benefit to the above, the benefit of educating a generation fast, more deeply, at far less cost, and engaging the student by making the student an expert in the topic which is of interest. Rather than requiring years of understanding a topic before one is permitted to do ‘serious research’, the BimiLeap program teaches the student about the topic, allowing the student to use artificial intelligence in order to suggest questions, and provide answers, with answers that can be further explored with real people. At the same time that the student learns about the topic by interacting with artificial intelligence in Idea Coach, the student is encouraged to take an active role, to use the information in an experiment, and by so doing provide new-to-the-world knowledge, and often discoveries. It may be the best of all worlds, a source of learning through Idea Coach, and a template for involved, experiential learning and discovery, with the real opportunity to major, new-to-the-world contributions to a topic as one learns about that topic.
References
- Waltman JL (2000) The Politics of the Minimum Wage. University of Illinois Press.
- Frank RH, Cartwright E (2010) Microeconomics and behavior (Vol. 8). New York, McGraw-Hill.
- Sauer R (2018) The macroeconomics of the minimum wage. Journal of Macroeconomics 56: 89-112.
- Palazzolo M, Pattabhiramaiah A (2021) The minimum wage and consumer nutrition. Journal of Marketing Research 58: 845-869.
- McCurdy, Thomas (2015) How effective is the minimum wage at supporting the poor? Journal of Political Economy 123: 497-545.
- Kaufman BE (2010) Institutional economics and the minimum wage: broadening the theoretical and policy debate. ILR Review 63: 427-453.
- Gertner J (2006) What is a living wage? New York Times Magazine, January 15, 2006.
- Moskowitz HR (2012) ‘Mind Genomics’: The experimental, inductive science of the ordinary, and its application to aspects of food and feeding. Physiology & behavior 107: 606-613. [crossref]
- Porretta S, Gere A, Radványi D, Moskowitz H (2019) Mind Genomics (Conjoint Analysis): The new concept research in the analysis of consumer behaviour and choice. Trends in Food Science & Technology 84: 29-33.
- Gofman A, Moskowitz H (2010) Isomorphic permuted experimental designs and their application in conjoint analysis. Journal of Sensory Studies 25: 127-145.
- Galanter E, Moskowitz H, Silcher M (2011) People, Preferences and Prices: Sequencing the Economic Genome of the Consumer Mind. Bentham Science Publishers.
- Saulo A, Moskowitz V, Gere A, Papajorgji P, Ettinger Lieberman L, et al. (2019) Linking food endorsement labels & messaging to perceived price and emotions. A Mind Genomics® Exploration. Advances in Nutrition and Food Science 5.
- Moskowitz H, Moskowitz D (2022) Systematics of communication: Conjoint measurement, Emotions, cognitive economics, and Consumer Mind-sets. Product Innovation Toolbox: A Field Guide to Consumer Understanding and Research 198-244.
- Moskowitz H, Rappaport S, Moskowitz D, Porretta S, Velema B, et al. (2017) Product design for bread through mind genomics and cognitive economics. In: Developing New Functional Food and Nutraceutical Products 249-278, Academic Press.
- Likas A, Vlassis N, Verbeek JJ (2003) The global k-means clustering algorithm. Pattern Recognition 36: 451-461.
- Bassili JN, Fletcher JF (1991) Response-time measurement in survey research a method for CATI and a new look at nonattitudes. Public Opinion Quarterly 55: 331-346.
- Yan T, Tourangeau R (2008) Fast times and easy questions: The effects of age, experience and question complexity on web survey response times. Applied Cognitive Psychology 22: 51-68.