Monthly Archives: June 2019

Severe acute respiratory infection and viral infections in adult patients: active surveillance results

DOI: 10.31038/JCRM.2019231

Abstract

Severe acute respiratory syndrome (SARI) is a compulsory notification disease. The new molecular biology-based diagnostic methodologies have increased sensitivity for respiratory viruses (RVs) identification, evidencing their representativeness in SARI. Usually, they account for 22% of community-acquired pneumonias in adults. However, the epidemiology and burden of these infections in adults with SARI remain unclear. This study aimed to determine the clinical, epidemiological, risk factors and mortality rate of hospitalized adults with SARI, based on virus positivity. This descriptive, cross-sectional study included patients with SARI aged over than 14 years who were hospitalized from 2010 to 2016. A total of 592 cases were identified, of which 295 (49.8%) had samples collected. A total of 113 (38.4%) patients tested positive for RVs, and most of them were infected with influenza viruses (30.1%). Death occurred in 27.5% vs. 17.7% (p=0.09) of patients in the negative and positive virus group, respectively. SARI is an important condition in hospitalized adults, and is caused predominantly by influenza. It is associated with high mortality, independent of its etiology, without significant difference among those infected by positive or negative viruses.

Keywords

respiratory infections, respiratory viruses, influenza, and epidemiologic surveillance

1. Introduction

Lower respiratory tract infections are the leading cause of global morbidity and mortality, accounting for 292 million cases and 2.7 million deaths in 2015 [1]. The incidence reaches to 24.8 cases/100, 000 adults and 164.3 cases/100, 000 elderly people over 80 years old [2]. In Brazil, respiratory diseases are the fourth cause of death, concentrating on the extremes of age and in population with low socioeconomic status [3]. Community-acquired pneumonia (CAP) are caused by respiratory viruses (RVs) in 22.4% of cases according to a meta-analysis [4], which is the main etiologic agent in adults hospitalized, as reported in a US population study [2]. Influenza viruses (IFV) are among the major etiologies of CAP in adults, and influenza A H1N1pdm has been associated with more severe cases [5].

RVs can occur through monoinfection or coinfection with other viruses or bacteria [6] and may lead to severe forms [7, 8]. Some clinical factors in CAP are mostly associated with viral infections such as rhinorrhea and ground-glass opacity on computed tomography [9], but clinical and radiological signs should not be used alone to determine the etiology, due to the overlap of findings with other etiological agents [10].

Multiplex PCR-based diagnostic methods have been used to investigate cases of severe acute respiratory infection (SARI) identified by influenza virus surveillance [11, 12]. This methodology allowed the identification of multiple viral pathogens. In addition, to the benefit of epidemiological knowledge, the identification of virus in a clinical sample makes it possible to diagnose the etiology, support control measures to prevent transmission, and, together with clinical and laboratory data, guide antibiotics stewardship [13].

The high potential for pathogenicity of FLUs, human parainfluenza viruses (HPIVs), human adenovirus (HAdV), human respiratory syncytial viruses (HRSVs), and human metapneumovirus (HMPV) is well recognized [14]. Although there are difficulties in interpreting the detection of other RVs such as human rhinovirus (HRV), human bocavirus (HBoV), human enterovirus (HEV), and human coronaviruses (HCoVs), although evidence showed that they are associated with the development of lower respiratory tract infections [15–17].

In this study, we evaluated the clinical and epidemiological aspects of SARI in hospitalized adults identified during influenza active surveillance, and compared the clinical findings and outcomes based on virus positivity.

2. Materials and Methods

A cross-sectional study was performed to provide information on the active surveillance of influenza in hospitalized patients. In Brazil, notification of SARI is mandatory, and in the Hospital de Clínicas Complex, a tertiary academic hospital in southern Brazil, an active surveillance is conducted to detect cases, notify and collect samples to investigate RVs. Clinical, laboratory, Charlson comorbidity index, and outcome data are updated in a specific form after discharge or death. The Ethics Committee for Institutional Research approved this study (#18714013.4.0000.0096).

To be included, eligible patients were identified in the influenza active surveillance and older than 14 years. The following data were evaluated: age, sex, race, comorbidities, Charlson comorbidity index score, number of intensive care unit admissions, use of mechanical ventilations, death, collection or non-collection of specimen to detect the presence of a RV, antiviral use, time of symptom onset, period of hospitalization, and initiation of antiviral therapy (when performed), number of virus isolated, and identification of the virus isolated in case of positivity. The distribution of positive cases was evaluated monthly, as well severe cases and deaths. Severe disease was considered in case of ICU hospitalization, mechanical ventilation, or death.

Viral laboratory investigation was carried out using a multiplex PCR technology (Seeplex® RV15 ACE Detection Kit, Seegene Inc., Korea), which enables the simultaneous detection of 15 RVs: HAdVs; HMPV; HPIVs types 1, 2, 3, and 4 (HPIV-1, HPIV-2, HPIV-3, and HPIV-4); IFVA subtypes H1N1pdm and H3N2; IFV type B; HRSVs types A and B (HRSVA and HRSVB); HRV types A, B, and C; HEV; HBoV; and HCoV types 229E/NL63 (alpha coronaviruses) and OC43/HKU1 (beta coronaviruses). Clinical findings and outcome between groups with positive and negative viruses were evaluated.

2.1 Statistical analysis

A statistical analysis was carried out using the program XLSTAT version 2018.2.50494. Baseline demographic and clinical characteristics with normal and non-normal distributions were presented as means ± standard deviation and medians with interquartile ranges, respectively. Fisher’s exact test, independent t-test, Wilcoxon-Mann‐Whitney test, and U tests were used where appropriate. Odds ratios (ORs) and 95% confidence intervals (CIs) were calculated for the variables included. For the results in which the observed frequencies were less than 5, no statistical analysis was performed.. The level of significance was set at p<0.05. Time-to-event analyses (discharge or death) were performed using the Kaplan-Meier method.

3. Results

In the study period, a total of 1, 840 SARI cases were notified, of which 592 (32%) were from patients over 14 years old. Of these, only 295 (49.8%) patients were evaluated to detect RVs, and 113 (38.3%) of these cases were positive (Figure 1).

JCRM 2019-111 - Sonia Raboni Brazil_F1

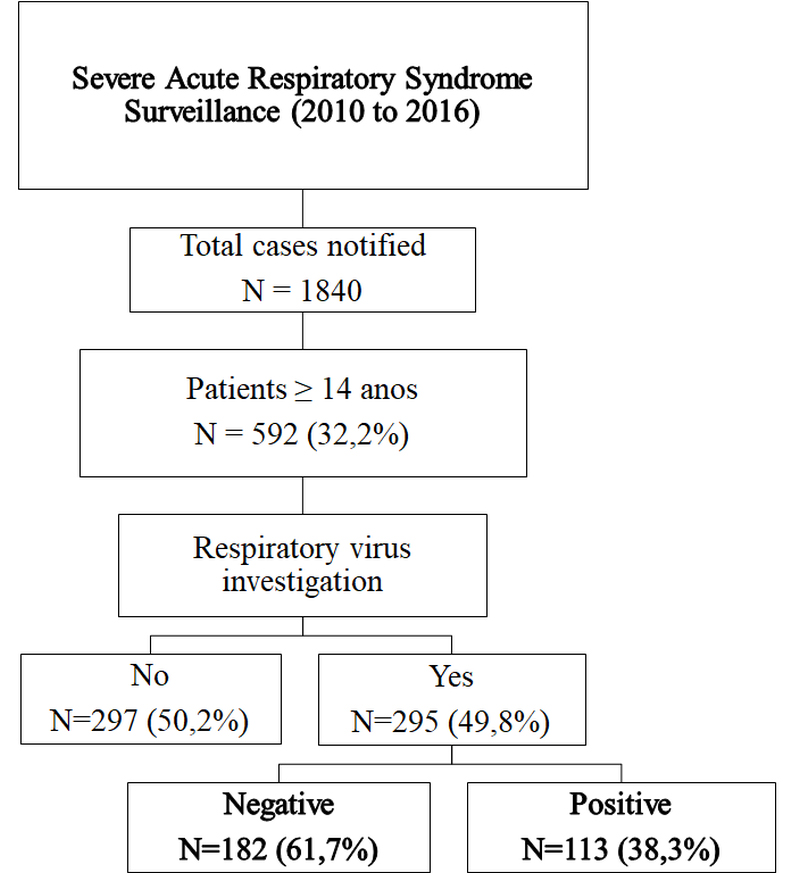
Figure 1. Flow chart of study design

Of the positive cases, influenza viruses were the most frequent pathogen (34 cases, 30.1%), and IFVA H1N1pdm represented more than half of IFVs samples (Fig 2B). HRV were present in 23.3%, HRSV in 13.8%, HPIV in 13%, HCoV in 7.2%, HAdV in 7.2%, HEV in 6.5% and HMPV in 4.3% of positive cases (Fig 2A). Monoinfection was detected in 89 cases (78.8%), and viral coinfection with 2 and 3 viruses were observed in 23 (20.4%) cases and 1 (0.9%) case, respectively.

JCRM 2019-111 - Sonia Raboni Brazil_F2

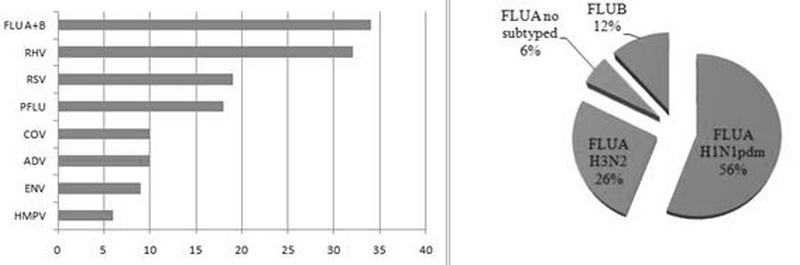
Figure 2. Respiratory viruses detected and influenza virus distribution

Patients whose samples were positive or negative for RVs had their demographic, clinical, and laboratory findings compared. No statistical difference was observed between both groups, except for the duration of symptoms until hospital admission that was higher in patients with negative results (p = 0.019). Mortality was also higher in patients with negative test results (27.5% vs. 17.7%, p = 0.09), but with no significant difference (Table 1).

Table 1. Demographic, clinical, and laboratory findings among positive and negative cases for respiratory viruses

 Characteristics

Total

N = 295 (%)

Positive virus

N = 113 (%)

Negative virus
N = 182 (%)

p-value

Age – median (IQR)

45.1 (30.8/60.3)

43.7 (29.2/61.3)

45.7 (33.1/59.6)

0.521

>14–<=18

19 (6.5)

7 (6.2)

12 (6.6)

NS

> 18–<=50

152 (51.6)

60 (53.1)

92 (50.6)

>50

124 (42.1)

46 (40.8)

78 (42.9)

Gender

female

135 (45.8)

57 (50.5)

78 (42.9)

0.229

IFV vaccine last season

60 (20.4)

27 (23.9)

33 (18.2)

0.237

Signs/symptoms

Dyspnea

287 (97.3)

109 (96.5)

178 (97.9)

0.487

Desaturation (O2Sat <95%)

192 (80.7)

72 (78.3)

120 (82.2)

0.709

respiratory discomfort

192 (85.4)

75 (86.3)

117 (84.8)

0.801

Comorbidities (yes)

228 (77.3)

93 (82.4)

135 (74.2)

0.117

Pneumopathy

93 (31.6)

40 (35.4)

53 (29.2)

NS

Cardiopathy

53 (18.1)

19 (16.9)

34 (18.8)

Immunodeficiency

106 (36.1)

47 (41.6)

59 (32.6)

Other comorbidities

130 (44, 1)

47 (41.6)

83 (45.6)

Pregnant/puerperium

15 (5.1)

9 (8)

6 (3.3)

NS

Charlson comorbidity index score

0

89 (30.6)

27 (24.4)

62 (34.5)

NS

1–2

105 (36.1)

49 (44.2)

56 (31.2)

3–4

68 (23.4)

21 (19)

47 (26.2)

>=5

29 (10)

14 (12.7)

15 (8.4)

Duration of symptoms until hospital admission – days (IQR)

4 (1.5/7)

3 (3/6)

4 (2/7)

0.019

Pulmonary X-ray

Normal

30 (11.6)

14 (15.3)

16 (9.6)

NS

Interstitial pattern

119 (46)

42 (45.7)

77 (46.2)

Consolidation

80 (30.9)

27 (29.4)

53 (31.8)

Mixed pattern

24 (9.3)

12 (13.1)

12 (7.2)

Other

22 (8.5)

7 (7.7)

15 (9)

Severe disease

196 (75, 7)

69 (75)

127 (76.1)

0, 129

Mechanical ventilation

130 (44.3)

42 (37.5)

88 (48.4)

NS

ICU

189 (64.3)

64 (57.2)

125 (68.7)

Death

70 (23.8)

20 (17.7)

50 (27.5)

IQR = interquartile range. NS = not significant. In bold = significant value

No significant difference was observed between patients infected with IFVs and those infected with other RVs (ORVs). Severe disease was found in 70.9% and 77% (p = 0.93) of cases and the mortality rate was 22.3% and 21% (p = 0.91), respectively. A Kaplan-Meier curve comparing monoinfection by IFV and ORV cases did not show a statistical difference (p = 0.91) (Fig 3).

JCRM 2019-111 - Sonia Raboni Brazil_F3

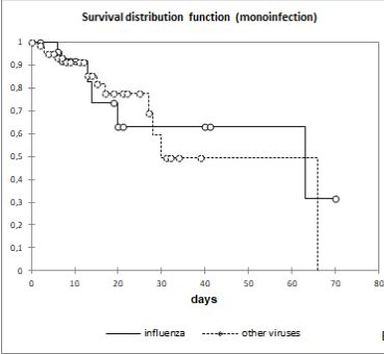
Figure 3. Kaplan-Meier curve comparing influenza vs. other respiratory virus infection

Comparing the clinical and laboratory findings of fatal and non-fatal cases, no significant differences were observed regarding presence of comorbidities, Charlson score and X-ray findings, only the identification of more than 1 virus were more common in non-fatal cases (10.3 vs. 1.5%, p = 0.02), although no signification association to a specific virus was observed (Table 2).

Table 2. Demographic, clinical, and laboratory findings of fatal and non-fatal cases

 Characteristics

Total cases with collected samples (N = 295)

Fatal cases (N = 70)

Non-fatal cases (N = 225)

p-value

Age – median (IQR)

45.1 (30.8/60.3)

47.9 (32.8/57.9)

44.5 (29.9/60.9)

0.477

Gender – Female

135 (45.8)

25 (35.8)

110 (48.9)

0.056

Influenza vaccine last season

60 (20.4)

8 (11.5)

52 (23.2)

0.046

Signs/symptoms

Dyspnea

287 (97.3)

68 (97.2)

219 (97.4)

1.000

Desaturation

192 (80.7)

47 (87.1)

145 (78.9)

0.774

Comorbidities (yes)

228 (77.3)

58 (82.9)

170 (75.6)

0.253

Virus result

Positive

113 (38.4)

20 (28.6)

93 (41.4)

0.067

IFV

34 (11.6)

6 (8.6)

28 (12.5)

0.520

IFV A H1N1pdm

19 (6.5)

3 (4.3)

16 (7.2)

NA*

IFV A H3N2

9 (3.1)

1 (1.5)

8 (3.6)

IFV not subtyped

2 (0.7)

0 (0)

2 (0.9)

IFV B

4 (1.4)

2 (2.9)

2 (0.9)

HRV

32 (10.9)

5 (7.2)

27 (12)

NA*

HRSV

19 (6.5)

2 (2.9)

17 (7.6)

HPIV

18 (6.2)

3 (4.3)

15 (6.7)

HAdV

10 (3.4)

1 (1.5)

9 (4)

HCoV

10 (3.4)

2 (2.9)

8 (3.6)

HEV

9 (3.1)

1 (1.5)

8 (3.6)

HMPV

6 (2.1)

1 (1.5)

5 (2.3)

Number of virus identified

1

89 (30.2)

19 (27.2)

70 (31.2)

0.555

>1

24 (8.2)

1 (1.5)

23 (10.3)

NA*

In bold: significant values; IQR = interquartile range; NS = Not significant; NA = Not applicable; *Frequency < 5

4. Discussion

Due to the importance of RVs in SARI, high morbidity and mortality, and the capacity to cause outbreaks and pandemics, clinical and epidemiological studies must be conducted to improve RVs knowledge, mainly in developing countries [18]. As a result of the high representativeness of RVs in pediatrics, few data are specific for the adult population, especially in Brazil and Latin American countries. In this study we showed a high prevalence of respiratory viral infection among adult SARI patients.

In recent years, there has been an important improvement in the knowledge on the epidemiological aspects of the etiology of CAP. This probably occurred after the introduction of vaccines for Streptococcus pneumoniae and Haemophilus influenzae and, especially, access to new molecular diagnostic methods (PCR) [19, 20], which considerably increased the sensitivity for the identification of RVs. The notification of SARI in adults accounted for practically one-third of the cases. The active surveillance guarantees the identification of almost all cases, but only half of them had virus sampling performed due to the low adherence to epidemiological surveillance procedures. In this study, among the samples collected, 38.3% were positive for some RVs, similar to the incidence previously reported [21], and confirming the importance of viruses as the main cause of SARI in this population.

Comparing virus positive and negative cases, no clinical and demographic difference was found, nor in the proportion of severe cases and deaths, despite the increasing mortality among negative cases. Unfortunately, no systematic investigation has been performed for other etiologic agents. Bacterial infections are present in 14%–23% of patients with community-acquired pneumonia, but no etiologic agent was identified in 46%–62% of the cases [2, 22]. Therefore, in our study, some of the negative cases are probably bacterial infections, or even viral infections, which were not identified by the method used to evaluate the case. Furthermore, patients with negative results had a significant higher duration of symptoms until hospital admission, which could contribute for viral negative results.

Regarding the viruses identified, the importance of the influenza virus in the adult population studied was confirmed, being present in 11.6% of the SARI cases with virus investigation and in 30.1% of the positive cases for RVs. Similar this finding, the IFVs were the major pathogen associated with the development of community-acquired pneumonia in adults, according to a previous meta-analysis (4). However, the differences between the results of epidemiological studies on RVs may be related to geographic location and seasonal factors. In the present study, we decided to collect the data from 2010, following the 2009 pandemic, which was considered as an atypical year in relation to the clinical and epidemiological aspects of RVs infections.

Regardless of RVs detection (positive or negative), high lethality was found among cases of SARI (23.8%), reaching 34.9% between cases requiring ICU and 45.4% among those who required mechanical ventilation. Therefore, all hospitalized patients who met the SARI criteria, notwithstanding of etiology and presence or absence of comorbidities, should be considered as high risk for poor outcome.

Also, viral coinfected patients had higher mortality rates than monoinfected individuals (p<0.02), but the low frequency of viral monoinfection in the studied group hinders any conclusion. We have previously reported a similar finding after comparing patients with viral monoinfection and coinfection with bacteria, in which the detection of mixed respiratory pathogens is frequent in hospitalized patients with acute respiratory infections, but its impact on the clinical outcome does not appear substantial [23].

This study presents some limitations: (i) the low rate of RVs sampling performed among adult patients with SARI, (ii) and the failure to investigate other etiological agents that are possibly associated with SARI such as bacteria, fungi, and mycobacteria. (iii) In addition, the high proportion of patients with immunosuppression limits the extrapolation of these data to other populations. However, the frequency of respiratory viruses found in adults with SARI with percentage values above those previously reported should serve as an alert to the need for viral investigation in all cases of SARI in adults, seeking to know the impact of these infections on this age group

5. Conclusion

As a conclusion, for the population evaluated in the present study, respiratory viruses accounted for more than a third of cases of SARI in adults, being IFVs the main etiological agent. SARI is associated with high lethality, regardless of virus positivity, and presence of comorbidities. Surveillance measures should therefore be maintained and strengthened in adults, seeking to establish risk factors possibly associated with fatality rates and the etiologies of negative cases for RVs to identify emerging pathogens.

Conflict of Interests: Nothing to declare.

Acknowledgements: We would like to thank all epidemiological division staff who supported the routine collection and registration of data: Adeli Ribeiro P. Medeiros, Celia Targa, Cristina Garcia Beckert Batista, Fabiana Costa de Senna Ávila Farias, Juçara Maleoni de Oliveira, Lili Gonçalves, Monica Klimczuk Fernandes, Rosa Helena Silva Souza, and Suzana Dal-Ri Moreira.

We would also like to thank the following virology laboratory staff: Meri B. Nogueira, Luine R. Vidal, and Luciane A. Pereira

Authors Contributions: SMR participated to the conception/design of the study, supervised the analysis, interpreted the data, and wrote the manuscript. BMA participated to the conception of the study, analyzed the data and performed the statistical analysis. NS and MLP collected and analyzed the data. All authors provided contributions to the manuscript, and approved the final version.

Fundings: None

References

  1. Troeger C, Forouzanfar M, Rao PC, Khalil I, Brown A, Swartz S, et al. (2017) Estimates of the global, regional, and national morbidity, mortality, and aetiologies of lower respiratory tract infections in 195 countries: a systematic analysis for the global burden of disease study 2015. Lancet Infect Dis 17; 909–48.
  2. Jain S, Self WH, Wunderink RG, Fakhran S, Balk R, Bramley AM, et al. (2015) Community-acquired pneumonia requiring hospitalization among U.S. adults. N Engl J Med 373, 415–27.
  3. Brasil, Ministério da Saúde. Protocolo de tratamento de influenza 2017. Available from http://bvsms.saude.gov.br/bvs/publicacoes/protocolo_tratamento_influenza_2017.pdf (accessed 02 June, 2018).
  4. Wu X, Wang Q, Wang M, Su X, Xing Z, Zhang W, Shi Y. (2015) Incidence of respiratory viral infections detected by PCR and real-time PCR in adult patients with community-acquired pneumonia: A meta-analysis. Respiration 2015; 89; 343–52. [Crossref]
  5. Qu JX, Gu L, Pu ZH, Yu XM, Liu YM, Li R, et al. (2015) Viral etiology of community-acquired pneumonia among adolescents and adults with mild or moderate severity and its relation to age and severity. BMC Infect Dis 15; 89. [Crossref]
  6. Musher DM, Thorner AR. (2014) Community-acquired pneumonia. N Engl J Med 371; 1619–28.
  7. Wu RG. (2013) Viral pneumonia in adults. J Int Med Taiwan 24; 317–27.
  8. Nguyen C, Kaku S, Tutera D, Kuschner WG, Barr J. (2016) Viral respiratory infections of adults in the intensive care unit. J Intensive Care Med 31; 427–41. [Crossref]
  9. Kim JE, Kim UJ, Kim HK, Cho SK, An JH, Kang SJ, et al. (2014) Predictors of viral pneumonia in patients with community-acquired pneumonia. PLoS One 9; 2014; 1–13. [Crossref]
  10. Jartti A, Rauvala E, Kauma H, Renko M, Kunnari M, Syrjälä H. (2011) Chest imaging findings in hospitalized patients with H1N1 influenza. Acta radiol; 52, 297–04. [Crossref]
  11. World Health Organization. Global epidemiological surveillance standards for Influenza 2014. Available from http://www.who.int/influenza/resources/documents/WHO_Epidemiological_Influenza_Surveillance_Standards_2014.pdf (accessed 02 June, 2018).
  12. World Health Organization. Operational guidelines for sentinel severe acute respiratory infection (SARI) surveillance 2015. Available from https://www.paho.org/revelac-i/wp-content/uploads/2015/10/2015-cha-operational-guidelines-sentinel-sari.pdf (accessed 02 June, 2018).
  13. Gadsby NJ, Russel CD, McHugh MP, Mark H, Conway Morris A, Laurenson IF et al. (2016) Comprehensive molecular testing for respiratory pathogens in community-acquired pneumonia. Clin Infect Dis 201; 62, 817–23. [Crossref]
  14. Ruuskanen O, Lahti E, Jennings LC, Murdoch DR. (2011) Viral pneumonia. Lancet 377; 1264–75.
  15. Tan D, Zhu H, Fu Y, Tong F, Yao D, Walline J, et al. (2016) Severe community-acquired pneumonia caused by human adenovirus in immunocompetent adults: a multicenter case series. PLoS One 11; 1–12. [Crossref]
  16. Branche AR, Falsey AR. (2015) Respiratory syncytial virus infection in older adults: an under-recognized problem. Drugs & Aging 32, 261–69. [Crossref]
  17. Panda S, Mohakud NK, Pena L, Kumar S. (2014) Human metapneumovirus: review of an important respiratory pathogen. Int J Infect Dis 25; 45–52. [Crossref]
  18. Al-Tawfiq JA, Zumia A, Gautret P, Gray GC, Hui DS, Al-Rabeeah AA et al. (2014) Surveillance for emerging respiratory viruses. Lancet Infect Dis 2014; 14, 992–1000. [Crossref]
  19. Fang GD, Fine M, Orloff J, Arisumi D, Yu VL, Kapoor W, et al.(1990) New and emerging etiologies for community-acquired pneumonia with implications for therapy. A prospective multicenter study of 359 cases. Medicine (Baltimore) 69, 307–16. [Crossref]
  20. Pavia AT. (2011) Viral infections of the lower respiratory tract: old viruses, new viruses, and the role of diagnosis. Clin Infect Dis 52, 0–5. [Crossref]
  21. Pavia AT. (2013) What is the role of respiratory viruses in community-acquired pneumonia? what is the best therapy for influenza and other viral causes of community-acquired pneumonia? Infect Dis Clin North Am 27, 157–75. [Crossref]
  22. Musher DM, Roig IL, Cazares G, Stager CE, Logan N, Safar H. (2013) Can an etiologic agent be identified in adults who are hospitalized for community-acquired pneumonia: Results of a one-year study. J Infect 2013; 67, 11–18. [Crossref]
  23. Damasio GAC, Pereira LA, Moreira SD, Duarte dos Santos CN, Dalla-Costa LM, Raboni SM. (2015) Does virus–bacteria coinfection increase the clinical severity of acute respiratory infection? J Med Virol 2015; 87; 1456–61. [Crossref]


Immune Cytokines for Cancer Therapy

DOI: 10.31038/CST.2019424

Summary

Cytokines are molecular messengers that mediate cell-to-cell communication in an autocrine and paracrine fashion. Development of cytokine-based drugs requires a deep understanding of cytokine biology and continuous engineering effort to fine-tune pharmacological properties to elicit potent anti-tumor response while keeping toxicity to a minimum. To date, high dose bolus IL-2 for metastatic melanoma and INF-α for renal carcinoma have been approved as single agents for cancer therapy. In additions, immune cytokines, especially IL-2 and more recently IL-7, IL-15, and IL-21, have been used in Adoptive T-Cell Therapy (ACT) to expand anti-tumor T cells. Nonetheless, systemic monotherapy using cytokines has not fulfilled the promise of clinical efficacy due to several limitations, including failure to achieve effective concentrations in the tumor tissue, severe systemic toxicities that often associated with the high dose administration, and unwanted induction of immune suppression. To address these impediments, innovative approaches have been adopted to improve cytokine-based immunotherapy. These include PEGylation, structure-based cytokine engineering and antibody-cytokine fusion molecules. In this review, we summarize the clinical activity of immune cytokines in the treatment of cancers and recent progress in the engineering of new cytokine therapeutics.

1. Introduction

The role of cytokines in cancer immunology

Immune cells are well recognized to play critical functions in the surveillance of tumor cells and the eradication of established disease foci. A weakened or exhausted immune system usually leads to the growth of tumor cells and metastases. Current immune oncological therapies, such as the immune checkpoint blockade agents PD-1/PD-L1 antibodies, and CAR T therapy, are examples of either boosting cytotoxic T cell functions or directly providing tumor specific T cells to combat tumors.

Immune cytokines are small soluble proteins that function to maintain the activity of the immune system by playing roles in many aspects, such as the proliferation and differentiation of cytotoxic T cells and enhance effector cell antitumor cytotoxic activities. Ever since the identification of the pro-inflammation activity of Interleukin-2 (IL-2), immune cytokines have been tested as cancer therapeutic. However, due to their broad and systemic effect, few cytokines could clinically demonstrate convincing anti-tumor activity with limited adverse effects. Nevertheless, clinical trials with native or engineered cytokines provide valuable insights on how immune networking is established and will shed light on future tumor immune therapy.

2. Current Clinical Experience with Immune Cytokines in Cancer Therapy

2.1 IL-2

2.1.1 Native or Recombinant IL-2

Interleukin-2 (IL-2) is a cytokine produced mainly by activated CD4 T cells and CD8 T cells, and occasionally by certain B cells and dendritic cells [1]. IL-2 can stimulate the proliferation of T cells and other cells that express IL-2 receptors. Since cytotoxic T cells play roles in tumor immunity by attacking cancerous cells directly, IL-2 was used as an agent to boost cytotoxic T cell function to treat cancer patients.

In fact, IL-2 was one of the first immune cytokines tested in clinical trials as early as the 1980s. Initially, only purified native IL-2 was available, and due to the limitation of the purification process, only small doses of IL-2 were used. Unfortunately, only toxicity but no clinical anti-tumor activity was observed when tested in advanced cancer patients [2].

Later, when recombinant IL-2 (rIL-2) was produced, higher doses of IL-2 were tested together with autologous LAK cells in 25 patients with metastatic cancer, who had failed standard therapy. In this trial, very promising anti-tumor activity was observed [3]. One 33-year old female with metastatic melanoma was among the first cohort of patients who received the high dose rIL-2 treatment. This patient responded very well to this treatment, with complete response observed in a few months. In addition, she was cancer-free for at least 29 years.

Additional clinical trials revealed that high dose rIL-2 alone was sufficient to obtain therapeutic activity that leads to tumor regression. In one clinical trial, high dose bolus IL-2 treatment led to a 15% objective response rate (ORR) in 182 metastatic melanoma patients and a 19% ORR in 277 metastatic renal cancer patients. After several multi-institutional studies demonstrated the clinical efficacy of rIL-2 treatment, FDA approved rIL-2 to treat metastatic renal cancer and melanoma in 1992 and 1998, respectively.

Due to the short half life of IL-2, which is about 7 minutes in humans, IL-2 has to be administered at a large dose and several times a day. This limits the use of IL-2 as an effective therapeutic agent. Side effects include hypotension, heart toxicities, and vascular leak syndrome. These side effects prevent many patients from taking rIL-2 at the optimal high dosage. Initially, treatment related death happened in 2~4% of IL-2 treated patients, but the mortality rate was reduced to less than 1% later with appropriate clinical management [4].

In addition to serving as a direct therapeutic drug to cancer patients, IL-2 is also used in cancer immune therapies. Both CAR-T and ACT therapies are dependent on the availability of a large amount of T cells, either engineered T cells or endogenous antitumor lymphocytes. Thus, IL-2 has been used as the growth factor to expand these types of cells in vitro to obtain enough cells to treat patients.

2.1.2 Engineered IL-2

NKTR-214:

The IL2 receptor complex has three distinct subunits, the α-chain (IL-2Rα or CD25), β-chain (IL-2Rβ or CD122), and γ-chain (γc or CD132). Not all 3 receptors exist on all types of IL-2 target cells. IL-2Rα and L-2Rβ are commonly found as heteroreceptors in many target cells, but the presence of the α-chain in the receptor complex increases the affinity for IL-2 by 2 orders of magnitude [5]. Treg cells, the immune suppressive T cells, express CD25 and thus have the highest affinity for IL-2 as compared to other T cells. This explains why at a lower dose, IL-2 failed to show any anti-tumor activity in clinical trials. To limit IL-2Rα binding, a PEGylated form of rIL-2, which is named NKTR-214, has been developed.

PEGylation is a common practice to extend the in vivo half-life of peptides or small proteins by covalent or non-covalent attachment of polyethylene glycol (PEG) to peptides/proteins. For NKTR-214, IL-2 was conjugated with releasable PEG chains at lysine residues in the IL-2Rα-binding interface. Since the bulky PEG chains block the interaction of IL-2 with its receptor, NKTR-214 serves as a prodrug, and after several PEG chains are released, the one-chain pegylated IL-2 (1-PEG-IL-2) becomes the active form. Compared with IL-2, 1-PEG-IL-2 has comparable binding affinity to IL-2Rβ but much less affinity to IL-2Rα, and thus has a drastically lowered affinity to IL-2Rαβγ, the receptor complex that is abundant on Treg [6].

As expected, NKTR-214 increases the half-life of IL-2 to 15.5 hours in mice. Since the active form is slowly released, the Cmax is reached 24 hrs after a single treatment. More importantly, compared to IL-2, the active forms of NKTR-214 have a 10-fold lower Cmax, but 27-fold higher AUC, meaning a controlled release and more drug exposure as the benefit of PEGylation [6].

In the mouse B16F10 melanoma model, NKTR-214 demonstrated better activity and safety than rIL-2. While rIL-2 had to be administered twice daily, NKTR-214 was given to mice every 9 days. Single agent NKTR-214 treatment had much better anti-tumor activity than that of IL-2 [7].

Analysis of T cell populations in mice treated with NKTR-214 also indicated that total and memory CD8 T-cell population in tumor infiltrating lymphocytes were significantly increased. This is more sustainable and stable than the effect of natural IL-2.

When combined with the immune checkpoint inhibitor CTLA-4 antibody, NKTR-214 demonstrated synergistic activity to control tumor growth in the EMT6 breast cancer model, with 70% of mice showing complete response and becoming tumor free. In comparison, the tumor free rate in mice treated with IL2 and anti-CTLA4 is 40%. Tumor free mice were resistant to tumor- rechallenges, indicating a durable and specific immunity had been established with the combination of NKTR-214 and checkpoint blockade [7].

Due to the slow release of the active cytokines, longer half life and reduced peak concentration, NKTR-214 also demonstrated less severe side effects in animal studies. rIL-2 treated mice became hypothermic and exhibited shivering behavior, while NKTR-214 treated mice only showed mild weakness [7] .

Although NKTR-214 was designed to spare Treg, in vivo studies revealed that at the high dosage used in tumor treatment, activation of Treg may not even be an issue for rIL-2. To the opposite, the Treg population was reduced by both IL-2 and NKTR-214 as compared with control treatment.

Using a humanized model of IL-2 therapy, Li and colleagues reported that Treg in fact controls the toxicity during IL-2 therapy [8]. Down-regulation of Treg by high dose rIL-2 or NKTR-214 thus could be directly linked to the toxicity related to IL-2 therapies. To ameliorate IL-2 toxicity, a strategy is to use the PIM-1 kinase inhibitor, Kaempferol [8]. As discovered previously, Kaempferol enhances the suppressive function of Treg cells by inhibiting FOXP3 phosphorylation by PIM1[9, 10].

With the promising activity in animal models, NKTR-214 has been tested in clinical trials. However, when NKTR-214 was tested as monotherapy in the early EXCEL trial, no objective response was observed, compared with the 15~29% ORR for rIL-2 seen in other trials. The lack of clinical efficacy for NKTR-214 monotherapy was accounted for by a lower maximum-administered dose (0.012 mg/kg q3w), the much lower Cmax and weaker activation of lymphocytes. Analysis of clinical trial data also revealed that NKTR-214 has a mixed effect on Tregs. While tumor-infiltrating Treg cells are reduced, peripheral Treg populations are increased after NKTR-214 treatment.

When tested in combination as first line treatment in early stage clinical trials, NKTR-214 and PD-1 antibody Nivolumab produced 64% ORR in stage IV melanoma and 71% ORR in Stage IV RCC. The same combination also produced 60% ORR as first or second line treatment in Stage IV NSCLC [11]. Again, additional trials are needed to verify the clinical efficacy for the combination strategy and to show its benefit over Nivolumab monotherapy.

In terms of side effects, NKTR-214 has not solved all of the adverse effects that IL-2 displays. Still, many patients report having fatigue, rashes, and flu-like symptoms.

Neo-2/15

Instead of using pegylation to block binding to IL-2Rα receptor, a creative de novo approach was taken to develop IL-2 mimics with better selectivity for IL-2Rβγ and higher in vivo stability [12]. Although called “de novo” design, this strategy started with IL-2 as the template, extracting α helices that interacting with IL-2Rβγ, but modified the loops connecting the helices and the backbones to obtain structures with lower energy. Site mutations were then introduced into the lead structure for a better affinity to IL-2Rβγ.

The final structure, Neo-2/15, shows only 14% and 24% structure-based sequence identity to human and mouse IL-2 respectively, but binds to IL-2Rβγ receptor of both species with very high affinity. As designed, Neo-2/15 has no detectable binding to IL-2Rα and demonstrates thermal stability at 80°C[12].

As demonstrated by in vivo studies, Neo-2/15 causes less expansion of the immunosuppressive Treg cells than IL-2. When mice were treated with Neo-2/15, the ratio of CD8 T cells over Treg cells was greatly increased. Most importantly, Neo-2/15 has been found to have a superior immunotherapeutic activity to IL-2 in mouse models of melanoma and colon cancer. When Neo-2/15 was used in combination with TA99, which is an antibody against TRP-1, 4 out of 10 mice were tumor-free after treatment. Neo-2/15 caused less weight loss and general health problems in treated mice as compared with native IL-2 [12].

In addition to NKTR-214 and Neo2/15, there are several other engineered IL-2 cytokines under clinical testing. An IL-2 variant (IL2v), which has abolished binding to IL2Rα, was recombinantly linked to anti-FAP or anti-CEA antibodies [13]. The antibody- cytokine fusions (FAP-IL2v and CEA-IL2v) are designed to enrich cytotoxic T cells- specific IL-2 to tumor microenvironment and thus limiting its effect on peripheral Treg. Furthermore, CEA-IL2v and FAP-IL2v enhanced the cytotoxic activity of Natural Killer (NK) cells when combined with ADCC-competent antibodies against HER2 or EGFR [13].

2.2 IL-10

T cell exhaustion is frequently observed in cancer patients. It could lead to the escape of tumor cells from immune surveillance and create hurdles for successful cancer immunotherapy.

As one of the immune cytokines having dual roles, IL-10 is anti-inflammatory at low concentrations, but pro-inflammatory at high concentrations to induce immune activation and invigorate CD8+ T cells. It is produced by activated T cells, monocytes and lymphocytes, which is further induced by PD-1 blockade in animal studies [14]. It is proposed that PD-1 induces IL-10 secretion and renders tumor microenvironment immunosuppressive, as evidenced by the synergistic anti-tumor effect by anti-PD-1 and anti-IL-10 antibodies on ovarian cancer xenografts.

Nevertheless, when PEGylated IL-10 (also known as Pegilodecakin, or AM0010) was administered to mice to obtain sustained elevated serum concentration, activation of tumor-resident CD8+ T cells was observed and tumor rejection occurred [15, 16].

A phase I clinical trial was conducted in patients with intermediate to poor-risk renal cell cancer. In patients treated with the optimal dose of AM0100, which was 20 μg/kg, partial responses were observed in four out of 15 patients, resulting in an overall response rate of 27%. Furthermore, a prolonged stable disease of at least 4 months was observed in 4 patients, with one having disease stabilization for 20 months. [17]

In this trial, patients self-administered PEGylated IL-10 subcutaneously at doses of 1 to 40 μg/kg once daily [18]. At 29 days after treatment initiated, sustained serum levels of IFNγ, IL-18, IL-4, and IL-7 were detected. Patients with better clinical response tended to have increased LAG+PD1+CD8+ T cells after the treatment, suggesting an invigoration of exhausted T cells after PEGylated IL-10 treatment. Patients with PR also have more T cell clones amplified. The combination of PEGylated IL-10 and the anti-PD1 antibody pembrolizumab was also tested in heavily pre-treated cancer patients, including melanoma, non-squamous cell lung cancer or RCC. 42% ORR was observed in 19 evaluable patients [18].

Observed adverse events (AEs) included anemia, fatigue, thrombocytopenia, fever, and injection site reactions. Grade 3 to 4 nonhematopoietic treatment-related AEs was observed in 5 out of 33 patients, Grade 3 to 4 anemia or thrombocytopenia was also observed in five patients. However, most treatment-related AEs were transient or reversible, and AM0100 was considered to have an acceptable toxicity profile. Prolonged exposure to AM0100 did not lead to acute toxicities at the therapeutic dose [17].

2.3 IL-12

The IL-12 family cytokines comprise heterodimeric IL-12, IL-23, IL-27, and IL-35. Although similar in structures, these cytokines have various biological and immunological functions. IL-12 is a pro-inflammatory cytokine produced by DCs, macrophages and B cells. Secretion of IL-12 can be potentiated by IFN-γ from T cells. IL-12 can further act on NK cells to induce IFN-γ [19].

Like other members of the IL-12 family, IL-12 is composed of 2 subunits: α and β. IL-12 shares the α subunit (p35) with IL-35, and the β subunit (p40) with IL-23. The IL-12 receptor also includes two subunits: IL-12Rβ1 and IL-12Rβ2. Like the ligands, the IL-12 family receptors also share subunits. IL-12Rβ1 exists in the receptors for IL-12 and IL-23, and IL-12Rβ2 exists in the receptors for IL-12 and IL-35.

In preclinical studies, IL-12 is able to enhance anti-tumor activity and totally eradicate large established tumors [20], which is dependent on CD8 T cells and IFN-γ [21]. IL-12 is also critical to anti-tumor T cell immunity induced by the anti-PD-1 antibody, as eliminating IL-12 with anti-IL-12 antibody entirely wiped out the anti-tumor effect of anti-PD-1 antibody in an MC38 tumor model [22]. It is reported that the PD-1 antibody acts on CD8+ T cells to produce IFN-γ, which subsequently induces DC to release IL-12.

In clinical trials, as recombinant IL-12 has to be used at high doses due to its short half-life, significant and unacceptable toxicity sometimes occurs.

2.3.1 Early Clinical Trials with IL-12

Cutaneous T Cell Lymphoma (CTCLs): CTCLs are a family of non-Hodgkin lymphomas. It has 2 common forms: mycosis fungoides (MF) and Sezary syndrome (SS). Patients with CTCLs usually have defects in IL-12 and are associated with deficient IFN-γ production and depressed Th1 cells functions. In a phase I clinical trial with 10 CTCL patients, subcutaneous treatment with IL-12 resulted in 2 complete responses in 5 MF patients with extensive plaque. Only mild and short-lived adverse effects were noticed. In these patients, an increased proportion of cytotoxic CD8+ T cell was observed. In total, IL-12 treatment achieved an ORR of 56% (5 out of 9 patients) [23].

Hodgkin’s and non-Hodgkin’s Lymphoma: Younes et al reported a phase II study on the effect of IL-12 on HL (Hodgkin’s lymphoma) and NHL (non-Hodgkin’s B cell lymphoma) [24]. Objective responses were only observed in NHL patients. It was concluded that i.v. treatment was more effective than s.c. injections (40% v.s. 7%), and responses were better in follicular grade I/II lymphoma v.s. diffuse large B-Cell lymphoma. Patients with less severe diseases tended to have a better response. In a phase I clinical trial [25], recurrent NHL patients showed 69% ORR when treated with both rituximab and IL-12. However, a follow-up phase II study showed that the efficacy in the combination treatment was entirely due to rituximab.

Kaposi Sarcoma (KS): KS is a tumor localized in the skin, caused by HHV-8 (human herpesvirus 8). It is often associated with iatrogenic immunosuppression or HIV-related immunodeficiency. In a dose-escalating clinical trial with 24 patients [26], high dose IL-12 showed 71% ORR, and one patient showed complete tumor regression after continued IL-12 therapy for almost 5 years. Again, some patients experienced psychoneurological problems. IL-12 was also studied in the phase II study in combination with pegylated liposomal doxorubicin [27]. Impressively, ORR of this trial was 83%, with 25% treated patients showing complete response.

In general, as we extrapolated from clinical trials, high doses of IL-12 commonly leads to severe hematologic toxicity such as neutropenia, thrombocytopenia, hyperbilirubinemia, and hypoalbuminemia. While pre-treatment with a priming dose of IL-12 allowing administration of higher doses, this strategy shows no improvement regarding the therapeutic outcomes. In addition, consecutive injections of IL-12 will lead to adaptive responses and the significant decline of IFN-γ induction. It is unlikely that IL-12 will become an effective single agent treatment for cancer patients.

2.3.2 IL-12-based immunocytokines (Antibody-cytokine fusion proteins)

In an effort to improve therapeutic efficacy and safety, IL-12 has been explored as fusion proteins with tumor targeting antibodies. By accumulating in the tumor tissue or even directly killing cancer cells, the antibody-cytokine fusion proteins are expected to induce a strong inflammatory signal to enhance antitumor response.

One of these fusion proteins is AS1409, which contains a humanized antibody BC1 that binds to the ED-B variant of fibronectin and directs IL-12 to tumor-associated vasculature. In a phase I trial with 11 melanoma and 2 renal cell carcinoma patients, AS1409 treatment induced elevated serum levels of IFN-γ and interferon-inducible protein-10 (IP-10) in all patients, indicating activation of cell-mediated immune response. One melanoma patient had a partial response, while stable disease was seen in 5 other patients [28]. At the maximum tolerated dose of 15 μg/kg, most drug-related adverse events were grade 2 or less, including pyrexia, fatigue, chills, headache, vomiting, and transient liver function abnormalities. Unfortunately, plasma half-life of this fusion antibody was only 22 hours, and antidrug antibody responses were seen in all patients [28]. The shorter than expected half-life and immunogenicity issue will somehow limit the clinical development of AS1409.

Another example is NHS-IL12, which is IL-12 fused with a tumor necrosis-targeting human IgG1 (an anti-histone antibody) [29]. NHS-IL12 has demonstrated anti-tumor activity in pre-clinical studies with murine and dog tumor models [29, 30]. Irradiation that induces the necrosis of tumor cells is shown to potentiate NHS-IL12 anti-tumor activity [31]. Combination of NHS-IL12 with anti-PD-L1 antibody achieves complete tumor regression in the EMT-6 mammary tumor model [32].

2.3.3 Delivery of IL-12 cDNA

Therapeutic IL-12 is usually delivered as recombinant or engineered IL-12 proteins. Alternatively, IL-12 was also explored as gene therapy by delivering viral or plasmid vectors to express IL-12 in the host. In clinical trials, RTS-hIL-12 plus veledimex were studied in recurrent or progressive glioblastoma multiforme adult patients.

IL-12 expressing vector can also be delivered to therapeutic cells directly. To help CAR T therapy, T cells were engineered to express IL-12 to enhance the durability and help change the tumor microenvironment to allow better tumor penetration. A MUC-16 targeting CAR T therapy has been developed for recurrent ovarian cancer and is currently tested in a phase I clinical trial [33].

2.4 IL-15

IL-15, a cytokine mainly produced by activated myeloid cells, shares structure similarity with IL-2 and binds to two of IL-2’s receptors: IL-2Rβ and γc. IL-15 has its own high affinity receptor, IL-15Rα. Due to receptor specificity, IL-15 acts on NK cells and activated T cells, but not on immunosuppressive Treg. For this reason, IL-15 is considered as an ideal cytokine to effectively augment CD8+ T cell and NK cell function in solid tumors.

Recombinant IL-15 produced in Escherichia coli was initially tested via intravenous bolus injection in advanced melanoma and RCC patients. Expansion of peripheral NK and CD8+ T cells was reported in patients treated with IL-15, but there was no objective clinical response [34]. rIL-15 was also tested subcutaneously in patients with a variety of solid tumors, and the best clinical outcome was stable disease [35]. In general, subcutaneously administration of rIL-15 tended to have a little higher dose-limiting toxicity at 3.0 μg/kg per day. The severe adverse events after patients were treated with rIL-15 included high fever, hypotension and thrombocytopenia [34].

To engineer a potent IL-15 ligand, IL-15 was recombinantly connected to the sushi domain of IL-15R alpha. The sushi domain functions as an IL-15 agonist by enhancing its binding and biological effects through the IL-2Rβ and γc heterodimer [36]. This super IL-15 ligand can be produced as an IgG- fusion protein to obtain longer half-life. ALT-803 is such an IgG fusion protein but contains a mutated IL-15 with superior activity [37]. In a mouse model of multiple myeloma, a single intravenous dose of ALT-803, but not IL15, eliminated well-established tumors and prolonged survival of mice. In B16F10 melanoma tumors and CT26 colon cancer models, ALT-803 also demonstrated better anti-tumor activity than IL-15, and increased peripheral blood lymphocyte, neutrophil, and monocyte counts by >8-fold [37].

In a phase one clinical trial in patients with hematologic malignancies who relapse after allogeneic hematopoietic cell transplantation (allo-HCT), ALT-803 was administered to 33 patients via the IV or subcutaneous (SQ) routes once weekly for 4 doses. In general, ALT-803 was well tolerated. While IV administration led to constitutional symptoms temporally related to increased serum IL-6 and IFN-γ, SQ delivery only resulted in prolonged (>96 hour) serum concentrations and only self-limited injection site rashes without acute constitutional symptoms. Activation of NK cells and CD8+ T cells, but not Treg, were observed after ALT-803 treatment. More importantly, clinical responses were observed in 19% of evaluable patients, including 1 complete remission lasting 7 months [38].

Nanoparticles and protein nanogels are potential efficient delivery methods for ALT-803. Nanogels contains an antibody molecule that can direct the delivery to a specific cell type, such as T cells. To receive the ALT-803 payload, T cells need to have a cell surface receptor as the “loading dock” that is not down-regulated after binding to the antibody. Tang et al identified CD45 acting as the stable, non-internalizing “loading dock” for nanogels [39]. After binding to the anti-CD45 antibody, CD45 remains to have close to 100% surface expression level for more than 60 hours. Once nanogels reach the surface of activated CD8+ T cells, the cytokine is released due to higher cell surface reduction potential.

Compared with free cytokines, nanogels delivery is able to selectively expanded T cells 16-fold in tumors. This also allows much higher doses of cytokine. In animal studies, ALT-803 nanogels are used to substantially enhance tumor eradication by mouse T cells or human CAR-T cells [39].

2.5 IFNα

Interferons (IFNs) play important roles in immune defense against cancer cells and intracellular pathogens. Based on their corresponding receptors, IFNs are categorized into 3 types: types I, II, and III. IFN-α belongs to type I IFN, which are generally expressed by all kinds of cells in response to viral infection. By promoting apoptosis in the infected cell, IFN-α interferes with viral replication. IFN-α also activates macrophages and NK cells.

IFN-α has been clinically used to treat a variety of malignancies, including indolent B cell lymphoma and hairy-cell leukemia, chronic myelogenous leukemia (CML), renal cell carcinoma (RCC), and melanoma.

In advanced RCC, IFN-α is approved for combination treatment with bevacizumab based on the results of the CALGB and AVOREN trials. In the CALGB trial, compared with IFN-α monotherapy, the addition of bevacizumab to IFN-α led to an improved ORR (25.5% vs. 13.1%, P < 0.0001) and a significant 3 month benefit in PFS (8.5 months vs. 5.2 months, P < 0.0001). However, overall survival (OS) did not significantly differ between the 2 groups (18.3 months vs. 17.4 months, unstratified log-rank, P = 0.097). In the AVOREN trial, median PFS was also significantly improved in the bevacizumab plus IFN-α arm at 10.2 months compared with 5.4 months in the IFN-α monotherapy group. Again, the final median OS was only marginally improved in combination arm (23.3 months vs. 21.3 months, HR = 0.91; 95% CI, 0.76–1.10, P = 0.34) [40].

The practical use of IFN-α in RCC management is limited, partially due to the frequency of IFN-α administration and the side effects of the treatment. IFN-α is administrated subcutaneously 3 times a week for 52 weeks. In the combination treatment group of the CALGB trial, 64% of patients need to reduce the dose due to intolerability, and 80% had severe toxicity (grade ≥3), including hypertension, anorexia, fatigue, and proteinuria. The majority of the patients (56%) discontinued for disease progression.

IFN-α is much less used now after anti-angiogenic tyrosine kinase inhibitors are approved for RCC. As a first line treatment of metastatic clear cell RCC, IFN-α is less effective than sunitinib, with much lower ORR (12% vs. 47%), mPSF (5.0 months vs. 11.0 months), and mOS (21.8 months vs. 26.4 months [41]. However, Naito et al reported that analysis of real world data suggested that IFN-α might have a better outcome in Japanese metastatic clear cell RCC patients than in the western patients [42].

In melanoma, IFN-α was used for more than a decade in the adjuvant setting, until the arrival of immune checkpoint inhibitors for adjuvant treatment of high-risk resected melanoma.

2.6 Interferon γ (IFN- γ)

IFN-γ, which is the only member in the type-II interferon family, is a dimerized soluble cytokine that is dominantly produced by natural killer (NK) cells, natural killer T (NKT) cells, CD4 helper T cells, and CD8 cytotoxic T cells. As an immune cytokine, IFN-γ’s function is not limited to promoting T cells / NK cells to migrate into the tumor tissue. It can also directly binds to its receptor on tumor cells and upregulates MHC class I antigen presentation. This enhances tumor recognition by cytotoxic lymphocytes, favoring tumor rejection.

In addition, IFN-γ also inhibits tumor angiogenesis by inducing the production of chemokines, such as MIG (CXCL9, a small cytokine belonging to the CXC chemokine family) and IP10 (CXCL10), through both direct mechanisms by reducing endothelial cell adhesion and indirect mechanisms by inducing the production of antiangiogenic molecules.

After dimerized IFN-γ binds to its receptor, which is composed of IFN-γ receptor 1 (IFNGR1) and IFN-γ receptor 2 (IFNGR2), it induces trans-phosphorylation and activation of JAK1 and JAK2. Activated JAK1/2 leads to the phosphorylation of IFN-γ receptor, providing STAT docking sites through the SH2 domain and to recruit STATs to the JAK- IFN-γ receptor complex. After recruited to the receptor complex, STATs become activated and form dimers, followed by translocation to the nucleus to promote the expression of target genes involved in cell proliferation, differentiation, and inflammation.

Because IFN-γ plays an important role in innate and adaptive immunity, loss of tumor sensitivity to IFN-γ will offer a mechanism for tumor cells to escape immune surveillance and to metastasize. This occurs when there is a defect in IFN-γ receptor or other molecules of the downstream signaling pathways, such as Jak1 and Jak2. A complete loss of tumor sensitivity to IFN-γR has been reported for human melanomas and lung adenocarcinomas, including the loss of IFN-γRα expression, loss of Jak1, and expression of an abnormally phosphorylated Jak2 enzyme [43]. Defects in IFN-γ signaling pathways also contribute to the resistance to immune checkpoint inhibitors in melanoma patients [44]. High expression of IFN-γ in melanoma patients is associated with longer overall survival after treatment with immune checkpoint inhibitor pembrolizumab [45].

Nevertheless, IFN-γ signaling can also pose a negative effect on cancer therapy. There are reports that IFN-γ down-regulates tumor antigen expression and promotes the emergence of tumor antigen-loss variants that leads to disease progression. A melanoma patient vaccinated with a gp100- derived class I peptide together with IFN-γ developed a metastatic lesion that was associated with a selective loss of gp100 expression after an initial response. This suggests that selective pressure facilitated the emergence of antigen-negative tumors.

IFN-γ is clinically used as an antiviral agent to treat infections. However, some patients under IFN-γ treatment are also cancer patients and thus provide insights on IFN-γ effects on cancers. Buddingh et al. reported a case of IFN-γ treatment of a 3-year old Acute Lymphoblastic Leukemia (ALL) patient [46]. In this case, IFN-γ was intended to restore immune function to treat severe systemic Candida dubliniensis infection due to chemotherapy-induced immunoparalysis. After the patient’s clinical condition was improved, imaging and abdominal ultrasound examination revealed that the patient was in remission, with complete resolution of brain lesions and greatly diminished kidney, liver and spleen lesions.

During the course of IFN-γ treatment, the percentage of HLA-DR-positive monocytes increased from almost 2% to 50%. The HLA-DR ratio is a good indication for innate immunity. Since this ALL patient had been treated with both chemotherapy and antifungal agents, IFN-γ was not the only reason for the complete control of fungal infection and long lasting remission. However, the contribution of IFN-γ to the normalization of immunity needs to be noted and worth further investigation.

AbZed

We have reported that IFN-γ is effective to enhance HER2-targeted antibody therapy. The anti-oncogenic HER2 (also know as p185erbB2/neu) antibody 7.16.4, when given at a sub-optimal dose of 1.5 mg/kg (1/3 of the normal dose), was unable to significantly inhibit the growth of the H2N113 tumor in syngeneic MMTV-neu transgenic mice. IFN-γ treatment alone also failed to cause significant inhibition of the growth of the tumor. However, the combination of low dose 7.16.4 and IFN-γ completely arrested the growth of H2N113 tumors [47].

A further step was taken to establish a fusion protein HER2 AbZed, which contains a scFv to bind to HER2, an Engineered Effector Domain (EED) to bind to the Fc region of IgG, and IFN-γ in a single fusion protein. Treatment with this engineered fusion protein is even more potent than the anti-HER2 antibody alone or simply combining scFv-ZZ and IFN-γ in terms of inhibiting tumor growth [48]. The new fusion protein demonstrates superior activity over the anti-HER2 antibody on tumors that are resistant to trastuzumab. Examination of tumor infiltrating macrophages and lymphocytes reveals that the fusion protein induces change in tumor microenvironments [48]. The EED domain is originally derived from the bacterial protein A but can be further humanized for therapeutic use.

3. Conclusion

Although some immune cytokines have been approved for the treatment of certain types of cancers, the clinical use is limited. PEGylation is able to extend the in vivo half-life of cytokines, but it remains unclear if such a modification can dramatically enhance the clinical utilities. While combination use of cytokines with other immunotherapeutic regimens appears to be the future, the systemic toxicity is one major limitation. This may be circumvented by recombinantly connecting a cytokine to target therapeutic agents, thus the cytokines can be selectively accumulated around tumor. It is hoped that by innovative engineering, immune cytokines may play a major role in immunotherapy against cancer.

Acknowledgement

We acknowledge grant supports from the Breast Cancer Research Foundation and the National Institutes of Health to M.I.G. (R01 CA219034). We thank Isabel Liang for her comments on the manuscript.

CST 2019-112 - Zhang USA_F1

Figure 1. Interactions of cytokines and immune cells. Immunostimulatory cytokines produced by immune cells (solid arrows) are investigated as immunotherapies against tumors, by acting on different types of immune cells (dashed arrows).

References

  1. Gaffen SL, KD Liu, et al. (2004) Overview of interleukin-2 function, production and clinical applications. Cytokine 28: 109–23.
  2. Lotze MT, et al. (1985) In vivo administration of purified human interleukin 2. I. Half-life and immunologic effects of the Jurkat cell line-derived interleukin 2. J Immunol 134: 157–166.
  3. Rosenberg SA, et al. (1985) Observations on the systemic administration of autologous lymphokine-activated killer cells and recombinant interleukin-2 to patients with metastatic cancer. N Engl J Med 313: 1485–1492.
  4. Rosenberg SA, et al. (2014) IL-2: the first effective immunotherapy for human cancer. J Immunol 192: 5451–5458. [crossref]
  5. Burchill MA, Yang J, Vang KB, Farrar MA (2007) Interleukin-2 receptor signaling in regulatory T cell development and homeostasis. Immunol Lett 114: 1–8. [crossref]
  6. Charych, D, et al. (2017) Modeling the receptor pharmacology, pharmacokinetics, and pharmacodynamics of NKTR-214, a kinetically-controlled interleukin-2 (IL2) receptor agonist for cancer immunotherapy. PloS one 12: 0179431–0179431.
  7. Charych DH, et al. (2016) NKTR-214, an Engineered Cytokine with Biased IL2 Receptor Binding, Increased Tumor Exposure, and Marked Efficacy in Mouse Tumor Models. Clin Cancer Res 22: 680–690.
  8. Li Y, Strick-Marchand H, Lim AI, et al. (2017) Regulatory T cells control toxicity in a humanized model of IL-2 therapy. Nat Commun 8: 1762. [crossref]
  9. Lin F, Luo X, Tsun A, Li Z, Li D, et al. (2015) Kaempferol enhances the suppressive function of Treg cells by inhibiting FOXP3 phosphorylation. Int Immunopharmacol 28: 859–865. [crossref]
  10. Li Z, et al. (2014) PIM1 kinase phosphorylates the human transcription factor FOXP3 at serine 422 to negatively regulate its activity under inflammation. J Biol Chem 289: 26872–26881.
  11. Diab A, et al. (2018) NKTR-214 (CD122-biased agonist) plus nivolumab in patients with advanced solid tumors: Preliminary phase 1/2 results of PIVOT. J Clin Oncol 36(suppl; abstr 3006).
  12. Silva DA, Yu S, Ulge UY, et al. (2019) De novo design of potent and selective mimics of IL-2 and IL-15. Nature 565: 186–191. [crossref]
  13. Waldhauer I, et al. (2013) Novel Tumor-Targeted, Engineered IL-2 Variant (IL2v)-Based Immunocytokines For Immunotherapy Of Cancer. Blood 122: 2278.
  14. Lamichhane P, et al. (2017) IL10 Release upon PD-1 Blockade Sustains Immunosuppression in Ovarian Cancer. Cancer Res 77: 6667–6678.
  15. Emmerich J, et al. (2012) IL-10 directly activates and expands tumor-resident CD8(+) T cells without de novo infiltration from secondary lymphoid organs. Cancer Res 72: 3570–3581.
  16. Mumm JB, et al. (2011) IL-10 elicits IFNgamma-dependent tumor immune surveillance. Cancer Cell 20: 781–796.
  17. Naing A, Papadopoulos KP, Autio KA, Ott PA, Patel MR, et al. (2016) Safety, Antitumor Activity, and Immune Activation of Pegylated Recombinant Human Interleukin-10 (AM0010) in Patients With Advanced Solid Tumors. J Clin Oncol 34: 3562–3569. [crossref]
  18. Naing A, et al. (2018) PEGylated IL-10 (Pegilodecakin) Induces Systemic Immune Activation, CD8(+) T Cell Invigoration and Polyclonal T Cell Expansion in Cancer Patients. Cancer Cell 34: 775–791.
  19. Vignali DA, Kuchroo VK (2012) IL-12 family cytokines: immunological playmakers. Nat Immunol 13: 722–728. [crossref]
  20. Brunda MJ, Luistro L, Warrier RR, Wright RB, Hubbard BR, et al. (1993) Antitumor and antimetastatic activity of interleukin 12 against murine tumors. J Exp Med 178: 1223–1230. [crossref]
  21. Brunda MJ, et al. (1995) Role of interferon-gamma in mediating the antitumor efficacy of interleukin-12. J Immunother Emphasis Tumor Immunol 17: 71–77.
  22. Garris CS, et al. (2018) Successful Anti-PD-1 Cancer Immunotherapy Requires T Cell-Dendritic Cell Crosstalk Involving the Cytokines IFN-gamma and IL-12. Immunity 49: 1148–1161.
  23. Rook AH, et al. (1999) Interleukin-12 therapy of cutaneous T-cell lymphoma induces lesion regression and cytotoxic T-cell responses. Blood 94: 902–908.
  24. Younes A, Pro B, Robertson MJ, Flinn IW, Romaguera JE, et al. (2004) Phase II clinical trial of interleukin-12 in patients with relapsed and refractory non-Hodgkin’s lymphoma and Hodgkin’s disease. Clin Cancer Res 10: 5432–5438. [crossref]
  25. Ansell SM, Witzig TE, Kurtin PJ, Sloan JA, Jelinek DF, et al. (2002) Phase 1 study of interleukin-12 in combination with rituximab in patients with B-cell non-Hodgkin lymphoma. Blood 99: 67–74. [crossref]
  26. Little RF, et al. (2006) Activity of subcutaneous interleukin-12 in AIDS-related Kaposi sarcoma. Blood 107: 4650–4657.
  27. Little RF, et al. (2007) Phase 2 study of pegylated liposomal doxorubicin in combination with interleukin-12 for AIDS-related Kaposi sarcoma. Blood 110: 4165–4171.
  28. Rudman SM, et al. (2011) A phase 1 study of AS1409, a novel antibody-cytokine fusion protein, in patients with malignant melanoma or renal cell carcinoma. Clin Cancer Res 17: 1998–2005.
  29. Fallon J, Tighe R, Kradjian G, Guzman W, Bernhardt A, et al. (2014) The immunocytokine NHS-IL12 as a potential cancer therapeutic. Oncotarget 5: 1869–1884. [crossref]
  30. Paoloni M (2015) Defining the Pharmacodynamic Profile and Therapeutic Index of NHS-IL12 Immunocytokine in Dogs with Malignant Melanoma. PLoS One 10: 0129954.
  31. Eckert F (2016) Enhanced binding of necrosis-targeting immunocytokine NHS-IL12 after local tumour irradiation in murine xenograft models. Cancer Immunol Immunother 65: 1003–1013.
  32. Xu C, et al. (2017) Combination Therapy with NHS-muIL12 and Avelumab (anti-PD-L1) Enhances Antitumor Efficacy in Preclinical Cancer Models. Clin Cancer Res 23: 5869–5880.
  33. Koneru M, et al. (2015) A phase I clinical trial of adoptive T cell therapy using IL-12 secreting MUC-16(ecto) directed chimeric antigen receptors for recurrent ovarian cancer. J Transl Med 13: 102.
  34. Conlon KC, et al. (2015) Redistribution, hyperproliferation, activation of natural killer cells and CD8 T cells, and cytokine production during first-in-human clinical trial of recombinant human interleukin-15 in patients with cancer. J Clin Oncol 33: 74–82.
  35. Miller JS, et al. (2018) A First-in-Human Phase I Study of Subcutaneous Outpatient Recombinant Human IL15 (rhIL15) in Adults with Advanced Solid Tumors. Clin Cancer Res 24: 1525–1535.
  36. Mortier E, et al. (2006) Soluble interleukin-15 receptor alpha (IL-15R alpha)-sushi as a selective and potent agonist of IL-15 action through IL-15R beta/gamma. Hyperagonist IL-15 x IL-15R alpha fusion proteins. J Biol Chem 281: 1612–1619.
  37. Rhode PR, et al. (2016) Comparison of the Superagonist Complex, ALT-803, to IL15 as Cancer Immunotherapeutics in Animal Models. Cancer Immunol Res 4: 49–60.
  38. Romee R, et al. (2018) First-in-human phase 1 clinical study of the IL-15 superagonist complex ALT-803 to treat relapse after transplantation. Blood 131: 2515–2527.
  39. Tang L, Zheng Y, et al. (2018) Enhancing T cell therapy through TCR-signaling-responsive nanoparticle drug delivery. Nat Biotechnol 36: 707–716. [crossref]
  40. Harshman, LC, S Srinivas (2010) The bevacizumab experience in advanced renal cell carcinoma. OncoTargets and therapy 3: 179–189.
  41. Motzer RJ, et al. (2009) Overall survival and updated results for sunitinib compared with interferon alfa in patients with metastatic renal cell carcinoma. J Clin Oncol 27: 3584–3590.
  42. Naito S, et al. (2010) Prognosis of Japanese metastatic renal cell carcinoma patients in the cytokine era: a cooperative group report of 1463 patients. Eur Urol 57: 317–325.
  43. Kaplan DH, et al. (1998) Demonstration of an interferon gamma-dependent tumor surveillance system in immunocompetent mice. Proceedings of the National Academy of Sciences of the United States of America 95: 7556–7561.
  44. Hugo W, Zaretsky JM, Sun L, Song C, Moreno BH, et al. (2017) Genomic and Transcriptomic Features of Response to Anti-PD-1 Therapy in Metastatic Melanoma. Cell 168: 542. [crossref]
  45. Karachaliou N, et al. (2018) Interferon gamma, an important marker of response to immune checkpoint blockade in non-small cell lung cancer and melanoma patients. Ther Adv Med Oncol 10: 1758834017749748.
  46. Buddingh EP, et al. (2015) Interferon-gamma Immunotherapy in a Patient With Refractory Disseminated Candidiasis. Pediatr Infect Dis J 34: 1391–1394.
  47. Nagai Y, et al. (2015) Disabling of the erbB Pathway Followed by IFN-gamma Modifies Phenotype and Enhances Genotoxic Eradication of Breast Tumors. Cell Rep 12: 2049–2059.
  48. Zhang H, et al. (2017) A targeted immunotherapy approach for HER2/neu transformed tumors by coupling an engineered effector domain with interferon-?. OncoImmunology, (just-accepted): p. 00–00.

Comparison of Some Conventional and Photocatalytic Treatment Process Cost: Toxicity Analysis to Some Nanoparticles

DOI: 10.31038/ESCC.2019111

Abstract

Nano-metal oxides (NMOs) offer significant improvement in the treatment of hazardous, toxic and non-biodegradable contaminants to enhance their biodegradability. Some of these metal oxides was separated with recovery process. Metal oxide nanoparticles are among the most used engineered nanoparticles (NPs) in various treatment plants in recent years since nanoparticles offer significant improvement with their extremely high specific surface area and associated sorption sites, short intraparticle diffusion distance, and tunable pore size and surface chemistry. Although some acute toxicities was detected in the performed ecotoxicological for NMOs studied below the NMOs should be used to treat the recalcitrant, non-biodegradable pollutants since their cost are lower. The acute toxicity tests should be monitored regularly to prevent the ecosystem since the cost spent for toxicity analysis is very low and their harmful effects remain largely unknown. The first aim of this study is to determine the cost of the removals of some pollutants in the petrochemical wastewater by using advanced treatment processes containing some nano composites. The treatment efficiencies of the processes namely membrane diatilation (MD), reverse osmosis (RO), membrane filtration (MF), ultrafiltration (UF), nanofiltration (NF) were calculated and compared. On the other hand, the toxicity of NMOs of ZnO, Co3O4, ZrO2, Bi2O3 and ATO (Antimony oxide) to Vibrio fischeri, crustaceans (Daphnia magna) and fish (Poecillia reticula – lepistes) were investigated. In the ecotoxicological tests; the EC50 values was calculated from the inhibitions of NMOs used at increasing concentrations (0.1 – 14 mg/l) for 24 and 48 hours. The bioaccumulation the NMOs given above were performed. It was found that the most sensitive organism was Vibrio fischeri – bacteria while the most resistant organism was fish – Poecillia reticula – lepistes. The most toxic NMO were Co3O4 with low EC5O values (1.5 mg/L, while the less toxic NMO was ATO with high EC30 values (12.5 mg/l). Furthermore, the cost of the toxicity test analysis were compared. Although some acute toxicities was detected in the performed ecotoxicological tests advanced treatment plants containing the NMOs below the toxicity values did not cause acute toxicity

Keywords

Acute Toxicity, Bioaccumulation, Cost, Daphnia Magna, Nanometal Oxides, Vibrio Fischeri, Wastewater Treatment

1. Introduction

Among the various emerging technologies, the advancement in nanotechnology has proved an incredible potential for the remediation of wastewater and various other environmental problems [1]. NMOs have extremely high specific surface area and associated sorption sites, and surface chemistry. They can be recovered and they can be reused, and relatively have low energy demand. Therefore, they are used in the pretreatment or treatment of refractory substances via photocatalysts. The low cost increased the extensively usage of NMOs. This means that an increasing number of NMOs will be released to the aquatic environment through production processes. Although some authors have published in the literature on the fate, and toxicological information of NMOs and proposed research strategies for evaluation of safety of NMOs, their release into the aquatic environment is continuous and their harmful effects on organisms is expected. Ecotoxicology is the studies to determine the effects of toxic chemicals on biological organisms. In both developing and industrialized countries, a growing number of contaminants like micropollutants, pharmaceuticals, PCB, and PAHs are entering to the water bodies. The biological wastewater treatment is widely applied but these are usually slow, limited due to the presence of non-biodegradable contaminant, and sometimes causes toxicity to microorganisms due to some toxic contaminants [2]. With conventional treatment processes (sequential anaerobic and aerobic treatments and SBR) are not enough to treat the chemicals aforementioned and reach to the discharge standard by regulations and by the authorities. Therefore, there is a real requirement for more efficient, cheaper and powerful technologies for treatment of industrial wastewaters [3]. Nanotechnology-enabled water and wastewater treatment promises to not only overcome major challenges faced by existing treatment technologies, but also to provide new treatment capabilities that could allow economic utilization of unconventional water sources to expand the water supply. Efficiency of conventional adsorbents is usually limited by the surface area or active sites, the lack of selectivity, and the adsorption kinetics. Nano-adsorbents offer significant improvement with their extremely high specific surface area and associated sorption sites, short intraparticle diffusion distance, and tunable pore size and surface chemistry. It is a useful pretreatment for hazardous and non-biodegradable contaminants to enhance their biodegradability. Photocatalysis can also be used as a polishing step to treat recalcitrant organic compounds. Although there are already some studies on potential hazard of manufactured NPs, their release into the aquatic environment and their harmful effects remain largely unknown.

In this study it was aimed to determine the removal efficiencies and the cost of the some advanced treatment plants (membrane diatilation (MD), reverse osmosis (RO), membrane filtration (MF), ultrafiltration (UF),nanofiltration (NF)) for treating the pollutants from a petrochemical industry wastewater by the utilization of some nano-metal oxides. Therefore, the ecotoxicity of NMOs (nano-ZnO, nano-Co2O3, nano-Bi2O3, nano- ZrO2 and nano-ATO) to bioluminescence bacteria – Vibrio fischeri, anaerobic methane Archaea bacteria and water flea – Daphnia magna were studied. Among the inhibitions plots the EC50 values (NMOs concentration inhibiting 50 % of the organisms) of NMOs were calculated. Their bioaccumulation tests were determined in an aquatic environment during 28 days based on the soluble COD concentrations.

1.1 Theoretical Background

The properties of advanced processes used in this study were summarized below:

Membrane distillation (MD) is a thermally driven separational program in which separation is enabled due to phase change. A hydrophobic membrane displays a barrier for the liquid phase, allowing the vapour phase (e.g. water vapour) to pass through the membrane’s pores. Capillary polypropylene membranes (Accurel PP S6/2, Membrane GmbH, Germany), with the outside/inside diameter dout/din = 2.6 mm/1.8 mm containing 0, 2 mg/l nano ZnO. The capillary membranes have the pore size with the maximum and nominal diameter of 0.55 and 0.22 μm, respectively, and the porosity of 72%. The membranes were arranged as a parallel bundle of braided capillaries (three membranes in the braid). The total active surface area of membranes (A) for the mass transfer was calculated for the internal capillary diameter and amounted to 0.0889 m2. The values of the permeate flux were calculated from the equation J = 3,5 L/m2 .h :A hollow fiber PVC with UF membrane module with a nominal pore size of 0.01 μm and a total membrane area of 0.4 m2 was employed in the sMBR. Reverse osmosis (RO) is a water purification technology that uses a partially permeable membrane to remove ions, molecules and larger particles from drinking water. In reverse osmosis, an applied pressure is used to overcome osmotic pressure, a colligative property, that is driven by chemical potential differences of the solvent, a thermodynamic parameter. Reverse osmosis can remove many types of dissolved and suspended chemical species as well as biological ones (principally bacteria) from water, and is used in both industrial processes and the production of potable water. The result is that the solute is retained on the pressurized side of the membrane and the pure solvent is allowed to pass to the other side. To be “selective”, this membrane should not allow large molecules or ions through the pores (holes), but should allow smaller components of the solution (such as solvent molecules, i.e., water, H2O) to pass freely. Nanofiltration (NF) is a relatively recent membrane filtration process used most often with low total dissolved solids water such as surface water and fresh groundwater, with the purpose of softening (polyvalent cation removal) and removal of disinfection by-product precursors such as natural organic matter and synthetic organic matter. Forward osmosis (FO) is an osmotic process that, like reverse osmosis (RO), uses a semi-permeable membrane to effect separation of water from dissolved solutes. The driving force for this separation is an osmotic pressure gradient, such that a “draw” solution of high concentration (relative to that of the feed solution), is used to induce a net flow of water through the membrane into the draw solution, thus effectively separating the feed water from its solutes. In contrast, the reverse osmosis process uses hydraulic pressure as the driving force for separation, which serves to counteract the osmotic pressure gradient that would otherwise favor water flux from the permeate to the feed. Hence significantly more energy is required for reverse osmosis compared to forward osmosis.

1.2 Cost Analysis for the Novel Treatment Processes

In every treatment process the total treatment cost was defined based on the total expenses spent to treat 1 m3 wastewater. The total cost is the sum of the all normalized investment cost, the energy cost(natural gas, methane gas, electricity, thermal and steam costs) used during treatment processes, membrane charges during filer changing , personal and chemical costs, pumps and mechanic stirring device costs , bakıve onarımcosts (Tables 1, 2). For MD membran process flowrate: 30,000 m3/day, the ratio of permeat velocity to the food velocity 95%; yearly productiob capacity=: 30.000 m3/day x 365 day/year x 0.95 = 104.045.000 m3/year; First investment-capital cost: It can be calculated by the assumption of the capacity factor. The cost of a new MD process can be calculated with a similar known MD process cost and capacity. In order to calculate the normalized first investment cost.

The first normalized capital cost to treat the 1 m3 wastewater Equation (1) was used

The known capital of the old MD Process / the first capital cost of the second MD

= (MD-1 capacity/MD-2 capacity)m (Equation 1);

m is the capacity factor, and indicated the slope of the log curve in MD process for mall or big membrane process. The capacityfactor in MD system was accepted as 0.6 olarak alınır (Bick et al, 2012). The first investment cost (Euro/(m3/day ) for a flowrate of 30.000 m3/day was calculated as 850 Euro/m3.day (Bicket al, , 2012).

[(850 Euro/m3.day) × (30.000 m3/day)] × [(30.000 m3/day /29.000 m3/DAY)]0.6 = 27,270.596 Euro,

Capital recovery factor (CRF); cost reduction rate (r), and the sum of the cost payment numbers in the years in the future was (n)’ dir. r and n was taken as 7% and 10, respectively.

CRF is equal to r(1 + r)n/(1 + r n)–1 = [0.07 [ (1 + 0.07) 10/(1 + 0.07 10) –1]= 0,02 ( Equation 2) (Kesime et al., 2012)

normalized first investment cost is equal to : CRF × [ first investment cost (euro/year)/membran capacity (m3/yEAR) ]

The normalized first investment cost= 0,02 × [27,270,596 Euro/(104,045,000 m3/yıl)]= 0.005 Euro/m3 Electrical cost: Energy cost (Euro/m3) = Energy cost (Euro/kWh) x specific energy consumption (kWh/m3).

This specific energy comcumption for electricity was taken as 0,5 kWh/m3 (Kesime ve diğerl, 2012).

The specific energy consumption for natural – methane gas utilization was taken as 0.4 kWh/m3 (2, 33). 1 kWh electricity cost is =23 krş = 0,23 TL = 0.07 Euro, 1 Euro=3.1 TL alınmıştır.

Electricity requirement is equal to 0,07 Euro/kWh × 0,5 kWh/m3 = 0,035 Euro/m3

The cost of 1 kwh of natural gas is 0,08 TL = 0,02 Euro.

Natural gas requirement for methane gas is equal to 0.02 Euro/kwh x 0,4 kwh/m3 = 0.008 Euro/m3, Steam and thermal energy requirement for MD; 0,001 m3 STEAM energy is equal to 0,072 m3 methane gas

Steam energy cost = 0.0024 Euro/kwh (9). Specific energy consumption for steam energy = 100 kwh/m3,

Steam enegy expense (Euro/m3) = Energy cost (Euro/kWh) × specific energy consumption (kWh/m3);

Steam expense is accepted as 10% of the thermal energy; the steam energy expenses is = 0,0024 Euro/kwh × 100 kwh/m3 × 10/100 = 0,024 Euro/m3; Membrane changing cost: Membrane upflow rate = 6 kg/m2/h, membran cost 1,5 Euro/m2, membrane alteration cost is 20% , membran replacement rate = one in a year.

Membrane cost (Euro/m3) = [membrane price(euro/m2) × membrane changing rate (1/y)] × [ (1000 (l/m3) ]/[(membran akısı (6 kg/m2 × h) × 8760 h/yıl)] = 1,5 Euro/m2 × 0,20 × [(1000 l/m3)/(6 × 8760)], = Membran replacement expense= 0,005 Euro/m3,

Membran maintenance cost is calculated as 2% of the normalized investment cost of the mambran:. Membrane maintenance expense = 0,005 Euro/m3 × 0,02 = 1 × 10⁻⁴ Euro/m3

Personal cost (Euro/m3) = personal expense (TL-/day)/wastewater flow rate (m3/day), Personel cost: 30 days 2000 TL ( with assurance) person/month= 66 TL person/day = 21,3 Euro/day, Personal cost= 0.0007 Euro/m3; emission cost= Carbon cost= (Euro/m3) = Energy requirement (kwh/m3) x Emission factor (kg CO2-e/kwh) x carbon tax (Euro/ton CO2-e)X 1/1000 (ton/kg); for 1 ton carbon the tax is accepted as 17 Euro/ton. Emission factor for electricity= 1.22 kg CO2-e/kwh; Emission factor for methane gas is 18,4 kg CO2-e/kwh; Energy for electricity requirement is 0,5 kWh/m3 (2, 33).

Energy requirement for natural gas is accepted as 0,4 kWh/m3 (2, 33);

Carbon emission cost for electricity = 0,5 × 1,22 × 17/1000= 1,25 × 10⁻³ Euro/m3; Carbon emission cost for natural gas= 0,4 × 0,184 × 17/1000 = 7,36 × 10⁻⁵ Euro/m3; Cost for chemicals ( = H2SO4 1 L = = 10 Euro/L, NaOH 1 L= 9,67 Euro, For 30.000 m3/day flowrate 0,5 N’ lik 20 ml H2SO4 consumption= 2 × 10⁻⁴ Euro/m3; For 30.000 m3/gün flowrate 0.5 N 20 ml naoh consumption = 1,67 × 10⁻⁴ Euro/m3, cost for chemicals = 3,67 × 10⁻⁴ Euro/m3; Cost for pressured and vakuum pumps (4) = 225 Euro; Dört Investment cost of four pumps: Euro/(m3/day) is taken as 225 Euro/year. In recovery factor (KGF); Price reduction rate ® in recovery factor (KGF-RF), and the sum of the expensess will be paid ın the nex years is (n). (r = %3, n = 3 ). In the determination of Pump cost; recycling factor for pump ( RF = 0,02) normalized investment cost was calculated according to equation 3

RF × ( investment cost (Euro/year)/ pump capacity(m3/year) ( Eq… 3)

Pump capacity 30.000 m3/day × 365 day/year = 10,950,000 m3/year;

Normalized investment cost of pump is = 0,02 × [225 Euro/(10,950,000 m3/year)]= 4 × 10⁻⁴ Euro/m3

The cost for all membran processes are güven based on unit m2. With the same way the total cost for all treatment processes were calculated. The cost were 1,5 , 0,90 , 1,4, 1,40, 1,42 , 1,49 and 0,0045 Euro per m2 membran area for the processes MD, UF, RO, NF,DCMD, PRO and for FO forward osmosis. MD için 1,5 Euro/m2; batık fiber delikli UF = 0,90 Euro/m2, RO = 1,4 Euro/m2; UF için 1,40 Euro/m2; NF için 1,42 Euro/m2, DCMD için 1,49 Euro/m2, PRO için 0,045 Euro/m2, and for forwarded osmosis is 0,28 Euro/m2.

Table 1. The results of toxicity tests performed by NMOs

Daphnia magna

ATA

Vibrio fischeri

Bioaccumulation

24 h (mg/l)

48 h (mg/l)

24 h (mg/l)

48 h (mg/l)

30 min (mg/l)

10 mg/l COD

100 mg/l COD

1000 mg/l COD

ZnO

EC30=7,2

EC50=6,2

EC50=5,1

EC50=2,9

EC50=7,1

BCF 2

BCF 15

BCF 250

Co3O4

EC50=8,7

EC50=5,2

EC50=6,8

EC50=1,5

EC50=8,1

BCF 5

BCF 20

BCF 400

ZrO2

EC50=7,1

EC50=5,1

EC50=8

EC50=7,9

EC50=6,1

BCF 8

BCF 38

BCF 450

Bi2O3

EC50=5,1

EC50=4,2

EC50=4,9

EC50=2,9

EC50=9,9

BCF 9

BCF 45

BCF 460

ATO

EC50=7,9

EC50=6,2

EC50=6,9

EC50=4,9

EC30=12,5

BCF 4

BCF 23

BCF 300

Table 2. Cost analysis for Ecotoxicity Tests

Cost for ecotoxicity test : Daphnia magna : 20 tests in year: 1,2 euro

Cost for ecotoxicity test : Vibrio fischeri 20 test in year : 2.8 Euro

Cost for ecotoxicity test : Anaerobic bacteria 20 test in year  : 0.9 euro

Cost for Bioaccumulation : 2.9 euro

Total : 9.7 euro per year for 20 test

2. Material and Methods

2.1 Analytical Procedures

2.1.1 Vibrio fischeri Acute Toxicity Test:

Bioluminescent tests were performed under a NaCl concentration of 2% at 18⁰C (with incubation block) according to ISO/EN/DIN 11348 with Vibrio fischeri. The effective concentration, EC50, is defined as the NMO concentration decreasing the 50% of the light emitted by the Vibrio fischeri.

2.1.2 Anaerobic Toxicity Test – ATA

Anaerobic Toxicity Assay (ATA) measures the adverse effect of NMOs on the rate of the methane gas production (Owen et al, 1979). ATA were performed at 35ºC at volume of 150 ml amber bottle reactors. Anaerobic sludge used for this test providing 3000 mg/l anaerobic VSS (volatile suspended solids).

2.1.3 Daphnia magna Acute Toxicity Test

Acute toxicity assays with D. magna were conducted following OECD 202 (2004). Different nano material concentrations and 10 neonates (24 h old) D. magna were exposed to each NMOs. Median (50%) effective concentration levels (EC50) was calculated from percentage of inhibition graphics for each NMOs.

2.1.4 Bioaccumulation (BCF) Test

The bioaccumulation of NMOs was evaluated according to OECD 305 (1996).

For bioaccumulating substances, it can be expected that a time-weighted average (TWA) is the most relevant exposure concentration in water (Cw) within the allowed range of fluctuation . It is recommended to calculate a TWA water concentration, it should be noted that the transformation of the water concentration is suitable when exponential decay between renewal periods is expected, e.g. in a semi-static test design. In a flow through system,transformation of exposure concentrations may not be needed. If TWA water concentrations are derived, they should be reported and used in subsequent calculations.

In a standard fish BCF test uptake and depuration can be described in terms of two first order kinetic processes.

Rate of uptake = k1 × Cw (Eq.1)

Overall loss rate = (k2 +kg +km +ke) × Cf (Eq.2)

k1= First order rate constant for uptake into fish (L·kg-1·day-1).

k2 = First order rate constant for depuration from fish (day-1).

kg = First order rate constant for fish growth (‘growth dilution’) (day-1)

km = First order rate constant for metabolic transformation (day-1)

ke = First order rate constant for faecal egestion (day-1)

Cw = Concentration in water (mg·L-1).

The test consists of two phases: the exposure (uptake) and post-exposure (depuration) phases. k1 is the uptake rate constant (day-1) (Eq. 1). Cw is the NMOs concentration in the water (mg/l), k2 is the depuration constant (day-1) (Eq. 2) and Cf is the NMOs concentration in the fish.

At steady-state, assuming growth and metabolism are negligible (i.e. the values for kg and km cannot be distinguished from zero), the rate of uptake equals the rate of depuration. BCF is the bioaccumulation Factor and it was calculated by k1/k2 in Equation 3 (Eq. 3).

The ratio of k1/k2 is known as the kinetic BCF (BCFK) and should be equal to the steady-state BCF (BCFSS) obtained from the ratio of the steady-state concentration in fish to that in water, but deviation may occur if steady-state was uncertain or if corrections for growth have been applied to the kinetic BCF. However, as k1 and k2 are constants, steady-state does not need to be reached to derive a BCFK.

BCF =  k1 / k2 (Eq. 3)

ESCC 2019-101 - Delia Teresa SPONZA Turkey_F1 (Eq. 4)

ESCC 2019-101 - Delia Teresa SPONZA Turkey_F2 (Eq. 5)

2.1.5 Operational Conditions for the Membrane Processes

RO

A Hidrotek RO membrane consisting of ESPA2 LD and 0,4 mg/m2 nano ZnO with a surface area of 24 m2 at 21 bar Maximum pressure with a1,2 ml / min feed flow rate at 26°C at a pH =8 in continous mode(continuous operation) at a recovery of 85% was used.

MD

Js, the transmembrane flux is 0,7 kg m−2s−1), the lowest membrane pore is 0.0082, the porosity was 80–87%,feed flow rate 0,056 L/sec, the membrane material consist from PVDF with a paralel modül and contained 0,03mg/m2 Co2O3.

Hollow membrane                    

The membrane material consist from PVDF at a prseure of 3,5 bar, tensil module 06 0,0066 m2 at a flow rate of 0,23 L/sec, permeate flow rate 0f 0,6 L/sec, effective fiber lenttgh 0,6 m WİT A 0,02 mg/m2 ZrO2.

Pro Pressure Retarded Osmosis

The PRO process consisting from commercial cellulose triacetate provided by USA membrane production Center. An FO membrane supported by a USA (CTA-W) and an FO membrane (CTA-NW) was used. The RO experiments were conducted at 90 psi at 25 ± 0.2 °C. The PRO consisted from stainless steel with active membrane area of 110 cm2. The effluent was recirculated by a high pressure pump. The pressure in the draw solution was set by a back pressure regulator located downstream to the PRO. The temperature was 25 ± 0.2 °C with a Cross-flow velocity OF 8.5 cm/sEC WİTH 0,03 mg/m2 ATO.

MBR

The experimental MBR system comprised a bioreactor WİTH 20 L aerated tank AND with submerged flat sheet MF module consisting from a hydrophilic polypropylene membrane having a pore size of , 0.2μm. The channels between the membrane modules had a gap of 5 mm. The organic loading rate is 0,5 g COD/m3/day. The permeate suction pressure WA is 0.20 kPa with optimum SRT and HRT of 30 days and 6 days the aeration intensity and the permeate flux were 0,65 m3/m2 h and 14 L/m2 h at pH =8,0 with 0,09 mg/m2 ZnO

UF

UF membrane consinting from MWCO cntaining hollow fiber with a lentgh of 1,1 m, iner diameter is 0,65 μm with a 0,5 mg/m2 Co2O3 at a inlet flow rate of 4,86 ml/sec and a flux rate of 3,6 L/h.m2@20”C with a recovery of 90%.The molecular weigth cut-off is 30.000 D in YM30.

DCMD

Inlet flow rate is 1,5 L/sec, porosity 70%, length of Cross sectional area of flow channel is 0,0003 m2 with a 0,06 mg/m2 ZrO2 while the flow rate (Perimeter length of flow channel) is 0,115 m with a velocity of 0,135 m/h.

FO

The initial flux is 7.0µm/sec(25.2 L/m2 h while the hydraulic pressure is 3102.6 kPa (450 psi) containing 0,07 mg/m2 ATO. The flux is 7.04 m/s (25.2 L/m2 h), cross-flow velocity is 8.5 cm/sec, and the temperature was 21.0±1.0 ºC.

3. Results and Discussion

3.1 Comparison of Costs for Conventional and Advanced Treatment Plants

With conventional treatment processes (sequential anaerobic and aerobic treatments, Membrane processes and SBR) are not enough to threat the chemicals aforementioned and to reach to the discharge standards given by regulations. Furthermore, oxidation with chlorination, ozonation, chemical precipitation, UV/phenton processes consume high amount of chemical agents and, can produce toxic by-products and excess sludge. Furthermore, the cost of the conventional biological treatment plant are high compared to the advanced treatment plants utilizing the nanoparticles (data not shown). In advanced treatment processes in which the NPs was utilized, the total cost in RO, NF, UF and reduce to 0,0515 Euro, 0,0576 and 0,0576Euro to treat 20.000 m3 wastewater(data not shown). As result, the advanced treatment plants containing NMOs are significantly cheaper than conventional biological treatment plant. The cost in conventional treatment plants is 10 fold higher than that advance treatment plants containing NMOs (data not shown). Therefore, there is a real requirement for more efficient, cheaper and powerful technologies for treatment of industrial wastewaters. Among the various emerging technologies, the advancement in nanotechnology has proved an incredible potential for the remediation of wastewater and various other environmental problems [3].

3.2 Daphnia magna Acute Toxicity Test

The most toxic NMO is Bi2O3 with a low EC50 of 5.1 mg/l to D. magna after 24 h (Table 2). The least toxic NMO is Co3O4 with high EC50 value of 8.7 mg/l after 24 h incubation period (Table 2). After 48 h incubation the most toxic NMO was found to be Bi2O3 with the lowest EC50 value of 4.2 mg/l (Table 2). The least toxic NMOs were nano-ATO and nano-ZnO with the highest EC50 values of 6.2 mg/l (Table 2). The trophic transfer of ZnO NMO and ZnO-octyl NP from daphnids (Daphnia magna) to zebra fish (Danio rerio) was studied by [4]. For ZnO NMO and ZnO-octyl NP fast uptakes in D. magna were observed, whereas no measurable uptake took place for ZnO-OH NMO.

It was reported that the zinc recovered in the animals was not solely due to soluble zinc, but agglomerates/aggregates of ZnO NMO or ZnO-octyl NP contributed to the body burdens. [5] recently found that ZnO NP significantly accumulated and distributed in various tissues of juvenile carp (Cyprinus carpio). Only very few studies have reported on trophic transfer of engineered NMO. [6] demonstrated transfer of TiO2 NMO from D. magna to Danio rerio and studies using QD found evidence of potential trophic transfer [7]. The size distribution data showed a trend of ZnO NMO having the smallest hydrodynamic diameter, followed by Bi2O3, Co3O4, ZrO2 and ATO. In this study it was found that the NMO containing nanoparticles affected their EC50 values to D. magna. Though a combination of soluble, complexed Zn-species, and ZnO NMO as particles may contribute to the acute toxicity behavior observed in this study, the uptake of particles and aggregates contribute significantly to the overall acute toxicity observed. While dissolution may play a role in the uptake pattern observed for ZnO particles it is more likely that agglomerates contribute more inexplainable the higher uptake of bulk ZnO.

3.3 Anaerobic Toxicity Test – ATA

The least toxic NMO to anaerobic methane Archaea bacteria is Nano ZrO2 with the highest EC50 value of 8 mg/l after 24 h incubation while the most toxic NMO is Bi2O3 with the lowest EC50 value of 4.9 mg/l (Table 2). After 48 h incubation the EC50 values decreased at all NMO. The most toxic NMOs were nano-Co3O4 with the lowest EC50 values of 1,5 mg/l (Table 1). The least toxic NMO is nano ZrO2 with the highest EC50 value of 7.9 mg/l (Table 2). The biocidal potential of zinc oxide NPs against bacterial strain Pseudomonas aeruginosa was studied by Dwivedi et al. (2014). The NPs at a concentration of 100 µg/mL significantly inhibited the growth of bacteria and biofilm formation. The biofilm inhibition by ZnO-NPs was also confirmed via bio-transmission electron microscopy. ZnO-NPs treated bacteria confirmed the deformation and damage of cells. The bacterial growth in presence of NPs concluded the bactericidal ability of NPs in a concentration dependent manner. It has been speculated that the antibacterial activity of NPs as a surface coating material, could be a feasible approach for controlling the pathogens. No reports have described the toxicity of Bi2O3 nanoparticles, which indicates the necessity of investigating this area of nanotoxicology. Co3O4 nanoparticles, exert oxidative stress on human lymphocytes, damage DNA, and cause inflammatory responses [8]. Oxidative stress is an important factor for toxicity and causes the induction of apoptosis. Co3O4 nanoparticles induced cytotoxicity, morphological transformation, and genotoxicity in Balb3T3 cells [9]. All of these effects were most likely because of cobalt ion dissolution from the nanoparticles. Although cobalt metal oxide nanoparticles led to time- and concentration-dependent cytotoxicity, free Co2+ ions were more toxic.

3.4 Vibrio fischeri Acute Toxicity Test

The least toxic NMO was nano ATO with the highest EC30 value of 12.50 mg/l after 30 min for V. fischeri while the most toxic NMO was ZrO2 with the lowest EC50 value of 6.1 mg/l (Table 2). EC50 values obtained for ZnO from two models are comparable with effective concentrations of ZnO suspensions obtained by [10] (1.9 ppm) and [11] (4.8 ppm). The test results and calculation of effective concentration (EC) values showed that MCM-41 and nano-ZnO have the lowest and highest toxicity after 5 min exposure time to V. fischeri respectively. MCM-41 after 30 min contact time to Vibrio fischeri, was more toxic than nano SiO2. MCM-41s are listed to the latticed silica nano particles which are quite porous and have meso pore structure, while silica (SiO2) is nonporous-spherical nanoparticle. Bi2O3 although has attracted a great deal of attention as a semiconductor that is sensitive to visible light and has superior photocatalytic activity for environmental purposes, such as water treatment it was found to be toxic to Vibrio fischeri [12].

3.5 Bioaccumulation test of NMOs

The most accumulative NMO is Bi2O3 with high BCF values of 9, 45 and 460 mg/l at COD concentrations of 10, 100 and 1000 mg/l (Table 2). The least accumulative NMO İS ZnO with low BCF values of 2,15 and 250 mg/l, respectively (Table 2). According to REACH (Registration, Evaluation and Authorization of Chemicals) (REACH-EU, 2007) criteria if BCF values are less than 1000, the chemical is not bioaccumulative. Therefore all BCF values of NMOs used in this study were not higher than 1000 so these NMOs are not bioaccumulative according to REACH criteria.

3.6 Cost analysis for Ecotoxicity Test

Although some acute toxicities in bacteria, daphnids and methane Archaea bacteria the used NMOs were not bioaccumulative. Since the cost spent to conventional treatment plants are high in order to remove the pollutants from the wastewaters. Therefore, due to low investment costs of NMOs, in recent years the NMOs will be extensively used in the treatment of non-biodegradable pollutants at low concentrations. The acute toxicities of the NMOs should be monitored and the cost for these test was not so expensive (Table 2). For all acute toxicity tests and bioaccumulation the total cost is only 9.7 euro per year for 20 tests.

3.7 Treatment efficiencies in the novel processes containing the nano metal oxides

High removal efficiencies was obtained for all pollutants present in petrochemical industry wastewater (Table 3).

Table 3. Removal efficiencies in the novel processes containing NMOs

Parameter

Removal efficiencies (%)

MD

PRO

Submerged porous UF

RO

MF

UF

NF

DCMD

FO

COD

96

98

98

99,9

97

97

96

97

99

TOC

95

98

98

99,9

97

98

97

99

Polyphenols

95

98

97

99

97

98

96

98

TDS

95

98

97

99

97

98

95

99

DOC

96

98

98

99

96

97

96

98

Color

95

98

98

99

98

98

95

98

Aromatic amines

96

98

99

99

98

99

97

97

TN

95

98

98

100

97

97

96

97

TP

95

98

98

100

97

98

96

97

PAH

94

98

99

99

98

98

96

97

The total cost for all studied advanced treatment processes are low to treat 1 m3 petrochemical wastewater (Table 4).

Table 4. Calculated costs for some advanced processes containing NMOs

Parameter

MD

Submerged porous UF

RO

MF

UF

NF

Investment cost

0,005

0,0077

0,0034

0,004

0,008

0,009

Energy cost for natural gas

0,008

0,008

0,008

0,008

0,008

0,008

Energy cost for electricity

0,035

0,035

0,035

0,035

0,035

Steam energy cost

0,024

0,0011

0,0011

0,0012

0,005

0,003

Membrane exchange cost

0,005

0,001

0,005

0,003

0,005

0,0055

Membran

maintance cost

0,0001

0,00002

0,0001

0,0001

0,0001

0,0001

Total cost

0,0771

0,05172

0,0515

0,0151

0,3711

0,0576

Conclusion

The advanced treatment processes containing the NMOs were effectively used in the treatment of pollutants from the petrochemical industry wastewater. The cost of these treatment plants are low therefore should be preferred in the treatment of wastewaters containing refractory pollutants. With the utilization of nano metals below the inhibitions and toxicity levels high treatment efficiencies will be obtained in the industrial wastewater. The toxicity analysis results showed that the most toxic NMO is nano-Co3O4 to methane Archaea because of lowest EC50 value (1,5 mg/l) after 48 h. The least toxic NMO is ATO due to high EC50 value for organism (Vibrio fischeri ; 12,5 mg/l after 30 min). The results showed that nano-Co3O4 and Nano Bi2O3 are the most toxic NMOs with high acute toxicity compared to other NMOs. The most bioaccumulative NMO is nano-Bi2O3 due to the highest BCF value [13]. The least bioaccumulative NMO is nano-ZnO due to the lowest BCF value [13]. The concentrations of NMOs should be taken into consideration in the utilization of the novel treatment plant processes.

Acknowledgement

This study was prepared in the scope of Master of Sciences in Environmental Earth Sciences, and at the same time it was supported by the Department of Scientific Resource Project (2014.KB.FEN.019), in Dokuz Eylül University Graduate School of Natural and Applied Sciences. Also, the author acknowledged The Scientific and Technological Research council of Turkey (TÜBİTAK) for financial support (2210-C).

References

  1. Hull MS, Bowmann (2014) Nanotechnology Environmental Health and Safety: Risks, Regulation, and Management.
  2. Aruoja V, Dubourguier HC, Kasemets K, Kahru A (2009) Toxicity of nanoparticles of CuO, ZnO and TiO2 to microalgae Pseudokirchneriella subcapitata. Science of Total Environment 407: 1461–1468.
  3. Zare N (2007) Renewable and Alternative Energy: Concepts, Methodologies, Tools, and Applications, USA.
  4. Skjoldinga LM, Winther N, Baun A (2014) Trophic transfer of differently functionalized zinc oxide nanoparticles from crustaceans (Daphnia magna) to zebrafish (Danio rerio). Aquatic Toxicology 157: 101–108.
  5. Hao L, Chen L, Hao J, Zhong N (2013) Bioaccumulation and sub-acute toxicity of zinc oxide nanoparticles in juvenile carp (Cyprinus carpio): a comparative study with its bulk counterparts. Ecotoxicol Environ Saf 91: 52–60. [crossref]
  6. Zhua H, Wang J, Zhang X, Chang Y, Chen Y (2010) Trophic transfer of Ti O2 nanoparticles from daphnia to zebrafish in a simplified freshwater food chain. Chemosphere 79: 928–933.
  7. Woo ML (2015) Evidence of three-level trophic transfer of quantum dots in an aquatic food chain by using bioimaging. Nanotoxicology 9: 407–412.
  8. Zhang H, Ji S, Xia T, Meng H, Loe C (2012) Use of Metal Oxide Nanoparticle Band Gap To Develop a Predictive Paradigm for Oxidative Stress and Acute Pulmonary Inflammation. ACS Nano 6: 4349–4368.
  9. Cavallo D, Ciervo A, Fresegna AM, Maiello R, Tassone P, et al. (2015) Investigation on cobalt-oxide nanoparticles cyto-genotoxicity and inflammatory response in two types of respiratory cells. Journal of Applied Toxicology 35: 102–113.
  10. Heinlaan M, Ivask A, Blinova I, Dbourguier HC, Kahru (2008) Toxicity of nanosized and bulk ZnO, CuO and TiO2 to bacteria Vibrio fischeri and crustaceans Daphnia magna and Thamnocephalus platyurus. Chemosphere 71: 1308–1316.
  11. Mortimer M, Kasemets K, Heinlaan M, Kurvet I, Kahru A (2008) High throughput kinetic Vibrio fischeri bioluminescence inhibition assay for study of toxic effects of nanoparticles. Toxicology in Vitro 22: 1412–1417.
  12. Ana J, Jeong S, Moon HS, Jho EH, Nam K (2012) Prediction of Cd and Pb toxicity to Vibrio fischeri using biotic ligand-based models in soil. Journal of Hazardous Materials 203–204: 69–76.
  13. Hanna S, Miller RJ, Zhou D, Keller AA, Lenihan HS (2013) Accumulation and toxicity of metal oxide nanoparticles in a soft-sediment estuarine amphipod. Aquatic Toxicology 142–143, 441–446.

Premature vaginal delivery with breech presentation

DOI: 10.31038/IGOJ.2019231

Short Note

Only a few cases of extreme premature deliveries with breech presentation are described in the literature.  An unavoidable delivery with a premature child before gestationweek 26–28 whether there is a caput or a breech presentation, there are reasons to prefer a vaginal delivery.  You can`t change in worst case a very   poor prognosis for the child in relation to psyko and somatic development.  If you choose a cesarean section there are higher risks for the mother compared with vaginal delivery in mortality, aspiration, thromboembolic diseases, amnion emboli, higher risks for bleeding under the operation and infections subsequent.  In the future you may see complications with adherences and infertility, following births often end with placenta accrete, placenta previa and ablatio placenta, rupture of uterus and higher frequencies of caesarean section.

Whether the mode of delivery is vaginal or cesarean section, there will be risk of traumatic complication in the delivery of the foetus. Higher risks after cesarean section are neonatal meconium aspiration, respiratoric distress, hypoxi, and in the childhood allergic and bowl diseases.

In the choose of delivery – vaginal or cesarean section-you are giving the mother a much better prognosis  in a vaginal delivery and in any way you can’t chance a poor prognosis to the child.

References

  1. Ismail MA, Nagib N, Ismail T et al. Comparation of vaginal and cesarean section   delivery of  foetues  in breech presentation. Perinat Med 1999; 27: 339–51.
  2. Herbst A, Kællen K. Influence of mode of delivery on neonatal mortality and morbidity in spontaneous premature delivery. Eur J Obstet Gynecol Reprod Biol 2007; 133: 25–9.
  3. Markestad T, Kaaresen T, Rønnestad P et al. Early death, morbidity and need of treatment among extremely premature infants. Paediatrics 2005; 115: 1289–98.

Quantitative Point of Care testing of HCG in early pregnancy units: A Review

DOI: 10.31038/IGOJ.2019225

Current Practice

Vaginal bleeding and or abdominal pain occurs in 25% – 30% of viable pregnancies and are very common presentations to Primary Care; Emergency Departments and to specialist Early Pregnancy Assessment Units. In up to 42% of cases, no intrauterine pregnancy is seen on scan (and no ectopic pregnancy is identified) and this is known as a ‘pregnancy of unknown location’ (PUL) [1]. The current line of investigation for bleeding and pain in early pregnancy is a pelvic ultrasound scan to determine the location and viability of the pregnancy [2]. The pelvic ultrasound scan could be inconclusive in a fair number of patients. In up to 40% of cases there is no intrauterine pregnancy picked up on the scan, a diagnosis of pregnancy of unknown location (PUL) is considered [3]. Human chorionic gonadotrophin (hCG) is a glycoprotein hormone secreted from the placenta and is the most widely used biomarker as an indication of pregnancy in women.  As a single value it is not diagnostic nor beneficial, but when measured serially it is helpful. Serial hCG monitoring and a pelvic ultrasound are the mainstay of management of PUL [4-7]. The expected change in hCG over 48 hours is at least 53% and gives an indication that the pregnancy (intrauterine or ectopic) is progressing [8]. Serial hCG measurements are therefore used, not to determine the location of the pregnancy, but to predict viability of the pregnancy. The use of serial quantitative human chorionic gonadotropin (hCG) measurements is a mainstay of practice in Early Pregnancy Assessment Units (EPAUs) to aid in the management of these patients.

Quantitative POCT hCG Devices

The measurement of serial hCG using a recognised laboratory method has been recommended by both the NICE and the Royal College of Obstetrics and Gynaecology guidelines for managing a suspected ectopic pregnancy [9,10]. There have been quite a number of qualitative Point of Care (POC) hCG devices available on the market for some time but very few quantitative POC hCG devices. The quantitative POC devices that are currently on the market include the Abbott Point of Care i-STAT, the Radiometer AQT90 FLEX, and the Boditech i-CHROMA™.

For these devices to become common place in the serial quantification of hCG, there are several questions that need to be answered:

  1. What is the accuracy of quantitative POC methods compared to laboratory methods?
  2. Are the quantitative POC methods faster when compared to laboratory methods and thereby impact on patient experience (waiting time, decision making, diagnosis and hospital admissions)?
  3. What is the cost effectiveness of introducing quantitative POC methods to the treatment pathway?

What is the accuracy of quantitative POC methods compared to laboratory methods?

The i-STAT is a handheld cartridge-based system, CE certified using whole blood samples, using a sample volume of 17μl, with a total assay time of 10 minutes and a working range of 5 – 2,000 IU/L. Comparative studies between the quantitative POC method i-STAT and existing laboratory methods such as  the Abbott Architect Total β-hCG ; Beckman Dxl Total β-hCG ; and Roche Cobas e601 hCG+β showed that the  i-STAT results agreed most closely with the Abbott Architect Total β-hCG assay, while greater differences were observed with Beckman Dxl Total β-hCG and Roche Cobas e601 hCG+β assays [11,12]. (see table 1)

Table 1. Showing correlations (r2) between hCG concentrations of i-STAT method and other laboratory methods.

Method

Correlation (r2)

Beckman Coulter UniCel DX 1800

0.99411

Abbott Architect Total β-hCG

0.84312

Beckman Dxl Total β-hCG

0.99212

Roche Cobas e601 hCG+β

0.99312

Abbott Architect Total β-hCG

0.99312

The Boditech i-CHROMA™ hCG method is a portable device using fluorescence immunoassay (FIA), CE certified using whole blood samples, using a sample volume of 50μl, with a total assay time of 15 minutes and a working range of 5–50,000 IU/L. Comparative data between the quantitative POC method Boditech i-CHROMA™ hCG method and existing laboratory methods such as the Beckman Coulter Access2 hCG method described in the product leaflet [13] and in another study [14], with the following methods: Abbott Architect, BioMerieiux VIDAS/mini VIDAS, Roche hCG + Beta, Siemens Centaur XP/XPT/Classic, Siemens Dimension, Siemens DPC Immulite 1000 and 2000, Beckman DxI 600/800, Roche hCG STAT, Beckman Access, SNIBE Maglumi and Ortho Vitros [14] shown in table 2, showed very good correlation. In another study, the Boditech i-CHROMA™ hCG showed very good correlation with the following methods: Abbott Architect, BioMerieiux VIDAS/mini VIDAS, Roche hCG + Beta, Siemens Centaur XP/XPT/Classic, Siemens Dimension, Siemens DPC Immulite 1000 and 2000, Beckman DxI 600/800, Roche hCG STAT, Beckman Access, SNIBE Maglumi and Ortho Vitros [14] (see table 2).

Table 2. Showing correlations (r2) between hCG concentrations of i-CHROMA™ method and other laboratory methods

Method

Correlation (r2)

Beckman Coulter Access2

0.98913

Abbott Architect

0.99514

Monobind Inc. ELISA/CLIA

0.84214

Siemens Centaur CP

0.99214

Siemens Centaur XP/XPT/Classic

0.99214

Roche Cobas Core EIA

0.99314

Beckman DxI 600 /800

0.99314

DiaSorin, Liaison

0.99414

Beckman DXI Total βhCG (5th IS)

0.99414

bioMerieux, VIDAS / mini VIDAS

0.99414

Siemens/DPC Immulite 1000

0.99514

SNIBE Maglumi analysers

0.99614

Beckman, Access/LXi725

0.99714

Roche hCG+β

0.99714

Siemens Dimension

0.99714

Roche hCG STAT (Intact)

0.99814

Siemens/DPC Immulite 2000

0.99814

Beckman Access Total βhCG (5th IS)

0.99814

Ortho Vitros 3600/5600/ECi

0.99814

The Radiometer AQT90 method is based on an all in one dry chemistry concept, CE certified using whole blood samples, with a volume 0.3 – 2ml, with a total assay time of 18 minutes and a working range of 1 – 5,000 IU/L.  The agreement or concordance of the Radiometer AQT90 was 69% with the Abbott i-STAT, 81% with the Beckman Coulter and 75% with the Roche methods [15].

Are the quantitative POC methods faster when compared to laboratory methods and thereby impact on patient experience (waiting time, decision making, diagnosis and hospital admissions)?

The hCG sample, when taken in the emergency unit, is transported to the conventional laboratory and could take approximately 2-3 hours to return.  This could affect the patient experience (waiting time, decision making, diagnosis and hospital admissions). A study showed that a quantitative hCG method was simpler and faster than the traditional laboratory method [16].  This is not surprising as the hCG analysis can be done on whole blood samples and the analytical times of these quantitative POC devices range between 10 – 18 minutes, as described in this review. In most cases, in practice, patients are asked to wait until the following day for the result of the hCG test. This not only causes a delay in determining the management plan, it may also result in unnecessary hospital admission and almost certainly increases patient anxiety.

A case scenario and a brief review of the relevant literature was conducted, taking into consideration clinical and analytical elements of the clarity on the use of qualitative and quantitative hCG for the assessment of pregnancy. The conclusion was that use of hCG assays were reliable for pregnancy assessment [17]. A further case was presented from the emergency gynaecology unit at Barts and the London NHS Trust, where a point of care hCG analyser, the Radiometer AQT90 FLEX, was introduced as a strategy to deal with inconclusive sonography results. The unit had previously been sending hCG tests to the laboratory and getting the results back within 2-3 hours. With this POC hCG test, the staff, not being laboratory personnel, found the system reliable; user friendly and very simple to perform the test. In addition, in the past, patients with an inconclusive scan would have been sent away but now they are able to get results with the patients still in the clinic, facilitating the chance to initiate the appropriate treatment for the patient [18,19]. More recently, monitoring of serial hCG levels alone, permitted an early viability diagnosis to be made within 48 hours for 41.1% of patients with PUL, instead of 7 to 14 days with a transvaginal ultrasound scan [20].

The cost effectiveness of introducing quantitative POC devices to the treatment pathway

There are no studies looking at the cost effectiveness of point of care quantitative hCG testing. However, one study looked at the introduction of a point of care qualitative serum assay for hCG into an outpatient department for a 1 month period and showed a significant decrease in culdocenteses (p<0.001), ultrasound examinations (p<0.025) and hospital admissions (p<0.01), with a net projected institutional reduction in health care costs of $123,000 annually [21].

Conclusion

The possible advantages of a point-of-care quantitative serial hCG test in early pregnancy units would provide a rapid result, helping to aid prompt and effective clinical decision making.  It is likely to improve patient satisfaction by reducing waiting time for results and clinical decisions and enabling immediate feedback of the results to the patient. It may help diagnoses to be made in primary care, especially in the context of increasing availability of ultrasound scanning in the community setting. In addition, it may allow follow-up in primary care, rather than in secondary care, and it may be more cost effective than current laboratory methods.

In conclusion, there are currently a few POC quantitative hCG testing devices such as the Abbott Point of Care i-STAT, the Radiometer AQT90 FLEX and the Boditech i-CHROMA™. These devices have demonstrated very good correlation with many laboratory methods.  They are all CE approved devices able to measure hCG throughout the acceptable range, using small amounts of whole blood samples assayed all within 18 minutes. The devices should be able to make the patient experience more pleasant by allowing accurate diagnosis to be made, reduce waiting times and hospital admissions and be cost effective.

References

  1. Kirk E, Bottomley C, Bourne T. Diagnosing ectopic pregnancy and current concepts in the management of pregnancy of unknown location. Hum Reprod 2014; 20 (2): 250–261
  2. Kirk E, Papageorghiou AT, Condous G, Tan L, Boara S, Bourne T. The diagnostic effectiveness of an initial transvaginal scan in detecting ectopic pregnancy. Hum Reprod 2007; 22 (11): 2824–2828
  3. Royal College of Obstetrics and Gynaecologists: The management of tubal ectopic pregnancy. RCOG Guideline No 21. 2010 https://www.rcog.org.uk/en/guidelines-research-services/guidelines/gtg21/
  4. Banhart KT. Clinical practice. Ectopic pregnancy. N Engl J Med 2009; 361: 379 –387
  5. Barnhart K, Mennuti MT, Benjamin I, Jacobson S, Goodman D, Coutifaris C Prompt diagnosis of ectopic pregnancy in an emergency department setting. Obstet Gynecol 1994; 84: 1010–1015
  6. Nyberg DA, Filly RA, Mahony BS, Monroe S, Laing FC, Jeffrey RB Jr. Early gestation: correlation of HCG levels and sonographic identification. Am J Roentgenol 1985; 144: 951–954
  7. Peisner DB, Timor-Tritsch IE. The discriminatory zone of beta-hCG for vaginal probes. J Clin Ultrasound 1990; 18: 280–285
  8. Chung K, Allen R.: The use of serial human chorionic gonadotropin levels to establish a viable or a nonviable pregnancy. Semin Reprod Med 2008; 26 (5): 383-90.
  9. Royal College of Obstetrics and Gynaecologists. The management of tubal ectopic pregnancy. RCOG Guideline No 21. 210 https://www.rcog.org.uk/en/guidelines-research-services/guidelines/gtg21/
  10. NICE clinical guideline (CG154). Ectopic pregnancy and miscarriage: Diagnosis and initial management in early pregnancy of ectopic pregnancy and miscarriage. 2012. https://www.nice.org.uk/guidance/cg154
  11. Sowder AM, Yarbrough ML, Nerenz RD, Mitsios JV, Mortenson R, Gronowski AM et al. Analytical performance evaluation of the i-STAT total beta-human chorionic gonadotrophin immunoassay. Clin Chim Acta 2015; 446 : 165 – 170 Epub 2015/04/29
  12. Wikstrom A-K, Hagmar M, Ronquist G, Larsson A. Evaluation of plasma hCG method for point of care testing with the aim of shortening test turnaround times. Open Journal of Obstetrics and Gynecology 2015; 5 : 341–343. http://dx.doi.org/10.4236/ojog.2015.56049
  13. β-hCG Product Leaflet. Boditech Med Inc
  14. Bolodeoku J, Bains S, Pinkney S, Coker O, Fakokunde A. Comparison of the Point of Care Test (POCT), i-CHROMA™ Human Chorionic Gonadotrophin (HCG), Leutinizing Hormone (LH) and Follicle Stimulating Hormone (FSH) methods in serum with the other methods in the Randox International Quality Assessment Scheme (RIQAS). Clin Obstet Gynecol Reprod Med 2017 3 (4): 1–7
  15. Brun MM, Holloway L, Oleksy A, Dayton J, Estey MP, Goudreau B-L, Fuzery AK. Analytical evaluation of the Radiometer AQT90 FLEX βhCG assay. Prac Lab Med 2019; 13 :e00116 http://doi.org/10.1016/j.plabm.2019.e00116
  16. Von Lode P, Rainaho J, Pettersson K. Quantitative, wide range, 5 minute point of care immunoassay for total human chorionic gonadotrophin in whole blood. Clin Chem 2004; 50 (6): 1026–1035 Epub 2004/04/10
  17. Greene DN, Grenache DG. Pathology consultation on human chorionic gonadotropin testing for pregnancy assessment. Am J Clin Pathol 2015; 144 : 830–836. DOI: 10.1309/AJCP707VAREDUYIJ
  18. Case Story – Faster point of care hCG testing, transforming patient management in emergency gynaecology unit, reducing patient anxiety. Obs Gynae & Midwifery News 2012 May 25 http://www.ogpnews.com/2012/05/case-story-faster-point-of-care-hcg-testing-transforming-patient-management-in-emergency-gynaecology-unit-reducing-patient-anxiety/9581
  19. Product News – Point of care hCG invaluable for emergency gynaecology Obs Gynae & Midwifery News 2011 June 1 http://www.ogpnews.com/2011/06/point-of-care-hcg-testing-invaluable-for-emergency-gynaecology/291
  20. Joueidi Y, Bauville E, Laviolle B, Bendavid C, Lavoue V, Le Louis M. Serial hCG and progesterone levels to predict early pregnancy outcomes in pregnancies of uncertain viability: A prospective study. European Journal of Obstetrics and Gynecology and Reproductive Biology 2018; 220: 100–105 https://doi.org/10.1016/j.ejogrb.2017.11.020
  21. Gennis P. Gallagher EJ, Andersen F, Hain L. Cost effectiveness of an accurate and rapid assay for serum human chorionic gonadotropin in suspected ectopic pregnancy. Am J of Emerg Med 1988; 6 (1) 4–6

Ginger Ameliorated the Exocrine Pancreatic Structure of Fetuses of Diabetic Mother Wistar Albino Rats

DOI: 10.31038/EDMJ.2019335

Abstract

Objective: Hyperglycaemia and diabetic complication during pregnancy interfered with birth defect and traditional usage of phytotherapy take a great attention. The present study searched for illustrate the interference of maternal diabetes on the development of exocrine pancreas during in utero growth and role of ginger extract in improving the disease.

Research design and methods: Sixteen pregnant rats were used and arranged into four groups (n = 4); control, ginger extract group, diabetes, diabetes and ginger supplementation. Diabetes was induced by single i.p. injection of streptozotocin (60 mg/kg in citrate buffer pH 4.5 plus 100mg/kg nicotinamide). Ginger watery extract (200mg/kg body weight) was orally daily supplemented from 5th day of gestation until 14th day of gestation. Pregnant were sacrificed at 14th day of gestation, fetuses were separated and exocrine pancreas were separated and fixed in either 10% phosphate buffered formalin or 2.5 cacodylate buffered glutaraldhyde for transmission electron microscopy. Immunohistochemistry of caspase 3 was carried out. During the gestation period, blood glucose level was measured in the studied groups.

Results: The present results revealed that diabetes developed atrophy and degeneration of the acinar epithelium of the pancreas. At ultrastructural level, there was a considerable missing of the secretory granules and arranged of rough endoplasmic reticulum taking the characteristic feature of fibrosis. Immunohistochemical analysis illustrated over expression of caspase 3 in acina epithelium. However, ginger water extract supplementation to diabetic mother improved the blood glucose level and histo-cytlogical and immunohistochemical picture manifesting marked alleviation of the drastic alterations compared to the control.

Conclusion: The author concluded that ginger extract showed a potent antioxidant activity, decreasing the diabetes associated oxidative stress and improved the fetal exocrine pancreas histo-cytological structure.

Introduction

The pancreas is composed of exocrine and endocrine portion. It is developed from the dorsal and ventral endodermal as a result of the epithelio-mesenchymal interactions. Exocrine acinar cells, are responsible for secretion of zymogens and digestive enzymes through a ductal network leading to the duodenum and facilitated digestion [1, 2]. Acinar cells builds up the exocrine pancreas and secrete up to more than 20 kinds of enzymes, such as proteinase, DNAses and lipases, which are important elements for digestion [3].

The knowledge of type T3c diabetes mellitus (T3cDM, MODY) is still unclear and involved in the impairing of exocrine pancreas, the reservoir of digestive enzymes. Little knowledge about the mark differences between T2DM and T3cDM. T3cDM is developed in early childhood growth [4] and characterized by chronic pancreatitis, pancreatic cancer. Inflammation, fibrosis leading to damage of both endocrine and exocrine function impairing insulin/glucagon secretion and dysfunction of pancreatic enzyme [5]. The prevalence of exocrine dysfunction in type-1 and type-2 diabetic patients reached approximately to 37.7% and 26.2% respectively [6]. Also, the exocrine pancreas dysfunction related to diabetes affects 1.8% of adults with new-onset diabetes. Cell death of the islet of Langerhans alters the secretion of insulin, glucagon, and pancreatic polypeptide resulting fluctuations in glucose levels. Diabetes induced acute or chronic pancreatitis, associated with co-existing cystic fibrosis or hemochromatosis [7,8].

At the same time, there is a great attention to the consumption of traditional medicine. Ginger (Zingiber officinale) is a rhizome popular food spice and showed varieties of bioactive components such as vallinoids, viz. gingerol[9] and paradol, shogaols, zingerone, and galanals A and B [10]. Its administration resulted in improvements of diabetic patients [11–13] and experimental animals [14,15] through managing of hyperglycemia glycemia, oxidative stress, and inflammation.

There was no available work concerned the influence of maternal diabetes on the developing of exocrine pancreas during intrauterine life. The present work searched for illustrated the light and transmission electron microscopically study of fetal exocrine pancreas of diabetic mother and the potential medical phytotherapy of watery ginger extract.

Materials and Methods

1. Applied dose of ginger watery extract

A known weight of dried ginger (Zingiber officinale) was mixed thoroughly with hot water weekly, filtrate and allows standing at room temperature. Each pregnant received 0.5 cc containing 200mg of the extract / kg body weight. Each dose was orally administered daily from 6th day of gestation till 16th day of gestation.

2. Induction of diabetes

Experimental type 2 diabetes mellitus was induced in all the rats by a single interperitoneal injection of streptozotocin (60 mg/kg) in citrate buffer (0.05 M) (pH 4.5) and 100mg/kg nicotinamide [16]. Hyperglycemia was verified by measuring the blood glucose within 240- 280 mg/dl were selected for the study.

3. Experimental animal work

Twenty fertile male and virgin female of albino rats (Rattus norvegicus) (at a ratio of 1 male to 3 females) weighing approximately 200g body weight, obtained from Hellwan Breeding Farm, Ministry of Health, Egypt and used for experimentation. They were housed in good ventilation on a 12-h light and dark cycle. Females were mated (1 male/3 females) overnight and zero dates of gestation were determined the next morning by observing the sperm in vaginal smear. The pregnant were arranged into four groups (n = 4 per each); control, ginger watery extract, diabetes, diabetes and ginger extract. Experimental work was carried out from zero date of gestation till 16th day intra-uterine growth. Water was allowed ad Libitum. At the end of treatment, they were sacrificed by light diethyl ether anesthesia and dissected at 14th days prenatal. Maternal blood was collected and serum was separated and kept in refrigerator. Also, the pregnant were dissected and their fetuses were separated and processed for the following investigations:

4. Biochemical investigations:

Serum levels of total cholesterol (TC) [17], Triglycerides (TG) [18] and high density lipoproteins (HDL) [19] were determined. In case of low density lipoproteins (LDL), it was calculated from the total concentrations of cholesterol (TC), HDL-cholesterol and triglycerides according to Friedewald et al [20]. The glucose regularly measured by blood glucometers one touch ultra (Life Scan Milipitas, CA, USA).

5. Histological investigation:

Pancreas of 14th day-old fetuses of the studied groups were separated and immediately fixed in 10% phosphate buffered formalin (pH 7.4), dehydrated in ascending grades of ethyl alcohol, cleared in xylene and mounted in molten paraplast at 58–62ºC. Five μm histological sections were stained with hematoxylin & eosin and investigated under a bright field light microscope.

6. Transmission electron microscopy

Specimen of pancreas of 16th day old fetuses of the studied groups were immediately fixed in 2.5 % glutaraldehyde in 0.1M cacodylate buffer (pH 7.4) and post-fixed in 1% osmium tetraoxide, dehydrated in ascending grades of ethyl alcohol, and embedded in epoxy–resin. Ultrathin sections were cut with a diamond knife on a LKB Ultratome IV (LKB Instruments, Bromma, Sweden) and mounted on grids, stained with uranyl acetate and lead citrate, and examined under a Joel 100CX transmission electron microscope (Musashino 3-chome, Akishima, Tokyo 196–8558, Japan).

7. Immunohistochemistry for caspase 3

Deparaffinized histological 5μm thick sections of pancreas of 16 day old fetuses were cut and mounted onto super frost plus glass slides (Fisher Thermo Scientific, Nepean, Ontario, Canada). At a normal room temperature, the tissue sections were processed for antigen retrieval by digestion in 0.05 % trypsin (pH 7.8) for 15 min at 37°C and incubated with the antibodies against caspase 3 (dilution 1:100 Thermo Fisher Scientific, Fremont, CA, USA; Cat. No. A1–70007) for overnight at 4°C, followed by treatment with a horseradish peroxidase streptavidin detection system (Dako), and DAB plus Chromagen for developing the immunoactivity. The immunohistochemical stained slides were counterstained with hematoxylin. Negative control was carried out by incubating slides with 1% non-immune serum phosphate buffer solution (PBS) solution. Specimens were investigated under a Leica BM5000 microscope (Leica Microsystems, Wetzlar, Germany) and photographed.

For assessments of image analysis, slides were photographed using Olympus® digital camera installed on Olympus® microscope with 1/2 X photo adaptor, using 40 X objective. The result images were analyzed on Intel® Core I5® based computer using Video Test morphology® software (Russia) with a specific built-in routine for area, % area measurement and object counting.

Results

Biochemical observations

Ginger-extract supplementation improved the diabetic associated increase of serum glucose level, LDL, triglycerides and total cholesterol levels (Fig.1).

EDMJ 2019-116 - El-Sayyad Egypt_F1

Figure 1. Chart illustrating serum glucose, LDL, TG, HDL and total cholesterol levels. Each result represent the mean ± SD of n = 5. * Significant at P < 0.05. Abbreviations; GL, glucose, HDL, high density lipoprotein; LDL, low density lipoprotein; TC, Total cholesterol.

Exocrine pancreas of 14th day fetuses

Fetuses of control and ginger-extract-supplemented mother exhibited normal structural pattern of exocrine pancreas. It is composed of tubuloacinar glands containing numerous acinar units. Each composed of pyramidal acinar cells with centrally located nuclei and basophilic cytoplasm surrounding their lumen (Fig. 2 A&B)

EDMJ 2019-116 - El-Sayyad Egypt_F2

Figure 2. Photomicrographs of histological sections of exocrine pancreas of 14th day rat fetuses. A. Control. B. Cinnamon-ginger extract. Note the normal structural pattern of centro-acinar cells and intercalated duct. C. Foetuses of diabetic mother showing disorganized acinus with collapsed duct and damaged acinar lining cells. D. Foetuses of diabetic mother supplemented ginger extract supplementation showing improved cento-acinar cells and intercalated duct. HE. Abbreviations; A, acini, CAC, centro-acinar cell; ICD, intercalated duct ; DA,deformed acinar.

However, those of diabetic mother exhibited massive damaging of the acinar units and atrophied lumina. The acinar lining cells appeared swollen with pyknotic nuclei and eosinophilic cytoplasm. Interlobular ducts were lined with flattened epithelium (Fig.2C).

On the other hand, fetuses of diabetic mother supplemented ginger-extract revealed improvement of the pancreatic structure but of less developed in comparison with the control (Fig.2D).

At ultrastructural level, the exocrine acinar cells possessed normal cytological structure in control and ginger –treatment. Each exocrine cell possessed centrally located nuclei with peripheral heterochromatin and abundant euchromatin. The cytoplasm contained abundant electron-dense and faint spherical zymogen granules of varying sizes and shape. The granules were membrane-bound. Numerous mitochondria and rough endoplasmic reticulum were detected in-between the secretory granules. Glycogen granules were observed in the cytoplasm of the acinar cells. Blood vessels are detected around the acini and ducts (Figs. 3 A&B).

EDMJ 2019-116 - El-Sayyad Egypt_F3

Figure 3. Transmission electron micrographs of exocrine pancreas of 14th day-old fetuses. A. Control. B. Maternally supplemented ginger extract. Note the presence of normal oval-shaped nuclei with peripheral marginal heterochromatin and central euchromatin. The is rich of electron –dense zymogen granules of different sizes containing in between mitochondria. C&D. Maternally diabetic showing apoptic atrophied nuclei composed electron-dense heterochromatin and surrounded by a network of clumped rough endoplasmic reticulum containing in between atrophied mitochondria (C). Another specimens illustrates nuclei with irregular nuclear envelope, lipid vacuoles and missing of secretory granules (D). E&F. Foetuses of diabetic mother supplemented ginger extract revealing increase secretion of light and electron-dense zymogen granules. Abbreviations; BC, blood capillary; ES, electron-dense-secretory granule; M, mitochondria, N, nuclei; PN, pyknotic nuclei; RER, rough endoplasmic reticulum; V, lipid vacuoles.

In those maternally diabetic, the acinar cells exhibited apoptic nuclei composed of electron-dense heterochromatin and surrounded by a network of clumped rough endoplasmic reticulum enclosed in between atrophied mitochondria manifesting fibrotic structure. In some other cells, the nuclei outlined by irregular nuclear envelope and their cytoplasm contained abundant lipidvacuoles of varying sizes and missing of their inclusion of secretory granules (Figs. 3 C&D).

On the other hand, fetuses of diabetic mother supplemented ginger extract restored the presence of faint secretory granules was comparatively decreased in some cells and increased in other ones. The criteria structure of the acinar cells is improved but less developed compared to the control (Figs. 3 E&F).

Following immunohistochemical staining with caspase 3, the fetuses of diabetic mother exhibited overexpression of dark brown reaction in acinar cells (Fig. 4C) in comparison with the negative staining affinity in control and ginger supplementation (Figs. 4 A&B). Fetuses of diabetic mother supplemented ginger extract revealed marked reduction of the immunohistochemical reaction (Fig. 4D). Image analysis revealed increased regional area of immunohistochemical reaction in acinar cells of diabetic mother compared to the other studied groups (Fig. 5).

EDMJ 2019-116 - El-Sayyad Egypt_F4

Figure 4. Photomicrographs of formalin fixed histological section of exocrine pancreas of 14th day-old fetuses maternally immunohistochemically stained with caspase 3. A. Control. B. Ginger extract-treatment. Note negative immuphistochemically stained with caspase 3. C. Maternally diabetic showing increased immunohistochemical affinity in acinar cells. D. Ginger extract showing marked reduction of the expression of caspase 3.

EDMJ 2019-116 - El-Sayyad Egypt_F5

Figure 5. Chart illustrating image analysis of surface immunohistochemical reactive areas with caspase 3 of acinar cells of fetuses of diabetic mother compared to the other studied groups. Each result represent the mean ± SD of n = 5. Star means significant at P < 0.05.

Discussion

The present findings revealed that 14th day-old fetuses of diabetic mother exhibited abnormal histological structure of exocrine pancreatic cells including eosinophilia cytoplasm and pyknotic nuclei of acinar cells and almost missing of their lumina. Although there is no detected the presence of inflammatory cells, other authors revealed that inflammation may be occurred during organogenesis of the lymphopoietic-hematopoietic system, based on hematopoietic cell-mesenchymal cell interactions [21].

The presence of zymogen granules in the acinar cells has been reported by Conklin [22] and Laitio et al. [23] in human fetal pancreas. Tadokoro et al. [24] reported the presence of increased number and density of zymogen granules before birth in rats. Inagaki et al. [25] mentioned that the secretory granules are responsible for stored zymogen granucles and secretion of lipase, trypsin, and amylase in fetal acinar cells. Rough endoplasmic reticulum and the Golgi apparatus are involved in synthesis of zymogen granule in the adult [26].

At ultrastructure level, the observed findings reported a detected missing of the secretory granules and increased network of endoplasmic reticulum surrounding the apoptic nuclei forming the fibrotic structure. Lipid vacuoles of varying sizes were distributed in the cytoplasm. Also, atrophied mitochondria with damaging internal structure were observed in comparison with the control.

Similar findings of reduced secretory granules were reported in E2F1/E2F2 compound-mutant mice develop non-autoimmune insulin-deficient diabetes [27].

Diabetes may involvein gene defects leads to pancreatic lipomatosis and exocrine pancreatic insufficiency in childhood, and progressed till 34 years [28]. The observed damage of both mitochondria and rough endoplasmic reticulum facilitated accumulation misfolding protein with intracellular and extracellular aggregation exerting a cytotoxic effect and caused progression of disease of the islets of Langerhans [29].

The apparent reduction and number of mitochondria and deposition of fat vacuoles reflected the depletion of energy level of acinar cells and consequently loss of pancreatic function.

Similar findings were reported by Kaido et al. [30] in a murine model of primary carnitine deficiency.

Also, the present study reported the development of congenital malformation of acute pancreatitis in fetuses of diabetic mother. Damaging of the acinar cells led to depletion of the majority of enzymes needed for digestion.

Pin et al. [31] reported that the acinar cells of the exocrine pancreas is responsible for the development of up >90% of the cells within the pancreas especially β cells. The conversion of acinar cells to either β cells involves alterations in the expression and activity of the transcription factor, and changes in their epigenetic program.

For my opinion in utero poor control of diabetes associated damage of the exocrine pancreas may be increased cell programming and increased the risk susceptibility for the developmental origin of diabetes during adult hood.

At the same time supplementation of ginger to diabetic mother ameliorated the structural pattern of the acinar cells, partially restoring the secretory granules and cell cytoskeletal structure.

Ginger was found to contain several bio components such as gingerol [9] and shogaols and zingerone [10] which improve hyperglycaemia and resoluted oxidative stress and inflammation. This led to decrease the programming of cell death and managing cell growth and differentiation [11,14, 15] .

The authors finally concluded that ginger supplementation during pregnancy may help to improve the antioxidant activity of the pancreatic cells and sustained growth and differentiation against the cytotoxicity of diabetes.

References

  1. Edlund H (2001) Developmental biology of the pancreas. Diabetes 50: 5–9.
  2. Zhou Q, Melton DA (2018) Pancreas regeneration. Nature 557: 351–358.
  3. Zhou Q, Law AC, Rajagopal J, Anderson WJ and Gray PA et al (2007) A multipotent progenitor domain guides pancreatic organogenesis. Dev Cell 13:103–14.
  4. Fajans SS, Bell GI, Polonsky KS (2001) Molecular mechanisms and clinical pathophysiology of maturity-onset diabetes of the young. N Engl J Med 345:971–980.
  5. Bhattamisra SK, Siang TC, Rong CY, Annan NC, Sean EHY et al (2019) Type-3c Diabetes Mellitus, Diabetes of Exocrine Pancreas – An Update. Curr Diabetes Rev.
  6. Talukdar R, Reddy DN (2017) Pancreatic Exocrine Insufficiency in Type 1 and 2 Diabetes: Therapeutic Implications. J Assoc Physicians India 65: 64–70.
  7. Bonnet-Serrano F, Diedisheim M, Mallone R, Larger E (2018) Decreased α-cell mass and early structural alterations of the exocrine pancreas in patients with type 1 diabetes: An analysis based on the nPOD repository. PLoS One 13: 0191528.
  8. Wynne K, Devereaux B, Dornhorst A (2019) Diabetes of the exocrine pancreas. J GastroenterolHepatol 34: 346–354.
  9. Kaul PN, Joshi BS (2001) Alternative medicine: Herbal drugs and their critical appraisal-part II. Prog Drug Res 57:1–75.
  10. Shukla Y, Singh M (2007) Cancer preventive properties of ginger: a brief review. Food ChemToxicol 45:683–690.
  11. Suk S, Kwon GT, Lee E, Jang WJ, Yang H et al (2017) Gingerenone A, a polyphenol present in ginger, suppresses obesity and adipose tissue inflammation in high-fat diet-fed mice. MolNutr Food Res 61.
  12. Wang J, Ke W, Bao R, Hu X, Chen F (2017) Beneficial effects of ginger Zingiberofficinale Roscoe on obesity and metabolic syndrome: a review. Ann N Y Acad Sci 1398: 83–98.
  13. Wang Y, Yu H, Zhang X, Feng Q, Guo X et al (2017) Evaluation of daily ginger consumption for the prevention of chronic diseases in adults: A cross-sectional study. Nutrition 36: 79–84.
  14. Ilkhanizadeh B, Shirpoor A, Khadem Ansari MH, Nemati S, Rasmi Y (2016) Protective effects of ginger (Zingiberofficinale) extract against diabetes-induced heart abnormality in rats. DiabetesMetab J 40: 46–53.
  15. de Las Heras N, Valero-Muñoz M, Martín-Fernández B, Ballesteros S, López-Farré A (2017) Molecular factors involved in the hypolipidemic- and insulin-sensitizing effects of a ginger (Zingiberofficinale Roscoe) extract in rats fed a high-fat diet. ApplPhysiolNutrMetab 42: 209–215.
  16. Ghasemi A, Khalifi S, Jedi S (2014) Streptozotocin-nicotinamide-induced rat model of type 2 diabetes. ActaPhysiol Hung 10: 408–20.
  17. Deeg R, Ziegenhorn J (1983) Kinetic enzymic method for automated determination of total cholesterol in serum. ClinChem 29: 1798–1802.
  18. Fossati P, Prencipe L (1982) Serum triglycerides determined colorimetrically with an enzyme that proceduces hydrogen peroxide. ClinChem 28: 2077–2080.
  19. Grove TH (1979) Effect of reagent PH on determination of the high-density lipoprotein cholesterol by precipitation with sodium phototungestate-magnesium. ClinChem 25: 560–564.
  20. Friedewald WT, Levy RI, Fredrickson DS (1972) Estimation of low density lipoprotein cholesterol in plasma without use preparative ultracentri-fuge. ClinChem 18: 499–502.
  21. Nishikawa SI, Hashi H, Honda K, Fraser S, Yoshida H (2000). Inflammation, a prototype for organogenesis of the lymphopoietic/hematopoietic system. CurrOpinImmunol 12: 342–345.
  22. Conklin JL (1962). Cytogenesis of the human fetal pancreas, Am J Anat 111: 181–193.
  23. Laitio M, Lev R, Orlic D (1974) The developing human fetal pancreas: An ultrastructural and histochemical study with special reference to exocrine cells. J Anat 117: 619–634.
  24. Tadokoro H, Takase M, Nobukawa B (2011) Development and congenital anomalies of the pancreas. Anat Res Int Article ID 351217: 7.
  25. Inagaki T, Tajiri T, Tate G, Kunimura T, Morohoshi T (2012). Dynamic morphologic change and differentiation from fetal to mature pancreaticacinar cells in rats. J Nippon Med Sch 79: 335–42.
  26. Caro LG, Palade GE (1964) Protein synthesis, storage, and discharge in the pancreatic exocrine cell: an autoradiographic study. J Cell Biol 20: 473–495.
  27. Iglesias A, Murga M, Laresgoiti U, Skoudy A, Bernales I et al (2004) Diabetes and exocrine pancreatic insufficiency in E2F1/E2F2 double-mutant mice. J Clin Invest 113: 1398–1407.
  28. Raeder H, Johansson S, Holm PI et al (2005) Mutations in the CEL VNTR cause a syndrome of diabetes and pancreatic exocrine dysfunction. Nat Genet 38: 54–62.
  29. Johansson BB, Torsvik J, Bjørkhaug L et al (2011) Diabetes and pancreatic exocrine dysfunction due to mutations in the carboxyl ester lipase gene-maturity onset diabetes of the young (CEL-MODY): a protein misfolding disease. J BiolChem 286: 34593–34605.
  30. Kaido M, Fujimura H, Ono A, Toyooka K, Yoshikawa H (1997) Mitochondrial abnormalities in a murine model of primary carnitine deficiency. Systemic pathology and trial of replacement therapy. EurNeurol 38: 302–9.
  31. Pin CL, Ryan JF, Mehmood R. (2015) Acinar cell reprogramming: a clinically important target in pancreatic disease. Epigenomics 7: 267–81.

Diabetes related cataract and histopathological abnormalities of the ocular regions of Wister albino rats

DOI: 10.31038/EDMJ.2019334

Abstract

Objective: Diabetes is an important public health disease affected different body organs especially eye. The present study aimed to illustrate the cataractous lenses associated complication on ocular organs.

Research design and methods: Following induction of type 2 diabetes for 6 months (streptozotocin 60mg/kg single dose in combination with nicotinamide100 mg./kg body weight), 6 rats of a colony of 47 individuals developed cataract. Control individuals were used of the similar age. The animals groups were anaesthetized and sacrificed. Ocular regions were incised and subjected for histopathology and comet assay. Transmission electron microscopy was carried out for the optic nerve. In case of meibomian gland, beside histopathological investigations, immunohistochemistry of bcl2, caspase 3 and p53 were carried out.

Results: The present findings revealed the development of cataractous lenses, diabetic retinopathy, thickened cornea and damaged stroma and optic neuropathy explained by demyelinated axons. Single gel electrophoresis explained DNA damage of cells of the retina, ciliary organ and optic nerve. Also, there is a marked reduction of the immunohistochemistry of bcl2, caspase 3 and p53 of diabetic meibomian gland, reflecting cell death.

Conclusion: Finally the authors concluded that the cataractous lenses originated through different pathways of diabetic complication.

Introduction

The Diabetes Mellitus (DM) is characterized by hyperglycemia associated with either decreased insulin production in the body or insulin resistance. It is increased among population reached up to 382 million in 2014 [1] and by 2035 more than 592 million may develop with the disease in a ratio of 1 per 10 individual become diabetic [2]. The disease resulted from impairing of β-cell function, hyperglycaemia and impairment of insulin secretion [3].

Poor diabetic-treatment resulted in impairment of visual acuity [4] and the development of cataract in child hood [5, 6]. Cataractous lenses were also reported in diabetic experimental animal [7]. Diabetic related cataract was associated with damaging corneal endothelial cells and increase foveal thickness [8]. Also, diabetic was found to induce retinopathy [9, 10] and represent the main cause of impaired visual acuity and blindness associated with elevated serum homocysteine level Hcy [11]. Also, it is involved in reduction of both retinal thickness and retinal blood flow, and increased thickening of the retinal choriocapillaries [12]. The disease increased retinal apoptosis, overexpression of VEGF and increased oxidative stress [13, 14] and altered osmoregulation leading to acidic retina [15]. Middle-aged, obese rhesus monkeys, developed diabetes mellitus characterized by hypertension, high levels of triglycerides and serum cholesterol. The disease associated with intraretinal hemorrhages, damage choriocapillaries, increased basal laminar deposits and hard drusen of Bruch’s membrane and numerical reduction of photoreceptor inner and outer segments [16]. Diabetic retinopathy characterized by up-regulation of pro-inflammatory interleukin-6 and down-regulation of superoxide dismutase and glutathione (GSH)/oxidized glutathione associated with numerical reduction of retinal ganglion cells and increased glial fibrillary acidic protein expression level [17–18].

Concerning cornea which is the transparent organ important for vision. Diabetes caused marked degeneration of corneal secondary nerve fiber branches [19, 20] and enhanced the development of anterior segment disorders such as corneal erosion and ulcer and persistent epithelial defects [21]. There is discrepancy between authors concerning diabetic interference on corneal thickness. Meanwhile Olsen and Busted (1981) [22] reported increased corneal thickness in diabetic patients, Hashemi et al. (2019) [23] reported no variations of corneal thickness between diabetic and non diabetic individuals. Diabetic keratopathy resulted in reduction of corneal sensitivity [24].

The ocular region guards by eye lid containing glands such as the meibomian glands (MGs) which are arranged in parallel strands within the tarsal plates of the eyelids. It secrete oily meibum by meibocytes and transported through the ductal system by ductule and the central duct towards the free lid margin. The gland possesses a characteristic innervations from sympathetic and parasympathetic fibers [25, 26]. The meibum lubricating the ocular surface during blinking and protecting against tear evaporation [27].

Diabetes was found to induced meibomian gland dysfunction [28, 29] leading to depletion of the lipid secretion associated the instability of tear and development of dry eye disease [27, 30].

Little is known about the diabetes related changes on the histopathological structure of the meibomian glands. Recently, a study from Ding et al. demonstrated that insulin stimulated the proliferation of immortalized human meibomian gland epithelial cells (HMGECs), whereas high glucose was found to be toxic for HMGECs [31]. Diabetes was found to reduce the number of glandular structure impairing its functional activity [32]. Also, diabetes was found to be involved in increase of ciliary body thickness [33] and reduction of both retinal nerve fiber layer and vessel density in the optic disc [34].

The present studies searched for illustrating if the opacity associated with other complication of the eye regions or not and the characteristic features of the histopathological alterations.

Materials and Methods

1. Induction of diabetes

Experimental type 2 diabetes mellitus was induced in all the rats by a single interperitoneal injection of streptozotocin (60 mg/kg) in citrate buffer (0.05 M) (pH 4.5) and 100mg/kg ncotinamide [35]. Hyperglycemia was verified by measuring the blood glucose within 240- 280 mg/dl were selected for the study.

2. Experimental animals

Following investigating a colony of 47 individual diabetic rats (Rattusnorvegicus) after 8 months of streptozotocin-induction and weighing approximately 200–250g body weight, 6 rats exhibiting cataractous lenses either unilateral (4/6) or bilateral (2/6). Control healthy individuals (n = 6) were selected. They were housed in good ventilation on a 12-h light and dark cycle. The studied cataractous rats were observed in about 47 individual diabetic rats after 6 months of induction the disease reaching incidence of about 13%. The cataractous group was separated and a similar control non-diabetic group was also selected. Free excess water and food were allowed ad Libitum. The studied groups were sacrificed by light diethyl ether anesthesia and dissected and ocular region, upper eye lid and optic nerves were separated and processed for the following investigations.

3. Histological investigation

Retina, cornea, proximal optic nerve, ciliary organ and upper eye lid of the studied groups were separated and immediately fixed in 10% phosphate buffered formalin (pH 7.4), dehydrated in ascending grades of ethyl alcohol, cleared in xylene and mounted in molten paraplast at 58–62ºC. Five μm histological sections were stained with hematoxylin & eosin and investigated under a bright field light microscope.

4. Immunohistochemistry for caspase 3

Histological 5 μm thick sections of upper eye lid were cut and mounted onto super frost plus glass slides (Fisher Thermo Scientific, Nepean, Ontario, Canada). The tissue sections were retained at normal room temperature and processed for antigen retrieval by digestion in 0.05 % trypsin (pH 7.8) for 15 min at 37°C and incubated with antibodies against bcl2, caspase 3 and P53 (dilution 1:100 Thermo Fisher Scientific, Fremont, CA, USA; Cat. No. A1–70007) for overnight at 4°C. Then treated with a horseradish peroxidase streptavidin detection system (Dako), followed with DAB plus Chromagen to detect the immunoactivity by counterstaining with hematoxylin (Sigma). Sections incubated with 1% non-immune serum phosphate buffer solution (PBS) solution served as negative controls. Specimens were observed with a Leica BM5000 microscope (Leica Microsystems, Wetzlar, Germany) and photographed. For assessments of the percentages of positive immunoreactive areas were determined by investigating slides using Olympus® digital camera installed on Olympus® microscope with 1/2 X photo adaptor, using 40 X objective. The result images were analyzed on Intel® Core I5® based computer using Video Test Morphology® software (Russia) with a specific built-in routine for area, % area measurement and object counting.

5. Transmission electron microscopy

Specimen of proximal optic nerve close to the retina of the studied groups were immediately fixed in 0.1M cacodylate buffer (pH 7.4) containing 2.5 % glutaraldehyde) and post-fixed in 1 % osmium tetraoxide, dehydrated in ascending grades of ethyl alcohol, and embedded in epoxy–resin. Ultrathin sections were cut with a diamond knife on a LKB Ultratome IV (LKB Instruments, Bromma, Sweden) and mounted on grids, stained with uranyl acetate and lead citrate, and examined under a Joel 100CX transmission electron microscope (Musashino 3-chome, Akishima, Tokyo 196–8558, Japan).

6. Comet assay

Retina, cornea, optic nerve, ciliary organ specimens of the studied groups were homogenized in chilled homogenizer buffer, pH 7.5, containing 75 mMNaCl and 24 mM Na2 ethylenediaminetetraacetic acid (EDTA), pH 13. Six µL of the homogenate were suspended on 0.5% low melting agarose and sandwiched between a layer of 0.6% normal-melting agarose and another of 0.5% low melting agarose on fully frosted slides and kept on ice for the polymerization. The slides were the immersed in a lysis solution (1% sodium surcosinate, 2.5 M NaCl, 100 mM Na2EDTA, 10 mm Tris-HCl, 1% Triton X-100, and 10% DMSO) at 4°C. After 1 h, they were placed in electrophoresis buffer (0.3 M NaOH, 1 mM Na2EDTA, pH 13) for 10 min at 37 oC to allow DNA to unwind. Electrophoresis was carried out for 10 min at 300 mA and 1 V/cm, followed by staining with 20 mg/mL ethidium bromide. Each slide was analyzed using a Leitz Orthoplan (Wetzlar, Germany) epifluorescence microscope. One hundred cells were analyzed on each slide using the Comet assay II automatic digital analysis system. Perspective tail length (mm) is the distance of DNA migration from the center of the body of the nuclear core and is used to evaluate the extent of DNA damage. Tail length was measured automatically by image analysis software [36].

7. Statistical analysis

Data are presented as means ± standard deviation (SD). The statistical analysis was performed with multi-variant analysis of variance (MANOVA) using the SPSS (version 13) software package for Windows, comparing the multivariations between diabetes and control groups. Significance was determined at p < 0.05.

Results

1. Cornea & Retina

The cornea is composed of outer lining epithelium, followed by Bowman’s membrane, stroma, descemet’s membrane and corneal endothelium. Regard to the control (Fig. 1A), the diabetic group revealed that the corneal epithelium was comparatively thickened with vesicular vacuolar degenerated nuclei. The stroma showed patches of hyaline degenerated collagenous fibrils and infiltrated by necrotic regions. Vacuolated keratocytes were detected in between the collagen fibrils of the stroma. The corneal endothelium lining the descemet’s membrane attained considerable thickening (Fig. 1A1).

EDMJ 2019-115 - El-Sayyad Egypt_F1

Figure 1. Photomicrographs of cross histological sections of cornea (A&A1) and retina (B&B1). A. Control showing normal epithelium, basement membrane, stroma and endothelium. B. Diabetic showing thickened epithelium, damaged stroma and thickened endothelium. B. Control retina showing arranged ganglion, inner plexiform, inner nuclear, outer plexiform, outer nuclear and photoreceptor layers. B1. Diabetic retina showing damaged ganglion, thinning inner nuclear (arrow head), damaged outer nuclear (star) and atrophied photoreceptor(arrow) C & A1. Comet assay of control (single star)(C) and cataractous (double star) (C1) retina showing detached retinal cells of diabetic group. Abbreviations; E, endothelium;BM, basement membrane; IPL, inner plexiform layer; ILM, inner limiting membrane; INL, inner nuclear layer; NFL, nerve fiber layer; OPL, outer plexiform layer; ONL, outer nuclear layer; PR, photoreceptor; Pg, pigmented cell; St, stroma.

Regarding to the normal structure of the retina (Fig, 1B ), the diabetic group showed comparative reduction of the retinal thickness. There was comparative numerical reduction of the inner and outer nuclear cells. The nuclei of these cell layer were electron-dese manifesting clumping of the nuclear chromatin. The photoreceptor layer was comparatively atrophied. The ganglion cells were markedly missing and the nerve fiber become thin, fragile and vacuolated (Fig.1B1). Diabetic retina showed detached retinal cells manifesting damaged DNa (Fig. 1C1) compared to non-changed in control (Fig.1C). The whole retina, inner and outer nuclear layer and photoreceptors attained considerable reduction in diabetic group in comparison with the control (Fig. 2).

EDMJ 2019-115 - El-Sayyad Egypt_F2

Figure 2. Chart illustrated retinal layer thickness of diabetic group. Abbreviations; GL, gamglion layer; INL, inner nuclear layer; ONL, outer nuclear layer; PR, photoreceptor; R, retina. each result represent mean ±SD (n-5). Diabetic retina and photoreceptor thickness are significant in diabetic group at P < 0.05.

2. Ciliary organ and optic nerve

The ciliary body occupied the interface between the iris and the choroids. It is made up of two ring-shaped components: the pars plicata and the pars plana. The parsplicata detected in the anterior region of the ciliary body, at the scleral spur. The ciliary body composed of branched ciliary processes. It is lined by two layers of columnar cells. The outer one is pigmented, mean while the inner lining cells lack pigmentation. The lumen is enclosed with fine collagenous network (Fig. 3 A). Following application of comet assay the control ciliary cells are round (Fig.3A1).

EDMJ 2019-115 - El-Sayyad Egypt_F3

Figure 3A-B1. Photomicrographs of histological sections of ciliary organ. A. Control showing branched ciliary organ. A1. Comet assay of control showing normal round cells (single star). B&B1. Diabetic rat showing atrophied ciliary organ (B) with detached damaged cells post comet assay (double star) (B1).

Figure 2C-C1. Photomicrographs of histological sections of control optic nerve showing attachement with retina in optic disc and compacted axons and contents of neuronal cells(dark arrow head).C2. Transmission electron micrographs of control showing compacted myelinated axons. C3. Comet assay of control showing round cells (Single star). D-D2 Diabetic group showing fragile histological section and vacuolated neurons (white arrow head) (D) and demyelinated electron micrograph (D1) and detached neuronal cells of optic nerve after comet assay (D2). Abbreviations; C, connective tissue; CE, ciliary epithelium; DCE, damaged ciliary epithelium; DMA, degenerated mitochondrial axons.LI, lymphocytic infiltration; M, mitochondria; MA, mitochondrial axons;

Experimental diabetic group revealed missing of the ciliary processes and comparative thinning of their lining epithelium. Congestion of their blood capillaries, widened lumen and distortion of their collagenous network were observed (Fig. 3B). Following single gel electrophoresis (comet assay), revealed DNA segregation assessed by formation of detached tail region manifested DNA damage (Fig. 3B1).

Optic nerve

Concerning the optic nerve, light microscopically, these are formed of densely aggregated and enclosed in-between cells with basophilic nuclei suspected the oligodendrocytes and astrocytes (Figs. 3 C&C1). Ultrastructurally, the nerve axons are densely packed and composed of myelinated and non-myelinated axons of varying small size. The axon enclosed by several layers of myelin sheath. Abundant mitochondria are distributed the cytoplasm of the inner compartment of the axons (Fig.3 C2).

Diabetic–treatment revealed widespread of vacuoles and fragility of the nerve fibers, and comparative reduction of the oligodendrocytes. Many of them possessed vacuolated axoplasm (Fig. 3D). Ultrastructurally, vacuolation and demyelination of the theaxonal sheath were detected (Fig. 3 D1). Following application comet assay, there was apparent increase of apoptic cells with detached tail region (Fig.3D2) compared to non-changed in control (Fig.3C3).

3. Meibomian gland

In control, the meibomian gland consisted of numerous branched acini that opened into a central duct through short ductules. Each acinus consisted of a basal layer of flattened cells. The central duct was lined by stratified squamous epithelium (Figs.4A1-A3).

EDMJ 2019-115 - El-Sayyad Egypt_F4

Figure 4. A, Photomacrograph of normal (A) and diabetic cataract (B).A1-A3. Photomicroph of histological sections of control meibomian gland showing normal branched acinar gland. B1-B3. Diabetic rat showing atrophied and degenerated meibomian gland (B1&B2) and degenerated germinativum of epidermis (B3) illustrated by arrow head. Abbreviations; DHf, degenerated hair follicle ; DMG, damaged meibomian gland; E, epidermis; HF, hair follicle ; MG, meibomian gland.HE

In diabetic group, the gland exhibiteda considerable atrophy and degeneration of the acinar cells (Figs. 4B1-B3).

Following immunohistochemical investigations, bcl2 revealed marked depletion of the immunostaining reaction in the gland of diabetic rats compared to the increased expression in the control (Fig.5A&B). On the other hand both caspase 3 and P53 were over expressed in those of diabetic mother manifesting cell death (Figs. 5) in comparison with the control (Figs. 5A1, A2, B1 &B2). Image analysis revealed decreased bcl2 and increased both caspase 3 and p53 active area of immunohistochemical reaction those of diabetic mothers in comparison with the control (Fig.6).

EDMJ 2019-115 - El-Sayyad Egypt_F5

Figure 5. Photomicrographs of formalin fixed histological sections of meibomian glands immunohistochemical stained with Bcl2(A&B), Caspase 3 (A1 &B1) and P53 (A2 &B2). Note decreased expression of Bcl2 (B), increased expression of caspase 3( B1) and overexpression of p53 (B2) in diabetic group compared to control (A-A2). Arrow head pointed to the immunostaining activity.

EDMJ 2019-115 - El-Sayyad Egypt_F6

Figure 6. Chart illustrating of the image analysis of percentages immunoreactive area of diabetic group in comparison with the control. Each result represent the mean SD (n = 5). Diabetic is significant at P < 0.05.

Discussion

The diabetes mellitus (DM) is a public health problem widely increased among population. The present findings revealed induction of cataractous lenses of 6/47 individuals with about 13%.

The present findings agree with the work of El-Sayyad et al. [37–39], Becker et al. [5] and Wu et al. [6] in human and El-Sayyad et al. [37] and Miller and Brines [7] in experimental animals.

Development of cataractous lenses in diabetic patients was found to result from damaging of lens epithelium [37, 40] associated with releasing of free radicals and reduction of the capacity of both antioxidant enzymes and aldose reductase [39, 41] altering glucose metabolism and accumulation of sorbitol enhanced cell damage and development of cataract [39, 42, 43].

Also, diabetic cataract was found to be associated with corneal damage assessed by thickened epithelial lining layer, necrotic stromal patches and thickened endothelium.

The present findings supported the work of Olsen and Busted [22] and Hashemi et al. [23] that reported increased corneal thickness in diabetic patients. Diabetic keratopathy was also, mentioned by Bikbova et al. [24] which impaired the corneal sensitivity. Alterations of diabetic cornea may contribute to damage of the corneal nerve fibers [20, 44] and progress the development of anterior segment disorders [21] resulting in impairing the vision.

Also, the diabetic retina attained a comparatively reduced thickness; numerical reduction of inner and outer nuclear cells and atrophied photoreceptors coincides with increased detached retinal cells manifested DNA damage.

The observed diabetic retinopathy supported the work of El-Sayyad et al. [37], Kim and Yu [33], Yao et al. [12] and Li et al [10]. The authors mentioned that the retinopathy impaired the visual acuity and the development of blindness. Diabetic retinopathy related to blindness affected about 800 cases each year [45].

At the same time, the detected atrophy and damaged photoreceptors supported the work of Johnson et al. [16] and El-Sayyad et al. [37].

Diabetic retinopathy was found to exhibit over expression of inflammatory markers, down-regulation of antioxidant enzymes associated with increased retinal cell death [13, 14, 17].

The present data revealed that diabetes caused abnormal non-branched biliary processes and reduced thickness of their lining epithelium parallel with single strand DNA damage. The present findings agree with [33] following investigating diabetic patients.

Ciliary organ is important for contraction and relaxation of lens allowing it for accommodation. Damage of ciliary epithelium and defect of collagenous fibrils of the ciliary lumina interfered with retinal dystrophies [46].

The present findings revealed neuropathy of optic nerve of diabetic rat assessed by fragility and degeneration of nerve fibers, demyelinated axons and decrease of neuronal cells coincides with single strand DNA damage of astrocytes. Similar findings of optic neuropathy were detected in aging rats which exhibited similar diabetic deterioration of the neuronal cells [47].

Diabetes associated microvascular abnormalities may facilitate the progress of ischemia of the anterior optic nerve [48].

On the other hand the meibomian glands are important for ocular function through secretion of oily meibum which lubricate the ocular surfaces and protecting against tear evaporation [49].

The present findings revealed that diabetes induced atrophy and degeneration of meibomian glands. Following immunohistochemical staining, decreased expression of bcl2 and overexpression of caspase3 and p53, the markers of cell death were detected.

Similar findings of diabetes associated meibomian gland dysfunction were reported [28, 31, 32]. Decreased lipid secretion was found to be associated with the instability of tear and progress of dry eye disease [27, 30].

Finally the authors concluded that the cataractous lenses originated through different pathways of diabetic complication.

References

  1. Wild S, Roglic G, Green A, Sicree R, King H (2004) Global prevalence of diabetes: estimates for the year 2000 and projections for 2030. Diabetes Care 27: 1047–53.
  2. Aguiree F, Brown A, Cho NH, Dahlquist G, Dodd S et al. C (2013) IDF Diabetes Atlas.
  3. Al-Goblan AS, Al-Alfi MA, Khan MZ (2014) Mechanism linking diabetes mellitus and obesity. Diabetes MetabSyndrObes 7: 587–91.
  4. Kalra S,  Singh RR (2018) Visual acuity assessment in diabetes. J Pak Med Assoc 68: 1407–1409.
  5. Becker C,  Schneider C,  Aballéa S,  Bailey C,  Bourne R et al. (2018) Cataract in patients with diabetes mellitus-incidence rates in the UK and risk factors. Eye (Lond) 32: 1028–1035.
  6. Wu J,  Zeng H,  Xuan R,  Lei S,  Li J et al (2018) Bilateral cataracts as the first manifestation of type 1 diabetes mellitus: A case report. Medicine (Baltimore) 97: 12874.
  7. Miller EJ,  Brines CM (2018) Canine Diabetes Mellitus Associated Ocular Disease. Top Companion Anim Med 33: 29–34.
  8. Chen Z,  Song F,  Sun L,  Zhao C,  Gao N et al (2018) Corneal integrity and thickness of central fovea after phacoemulsification surgery in diabetic and nondiabetic cataract patients. Arch Med Sci 14: 818–825.
  9. Kim C,  Yu HG (2012) Changes in ciliary body thickness in patients with diabetic macular edema after vitrectomy. Retina 32: 1316–23.
  10. Li Z,  Alzogool M,  Xiao J,  Zhang S,  Zeng P et al. (2018) Optical coherence tomography angiography findings of neurovascular changes in type 2 diabetes mellitus patients without clinical diabetic retinopathy. ActaDiabetol 55: 1075–1082.
  11. Tawfik A,  Mohamed R,  Elsherbiny NM,  DeAngelis MM,  Bartoli M et al (2019) Homocysteine: A potential biomarker for diabetic retinopathy. J Clin Med 8: 121.
  12. Li Q, Yang Y, Lu X, Zhang Q, Luo M et al (2018) Lycium Barbarum Polysaccharides improve retinopathy in diabetic Sprague-Dawley rats. Evid Based Complement Alternat Med 2018: 7943212.
  13. Amato R, Rossino MG, Cammalleri M, Locri F, Pucci L et al (2018) Protects the retina from neurovascular damage in experimental diabetic retinopathy. Nutrients 10: 1932.
  14. Ola MS, Alhomida AS, LaNoue KF (2019) Gabapentin attenuates oxidative stress and apoptosis in the diabetic rat retina. Neurotox Res.
  15. Dmitriev AV,  Henderson D,  Linsenmeier RA (2019) Diabetes  alters pH control in rat retina. Invest Ophthalmol Vis Sci 60: 723–730.
  16. Johnson MA,  Lutty GA,  McLeod DS,  Otsuji T,  Flower RW et al (2005) Ocular structure and function in an aged monkey with spontaneous diabetes mellitus. Exp Eye Res 80: 37–42.
  17. Ren C,  Wu H, Li D,  Yang Y,  Gao Y et al. (2018) Remote Ischemic Conditioning Protects Diabetic Retinopathy in Streptozotocin-induced Diabetic Rats via Anti-Inflammation and Antioxidation. Aging Dis 9: 1122–1133.
  18. Yang F, Yu J, Ke F,  Lan M,  Li D et al (2018) Curcumin alleviates diabetic retinopathy in experimental diabetic rats. Ophthalmic Res 60: 43–54.
  19. Lagali NS, Allgeier S, Guimarães P, Badian RA, Ruggeri A et al (2017) Reduced corneal nerve fiber density in type 2 diabetes by wide-area Mosaic analysis. Invest Ophthalmol Vis Sci 58: 6318–6327.
  20. Bikbov MM,  Surkova VK (2019) Prognostic value of changes in the cornea and conjunctiva in diabetes mellitus. VestnOftalmol 135: 90–97.
  21. Han SB,  Yang HK,  Hyon JY (2018) Influence of diabetes mellitus on anterior segment of the eye. ClinInterv Aging 14: 53–63.
  22. Olsen T, Busted N (1981) Corneal thickness in eyes with diabetic and non diabetic neovascularisation. Br J Ophthalmol 65: 691–3.
  23. Hashemi H,  Asgari S,  Mehravaran S,  Emamian MH,  Fotouhi A (2019) Five-Year Changes of Anterior Corneal Indices in Diabetics versus Non-Diabetics: The Shahroud Eye Cohort Study. Curr Eye Res 44: 30–33.
  24. Bikbova G,  Oshitari T,  Baba T,  Bikbov M,  Yamamoto S (2018) Diabetic corneal neuropathy: clinical perspectives. ClinOphthalmol 12: 981–987.
  25. Knop N, Knop E (2009) Meibomian glands. Part I: anatomy, embryology and histology of the Meibomian glands. Ophthalmologe 106: 872–83.
  26. Bolekova A, Kluchova D, Tomasova L, Hvizdosova N (2012) Effect of retinoic acidon the nitrergic innervations of Meibomian glands in rats. Eur J Histochem 56: 50.
  27. Knop E, Knop N, Millar T, Obata H, Sullivan DA (2011) The international workshop on meibomian gland dysfunction: report of the subcommittee on anatomy, physiology, and pathophysiology of the meibomian gland. Invest Ophthalmol Vis Sci 52: 1938–1978.
  28. Seirafi H, Farsinejad K, Firooz A,  Davoudi SM, Robati RM et al (2009) Biophysical characteristics of skin in diabetes: a controlled study. J EurAcadDermatolVenereol 23:146–149.
  29. Shamsheer RP, Arunachalam C (2015) A Clinical Study of Meibomian Gland Dysfunction in Patients with Diabetes. Middle East Afr J Ophthalmol 22: 462–6.
  30. Baudouin C, Aragona P, Messmer EM,  Tomlinson A, Calonge M et al. (2013)  Role of hyperosmolarity in the pathogenesis and management of dry eye disease: proceedings of the OCEAN group meeting. Ocul Surf 11: 246–58.
  31. Ding J, Liu Y, Sullivan D (2015) Effects of insulin and high glucose on human meibomian gland epithelial cells. Invest Ophthalmol Vis Sci 56: 7814–7820.
  32. Lin X, Xu B, Zheng Y, Coursey TG, Zhao Y et al (2017) Meibomian Gland Dysfunction in Type 2 Diabetic Patients. J Ophthalmol 2017: 3047867.
  33. Kim C, Yu HG (2012) Changes in ciliary body thickness in patients with diabetic macular edema after vitrectomy. Retina 32: 1316–23.
  34. Cao D, Yang D, Yu H, Xie J, Zeng Y et al (2019) Optic nerve head perfusion changes preceding peripapillary retinal nerve fibre layer thinning in preclinical diabetic retinopathy. ClinExpOphthalmol 47: 219–225.
  35. Ghasemi A,  Khalifi S,  Jedi S (2014) Streptozotocin-nicotinamide-induced rat model of type 2 diabetes. ActaPhysiol Hung 101:408–20.
  36. Sasaki YF, Saga A, Akasaka M, Yoshida K, Nishidate E et al (1997) In vivo genotoxicity of ortho-phenylphenol, biphenyl, and thiabendazole detected in multiple mouse organs by the alkaline single cell gel electrophoresis assay. Mutat Res 395:189–98.
  37. El-Sayyad HIH, El-Sherbiny M, Sobh MA, Abou-El-Naga AM, Ibrahim MAN et al. (2011) Protective effects of Morus alba leaves extract on ocular functions of pups from diabetic and hypercholesterolemic mother rats. Int.JBiolSci 7: 715–728.
  38. El-Sayyad HIH, Bakr EHM, El-Ghawet HA, El-Desoky TMG (2015) Overview of congenital, senile and metabolic cataract J Ocular Biol 3: 12.
  39. El-Sayyad HI, Tag-Eldin YM, Khalifa SA, Abd- El-Wahab AA, El-Desoky TMG (2017) Biochemical and molecular markers of congenital and senile cataractous lenses. J MolBiomarkDiagn 8: 318.
  40. Tkachov SI, Lautenschlager C, Ehrich D, Struck HG (2006) Changes in the lens epithelium with respect to cataractogenesis: light microscopic and Scheimpflug densitometric analysis of the cataractous and the clear lens of diabetics and non- diabetics. Graefes Arch ClinExpOphthalmol 244: 596–602.
  41. Hashim Z, Zarina S (2012) Osmotic stress induced oxidative damage: possible mechanism of cataract formation in diabetes. J Diabetes Complications 26: 275–279.
  42. Kador PF, Lee JW, Fujisawa S, Blessing K, Lou MF (2000) Relative importance of aldose reductase versus nonenzymatic glycosylation on sugar cataract formation in diabetic rats. J OculPharmacolTher 16: 149–160.
  43. Gupta SK, Selvan VK, Agrarwal SS, Saxena R (2009) Advances in pharmacological strategies for the prevention of cataract development. Indian J Ophthalmol 57: 175–183.
  44. Lagali N, Wowra B, Dobrowolski D, Utheim TP and Fagerholm P et al (2018) Stage-related central corneal epithelial transformation in congenital aniridia-associated keratopathy. Ocul Surf 16: 163–172
  45. NegiA , Vernon SA (2003) An overview of the eye in diabetes. J Royal Soc Med 96: 266–272.
  46. May-Simera H, Nagel-Wolfrum K, Wolfrum U (2017) Cilia – The sensory antennae in the eye. ProgRetin Eye Res 60: 144–180.
  47. El-Sayyad HIH, Khalifa SA, El-Sayyad FI, Al-Gebaly AS, El-Mansy AA et al ( 2014) Aging-related changes of optic nerve of Wistar albino rats. Age (Dordr) 36: 519–32.
  48. Flammer J, Orgül S, Costa VP, Orzalesi N, Krieglstein GK et al (2002) The impact of ocular blood flow in glaucoma. Prog Ret Eye Res 21: 359–393.
  49. Knop E,  Knop N, Millar T, Obata H, Sullivan DA (2011) The international workshop on meibomian gland dysfunction: report of the subcommittee on anatomy, physiology, and pathophysiology of the meibomiangland. Invest Ophthalmol Vis Sci  52: 1938–78.

Building resilience, health, and wellness for undergraduate nursing students beyond Title IX and early alert programs

DOI: 10.31038/AWHC.2019232


Policy Brief: Building resilience, health, and wellness for undergraduate nursing students beyond Title IX and early alert programs.

Issue

Manifestations of stress have serious consequences for nursing professionals beginning with nursing students. [1, 2] One source of stress for baccalaureate nursing students is inappropriate patient sexual behavior (IPSB). [3, 4] Baccalaureate nursing programs have limited response frameworks to provide support to affected students. High levels of stress, regardless of duration or frequency, can affect learning, performance, and retention in nursing programs. [1, 3] Many stressful incidents experienced by nursing students do not meet parameters of existing student support policies, including Title IX or early alert programs since they occur in clinical sites off campus. Repetitive high-stake stressors encountered by nursing students increase risks for deleterious health outcomes. [1–4] Therefore, policy changes at university, state, and federal levels to build resilience, health, and wellness for undergraduate nursing students must be developed and implemented.

Background

Nurses face higher levels of stress with adverse health outcomes compared to other health professions. [2] Stress in nursing has been linked to reduced job satisfaction, increased illness, and poor job performance. [1–4] Furthermore, nursing students who were exposed to more adverse childhood experiences (ACE) showed higher rates of burnout and depression. [5] Developing strong foundations to manage stress early in nursing education may prepare nurses to develop better coping mechanisms, which could subsequently help them to develop healthy habits, decrease attrition rates, and reduce chances of developing stress-related illness later in life [6].

It is well documented that that nursing school can be a stressful experience and that nursing students have more intense stress levels than students studying in other health fields. [4] While there are many sources of stress, one of the more prevalent identified sources in healthcare is inappropriate patient sexual behavior. [3, 4] Johnson and colleagues define IPSB as any “verbal or physical act of an explicit, or perceived sexual nature which is unacceptable within the social context in which it is carried out.” [7]. IPSB encompasses a spectrum of behaviors including: gesturing, giving romantic gifts, making suggestive remarks, propositioning, exposing genitalia, unnecessary touching, with some of the more extreme cases resulting in sexual assault and rape. [8] It is imperative to note that when a patient’s behavior creates a hostile or intimidating work environment for any health care worker, as in its extreme manifestations, IPSB falls under the legal classification of sexual harassment, a form of sex discrimination that violates Title VII of the Civil Rights Act of 1964 [9].

The prevalence of IPSB among the nursing profession is difficult to ascertain due to a paucity of research and a presumption of underreporting. Ranges of reported IPSB in nursing range from 30–90% [10] and the majority of these reported incidents are from female nurses. [11] As nursing is a predominantly female profession, it is logical that female nursing students are a high risk for experiencing IPSB.

When IPSB is recognized as sexual harassment, it can imply patients as adversaries creating a difficult and potentially less effective care environment. Sexual harassment by patients is a significant problem for general healthcare professionals; however, nurses consistently report sexual harassment by their patients more than any other healthcare sector. [8] This is particularly poignant given that we are in the midst of several international campaigns increasing the awareness of sexual assault and harassment. Additionally, the Joint Commission has issued a Sentinel Event Alert on physical and verbal violence against healthcare workers, including sexual harassment, which calls to enforce workplace policies that keep nurses and other healthcare workers safe [12].

The emotional repercussions of sexual harassment include but are not limited to frustration, embarrassment, fear, anxiety, shame, depression, diminished self-esteem, and isolation by the victim. [13] The confusion and self-blame that often accompanies these emotions can then lead to psychological distress. For healthcare providers, inappropriate sexual behavior has been shown to impact ability to function, which can ultimately result in patient avoidance or neglect. [14] This is especially concerning in nursing given the amount of intimate care that we provide. While experienced nurses may have learned over time how to cope with toxic work environments, nursing students may lack the skills to navigate through such patient situations while simultaneously learning how to be a nurse. High levels of stress can affect learning, performance, and retention in nursing programs [1].

Nursing students must attain a unique skill set in their education to establish a foundation of resilience. They must mitigate the negative impact of stressors while managing physical and mental stressors of challenging nursing curricula. Concepts such as resilience, psychological strengthening mental wellness and academic success have been shown to have a pivotal role in the ability to cope with the challenges of nursing education. [15] Cognitive restructuring programs, problem-based learning support from family/friends/faculty, and education programs improving communication have been shown to increase resilience among nursing students [4].

Current Policies

Title IX of the Education Amendments Act of 1972 is a landmark federal law prohibiting sex discrimination in education. This law addresses sexual harassment, gender-based discrimination, and sexual violence. Title IX applies to all programs and related aspects of educational systems. In the 1990s, the U.S. Supreme Court issued three decisions interpreting Title IX to require schools to respond appropriately to reports of sexual harassment and sexual violence against students [9]. Early alert programing supports students and improves student retention in higher education. Some institutions solicit early alerts for social and emotional indicators beyond academic performance, such as drug and alcohol use, personal/family difficulties, and medical/mental health concerns. Early alert systems include any arrangement that provides feedback on a student’s situation – academic, social, or otherwise – allowing early intervention by divisions of academic or student affairs [16].

Closing The Policy Gap

Title IX and early alert systems offer organizational frameworks for identifying and managing specific types of stressors experienced by higher education students. Undergraduate nursing students are exposed to many potentially stressful situations in off-campus clinical settings, including IPSB. This type of incident does not fall within the parameters of Title IX or early alert systems, placing undergraduate nursing students in a vulnerable position that does not encourage a strong foundation of resilience, health and wellness. To address this crucial gap, a support system for undergraduate nursing students must be developed at the institutional level, the accrediting body level, both state and national levels, as well as the curriculum level. The Code Lavender model provides an established and effective framework for delivering emotional support in the clinical setting. Initially intended for patients and families, Code Lavender has evolved into an intervention when challenging situations threaten personal emotional equilibrium of healthcare staff as well. Affected individuals are assisted to meet their immediate responsibilities and process stressful situations through evidence-based relaxation and restoration interventions such as relaxation or breathing exercises, massage therapy, music, Reiki, or other kinds of soothing. [17, 18] Regardless of the specific intervention used, the message conveyed is comfort, caring, support, and restoration. [19] While this framework has been shown to be successful in clinical settings, there is no research demonstrating its effect in educational institutions and more specifically, for undergraduate nursing students. The Code Lavender framework would have the potential to lead to state boards of nursing initiatives to promote psychological first-aid support systems into the accreditation processes for baccalaureate nursing curricula.

References

  1. Puildo-Martos M, Augusto-Landa J, Lopez-Zafara E (2011) Sources of stress in nursing students: a systemic review of quantitative studies. Int Nurs Rev. 59: 15–25.
  2. Roberts RK, Grubb PL (2014) The consequences of nursing stress and need for integrated solutions. Rehabil Nurs 39: 62–69. [crossref]
  3. Wyss H, Vermeesch A (2019) Inappropriate patient sexual behavior in nursing education. ARCH Women Health Care. 2(1): 1. 2019. [crossref]
  4. Onan N, Karaca S, Barlas GU (2019) Evaluation of a stress coping course for psychological resilience among a group of university nursing students. Perspect Psychiatr Care 55: 233–238. [crossref]
  5. Thew J (2018) Bad childhood experiences increase burnout among student nurses. Health Leaders. Available: https://www.healthleadersmedia.com/nursing/bad-childhood-experiences-increase-burnout-among-student-nurses.
  6. Vermeesch A, Barber H, Howard L, Payne K, Sackash C (2016) Road less traveled: stressors and coping strategies of nursing students. Nurse Educ 41: 117. [crossref]
  7. Johnson C, Knight C, Alderman N (2006) Challenges associated with the definition and assessment of inappropriate sexual behavior amongst individuals with an acquired neurological impairment. Brain Inj 20: 687–693. [crossref]
  8. Cambier Z (2013) Preparing new clinicians to identify, understand, and address inappropriate sexual behavior in the clinical environment. Journal of physical Therapy Education 27: 7–14.
  9. The U.S. Equal Employment Opportunity Commission (2019) Sexual harassment. Available: https://www.eeoc.gov/laws/types/sexual_harassment.cfm.
  10. Bronner G, Peretz C, Ehrenfeld M (2003) Sexual harassment of nurses and nursing students. J Adv Nurs 42: 637–644. [crossref]
  11. Frellick M (2018) Harassment from patients prevalent, poll shows. Medscape Medical News Available: https://www.medscape.com/viewarticle/892006.
  12. The Joint Commission (2018) Physical and verbal violence against health care worker. Sentinel Event Alert. Pg No: 1–9.
  13. De Mayo RA (1997) Patient sexual behaviors and sexual harassment: a national survey of physical therapists. Physical Therapy 77: 739–744. [crossref]
  14. O’Sullivan V, Weerakoon P (1999) Inappropriate sexual behaviours of patients towards practicing physiotherapists: a study using qualitative methods. Physiotherapy Research International 4: 28–42. [crossref]
  15. Beauvais AM, Stewart JD, Denisco S, Beauvais JE (2013) Factors related to academic success among nursing students: a descriptive correlational research study. Nurse Educ Today 34: 918–923. [crossref]
  16. Tampke, DR (2013) Developing, implementing, and assessing an early alert system. J College Student Retention 14: 523–532.
  17. Stone RSB (2018) Code Lavender: A tool for staff support. Nursing 48: 15–17. [crossref]
  18. Manton A (2018) Emergency Nurses and Code Lavender. J Emerg Nurs 44: 321. [crossref]
  19. Davidson JE, Graham P, Montross-Thomas L, Norcross W, Zerbi G (2017) Code Lavender: Cultivating Intentional Acts of Kindness in Response to Stressful Work Situations. Explore (NY) 13: 181–185. [crossref]

Universal Design for Learning: A Framework for Education in Nursing

DOI: 10.31038/AWHC.2019231


Universal design for learning (UDL) is a framework that arose from a desire to provide greater educational opportunities for all learners. In the 1980’s, educators working with children with disabilities began utilizing new computer technologies to foster learning. Their approaches were successful in decreasing limitations created by print-based materials. The educators quickly realized that it was the curriculum, rather than the learners, that created barriers to learning. This new approach became known as universal design for learning-a way of thinking about the teaching / learning process that gives all individuals an equal opportunity to succeed [1].

Today, educators are exploring new ways to meet the needs of diverse learners, using new technologies and activities. The UDL approach offers flexibility in the ways students access material, engage with it and show what they know. Societal values and expectations are changing as well.  Our expectations for learning are rising as we find new ways to provide a relevant education for all learners.  Educators are becoming more savvy at presenting information directed to a variety of senses (auditory, visual, kinesthetic), assessing and meeting the motivational needs of learners, and utilizing social interaction and teamwork to maximize learning.  New approaches for designing learning environments are supporting high expectations for a wide variety of individuals. These innovations are directed at change in the curriculum and not the learner.

Using new approaches, educators recognize the need to make education more responsive to learner differences [1].  The education community realizes that many individuals, and not just those with disabilities, face barriers and impediments that interfere with learning. Likewise, the learning environment and the learner’s self-awareness play a huge role in whether a given condition is disabling or not. UDL principles are being applied in K-12 and higher education, and are equally relevant to patient and staff education within healthcare organizations. Following principles of UDL, educators begin with high standards for all learners and use a variety of activities to help each learner find appropriate challenges and supports for learning.

The three core principles of the UDL framework outlined by Meyer et al. [1] are as follows:

  • Multiple means of engagement
  • Multiple means of representation
  • Multiple means of action and expression

Engagement

Providing multiple means of engagement composes the “why” of learning.  Engagement means helping learners develop interest and motivation. The ability to self-regulate their own learning (maintaining control) is key.  Successful learners set their own objectives and work toward meeting those goals. Learners maintain a balance between personal motivation and the demands of others. This balance is monitored by learners, so that they can adjust their behaviors and strategies as needed.  The teacher’s role in this phase of the learning process is to stimulate interest and motivation for learning [1].

Representation

Providing multiple means of representation refers to the “what” of learning.  According to Meyer et al. [1] the teacher’s role is to present content and information in different ways to accommodate a variety of learning styles and preferences. Learners show variability in how they perceive information in the environment, understand and integrate new information, and develop skills to assimilate and remember information. The medium itself may be a barrier; for example a blind person requires audio information. When content is represented through two or more mediums, such as text, images, video, or audio, more learners can benefit.

Action and Expression

Providing multiple means of action and expression focuses on the “how” of learning.  Methods by which learners express what they have learned varies in different levels of learners.  Novice learners model demonstration by the teacher, with support to implement new skills.  As learners gain experience, they become more independent in setting goals and monitoring their performance.  The more difficult the task, the more learners must interact with others, to learn standards and receive feedback.  Ultimately, the teacher’s role is to create learning activities and define appropriate ways that students can demonstrate new skills and knowledge [1].

Most references that focus on UDL as a learning framework come from academic or formal education settings [1]. Examples are more easily transferred to these educational settings, e.g. teaching students in a school of nursing or providing staff education in a healthcare agency. More exploration is needed regarding how UDL principles can be applied to individual patient/family education provided by nursing staff. Nurses as patient educators have too long relied on print media to share information with patients and families. While many hospital and outpatient systems have developed video libraries for patient education, these resources are developed for groups, or “the average patient.” Nurse educators need to explore how to individualize the teaching plan for each individual patient, drawing upon group resources. Nurses can better engage patients by making use of “teachable moments” when patients or family members are more open to health promotion information, improving skills, or learning about a physiological process.

While academic and staff educators deal with curriculum and teach groups of students, individual nurses often teach patients one-on-one. In all these educator roles, nurses can learn more about how and when to engage learners in a targeted exchange of information. By using multiple means of representation, i.e. a variety of teaching resources that address different learning styles, their message is more likely to reach diverse learners. Likewise, they need to be open to multiple means of expression, encouraging each learner to become more self-directed and more proficient at self-care. By encouraging learners to act in ways that fit their lifestyle, expressions of learning will be more effective and empowering. For additional information on UDL, go to www.CAST.org.

Reference

  1. Meyer A, Rose D, Gordon D (2014) Universal design for learning: Theory and practice. Wakefield, MA: CAST Professional Publishing.

LDL and beyond: New emerging LDL biomarkers in lipidology

Abstract

Lipidology as super-specialty is evolving both in terms of risk prediction but also to uncover the hidden mysteries within humans suffering from atherosclerotic cardiovascular disease (ASCVD) associated complication with apparently similar LDL concentration and particle size. Over decades since LDL discovery in 1950, the science has covered miles to allow us to learn more about the villainous nature of LDL lipoprotein i.e., ApoB, size wise fractions of LDL particles especially the small dense and large buoyant LDL types and oxidized LDLs. However, the recent evidence suggest exploring the morphology of LDLp within plaques suggest the varying concentration of sphingolipids to phosphatidylcholine in LDL-aggregates. This discovery has allowed newer insights into the pathophysiological mechanisms leading to plaque instability and rupture though an accelerated atherosclerotic mechanistic phenomena. This newer development will also allow us to segregate individuals with similar LDL phenotypes in terms of concentration and particle size to end up with ASCVD related complications. This brief communication discusses briefly discusses the recent LDL-plaque relationship and highlights new lipid biomarkers to further allow personalized segregation of cardiovascular disease (CVD) risk.

Key words

LDL-cholesterol (LDLc), small dense LDL-cholesterol (sdLDLc), Large buoyant LDL-cholesterol (lbLDLc), LDL-aggregates, Oxidized LDL, Lipoprotein associated phospholipase A2 (Lp-LPA2), ApoB

1. Introduction

While cholesterol was acknowledged as one of the components being present in the blood from 16th century onwards, it was Oncley et al in 1950 who isolated the beta globulin from fraction-III by means of ultracentrifugation. [1] Since then it was realized that the increasing LDL lipoprotein concentration emerged strongly as a risk for various atherosclerotic cardiovascular diseases (ASCVD) and was thus included as a primary prevention target parameter. [2] Though multiple studies have highlighted LDL lipoprotein concentration as the culprit, but later research further dissected LDL fractions to identify particle size to be more related with ASCVD. [3] Down the line researchers were able to segregate LDL particles between two broad categories including small dense LDL particles (sdLDc) and large buoyant LDL particles (lbLDLc), where the former category is associated with more atherogenicity and ASCVD. [4] Guidelines followed the initial research and quickly adopted the concept of particle size and some labs even marketed the LDL-particle size as of now. [5] The traditional concept of LDL cholesterol concentration measurements is still, however in vogue across the world and evolved from calculation based methods to directly measuring techniques which have improved at least the precision of LDL measurement. [6] Form the point of view developing and under developed economies the strategy still remains the most cost-effective, well-understood in terms of data interpretation and feasibility in terms of instrument availability. While the reliance on conventional lipid profile data currently seem to be the logical option for many set ups across the globe still, there are gaps with this “LDL concentration approach” to predict ASCVD risk. [7] LDL Lipoprotein structure has more to offer, than just the cholesterol content as the origin from VLDL to movement within circulation and with dumping down physiologically through LDL receptors into liver and pathologically into vasculature is highly variable between subjects. [8] Data suggest simple LDL concentration measures does not provide optimal appraisal of ASCVD in many subjects. Ramasamy et al in his very recent publication has clearly highlighted the limitations in lipid measurement technologies to highlight the need to develop biomarkers to better predict cardio vascular disease (CVD) risk. [7] Lawler et al using Nuclear Magnetic Resonance (NMR) Spectroscopy evaluated different fractions of LDL particles and concluded that small LDL particle was associated with CVD risk.[9] Finally literature at least now clearly acknowledges the LDL sub-fractions to be differently linked with ASCVD, and the whole lipoprotein risk evaluation using traditional lipid markers are poorly equated with future CVD prediction. [10]

2. Emerging biomarkers in Lipidology

a. Small dense LDL-cholesterol (sdLDLc)

The initial search comes in through discovery of LDL-fractions where an initial broader categorization was made as to segregate LDL particles into two categories i.e., sdLDLc and large buoyant LDL cholesterol (lbLDLc). sdLDLc in current research has been considered as risk for CVD. [11] However, lbLDLc were not considered atherogenic which clearly challenges the use of LDLc in clinics for identifying ASCVD risk.

b. ApoB measurements

Alongside the protein components within lipoprotein also entered clinical market as ApoA as surrogate for HDLc and ApoB for LDLc. The Insulin Resistance Atherosclerosis Study (IRAS) have graded ApoB measurements to be more predicative than LDLc.[12] However, research shows ApoB not to provide any additional information than conventional LDLc. [13,14]

c. Lipoprotein associated phospholipase A2 (Lp-LPA2)

This enzyme is found mainly in LDLc where it helps contributes to atherosclerosis but confers some anti-atherogenic advantages to HDLc as well. Lp-PLA(2) studies collaboration group have identified a strong association of enzyme activity and mass with various ASCVD adverse outcomes like stroke, heart diseases and hypertension. Similarly, Anderson J et al have demonstrated Lp-LPA2 as an independent risk factor for predicting coronary artery disease (CAD). [16] Though appealing in terms of its role to cleave oxidized phospholipids and acting as a chemo-attractant to bring inflammatory proteins and cells to unstable plaque, still large trials like JUPITER and HPS have not found additional benefit of its utilization for both primary and secondary prevention of ASCVD than conventional LDLc. [17,18] Another issues haunting Lp-PLA(2) is the measurement variability due to assay formats, which stands mandatory before its clinical use in routine. [19] So it seems that Lp-PLA(2) use in clinical arena is bound to face delays or may never be used due to incoming better markers.

d. LDL Particles

Over the last 2 decades LDL particles have been found to have multiple sizes, where the literature has identified varying atherogenic potential for LDL-sub particles. Gourgari et al have identified in a study LDL-particle size to be higher in polycystic ovarian syndrome subjects (PCOS) in comparison to controls which was related with markers of inflammation and insulin resistance. [20] Similarly others have highlighted LDL particles to be more related with ASCVD. [3] However, the contrasting evidence highlighted in the Multi-Ethnic Study of Atherosclerosis(MESA) observed slightly greater benefit by using LDLp/HDLp ratio but identified this risk prediction for coronary heart disease (CHD) to get attenuated after adjustment of standard lipid variables. [21]

e. Oxidized LDL

For some time researchers did thrive on the concept of LDL concentration and particle size, but emerging evidence from kinetic studies identified various post-translational modifications like oxidative changes. [22, 23] These oxidized LDL (oxLDLc) are considered to result in certain “damage associated molecular patterns” (DAMP), which are later to result in vascular inflammation. [22] So oxLDLc within vessel walls can act as new LDL biomarkers; however, no standardized lipid lowering therapy is yet available to prevent this oxidative damage in LDL.[23]

f. LDL-aggregates

Within vessel wall it has been demonstrated that LDL particles aggregate. [24] These aggregates of LDL particles within arterial walls are quite atherogenic and can cause changes like conversion of macrophages into foam cells and accumulation within smooth muscles to cause accelerated atherosclerosis and plaque formation by the enzyme sphingomyelinase (SMase). [24, 23] LDL-aggregates, though not in correlation with conventional lipid and inflammatory markers but still have been observed to change with lifestyle modifications, use of PCSK9 inhibitors and other treatment modalities. These LDL-aggregates are distinguished by the fact that they have increase sphingolipids to phospatidylcholine ratio, which accelerates the process of atherosclerosis and in turn predispose plaques to rupture.Therefore, LDL-aggregates may emerge as powerful diagnostic and monitoring tool in future. [23–25]

3. Futuristic incorporation in lipid clinic care pathways

While current clinical market poses both economic issues and lack of quality research, still visibility is now here that conventional lipid markers are not able to predict ASCVD in multiple cases and the need is ever appreciated for advance lipid biomarkers to address both personalized medicine and health economics. The below mentioned algorithm is meant for a dedicated lipid clinic where an individualized diagnosis of lipid pathology could be diagnosed to avoid pan-medical trials and to provide specific interventional approached to reduce ASCVD risk for the patients and genetic solutions for the family members.

This data, albeit discussed recently in literature replies to the critical question raised in the clinics that “why ASCVD prevalence did not correspond with LDL concentration and particle size?” Deeper insight intoLDLp interaction within plaque, ratio of sphingolipid / phosphatidylcholine as prevails within LDLp and the activity of sphingomyelinase (SMase) all finally converge towards plaque progression, rupture and thus the acute consequences resulting from the ASCVD. It is anticipated that SMase activity and genetic alterations in LDL aggregation will probably follow these phenotypic changes to clarify the mutations and polymorphisms underlying the varying development of plaques and onward ASCVD risk among individuals.

4. Closing remarks

Incorporation overtime to address one of the crucial villains to cause ASCVD would require additional biomarker arsenal to allow meaningful data to segregate risk prediction among individuals with similarities baseline LDL phenotypes i.e., Aggregation-prone LDLp and Aggregation-resistant LDLp. In this regard advanced lipid clinics can extend help to incorporate LDL particle measurements, phenotyping of LDL classes, functional assays to asses to learn LDL aggregation and oxidized LDL types. Molecular diagnostics can also be added to specifically diagnose the underlying genetic pathology. A one-time assessment can help predict risk for ASCVD related morbidity and mortality along with avoiding people with unnecessary lifelong medication, concerns and as a very powerful primary prevention tool. Perhaps larger tertiary care set ups in country should develop tools and arsenals to perform advanced lipid testing within dedicated lipid clinics to address the multifactorial pathogenesis of ASCVD to address the pushing needs to “personalized medicine”, cost-effective care provision and finally to segregate .patients who need lipid lowering treatment or otherwise.

Consent for publication: Not applicable (No individual data was presented)

Competing interests: The author has no competing interests to declare.

Data funding: There are no funding sources to disclose.

JCRM 2019-108 - SikhindharKhan UK_F1

Figure 1. The process of LDLp entry into carotid intima, to changeswithin the plaque resulting in plaque instability and onward rupture.

JCRM 2019-108 - SikhindharKhan UK_F2

Figure 2. Evolution LDL biomarkers for predicting adverse ASCVD consequences

References

  1. Oncley JL, Gurd FRM, Melin M (1950) Preparation and properties of serum and plasma proteins XXV. Composition and properties of human serum β-lipoprotein. J. Am. Chem. Soc. 68: 458–464.
  2. Piepoli MF, Hoes AW, Agewall S, Albus C, Brotons C, Catapano AL, et al. (2016) ESC Scientific Document Group. 2016 European Guidelines on cardiovascular disease prevention in clinical practice: The Sixth Joint Task Force of the European Society of Cardiology and Other Societies on Cardio vascular Disease Prevention in Clinical Practice (constituted by representatives of 10 societies and by invited experts) Developed with the special contribution of the European Association for Cardiovascular Prevention & Rehabilitation (EACPR). Eur Heart J. 37(29): 2315–2381. doi: 10.1093/eurheartj/ehw106. [Crossref]
  3. Otvos JD, Mora S, Shalaurova I, Greenland P, Mackey RH, Goff DC Jr. (2011) Clinical implications of discordance between low-density lipoprotein cholesterol and particle number. J Clin Lipidol. 5(2): 105–13. doi: 10.1016/j.jacl.2011.02.001. [Crossref]
  4. Srisawasdi P, Vanavanan S, Rochanawutanon M, Kruthkul K, Kotani K, Kroll MH (2015) Small-dense LDL/large-buoyant LDL ratio associates with the metabolic syndrome. Clin Biochem. 48(7–8): 495–502. doi: 10.1016/j.clinbiochem.2015.01.011. [Crossref]
  5. Kulkarni KR (2006) Cholesterol profile measurement by vertical auto profile method. Clin Lab Med. 26(4): 787–802. [Crossref]
  6. Miller WG, Myers GL, Sakurabayashi I, Bachmann LM, Caudill SP, Dziekonski A, et al. (2010) Seven direct methods for measuring HDL and LDL cholesterol compared with ultracentrifugation reference measurement procedures. Clin Chem. 56(6): 977–86. doi: 10.1373/clinchem.2009.142810. [Crossref]
  7. Ramasamy I (2018) Update on the laboratory investigation of dyslipidemias. Clin Chim Acta. 479: 103–125. doi: 10.1016/j.cca.2018.01.015. [Crossref]
  8. Silva IT, Almeida-Pititto Bd, Ferreira SR (2015) Reassessing lipid metabolism and its potentialities in the prediction of cardiovascular risk. Arch Endocrinol Metab. 59(2): 171–80. doi: 10.1590/2359-3997000000031. [Crossref]
  9. Lawler PR, Akinkuolie AO, Chu AY, Shah SH, Kraus WE, Craig D, et al. (2017) Atherogenic Lipoprotein Determinants of Cardiovascular Disease and Residual Risk Among Individuals With Low Low-Density Lipoprotein Cholesterol. J Am Heart Assoc. 6(7). pii: e005549. doi: 10.1161/JAHA.117.005549. [Crossref]
  10. Diffenderfer MR, Schaefer EJ (2014) The composition and metabolism of large and small LDL. Curr Opin Lipidol. 25(3): 221–6. doi: 10.1097/MOL.0000000000000067. [Crossref]
  11. Gerber PA, Nikolic D, Rizzo M (2017) Small dense LDL: an update. Curr Opin Cardiol. 32(4): 454–459. doi: 10.1097/HCO.0000000000000410. [Crossref]
  12. Williams K, Sniderman AD, Sattar N, D’Agostino R Jr, Wagenknecht LE, Haffner SM (2003) Comparison of the associations of apolipoprotein B and low-density lipoprotein cholesterol with other cardiovascular risk factors in the Insulin Resistance Atherosclerosis Study (IRAS). Circulation. 108(19): 2312–6. [Crossref]
  13. Fernández-Friera L, Fuster V, López-Melgar B, Oliva B, García-Ruiz JM, Mendiguren J, et al. (2017) Normal LDL-Cholesterol Levels Are Associated With Subclinical Atherosclerosis in the Absence of Risk Factors. J Am Coll Cardiol. 70(24): 2979–2991. doi: 10.1016/j.jacc.2017.10.024. [Crossref]
  14. Sniderman AD, Robinson JG (2018) ApoB in clinical care: Pro and Con. Atherosclerosis. pii: S0021-9150(18)31456-4. doi: 10.1016/j. atherosclerosis.2018.11.001. [Crossref]
  15. Lp-PLA (2) Studies Collaboration, Thompson A, Gao P, Orfei L, Watson S, Di Angelantonio E, Kaptoge S, et al. (2010) Lipoprotein-associated phospholipase A(2) and risk of coronary disease, stroke, and mortality: collaborative analysis of 32 prospective studies. Lancet. 375(9725): 1536–44. doi: 10.1016/S0140-6736(10)60319-4. [Crossref]
  16. Anderson JL (2008) Lipoprotein-associated phospholipase A2: an independent predictor of coronary artery disease events in primary and secondary prevention. Am J Cardiol. 101(12A): 23F-33F. doi: 10.1016/j.amjcard.2008.04.015. [Crossref]
  17. Ridker PM, MacFadyen JG, Wolfert RL, Koenig W (2012) Relationship of lipoprotein-associated phospholipase A2mass and activity with incident vascular events among primary prevention patients allocated to placebo or to statin therapy: an analysis from the JUPITER trial. Clin Chem 58: 877–86.
  18. Heart Protection Study Collaborative Group. Lipoprotein-associated phospholipase A2 activity and mass in relation to vascular disease and nonvascular mortality. J Intern Med 2010;268: 348–58. [Crossref]
  19. McConnell JP, Jaffe AS (2008) Variability of lipoprotein-associated phospholipase A2 measurements. Clin Chem. 54(5): 932–3. doi: 10.1373/clinchem.2008.103358. [Crossref]
  20. Gourgari E, Lodish M ,Shamburek R, Keil M, Wesley R, Walter M, et al. (2015) Lipoprotein Particles in Adolescents and Young Women With PCOS Provide Insights Into Their Cardiovascular Risk. J Clin Endocrinol Metab. 100(11): 4291–8. doi: 10.1210/jc.2015–2566. [Crossref]
  21. Steffen BT, Guan W, Remaley AT, Paramsothy P, Heckbert SR, McClelland RL, et al. (2015) Use of lipoprotein particle measures for assessing coronary heart disease risk post-American Heart Association/American College of Cardiology guidelines: the Multi-Ethnic Study of Atherosclerosis. Arterioscler Thromb Vasc Biol. 35(2): 448–54. doi: 10.1161/ATVBAHA.114.304349. [Crossref]
  22. Choi SH, Sviridov D, Miller YI (2017) Oxidized cholesteryl esters and inflammation. Biochim Biophys Acta Mol Cell Biol Lipids. 1862(4): 393–397. doi: 10.1016/j.bbalip.2016.06.020. [Crossref]
  23. Laufs U, Weingärtner O (2018) Pathological phenotypes of LDL particles. Eur Heart J. 39(27): 2574–2576. doi: 10.1093/eurheartj/ehy387.
  24. Deevska GM , Sunkara M, Morris AJ, Nikolova-Karakashian MN (2012) Characterization of secretory sphingomyelinase activity, lipoprotein sphingolipid content and LDL aggregation in ldlr-/- mice fed on a high-fat diet. Biosci Rep. 32(5): 479–90. doi: 10.1042/BSR20120036. [Crossref]
  25. Ruuth M, Nguyen SD, Vihervaara T, Hilvo M, Laajala TD, Kondadi PK, et al. (2018) Susceptibility of low-density lipoprotein particles to aggregate depends on particle lipidome, is modifiable, and associates with future cardiovascular deaths. Eur Heart J. 39(27): 2562–2573. doi: 10.1093/eurheartj/ehy319. [Crossref]