Monthly Archives: July 2018

Adjunctive Sarcosine and N-Acetylcysteine Use for Treatment-Resistant Schizophrenia

DOI: 10.31038/JNNC.2018114

Introduction

The pathophysiology of schizophrenia is not completely understood, but most hypotheses center around the core philosophy that schizophrenia is subject to the influence of neurotransmitters, specifically dopamine [1, 2]. While traditional psychotropic agents used to treat psychiatric illness correct neurotransmitter dysfunction to alleviate symptoms, there is growing evidence to suggest that inflammation, oxidative stress, and glutamate pathological changes have an effect in psychiatric conditions.

In the glutamate hypothesis of schizophrenia, abnormal glutamate uptake by glial cells can result in decreased N-methyl-D-aspartate (NMDA) receptor function [1, 3–7]. Dysfunction of NMDA receptors results in the disruption of downstream dopamine signaling. Specifically, hypofunction of the NMDA receptors in the mesolimbic dopamine pathway can result in hyperactivation of neurons, which can present as hallucinatory symptoms. Whereas, in the mesocortical pathway, NMDA receptor hypofunction can lead to negative symptoms, including anhedonia and impaired cognition. The affinity of glutamate for the NMDA receptor can be influenced by NMDA cofactors glycine and glutathione.

Modulation of the NMDA receptor via allosteric binding of glycine can enhance glutamate binding [1, 3–4]. Sarcosine (N-methyl glycine) is a type 1 glycine transporter inhibitor (GlyT1), that increases the synaptic concentration of glycine by preventing its reuptake by glial cells. Increased glycine in the synapse is proposed to augment glutamate binding at the NMDA receptor, in theory, alleviating the many symptoms of schizophrenia.

It is also thought that the abnormal metabolism of neurotransmitters in patients with schizophrenia can consequently result in oxidative stress and damaged neurons [5]. N- acetylcysteine (NAC) is thought to relieve oxidative stress by replenishing glutathione levels to prevent neurodegenerative effects and further cognitive dysfunction [5, 8–9]. NAC increases glutathione levels by delivering cysteine to the brain, which is necessary for glutathione synthesis. Similar to the cofactor glycine, increased glutathione levels will also augment glutamate binding at the NMDA receptor.

While current approved treatment options for
neuropsychiatric disorders, including schizophrenia, have
substantial documented efficacy, there are instances in which
response to these treatment options is suboptimal [10]. In these situations, patients can be further diagnosed with treatment-resistant schizophrenia. Complementary and alternative medicine (CAM) is a treatment intervention not approved by the Food and Drug Administration (FDA), however offers additional options When other treatments Fail. Both sarcosine and NAC are recognized as CAM therapy options. This report will discuss the efficacy and safety of adjunctive sarcosine and NAC in the treatment of treatment-resistant schizophrenia.

Current Literature Evaluating Sarcosine

Recent literature has evaluated the efficacy of sarcosine in the treatment of schizophrenia. In an open-label, preliminary trial by Amiaz et al., sarcosine was initiated in 22 patients with schizophrenia. To be included, subjects had to be stabilized on an antipsychotic regimen for at least four weeks prior to the addition of sarcosine. The antipsychotic agents patients were receiving included risperidone
(n = 7), quetiapine (n = 4), zuclopenthixol intramuscular (IM) injection (n = 4), olanzapine (n = 3), fluphenazine IM injection (n = 2) and paliperidone (n = 2). Five of the 22 patients received sarcosine 2g/day, while 17 patients received 4g/day. Significant improvement from baseline was noted  on the positive symptoms subscale of Positive and Negative Syndrome Scale (PANSS) following eight days of treatment (p = 0.007). Significant improvement was also seen on general psychopathology subscale of PANSS (p = 0.003). However, no significant improvement was detected in Clinical Global Impression Severity of Illness scale (CGI-S) (p = 0.08) and total PANSS score (p = 0.06) following treatment. The recruitment of this primary study was terminated following a documented safety issue reporting sarcosine may be linked to prostate cancer progression. This study was limited by the small sample size and short observation period.

A previous double-blind trial by Tsai et al. evaluated 38 patients with schizophrenia who received either adjunctive sarcosine or placebo in addition to their current antipsychotic therapy regimen for 6 weeks [12]. Patients were required to have been stabilized on their antipsychotic regimen for at least three months prior to enrollment in the study. The antipsychotic therapy regimens received included risperidone (n = 20), sulpiride (n = 6), haloperidol (n = 5), chlorpromazine (n = 1), fluphenazine decanoate (n = 1), trifluoperazine (n = 1), etumine (n = 1), sulpiride combined with chlorpromazine (n = 1), pipotiazine combined with chlorpromazine (n = 1) and medication free (n = 1). Significant improvements in positive (p < 0.0001), cognitive (p < 0.0001), and general psychiatric (p = 0.0002) symptom subscales of PANSS were observed in patients adjunctively treated with sarcosine when compared to placebo. Significant improvement was also found in Scales for the Assessment of Negative Symptoms (SANS) (p < 0.0001) and Brief Psychiatric Rating Scale (BPRS) (p = 0.0001) in patients receiving sarcosine therapy. When risperidone with adjunctive sarcosine was analyzed separately, similar results were found, as significant improvement was noted in PANSS, SANS and BPRS scales.

Lane et al. (2005) evaluated sarcosine use in patients experiencing acute exacerbations of schizophrenia [13]. It was difficult to derive clinically significant conclusions due to the numerous limitations of this study. However, improvement in general psychiatric symptoms, depression, and possibly negative symptoms was observed. Lane et al. (2008) assessed sarcosine use in 20 patients with schizophrenia as monotherapy as opposed to adjunctive therapy[14]. Compared to patients who received sarcosine 1g/day, patients who received sarcosine 2g/day experienced a 20% or greater reduction in total PANSS score. A follow-up double-blind trial, also conducted by Lane et al. (2010), randomized 60 patients with schizophrenia to receive sarcosine 2g/day or placebo[15]. Compared to placebo, sarcosine showed improvement in positive, negative and cognitive symptom subscales of PANSS. Improvement was also found among total PANSS (p=0.005), SANS (p=0.021), Quality of Life (QOL) scale (p = 0.025) and Global Assessment of Functioning (GAF) scale (p = 0.042). Similar to previous studies, the sarcosine treatment group had greater than a 20% reduction in total PANSS score. It is evident that adjunctive sarcosine therapy may provide significant benefit in patients with treatment-resistant schizophrenia who have exhausted traditional antipsychotic therapy options.

Current Literature Evaluating N-acetylcysteine (NAC)

A double-blind, placebo-controlled trial assessing the impact of adjunctive NAC in patients diagnosed with schizophrenia evaluated a primary outcome of improvement on PANSS score [5]. The treatment group received NAC 2g daily compared to placebo for 4 months. NAC was administered in addition to each patient’s current antipsychotic regimen. Four weeks following NAC discontinuation, the treatment group demonstrated a statistically significant improvement in PANSS total (p = 0.009), negative (p = 0.018) and general (p = 0.035) subscales. No significant improvement in PANSS positive subscale was found. A second randomized, double-blind, placebo-controlled trial assessed efficacy of NAC (up to 2g/day), in addition to risperidone (up to 6mg/ day), for 8 weeks in 42 patients with a baseline PANSS score greater than 20 [16]. A significant improvement in PANSS negative (p < 0.001) and total (p = 0.006) scales was found, but positive and general subscales lacked statistically significant improvements.

A systematic review and meta-analysis examined the efficacy and safety of adjunctive NAC in patients with schizophrenia among three randomized controlled trials [17]. Adjunctive NAC (2 to 6g/day) significantly improved total psychopathology (p = 0.03), but not general, positive or negative PANSS subscales. There were no significant differences observed in discontinuation rates or adverse effects (drowsiness, headache, nauseas and constipation) between placebo and treatment groups, which indicates favorable tolerability. These studies conclude that there is a modest benefit observed in augmenting maintenance antipsychotic therapy with NAC.

Case Report

A 43-year-old, single, white, female patient, with borderline intellectual functioning, has been continuously hospitalized at an inpatient New York State psychiatric institute since February 2003. She had been admitted to this same facility five times prior, with her first inpatient hospitalization dating back to June 1997, when she was diagnosed with schizophrenia, paranoid type. Her symptoms include paranoia, delusional ideation, hallucinations, disorganized thoughts, poor insight, impaired judgement, irritability, agitation and aggression. The patient has a history of physical and sexual abuse, as well as polysubstance abuse with marijuana, Lysergic Acid Diethylamide (LSD) and alcohol. The patient’s father reportedly suffered from schizophrenia, and died at age 48 from myocardial infarction.

Despite multiple treatment regimens over her lengthy hospital stay, the patient continued to have episodes of severe symptoms that interfered with daily functioning, including aggression. A trial of clozapine (Clozaril) was initiated, but was discontinued due to the development of myocarditis, leaving the patient ineligible for treatment rechallenge. After subsequent failed attempts to stabilize the patient with the use of alternative antipsychotic agents, either as monotherapy or in combination, including risperidone (Risperdal), olanzapine (Zyprexa), fluphenazine (Prolixin) and quetiapine (Seroquel), the patient’s treating psychiatrist requested a trial of CAM to augment her current psychiatric medication regimen of fluphenazine (Prolixin) decanoate 75mg intramuscular injection (IM) every other week along with oral doses of olanzapine (Zyprexa) 20mg twice daily, topiramate (Topamax) 200mg twice daily and lorazepam (Ativan) 2mg four times daily (Table 1). On 12/27/12, the patient was initiated on oral doses of NAC 600mg twice daily, followed by sarcosine 1g twice daily  on 1/17/13, for treatment resistant schizophrenia. The patient was additionally treated with chloral hydrate as needed (PRN) until it was removed from the market by the Food and Drug Administration (FDA) in October 2012. The patient received   hydroxyzine pamoate (Vistaril) 50mg every 4 hours PRN as a replacement for the chloral hydrate (Figures 1A-C).

JNNC18-103_F1

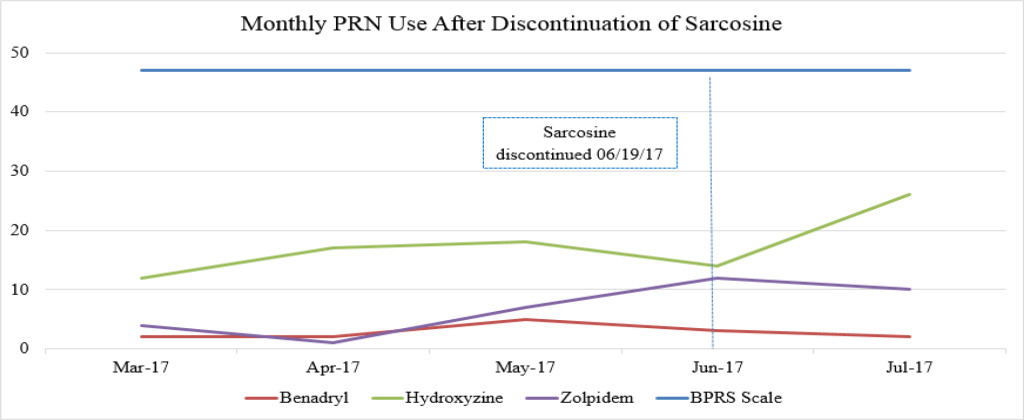
Figure 1A. Monthly PRN use before initiation of sarcosine.

JNNC18-103_F2

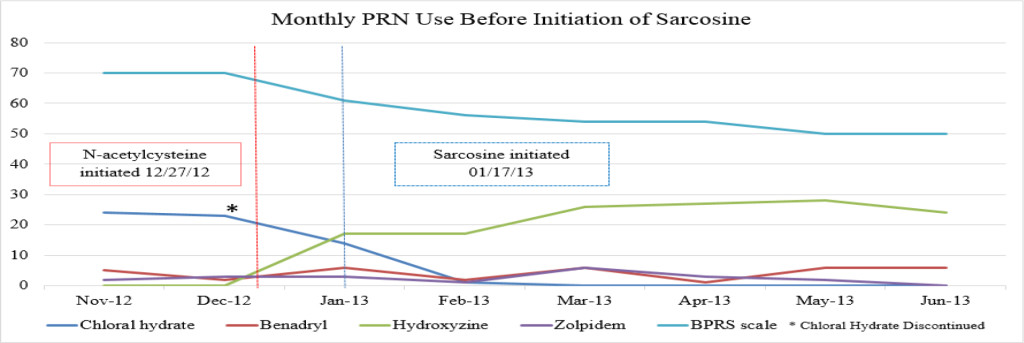
Figure 1B. Monthly PRN use after discontinuation of sarcosine.

JNNC18-103_F3

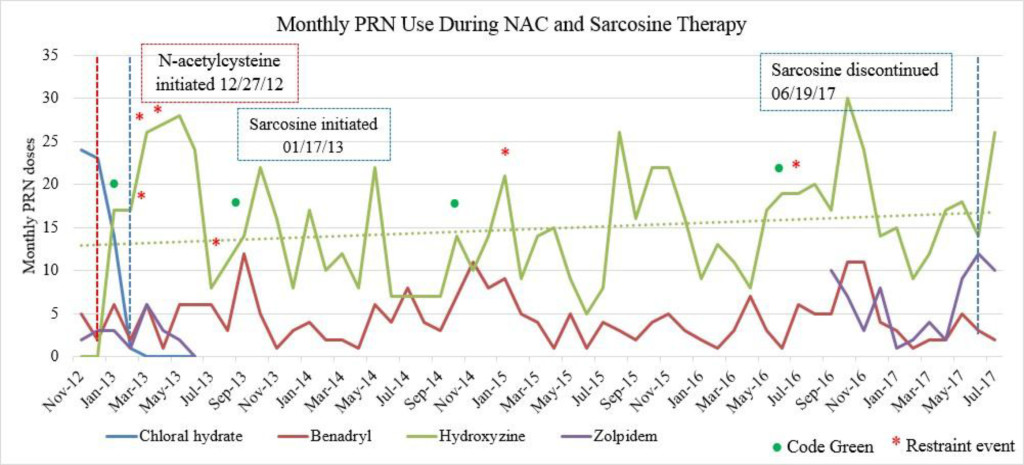
Figure 1C. Monthly PRN use during sarcosine therapy.

Table 1. Medication regimen changes over course of hospitalization.

Medication List 11/2/12

2013–2016

(date initiated)

Medication List 4/20/17

Calcium/Vitamin D 500mg/200units BID

Calcium/Vitamin D 500mg/200units BID

Calcium/Vitamin D 500mg/200units BID

Fluphenazine 5mg 4x daily

Discontinued: Fluphenazine 5mg 4x daily (11/16/12)

Fluphenazine 75mg IM injection every other week

Fluphenazine 75mg IM injection every other week

Fluphenazine 75mg IM injection every other week

Lactulose 20mg/30mL QHS

Lactulose 20mg/30mL QHS

Lactulose 20mg/30mL QHS

Lorazepam 2mg 4x daily

Lorazepam 2mg 4x daily

Lorazepam 2mg 4x daily

Olanzapine 20mg BID

Olanzapine 20mg BID

Olanzapine 20mg BID

Topiramate 200mg BID

Topiramate 200mg BID

Topiramate 200mg BID

Initiated: Propranolol 20mg BID (11/2012)

Propranolol 20mg BID

Initiated: N-Acetylcysteine 600mg BID (12/2012)

N-Acetylcysteine 600mg BID

Initiated: Sarcosine 1g BID (1/2013)

Sarcosine 1g BID

Initiated: Doxepin 50mg 4x daily (2/2013)

Doxepin 50mg 4x daily

Initiated: Bisacodyl 10mg twice weekly (2/2013)

Bisacodyl 10mg twice weekly

Initiated: Omeprazole 20mg QAM (4/2017)

Omeprazole 20mg QAM

Initiated: Thiothixene 10mg 4x daily (1/2016)

Thiothixene 10mg 4x daily

BID=twice daily
QHS=at bedtime
QAM=in the morning
4x daily=four times daily
All doses were administered by mouth unless otherwise noted

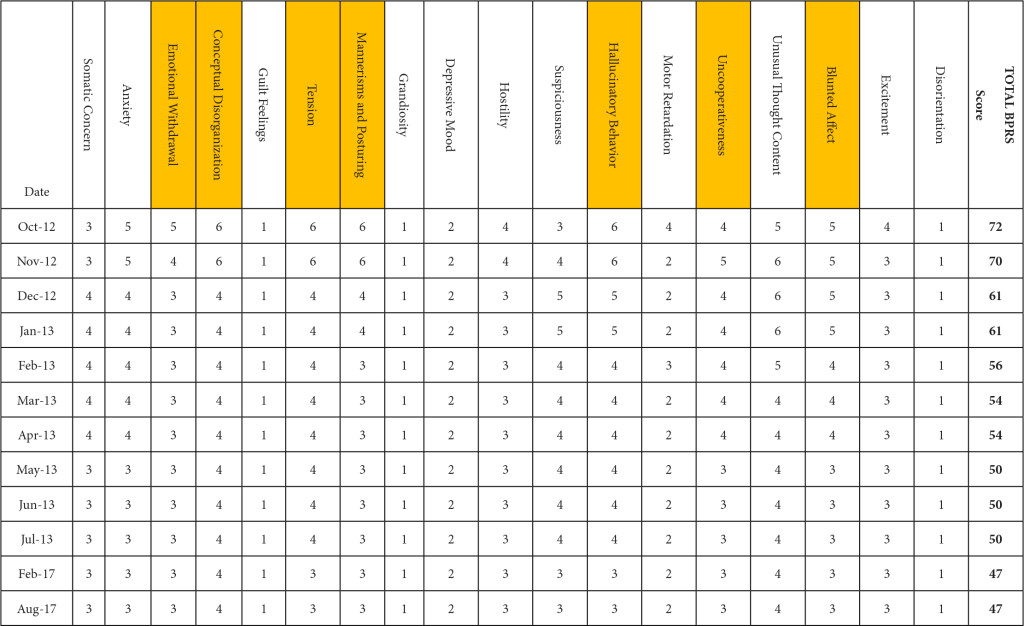
BPRS was utilized to document the progression of her treatment and the impact medication interventions had on her delusional thoughts and behaviors, including paranoia, anxiety and hostility. Prior to the initiation of NAC and sarcosine, the patient’s BPRS score was 72 in October 2012. Following the initiation of NAC and sarcosine, the patient’s BPRS score decreased, over the following 6 months of therapy, to a score of 50 in June 2013. Improvements were specifically seen in the areas of emotional withdrawal, conceptual disorganization, tension, mannerisms, hallucinatory behavior, uncooperativeness and blunted affect (Table 2).

Table 2. Improvement in BPRS score by date and domain. (highlighted boxes represent the score domains with the greatest improvements noted)

JNNC18-103_F4

Emergent psychiatric interventions, including Code Greens (CG) and Restraint and Seclusions (R/S), along with PRN medication use, were also included in the analysis to evaluate the efficacy of the patient’s psychiatric medication regimen, as these are indicators of symptoms pertaining to agitation and aggression (Table 3). In the one year prior to the initiation of NAC and sarcosine, the patient required 2 CG (3/12/12, 4/9/12) and had 4 assaults reported (1/2/12, 3/19/12, 5/6/12, 6/11/12). She did not have a R/S. In the year following the initiation of NAC and sarcosine, the patient required 2 CG (1/4/13, 9/23/13) and had 4 assaults reported (2/25/13, 3/24/13, 4/2/13, 7/5/13), with no R/S (Figure 1C). Hydroxyzine pamoate (Vistaril) use fluctuated from month to month. Of note, doxepin (Sinequan) 50mg four times daily was initiated on 2/1/13. Her aggressive behavior, documented by reported assaults and CG, significantly decreased following her assault on 4/2/13, which is when her BPRS score was decreasing towards 50 (Tables 2 and 3). From her assault on 7/5/13 and CG on 9/23/13 until June 2017 (4 years following the initiation of NAC and sarcosine), the patient only required 2 CG (10/12/14, 6/14/16). Of note, thiothixene (Navane) 10mg four times daily was added to the patient’s medication regimen on 1/19/16.

Table 3. Emergent Psychiatric Interventions.

Date (1 year prior to NAC and sarcosine initiation)

1/2/12

Assault

3/12/12

Code Green

3/19/12

Assault

4/9/12

Code Green

5/6/12

Assault

6/11/12

Assault

Date (Following initiation of NAC and sarcosine)

1/4/13

Code Green

2/25/13 (doxepin initiated on 2/1/13)

Assault

3/24/13

Assault

4/2/13 (BPRS score decreased to 50)

Assault

7/5/13

Assault

9/23/13

Code Green

10/12/14

Code Green

6/14/16 (thiothixene initiated on 1/19/16)

Code Green

The patient was maintained on fluphenazine (Prolixin Decanoate)  olanzapine (Zyprexa), thiothixene (Navane), topiramate (Topamax), lorazepam (Ativan), hydroxyzine pamoate (Vistaril), NAC and sarcosine, until sarcosine became unavailable in April 2017. The patient was subsequently given 500mg once daily starting on 4/20/17 to conserve the remaining sarcosine supply while the facility searched for alternative sources, but was given her last dose on 6/19/17. The BPRS score closest to the time of sarcosine discontinuation was 47 on 2/29/17. On 8/1/17, nearly 2 months after sarcosine discontinuation, the BPRS score was the same (47).

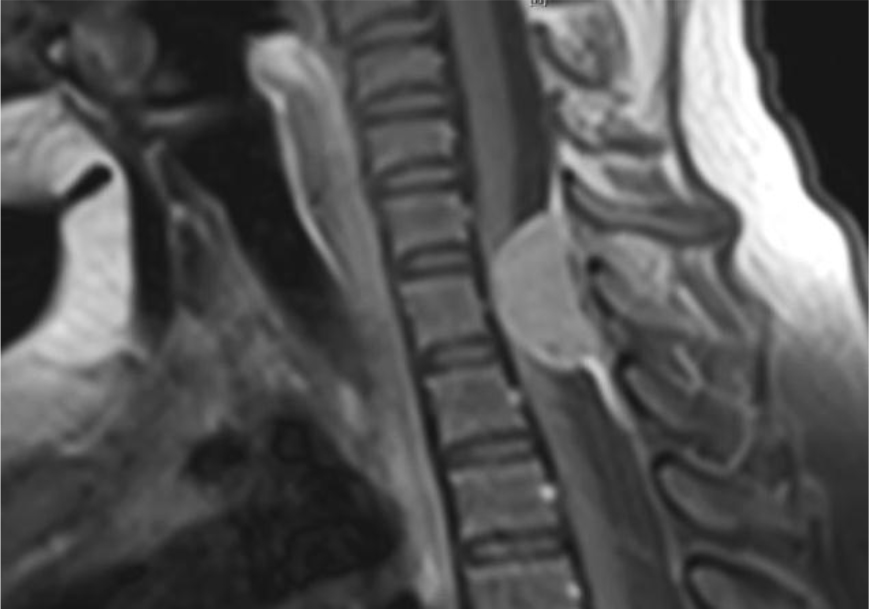
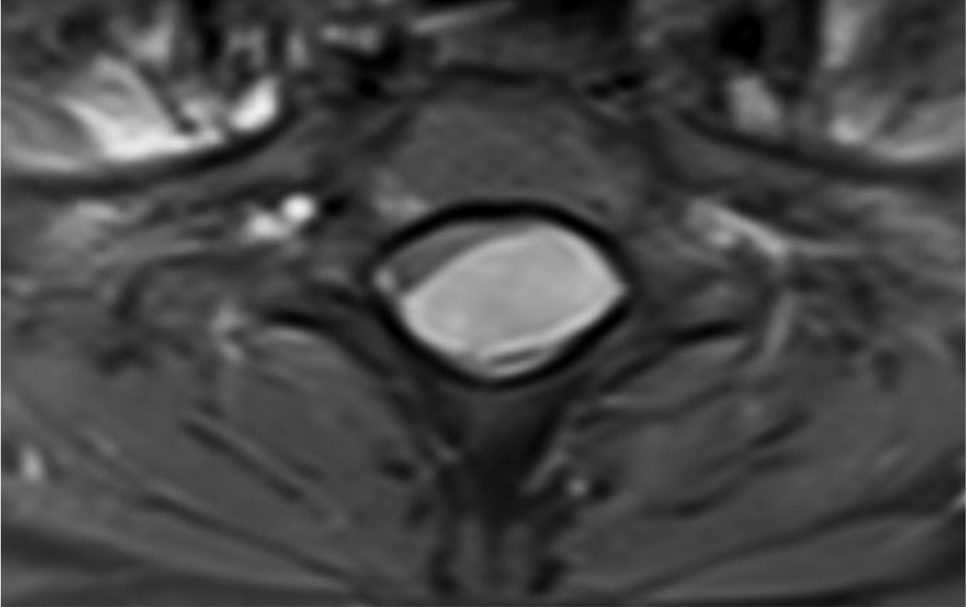
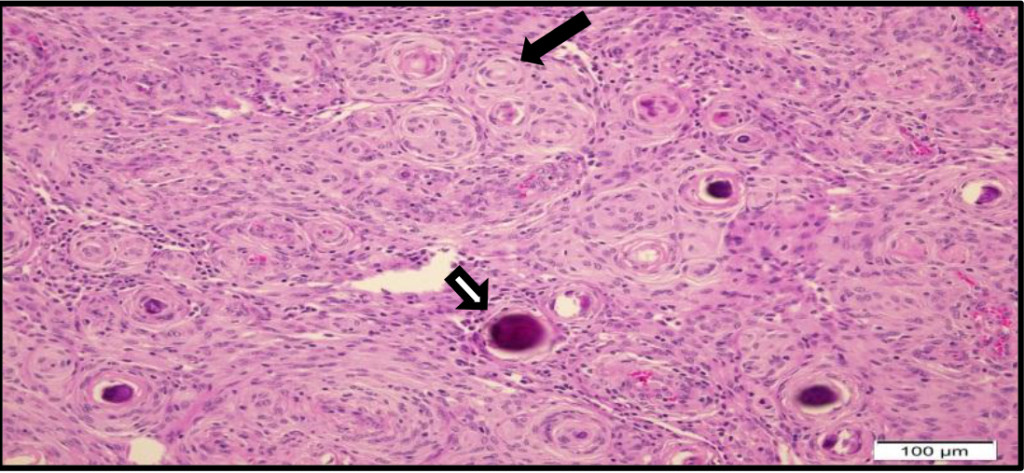
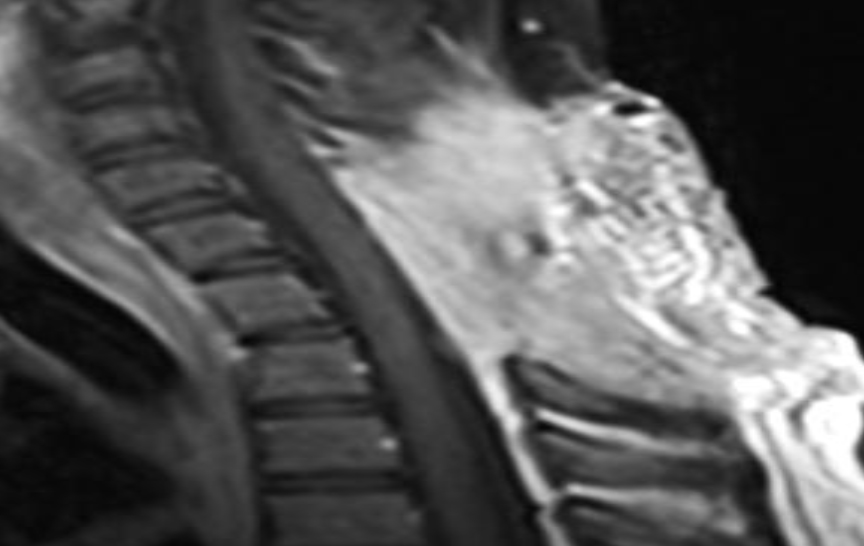
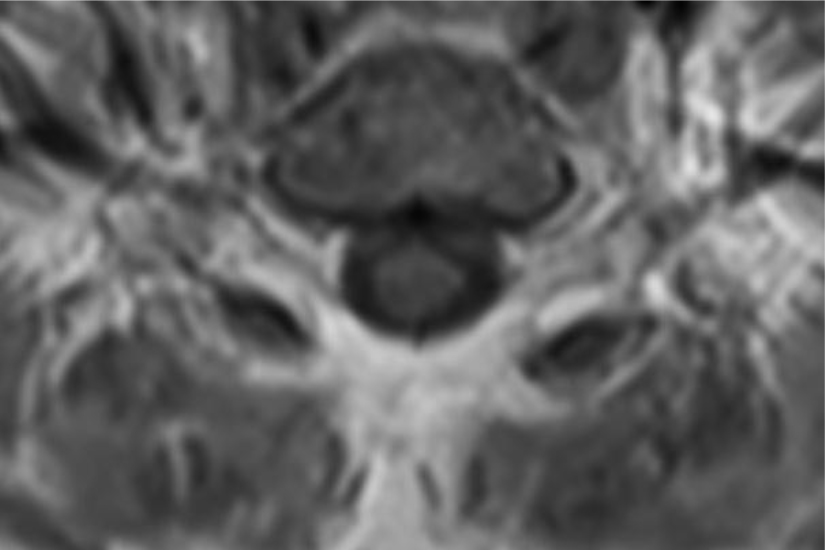
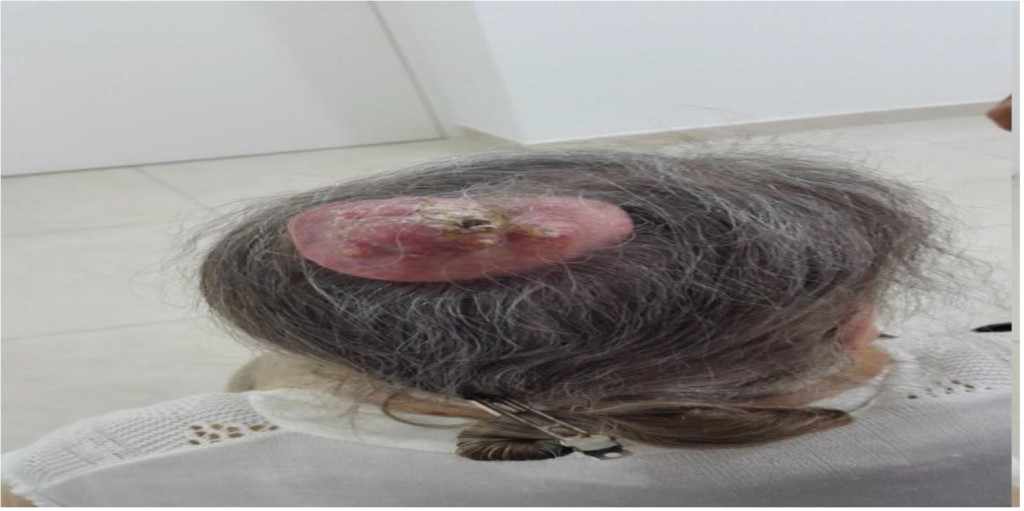
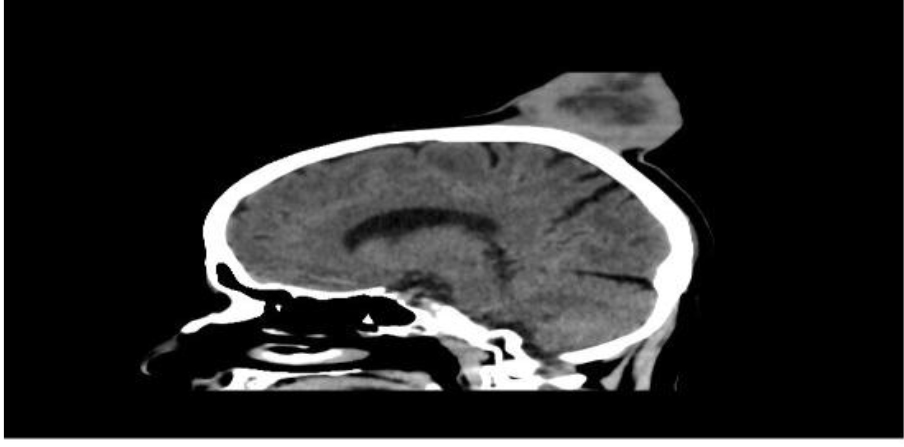
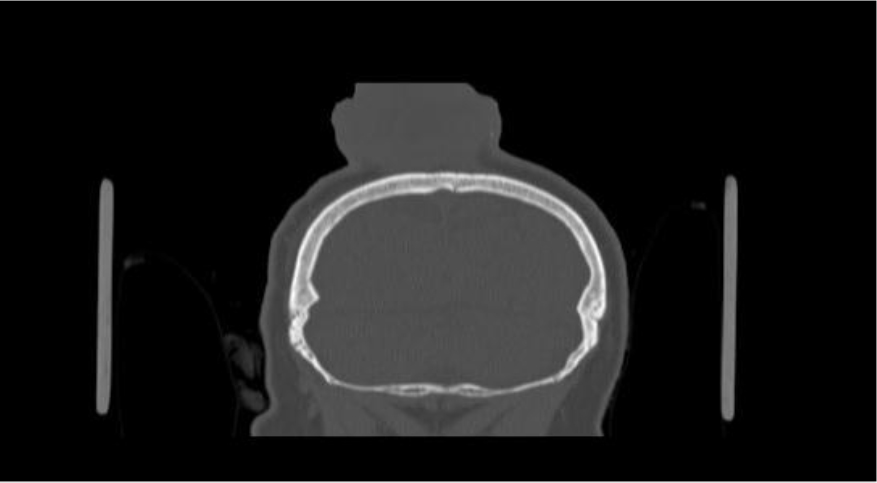
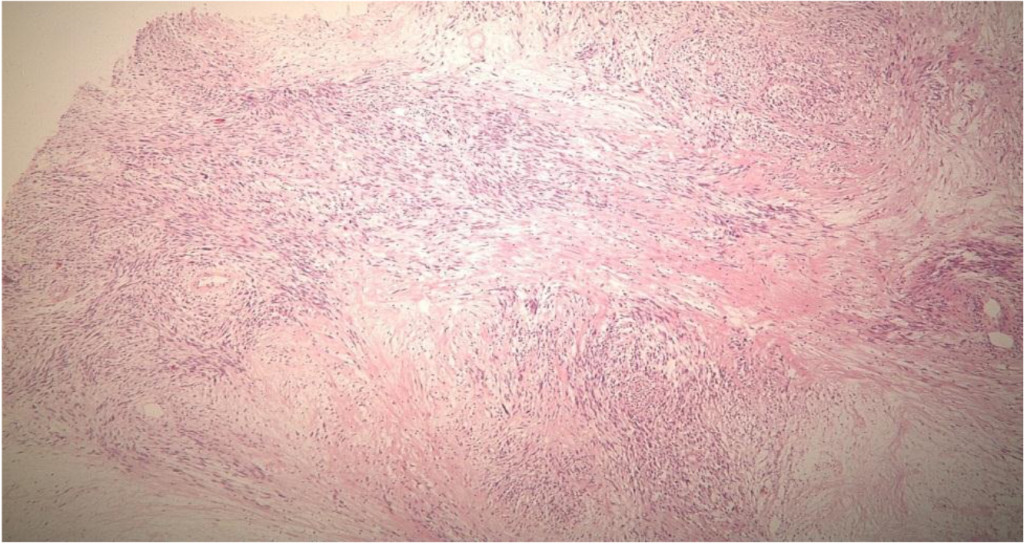
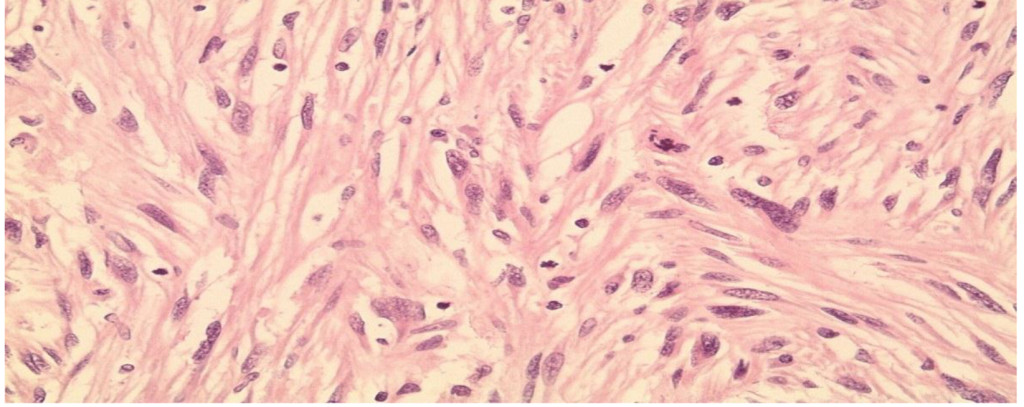
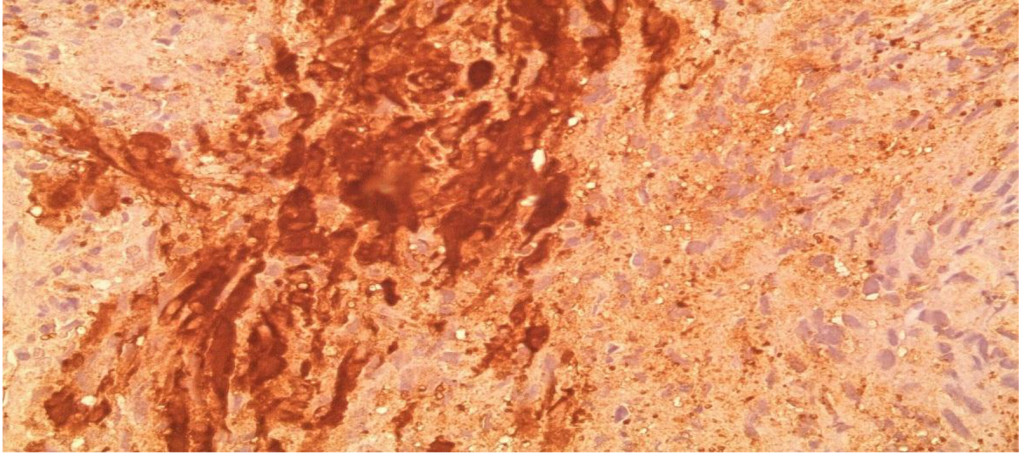
Of note, in January 2017, the patient required evaluation at an adjoining neurology clinic following ophthalmoplegia, loss of visual acuity in her right eye, and frequent headaches. The patient did present with recurrent headaches upon admission to the state psychiatric hospital. However, the frequency and severity of these headaches increased prior to her neurology consultation. An magnetic resonance imaging (MRI) scan revealed a mass extending through the orbital fissure along the cavernous sinus. The patient was subsequently diagnosed with Tolosa-Hunt Syndrome: a rare disorder characterized by non-specific inflammation in the superior orbital fissure and cavernous sinus [18]. The clinical presentation includes ophthalmoplegia and severe unilateral headaches with orbital pain. The patient received treatment with prednisone 60mg daily tapered to 15mg daily, in addition to acetaminophen (Tylenol) 650mg four times daily as needed, to alleviate her symptoms. Repeat MRI revealed minimal improvement in the mass. The patient continues to be followed by the neurology clinic with an uncertain prognosis.

Discussion

It is unknown whether symptomatic improvement can be attributed to one specific medication or a concomitant synergistic outcome. The patient’s BPRS score was report ed as 70 in November 2012. Following the initiation of NAC, the patient’s BPRS score decreased from 70 to 61 in December 2012. Following the initiation of sarcosine, the patient’s BPRS score was unchanged with a reported score of 61 in January 2012. If sarcosine were to elicit a psychotropic response, a decreased BPRS score would be expected shown as a steeper negative slope of the BPRS data line (shown in Figure 1A). The patient’s BPRS score decreased from 61 to 56 in February 2013, which could indicate a delayed response from sarcosine or be a result of doxepin (Sinequan) initiation. Following the initiation of doxepin (Sinequan) in February 2012, the patient’s BPRS score decreased from 56 to 54 in March 2013, and then continued trending downward.

There were no major fluctuations in PRN use following the initiation of NAC and sarcosine. Figure 1A shows a steep increase in hydroxyzine pamoate (Vistaril) use from December 2012 to January 2013. This was likely a result of the manufacturing discontinuation of chloral hydrate, because the patient was transitioned to hydroxyzine pamoate by the prescriber as the selected alternative to chloral hydrate. There were peaks of hydroxyzine pamoate (Vistaril) and diphenhydramine (Benadryl) use over the course of NAC and sarcosine treatment. These peaks of use tended to occur in May, and again between October and January. It is unclear what may have caused these changes in PRN use, but it may possibly be related to seasonal changes. Increased pain and discomfort, along with long-term steroid treatment may also have resulted in mood and behavioral changes leading to increased PRN use.

Sarcosine became unavailable in April 2017 due to the reclassification of sarcosine to a Category 1 substance by the FDA. Category 1 FDA designation excludes use of the agent for compounding until further efficacy and safety data is available for review [19]. The patient received her last dose of sarcosine on 6/19/17. Following the discontinuation of sarcosine, the patient’s hydroxyzine pamoate (Vistaril) use increased from 14 PRN doses in June 2017 to 26 PRN doses in July 2017.  The increased PRN use following sarcosine discontinuation occurred despite the sustained lower BPRS score and reduced reports of aggressive behavior (Table 3). This could be a result of a “placebo” effect with sarcosine use or may indicate that there could have been an improvement “plateau” with sarcosine use. It could also indicate that NAC is the agent responsible for this initial and continued improvement in BPRS score. Increased risk for loss of behavioral control could have possibly been mitigated by the administration of psychiatric medications as well as the use of behavioral interventions initiated by staff. Thus decreasing the need for a CG or R/S following sarcosine discontinuation.

It is of interest that this patient was diagnosed with Tolosa-Hunt Syndrome. There are previous reports linking sarcosine to the progression of prostate and breast cancer [11, 20, 21]. Two patients diagnosed with breast cancer later presented with diffuse orbital involvement of the extraocular muscles, simulating Tolosa-Hunt syndrome [21]. Breast cancer is known to metastasize and can involve ocular structures. The patient in this case does not have a known personal or  immediate family history of cancer to date. The association between sarcosine, cancer and Tolosa-Hunt syndrome is not clear, but should receive attention as the use of CAM becomes even more common.

Conclusion

There is evidence to suggest that CAM therapies, including sarcosine and NAC, can provide some therapeutic benefit to patients suffering from treatment-resistant schizophrenia who have exhausted other therapy options. The patient discussed in this case report experienced a decrease in her BPRS score following the initiation of NAC, however the magnitude of the decrease was more robust with NAC than that seen with the initiation of sarcosine.  When sarcosine was discontinued there was not an increase of BPRS scores as would be expected if sarcosine were the agent responsible for her improvement.

NAC may have been the agent responsible for the patient’s symptom improvement versus a concomitant synergistic outcome with NAC and sarcosine. However, the patient is still hospitalized to date, which does question the efficacy of these alternative medication therapy options. Little is known about the long-term effects of NAC or sarcosine, when used for any patient, whether diagnosed  with psychiatric illness or not. While there is no clear association, more studies pertaining to the long-term safety outcomes of NAC and sarcosine exposure should be explored before recommendations are made to promote this psychiatric therapy intervention.

References

  1. Yang AC, Tsai SJ (2017) New Targets for Schizophrenia Treatment beyond the Dopamine Hypothesis. Int J Mol Sci 18. crossref]
  2. Stahl SM, Grady MM Stahl’s (2011) Stahl’s Essential Psychopharmacology: Neuroscientific Basis and Practical Applications. (4th edn), Cambridge University Press, Cambridge, UK.
  3. Javitt DC, Zukin SR, Heresco-Levy U, Umbricht D (2012) Has an angel shown the way? Etiological and therapeutic implications of the PCP/NMDA model of schizophrenia. Schizophr Bull 38: 958–966. [crossref]
  4. Lee MY, Lin YR, Tu YS, Tseng YJ, Chan M, et al. (2017) Effects of sarcosine and N, N-dimethylglycine on NMDA receptor-mediated excitatory field potentials. J Biomed Sci 24: 18. [crossref]
  5. Berk M, Copolov D, Dean O, Lu K, Jeavons S, et al. (2008) N-acetylcysteine as a glutathione precursor for schizophrenia, double-blind, randomized, placebo-controlled trial. Biol Psychiatry 64: 361–368. [crossref]
  6. Dean O, Giorlando F, Berk M (2011) N-acetylcysteine in psychiatry: current therapeutic evidence and potential mechanisms of action. J Psychiatry Neurosci 36: 78–86. [crossref]
  7. Gysin R, Kraftsik R, Sandell J, Bovet P, Chappuis C, et al. (2007) Impaired glutathione synthesis in schizophrenia: convergent genetic and functional evidence. Proc Natl Acad Sci USA 104: 16621–16626. [crossref]
  8. Dringen R, Gutterer JM, Hirrlinger J (2000) Glutathione metabolism in brain metabolic interaction between astrocytes and neurons in the defense against reactive oxygen species. Eur J Biochem 267: 4912–4916. [crossref]
  9. Chen G, Shi J, Hu Z, Hang C (2008) Inhibitory effect on cerebral inflammatory response following traumatic brain injury in rats: a potential neuroprotective mechanism of N-acetylcysteine. Mediators Inflamm 2008: 716458. [crossref]
  10. Lehman AF, Lieberman JA, Dixon LB, McGlashan TH, Miller AL, et al. (2004) Practice guideline for the treatment of patients with schizophrenia, second edition. Am J Psychiatry 161: 1–56. [crossref]
  11. Amiaz R, Kent I, Rubinstein K, Sela BA, Javitt D, et al. (2015) Safety, tolerability and pharmacokinetics of open label sarcosine added on to anti-psychotic treatment in schizophrenia – preliminary study. Isr J Psychiatry Relat Sci 52: 12–15. [crossref]
  12. Tsai G, Lane HY, Yang P, Chong MY, Lange N (2004) Glycine transporter I inhibitor, N-methylglycine (sarcosine), added to antipsychotics for the treatment of schizophrenia. Biol Psychiatry 55: 452–456. [crossref]
  13. Lane HY, Chang YC, Liu YC, Chiu CC, Tsai GE (2005) Sarcosine or D-Serine add-on treatment for acute exacerbation of schizophrenia: a randomized, double-blind, placebo-controlled study. Arch Gen Psychiatry 62: 1196–1204. [crossref]
  14. Lane HY, Liu YC, Huang CL, Chang YC, Liau CH, et al. (2008) Sarcosine (N-methylglycine) treatment for acute schizophrenia: a randomized, double-blind study. Biol Psychiatry 63: 9–12. [crossref]
  15. Lane HY, Lin CH, Huang YJ, Liao CH, Chang YC, et al. (2010) A randomized, double-blind, placebo-controlled comparison study of sarcosine (N-methylglycine) and D-serine add-on treatment for schizophrenia. Int J Neuropsychopharmacol 13: 451–460. [crossref]
  16. Farokhnia M, Azarkolah A, Adinehfar F, Khodaie-Ardakani MR, Hosseini SM, et al. (2013) N-acetylcysteine as an adjunct to risperidone for treatment of negative symptoms in patients with chronic schizophrenia: a randomized, double-blind, placebo-controlled study. Clin Neuropharmacol 36: 185–192. [crossref]
  17. Zheng W, Zhang QE, Cai DB, Yang XH, Qiu Y, et al. (2018) N-acetylcysteine for major mental disorders: a systematic review and meta-analysis of randomized controlled trials. Acta Psychiatr Scand 137: 391–400. [crossref]
  18. Cohn DF, Carasso R, Streifler M (1979) Painful ophthalmoplegia: the Tolosa-Hunt syndrome. Eur Neurol 18: 373–381. [crossref]
  19. U.S. Food and Drug Administration (2017) Update: FDA revises final guidance on interim policy for certain bulk drug substances used in compounding. Washington, D.C, USA.
  20. Sreekumar A, Poisson LM, Rajendiran TM, Khan AP, Cao Q, et al. (2009) Metabolomic profiles delineate potential role for sarcosine in prostate cancer progression. Nature 457: 910–914. [crossref]
  21. Harnett AN, Kemp EG, Fraser G (1999) Metastatic breast cancer presenting as Tolosa-Hunt syndrome. Clin Oncol (R Coll Radiol) 11: 407–409. [crossref]

Dutta’s Innovative work to prevent PPH

DOI: 10.31038/IGOJ.2018115

Introduction

Haemorrhage killed more women than any other complications of pregnancy in the history of mankind. Placenta previa, abruption placenta and uterine rupture are in three important causes of ante partum haemorrhage seen frequently at tertiary level care hospital claiming high maternal mortality and morbidity till date present existing surgical technique to tackle major degree placenta previa is found to be not effective method to control haemorrhage during LUCS causing high incidence of maternal mortality and morbidity. Hence to prevent uncontrolled haemorrhage due to major degree placenta previa, author has advocated new surgical technique (Dutta’s) to prevent uncontrolled haemorrhage during LUCS.

Methodology

New technique (Dutta’s) were undertaken during LUCS operation in a stepwise Manner > delivery of baby following lower segment incision > bilateral uterine artery ligation > inj. Tranexamic acid (1000 gm) intramuscular > oxytocin infusion ( 10 unit) > delivery of placenta and its membrane and checked properly > if tear or laceration interrupted suture by catgut 1–0 > uterine wound were closed in two layers by catgut no 1 after securing bleeding from placental site or uterine wound > abdominal wall closed, after toileting the abdominal cavity, in presence of good uterine contraction. Main objective of the study to find out how to reduce maternal mortality and morbidity, after advocating (Dutta’s) new technique, during LUCS operation, for major degree placenta previa.

Benefits: Operative findings: good effectiveness to control bleeding, caesarean hysterectomy not required, immediate post operative bleeding – less. Maternal mortality – nil, maternal morbidity – less, good fetal outcome. Follow up up to two years: mentrual cycle normal, future fertility – good

Conclusion

Hence by adopting the new surgical technique (Dutta’s) during LUCS it was found to be simple, safe, quick procedure, reduce perfusion pressure, permits time for further steps thereby avoiding unnecessary ligation of hypogastric, bill and caesarean hysterectomy. Maternal mortality and morbidity were also found to be reduced. It is a suitable technique for rural based tertiary care hospital in absence of adequate blood transfusion facility.

Reference

  1. Damania KR, Salvi VS, Walvekar Vs. A Study of maternal mortality over 20 years. J Obst Gyn India 1989; 39: 61–5.
  2. Motwani MN, Sheeth J. Maternal Mortality from APH: Review of 20 years death. J Obst Gyn India 1990; 39: 364–6.
  3. Bowie JD, Rochester D, Cadkin AV, et al. Accuracy of placental localization by ultrasound. Radiology 1978; 128: 177–80.
  4. Cotton D, Read J, Paul R, et al. The conservative aggressive management of placenta praevia. Am J Obstet Gynecol 1989; 137: 687–95.
  5. Davis ME, Campbell A. The management of placenta praevia in the Chicago Lyingin Hospital. Surg Gynaec and Obst 1946; 83: 777.
  6. Evans, McShane. The efficacy of hypogastric artery ligation in obstetric haemorrhage. Surg Gynaecol Obstet 1985; 160: 250–3.
  7. Hill DJ, Beischer NA. Placenta praevia without antepartum haemorrhage Aust N Z J Obstet Gynaeclo 1980; 20: 21–3.
  8. Macafee CHG. Modern views on the management of placenta praevia. Post Card, Ded Journ 1949; 25: 297.
  9. McClure N, Dornal JC. Early identification of placenta praqevia (see comments). Br J Obstet Gynaecol 1990; 98–625.
  10. Render S. Placenta preavia and previous lower segment caesarean secton. Surg Gynaec and Obst 1954; 98: 625.
  11. Weiser EB. Managing second trimester placenta praevia. Contrib Gynecol Obstet 1980; 15: 187.

African KhoeSan Ancestry Linked to High-Risk Prostate Cancer

DOI: 10.31038/JMG.2018114

Abstract

Background: Genetic diversity is greatest within Africa, in particular Southern Africa. Within the United States, African ancestry has been linked to lethal high-risk prostate cancer. Here we investigate the contribution of African ancestral fractions to high-risk prostate cancer in two South African populations.

Methods: Genetic fractions were determined for 152 South African men of African (Black) or African-admixed (Coloured) ancestries, in which 40% showed high-risk prostate cancer.

Results: Averaging an equal African to non-African ancestral contribution in the Coloured, we found African ancestry to be linked to high-risk prostate cancer (P-value = 0.0477).

Adjusting for age, the associated African ancestral fraction was driven by a significant KhoeSan over Bantu contribution, defined by Gleason score ≥ 8 (P-value = 0.02329) or prostate specific antigen levels ≥ 20 ng/ml (P-value = 0.03713). Although not significant, the mean overall KhoeSan contribution was increased in Black patients with high-risk (11.8%) over low-risk (10.9%) disease. Using KhoeSan ancestry as a surrogate for high-risk prostate cancer, we identified four potential risk loci within chromosomal regions 2p11.2, 3p14, 8q23 and 22q13.2 (P-value = all age-adjusted < 0.01).

Conclusions: This is the first study to suggest a link between ancient KhoeSan ancestry and a common modern disease.

Key words

African ancestry; prostate cancer; KhoeSan; high-risk disease; ancestral fractions; ancestry informative markers

Introduction

High-risk prostate cancer (HRPCa) accounts for approximately 15% of diagnoses in Western countries, with significant potential for associated lethality [1]. Although a number of HRPCa classifications have been proposed, including variations in the requirement for clinical tumor staging and serum prostate specific antigen (PSA) levels, HRPCa is typically defined as pathological Gleason score (GS) ≥ 8 or PSA ≥ 20 ng/ml at diagnosis. In the United States, African American men are disproportionally affected by HRPCa and in turn present with the highest associated mortalities [2]. Additionally, HRPCa is disproportionally observed in men from sub-Saharan Africa and Southern Africa [3, 4]. In the latter study, compared with African Americans, Black South African men are at a 2.1-fold and 4.9-fold greater risk for presenting at diagnosis with GS ≥ 8 and PSA ≥ 20 ng/ml, respectively. While socioeconomic and lifestyle factors, as well as late detection, all contribute to the disproportionate impact of HRPCa within African Americans, the significance of genetic contribution is becoming increasingly evident [2,5]. However, data within Africa is severely lacking.

In addition to significant HRPCa presentation in Black South Africans, [4] HRPCa is also elevated within the African-admixed population from South Africa, the South African Coloured [4, 6]. While Black South Africans represent a uniquely African ancestry, predominantly Bantu, with contributing KhoeSan heritage, the Coloured arose as a result of intermarriage between initial European colonists, Dutch East Indian slaves and indigenous Bantu and KhoeSan Southern Africans [7, 8]. Therefore, the genetic ancestral fractions of the South African Coloured uniquely represent the broad spectrum of prostate cancer racial disparity reported in the United States, specifically African-biased high-risk, European-biased intermediate-risk (GS = 7) and Asian-biased low-risk prostate cancer (LRPCa; GS = 6). In this study we determine if African ancestry, specifically Bantu or KhoeSan African ancestry, is preferentially linked to HRPCa presentation in the region.

Participants and Methods

Study participants

South African men self-identifying as Black (n=68) or Coloured (n=84) presented at the urology clinics at Polokwane (Limpopo Province), Steve Biko (Gauteng Province) or Tygerberg (Western Cape Province) Academic Hospitals. Participants recruited within Limpopo and Gauteng form part of the previously described Southern African Prostate Cancer Study (SAPCS) [4,9] DNA was extracted from whole blood using standard methods (QIAGEN Inc., Germantown, Maryland).

Clinical and pathological presentation

Presence or absence of prostate cancer was provided by clinic-pathological diagnosis. All biopsy cores underwent independent rescoring for the 50 Black cases and 18 Black cancer- free patients as previously described [10] and the 84 Coloured cases (by AvW and WB). HRPCa defined as a GS ≥ 8, was confirmed for 33 Black (66%) and 27 Coloured (32%), or PSA ≥ 20 ng/ml (irrespective of pathological features), was observed for 36 Black (72%) and 39/81 Coloured (48%). LRPCa defined as a GS = 6, was observed for seven Black (14%) and 12 Coloured (14%), or PSA <10 ng/ml for six Black (12%) and 23 Coloured (28%). The remaining patients were classified as presenting with intermediate risk disease.

Genomic data generation

Illumina Infinium HumanCore Beadchip (>250K markers) genotype array data was either made available (68 Black)10 or generated (84 Coloured). Data inclusion was dependant on a GenTrain score (a measure representing the reliability of the genotype calls) of at least 0.5 or more (Illumina GenomeStudio 1.9.4) with further selection of autosomal markers based on a linkage disequilibrium r2 value >0.2 within a 50-variant sliding window, advanced by five variants at a time (SNP and Variation Suite 8.3.1, Golden Helix).

Determining ancestral fractions

Genomic data from population representatives (in brackets) for different African ancestral identifiers were used and defined as: KhoeSan (Ju/’hoan), [7] West African (Mandinka), Proto- Bantu (Yoruba), West Bantu (Bamoun and Fang), and East Bantu (Luhya), [11] while non- African ancestral identifiers included: Asian (Han Chinese) and European (Utah Americans) (Illumina iControl data). African American data (n=48) was sourced from the International Genome Sample Resource. Ancestral fractions were estimated using STRUCTURE 2.3.3 (5000/10000 burn-in iterations, 10000/20000 replicates) assuming different ancestral contributions (≥ five replications) [12].

Statistical analyses

Statistical analyses were performed in R (https: //www.r-project.org) using linear regression (lm) of continuous or categorical data. One-way ANOVA was used for establishing significant disease predictors. Two tailed t-test was used to determine an association between African ancestry and risk extremes, namely HRPCa versus LRPCa. RFMix analysis for local ancestry inference was used to estimate admixture across 22 individual pairs of autosomes [13]. Genotyping data of 84 Coloured patients were removed if unmapped to GRCh37, and phased using SHAPEIT2 with the 1000 Genomes Phase 3 reference panel [14]. RFMix was run with two expectation maximization iterations and 0.2 cM window size and results of each patient along with the population representatives described above were converted to genomic intervals with ancestral identifiers. The intervals where KhoeSan contributions between HRPCa and LRPCa (defined by either GS or PSA) differed greater than three times were compared using Fisher’ exact significance test and then Bonferroni correction (46 and 45 intervals compared based on GS and PSA values, respectively). Significant phased intervals greater than one megabase were chosen for single marker and haplotype block association tests using Haploview (https: //www.broadinstitute.org/haploview/haploview). The RFMix results with posterior probability greater than 0.9 were modelled for migration timing and gene flow estimation using the ancestry tracts analysis (TRACTS) program [15]. The best-fit model assuming KhoeSan, Bantu and Eurasian contributions, was selected based on likelihood values.

Results

Population specific ancestral fractions

STRUCTURE analysis using 10,295 autosomal markers provided detailed population substructure (Figure 1 based on eight reference populations). In contrast to African Americans, the African ancestral contributions to the study participants are almost exclusively Bantu and KhoeSan. While African Americans lack KhoeSan contributions, their African ancestral contribution is largely West African (non-Bantu with a lesser West/Proto-Bantu contribution) and East Bantu, with a significant European-biased non-African contribution.

The Bantu contribution in our study participants can be defined as uniquely Southern Bantu, 69.6% in the Black and 17.1% in the Coloured, with a smaller East Bantu fraction, 14.5% and 9%, respectively. KhoeSan contributions range from minimal up to 20.8% in the Black and as much as 68.1% in the Coloured.

While the Black participants show exclusive African heritage, the Coloured present overall with an almost equal non-African to African fraction. A 9-fold increase in the number of ancestry informative markers through limiting founder population inclusion (91,263 markers), allowed for further separation of the non-African Coloured fractions into European (range 0 to 62.3%) and Asian (range 0. 3 to 42.2%) (Supplementary Figure 1). To better understand the extent of African ancestral contributions in our study participants, we used TRACTS to model their migration history. Consequently, we defined the Coloured as migratory non-African, with significant KhoeSan contributions from 11 (31.5%) to 10 (7.1%) generations ago, followed by Bantu contributions appearing 8 (20.4%) and 7 (11.8%) generations ago (Figure 1). In contrast, the KhoeSan contribution to the Black population appeared as a single pulse migration event roughly 21 generations ago (11.1%; Optimal likelihoods value: -255.7).

JMG2018-104-VanessaHayesSA_F1

Figure 1. Population substructure of the study participants. (Top Panel) STRUCTURE analysis for 10,295 autosomal markers and eight ancestral populations for the 68 Black (50 cases and 18 controls) and 84 Coloured South African (SA) study participants compared with African Americans and reference populations from Africa (Ju/’hoan, Mandinka, Yoruba, Bamoun, Fang and Luhya) and outside of Africa (European and Han Chinese). (Middle Panel) Using STRUCTURE analysis we determined the African ancestral fractions, defined as KhoeSan, West/Proto-Bantu, East Bantu and Southern Bantu, as well as the non-African ancestral fractions, defined as European and Eurasian, within our study cohort with comparisons made with the African Americans. (Bottom Panel) Magnitude and origin of migrants is shown with different colors in bar and pie charts representing three ancestral contributions. The size of pie charts is proportional to percentage of migrants, with the earliest generation equal to 100% and a decrement in the next generation.

JMG2018-104-VanessaHayesSA_F3

Figure S1. Ancestral fractions determined using STRUCTURE analysis 84 South African Coloured men with PCa using 114,199 autosomal markers and K=4 (5000 burn in and 10000 reps). Ancestral contributions are defined as African-KhoeSan (yellow), African-Bantu (green), European (blue) and Asian (red).

African ancestral fractions linked to HRPCa

Presenting with an almost even distribution of African to non-African heritage, the Coloured provide an ideal genetic resource to further evaluate the African ancestral contribution to HRPCa. We observed a significant association between total African ancestry and prostate cancer pathology. Patients with HRPCa (GS ≥ 8) showed an average of 54.8% African ancestry compared to the 37.3% observed for patients with LRPCa (GS = 6) (t = 2.0974, P– value = 0.0477). Furthermore, we observed a significant KhoeSan over Bantu African contribution to HRPCa, specifically the average KhoeSan contributions to GS ≥ 8 versus 6 tumors was 31% and 20.1%, respectively (t = 2.4491, P-value = 0.0233) and for PSA ≥ 20 versus < 10 ng/ml tumors, 31% and 24.1%, respectively (t=2.1455, P-value = 0.0371).

Although the total KhoeSan contribution to the Black patients was less significant (range 0% to 21%), we did note a slight increase in total KhoeSan ancestral contribution within patients presenting with GS ≥ 8 versus 6 tumors (mean 11.8% vs 10.9%; t = 0.3249, P-value = 0.754).

HRPCa loci enriched for KhoeSan ancestral contribution

Associating excess KhoeSan contribution within HRPCa presentation in the Coloured, we performed a local-ancestry inference analysis for KhoeSan-specific enrichment, using RFMix [13]. The most significant age-adjusted KhoeSan ancestral association with GS ≥ 8 was observed at chromosome 22q13.2 (95 markers; GRCh37 positions 40,178,619–42,552,253; ANOVA Pvalue = 0.0062) and chromosome 2p11.2 (332 markers; positions 80,741,406- 85,833,046; ANOVA P-value = 0.0083) (Figure 2). While KhoeSan ancestry was also associated with an elevated PSA ≥ 20 ng/ml at 2p11.2 (ANOVA P-value = 0.0004), two additional PSA-HRPCa associated loci were identified, including chromosome 3p14 (127 markers; positions 57,971,523–59,436,405; ANOVA P-value = 0.0026) and 8q23 (79 markers; positions 111,028,667 to 112,656,042; ANOVA P-value = 0.0052). Performing haplotype and single marker association test we identified two markers, rs10103786 and rs4504665, within 8q23 that remained significant after correcting for multiple testing (1,000 permutations; Chi-Square = 15.365 and 11.245; Pvalue = 0.007 and 0.048, respectively).

JMG2018-104-VanessaHayesSA_F2

Figure 2. Candidate high-risk prostate cancer (HRPCa) chromosomal regions defined as an over-abundance of KhoeSan heritage. Legends show the proportion of Coloured patients presenting with HRPCa (red) versus low-risk prostate cancer (LRPCa; blue); asterisks (**) indicate regions with age-adjusted P-values < 0.01; 1/1, 0/1 or 0/0 represent the presence of KhoeSan ancestry within both DNA strands, a single strand or none, respectively. The local ancestry is defined using RFMix.

Discussion

We determined the contribution of African ancestral contributions defined as Bantu and KhoeSan to increased HRPCa presentation within South Africa. In contrast to African Americans, Black South Africans present with uniquely Bantu, specifically Southern over West Bantu or West non-Bantu contribution, with a single pulse KhoeSan contribution occurring over 550 years ago. The South African Coloured present, on average, with matched non-African to African genetic contributions. While the non-African fraction includes both European and Asian contributions, the African initiating admixture event predates African American admixture by two generations and includes significant KhoeSan contributions followed to a lesser extent by Bantu contribution. We demonstrate that the South African Coloured represents a unique and alternative resource to African American studies for identifying significant African ancestral contributions to elevated HRPCa.

Confirming an African ancestral link to HRPCa within the Coloured, we showed further that the observed significance appears to be driven largely by a KhoeSan over Bantu contribution. To the best of our knowledge, this is the first reported link between ancient KhoeSan ancestry and prognosis of a common modern condition. It would be reasonable to speculate that prostate cancer risk alleles would not be under negative selection within a hunter-gatherer society with an on average younger overall lifespan. Using KhoeSan ancestry as a surrogate for HRPCa, we identify four chromosomal regions as potential risk loci for aggressive presentation within the region. The 2p11.2 locus, enriched for both GS ≥ 8 and PSA ≥ 20 ng/ml, has previously been associated with PCa risk [16, 17]. A recent study, using capture-based Chromosome Conformation Capture (3C) sequencing, identified a significant physical long-range interaction between common variants within the largely non-coding 2p11.2 region and the candidate tumor suppressor gene CAPG, with expression quantitative trait locus signals at rs1446669, rs699664 and rs1078004 (absent within our array content) [18]. Additionally, the GS-associated 22q13.2 region has previously been associated with HRPCa in a roughly 1,000 strong Swedish genome-wide association study, with independent rs7291691 cross study validation. Located at position 38,778,569, the latter common variant is upstream of the region identified in this study, which may indicate a population specific impact [19]. Notably, the PSA-associated regions, 3p14 and 8q23, are both proximal to known prostate cancer risk loci, including a deletion of the 3p14.1–3p13 region HRPCa [20,21] and the common 8q24 prostate cancer risk loci [18].

In summary, this is the first study to link KhoeSan ancestry to prostate cancer, specifically HRPCa presentation within a uniquely admixed population with African, KhoeSan and Bantu, as well as non-African, European and Asian, ancestries. Using KhoeSan ancestry as a surrogate for HRPCa, we identify potential candidate loci, although one must caution that these regions are only suggestive and require larger study numbers to meet levels of genome-wide significance. However, previously two regions, 2p11 and 22q13 have been suggested as HRPCa risk loci, while two variants at 8q23 remained significant when accounting for multiple testing. Our findings suggest that modern humans earliest ancestors may have been carrying genomic signatures for HRPCa, which would not have been selected against due to later age of onset of prostate cancer.

Acknowledgements

The authors acknowledge the study participants, Sister Heather Money and nursing staff at Western Province Blood Transfusion Service (WPBTS), as well as additional urological members of the South African Prostate Cancer Study (SAPCS), Dr Richard L. Monare and Dr Smit van Zyl.

Contributors

DCP and VMH conceived and designed the study. DCP, PF, AvdM, PAV and MSRB enrolled study subjects and maintained clinical databases. MSRB and VMH direct, manage and fund the SAPCS. VMH sourced funding for genomic analyses. AvdM and MSRB provided clinical revision. AvW and WB performed pathological analyses. DCP and RJL isolated the samples, generated genomic data and provided genetic reports. DCP, WJ, EKFC and VMH performed data analysis and critical interpretation. DCP, WJ and EKFC performed statistical analyses. DCP, WJ and VMH drafted the manuscript. All authors reviewed the manuscript.

Funding

This work was supported by project grants supporting the Southern African Prostate Cancer Study (SAPCS) including: the Cancer Foundation of South Africa (CANSA), the National Research Foundation (NRF) of South Africa, and the Medical Research Council (MRC) of South Africa. Additional support was received from the Australian Prostate Cancer

Research Centre (APCRC) New South Wales (NSW) and by a Perpetual IMPACT grant to the Garvan Foundation, Australia. EFKC and DCP are supported by the Movember Australia and the Prostate Cancer Foundation Australia (PCFA) Prostate Cancer Bone Metastasis (ProMis) Movember Revolutionary Team Award (MRTA), while VMH is supported by the Petre Foundation and University of Sydney Foundation, Australia.

Competing interests: None declared.

Ethics approvals and permits: Participants were recruited and consented according to research ethics approvals granted from the Provincial Government of Limpopo (#32/2008) and the University of Limpopo Medical Research Ethics Committee (#MREC/H/28/2009), the University of Pretoria Human Research Ethics Committee (HREC #43/2010, including US Federal wide assurance FWA00002567 and IRB00002235 IORG0001762), Stellenbosch University HREC (#N08/03/072) or the SANBS HREC (#2012/11). DNA was shipped to Australia under the Republic of South Africa Department of Health Export Permits in accordance with the National Health Act 2003 (J1/2/4/2 #1/10, #1/12 and #3/15) and as per institutional Material Transfer Agreements. Genomic interrogation was performed in accordance with St Vincent’s Hospital (SVH) HREC site-specific approval (#SVH15/227).

References

  1. Chang AJ, Autio KA, Roach M 3rd, Scher HI (2014) High-risk prostate cancer-classification and therapy. Nat Rev Clin Oncol 11: 308–323. [crossref]
  2. Chang AJ, Autio KA, Roach M 3rd, Scher HI (2014) High-risk prostate cancer-classification and therapy. Nat Rev Clin Oncol 11: 308–323. [crossref]
  3. McGinley KF, Tay KJ, Moul JW1 (2016) Prostate cancer in men of African origin. Nat Rev Urol 13: 99–107. [crossref]
  4. Rebbeck TR, Devesa SS, Chang BL, et al. (2013) Global patterns of prostate cancer incidence, aggressiveness, and mortality in men of african descent. Prostate Cancer 2013: 560857.
  5. Tindall EA, Monare LR, Petersen DC, van Zyl S, Hardie RA, et al. (2014) Clinical presentation of prostate cancer in black South Africans. Prostate 74: 880–891. [crossref]
  6. Tan DS, Mok TS2, Rebbeck TR (2016) Cancer Genomics: Diversity and Disparity Across Ethnicity and Geography. J Clin Oncol 34: 91–101. [crossref]
  7. Heyns CF, Fisher M, Lecuona A, et al. (2011) Prostate cancer among different racial groups in the Western Cape: presenting features and management. S Afr Med J 101: 267–70.
  8. Petersen DC, Libiger O, Tindall EA, Hardie RA, Hannick LI, et al. (2013) Complex patterns of genomic admixture within southern Africa. PLoS Genet 9: e1003309. [crossref]
  9. Patterson N, Petersen DC, van-der-Ross RE, et al. (2010) Genetic structure of a unique admixed population: implications for medical research. Hum Mol Genet 19: 411–19.
  10. Tindall EA, Bornman MS, van-Zyl S, et al. (2013) Addressing the contribution of previously described genetic and epidemiological risk factors associated with increased prostate cancer risk and aggressive disease within men from South Africa. BMC Urol 13: 74.
  11. McCrow JP, Petersen DC, Louw M, et al. (2016) Spectrum of mitochondrial genomic variation and associated clinical presentation of prostate cancer in South African men. Prostate 76: 349–58.
  12. Henn BM, Gignoux CR, Jobin M, et al. (2011) Hunter-gatherer genomic diversity suggests a southern African origin for modern humans. Proc Natl Acad Sci U S A 108: 5154–62.
  13. Pritchard JK, Stephens M, Donnelly P (2000) Inference of population structure using multilocus genotype data. Genetics 155: 945–59.
  14. Maples BK, Gravel S, Kenny EE, Bustamante CD (2013) RFMix: a discriminative modeling approach for rapid and robust local-ancestry inference. Am J Hum Genet 93: 278–288. [crossref]
  15. Delaneau O, Marchini J (2014) 1000-Genomes-Project-Consortium. Integrating sequence and array data to create an improved 1000 Genomes Project haplotype reference panel. Nat Commun 5: 3934.
  16. Gravel S (2012) Population genetics models of local ancestry. Genetics 191: 607–619. [crossref]
  17. Akamatsu S, Takata R, Haiman CA, Takahashi A, Inoue T, et al. (2012) Common variants at 11q12, 10q26 and 3p11.2 are associated with prostate cancer susceptibility in Japanese. Nat Genet 44: 426–429, S1. [crossref]
  18. Kote-Jarai Z, Olama AA, Giles GG, et al. (2011) Seven prostate cancer susceptibility loci identified by a multi-stage genome-wide association study. Nat Genet 43: 785- 91.
  19. Du M, Tillmans L, Gao J, Gao P, Yuan T, et al. (2016) Chromatin interactions and candidate genes at ten prostate cancer risk loci. Sci Rep 6: 23202. [crossref]
  20. Sun J, Zheng SL, Wiklund F, Isaacs SD, Li G, et al. (2009) Sequence variants at 22q13 are associated with prostate cancer risk. Cancer Res 69: 10–15. [crossref]
  21. Feik E, Schweifer N, Baierl A, et al. (2013) Integrative analysis of prostate cancer aggressiveness. Prostate 73: 1413–26.

Stress and Cell Death in Brassica

DOI: 10.31038/JMG.2018113

Abstract

As a sessile organism, many plants have resolved to improve on strategies focused on detecting and resisting many types of stress. Understanding of these strategies and how to add them to sensitive plants have become a necessity in a world with more disadvantage conditions like: extreme temperatures, nutrients starvation, plagues and diseases. The capability of manipulate, enhance, in some cases retard or abolish these processes could help to improves cultivar production. Many plants of Brassicaceae family are some of most important crops worldwide, including Brassica oleracea, B. napus and B. juncea. Currently the genome is sequence and is freely accessible. This is one of many advantages in that molecular marker specific for this species. Moreover, the easy cultivation and accessibility worldwide, as well as the size and life cycle make this species good models to study stress and cell death. Several studies of tolerance and response to different types of stress and cell death have been carried out in many species from this genus. Therefore, some data is accumulating on several pathways.

Keywords

brassica, stress, cell death, apoptosis, stress tolerance

Introduction

As a sessile organism plants take advantage of different strategies that are focused on detecting and resisting many types of stress. Understanding of these strategies has become necessary due to increasingly disadvantage conditions: extreme temperatures, nutrients starvation, plagues and diseases. The capability to manipulate, enhance, overtake or in some cases retard or abolish these processes could help to improves cultivar production. Cell death is a consequence of either cell stress or involved in the lifecycle of the organism, and there is a close relationship of these two events. Moreover, the possibility of manipulating cell death in crops can be a way in which tolerance to crop stress can be improved or even accelerate or delay their maturation.

Brassicaceae family members are some of most important crops worldwide and have become a good model for study of different aspects of plant biology specially stress and cell death. Thanks to new powerful techniques such as proteomics and metabolomics, and a major number of complete genomes publication, it is possible to deepen in particular molecules related with stress and cell death or view a wide perspective of complex events.

1. Stress and cell death (RCD)

All organisms, including plants, are constantly suffering from changing environmental conditions and pathogen attacks which alters cellular homeostasis, causing damage in membranes and proteins structures, in first instance plants sense stress and producing and activating signal transduction pathways, this activates different mechanism under transcription control and try to repair damages [1]. Due to its condition as sessile organisms, plants develop multiple strategies to sense and contend against multiple stresses at the same time [2, 3]. They synthesize various molecules as proteins, amino acids (aa), carbohydrates and phospholipids to initiate an adaptive process to maintain homeostasis [1, 4, 5].

Now is clear that plant stress response is an interconnected network, which facilitates and produces an efficient and fast defense against environmental and biotic menaces and it is mediated by plant hormones and reactive oxygen species (ROS) that are detected through the plant [4, 6, 7]

Stress triggers a higher production of ROS which acts as a signal for the activation of stress response pathways, but when these defense mechanisms are not enough, the stress can result in cell death. Two mutually exclusive models are proposed to explain cell death triggers by stress. The conversion model involves the cessation of inhibitory signals of death after a homeostasis perturbation in a point in time and then it start to occur promoting signals, being the time briefer according to perturbation intensity. The competition model postulates that inhibitory and promoting signals coexist at the same time and the predomination of one of them depends of time and intensity of the perturbation and the successful of the adaptive response [8].

Cell death (CD) is part of the normal development and maturation cycles in living beings and part of many response patterns of tissues to external agents [9]. CD is necessary for plants and animals to develop correctly, for example; during metamorphosis of amphibians and insects, the morphogenesis of organs, and cell turnover required CD of certain cells in order for development to take place. In addition, the abnormal function of CD, as in an occurrence of multiple diseases, includes developmental disorders in plants and animals, as well as degenerative diseases and cancer in humans.

CD is classified as accidental cell death (ACD) and regulated cell death (RCD). RCD can be a programmed cell death (PCD) when it is part of the development cycle of an organism (see Figure 1). The ACD is a passive process that occurs when the intensity of a physical, chemical or mechanical stimulus is so great that cellular integrity deteriorates uncontrollably.

Web

Figure 1. Cell death can be due to a failure of the adaptive response to a stimulus or be part of the normal development of an organism. There are two categories of cell death: accidental and regulated. What triggers one or the other is the intensity of an external stimulus or develop. When regulated cell death is part of the normal life cycle of a cell or tissue then it is a programmed cell death. Only regulated cell death could be delayed or stopped through iRNA or protein inhibitors such as Z-VAD-FMK, a caspase inhibitor.

RCD is active processes by which specific cells can pose a threat to a complete organism are eliminated. For this reason in the RCD, the molecular signaling pathways that govern the different forms of it are ordered and are strictly controlled [10].

RCD is caused by external stimuli, that is means stress, but with a lower intensity. In the first instance, the adaptive response of the organism tries to restore homeostasis, but when this cannot be achieved, specific genetic machinery is activated that directs this type of cell death, as long as the external stimulus is not excessive. RCD can be influence by specific pharmacological or genetic means [11]. By making use of specific inhibitors, such as iRNA, caspase inhibitors like Z-VAD-fmk or cyclosporin A and sanglifehrin A, for each particular manifestation of MCR, the events that control the death of the cells can be stopped or delayed.

Cell death can be part of a cell development program and it is then that we talk about PCD [8]. This term refers to the physiological cases of cell death that occur as part of the embryogenic or post embryogenic development in the formation of tissues and organs. Some of these organs and tissues are embryonic suspensors, xylem tracheary elements, roots and lateral roots [12]. PCD also occurs to maintain the homeostasis of a tissue, referring in this case to the balance between death and cell proliferation [12, 13].

2. Tools to the study of stress and cell death in brassica species

Currently there are many techniques to study a great variety of biological phenomena, including cell death and stress. These techniques let us learn about a single gene or molecule, including protein, lipids, and amino acids, among others or see a wide net of molecules interacting at the same time.

New bioinformatics software allows us to take advantage of the information from genes related with stress and cell death, such as BLAST and MEGA, which contains MUSCLE and CLUSTAL or RAxml to perform evolutionary studies between brassica species. Use proteomics, transcriptomic or metabolomics approaches to make new models or refine those that already exist, using bioinformatics tools such as Cutadapt, Trinity and N50 to perform transcriptomic, AMIX, SIMCA, METABOANALIZER for metabolomics and MASCOT, SEQUEST for proteomic analysis. Many databases are currently availables with invaluable information of the main brassica species: B. oleracea, B. rapa, B. napusand B juncea . In these data bases is possible to find molecular markers, genomes, expression sequence tags (EST), metabolic pathways and sequence specific searching tools as well as information about specific genes and the kind of evidence supplied (while bioinformatics level to protein level). This information gives us an excellent point of departure to start the study of specific molecules to look for interactors, novel functions, confirm the homology with others, discover specific mechanisms of each specie, define molecular markers of resistance that help breeders to select the best plants or possible targets of genetic enhancement.

3. Stress in brassica species

Abiotic stress and attacks pests and pathogens represent big challenge for agriculture, because plants spend a large part of their resources coping with these threats, decreasing their performance in the field. Current estimates indicate that arable land will be reduce by >50% for most major crop plants and current climate prediction models indicate that average surface temperatures will rise by 3–5 C in the next 50–100 years [3]. Although arabidopsis is the model, plant par excellence due to the large amount of mutants and wealth of genetic data available. However, many species of brassica used to study stress and CD process, especially in the study of heat stress, because of its sensitivity to heat e.g., temperature is one of the most important parameters for the development of the florets in B.oleracea. In some cases, heat stress benefits plant culture. In B napus microspore in vitro embryogenesis produced by the application of a treatment of 32°C for eight hours [14, 15] or an additional treatment of two hours to 41°C in late bicellular pollen to increase yield [16]. Coupled with this, HSP70 over expression and its nuclear translocation during heat treatments suggest which this protein is necessary for embryogenesis induction [17].

In most cases, heat stress reduce crops yield, causing morphological changes such as abnormal leave shapes due to changes in cell microtubules and microfilaments; injuring or killing plants. In B napus heat stress, reduce flower fertility. Under a treatment of four hours at 35 °C for one and two weeks after flowering ten days), experiments shows a similar number of flowers in control and the two stress periods (six thousand). However, the number of fruits shows a drastically reduction (50%) in one week of stress compared with control, following by a recovery. This recovery let to obtain similar number of fruit in both control and plants with one week of treatment (3.000 silique) and plants under two weeks of heat stress didn’t show recovery. The number of seed and fresh weight, in both stress conditions shows a reduction in 66% and 75% respectively with a light recovery after treatments in a 50% compared with control. At the same time germination reduced in stressed plants (germination rates of 17.5%) in contrast with control plants (germination rates of 59.2%) [18].

Other study shows that B. rapa and B. juncea are sensible too to heat stress, affecting the reproductive development and yield, showing which the first of them are the most sensitive [19]. Under a treatment of 35 oC, B. rapa and B. juncea, reproductive organs was injured, mainly resulted in the reduction of seeds in 80 and 40% respectively in early flowers. Inflorescences of B. oleracea var. italica (broccoli), presents reduction in flowering after a treatment of heat to 35 °C. Buds reduced its size in 50 to 75% in treated plants and the damage caused to buds is bigger in young inflorescences (straight stage) than mature (crown stage) [18].

Kale variety of B. oleracea seedlings under heat stress (32 oC) shows abnormal leave shape, presenting elongation of them and a reduction of fresh weight of a 30% percent, at the same time stomal conductance increase and its size was reduced due its heat stress susceptibility [20]. Due to global warming, high temperatures expected to become a limiting factor for production, so research on tolerance to heat stress will be of great importance [21, 22]. Plants have a higher number of transcription factors related to tolerance to heat stress, than those found in animal cells; this is probably due to the plants, unlike them; they are not able to move to another place to mitigate the high temperatures [23].

A way to know if stress response proteins also produced in brassicas shown by Fabijanski and colaborators. Comparing the differential expression of proteins in plants without and with stress using sulfur 35 (35S) and later comparing the differential proteins found with 1D and 2D gel electrophoresis, with those already known in other models such as tobacco. The typical proteins synthetized by plants in heat and other abiotic stresses are heat shock proteins (hsp) , maintaining proteins correct conformations and prevent the aggregation of non-native proteins [24]. Fourteen of these found in broccoli leaves. After a treatment of 37 oC, in the first two hours a presence of a differential protein expression compared with plants treated with 20 oC, mainly 90 KDa, 88 KDa, 86 KDa, 74 KDa, 69 KDa, 66 KDa, 47 KDa, 43 KDa, 42 KDa, 27 KDa, 23 KDa, 21 KDa, 19 KDa and 18 KDa. Molecular mass proteins. After two hours, there seems to be a reduction in their synthesis; however, this maintained for two hours after [25].

A similar way to give identity to a protein is to use antibodies that recognize homologous proteins already characterized to confirm, through the specific interaction of the antibody with the protein and the expression during the condition evaluated, in this case, stress, identity and participation of the protein in the condition. A study realized by Avice group answer the question if the 19-kD trypsin inhibitor (TI) protein related with the Water-soluble chlorophyll-binding protein (WSCP) BnD22 from B. napus previously detected in leaves.

Using young leaves during leaf nitrogen (N) starvation methyl jasmonate (MeJA) treatments and proteomic technique, this work confirmed the relation between both proteins. Partial sequences from two differential spots in stress and normal conditions, identified by Electrospray ionization Tandem Mass Spectrometry (ESI-LC MS/MS) were identical to peptides previously identified by the same method and a search in databases revealed that both also presented 100% homology to BnD22. Prior to this, immunoblot analysis and image analysis software shows that BnD22 and 19-kD (TI) are two isoforms of the same protein, and BnD22is induced 12-fold by MeJA [26].

Proteomic approaches are also useful to find out novel proteins that plants expressed under stress. Following the same strategy, we used two contrasting conditions, but now with two broccoli cultivars, one heat-tolerant TSS-AVRDC-2 and one heat-susceptible B-75, under heat stress and waterlogging. Plants divided into four 20 °C without waterlogging (as control) 20 °C with waterlogging; 40 °C without waterlogging, and 40 °C with waterlogging. With this method, was identified 15 and 16 pivotal proteins in stress tolerance from TSS-AVRDC-2 and B-75 respectively, giving the work a deeper biological context also using physiological parameters such as chlorophyll content and stomal conductance in which the resistant cultivar was better [27]. By combining all the data, it explained that this resistance is due to a better metabolic behavior, in which the ROS levels produced controlled more efficiently.

Other species, such as B. juncea, B. napus, b. carinata and B. campestris, accustomed to tropical climates, studied to better understand the tolerance to stress by drought. Six parameters including water content, epicuticular wax, chlorophyll content, leaf water potential, osmotic potential and content of protein, authors comparing the stress tolerance of both species. B. napus was the one that best supports these conditions and B. carinata was the most sensitive. Although, all the four species decreases in most of parameters, B. napus presents a better production of biomass respect to the others. This behavior also occurs with respect to the chlorophyll content. For all species, except B. campestris, clhorophyl in control condiction was 3 fold higher than in stress treatments, for B campestris clori [28].

B. napus was used again to evaluate the synthesis of aa as a mechanism of drought stress tolerance. Since the increased of solutes to decreased osmotic potential and diminish water loss. This specie was exposed to dehydration to measure changes in the concentration of aa, with an overall increase of 5–9 folds during the four days of treatment. It was later observed that aa levels decreased almost to the initial levels prior to stress. Likewise, the use of radioactive labeled methionine with sulfur 35 (35S) results in an increase in protein synthesis observed on the second day of treatment, to later return to the first day levels. Finally, it was determined that the increase in the amount of aa was due to the synthesis of alanine, aspartate and asparagine precursors, pyruvate and glutamate and not to the enzymatic activity of alanine aminotransferase and aspartate aminotransferase, two enzymes involved in aa synthesis [29].

3.1. PLC-Phosphoinositide pathway during stress response in Brassica

B. napus served as a model to study the signaling pathways activated in response to drought, salt and cold stress. A work mainly focused in phosphoinositide signaling pathway controlled by the enzyme phospholipase C (PLC) which hydrolyzes phosphatidylinositol (4,5) bisphosphate (PIP2) to generate diacylglycerol (DAG) and inositol 1,3,5-trisphosphate (IP3) two second messengers in the cell [30] found the relationship between PLC and the tolerance to abiotic stress as well as the particular differences in each stress.

By cloning of the genes PLC-2, phosphatidylinositol 3-Kinase (VPS34) and a phosphatidylinositol synthase (PtdInsS1), as well as relative expression of a phosphatidylinositol 4-kinase (PtdIns 4-K) and phosphatidylinositol -4-phosphate 5-kinase (PtdIns4P-5-K) shows which in cold stress the expression of PLC-2 increased, PtdInsS1 decreased and while the levels of the other genes remains without changes. Under salt stress expression of VPS34 increases, suggesting an important role for other phosphoinositide, phosphatidylinositol 3 phosphate PI(3)P in the tolerance of this stress, acting in an alternative pathway different from the PLC-2, however a slight increase of PLC-2 could be observed. In the same work, plant growth in drought stress exhibit a major number of transcripts of all evaluated genes [31].

B.napus used to evaluate the changes at the metabolic level produced by the overexpression of plc. Since PLC produces an increase in tolerance to abiotic stress, researchers runs a profile of various metabolites in cold stress. 12 metabolites presents significate changes, 9 increased, many of them aa, highlighting b-alanine (1.5 folds); there was also an increase in spermidine (2.5 fold) and a lipid, linoleate (1.66 fold). A very important change in sucrose levels, in which there was an almost 5-fold increase during stress. In plants that over expressed the enzyme could be seen a better recovery after stress. Also, since it is known that biotic and abiotic stress share some signaling pathways [3], using the fungus Sclerotinia sclerotiorum to test biotic tolerance, authors reports minor severity of symptoms in plants with enhanced expression of PLC-2, however this tolerance appears to be partial [32].

4. Cell death in Brassica species

RCD is divided morphologically into apoptosis, autophagic cell death and necrosis. Apoptosis for many years was considered synonymous with the RCD. During apoptosis occurs fragmentation of the nucleus and formation of apoptotic bodies, phagocytosis and degradation of these bodies by other cells [33].

Autophagic cell death is a mechanism conserved in eukaryotes by which organisms degrade and recycle cellular components [34]. The organelles are sequestered by double membrane vacuoles called autophagosomes and then degraded by various hydrolases [35].

Necrosis was considered for many years, synonymous with accidental cell death, since it was believed that there was no way to regulate it [9]. The necrosis is defined in negative terms, that is, all that death whose morphology does not correspond to autophagy or apoptosis is considered necrosis. However, there is generally a gain in cell volume (oncosis), swelling of the organelles, and the rupture of the plasma membrane results in a consequent loss of intracellular content [36, 37].

Cell death in plants is a phenomenon little studied if compared with animals, where, because of the importance of cell death in various types of cancer have been established more appropriate criteria for the classification and study of CD.

An attempt to establish a morphological classification proposes two categories: autolytic and non-autolytic cell death. The main difference between the two deaths is that in the autolytic death a rapid clearance of the tonoplast occurs, due to the degradation of cellular components through various hydrolases. Hydrolases are released into a large vacuole that occupies most of the volume of the cytoplasm and which is formed by vacuoles of smaller size (very similar to the autophagic cell death), until finally the tonoplast is broken. In non-autolytic type death, the clearance occurs after the tonoplast rupture [38, 39].

Brassica species it is a model widely used to study cell death processes. In several species of the genre, RCD studies were carried out induced by various abiotic stresses such as cold, mechanical or heavy metal stress.

B. oleracea was used to study regulated cell death. The expression of genes related to apoptotic cell death induced by post-harvest management (refrigeration) has been identified, for example, of proteins like serine palmitoyltransferases (BoSPT1) and proteins with caspase 3 activity (Cas3) [40, 41].

In B. napus similar nuclear fragmentation due to MCR was associated with recalcitrance to the regeneration of whole plants in protoplast cultures of B. napus leaves. The MCR induction was attributed to the stress caused by the protoplast isolation process [42].

The lack of iron in protoplast cultures of B. napus induced non-autolytic death. The lack of iron caused the generation of reactive oxygen species (ROS) and the activation of a protein with cas3 activity. Also condensation of chromatin and fragmentation of the nucleus was observed [43, 44].

Other cysteine-proteases (CysP) were related with similar observation in B. napus during PCD in seed development [45]. Northern blot analysis of temporal of the CysP, BnCysP1 in B. napus, shows the expression of said gene from the tenth to the sixteenth day after flowering and confirmed later by western blot. Not only that, but, the synthesis of BnCysP1 ocurs in the inner tegument during PCD confirmed by the observation of DNA degradation with a TUNEL assay [46].

In B. oleracea was also found that a CysP, BoCP5 was responsible for florets senescence [47]. In this work authors compared broccoli lines, wild type (wt) and transgenics, transformed with antisense construct for BoCP5under the control of a senescence-induced promoter. During harvest-induced senescence in broccoli floret BoCP5 is induced and synthetized 6 h after harvest. In wt line in which mRNA, protein and protease activity was detected in higher levels. Finally, three transgenic lines shows less florets senescence (more greener) than wt within 72 and 96 h after harvest.

It is very interesting to note that especially B. oleracea and B napus are excellent models to explore the molecular and biochemical similarities between the RCD in plants and animals. In addition they are also suitable models to perform with them different microscopy techniques to characterize biochemistry, molecular and morphologically the RCD in plants. For example, it is clear that different stresses cause morphological changes in the nucleus when the CD is produced. However, it must be studied if these changes are similar in terms of signaling pathways that activate to cause these changes.

In of B. oleracea florets for example, whose nucleuses have a larger size because they are very active, several confocal microscopy studies have been carried out [48]. A simple analysis using different stress inducers shows how the nucleus changes its shape differentially in each treatment (Figure 2). This may mean that it activates different mechanisms or moon greater or less sensitivity to each stress.

JMG2018-103-CastanoEnrique_F2

Figure 2. Histological slices of Brassica oleracea inflorescences stained with Dapi a observed with a fluorescence microscope. A): Control, without stress treatment. B): Nuclei of B. oleracea treated with 0.1% glyphosate. C): Nuclei of B. oleracea treated with 300 mM NaCl. D): Nuclei of B. oleracea treated with 0.1% H2O2. E): Nuclei of B. oleracea treated with 600 mM of sorbitol. F): Nuclei of B. oleracea treated at 45 oC. all treatments was applied for six hours, except for H2O2 for 26 hours. G): DNA extraction of in fluoresces after stress. Each lane contains 1 mg of DNA. Nuclear morphology of stressed samples differs from control, especially in C-F. In sorbitol treatments observed a clearly nuclear fragmentation, less in NaCl stress, whereas in D and F a major condensation is observed.

5. p53 protein in Brassica species

Protein p53 acts as a link between cell proliferation, stress and cell death. Is a transcription factor induced in many stress signals responsive to such as oxidative stress, cold and heat stress, nutrition deprivation, apoptosis, phagocytosis, apoptosis and cell cycle arrest [49–51] . also is named as genome guardian due its implication in DNA repair caused e.g. uv radiation and genotoxic drugs such as Danthron, Lansoprazole and Phenolphthalein [52], in human cells, mutation or reduction in p53 gene results in many types of cancer [51, 53, 54].

One way of p53 to inhibit tumor formation is by the negative transcriptional regulation of fibrillarin (fib), a nucleolar protein with metyltransferase activity, which processes ribosomal RNA (rRNA) maturation and assemble of ribosomes [48, 55–58] , and has been related with virus movement and systemic infection in plants [59, 60]. Partial silencing of p53 in immortalized human mammary epithelial cells (HME) produces overexpression of fib, leading to changes in the methylation of rRNA that results in changes of translation fidelity, showed by the bypass of added stop codon addition in rRNA and amino acid miss incorporation and alter translation initiation[53]. In Brassica oleracea fibrillarin alters its localization during heat stress as seen in Figure 3.

JMG2018-103-CastanoEnrique_F3

Figure 3. Histological slices of Brassica oleracea inflorescences under heat stress. Control (without stress) and stressed inflorescences stained with DAPI and incubated with anti-fib antibody. Treatment was six hour longer. In stressed nuclei, fibrillarin are outside the nucleus, which presents condensation (white arrows).

Expression of human p53 in Arabidopsis thaliana induce early senescence and exhibited fascinated phenotype (fused or distorted organs along a plant stem) including thick stems causing by elevated homologous DNA recombination, also shows more secondary inflorescences (twice compared with wt plants) and clustered siliques. NPR1–1 INDUCIBLE 1 (SNI1) a p53 inhibitor in plants, not present in human cells, expressed in in human osteosarcoma U2OS cancer cells, reduce homologous recombination in DNA damage cells by UV radiation and hydroxyurea treatments to induce DNA repair [61].

In brassica, p53 has been detected during Alternaria pathotoxin- and nutritional depletion treatments using human p53 antibodies [Khandelwal, 2002 #106]. In proliferating callus, the amount of p53 is less than decaying callus (induced by nutrient starvation) and pathotoxin treated callus in 2.2 fold and 1.88 fold respectively. Similar results shows p53 in leaves. Senescent and Pathotoxin·treated presents twice the concentration observed in healthy leaves [62].

Transformed B. juncea calli with osmotin gene, a pathogenesis related protein, presents tolerance against Alternaria toxin compared with wt calli. This tolerance correlates with lower levels of p53 protein. With 0.5 and 1.0 units of toxin treatment, non-transformed calli levels of p53 increase 1.85 and 3.3-fold compared with control conditions (no toxin) whilst the levels increase 1.41 and 1.89-fold in transformed calli. This observation seems to be result of a delay in PCD triggers by hypersensitive response (HR) [63].

P53 is very interesting, although there are only these two examples, very similar to the possible role of p53 in stress and cell death, although in other organisms the link between different metabolic and signaling pathways. In this way, p53 covers almost all the phenomena present in plants, from the metabolic state, to RCD.

Many interaction partners need to be confirmed in most pathways, including apoptosis, p53 signaling pathway and senesce. This is confirmed by the fact that in databases such as KEGG there are no those that are specific to plant species, and the evidence of the presence of homologous proteins is generally reached just by bioinformatics

Conclusion

Brassica species have served as an important source of knowledge regarding stress and cell death, even finding in them, the first evidences of the role of certain molecules, e.g. p53 in these events.

All these discoveries have been carried out using “classic” and “modern” techniques, which has provided a broad background that serves as a firm basis for new discoveries in these fields of research. Much remains to be contributed to them, since most of the efforts in these issues are aimed at human health and for this reason represent a great opportunity for future research.

Abbreviations

aa – amino acids

ACD – Accidental cell death

CD – Cell death

CysP – cysteine protease

Fib – fibrillarin

MeJa – methyl jasmonate

PCD – Programmed cell death

PLC – phospholipase C

ROS – Reactive oxygen species

rRNA – ribosomal RNA

RCD – Regulated cell death

WT – wild type

References

  1. Wang W, Vinocur B, Altman A (2003) Plant responses to drought, salinity and extreme temperatures: towards genetic engineering for stress tolerance. Planta 218: 1–14. [crossref]
  2. Fujita M, Fujita Y, Noutoshi Y, Takahashi F, Narusaka Y, Yamaguchi-Shinozaki K, et al. (2006) Crosstalk between abiotic and biotic stress responses: a current view from the points of convergence in the stress signaling networks. Current Opinion in Plant Biology 9: 436–42.
  3. Atkinson NJ, Urwin PE (2012) The interaction of plant biotic and abiotic stresses: from genes to the field. J Exp Bot 63: 3523–3543. [crossref]
  4. Petrov V, Hille J, Mueller-Roeber B, Gechev TS (2015) ROS-mediated abiotic stress-induced programmed cell death in plants. Frontiers in Plant Science.
  5. Mittler R (2002) Oxidative stress, antioxidants and stress tolerance. Trends Plant Sci 7: 405–410. [crossref]
  6. Baxter A, Mittler R, Suzuki N (2014) ROS as key players in plant stress signalling. J Exp Bot 65: 1229–1240. [crossref]
  7. Verma V, Ravindran P, Kumar PP (2016) Plant hormone-mediated regulation of stress responses. BMC Plant Biol 16: 86. [crossref]
  8. Galluzzi L, Bravo-San Pedro JM, Vitale I, Aaronson SA, Abrams JM, et al. (2015) Essential versus accessory aspects of cell death: recommendations of the NCCD 2015. Cell Death Differ 22: 58–73. [crossref]
  9. Kanduc D, Mittelman A, Serpico R, Sinigaglia E, Sinha AA, Natale C, et al. (2002) Cell death: Apoptosis versus necrosis (Review) International Journal of Oncology 21: 165–70.
  10. Ashkenazi A, Salvesen G (2014) Regulated cell death: signaling and mechanisms. Annu Rev Cell Dev Biol 30: 337–356. [crossref]
  11. Kroemer G, Galluzzi L, Vandenabeele P, Abrams J, Alnemri ES, et al. (2009) Classification of cell death: recommendations of the Nomenclature Committee on Cell Death 2009. Cell Death Differ 16: 3–11. [crossref]
  12. Van Hautegem T, Waters AJ, Goodrich J, Nowack MK (2015) Only in dying, life: programmed cell death during plant development. Trends in Plant Science 20: 102–13.
  13. Galluzzi L, Vitale I, Abrams JM, Alnemri ES, Baehrecke EH, Blagosklonny MV, et al. (2012) Molecular definitions of cell death subroutines: recommendations of the Nomenclature Committee on Cell Death 2012. Cell Death and Differentiation 19: 107–20.
  14. Pechan PM, Keller WA (1988) Identification of potentially embryogenic microspores in Brassica napus. Physiologia Plantarum 74: 377–84.
  15. Telmer CA, Newcomb W, Simmonds DH (1995) Cellular changes during heat shock induction and embryo development of cultured microspores ofBrassica napus cv. Topas. Protoplasma 185: 106–12.
  16. Binarova P, Hause G, Cenklová V, Cordewener JHG, Campagne MML (1997) A short severe heat shock is required to induce embryogenesis in late bicellular pollen of Brassica napus L. Sexual Plant Reproduction 10: 200–8.
  17. Cordewener JHG, Hause G, Görgen E, Busink R, Hause B, Dons HJM, et al. (1995) Changes in synthesis and localization of members of the 70-kDa class of heat-shock proteins accompany the induction of embryogenesis inBrassica napus L. microspores. Planta 196: 747–55.
  18. Young L, W Wilen R, C Bonham-Smith P (2004) High temperature stress of Brassica napus during flowering reduces micro- and megagametophyte fertility, induces fruit abortion, and disrupts seed production. 485–95 p.
  19. Angadi SV, Cutforth HW, Miller PR, McConkey BG, Entz MH, Brandt SA, et al. (2000) Response of three Brassica species to high temperature stress during reproductive growth. Canadian Journal of Plant Science 80: 693–701.
  20. Rodríguez VM, Soengas P, Alonso-Villaverde V, Sotelo T, Cartea ME, Velasco P (2015) Effect of temperature stress on the early vegetative development of Brassica oleracea L. BMC Plant Biology 15: 145.
  21. Uchida A, Jagendorf AT, Hibino T, Takabe T, Takabe T (2002) Effects of hydrogen peroxide and nitric oxide on both salt and heat stress tolerance in rice. Plant Science 163: 515–23.
  22. Wang P, Zhao L, Hou H, Zhang H, Huang Y, et al. (2015) Epigenetic Changes are Associated with Programmed Cell Death Induced by Heat Stress in Seedling Leaves of Zea mays. Plant Cell Physiol 56: 965–976. [crossref]
  23. Panchuk II, Volkov RA, Schöffl F (2002) Heat Stress- and Heat Shock Transcription Factor-Dependent Expression and Activity of Ascorbate Peroxidase in Arabidopsis. Plant Physiology 129: 838–53.
  24. Wang W, Vinocur B, Shoseyov O, Altman A (2004) Role of plant heat-shock proteins and molecular chaperones in the abiotic stress response. Trends in Plant Science 9: 244–52.
  25. Fabijanski S, Altosaar I, Arnison PG (1987) Heat Shock Response of Brassica oleracea L. (Broccoli). Journal of Plant Physiology 128: 29–38.
  26. Desclos M, Dubousset L, Etienne P, Le Caherec F, Satoh H, Bonnefoy J, et al. (2008) A Proteomic Profiling Approach to Reveal a Novel Role of <em>Brassica napus</em> Drought 22 kD/Water-Soluble Chlorophyll-Binding Protein in Young Leaves during Nitrogen Remobilization Induced by Stressful Conditions. Plant Physiology. 147: 1830.
  27. Lin H-H, Lin K-H, Chen S-C, Shen Y-H, Lo H-F (2015) Proteomic analysis of broccoli (Brassica oleracea) under high temperature and waterlogging stresses. Botanical Studies 56: 18.
  28. Ashraf M, Mehmood S (1990) Response of four Brassica species to drought stress. Environmental and Experimental Botany 30: 93–100.
  29. Good AG, Zaplachinski ST (1994) The effects of drought stress on free amino acid accumulation and protein synthesis in Brassica napus. Physiologia Plantarum 90: 9–14.
  30. Runkel F, Hintze M, Griesing S, Michels M, Blanck B, et al. (2012) Alopecia in a viable phospholipase C delta 1 and phospholipase C delta 3 double mutant. PLoS One 7: e39203. [crossref]
  31. Das S, Hussain A, Bock C, Keller WA, Georges F (2005) Cloning of Brassica napus phospholipase C2 (BnPLC2), phosphatidylinositol 3-kinase (BnVPS34) and phosphatidylinositol synthase1 (BnPtdIns S1)—comparative analysis of the effect of abiotic stresses on the expression of phosphatidylinositol signal transduction-related genes in B. napus. Planta 220: 777–84.
  32. Nokhrina K, Ray H, Bock C, Georges F (2014) Metabolomic shifts in Brassica napus lines with enhanced BnPLC2 expression impact their response to low temperature stress and plant pathogens. GM Crops & Food 5: 120–31.
  33. Kerr JFR, Wyllie AH, Currie AR (1972) Apoptosis: A Basic Biological Phenomenon with Wide-ranging Implications in Tissue Kinetics. British Journal of Cancer 26: 239–57.
  34. Duprez L, Wirawan E, Vanden Berghe T, Vandenabeele P (2009) Major cell death pathways at a glance. Microbes Infect 11: 1050–1062. [crossref]
  35. Galluzzi L, Maiuri MC, Vitale I, Zischka H, Castedo M, Zitvogel L, et al. (2007) Cell death modalities: classification and pathophysiological implications. Cell Death Differ 14: 1237–43.
  36. Golstein P, Kroemer G (2007) Cell death by necrosis: towards a molecular definition. Trends Biochem Sci 32: 37–43. [crossref]
  37. Vanden Berghe T, Linkermann A, Jouan-Lanhouet S, Walczak H, Vandenabeele P (2014) Regulated necrosis: the expanding network of non-apoptotic cell death pathways. Nat Rev Mol Cell Biol 15: 135–147. [crossref]
  38. Van Doorn WG, Beers EP, Dangl JL, Franklin-Tong VE, Gallois P, et al. (2011) Morphological classification of plant cell deaths. Cell Death Differ 18: 1241–1246. [crossref]
  39. Van Doorn WG (2011) Classes of programmed cell death in plants, compared to those in animals. J Exp Bot 62: 4749–4761. [crossref]
  40. Coupe SA, Sinclair BK, Watson LM, Heyes JA, Eason JR. Identification of dehydration-responsive cysteine proteases during post-harvest senescence of broccoli florets. J Exp Bot 54: 1045–56.
  41. Coupe SA, Watson LM, Ryan DJ, Pinkney TT, Eason JR (2004) Molecular analysis of programmed cell death during senescence in Arabidopsis thaliana and Brassica oleracea: cloning broccoli LSD, Bax inhibitor and serine palmitoyltransferase homologues. Journal of Experimental Botany 55: 59–68.
  42. Watanabe M, Setoguchi D, Uehara K, Ohtsuka W, Watanabe Y (2002) Apoptosis-like cell death of Brassica napus leaf protoplasts. New Phytologist 156: 417–26.
  43. Tewari RK, Hadacek F, Sassmann S, Lang I (2013) Iron deprivation-induced reactive oxygen species generation leads to non-autolytic PCD in Brassica napus leaves. Environmental and Experimental Botany 91: 74–83.
  44. Tewari RK, Bachmann G, Hadacek F (2015) Iron in complex with the alleged phytosiderophore 8-hydroxyquinoline induces functional iron deficiency and non-autolytic programmed cell death in rapeseed plants. Environmental and Experimental Botany 109: 151–60.
  45. Wan L, Xia Q, Qiu X, Selvaraj G (2002) Early stages of seed development in Brassica napus: a seed coat-specific cysteine proteinase associated with programmed cell death of the inner integument. The Plant Journal 30: 1–10.
  46. Gavrieli Y, Sherman Y, Ben-Sasson SA (1992) Identification of programmed cell death in situ via specific labeling of nuclear DNA fragmentation. J Cell Biol 119: 493–501. [crossref]
  47. Eason JR, Ryan DJ, Watson LM, Hedderley D, Christey MC, Braun RH, et al. (2005) Suppression of the cysteine protease, aleurain, delays floret senescence in Brassica oleracea. Plant Molecular Biology. 57: 645–57.
  48. Loza-Muller L, Rodríguez-Corona U, Sobol M, Rodríguez-Zapata LC, Hozak P, Castano E (2015) Fibrillarin methylates H2A in RNA polymerase I trans-active promoters in Brassica oleracea. Frontiers in Plant Science. 6: 976.
  49. Perwez Hussain S, Harris CC (2006) p53 Biological Network: At the Crossroads of the Cellular-Stress Response Pathway and Molecular Carcinogenesis. Journal of Nippon Medical School 73: 54–64.
  50. Levine AJ, Oren M (2009) The first 30 years of p53: growing ever more complex. Nat Rev Cancer 9: 749–758. [crossref]
  51. Brady CA, Attardi LD (2010) p53 at a glance. J Cell Sci 123: 2527–2532. [crossref]
  52. Brambilla G, Mattioli F, Martelli A (2010) Genotoxic and carcinogenic effects of gastrointestinal drugs. Mutagenesis 25: 315–326. [crossref]
  53. Marcel V, Ghayad Sandra E, Belin S, Therizols G, Morel A-P, Solano-Gonzàlez E, et al. p53 Acts as a Safeguard of Translational Control by Regulating Fibrillarin and rRNA Methylation in Cancer. Cancer Cell. 24: 318–30.
  54. Joerger AC, Fersht AR (2016) The p53 Pathway: Origins, Inactivation in Cancer, and Emerging Therapeutic Approaches. Annual Review of Biochemistry 85: 375–404.
  55. Cerdido A, Medina FJ. Subnucleolar location of fibrillarin and variation in its levels during the cell cycle and during differentiation of plant cells. Chromosoma 103: 625–34.
  56. Newton K, Petfalski E, Tollervey D, Cáceres JF. Fibrillarin Is Essential for Early Development and Required for Accumulation of an Intron-Encoded Small Nucleolar RNA in the Mouse. Molecular and Cellular Biology 23: 8519–27.
  57. Amin MA, Matsunaga S, Ma N, Takata H, Yokoyama M, Uchiyama S, et al. Fibrillarin, a nucleolar protein, is required for normal nuclear morphology and cellular growth in HeLa cells. Biochemical and Biophysical Research Communications 360: 320–6.
  58. Rodriguez-Corona U, Pereira-Santana A, Sobol M, Rodriguez-Zapata LC, Hozak P, Castano E. Novel Ribonuclease Activity Differs between Fibrillarins from Arabidopsis thaliana. Frontiers in Plant Science.
  59. Canetta E, Kim SH, Kalinina NO, Shaw J, Adya AK, Gillespie T, et al. (2008) A Plant Virus Movement Protein Forms Ringlike Complexes with the Major Nucleolar Protein, Fibrillarin, In Vitro. Journal of Molecular Biology. 376: 932–7.
  60. Li Z, Zhang Y, Jiang Z, Jin X, Zhang K, et al. (2018) Hijacking of the nucleolar protein fibrillarin by TGB1 is required for cell-to-cell movement of Barley stripe mosaic virus. Mol Plant Pathol 19: 1222–1237. [crossref]
  61. Ma H, Song T, Wang T, Wang S (2016) Influence of Human p53 on Plant Development. PLoS One 11: e0162840. [crossref]
  62. Khandelwal A, Kumar A, Banerjee M, Garg GK (2002) Effect of alternaria pathotoxin(s) on expression of p53-like apoptotic protein in calli and leaves of Brassica campestris. Indian journal of experimental biology. 40: 89–94.
  63. Taj G, Kumar A, Bansal KC, Garg GK (2004) Introgression of osmotin gene for creation of resistance against Alternaira blight by perturbation of cell cycle machinery. Indian Journal of Biotechnology. 3: 291–8.

Recurrent Falls: An Unusual Presentation of Spinal Meningioma in a Child

DOI: 10.31038/JNNC.2018113

Abstract

Spinal meningiomas in childhood are very rare. To the best of our knowledge, recurrent falls has not been previously described in this kind of pediatric tumor as an initial clinical presentation. We present an unusual case of a 13-year-old female with a history of recurrent falls for several months, who was diagnosed with spinal meningioma. After five months of the initial symptom, the patient presented with sudden onset paraparesis, urinary incontinence, and left lower limb hypoesthesia. An urgent MRI was performed revealing cervicothoracic junction meningioma. She underwent C6-T2 superiorly based laminotomy and complete resection of the tumor. Pathologic study revealed a benign transitional meningioma. Post-operative evolution was satisfactory, with full recover of muscular strength in the lower limbs and no new episodes of recurrent falls or of urinary incontinence. A follow-up MRI study, performed 3-months after surgery, demonstrated complete tumor resection with no signs of recurrence. We hypothesize that the patient initially developed recurrent falls due to dorsal cord compression, which resulted in a posterior column dysfunction and proprioception deficit. Recurrent falls may be an unusual presentation of posteriorly based spinal cord tumor.

Key words

meningioma – paraparesis – pediatric neurosurgery – recurrent falls – spinal meningioma

Introduction

Despite accounting for approximately 20% of all primary tumors in the central nervous system [1], meningiomas are very rare in pediatric patients, with an annual incidence of 8 cases per 1, 000, 000 people [2]. Meningiomas are generally benign and their recurrence is mostly related to the histologic type. Until now, approximately 60 cases of spinal meningiomas in childhood (SMCs) have been reported in the English literature. To the best of our knowledge, recurrent falls has not been previously described in this kind of pediatric tumor as an initial clinical presentation. The current standard of treatment for meningiomas in children is surgical resection [3]. We report a case of a 13-year-old female with a history of recurrent falls during several months as an initial presentation of a spinal meningioma.

Case Material

Anamnesis, Physical Exam & Imaging

A 13-year-old female presented without any remarkable medical conditions except for a 5 month history of recurrent falls. She underwent a neurological exam by the pediatrician at the clinic, as well as head MRI and lower limbs CT that revealed no pathology. She presented to the emergency room with acute onset of paraparesis, urinary incontinence, and left lower limb hypoesthesia. Physical examination revealed bilateral reduction in muscle strength of the legs and thighs (both strength grade II/V), bilateral clonus, and bilateral positive pyramidal signs (Babinski, Chaddock, Oppenheim, and Gordon). Examination of the left lower limb demonstrated reduction of temperature and pain senses leveling at T3, with severe proprioception deficit of the left leg. Right side proprioception, temperature, pain and tactile examination were intact. Urgent spinal cord MRI with gadolinium-enhanced T1-weighted imaging, revealed a homogeneously enhancing intradural-extramedullary mass located posteriorly at the cervicothoracic junction area (C7-T1-T2) with a dural tail extending from the C6 to T2 levels (Fig.1 A, B). This mass exerted a local expansive-effect, creating medullar dorsal compression without significant peritumoral cord edema.

Surgical procedure and follow-up

In a prone position, with neurophysiological monitoring, a C6-T2 laminotomy was performed. The outer layer of dura matter was opened and the inner layer was attached to the tumor, a careful dissection was performed between the dural layers. The dura was opened at the lower and the upper ends of the tumor where it was free of disease. A good plain between tumor and the spinal cord was dissected. The tumor was lobulated, well-vascularized, with a hard rock consistency and multiple sites of calcification. Despite not finding a clear cleavage plane with the dura matter and an impressive compression of the spinal cord, an arachnoid plane was used and gross total tumor resection was achieved. The operative and post-operative courses were uneventful. The patient improved immediately after surgery, and returned to normal neurological status within 3 weeks. Paraffin embedded sections stained with H&amp;E displayed a meningothelial neoplasm, with a partial fibrous pattern, and many tight whorls and psammoma bodies. No atypical features were detected. There was no necrosis and mitotic figures were not identified. On immunohistochemical stain the MIB-1 proliferation marker labeling index was about 2–3%. The features are consistent with a pathological diagnosis of transitional meningioma, WHO grade I. (Figure 2). No risk factors for SCM as neurofibromatosis type 2 or exposure to radiation were found. A follow-up MRI study, 3-months after surgery, demonstrated complete tumor resection with no signs of recurrence (Figure 3 A, B). She continue follow-up in our institution and 24 months after surgery the patient remains without neurologic deficit and no signs of tumor recurrence.

JNNC18-105_F1

(1A) Sagittal

JNNC18-105_F2


(1B) Axial

Figure 1. Sagittal (A) and axial (B) T1-weighted gadolinium-enhanced MRI showing a homogeneously enhancing intradural-extramedullary mass located posteriorly at the cervico-thoracic junction area (C7-T1-T2) with dural tail extending from the C6 to T2 levels, in a 13-year-old female with a history of recurrent falls.

JNNC18-105_F3

Figure 2. Paraffin embedded section stained with H&E display a transitional meningioma, with many tight whorls (black arrow) and psammoma bodies (white arrow). No atypical features were detected. There is no necrosis and mitotic figures were not seen.

JNNC18-105_F4

(3A) Sagittal

JNNC18-105_F5

(3B) Axial

Figure 3. Sagittal (A) and axial (B) T1-weighted gadolinium-enhanced MRI at 3 month follow-up revealed complete tumor resection with no signs of recurrence.

Discussion

We report a case of a 13-year-old female with a history of recurrent falls for several months as an initial presentation of a spinal meningioma at the level of the cervicothoracic junction. Recurrent falls as the only symptom, with a normal neurological exam, has not been previously reported in the English literature. We hypothesize that the initial neurological deficit was due to dorsal cord compression, resulting in a posterior column dysfunction and proprioception deficit, eventually leading to recurrent falls. Misdiagnosis resulted in a late diagnosis of a spinal meningioma in a child.

In the pediatric population, meningiomas account for less than 5% of brain tumors. Pediatric spinal tumors represent only 5% of tumors of the central nervous system, 25% of which occur in the intradural-extramedullary compartment [3] with an annual incidence of almost 1 per 1, 000, 000 children [4]. Reports from the adult population demonstrate that the majority of cases tend to occur in women (ratio around 2: 1). Nevertheless, this association is not replicated in children, where there are reports of an approximately 1.2: 1 predominance of cases in males [2]. In their retrospective analysis of 20 children, Greene at el. showed a median age of about 13 years at the time of the tumor presentation [2].

Clinical presentation of Spinal Meningiomas in Childhood (SMC) is variable, but consistent with the anatomical localization. The most common presenting symptoms are pain and limb weakness. Wang et al. [5] presented the largest series of SMC, with 10 patients treated from January 2002 to December 2010. They observed back pain in 60%, followed by signs of limb weakness in 40%, gait disturbance in 20%, paresthesia in one patient, and urinary incontinence in another. Conesa D. et al. described a case of recurrent falls caused by spinal meningioma in an elderly woman [6]. Due to the slow growing pattern of meningioma, the symptoms develop gradually during 1–18 months [5].

The etiology of SMC is still not clear but some risk factors have been described, such as association with NF-2 and a history of radiation [7, 8]. The link to NF-2 is becoming clearer, with the most common finding the loss of a tumor suppressor gene in the chromosome 22 (NF-2). Other gene mutations may contribute to the progression of the meningiomas, leading to the more aggressive, anaplastic type. Ionizing radiation is the environmental risk factor most predisposing to meningiomas [8]. The slight predominance of this tumor in women over men in adults raises the hypothesis of the influence of female hormones. Receptors for estrogen and progesterone have been suggested to cause faster tumor growth on the third trimester of pregnancy; however, the exact link between hormones and the development of meningiomas is still not clear [8].

Spinal cord meningioma is rare, with only 60 cases reported in the English literature. Reported ratios of intracranial to spinal meningiomas in children are 20: 1 [12], 14: 1 [1], and 10: 1 [9]. From their review of 15 cases of SMCs, Colen et al. [13] reported that in 14 children the tumor was located in the thoracic and lumbar spinal canal. However, in Wang’s et al. series [5] none of the tumors was in the lumbar area, with 50% in the cervical area, 30% thoracic, and 20% in the cervicothoracic junction.

The standard exam for diagnosing SMC is MRI study. The most common appearance in T1 and T2-weighted imaging is an extra-axial isointense mass. In the post-gadolinium injection, T1-weighted image, SMC appears as a homogeneously enhancing mass. Different degrees of peritumoral edema may be observed.

In 1993 the World Health Organization (WHO) ratified a new comprehensive classification of neoplasms affecting the central nervous system; its last edition (fifth) was published in 2016. According to the WHO classification,  meningiomas are divided in to 3 grades – benign (grade I), atypical (grade II) and anaplastic or malignant (grade III). In the literature, psammomatous and fibroblastic meningiomas are the most common pathological subtypes reported in the largest series of pediatric [13] and adult [14] spinal meningiomas.

Gross total resection is the treatment of choice for SMC, with special care required to preserve the neurological function and stability of the growing spinal canal [14]. However, many factors should be considered in order to achieve a gross total resection, such as location, size, blood loss, adhesion, and the pathological subtypes (causing severe adhesion) [9]. Complete resection has been achieved with good post-operative outcome in most reported cases [5]. The extent of resection may also be predictive for recurrence.

In summary, spinal meningioma is a rare disease in the pediatric population. Not only pediatric neurosurgeons, but also pediatricians need be aware of this highly unusual presentation of SMC when facing recurrent falls in children. The diagnosis and treatment are relatively straightforward using an imaging study (MRI) and surgical tumor excision, respectively.

Conflicts of Interest/Disclosure

The authors declare that they have no financial or other conflicts of interest in relation to this research and its publication.

References

  1. Rushing EJ, Olsen C, Mena H, Rueda ME, Lee YS, et al. (2005) Central nervous system meningiomas in the first two decades of life: a clinicopathological analysis of 87 patients. J Neurosurg 103: 489–495.
  2. Greene S, Nair N, Ojemann JG, Ellenbogen RG, Avellino AM (2008) Meningiomas in children. Pediatr Neurosurg 44: 9–13. [crossref]
  3. Binning M, Klimo P, Gluf W, Goumnerova L (2007) Spinal tumors in children. Neurosurg Clin N Am 18: 631–658. [crossref]
  4. Kumar R, Giri PJ (2008) Pediatric extradural spinal tumors. Pediatr Neurosurg 44: 181–189. [crossref]
  5. Wang XQ, Zeng XW, Zhang BY, Dou YF, Wu JS, et al. (2012) Spinal meningioma in childhood: clinical features and treatment. Childs Nerv Syst 28: 129–136. [crossref]
  6. Conesa D, Ferrer A, Torres A, Formiga F, Pujol R, et al. (2013) An unusual and reversible cause of falls: spinal meningioma in an elderly woman. J Am Geriatr Soc 61: 166–168. [crossref]
  7. Mekitarian Filho E, Horigoshi NK, Carvalho WB, Hirscheimer MR, Bresolin AU, et al. (2010) Primary spinal meningioma in a 10-year-old boy. Arq Neuropsiquiatr 68: 804–806. [crossref]
  8. Riemenschneider MJ, Perry A, Reifenberger G (2006) Histological classification and molecular genetics of meningiomas. Lancet Neurol 5: 1045–1054
  9. Campbell BA, Jhamb A, Maguire JA, Toyota B, Ma R (2009) Meningiomas in 2009: controversies and future challenges. Am J Clin Oncol 32: 73–85. [crossref]
  10. Hanel RA, Tatsui CE, Araujo JC, Grande CV, Antoniuk A, et al. (2001) [Meningiomas in pediatric patients: report of 2 cases]. Arq Neuropsiquiatr 59: 623–627. [crossref]
  11. Watanabe M, Chiba K, Matsumoto M, Maruiwa H, Fujimura Y, et al. (2001) Infantile spinal cord meningioma. Case illustration. J Neurosurg 94: 334. [crossref]
  12. Colen CB, Rayes M, McClendon J Jr, Rabah R, Ham SD (2009) Pediatric spinal clear cell meningioma. Case report. J Neurosurg Pediatr 3: 57–60. [crossref]
  13.  Loh JK, Lin CK, Hwang YF, Hwang SL, Kwan AL, et al. (2005) Primary spinal tumors in children. J Clin Neurosci 12: 246–248. [crossref]
  14. Engelhard HH, Villano JL, Porter KR, Stewart AK, Barua M, et al. (2010) Clinical presentation, histology, and treatment in 430 patients with primary tumors of the spinal cord, spinal meninges, or cauda equina. J Neurosurg Spine 13: 67–77. [crossref]

Malignant Schwannoma of the Scalp: A Case Report and Review of the Literature

DOI: 10.31038/JNNC.2018112

Abstract

Objective

Malignant peripheral nerve sheath tumors are uncommon malignant spindle cell tumors that account for 5% to 10% of all soft tissue sarcomas. Localization of such tumors in the scalp is extremely rare. Diagnosing and treating these tumors is very challenging.

Methods

Case presentation and Literature review.

Results

We found 18 cases of malignant peripheral nerve sheath tumors including our case. The occipital region was the most common site of the tumor. Five patients had h intracranial invasion and two patients had distant metastasis. All the patients were treated surgically. Four patients had recurrence of their tumors and two of them died from the disease

Conclusion

MPNSTs should be considered in the differential diagnosis of rapidly enlarging scalp tumors. Radical excision with wide margins and adjuvant radiation therapy should be considered as the standard treatment for these highly malignant tumors

Keywords

Malignant Peripheral Nerve Sheath Tumor, Scalp Tumor, Neurosarcoma, Shwannsarcoma, Malignant Schwannoma

Introduction

Malignant peripheral nerve sheath tumors (MPNST) are soft tissue sarcomas of ectomesenchymal origin. They derived from components of nerve sheath such as Schwann cells or perineural fibroblasts. The incidence of MPNST is around 0.001% in the general population and 3–4.6% in patients with NF 1. They account for 5–10% of all soft tissue sarcomas. The head and neck region is an unusual site for their development; they are located mostly in the extremities and the trunk (1, 2). We hereby describe a case of giant MPNST of the scalp and discuss the management of such a rare case with a review of the literature.

Case report

A forty-year-old female patient presented to her family physician for a painless mass on her vertex of 5-year duration. The tumor was first a small subcutaneous nodule that gradually increased in size for three years and then experienced rapid growth over the next year with recent onset of ulceration and bleeding from the tumor. No history of previous trauma.

Physical examination revealed an 8x8x6 cm occipital-parietal mass with superficial ulcerations and crusting. It was hard, non-tender, non-pulsating and adherent to the underlying skull. No cervical or occipital lymph nodes were palpated. The patient had no skin lesions elsewhere and no clinical manifestations of neurofibromatosis. Computerized tomography showed a large irregular exophytic, heterogeneously enhancing scalp mass obliterating the subcutaneous tissue reaching the periosteum, the underlying bone was intact (Figure 1). A whole body CT scan revealed no metastatic lesions. Biopsy of the tumor was done under local anesthesia. The histopathologic examination revealed a dermal proliferation of haphazardly arranged pleomorphic spindle cells. The background displayed lymphoid cells and histiocytes. Mitotic figures were evident and abundant. Immunohistochemistry for melanoma associated antigen (HMB-45), Melan A, AlK, MSA, CD34 and CD68 did not reveal any positivity. The tumor cells were positive for vimentin and Ki-67 proliferation marker was up to 10 %. Immunostaining for neural antigen S-100 protein led the pathologists to the diagnosis of high grade malignant peripheral nerve sheet tumor of the scalp (Figure 2).

JNNC18-104_F1

Figure 1A. Scalp tumor in a 45-year-old female manifesting as a dome-shaped tumor measuring 8 × 8 × 6 cm with superficial superficial ulcers and crusting

JNNC18-104_F2

Figure 1B. Sagittal CT scans showing the enhancing scalp tumor with an intact underlying bone.

JNNC18-104_F3

Figure 1C. oronal CT scans showing the enhancing scalp tumor with an intact underlying bone

The patient was referred to the ENT department for surgical management. Under general anesthesia the tumor was excised with a 2-cm margin of healthy tissue. The tumor was highly vascularized; the periosteum was involved by the tumor but no bony erosions were noted. The tabula externa of the skull was removed using the drill and the resulting defect was covered by three local rotation flaps (Figure 3). The postoperative period was uneventful. The surgical field was treated by radiation therapy with a total dose of 50 Gy 1 month postoperatively. There was no recurrence at 18 months of follow-up (Table 1).

JNNC18-104_F4

Figure 2A. Low power view (4X) of a Hematoxylin and eosins section showing a variably cellular spindle cell proliferation with focal palisading and necrosis.

JNNC18-104_F5

Figure 2B. High power view (40X) on a Hematoxylin and eosin section showing moderate nuclear Pleomorphism and brisk mitotic activity.

JNNC18-104_F6

Figure 2C. High power view showing S100 Positivity in Tumor cells.

JNNC18-104_F7

Figure 3A. Intraoperative Picture Showing the Scalp Defect with Preparation of Local Myocutaneous Rotation Flaps.

JNNC18-104_F8

Figure 3B. Postoperative Image of the Patient.

JNNC18-104_F9

Figure 3C. Image of the Patient at 18 month of Follow-Up.

Table 1. Literature review of studies of malignant peripheral nerve sheath tumor of the scalp

Study

Age/sex

Location

Size

(cm)

Time between Dx & SS

Bone infiltration

NF1

Adjuvant Treatment

Closure

Follow up

George

56/F

Occipital

3

6 m

No

No

RT

NA

4m/NED

George

50/M

Temporal

NA

4 m

NA

Yes

RT

NA

11yrs/NED

Dabski

NA

NA

NA

NA

NA

No

NA

NA

NA

Kikuchi

59/M

Frontal

5 × 3

11 yrs

no

No

No

NA

5yrs NED

Demir

80/M

Parietal

1.5 × 2

2 yrs

No

No

RT

FTSG

6m NED

Grag

50/M

Occipital

21 × 17

8 yrs

Yes

NA

RT

NA

NA

Williams

75/F

NA

NA

NA

NA

No

Chemo

Na

2yrs NED

Fakushima

38/M

Occipital

21 × 19

3 yrs

No

No

No

NA

4m DOD

Kumar

36/M

Occipital

6 × 7

30 yrs

No

Yes

RT

primary

28m NED

Ge

52 /M

Parietal-occipital

22 × 18

8 yrs

Yes

Yes

No

Free flap

6m NED

Hasturk

44/M

Occipital

5 × 2

2 yrs

No

NA

No

TM flap

NA

Shintaku

59/F

NA

12

1.5 yr

No

Yes

NA

NA

18 m DOD

Voth

89/M

Parietal

4.5 × 3

5 yrs

No

No

RT

STSG

14m AWD

Jhawer

43/F

Parietal

6 × 8

5 yrs

Yes

No

RT

Rotation flap

1yr NED

Wang

35/M

Occipital

10 × 9

18yrs

Yes

No

RT

LD free flap

20m NED

Wang

72/F

Occipital

10 × 10

4 yrs

Yes

No

RT

NA

15m AWD

Schaefer

59/F

NA

NA

NA

NA

Yes

NA

NA

15m NED

Tanbouzi

45/F

Parietal

8 × 8

5 yrs

No

No

RT

Rotation flap

2 yrs NED

Abbreviations:

F-female, M-male, m-Month; AWD-Alive With Disease; Chemo-Chemotherapy; DOD-Dead of Disease; Dx-Diagnosis; FTSG-Full Thickness Skin Graft; LD-Latissimus Dorsi; NED-No Evidence of Disease; NA-Non Available; NF1-Neurofibromatosis type 1; RT-radiation therapy; SS-symptoms; TM-Trapezius Muscle; Yrs-years

Discussion

Malignant Peripheral Nerve Sheath Tumor (MPNST) is a rare neoplasm of the nervous system. It is a malignant spindle-cell tumor derived from components of nerve sheath. Although the universal terminology defined by the World Health Organization is MPNST, a variety of terminologies are recognized including malignant schwannoma, neurofibrosarcoma, malignant neurofibroma, malignant neurilemomma, and shwannsarcoma (2, 3).

The etiology is still uncertain but MPNSTs are commonly associated with Von Recklinghausen disease in whom gene mutations are found, such as loss of the neurofibromatosis 1 gene and rearrangement of the p16 (INK4A) gene (4, 5). It has been reported that 60% of all MPNSTs represent a malignant transformation of a preexisting benign neurofibroma, whereas 30% arise de novo, and approximately 10% occur in patients with history of previous radiation at the tumor site. MPNST usually affects the patients in their third to sixth decades of life. Medium and larger nerves like brachial plexus and sciatic nerve are commonly affected, consequently MPNSTs have a propensity to occur in the proximal limbs and the trunk (6, 7). MPNST of the scalp is extremely rare. We performed a detailed search in Pubmed and Medline database with a complete review of all the English literature published. We found 18 cases of MPNST of the scalp, including our case (Table 1).

Patients were aged from 36 to 89 (mean age 50) with male predominance (61.1%). Tumors measured from 2 to 22 cm in their largest diameter (mean 9.1 cm). The occipital region was the most common site. Of these 18 patients, four had neurofibromatosis. The interval time between tumor diagnosis and symptoms ranged from 4 months to 30 years, only 2 patients had rapid onset of their tumors suggesting the theory of de-novo tumor. In 16 cases, the tumor had a slow growth pattern at the beginning and then became rapid in the last several months, suggesting malignant transformation of a previously benign tumor. Five patients had calvarial destruction with intracranial invasion and only 2 patient had distant metastasis. All the patients were treated surgically. Ten patients received postoperative radiation therapy and only one patient received chemotherapy. Follow-up periods ranged from 4 months to 11 years. Four patients had recurrence of their tumors and two of them died from the disease.

MPNSTs are poorly defined sarcomas. They can easily be identified when the surgeon or the pathologist demonstrates a neurofibroma or a nerve trunk; but in the absence of these findings as in skin tumors, differentiating MPNSTs from other benign or malignant spindle cell tumors and melanoma is very challenging. Microscopically, MPNST is a densely cellular tumor that shows fascicular areas. The cells may be spindle or polygonal in shape with irregular contours. Malignancy is suggested when there is invasion of surrounding tissues, necrosis, focal hemorrhage, mitotic activity, nuclear pleomorphism and atypia (7–10). Immunohistochemical studies with a combination of should be used to exclude other spindle cell tumors and to give an accurate diagnosis. Up to 90% of MPNSTs stain positive for S-100 protein. Ki-67 is a proliferation marker that reflects the increased mitotic index and support malignancy. The differential diagnosis of MPNST in the scalp includes leiomyosarcoma, dermatofibrosarcoma protuberans (excluded by a negative MSA and CD34 respectively) and melanoma which is excluded by a negative Melan A and HMB-45 (1, 3, 11, 12).

The International Consensus Group has recommended that the current management of MPNST should be identical to that of any other soft tissue tumors. Accordingly, the mainstay of treatment is complete surgical excision of the tumor with wide margins (≥2cm). The bone and dura involved should be resected together (6). The scalp defect is reconstructed using skin graft, local cutaneous flap, myocutaneous flap or free flaps depending on the size of the defect. A cranioplasty should be done in case of significant calvarial destruction (13). Adjuvant radiation therapy should be considered for all intermediate- and high-grade lesions as well as low-grade tumors with positive margins. The role of chemotherapy is usually limited to the treatment of metastatic disease (13, 14). It is well known that the majority of MPNSTs have a poor prognosis because they are usually high-grade deep-seated tumors (7, 10). This is not applicable for MPNST of the scalp (table1). Although the present data is based on a small patient number with short follow-up periods; but the fact that scalp tumors have early clinical manifestations with the possibility of radical excision make them having a more-favorable prognosis (3, 14).

Conclusion

In conclusion, MPNSTs should be considered in the differential diagnosis of any rapidly enlarging scalp tumor especially in the context of neurofibromatosis. Accurate histopathologic and immunohistochemical findings are indispensable for the confirmation of the diagnosis. Considering the high malignancy and the invasive growth of MPNST of the scalp, radical excision with wide margins (≥2 cm), and adjuvant radiation should be considered as the standard treatment for these highly malignant tumors

References

  1. Fukushima S, Kageshita T, Wakasugi S, Matsushita S, Kaguchi A, et al. (2006) Giant malignant peripheral nerve sheath tumor of the scalp. J Dermatol 33: 865–868. [crossref]
  2. Demir Y, Tokyol C (2003) Superficial malignant schwannoma of the scalp. Dermatol Surg 29: 879–881. [crossref]
  3. Wang J, Ou S, Guo Z, Wang Y, Xing D (2013) Microsurgical management of giant malignant peripheral nerve sheath tumor of the scalp: two case reports and a literature review. World J Surg Oncol 11: 269.
  4. Williams SB, Szlyk GR, Manyak MJ (2006) Malignant peripheral nerve sheath tumor of the kidney. Int J Urol 13: 74–75. [crossref]
  5. Ge P, Fu S, Lu L, Zhong Y, Qi B, et al. (2010) Diffuse scalp malignant peripheral nerve sheath tumor with intracranial extension in a patient with neurofibromatosis type 1. J Clin Neurosci 17: 1443–1444. [crossref]
  6. Kumar P, Jaiswal S, Agrawal T, Verma A, Datta NR (2007) Malignant peripheral nerve sheath tumor of the occipital region: case report. Neurosurgery 61: 1334–1335. [crossref]
  7. Garg A, Gupta V, Gaikwad SB, Mishra NK, Ojha BK, et al. (2004) Scalp malignant peripheral nerve sheath tumor (MPNST) with bony involvement and new bone formation: case report. Clin Neurol Neurosurg 106: 340–344. [crossref]
  8. Shintaku M, Wada K, Wakasa T, Ueda M (2011) Malignant peripheral nerve sheath tumor with fibroblastic differentiation in a patient with neurofibromatosis type 1: imprint cytological findings. Acta Cytol 55: 467–472.
  9. Jhawar SS, Mahore A, Goel N, Goel A (2012) Malignant peripheral nerve sheath tumour of scalp with extradural extension: case report. Turk Neurosurg 22: 254–256. [crossref]
  10. Schaefer IM, Fletcher CD (2015) Malignant peripheral nerve sheath tumor (MPNST) arising in diffuse-type neurofibroma: clinicopathologic characterization in a series of 9 cases. Am J Surg Pathol. 39: 1234–1241. [crossref]
  11. Kikuchi A, Akiyama M, Han-Yaku H, Shimizu H, Naka W, et al. (1993) Solitary cutaneous malignant schwannoma. Immunohistochemical and ultrastructural studies. Am J Dermatopathol 15: 15–19. [crossref]
  12. George E, Swanson PE, Wick MR (1989) Malignant peripheral nerve sheath tumors of the skin. Am J Dermatopathol 11: 213–221. [crossref]
  13. Hasturk AE, Basmaci M, Bayram C, Bozdogan N (2011) Surgical management of recurrent malignant schwannoma of the scalp. J Craniofac Surg 22: 1120–1122. [crossref]
  14. Voth H, Nakai N, Wardelmann E, Wenzel J, Bieber T, et al. (2011) Malignant peripheral nerve sheath tumor of the scalp: case report and review of the literature. Dermatol Surg 37: 1684–1688. [crossref]

Energy Metabolism and Autism: The Ameliorative Potential of Carnosine and Agmatine

DOI: 10.31038/JNNC.2018111

Abstract

Recent studies have revealed that autistic spectrum disorders (ASD) is associated with enhanced glycolysis (i.e. establishment of the Warburg effect) accompanied by increased formation of glycated proteins in sera and urine. Both carnosine and agmatine levels in sera of autistic individuals are reported to be lower than in control subjects. Carnosine and agmatine can influence cellular energy metabolism, in part via effects on mTOR, thereby decreasing glycolysis and enhancing mitochondrial activity and thus countering onset of Warburg-like metabolism: other mechanisms including suppressing methylglyoxal toxicity are also discussed. Dietary supplementation studies with carnosine and arginine (agmatine precursor) indicate ameliorative activity towards behaviour in ASD subjects. It is suggested that co-administration of carnosine and agmatine should be explored as a potential route for ASD amelioration.

Key words

Carnosine, Agmatine, Autism, Glycolysis, Glycation, Mitochondria, Methylglyoxal, Propionic Acid, Rapamycin, Mtor

Introduction

A recent publication has suggested that Autism Spectrum Disorders (ASD) is accompanied, associated and/or related to changes in energy metabolism, more specifically the imposition of enhanced aerobic glycolysis, coupled with a suppression of mitochondrial ATP synthesis, also known as the Warburg effect [1]. Another recent paper has revealed the presence of elevated amounts of oxidized, nitrated and glycated proteins in the plasma of some ASD subjects, as well as a disturbance in arginine metabolism and/or clearance [2]. The objective of the present piece is to attempt to integrate these findings by highlighting the possible ameliorative roles of carnosine and agmatine (decarboxylated arginine), both of which are diminished in sera of some ASD subjects [3–5].

Energy metabolism and ASD

The Vallée and Vallée hypothesis [1] proposes that ASD is strongly associated with “a shift in energy production from mitochondrial oxidative phosphorylation to aerobic glycolysis – despite the availability of oxygen” i.e. the imposition of the Warburg effect. Plausible mechanistic routes proposed include the WNT/beta-catenin pathway, and activation of the regulatory complex PI3Akt/mTOR [1]. It is uncertain whether the induction of the predominantly glycolytic metabolism is caused primarily by dysfunction of the PI3AktmTOR regulatory complex, provoked perhaps by glycated protein (also called advanced glycation end-products i.e. AGEs) [6] or whether the imposition of the Warburg-type metabolism is a response to some other causative event or events, such as mitochondrial dysfunction. Indeed, it has been claimed that ASD is associated with mitochondrial dysfunction [7–10], and a three-fold decline in oxidative phosphorylation has been detected in ASD subjects’ granulocytes [10]. It would obviously be informative to determine if this deficit is systemic and also occurring in the CNS, or exhibited solely in granulocytes.

There is evidence suggesting that formation and/or accumulation of propionic acid is associated with some cases of ASD [11–13], possibly originating in the gut tissue or more likely in the microbiome (mostly Clostridia bacterial species) [14]. It is thought that, in the brain, propionic acid inhibits GABA breakdown causing its accumulation thereby affecting brain function. Interestingly, raised levels of β-alanine have been detected in the urine of some autistic subjects [4], whilst in other autistic individuals a decrease was detected [3] These observations, although seemingly contradictory, may reflect differences in β-alanine generation and utilisation by the micro-organisms in the gut. β-Alanine is a precursor pantothenic acid which, in turn, is a precursor of Co-enzyme-A (CoA) (synthesized by the gut micro-organisms). The microbiome is the predominant source of pantothenic acid in the human body. One speculative suggestion is that propionic acid accumulates as a result of a failure in its carboxylation, which requires functional CoA, hence propionic acid accumulates if synthesis of Co-A is compromised. General deficiency in CoA availability would also decrease fatty acid oxidation, as found in ASD [7,8,10,16,17]. The resultant mitochondrial dysfunction would have two important consequences which directly impact ASD. First, the decreased supply of electrons (i.e. acetyl units attached to CoA) will provoke an increase in the generation of incompletely reduced oxygen molecules, i.e. oxygen free-radicals [18], the presence of which will provoke formation of deleterious Reactive Oxygen Species (ROS) and Reactive Nitrogen Species (RNS). Such a mechanism may account for the raised levels of protein oxidation and nitration recently detected in autistic patients’ urine and plasma [2]. A second consequence of insufficient mitochondrial ATP synthesis may be a compensating upregulation of glycolysis in an attempt to maintain ATP levels [1]. Indeed enhanced glycolysis accompanied by mitochondrial abnormalities have been detected in ASD subjects (compared to siblings and controls) [19]. Importantly, upregulated glycolysis would enhance generation of the highly toxic bicarbonyl compound, Methylglyoxal (MG), produced following spontaneous decomposition of the glycolytic intermediates, dihydroxyacetone-phosphate and glyceraldehyde-3-phosphate. MG is a strong glycating agent and well-recognised as a major source of the post-synthetic protein modifications which characterise both type-2 diabetes and ageing [20,21]. The notion that ASD is associated with enhanced MG generation is supported by the detection in some autistic subjects of gene polymorphisms in the MG detoxification enzyme, glyoxalase-1 [22–25], which could result in decreased MG elimination and increased macromolecular glycation. The increased glycolytic activity could therefore account for the raised levels of glycated proteins detected in autistic patients’ plasma and urine [2], especially if glyoxalase-1 activity was insufficient to meet the increased generation of MG. However it must be pointed out that the suggestion that ASD is associated with glyoxalase dysfunction has been disputed [26,27]. Never-the-less, it is interesting that (i) changes in glyoxalase-1 expression in white blood cells seems to influence mood in human subjects [28], and (ii) it has recently been reported that erythrocytes of autistic boys possess lower levels of the detoxification enzyme retinal dehydrogenase (RALDH1), than was present in controls [29], observations which suggest that detoxification deficiency may influence behaviour in ASD individuals. The possibility that autism is associated with aldehyde toxicity generally and acetaldehyde in particular, has been proposed [30]. Furthermore, it has recently been shown that MG readily reacts with β-alanine [31], a reaction which would decrease pantothenate synthesis and further compromise formation of the CoA in the microbiome, as outlined above. Additionally the microbiome can also generate a well-studied neurotoxin, 3-Nitropropionic Acid (3NPA), presumably from propionic acid, which can induce a range of neuropathologies in model animals [32], although no specific claims for ASD have been made. Biochemically, 3NPA inhibits the TCA cycle enzyme succinate dehydrogenase, thereby compromising mitochondrial ATP synthesis and so could induce a Warburg-like metabolic state. It is likely that any gut organism in which propionic acid accumulates (as discussed above) may also increase the potential for 3NPA generation following attack by Reactive Nitrogen Species (RNS); it is noteworthy ASD sera is enriched with nitrated proteins [2]. Consequently, it is possible to integrate a number of observations associated with ASD, including mitochondrial dysfunction, propionic acid accumulation, increased urinary β-alanine levels, decreased pantothenate levels, decreased glyoxalase-1 activity, and raised levels of sera oxidized, nitrated and glycated proteins.

There is additional evidence that ASD may be associated directly with changes in energy metabolism. A number of studies showing that the anti-aging agent rapamycin, which suppresses mTOR signalling activity to decrease glycolysis and upregulate oxidative phosphorylation, also suppresses autism-like behaviour in animal models [33,34]. Glycated proteins (AGEs) have been shown to activate mTOR [6] and elevated mTOR activity was detected in cells obtained from ASD children [35,36], suggesting a possible causative relationship between these phenomena. Animals exposed to valproic acid have been used as an animal model of ASD see Nicolini & Fahnestock, 2018 for recent review [37]: amongst the resultant effects of valproic acid is a dose dependent stimulation of glycolysis [38] and, perhaps even more importantly, it has previously been observed that resveratrol, an anti-diabetic agent which inhibits non-enzymic glycosylation (glycation) of proteins, prevents valproic acid-induced social impairment in these animals [40]. Furthermore, ketogenic diets (presumably provoking very little glycolysis) have been shown to be somewhat effective in controlling ASD behavioural symptoms in human subjects [41]. Although it is uncertain whether these effects are mediated via the microbiome or specifically in the cells of CNS, these findings are nevertheless consistent with the suggestion that ASD is associated with increased protein glycation resulting from enhanced glycolysis and MG generation.

Deficiency in vitamin-D has also been proposed to play a role in ASD [42–44] and it has been claimed that vitamin D supplementation in children may improve symptoms of ASD [45]. It is interesting to note that vitamin D appears to play a role in controlling the reaction between advanced glycation end-products (AGEs) with their cellular receptors (RAGEs) [46–48], again observations consistent with the findings of elevated levels of protein glycation in ASD subjects.

Carnosine and ASD

The dipeptide carnosine (β-alanyl-L-histidine), when given as a dietary supplement to autistic children, has been shown to exert beneficial effects on behaviour [49,50]. Furthermore the levels of carnosine in urine [51] and sera [17,52 ] of autistic subjects are reported to be substantially lower (by up to 75%) than in controls. Although first described more than 100 years ago [53], carnosine was regarded as “enigmatic” [54]; its precise physiological function still remains uncertain. Amongst the variety of suggestions, all supported with evidence using model and/or cell and animal studies, carnosine can behave as a hydrogen ion buffer, anti-oxidant, anti-glycator, wound-healing agent, metal ion chelator, whilst beneficial effects towards diabetes, atherosclerosis, heart failure, tumour cell growth and cellular ageing have also been reported [55–57]. Interestingly, dietary supplementation studies in human subjects have revealed improvement in cognition and/or behaviour in schizophrenics [58], elderly subjects [59], Gulf War veterans [60] and as well as autistic children [3, 52].

There are a number of possible mechanisms by which carnosine might ameliorate aspects of ASD. First, the additional presence of dietary dipeptide carnosine could, following its hydrolysis, provide a supply of β-alanine and thus allow pantothenate and CoA synthesis in the microbiome, and thereby permit effective oxidative phosphorylation and perhaps additionally ensuring removal of the propionic acid via its carboxylation using acetyl-CoA kinase. Secondly, as outlined above, in order to maintain ATP levels, a compensating response to mitochondrial dysfunction would be enhanced glycolysis, despite the presence of oxygen (i.e. Warburg effect). There is evidence that carnosine can partially suppress glycolysis and decrease glycolytic ATP synthesis in yeast [61] and in transformed cells [62–64 ], which may decrease synthesis of triose phosphates and MG formation. Carnosine can also directly react with methylglyoxal [65] and other reactive carbonyl compounds [66], as well as inhibit formation of glycated proteins as shown in whole animal studies [67,68] and in humans [69]. Carnosine has also been shown to exert regulatory effects on mitochondrial function [70,71] as well as activate the Nrf2 transcription factor (regulator of the antioxidant response) and thereby enhance oxidative defence [72,73]. It is relevant to note that autism in young boys is associated with alteration in Nfr2 expression and/or function [10,74]. Furthermore it should be noted that carnosine may mimic rapamycin to some degree in its ability to inhibit mTOR activity [75]; as noted above, rapamycin is a well-recognised mTOR inhibitor that exerts beneficial effects towards ASD subjects and in animal models [33–35].

These properties (inhibitory effects on mTOR and glycolysis, suppression of MG-induced macromolecular modifications and enhancement of anti-oxidant defence) exhibited by carnosine would appear to counter the onset of the Warburg effect and might account for the beneficial effects of carnosine towards at least some aspects of ASD. Furthermore carnosine has been shown to suppress acetaldehyde-mediated toxicity towards cultured cells [76] and DNA-protein cross-linking in a model system [77], observations consistent with the proposal that ASD is somehow associated with acetaldehyde-mediated dysfunction [30]. It is interesting to note that carnosine seems to possess many of the properties which are likely to suppress generation of the changes exhibited by sera and urinary proteome detected in ASD subjects [2].

There is also a study showing that carnosine can ameliorate the deleterious effect of propionic acid in an animal model of ASD, although the mechanisms responsible have not been explored [78]. Recent studies have suggested that the DJ-1 protein complex can facilitate protein deglycation [31], including glycated β-alanine (induced by MG). Many years ago it was suggested that carnosine might participate the repair of glycated proteins (via deglycation and/or transglycation), perhaps acting as a recipient of the detached glycating agent [79]. However, the possibility that carnosine might participate in protein deglycation has not been explored experimentally.

Carnosine can also inhibit protein nitration by forming adducts such as NO-carnosine and carnosine nitrite [80]. Given that raised levels of protein nitration have been detected in ASD plasma and urine [2], as well as in hair and nails [81], this may partly explain carnosine’s ability to moderate aspects ASD behaviour [49]. More recently it has been shown that romidepsin can ameliorate autism-like behavioural symptoms in a mouse model of ASD [82] by binding to zinc ions in the zinc pocket of histone deacetylase and thus altering gene expression. As carnosine is a well-known zinc chelator, one wonders if the dipeptide might also bind the zinc in histone deacetylase in a manner similar to romidepsin.

Agmatine and ASD

There is evidence from an animal study that agmatine (decarboxylated arginine) can be beneficial towards valproic acid-induced autism-like symptoms of ASD in an animal model [83,84] and that some ASD subjects possess decreased levels of agmatine in their sera [5]. While there is evidence that agmatine possesses anti-inflammatory properties [84,85], there is little direct evidence of any anti-glycation activity of agmatine, although the structure of the molecule (an amino group plus the guanidino group) resembles the strong but toxic anti-glycator, aminoguanidine. Consequently, it is suggested that agmatine should be very readily glycated by a variety of reactive aldehydes, including MG and acetaldehyde, although this property does not appear to have been investigated. Never-the-less it is very relevant to note that agmatine can bind ADP-ribose [86] which may indicate agmatine’s possible inhibitory action towards protein modification by ADP-ribose, or its participation in reversible protein modification (e.g. NAD-dependent histone deacetylation or polyADP ribosylation). The fact that agmatine activity has been likened to that of the anti-aging agent rapamycin [87], including mTOR inhibition, suppression of glycolysis and activation of mitochondrial activity [88], supports this idea. The findings that ASD is associated with changes in arginine metabolism [34] and its intracellular distribution [2] reinforces the proposal that arginine’s decarboxylation product, agmatine, might be ameliorative [89].

It is perhaps also interesting to note that agmatine can promote an increase in cyclic-AMP levels in tissues [88], but cyclic-AMP has been reported to suppress carnosine synthesis [90]. Such observations might suggest that while agmatine can suppress carnosine synthesis, but upon its glycation agmatine may not suppress carnosine synthesis, which could indicate a possible regulatory mechanism of carnosine production in response to endogenous and exogenous glycating agents. Agmatine has been shown to inhibit polyamine synthesis, but whether this property is suppressed following agmatine glycation has not been investigated. However it has been proposed that polyamines generally can, by being readily glycated themselves [91], behave protectively and thereby prevent glycation of polypeptides and nucleic acids.

Conclusions

ASD causation is undoubtedly complex [92]; amongst the factors so far recognised are changes in the microbiome, enhanced glycolytic activity, mitochondrial dysfunction and alteration in redox activity, all of which, presumably together with unrecognised metabolic and exogenous agents, contribute to varying degrees to the changes in behaviour and social interaction which characterise autism. Amongst these factors are agents such as AGEs which affect energy metabolism directly or indirectly, especially glycolysis, oxidative phosphorylation and their potentially dysfunctional, glycated, by-products.

The proposal that ASD is associated with mTOR activation leading to enhanced glycolytic activity as exemplified by the establishment of the Warburg effect (as proposed by Vallée & Vallée, [1] is supported by the findings that not only is a ketogenic diet beneficial towards ASD [93], but that glycated proteins (i.e. AGEs) can indeed activate mTOR to provoke onset of the Warburg effect [6]. Thus carnosine and possibly agmatine, both being pluripotent and essentially non-toxic endogenous molecules which can decrease glycolysis, possibly via effects on mTOR [75,87], plus their reactivity towards reactive carbonyls such as MG, may inhibit protein glycation and thereby ameliorate some of the consequences of increased glycolytic activity and exert beneficial effects on aspects of behaviour in ASD children. Although the specific mechanisms by which some of these effects are mediated may differ; for example control of protein nitration may occur via carnosine’s direct reaction with the nitrating agent whereas agmatine may inhibit nitric oxide synthesis, such complementary mechanisms could conceivably be therapeutically efficacious. That changes in both carnosine and agmatine may be connected to ASD is also supported by the findings that their serum levels are substantially lower in ASD subjects and that they both can also ameliorate the effects of propionic acid, which is known to sometimes accumulate in ASD. It is also suggested that the ability of carnosine and agmatine to ameliorate the effects of MG, either directly or following upregulation of antioxidant defences may also contribute to their efficacy towards ASD. It is interesting to note that two of propionic acid’s likely metabolites, 3-nitropropionate [94] and propionaldehyde [95], have also been associated with ASD; both carnosine and agmatine, could theoretically antagonise either their formation and/or toxicity via inhibiting propionate nitration or promoting aldehyde scavenging.

Whether combined treatment with both carnosine and agmatine is therapeutic towards ASD has not been explored. However, it has been noted that co-administration of carnosine and arginine (agmatine precursor) was more effective in combating hypoxic stress in rats than when either agent was supplied singly [96], an observation at least consistent with the above suggestion. More generally, as both carnosine and agmatine [97] when administered separately seem to exert beneficial effects towards aspects of both Parkinson’s disease [70, 98, 99] and Alzheimer’s disease [100–102] in cellular and animal models, then perhaps their co-administration should be also explored towards these age-related neurodegenerative conditions.

References

  1. Vallée A, Vallée JN (2018) Warburg effect hypothesis in autism Spectrum disorders. Mol Brain 11: 1. [crossref]
  2. Anwar A, Abruzzo PM, Pasha S, Rajpoot K, Bolotta A, et al (2018) Advanced glycation endproducts, dityrosine and arginine transporter dysfunction in autism – a source of biomarkers for clinical diagnosis. Mol. Autism 9: 3.
  3. Zaki MM, Abdel-Al H, Al-Sawi M (2017). Assessment of plasma amino acid profile in autism using cation-exchange chromatography with postcolumn derivatization by ninhydrin. Turk J Med Sci 47: 260–267.
  4. Mavel S, Nadal-Desbarats L, Blasco H, Bonnet-Brilhault F, Barthélémy C (2013) 1H-13C NMR-based urine metabolic profiling in autism spectrum disorders. Talanta 114: 95–102.
  5. Esnafoglu E, Irende I (2018) Decreased plasma agmatine levels in autistic subjects. J Neural Transm .
  6. Zhao X, Chen Y, Tan X, Zhang L, Zhang H, et al (2018) Advanced glycation end-products suppress autophagic flux in podocytes by activating mammalian target of rapamycin and inhibiting nuclear translocation of transcription factor EB. J Pathol. Mar 23.
  7. Varga NÁ, Pentelényi K, Balicza P, Gézsi A, Reményi V, et al (2018) Mitochondrial dysfunction and autism: comprehensive genetic analyses of children with autism and mtDNA deletion. Behav Brain Funct 14: 4.
  8. Hollis F, Kanellopoulos AK, Bagni C (2017) Mitochondrial dysfunction in Autism Spectrum Disorder: clinical features and perspectives. Curr Opin Neurobiol 45: 178–187.
  9. Pei L, Wallace DC (2017) Mitochondrial Etiology of Neuropsychiatric Disorders. Biol Psychiatry : S0006–3223(17)32209–32216.
  10. Napoli E, Wong S, Hertz-Picciotto I, Giulivi C (2014) Deficits in bioenergetics and impaired immune response in granulocytes from children with autism. Pediatrics 133: 1405–1410. [crossref]
  11. de la Bâtie CD, Barbier V, Roda C, Brassier A, Arnoux JB, et al. (2017) Autism spectrum disorders in propionic acidemia patients. J Inherit Metab Dis . [crossref]
  12. Frye RE, Nankova B, Bhattacharyya S, Rose S, Bennuri SC, et al (2017). Modulation of Immunological Pathways in Autistic and Neurotypical Lymphoblastoid Cell Lines by the Enteric Microbiome Metabolite Propionic Acid. Front Immunol 8: 1670
  13. Choi J, Lee S (2018) Pathophysiological and neurobehavioral characteristics of a propionic acid-mediated autism-like rat model. PLoS One 13: 192925. [crossref]
  14. Macfabe D (2013) Autism: metabolism, mitochondria, and the microbiome. Glob. Adv. Health Med 2; 52–66.
  15. Morland C, Frřland AS, Pettersen MN, Storm-Mathisen J, Gundersen V, et al (2018) Propionate enters GABAergic neurons, inhibits GABA transaminase, causes GABA accumulation and lethargy in a model of propionic acidemia. Biochem J 475: 749–758.
  16. Patowary A, Nesbitt R, Archer M, Bernier R, Brkanac Z (2017) Next Generation Sequencing Mitochondrial DNA Analysis in Autism Spectrum Disorder. Autism Res 10: 1338–1343.
  17. Xie Z, Jones A, Deeney JT, Hur SK, Bankaitis VA (2016) Inborn Errors of Long-Chain Fatty Acid β-Oxidation Link Neural Stem Cell Self-Renewal to Autism. Cell Rep 14: 991–999. [crossref]
  18. Powers SK (2014) Can antioxidants protect against disuse muscle atrophy? Sports Med 44: 155–165. [crossref]
  19. Rose S, Bennuri SC, Wynne R, Melnyk S, James SJ, Frye RE. (2017) Mitochondrial and redox abnormalities in autism lymphoblastoid cells: a sibling control study. FASEB J 31: 904–909.
  20. Rabbani N, Xue M, Thornalley PJ (2016) Methylglyoxal-induced dicarbonyl stress in aging and disease: first steps towards glyoxalase 1-based treatments. Clin Sci (Lond) 130: 1677–1696.
  21. Allaman I, Bélanger M, Magistretti PJ2 (2015) Methylglyoxal, the dark side of glycolysis. Front Neurosci 9: 23. [crossref]
  22. Gabriele S, Lombardi F, Sacco R, Napolioni V, Altieri L, Tirindelli MC, Gregorj C, Bravaccio C, Rousseau F, Persico AM (2014) The GLO1 C332 (Ala111) allele confers autism vulnerability: family-based genetic association and functional correlates. J Psychiatr Res 59: 108–116.
  23. Junaid MA, Kowal D, Barua M, Pullarkat PS, Sklower Brooks S, et al. (2004) Proteomic studies identified a single nucleotide polymorphism in glyoxalase I as autism susceptibility factor. Am J Med Genet A 131: 11–17. [crossref]
  24. Barua M, Jenkins EC, Chen W, Kuizon S, Pullarkat RK, Junaid MA (2011) Glyoxalase I polymorphism rs2736654 causing the Ala111Glu substitution modulates enzyme activity–implications for autism. Autism Res 4: 262–270.
  25. Maher P (2012). Methylglyoxal, advanced glycation end products and autism: is there a connection? Med Hypotheses 78: 548–552.
  26. KovaÄŤ J, Podkrajšek KT, LukšiÄŤ MM, Battelino T (2015) Weak association of glyoxalase 1 (GLO1) variants with autism spectrum disorder. Eur Child Adolesc Psychiatry 24: 75–82. [crossref]
  27. Wu YY1, Chien WH, Huang YS, Gau SS, Chen CH (2008) Lack of evidence to support the glyoxalase 1 gene (GLO1) as a risk gene of autism in Han Chinese patients from Taiwan. Prog Neuropsychopharmacol Biol Psychiatry 32: 1740–1744. [crossref]
  28. Fujimoto M, Uchida S, Watanuki T, Wakabayashi Y, Otsuki K, et al. (2008) Reduced expression of glyoxalase-1 mRNA in mood disorder patients. Neurosci Lett 438: 196–199. [crossref]
  29. Paval D, Rad F, Rusu R, Niculae AS, Colosi HA, et al (2017) Low Retinal Dehydrogenase 1 (RALDH1) Level in Prepubertal Boys with Autism Spectrum Disorder: A Possible Link to Dopamine Dysfunction? Clin Psychopharmacol Neurosci 15: 229–236.
  30. Jurnak F (2016) The Pivotal Role of Aldehyde Toxicity in Autism Spectrum Disorder: The Therapeutic Potential of Micronutrient Supplementation. Nutr Metab Insights 14: 57–77.
  31. Matsuda N, Kimura M, Queliconi BB, Kojima W, Mishima M, et al (2017) Parkinson’s disease-related DJ-1 functions in thiol quality control against aldehyde attack in vitro. Sci Rep 7: 12816.
  32. Liachenko S, Ramu J, Paule MG, Hanig J (2018) Comparison of quantitative T2 and ADC mapping in the assessment of 3-nitropropionic acid-induced neurotoxicity in rats. Neurotoxicology 65: 52–59. [crossref]
  33. Winden KD, Ebrahimi-Fakhari D, Sahin M (2018) Abnormal mTOR Activation in Autism. Annu Rev Neurosci . [crossref]
  34. Zhang J, Liu LM, Ni JF (2017) Rapamycin modulated brain-derived neurotrophic factor and B-cell lymphoma 2 to mitigate autism spectrum disorder in rats. Neuropsychiatr Dis Treat 13: 835–842
  35. Onore C, Yang H, Van de Water J, Ashwood P (2017) Dynamic Akt/mTOR Signaling in Children with Autism Spectrum Disorder. Front Pediatr 5: 43. [crossref]
  36. Nicolini C, Ahn Y, Michalski B, Rho JM, Fahnestock M (2015). Decreased mTOR signaling pathway in human idiopathic autism and in rats exposed to valproic acid. Acta Neuropathol Commun 3: 3.
  37. Nicolini C, Fahnestock M (2018) The valproic acid-induced rodent model of autism. Exp Neurol 299: 217–227. [crossref]
  38.  Aucamp J, Van Dyk HC, Bronkhorst AJ, Pretorius PJ (2017) Valproic acid alters the content and function of the cell-free DNA released by hepatocellular carcinoma (HepG2) cells in vitro. Biochimie 140: 93–105. [crossref]
  39. Shen Y, Xu Z, Sheng Z. (2017). Ability of resveratrol to inhibit advanced glycation end product formation and carbohydrate-hydrolyzing enzyme activity, and to conjugate methylglyoxal. Food Chem 216: 153–160.
  40. Bambini-Junior V, Zanatta G, Della Flora Nunes G, Mueller de Melo G, Michels M, et al (2014) Resveratrol prevents social deficits in animal model of autism induced by valproic acid. Neurosci Lett 583: 176–81.
  41. El-Rashidy O, El-Baz F, El-Gendy Y, Khalaf R, Reda D, et al (2017) Ketogenic diet versus gluten free casein free diet in autistic children: a case-control study. Metab Brain Dis 32: 1935–1941. [crossref]
  42. Berridge MJ (2018) Vitamin D deficiency: infertility and neurodevelopmental diseases (attention deficit hyperactivity disorder, autism, and schizophrenia). Am J Physiol Cell Physiol 314: 135–151.
  43. El-Ansary A, Cannell JJ, Bjřrklund G, Bhat RS, Al Dbass AM (2018) In the search for reliable biomarkers for the early diagnosis of autism spectrum disorder: the role of vitamin D. Metab Brain Dis
  44. Guo M1, Zhu J1, Yang T1, Lai X1, Lei Y1, et al. (2018) Vitamin A and vitamin D deficiencies exacerbate symptoms in children with autism spectrum disorders. Nutr Neurosci  [crossref]
  45. Saad K. Abdel-Rahman AA, Elserogy YM, Al-Atram AA, El-Houfey AA, Othman HA, et al (2018) Randomized controlled trial of vitamin D supplementation in children with autism spectrum disorder. J Child Psychol Psychiatry 59: 20–29.
  46. Rüster C, Franke S, Reuter S, Mrowka R, Bondeva T, Wolf G (2016) Vitamin D3 Partly Antagonizes Advanced-Glycation Endproducts-Induced NF?B Activation in Mouse Podocytes. Nephron 134: 105–116.
  47. Merhi Z, Buyuk E, Cipolla MJ (2018) Advanced glycation end products alter steroidogenic gene expression by granulosa cells: an effect partially reversible by vitamin D. Mol Hum Reprod Mar 12.
  48. Molinuevo MS, Fernández JM, Cortizo AM, McCarthy AD, Schurman L, et al (2017) Advanced glycation end products and strontium ranelate promote osteogenic differentiation of vascular smooth muscle cells in vitro: Preventive role of vitamin D. Mol Cell Endocrinol. 450: 94–104.
  49. Chez MG, Buchanan CP, Aimonovitch MC, Becker M, Schaefer K, et al (2002) Double-blind, placebo-controlled study of L-carnosine supplementation in children with autistic spectrum disorders. J Child Neurol 17: 833–837.
  50. Hajizadeh-Zaker R, Ghajar A, Mesgarpour B, Afarideh M, Mohammadi MR, (2018) L-Carnosine as an Adjunctive Therapy to Risperidone in Children with Autistic Disorder: A Randomized, Double-Blind, Placebo-Controlled Trial. J Child Adolesc Psychopharmacol 28: 74–81.
  51. Ming X, Stein TP, Barnes V, Rhodes N, Guo L (2012) Metabolic perturbance in autism spectrum disorders: a metabolomics study. J Proteome Res 11: 5856–5862.
  52. Bala KA, Doğan M, Mutluer T, Kaba S, Aslan O, et al (2016) Plasma amino acid profile in autism spectrum disorder (ASD). Eur Rev Med Pharmacol Sci 20: 923–929.
  53. Boldyrev AA (2000) Problems and perspectives in studying the biological role of carnosine. Biochemistry (Mosc) 65: 751–756.
  54. Bauer K (2005) Carnosine and homocarnosine, the forgotten, enigmatic peptides of the brain. Neurochem Res 30: 1339–1345. [Crossref]
  55. Boldyrev AA, Aldini G, Derave W (2013) Physiology and pathophysiology of carnosine. Physiol Rev 93: 1803–1845.
  56. Hipkiss AR, Baye E, de Courten B (2016) Carnosine and the processes of ageing. Maturitas 93: 28–33.
  57. Cararo JH, Streck EL, Schuck PF, Ferreira Gda C (2015) Carnosine and Related Peptides: Therapeutic Potential in Age-Related Disorders. Aging Dis 6: 369–379
  58. Chengappa KN, Turkin SR, DeSanti S, Bowie CR, Brar JS (2012). A preliminary, randomized, double-blind, placebo-controlled trial of L-carnosine to improve cognition in schizophrenia. Schizophr Res 142: 145–52.
  59. Szcześniak D, Budzeń S, Kopeć W, Rymaszewska J (2014) Anserine and carnosine supplementation in the elderly: Effects on cognitive functioning and physical capacity. Arch Gerontol Geriatr 59: 485–90.
  60. Baraniuk JN, El-Amin S, Corey R, Rayhan R, Timbol C (2013) Carnosine treatment for gulf war illness: a randomized controlled trial. Glob J Health Sci 5: 69–81.
  61. Cartwright SP, Bill RM, Hipkiss AR (2012) L-carnosine affects the growth of Saccharomyces cerevisiae in a metabolism-dependent manner. PLoS One 7: 45006.
  62. Holliday R, McFarland GA (1996) Inhibition of the growth of transformed and neoplastic cells by the dipeptide carnosine. Br. J. Cancer. 73: 966–971
  63. Renner C, Asperger A, Seyffarth A, Meixensberger J, Gebhardt R, Gaunitz F (2010) Carnosine inhibits ATP production in cells from malignant glioma. Neurol Res. 32: 101–105.
  64. Renner C, Zemitzsch N, Fuchs B, Geiger KD, Hermes M (2010) Carnosine retards tumor growth in vivo in an NIH3T3-HER2/neu mouse model. Mol Cancer 9: 2.
  65. Hipkiss AR, Chana H (1998) Carnosine protects proteins against methylglyoxal-mediated modifications. Biochem Biophys Res Commun 248: 28–32.
  66. Vistoli G, Colzani M, Mazzolari A, Gilardoni E, Rivaletto C, et al (2017) Quenching activity of carnosine derivatives towards reactive carbonyl species: Focus on α-(methylglyoxal) and β-(malondialdehyde) dicarbonyls. Biochem Biophys Res Commun 492: 487–492.
  67. Aydın AF, Küçükgergin C, Çoban J, Doğan-Ekici I, Doğru-Abbasoğlu S, Uysal M, Koçak-Toker N. (2018). Carnosine prevents testicular oxidative stress and advanced glycation end product formation in D-galactose-induced aged rats. Andrologia. 50(3).
  68. Bingül İ, Yılmaz Z, Aydın AF, Çoban J, Doğru-Abbasoğlu S, et al (2017) Antiglycation and anti-oxidant efficiency of carnosine in the plasma and liver of aged rats. Geriatr Gerontol Int 17: 2610–2614.
  69. Houjeghani S, Kheirouri S, Faraji E, Jafarabadi MA (2018) L-Carnosine supplementation attenuated fasting glucose, triglycerides, advanced glycation end products, and tumor necrosis factor-α levels in patients with type 2 diabetes: a double-blind placebo-controlled randomized clinical trial. Nutr Res 49: 96–106.
  70. Zhao J, Shi L, Zhang LR (2017) Neuroprotective effect of carnosine against salsolinol-induced Parkinson’s disease. Exp Ther Med 14: 664–670.
  71. Baek SH, Noh AR, Kim KA, Akram M, Shin YJ, (2014) Modulation of mitochondrial function and autophagy mediates carnosine neuroprotection against ischemic brain damage. Stroke 45: 2438–2443.
  72. Ooi TC, Chan KM, Sharif R (2017) Zinc L-carnosine suppresses inflammatory responses in lipopolysaccharide-induced RAW 264.7 murine macrophages cell line via activation of Nrf2/HO-1 signalling pathway. Immunopharmacol Immunotoxicol 39: 259–267.
  73. Ahshin-Majid S, Zamani S, Kiamari T, Kiasalari Z, Baluchnejadmojarad T, Roghani M (2016) Carnosine ameliorates cognitive deficits in streptozotocin-induced diabetic rats: Possible involved mechanisms. Peptides 86: 102–111.
  74. Stamova BS, Tian Y, Nordahl CW, Shen MD, Rogers S, et al (2013) Evidence for differential alternative splicing in blood of young boys with autism spectrum disorders. Mol Autism. 4: 30.
  75. Zhang Z, Miao L, Wu X, Liu G, Peng Y (2014) Carnosine Inhibits the Proliferation of Human Gastric Carcinoma Cells by Retarding Akt/mTOR/p70S6K Signaling. J Cancer 5: 382–389.
  76. Hipkiss AR, Michaelis J, Syrris P, Dreimanis M (1995) Strategies for the extension of human lifespan. Perspect. in Human Biol 1: 59–70.
  77. Hipkiss AR, Preston JE, Himsworth DT, Worthington VC, Keown M, Michaelis J, et al (1998) Pluripotent protective effects of carnosine, a naturally occurring dipeptide. Ann N Y Acad Sci 854: 37–53
  78. El-Ansary A, Shaker GH, El-Gezeery AR, Al-Ayadhi L (2013) The neurotoxic effect of clindamycin – induced gut bacterial imbalance and orally administered propionic acid on DNA damage assessed by the comet assay: protective potency of carnosine and carnitine. Gut Pathog 5: 9.
  79. Szwergold BS (2005) Intrinsic toxicity of glucose, due to non-enzymatic glycation, is controlled in-vivo by deglycation systems including: FN3K-mediated deglycation of fructosamines and transglycation of aldosamines. Med Hypotheses 65: 337–348.
  80. Fontana M, Pinnen F, Lucente G, Pecci L (2002) Prevention of peroxynitrite-dependent damage by carnosine and related sulphonamido pseudodipeptides. Cell Mol Life Sci 59: 546–551.
  81. Lakshmi Priya MD, Geetha A (2011) A biochemical study on the level of proteins and their percentage of nitration in the hair and nail of autistic children. Clin Chim Acta 412: 1036–1042.
  82. Qin L, Ma K, Wang ZJ, Hu Z, Matas E (2018) Social deficits in Shank3-deficient mouse models of autism are rescued by histone deacetylase (HDAC) inhibition. Nat Neurosci. Mar 12.
  83. Kim JW, Seung H, Kim KC, Gonzales ELT, Oh HA, et al (2017) Agmatine rescues autistic behaviors in the valproic acid-induced animal model of autism. Neuropharmacology. 113: 71–81.
  84. Kim JM, Lee JE, Cheon SY, Lee JH, Kim SY (2017) The Anti-inflammatory Effects of Agmatine on Transient Focal Cerebral Ischemia in Diabetic Rats. J Neurosurg Anesthesiol 28
  85. Turan I, Ozacmak HS, Ozacmak VH, Barut F, Araslı M (2017) Agmatine attenuates intestinal ischemia and reperfusion injury by reducing oxidative stress and inflammatory reaction in rats. Life Sci. 189: 23–28.
  86. Laing S, Unger M, Koch-Nolte F, Haag F (2011) ADP-ribosylation of arginine. Amino Acids 41: 257–269.
  87. Neis VB, Moretti M, Bettio LE, Ribeiro CM, Rosa PB (2016) Agmatine produces antidepressant-like effects by activating AMPA receptors and mTOR signaling. Eur Neuropsychopharmacol 26: 959–971.
  88. Nissim I, Horyn O, Daikhin Y, Chen P, Li C (2014) The molecular and metabolic influence of long term agmatine consumption. J Biol Chem 289: 9710–9729.
  89. Gilad GM, Gilad VH (2013) Evidence for oral agmatine sulfate safety–a 95-day high dosage pilot study with rats. Food Chem Toxicol 62: 758–762.
  90. Schulz M, Hamprecht B, Kleinkauf H, Bauer K (1989) Regulation by dibutyryl cyclic AMP of carnosine synthesis in astroglia-rich primary cultures kept in serum-free medium. J. Neurochem. 52: 229–234.
  91. Gugliucci A, Menini T (2003) The polyamines spermine and spermidine protect proteins from structural and functional damage by AGE precursors: a new role for old molecules? Life Sci 72: 2603–2616.
  92. Ji X, Kember RL, Brown CD, Bucan M. (2016). Increased burden of deleterious variants in essential genes in autism spectrum disorder. PNAS 113: 15054–15059.
  93. Newell C, Bomhof MR, Reimer RA, Hittel DS, Rho JM, Shearer J (2016) Ketogenic diet modifies the gut microbiota in a murine model of autism spectrum disorder. Mol Autism. 7: 37.
  94. Alarcón-Herrera N, Flores-Maya S, Bellido B, García-Bores AM, Mendoza E, et al (2017) Protective effects of chlorogenic acid in 3-nitropropionic acid induced toxicity and genotoxicity. Food Chem Toxicol 109: 1018–1025
  95. Kalkbrenner AE, Windham GC, Zheng C, McConnell R, Lee NL, Schauer JJ, Thayer B, Pandey J, Volk HE (2018) Air Toxics in Relation to Autism Diagnosis, Phenotype, and Severity in a U.S. Family-Based Study. Environ Health Perspect 126: 037004.
  96. Fadda LM, Attia HA, Al-Rasheed NM, Ali HM, Aldossari M. (2017). Attenuation of DNA damage and mRNA gene expression in hypoxic rats using natural antioxidants. J Biochem Mol Toxicol 31
  97. Laube G, Bernstein HG (2017) Agmatine: multifunctional arginine metabolite and magic bullet in clinical neuroscience? Biochem J 474: 2619–2640.
  98. Hipkiss AR (2018) Glycotoxins: Dietary and Metabolic Origins; Possible Amelioration of Neurotoxicity by Carnosine, with Special Reference to Parkinson’s Disease. Neurotox Res Feb 7.
  99. Tsai SJ, Kuo WW, Liu WH, Yin MC (2010) Antioxidative and anti-inflammatory protection from carnosine in the striatum of MPTP-treated mice. J Agric Food Chem 58: 11510–11516.
  100. Kawahara M, Tanaka KI, Kato-Negishi M (2018) Zinc, Carnosine, and Neurodegenerative Diseases. Nutrients 10: 147.
  101. Herculano B, Tamura M, Ohba A, Shimatani M, Kutsuna N, Hisatsune T (2013) β-alanyl-L-histidine rescues cognitive deficits caused by feeding a high fat diet in a transgenic mouse model of Alzheimer’s disease. J Alzheimers Dis 33: 983–997.
  102. Hipkiss AR (2007) Could carnosine or related structures suppress Alzheimer’s disease? J Alzheimers Dis 11: 229–40.

Is Cervical Cancer a Defeated Enemy?

DOI: 10.31038/IGOJ.2018114

Editorial

Cervical screening by Pap-test has been on the top of public health agenda for several decades. This is not because of the epidemiological weight of the disease but because we have all tools for its prevention in hand. The primary prevention of cervical cancer by vaccination against human papillomvirus (HPV) infection is an increasingly widespread practice; however, we still do not know enough how long the protection will last. The secondary prevention by method of proven effectiveness for early detection of both premalignant lesion of uterine cervix, and cervical cancer itself has long been widely available for women. Screening tests, by definition, sort out apparently well persons who probably have the target disease those who have not. Cervical screening is to substantially reduce the burden of disease in terms of mortality, morbidity, and improve quality of life. Primary and secondary prevention of cervical cancer could be the “success story” of health care system. Unfortunately, they are not so.

In the last 50–60 years, the clinical spread of screening was followed by the need for its public health application. In 1960’s, expert groups established the concept of “organized screening”, as opposed to “opportunistic” one, meaning actions initiated and financed by the provider health care system, and individually inviting of those women to be screened [1]. In the development of such population screening, the Nordic Countries have shown a good example [2]. Population screening is most effective if most invited women in the eligible population choose to participate. The participation rate is the Achiles’heel of population screening.

In fact, not everyone benefits equally from the screening due to inequalities of various kind, such as diversity in health care systems, access to screening services, socioeconomic and demographic status, lack of knowledge and education, and last but not least, due to differences in geopolitical status [3].  Screening programmes are much better developed in Nordic and Western Europe as compared to the Central-Eastern Europe, where the burden of the disease is much higher due to a history of mostly opportunistic cervical screening practices, and due to the strong influence of political and economic changes in post-communist transition; as a result the screening facilities are underdeveloped [4].

As far as Europe is concerned, in 2003, the Council of the European Union recommended to its Member States to implement organized, population-based cervical screening programmes [5]. In 2017, in the second report of the implementation of the Council Recommendation, out of 27 member states not more than nine countries reported “complete rolling out”, the rest of the countries “piloting” or “planning” organised cervical screening programmes [6]. The up-to-date estimates of cancer burden in Europe shows that cervical cancer mortality is inversely proportional to the intensity of the cancer screening activities in the respective countries [7].

The gynaecological community has a lot to contribute with to the impact of cervical screening, as the smear-taking for cytological analysis is their task in all those countries where the task is not delegated to paramedical personnel, as midwifes, praxis nurses, public health nurses. In such a situation, the gynaecologists are the “gate-keepers” of the screening which tends to be opportunistic rather than organized one; opportunistic screening is much less effective than the organized one [8]. The insistence of gynaecological community on their “historical role” seems to be a major obstacle to be overcome.

Cytological screening every three to five years can potentially prevent up to four out five cases of cervical cancer, and can reduce cervical cancer incidence up to 80% at population level [9]. Such benefits can only be achieved if screening is provided in organised population-based programmes with optimal attendance rate, and quality assurance at all levels [10]. Following this protocol, the cervical cancer might become a defeated enemy [11].

References

  1. Hakama M, Niller AB, Day NE. (eds) Screening for Cancer of Uterine Cervix. IARC Sci. Publ. No. 76. IARC. Lyon. 1986. pp. 289–290.
  2. Lärä E, Day NE, Hakama M. Trends in mortality from cervical cancer in the Nordic countries: association with organized screening programmes. Lancet i. 1247–1249. 1987.
  3. Döbrőssy L, Kovács A, Budai A. Inequalities in cervical screening practices in Europe. Diversity. Equality Health Care 12(2): 34–36. 2015.
  4. Maver P, Seme K, Korac T. et al. Cervical cancer screening practices in central and eastern Europe. Acta Dermatovenerol. 22: 7–19. 2013.
  5. Council of the European Union. Council recommendation of 2 December on Cancer Screening. (2003/878/EC). Off. J. Eur. Union L327: 34–38.
  6. Cancer screening in the European Union. Report on the implementation of the Council Recommendation on cancer screening. IARC. Lyon. 2017.
  7.  Vicus D,  Sutradhar R, Lu  Y. et al. on behalf of the Investigators of the Ontario Cancer Screening Research Network. The association between cervical cancer screening and mortality from cervical cancer: A population based case–control study. Gynecol. Oncol. 133 (2): 167–171. 2014.
  8. Makkonen P, Heinävaara S, Tytti Sarkeala, Anttila A.  Impact of organized and opportunistic Pap testing on the risk of cervical cancer in young women. A case-control study from Finland. Gynecol Oncol. 147: 601–606. 2017.
  9. International Agency for Research on Cancer. Cervical cancer screening. Handbook of Cancer Prevention. IARC Press. Lyon. 2005.
  10. Arbyn M, Anttila A, Jordan J. et al European Guidelines for Quality Assurance in Cervical Cancer Screening. Second Edition. Summary Document. Ann Oncol. 21(3): 448–458. 2010.
  11. Peto J, Gilham C,   Fletche O. et al The cervical cancer epidemic that screening has prevented in the UK. Lancet 364: 249–256. 2004. [crossref]

The impact of P-glycoprotein and Midkine on Paclitaxel / Cisplatin Chemoresistance in Ovarian Cancer

DOI: 10.31038/CST.2018333

Abstract

Chemoresistance is one of the most important factors leading to high mortality in ovarian cancer (OC). Overexpression of P-glycoprotein (P-gp) in OC cells may results in resistance to paclitaxel treatment by pumping the drug out of the cells, which in turn decreases the intracellular drug concentration. Additionaly overproduction of midkine (MK) can also affect the development of chemoresistance in OC. Although, the mechanisms of action of P-gp and MK are not the same, overexpression of both proteins in OC may intensify chemoresistance to paclitaxel treatment. Therefore, simultaneously inhibition of P-gp and MK in overcoming chemoresistance to drugs may improve treatment results in OC.

Introduction

Ovarian cancer (OC) is the fourth most common type of gynecological cancers worldwide and has the highest mortality rates among female genital tract malignancies [1–3]. Even patients with same clinical characteristics, such as cancer stage, histological type and grade display different disease progression and treatment results [3–5]. Due to absence of specific symptoms in the early stage, OCs are diagnosed at the advanced stages in two thirds of the patients [6]. The overall 5 year survival rate is still less than 40% despite some advances in the treatment of OC, including the combination of surgery, radiation and chemotherapy. This may be attributed to the late stage diagnosis, poor prognosis and resistance to chemotherapy, which is one of the major problems to controlling malignant tumors [3, 7, 8]. The first-line treatment of OC is cytoreductive surgery followed by adjuvant chemotherapy, including paclitaxel and cisplatin [3, 9–11]. Paclitaxel, administered as monotherapy or in combination with cisplatin, is potentially effective therapeutic regimen in OC. Paclitaxel may be regarded as a mitotic poison and affects the cellular microtubule network. It inhibits chromosome alignment and segregation and then trigger the apoptosis pathway [10, 11].

Initial response rates to chemotherapy vary between 40 and 80% in OCs. However, majority of these patients who respond to chemotherapy at first, eventually have recurrence following the development of chemoresistance. Thus, acquired resistance is the main cause of unsuccessful treatment in OC. The molecular mechanisms behind chemoresistance is multifactorial and involves multiple processes, including drug transport and metabolism, DNA repair and apoptosis. Currently, the factors that affect the development of chemoresistance in OC has not been completely understood [6, 12]. Chemoresistance is usually attributed to the overproduction of P-gp. It has been reported that overexpression of P-gp is the major factor for reduced chemo-sensitivity in a lot of malignancies, including OC [6, 12–14]. It has been demonstrated that the overexpression of P-gp in aggressive OC cells results in the development of resistance to paclitaxel treatment [10, 11, 15]. Although the mechanism of P-gp-induced chemoresistance is not fully known, it is considered to acts essentially as an efflux pump and plays an important role in the exclusion of drugs from tumor cells, resulting in decreased accumulation of chemotherapy drugs within cancer cells [8, 10, 11, 15].

Another important protein, MK, is overexpressed in many cancers, including OC and induces the growth and survival of tumors. On the other hand, overproduction of MK can also affect the development of chemoresistance. The chemoresistance caused by MK is mainly due to its inhibitory action on the apoptosis process.

Our proposal is that both proteins, namely P-gp and MK, may protect tumor cells against chemotherapeutic drugs more effectively by a synergistically way than they do one by one and they could increase chemoresistance [3, 16–19]. Therefore, it can be speculated that inhibition of both proteins may enhance the effectiveness of paclitaxel chemosensitivity in OC.

The role of P-glycoprotein in chemoresistance to paclitaxel /cisplatin in ovarian cancer

ATP-binding cassette transporter B1 (ABCB1), also known as P-gp or multidrug resistance protein 1 (MDR1) is an adenosine triphosphate (ATP)-dependent efflux transporter located in the plasma membrane of many different cell types [20]. It is a 170 kD transmembrane glycoprotein and has unusually broad polyspecificity for structurally different substances, including anticancer drugs such as paclitaxel and cisplatin. Most of these substances are hydrophobic, thus, P-gp acts like a ‘’hydrophobic vacuum cleaner’’ [20].

P-gp leads to chemoresistance by pumping drugs out of the cells and decreases the intracellular drug concentration [9]. P-gp is also associated with a more progressed malignant phenotype in carcinogenesis. The function of P-gp in relation to cellular differentiation may be pleiotropic, depending on the origins from which the cancer arises [8]. P-gp is localized in the membrane of epithelial cells in the intestine, liver, proximal tubule of the kidney and in the capillary endothelial cells. It functions as a blood–brain barrier, blood–placenta barrier and blood-testis barrier and protects them from toxic xenobiotics [20]. This transporter may affect the pharmacological treatment of numerous diseases by changing drug pharmacokinetics and inhibiting accumulation of anticancer drugs in cancer cells. Cancer cells of some tissues also produce very large amount of P-gp, which lead to chemoresistance by transfering chemotherapeutic agents out of cancer cells. Additionally, increased intestinal expression of P-gp can inhibit the absorption of orally administered drugs, promotes their biliary and renal elimination and as a result, decreases plasma concentrations of these drugs, which causes unsuccesful treatment [6, 19, 20].

Fojo et al. have reported that the MDR1 gene is overexpressed in many cancers arising from some tissues in which the MDR1 gene is expressed at high levels. Most of these cancers are resistant to chemotherapy, and the MDR1 gene plays an important role in intrinsic and acquired chemoresistance [8, 21]. Approximately 40% of OCs after chemotherapy produce P-gp at high level, suggesting chemoresistance in OCs may be most likely acquired [8, 22]. However, some OC cases before chemotherapy are intrinsically multidrug resistant, which can be determined by MDR1 gene expression, and this phenotype should be taken into account for effective chemotherapy of ovarian epithelial carcinomas [8]. It has been revealed that the overexpression of P-gp in aggressive OC cells is associated with the development of resistance to paclitaxel treatment [10, 11, 15]. In contrast, downregulation of P-gp increases the effectiveness of certain chemotherapeutic agents. For example, myricetin (a dietary-flavonoid) enhances the chemotherapeutic potential of paclitaxel in OC cells by downregulating P-gp and inhibits the migratory properties of OC cells [10]. Alike, microRNAs (miRNA), which are endogenous, noncoding RNAs may regulate the ABCB1 gene. Recently, Sun et al. have demonstrated that miR-186 overexpression may sensitize OC cells to paclitaxel and cisplatin by downregulating P-gp in the OC cell lines [9]. Another study has demonstrated that miR-21 may regulate the production of MDR1/P-gp, by targeting hypoxia-inducible factor-1α (HIF-1α, ) which influences the development of drug resistance in paclitaxel-resistant OC A2780/taxol cell lines. Furthermore, the inhibition of miR-21 may sensitize A2780/taxol cells to paclitaxel [12]. Aditionally, upregulation of miR-27a expression results in inhibition of P-gp expression and decreases paclitaxel-resistance in OC cell line [15].

As the expression of P-gp in cancer cells usually results in multidrug resistance (MDR) to chemotherapeutic drugs, which is the main cause of chemotherapy failure in cancer treatment, it is important to develop new treatment strategies, which target P-gp [11]. Some MDR reversal agents that inhibit the drug efflux activity of P-gp could increase the intracellular drug levels [11]. It has been demonstrated that MDR1 expression levels after promethazine (an antihistaminic agent) administration is significantly reduced and verapamil (a calcium channel antagonist) leads to a significant decrease in MDR1 mRNA levels and downregulates P-gp activity [23].

The role of midkine in chemoresistance to paclitaxel /cisplatin in ovarian cancer

Midkine (MK), a heparin-binding growth factor, was firstly found to be the product of a retinoic acid-responsive gene during embryogenesis [24, 25]. Despite its high expression during embryogenesis, MK is downregulated to neglible levels in healthy adults and only re-expressed in some pathological processes [16, 25, 26]. MK promotes many cellular functions including survival, growth, migration, reproduction and repair, and gene expression while inhibiting apoptosis [27]. Due to its multiple functions, MK has significant impact on the pathogenesis of neurological, cardiovascular and inflammatory diseases and malignancies [19, 25]. It induces several signal transduction pathways including phosphoinositide 3-kinase (PI3K) and extracellular signal-regulated kinase (ERK), therefore participates in the regulation of diverse biological processes. Recent studies showed that MK expression is influenced by hypoxia, growth factors, and cytokines through a nuclear factor-κB (NF-κB) dependent pathway. The precise regulatory mechanisms behind MK expression is not fully understood [25, 28, 29]. MK plays significant roles as a growth factor during carcinogenesis, such as transformation, fibrinolysis, cell invasiveness, cell survival, anti-apoptosis, and angiogenesis processes [24, 27, 29–33].

It has been shown that MK is overexpressed in various human malignancies, including oral, lung, thyroid, bladder, prostate, cervical and OCs [18, 25, 35–37]. MK is also a plasma-secreted protein, and its levels in blood may increase in patients with malignant diseases [25]. Nakanish et al. have demonstrated that the expression of MK in germ cell ovarian tumors is significantly lower than in epithelial ovarian tumors, and expression in malignant epithelial tumors is significantly higher than in benign ones [18]. MK not only induces carcinogenesis but also contributes to chemoresistance [34]. It is considered that MK-induced chemoresistance is mainly due to inhibitory impact on apoptosis mediated by the Janus-activated kinases (JAKs) and STAT1 by activating the Akt-mediated survival pathway and senescence of tumor cells [19, 31]. On the other hand, it appears that some of the mechanisms of its chemoresistance actions are partially similar to those of P-gp [19].

MK, has been verified overexpressed in many cancers, including OC. It has been shown that MK is increased in the serum of patients with epithelial OC. MK may also be an indicator of the response to paclitaxel and/or cisplatin in the clinical treatment of OC [3, 16–18]. Zhang et al. have demonstrated that cancer-associated fibroblasts (CAFs) in the tumour microenvironment (TME) may lead to the high level of MK in tumours and that CAF-derived MK can induce cisplatin resistance via inhibition of the cell apoptosis in the TME by increasing production of lncRNA ANRIL. CAF-derived MK increases lncRNA ANRIL expression in tumour cells and thus promoting the up-regulation of ABC family proteins, multidrug resistance-associated protein 1 (MRP1) and ABCC2, which ultimately cause resistance to cisplatin. These findings related to the source of MK in tumour tissues, may serve as a novel therapeutic approach for cancer [34]. Further evidence is that a novel midkine inhibitor (iMK) has antitumor effect against oral squamous cell carcinoma and it has been demonstrated that iMK inhibits the expression of MK and suggested that iMK can be effectively used for the treatment of oral squamous cell carcinoma [19, 25, 38].

On the contrary, Wu et al. have suggested that the MK expression has a positive correlation with the predicted survival time and chemosensitivity of OC to paclitaxel/cisplatin. This study proposed that MK could down-regulate the expression of multidrug resistance-associated protein 3 (MRP3), and in turn increases the cytotoxicity of paclitaxel and/or cisplatin [3]. Despite this contrary opinion, it is generally considered that MK increases chemoresistance and decreases effective treatment during chemotherapy. On the other hand, due to its biological significance in carcinogenesis, it is suggested that MK can be regarded as a candidate molecular target for therapy against human carcinomas [25].

Conclusion

Chemoresistance is one of the important factors leading to high mortality in OC. At present paclitaxel and cisplatin are the most used drugs to treat OC. However, numerous patients with OC frequently relapse following the development of chemoresistance to chemotherapeutic agents, including paclitaxel and cisplatin. Overexpression of P-gp and MK have important impacts on chemoresistance in many cancer types, including OCs. Therefore, inhibition of both P-gp and MK may overcome chemoresistance in OCs. However, whether they act synergistically or in contrary remains unclear and further investigations are needed to clarify the interplay of these proteins in cancer cells and in the treatment of malignancies.

References

  1. Konstantinopoulos PA, Matulonis UA. Current status and evolution of preclinical drug development models of epithelial ovarian cancer. Front Oncol.2013; 3: 296.
  2. Rajanbabu A, Kuriakose S, Ahmad SZ, Khadakban T, Khadakban D, Venkatesan R, Vijaykumar DK. Evolution of surgery in advanced epithelial ovarian cancer in a dedicated gynaecologic oncology unit-seven year audit from a tertiary care centre in a developing country. Ecancermedicalscience. 2014; 8: 422.
  3. Wu X, Zhi X, Ji M, Wang Q, Li Y, Xie J, Zhao S. Midkine as a potential diagnostic marker in epithelial ovarian cancer for cisplatin/paclitaxel combination clinical therapy. Am J Cancer Res. 2015; 5(2): 629–38
  4. Romero-Laorden N, Olmos D, Fehm T, Garcia-Donas J, Diaz-Padilla I. Circulating and disseminated tumor cells in ovarian cancer: a systematic review. Gynecol Oncol. 2014; 133(3): 632–9.
  5. Musrap N, Diamandis EP. Revisiting the complexity of the ovarian cancer microenvironment-clinical implications for treatment strategies. Mol Cancer Res. 2012; 10(10): 1254–64.
  6. Norouzi-Barough L, Sarookhani M, Salehi R, Sharifi M, Moghbelinejad S.CRISPR/Cas9, a new approach to successful knockdown of ABCB1/P-glycoprotein and reversal of chemosensitivity in human epithelial ovarian cancer cell line. Iran J Basic Med Sci. 2018; 21(2): 181- 187.
  7. Bast RC Jr. Early detection of ovarian cancer: new technologies in pursuit of a disease that is neither common nor rare. Trans Am Clin Climatol Assoc.2004; 115: 233–47.
  8. Arao S, Suwa H, Mandai M, Tashiro H, Miyazaki K, Okamura H, Nomura H, Hiai H, Fukumoto M. Expression of multidrug resistance gene and localization of P-glycoprotein in human primary ovarian cancer. Cancer Res. 1994; 54(5): 1355–9.
  9. Sun KX, Jiao JW, Chen S, Liu BL, Zhao Y (2015) MicroRNA-186 induces sensitivity of ovarian cancer cells to paclitaxel and cisplatin by targeting ABCB1. J Ovarian Res 8: 80. [crossref]
  10. Zheng AW, Chen YQ, Zhao LQ, Feng JG. Myricetin induces apoptosis and enhances chemosensitivity in ovarian cancer cells. Oncol Lett. 2017; 13(6): 4974–78.
  11. Wang B, Li S, Meng X, Shang H and Guan Y: Inhibition of mdr1 by G-quadruplexoligonucleotides and reversal of paclitaxel resistance in human ovarian cancer cells. Tumour Biol. 2015; 36: 6433–6443.
  12. Xie Z, Cao L, Zhang J. miR-21 modulates paclitaxel sensitivity and hypoxia-inducible factor-1a expression in human ovarian cancer cells. Oncol Lett. 2013; 6(3): 795–800.
  13. Gottesman MM, Ling V. The molecular basis of multidrug resistance in cancer: the early years of P-glycoprotein research. FEBS Lett. 2006; 580(4): 998–1009.
  14. Binkhathlan Z, Lavasanifar A. P-glycoprotein inhibition as a therapeutic approach for overcoming multidrug resistance in cancer: current status and future perspectives. Curr Cancer Drug Targets. 2013; 13(3): 326–46.
  15. Zhang H, Wang J, Cai K, Jiang L, Zhou D, Yang C, Chen J, Chen D, Dou J. Downregulation of gene MDR1 by shRNA to reverse multidrug-resistance of Ovarian cancer A2780 cells. J Cancer Res Ther. 2012; 8(2): 226–31.
  16. Jones DR (2014) Measuring midkine: the utility of midkine as a biomarker in cancer and other diseases. Br J Pharmacol 171: 2925–2939. [crossref]
  17. Rice GE, Edgell TA, Autelitano DJ (2010) Evaluation of midkine and anterior gradient 2 in a multimarker panel for the detection of ovarian cancer. J Exp Clin Cancer Res 29: 62. [crossref]
  18. Nakanishi T, Kadomatsu K, Okamoto T, Tomoda Y, Muramatsu T (1997) Expression of midkine and pleiotropin in ovarian tumors. Obstet Gynecol 90: 285–290. [crossref]
  19. Aynacioglu AS, Bilir A, Kadomatsu K. Dual inhibition of P-glycoprotein and midkine may increase therapeutic effects of anticancer drugs. Med Hypotheses. 2017; 107: 26–28.
  20. Wolking S, Schaeffeler E, Lerche H, Schwab M, Nies AT. Impact of Genetic Polymorphisms of ABCB1 (MDR1, P-Glycoprotein) on Drug Disposition and Potential Clinical Implications: Update of the Literature. Clin Pharmacokinet. 2015; 54(7): 709–35.
  21. Fojo AT, Ueda K, Slamon DJ, Poplack DG, Gottesman MM, et al. (1987) Expression of a multidrug-resistance gene in human tumors and tissues. Proc Natl Acad Sci U S A 84: 265–269. [crossref]
  22. Bell DR, Gerlach JH, Kartner N, Buick RN, Ling V. Detection of P-glycoprotein in ovarian cancer: a molecular marker associated with multidrug resistance. Clin Oncol. 1985; 3(3): 311–5.
  23. Dönmez Y, Akhmetova L, Iseri ÖD, Kars MD, Gündüz U. Effect of MDR modulators verapamil and promethazine on gene expression levels of MDR1 and MRP1 in doxorubicin-resistant MCF-7 cells. Cancer Chemother Pharmacol. 2011; 67(4): 823–8.
  24. Kadomatsu K, Huang RP, Suganuma T, Murata F, Muramatsu T. A retinoic acid responsive gene MK found in the teratocarcinoma system is expressed in spatially and temporally controlled manner during mouse embryogenesis. J Cell Biol. 1990; 110(3): 607–16.
  25. Jono H, Ando Y (2010) Midkine: a novel prognostic biomarker for cancer. Cancers (Basel) 2: 624–641. [crossref]
  26. Matsubara S, Tomomura M, Kadomatsu K, Muramatsu T. Structure of a retinoic acid-responsive gene, MK, which is transiently activated during the differentiation of embryonal carcinoma cells and the mid-gestation period of mouse embryogenesis. J Biol Chem. 1990; 265(16): 9441–3.
  27. Muramatsu T (2014) Structure and function of midkine as the basis of its pharmacological effects. Br J Pharmacol 171: 814–826. [crossref]
  28. Owada K, Sanjo N, Kobayashi T, Mizusawa H, Muramatsu H, Muramatsu T, Michikawa M. Midkine inhibits caspase-dependent apoptosis via the activation of mitogen-activated protein kinase and phosphatidylinositol 3-kinase in cultured neurons.J Neurochem. 1999; 73(5): 2084–92.
  29. You Z, Dong Y, Kong X, Beckett LA, Gandour-Edwards R, et al. (2008) Midkine is a NF-kappaB-inducible gene that supports prostate cancer cell survival. BMC Med Genomics 1: 6. [crossref]
  30. Kojima S, Muramatsu H, Amanuma H, Muramatsu T. Midkine enhances fibrinolytic activity of bovine endothelial cells. J Biol Chem. 1995; 270(16): 9590–6.
  31. Ratovitski EA, Kotzbauer PT, Milbrandt J, Lowenstein CJ, Burrow CR. Midkine induces tumor cell proliferation and binds to a high affinity signaling receptor associated with JAK tyrosine kinases. J Biol Chem. 1998; 273(6): 3654–60.
  32. Huang Y, Hoque MO, Wu F, Trink B, Sidransky D, Ratovitski EA. Midkine induces epithelial-mesenchymal transition through Notch2/Jak2-Stat3 signaling in human keratinocytes. Cell Cycle. 2008; 7(11): 1613–22.
  33. Huang Y, Sook-Kim M, Ratovitski E. Midkine promotes tetraspanin-integrin interaction and induces FAK-Stat1alpha pathway contributing to migration/invasiveness of human head and neck squamous cell carcinoma cells. Biochem Biophys Res Commun. 2008; 377(2): 474–478.
  34. Zhang D, Ding L, Li Y, Ren J, Shi G, Wang Y, Zhao S, Ni Y, Hou Y. Midkine derived from cancer-associated fibroblasts promotes cisplatin-resistance via up-regulation of the expression of lncRNA ANRIL in tumour cells. Sci Rep. 2017; 7(1): 16231
  35. Ruan M, Ji T, Wu Z, Zhou J, Zhang C (2007) Evaluation of expression of midkine in oral squamous cell carcinoma and its correlation with tumour angiogenesis. Int J Oral Maxillofac Surg 36: 159–164.
  36. Aridome K, Tsutsui J, Takao S, Kadomatsu K, Ozawa M, Aikou T, Muramatsu T. Increased midkine gene expression in human gastrointestinal cancers. Jpn J Cancer Res. 1995; 86(7): 655–61. [crossref]
  37. Kato M, Shinozawa T, Kato S, Endo K, Terada T. Increased midkine expression in intrahepatic cholangiocarcinoma: immunohistochemical and in situ hybridization analyses. Liver. 2000; 20(3): 216–21.
  38. Masui M, Okui T, Shimo T, Takabatake K, Fukazawa T, Matsumoto K, Kurio N, Ibaragi S, Naomoto Y, Nagatsuka H, Sasaki A. Novel Midkine Inhibitor iMDK Inhibits Tumor Growth and Angiogenesis in Oral Squamous Cell Carcinoma. Anticancer Res. 2016; 36(6): 2775–81.
  39. Shen Y, Zhang XY, Chen X, Fan LL, Ren ML, Wu YP, Chanda K, Jiang SW. Synthetic paclitaxel- octreotide conjugate reverses the resistance of paclitaxel in A2780/Taxol ovarian cancer cell line. Oncol Rep. 2017; 37(1): 219–226.
  40. Gillet JP, Gottesman MM (2010) Mechanisms of multidrug resistance in cancer. Methods Mol Biol 596: 47–76. [crossref]
  41. Pan ST, Li ZL, He ZX, Qiu JX, et al. (2016) Molecular mechanisms for tumour resistance to chemotherapy. Clin Exp Pharmacol Physiol 43: 723–737. [crossref]

Providing Sand Rats (Psammomys Obesus) Environmental Enrichment is not Inhibiting their Diabetes Development and Use as an Animal Model for Human Diet Induced Type 2 Diabetes

DOI: 10.31038/IJVB.2018232

Abstract

The gerbil, Psammomys obesus, commonly known as the fat sand rat, is a well-defined animal model for human type 2 diabetes (T2D). Captive housed fat sand rats often develop serious digging- and gnawing stereotypies but historically, little has been done to improve the housing conditions for the animals by providing environmental enrichment and thereby minimizing or eliminating this unwanted behaviour. Although not scientifically proven, it is generally believed that providing environmental enrichment might inhibit the development of diabetes in the fat sand rats, mainly due to raised activity levels.

This study compared the development of T2D in fat sand rats housed in standard housing conditions and sand rats housed in various enriched environments. The study included 51 fat sand rats in five groups, of which one group acted as the control. The remaining four groups were housed in four different enriched environments for 37 days; including various combinations of provided mazes/burrows, nuts, seeds, maize and barley plus access to salt water. No significant differences were found in the development of diabetes in the five groups. It is concluded that provision of the tested environmental enrichment has no effect on the development of T2D in Psammomys obesus, and hence there are no reasons for not providing captive housed fat sand rats with species-specific environmental enrichment like the tested items to fulfil their natural needs and enhance their welfare.

Introduction

Psammomys obesus, the fat sand rat, of the genus Psammomys, which also often is referred to as the desert sand rat [1], the Israeli sand rat [2] or simply the sand rat [3–5] has since the 1960s been used as an animal model for diet induced T2D [6]. In the sand rat’s natural habitat – the arid regions of North Africa and Eastern Mediterranean – the animals mainly feed on succulent leaves that are relatively low in energy and high in water and electrolytes [7]. Sand rats living in this habitat are lean and normoglycemic and do not naturally develop T2D. However, when fed a regular or high energy laboratory rodent diet in captivity, the animals gain weight and develop insulin resistance, hyperinsulinemia and eventually hyperglycaemia. As the disease development progresses, the sand rats lose their functional pancreatic beta cell mass and become hypoinsulinemic eventually leading to death if insulin therapy is not initiated. This is very similar to the T2D development seen in humans [8–12]. In the early 1970s, sand rats were caught in the wild in the desert areas north of the Dead Sea in Israel. A breeding colony was then successfully established at the Hebrew University Hadassah Medical School, Israel [13]. In captivity, the colony developed four distinct phenotypes; 32% of the animals were normoglycemic and normoinsulinemic, 26% were moderately obese, normoglycemic and hyperinsulinemic, 36% were hyperglycaemic and hyperinsulinemic, and about 6% developed hypoinsulinemia and hyperglycaemia with weight loss and ketosis [14, 15]. These different phenotypes led to the establishment of two distinct breeding lines: A diabetes prone (DP) line, in which more than 70% of the animals develop T2D and a diabetes resistant (DR) line in which 60–70% of the animals remain normoglycemic despite intake of a high calorie diet [16]. Heled et al [17] have documented that exercise training in sand rats could prevent or postpone the progression of T2D.

It is generally believed that environmental enrichment for laboratory animals will increase activity associated with exploring and manipulating inanimate enrichment items [18], and hence it could be a concern, that enriching the environment of the sand rat would inhibit or delay the development of T2D due to raised activity levels. Accordingly, very little has historically been done to improve the housing conditions. Even though sand rats, being gerbils, differ notably from mice and rats in their way of living e.g. in being great diggers and building extensive tunnel systems with several entrances leading to different foraging sites and spending only 2–3 hours above ground every day [25], sand rats are traditionally housed in the same way as laboratory rats.

The present study aimed at investigating if sand rats can be housed under environmentally enriched conditions without there being an effect on the development and onset of T2D.

Material And Methods

Animals

For this study, a total of 98 diabetes prone (DP) sand rats (49 males and 49 females) (Psammomys obesus), aged nine weeks on arrival, were used. All animals originated from the same commercial breeding colony (Harlan, Jerusalem, Israel) which twice a year is health monitored based on the recommendations of the FELASA Working Group on Health Monitoring of Rodent and Rabbit Colonies (FELASA 2002). The breeding colony is historically and by the use of mice and rat sentinels tested positive for Pneumonia Virus of Mice (PVM) and Helicobacter spp. only. On arrival, the animals were micro chipped, randomly assigned to single-sex groups with two or three animals per cage and acclimatized for two weeks on a low-energy diet (LE) (3084 Teklad Low Energy Sand Rat Diet, Harlan, Jerusalem, Israel) with 2.4 cal/g of total digestible energy and consisting of 70% carbohydrate, 3.1% fat, 16.7% protein, and 10.2% ash in the form of hard-pressed pellets. On this diet, the sand rats maintain a non-fasting blood glucose (BG) level of 4–6 mmol/L. The study consisted of two parts; a pre-study and the main study on the effect of enrichment (the enrichment study). After two weeks of acclimatisation, the pre-study, lasting 10 days, was done to identify diabetes prone animals (DP) to be used in the enrichment study. After the selection of DP animals, a two-week period for normalisation of blood glucose was initiated prior to the enrichment study, which lasted 37 days.

Housing

The sand rats were housed in yellow, semi-transparent type IV macrolon cages (Scanbur A/S, Karlslunde, Denmark) throughout the study. For details on environmental enrichment please refer to Table 1. All cages had two water bottles. Citric acid was added to the drinking water in a 0.4% solution (pH 2–3) to prevent bacterial growth. All cages were changed once a week. When the animals became diabetic and developed polyuria, cages were changed more frequently. The animals were housed in an animal room with a 12 hour light-dark cycle providing light from 6: 00 to 18: 00. The temperature was
22–25oC, and the humidity 30–70% (norm. 45–65%). The animals had free access to food and water. All animals were observed and cared for by experienced animal caretakers at least once daily and all animals included in the study were weighed twice a week. At the end of the study, all animals were euthanized using a gradually filled 85% CO2 / 15% O2 chamber. Throughout the study, all animals were housed and cared according to current Danish and European legislation and guidelines, and the actual study was both approved by the Danish Animal Experiments Inspectorate and the Novo Nordisk Ethical Review Committee (ERC).

Table 1. Housing of the sand rats prior to study start (SH = standard housing) and during the study.

Study

SH

G1

G2

G3

G4

G5

N

51

11

10

10

10

10

Yellow semi-transparent type IV macrolon cage (595 x 380 x 200 mm; floor area 1820 cm²) (Scanbur A/S, Karlslunde, Denmark)

X

X

X

X

X

X

Standard lid (total cage height 25 cm)

X

X

X

X

X

X

3 cm layer of aspen bedding (Tapvei, Kortteinen, Finland) or enough to cover maze/burrow

X

X

X

X

X

X

Paper based nesting material “EnviroDri” (Lillico, Surrey, UK) and two aspen biting sticks, size medium (Tapvei, Kortteinen, Finland).

These sticks followed the animals, when the cages were changed

X

X

X

X

X

X

Food enrichment*

X

X

X

X

Saltwater (3% saline/sea salt)

X

X

X

Novo Nordisk shelter

X

X

X

X

Plastic maze/burrow

X

Metal maze/burrow

X

N = number of animals. G1 = Group 1 (control), G2 = enrichment group 2,
G3 = enrichment group 3 etc. *Food enrichment = peanuts and hazelnuts with shells, sunflower seeds, maize and barley.

Blood sampling

Blood samples for determination of whole BG and HbA1C levels in both the pre-study and the enrichment study were drawn from the tip of the tail of non-sedated animals, using an “Assistant” blood lancet (Bie & Berntsen, Rødovre, Denmark). Samples for measurement of BG were collected in 10 μl glass Na-heparinized capillary tubes (Vitrex, Herlev, Denmark), immediately suspended in 500 μl Biosen analysis buffer (EKF Diagnostics, Cardiff, UK) and analysed for BG concentration expressed as mmol/L. Blood samples for HbA1Cwere transferred to a freezer (-20oC) until analysis on a Hitachi 912 (Roche HbA1cII; Tina-quant Hemoglobin A1c II, Roche/Hitachi 912, Mannheim, Germany) and expressed as percentage glycated haemoglobin of the total haemoglobin.

Pre-study

After two weeks of acclimatization, all animals were transferred for 10 days to a high energy diet (HE) (Purina LabDiet 5008, Brogaarden, Gentofte, Denmark) with 3.1 cal/g of total digestible energy and consisting of 66.6% carbohydrate, 2.1% fat, 22.4% protein, and 6.9% ash. BG was measured on days 0, 3, 6, 7, 8, 9 and 10. Animals that developed BG levels above 10 mmol/L for two consecutive days during the 10-day period were classified as diabetes prone (DP) and included in the study (19 DP females and 32 DP males). Animals with BG levels below10 mmol/L were classified as diabetes resistant (DR) and were not included in the study. If a DP animal was pair housed with a DR animal, the DR animal remained in the cage as a companion animal for animal welfare reasons. For this study, 9 females and 8 males were kept as companions for a DP cage mate. If both pair housed animals were DR, they were excluded from the study and used for other purposes. The study animals were after selection transferred back to the LE diet for two weeks to lower their BG to normal levels before start of the actual study.

Enrichment study

The animals were housed in one of five environments (Table 1) for 37 days and fed HE diet. BG was measured on day 0 and twice per week in the morning thereafter (a total of 12 samples). Samples for HbA1C were drawn on day 0 and once a week (a total of 6 samples) thereafter. All the blood samples were taken at the same time point, early in the morning, from overnight fed animals. A variety of enrichment items were used in the four enrichment groups (Table 1). The used shelter was a small hideout used as standard enrichment for rats at Novo Nordisk (Mikkelsen 2010). A multi-entranced labyrinth-like tunnel-house was designed and fabricated (“the maze/burrow”; Novo Nordisk, Maaloev, Denmark). Two different types were used; one produced in stainless steel (Group 4) and one produced in non-transparent plastic (Group 5) (Figure 1). A 3% saltwater (sodium chloride; ATLANTIS sea salt from Portugal) solution was provided as enrichment in groups 3, 4 and 5.

IJVB2018-113-LarsDenmark_F1

Figure 1. The non-transparent plastic maze/borrow.

To satisfy the animal’s need for gnawing and searching for food, several food items commonly used as enrichment for other species of rodents were used. Those selected were peanuts and hazelnuts with shells, sunflower seeds, maize and barley (all from Brogaarden, Gentofte, Denmark). All were given once daily in a very limited amount to all enrichment groups (groups 2, 3, 4 and 5).

Data

Data was analysed with PASW Statistics 18, 2009 (SPSS Inc., Chicago, Illinois, USA) and graphs made with Graph Pad Prism version 5.00 for Windows (Graph Pad Software, San Diego, California, USA).

The data sets were continuous and found to be normally distributed, hence the differences between the groups were analysed using the one-way analysis of variance. Dichotomous data (e.g. the number of animals developing diabetes or not) were analysed using the Chi-square test. A two-sided 5% level of significance was used in all the analysis.

Results

The five groups did not differ with respect to either HbA1C (p=0.28) or BG levels (p=0.87) at the start of the study (Table 2). The changes in measured variables over time did not differ significantly between the groups either with respect to HbA1C (p=0.40) or BG levels (p=0.83) (Table 2). In total, 38 out of 51 (75%) sand rats developed T2D (defined as a BG reading above 10 mmol/L on two consecutive days) which is in accordance with our previous experiences where 60 to 85% of the animals develop diabetes. Furthermore, the percentage of sand rats developing T2D did not differ between groups (p=0.16). However, the fact that not all sand rats developed diabetes resulted in a rather large standard deviation in glycaemic levels.

Table 2. mean (+/- standard deviation) blood glucose (mmol/l) and HbA1C (% of total hemoglobin) values on day 0 and day 37 (start and end of study).

Blood Glucose mmol/L

HbA1C (% )

Day 0

Day 37

Day 0

Day 37

Group 1 (control)

7.4 (+/- 4.5)

18.4 (+/- 10.8)

5.3 (+/- 0.5 )

7.7 (+/- 0.7)

Group 2

7.5 (+/- 4.8)

18.0 (+/- 10.0)

5.2 (+/- 0.9 )

7.7 (+/- 1.9)

Group 3

8.7 (+/- 4.4)

16.6 (+/- 4.5)

5.0 (+/- 0.6 )

8.0 (+/- 0.9)

Group 4

7.3 (+/- 4.0)

15.5 (+/- 9.2)

5.1 (+/- 0.5 )

8.0 (+/- 1.6 )

Group 5

5.0 (+/- 3.2)

14.2 (+/- 8.7)

4.8 (+/- 0.5 )

6.6 (+/- 1.3 )

P = 0.87

P = 0.83

P = 0.28

P = 0.40

Discussion

This study has demonstrated that is possible to provide environmental enrichment to sand rats without having significant effects on the development of T2D. The four test-groups were enriched in four different ways and none of the groups showed any significant difference in either BG levels or HbA1C, as compared to the control group.

Housing systems containing items used by the animals to satisfy species-specific basic needs contribute to improved animal welfare [19]. Even though not quantified, it was observed that the animals used the maze/burrow, when provided; they would dig under it and they would arrange their shelters in it (Figure 2) and they seemed to have a lower level of stereotypies (personal observations). Hence the constructed maze/burrow seemed to be a valuable enrichment item in the cage with a positive effect on the animals’ welfare. The animal caretakers preferred the plastic maze/burrow, as it was easier to handle than the stainless-steel maze/burrow. The 3% saltwater solution as drinking water seemed to be preferred by the sand rats, especially in the beginning of the study. As the animals became diabetic they seemed to increase their intake of normal water (personal observations). Sand rats may show adrenal pathology and increased mortality, when not given extra sodium chloride [20, 21] and hence this supply may be valuable for the health of the animals. Further studies could establish the need as well as the preference for sodium chloride water compared to fresh water in sand rats. The sand rats ate the sunflower seeds, the maize and the barley. However, the hazelnuts with shells did not seem to be highly valued by the sand rats [21–25].

IJVB2018-113-LarsDenmark_F2

Conclusion

As there were no significant differences in the development of diabetes, there are no reasons to withhold species-specific environmental enrichments, like the items tested in this study, for fat sand rats. Based on the results and observations made in this study, a plastic maze/burrow, a 3% salt water solution and sunflower seeds, maize and barley would be excellent choices for adding environmental complexity to the cages of sand rats, allowing the sand rats to express natural behaviours such as exploration and foraging, thereby increasing the welfare of the fat sand rat.

References

  1. Ziran BH, Pineda S, Pokharna H, Esteki A, Mansour JM, Moskowitz RW (1994) Biomechanical, radiologic, and histopathologic correlations in the pathogenesis of experimental intervertebral disc disease. Spine 19: 2159–2163.
  2. Collier G, Walder K, De Silva A, Tenne-Brown J, Sanigorski A, et al. (2002) New approaches to gene discovery with animal models of obesity and diabetes: Lipids and Insulin Resistance: the Role of Fatty Acid Metabolism and Fuel Partitioning. Annals of the New York Academy of Sciences 967: 403–413.
  3. Borenshtein D, Ofri R, Werman M, Stark A, Tritschler HJ, et al. (2001) Cataract development in diabetic sand rats treated with alpha-lipoic acid and its gamma-linolenic acid conjugate. Diabetes Metab Res Rev 17: 44–50. [crossref]
  4. Gruber HE, Johnson T, Norton HJ, Hanley EN (2002) The sand rat model for disc degeneration: Radiologic characterization of age-related changes – Cross-sectional and prospective analyses. Spine 27: 230–234.
  5. Shafrir E (1996) Development and consequences of insulin resistance: Lessons from animals with hyperinsulinaemia. Diabetes & Metabolism 22: 122–131.
  6. Fine J, Quimby FW, Greenhouse DD (1986) Annotated bibliography on uncommonly used laboratory animals: Mammals. ILAR NEWS 29: 1A-38A.
  7. Daly M, Daly S (1975) Behavior of Psammomys Obesus (Rodentia: Gerbillinae) in the Algerian Sahara. Zietschrift fur Tierpsychologie 37: 298–321.
  8. Kaiser N, Cerasi E, Leibowitz G (2012) Diet-Induced Diabetes in the Sand Rat (Psammomys obesus). Animal Models in Diabetes Research, Methods in Molecular Biology. 933, 89–102.
  9. Donath MY, Gross DJ, Cerasi E, Kaiser N (1999) Hyperglycemia-induced beta-cell apoptosis in pancreatic islets of Psammomys obesus during development of diabetes. Diabetes 48: 738–744.
  10. Barnett M, Collier GR, Collier F, McL, Zimmet P, O´Dea K (1994) A cross-sectional and short-term longitudinal characterisation of NIDDM in Psammomys obesus. Diabetologia 37: 671–676.
  11. Hackel DB, Mikat E, Lebovitz HE, Schmidt-Nielsen K, Horton ES, Kinney TD (1967) The sand rat (Psammomys Obesus) as an experimental animal in studies of diabetes mellitus. Diabetologia 3: 130–134.
  12. Schmidt-Nielsen K, Haines Hb, Hackel Db (1964) Diabetes Mellitus In The Sand Rat Induced By Standard Laboratory Diets. Science 143: 689–690. [crossref]
  13. Shafrir E, Ziv E, Kalman R (2006) Nutritionally induced diabetes in desert rodents as models of type 2 diabetes: Acomys cahirinus (spiny mice) and Psammomys obesus (desert gerbil). Ilar Journal 47: 212–224.
  14. Shafrir E, Gutman A (1993) Psammomys obesus of the Jerusalem colony: A model for nutritionally induced, non-insulin-dependent diabetes. Journal of Basic & Clinical Physiology & Pharmacology 4: 83–99.
  15. Kalderon B, Gutman A, Levy E, Shafrir E, Adler JH (1986) Characterization of stages in development of obesity-diabetes syndrome in sand rat (Psammomys obesus). Diabetes 35: 717–724. [crossref]
  16. Kaiser N, Nesher R, Donath MY, Fraenkel M, Behar V, et al. (2005) Psammomys obesus, a model for environment-gene interactions in type 2 diabetes. Diabetes 54 Suppl 2: S137–144. [crossref]
  17. Heled Y, Shapiro Y, Shani Y, Moran DS, Langzam L, et al. (2002) Physical exercise prevents the development of type 2 diabetes mellitus in Psammomys obesus. Am J Physiol Endocrinol Metab 282: E370-E375.
  18. Bayne K (2005) Potential for Unintended Consequences of Environmental Enrichment for Laboratory Animals and Research Results. ILAR 46: 129–139.
  19. Ottesen JL, Weber A, Gürtler H, Mikkelsen LF (2004) new housing conditions: improving the welfare of experimental animals. Altern Lab Anim 32 Suppl 1B: 397–404. [crossref]
  20. Abdallah A, Tawfik J (1971) Effects of sodium chloride on the water consumption of sand rats (Psammomys obesus). Z Versuchstierkd 13: 150–157. [crossref]
  21. Frenkel G, Shaham Y, Kraicer PF (1972) Establishment of conditions for colony-breeding of the sand-rat Psammomys obesus. Lab Anim Sci 22: 40–47. [crossref]
  22. Nicklas W, Baneux P, Boot R, Decelle T, Deeny AA, et al. (2002) Recommendations for the health monitoring of rodent and rabbit colonies in breeding and experimental units. Lab Anim 36: 20–42. [crossref]
  23. Kalman R, Ziv E, Shafrir E, Bar-On H, Perez R (2001) Psammomys obesus and the albino rat – two different models of nutritional insulin resistance, representing two different types of human populations. Laboratory Animals 35: 346–352.
  24. Mikkelsen LF, Sørensen DB, Krohn T, Dragsted N, Hansen AK, Ottesen JL (2010) Clinical pathology and cardiovascular parameters are not influenced by housing rats under increased environmental complexity. Animal Welfare 19: 449–460.
  25. Sørensen DB, Krohn T, Hansen HN, Ottesen JL, Hansen AK (2005) An ethological approach to housing requirements of golden hamsters, Mongolian gerbils and fat sand rats in the laboratory – A review. Applied Animal Behaviour Science 94: 181–195.