Abstract
The gerbil, Psammomys obesus, commonly known as the fat sand rat, is a well-defined animal model for human type 2 diabetes (T2D). Captive housed fat sand rats often develop serious digging- and gnawing stereotypies but historically, little has been done to improve the housing conditions for the animals by providing environmental enrichment and thereby minimizing or eliminating this unwanted behaviour. Although not scientifically proven, it is generally believed that providing environmental enrichment might inhibit the development of diabetes in the fat sand rats, mainly due to raised activity levels.
This study compared the development of T2D in fat sand rats housed in standard housing conditions and sand rats housed in various enriched environments. The study included 51 fat sand rats in five groups, of which one group acted as the control. The remaining four groups were housed in four different enriched environments for 37 days; including various combinations of provided mazes/burrows, nuts, seeds, maize and barley plus access to salt water. No significant differences were found in the development of diabetes in the five groups. It is concluded that provision of the tested environmental enrichment has no effect on the development of T2D in Psammomys obesus, and hence there are no reasons for not providing captive housed fat sand rats with species-specific environmental enrichment like the tested items to fulfil their natural needs and enhance their welfare.
Introduction
Psammomys obesus, the fat sand rat, of the genus Psammomys, which also often is referred to as the desert sand rat [1], the Israeli sand rat [2] or simply the sand rat [3–5] has since the 1960s been used as an animal model for diet induced T2D [6]. In the sand rat’s natural habitat – the arid regions of North Africa and Eastern Mediterranean – the animals mainly feed on succulent leaves that are relatively low in energy and high in water and electrolytes [7]. Sand rats living in this habitat are lean and normoglycemic and do not naturally develop T2D. However, when fed a regular or high energy laboratory rodent diet in captivity, the animals gain weight and develop insulin resistance, hyperinsulinemia and eventually hyperglycaemia. As the disease development progresses, the sand rats lose their functional pancreatic beta cell mass and become hypoinsulinemic eventually leading to death if insulin therapy is not initiated. This is very similar to the T2D development seen in humans [8–12]. In the early 1970s, sand rats were caught in the wild in the desert areas north of the Dead Sea in Israel. A breeding colony was then successfully established at the Hebrew University Hadassah Medical School, Israel [13]. In captivity, the colony developed four distinct phenotypes; 32% of the animals were normoglycemic and normoinsulinemic, 26% were moderately obese, normoglycemic and hyperinsulinemic, 36% were hyperglycaemic and hyperinsulinemic, and about 6% developed hypoinsulinemia and hyperglycaemia with weight loss and ketosis [14, 15]. These different phenotypes led to the establishment of two distinct breeding lines: A diabetes prone (DP) line, in which more than 70% of the animals develop T2D and a diabetes resistant (DR) line in which 60–70% of the animals remain normoglycemic despite intake of a high calorie diet [16]. Heled et al [17] have documented that exercise training in sand rats could prevent or postpone the progression of T2D.
It is generally believed that environmental enrichment for laboratory animals will increase activity associated with exploring and manipulating inanimate enrichment items [18], and hence it could be a concern, that enriching the environment of the sand rat would inhibit or delay the development of T2D due to raised activity levels. Accordingly, very little has historically been done to improve the housing conditions. Even though sand rats, being gerbils, differ notably from mice and rats in their way of living e.g. in being great diggers and building extensive tunnel systems with several entrances leading to different foraging sites and spending only 2–3 hours above ground every day [25], sand rats are traditionally housed in the same way as laboratory rats.
The present study aimed at investigating if sand rats can be housed under environmentally enriched conditions without there being an effect on the development and onset of T2D.
Material And Methods
Animals
For this study, a total of 98 diabetes prone (DP) sand rats (49 males and 49 females) (Psammomys obesus), aged nine weeks on arrival, were used. All animals originated from the same commercial breeding colony (Harlan, Jerusalem, Israel) which twice a year is health monitored based on the recommendations of the FELASA Working Group on Health Monitoring of Rodent and Rabbit Colonies (FELASA 2002). The breeding colony is historically and by the use of mice and rat sentinels tested positive for Pneumonia Virus of Mice (PVM) and Helicobacter spp. only. On arrival, the animals were micro chipped, randomly assigned to single-sex groups with two or three animals per cage and acclimatized for two weeks on a low-energy diet (LE) (3084 Teklad Low Energy Sand Rat Diet, Harlan, Jerusalem, Israel) with 2.4 cal/g of total digestible energy and consisting of 70% carbohydrate, 3.1% fat, 16.7% protein, and 10.2% ash in the form of hard-pressed pellets. On this diet, the sand rats maintain a non-fasting blood glucose (BG) level of 4–6 mmol/L. The study consisted of two parts; a pre-study and the main study on the effect of enrichment (the enrichment study). After two weeks of acclimatisation, the pre-study, lasting 10 days, was done to identify diabetes prone animals (DP) to be used in the enrichment study. After the selection of DP animals, a two-week period for normalisation of blood glucose was initiated prior to the enrichment study, which lasted 37 days.
Housing
The sand rats were housed in yellow, semi-transparent type IV macrolon cages (Scanbur A/S, Karlslunde, Denmark) throughout the study. For details on environmental enrichment please refer to Table 1. All cages had two water bottles. Citric acid was added to the drinking water in a 0.4% solution (pH 2–3) to prevent bacterial growth. All cages were changed once a week. When the animals became diabetic and developed polyuria, cages were changed more frequently. The animals were housed in an animal room with a 12 hour light-dark cycle providing light from 6: 00 to 18: 00. The temperature was
22–25oC, and the humidity 30–70% (norm. 45–65%). The animals had free access to food and water. All animals were observed and cared for by experienced animal caretakers at least once daily and all animals included in the study were weighed twice a week. At the end of the study, all animals were euthanized using a gradually filled 85% CO2 / 15% O2 chamber. Throughout the study, all animals were housed and cared according to current Danish and European legislation and guidelines, and the actual study was both approved by the Danish Animal Experiments Inspectorate and the Novo Nordisk Ethical Review Committee (ERC).
Table 1. Housing of the sand rats prior to study start (SH = standard housing) and during the study.
|
Study |
||||||
|
SH |
G1 |
G2 |
G3 |
G4 |
G5 |
|
|
N |
51 |
11 |
10 |
10 |
10 |
10 |
|
Yellow semi-transparent type IV macrolon cage (595 x 380 x 200 mm; floor area 1820 cm²) (Scanbur A/S, Karlslunde, Denmark) |
X |
X |
X |
X |
X |
X |
|
Standard lid (total cage height 25 cm) |
X |
X |
X |
X |
X |
X |
|
3 cm layer of aspen bedding (Tapvei, Kortteinen, Finland) or enough to cover maze/burrow |
X |
X |
X |
X |
X |
X |
|
Paper based nesting material “EnviroDri” (Lillico, Surrey, UK) and two aspen biting sticks, size medium (Tapvei, Kortteinen, Finland). These sticks followed the animals, when the cages were changed |
X |
X |
X |
X |
X |
X |
|
Food enrichment* |
X |
X |
X |
X |
||
|
Saltwater (3% saline/sea salt) |
X |
X |
X |
|||
|
Novo Nordisk shelter |
X |
X |
X |
X |
||
|
Plastic maze/burrow |
X |
|||||
|
Metal maze/burrow |
X |
|||||
N = number of animals. G1 = Group 1 (control), G2 = enrichment group 2,
G3 = enrichment group 3 etc. *Food enrichment = peanuts and hazelnuts with shells, sunflower seeds, maize and barley.
Blood sampling
Blood samples for determination of whole BG and HbA1C levels in both the pre-study and the enrichment study were drawn from the tip of the tail of non-sedated animals, using an “Assistant” blood lancet (Bie & Berntsen, Rødovre, Denmark). Samples for measurement of BG were collected in 10 μl glass Na-heparinized capillary tubes (Vitrex, Herlev, Denmark), immediately suspended in 500 μl Biosen analysis buffer (EKF Diagnostics, Cardiff, UK) and analysed for BG concentration expressed as mmol/L. Blood samples for HbA1Cwere transferred to a freezer (-20oC) until analysis on a Hitachi 912 (Roche HbA1cII; Tina-quant Hemoglobin A1c II, Roche/Hitachi 912, Mannheim, Germany) and expressed as percentage glycated haemoglobin of the total haemoglobin.
Pre-study
After two weeks of acclimatization, all animals were transferred for 10 days to a high energy diet (HE) (Purina LabDiet 5008, Brogaarden, Gentofte, Denmark) with 3.1 cal/g of total digestible energy and consisting of 66.6% carbohydrate, 2.1% fat, 22.4% protein, and 6.9% ash. BG was measured on days 0, 3, 6, 7, 8, 9 and 10. Animals that developed BG levels above 10 mmol/L for two consecutive days during the 10-day period were classified as diabetes prone (DP) and included in the study (19 DP females and 32 DP males). Animals with BG levels below10 mmol/L were classified as diabetes resistant (DR) and were not included in the study. If a DP animal was pair housed with a DR animal, the DR animal remained in the cage as a companion animal for animal welfare reasons. For this study, 9 females and 8 males were kept as companions for a DP cage mate. If both pair housed animals were DR, they were excluded from the study and used for other purposes. The study animals were after selection transferred back to the LE diet for two weeks to lower their BG to normal levels before start of the actual study.
Enrichment study
The animals were housed in one of five environments (Table 1) for 37 days and fed HE diet. BG was measured on day 0 and twice per week in the morning thereafter (a total of 12 samples). Samples for HbA1C were drawn on day 0 and once a week (a total of 6 samples) thereafter. All the blood samples were taken at the same time point, early in the morning, from overnight fed animals. A variety of enrichment items were used in the four enrichment groups (Table 1). The used shelter was a small hideout used as standard enrichment for rats at Novo Nordisk (Mikkelsen 2010). A multi-entranced labyrinth-like tunnel-house was designed and fabricated (“the maze/burrow”; Novo Nordisk, Maaloev, Denmark). Two different types were used; one produced in stainless steel (Group 4) and one produced in non-transparent plastic (Group 5) (Figure 1). A 3% saltwater (sodium chloride; ATLANTIS sea salt from Portugal) solution was provided as enrichment in groups 3, 4 and 5.

Figure 1. The non-transparent plastic maze/borrow.
To satisfy the animal’s need for gnawing and searching for food, several food items commonly used as enrichment for other species of rodents were used. Those selected were peanuts and hazelnuts with shells, sunflower seeds, maize and barley (all from Brogaarden, Gentofte, Denmark). All were given once daily in a very limited amount to all enrichment groups (groups 2, 3, 4 and 5).
Data
Data was analysed with PASW Statistics 18, 2009 (SPSS Inc., Chicago, Illinois, USA) and graphs made with Graph Pad Prism version 5.00 for Windows (Graph Pad Software, San Diego, California, USA).
The data sets were continuous and found to be normally distributed, hence the differences between the groups were analysed using the one-way analysis of variance. Dichotomous data (e.g. the number of animals developing diabetes or not) were analysed using the Chi-square test. A two-sided 5% level of significance was used in all the analysis.
Results
The five groups did not differ with respect to either HbA1C (p=0.28) or BG levels (p=0.87) at the start of the study (Table 2). The changes in measured variables over time did not differ significantly between the groups either with respect to HbA1C (p=0.40) or BG levels (p=0.83) (Table 2). In total, 38 out of 51 (75%) sand rats developed T2D (defined as a BG reading above 10 mmol/L on two consecutive days) which is in accordance with our previous experiences where 60 to 85% of the animals develop diabetes. Furthermore, the percentage of sand rats developing T2D did not differ between groups (p=0.16). However, the fact that not all sand rats developed diabetes resulted in a rather large standard deviation in glycaemic levels.
Table 2. mean (+/- standard deviation) blood glucose (mmol/l) and HbA1C (% of total hemoglobin) values on day 0 and day 37 (start and end of study).
|
Blood Glucose mmol/L |
HbA1C (% ) |
|||
|
Day 0 |
Day 37 |
Day 0 |
Day 37 |
|
|
Group 1 (control) |
7.4 (+/- 4.5) |
18.4 (+/- 10.8) |
5.3 (+/- 0.5 ) |
7.7 (+/- 0.7) |
|
Group 2 |
7.5 (+/- 4.8) |
18.0 (+/- 10.0) |
5.2 (+/- 0.9 ) |
7.7 (+/- 1.9) |
|
Group 3 |
8.7 (+/- 4.4) |
16.6 (+/- 4.5) |
5.0 (+/- 0.6 ) |
8.0 (+/- 0.9) |
|
Group 4 |
7.3 (+/- 4.0) |
15.5 (+/- 9.2) |
5.1 (+/- 0.5 ) |
8.0 (+/- 1.6 ) |
|
Group 5 |
5.0 (+/- 3.2) |
14.2 (+/- 8.7) |
4.8 (+/- 0.5 ) |
6.6 (+/- 1.3 ) |
|
P = 0.87 |
P = 0.83 |
P = 0.28 |
P = 0.40 |
|
Discussion
This study has demonstrated that is possible to provide environmental enrichment to sand rats without having significant effects on the development of T2D. The four test-groups were enriched in four different ways and none of the groups showed any significant difference in either BG levels or HbA1C, as compared to the control group.
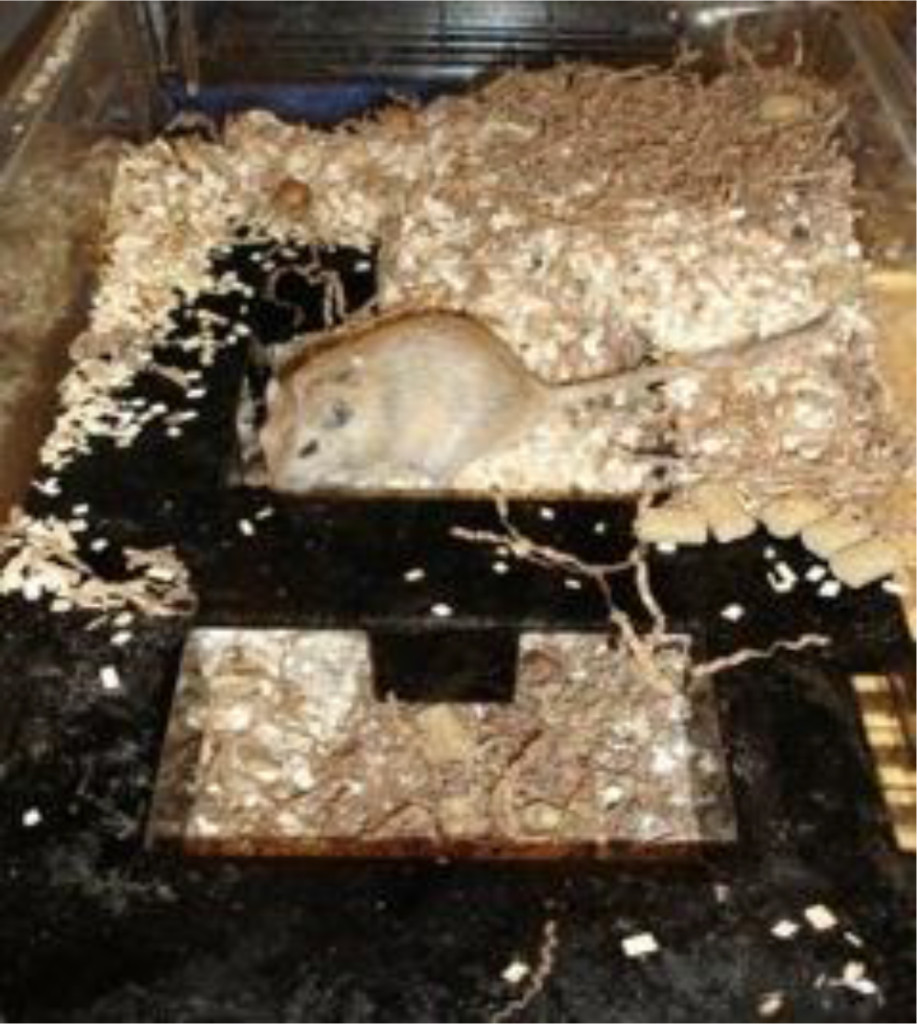
Housing systems containing items used by the animals to satisfy species-specific basic needs contribute to improved animal welfare [19]. Even though not quantified, it was observed that the animals used the maze/burrow, when provided; they would dig under it and they would arrange their shelters in it (Figure 2) and they seemed to have a lower level of stereotypies (personal observations). Hence the constructed maze/burrow seemed to be a valuable enrichment item in the cage with a positive effect on the animals’ welfare. The animal caretakers preferred the plastic maze/burrow, as it was easier to handle than the stainless-steel maze/burrow. The 3% saltwater solution as drinking water seemed to be preferred by the sand rats, especially in the beginning of the study. As the animals became diabetic they seemed to increase their intake of normal water (personal observations). Sand rats may show adrenal pathology and increased mortality, when not given extra sodium chloride [20, 21] and hence this supply may be valuable for the health of the animals. Further studies could establish the need as well as the preference for sodium chloride water compared to fresh water in sand rats. The sand rats ate the sunflower seeds, the maize and the barley. However, the hazelnuts with shells did not seem to be highly valued by the sand rats [21–25].
Conclusion
As there were no significant differences in the development of diabetes, there are no reasons to withhold species-specific environmental enrichments, like the items tested in this study, for fat sand rats. Based on the results and observations made in this study, a plastic maze/burrow, a 3% salt water solution and sunflower seeds, maize and barley would be excellent choices for adding environmental complexity to the cages of sand rats, allowing the sand rats to express natural behaviours such as exploration and foraging, thereby increasing the welfare of the fat sand rat.
References
- Ziran BH, Pineda S, Pokharna H, Esteki A, Mansour JM, Moskowitz RW (1994) Biomechanical, radiologic, and histopathologic correlations in the pathogenesis of experimental intervertebral disc disease. Spine 19: 2159–2163.
- Collier G, Walder K, De Silva A, Tenne-Brown J, Sanigorski A, et al. (2002) New approaches to gene discovery with animal models of obesity and diabetes: Lipids and Insulin Resistance: the Role of Fatty Acid Metabolism and Fuel Partitioning. Annals of the New York Academy of Sciences 967: 403–413.
- Borenshtein D, Ofri R, Werman M, Stark A, Tritschler HJ, et al. (2001) Cataract development in diabetic sand rats treated with alpha-lipoic acid and its gamma-linolenic acid conjugate. Diabetes Metab Res Rev 17: 44–50. [crossref]
- Gruber HE, Johnson T, Norton HJ, Hanley EN (2002) The sand rat model for disc degeneration: Radiologic characterization of age-related changes – Cross-sectional and prospective analyses. Spine 27: 230–234.
- Shafrir E (1996) Development and consequences of insulin resistance: Lessons from animals with hyperinsulinaemia. Diabetes & Metabolism 22: 122–131.
- Fine J, Quimby FW, Greenhouse DD (1986) Annotated bibliography on uncommonly used laboratory animals: Mammals. ILAR NEWS 29: 1A-38A.
- Daly M, Daly S (1975) Behavior of Psammomys Obesus (Rodentia: Gerbillinae) in the Algerian Sahara. Zietschrift fur Tierpsychologie 37: 298–321.
- Kaiser N, Cerasi E, Leibowitz G (2012) Diet-Induced Diabetes in the Sand Rat (Psammomys obesus). Animal Models in Diabetes Research, Methods in Molecular Biology. 933, 89–102.
- Donath MY, Gross DJ, Cerasi E, Kaiser N (1999) Hyperglycemia-induced beta-cell apoptosis in pancreatic islets of Psammomys obesus during development of diabetes. Diabetes 48: 738–744.
- Barnett M, Collier GR, Collier F, McL, Zimmet P, O´Dea K (1994) A cross-sectional and short-term longitudinal characterisation of NIDDM in Psammomys obesus. Diabetologia 37: 671–676.
- Hackel DB, Mikat E, Lebovitz HE, Schmidt-Nielsen K, Horton ES, Kinney TD (1967) The sand rat (Psammomys Obesus) as an experimental animal in studies of diabetes mellitus. Diabetologia 3: 130–134.
- Schmidt-Nielsen K, Haines Hb, Hackel Db (1964) Diabetes Mellitus In The Sand Rat Induced By Standard Laboratory Diets. Science 143: 689–690. [crossref]
- Shafrir E, Ziv E, Kalman R (2006) Nutritionally induced diabetes in desert rodents as models of type 2 diabetes: Acomys cahirinus (spiny mice) and Psammomys obesus (desert gerbil). Ilar Journal 47: 212–224.
- Shafrir E, Gutman A (1993) Psammomys obesus of the Jerusalem colony: A model for nutritionally induced, non-insulin-dependent diabetes. Journal of Basic & Clinical Physiology & Pharmacology 4: 83–99.
- Kalderon B, Gutman A, Levy E, Shafrir E, Adler JH (1986) Characterization of stages in development of obesity-diabetes syndrome in sand rat (Psammomys obesus). Diabetes 35: 717–724. [crossref]
- Kaiser N, Nesher R, Donath MY, Fraenkel M, Behar V, et al. (2005) Psammomys obesus, a model for environment-gene interactions in type 2 diabetes. Diabetes 54 Suppl 2: S137–144. [crossref]
- Heled Y, Shapiro Y, Shani Y, Moran DS, Langzam L, et al. (2002) Physical exercise prevents the development of type 2 diabetes mellitus in Psammomys obesus. Am J Physiol Endocrinol Metab 282: E370-E375.
- Bayne K (2005) Potential for Unintended Consequences of Environmental Enrichment for Laboratory Animals and Research Results. ILAR 46: 129–139.
- Ottesen JL, Weber A, Gürtler H, Mikkelsen LF (2004) new housing conditions: improving the welfare of experimental animals. Altern Lab Anim 32 Suppl 1B: 397–404. [crossref]
- Abdallah A, Tawfik J (1971) Effects of sodium chloride on the water consumption of sand rats (Psammomys obesus). Z Versuchstierkd 13: 150–157. [crossref]
- Frenkel G, Shaham Y, Kraicer PF (1972) Establishment of conditions for colony-breeding of the sand-rat Psammomys obesus. Lab Anim Sci 22: 40–47. [crossref]
- Nicklas W, Baneux P, Boot R, Decelle T, Deeny AA, et al. (2002) Recommendations for the health monitoring of rodent and rabbit colonies in breeding and experimental units. Lab Anim 36: 20–42. [crossref]
- Kalman R, Ziv E, Shafrir E, Bar-On H, Perez R (2001) Psammomys obesus and the albino rat – two different models of nutritional insulin resistance, representing two different types of human populations. Laboratory Animals 35: 346–352.
- Mikkelsen LF, Sørensen DB, Krohn T, Dragsted N, Hansen AK, Ottesen JL (2010) Clinical pathology and cardiovascular parameters are not influenced by housing rats under increased environmental complexity. Animal Welfare 19: 449–460.
- Sørensen DB, Krohn T, Hansen HN, Ottesen JL, Hansen AK (2005) An ethological approach to housing requirements of golden hamsters, Mongolian gerbils and fat sand rats in the laboratory – A review. Applied Animal Behaviour Science 94: 181–195.