DOI: 10.31038/GEMS.2025714
Abstract
Background: Previous studies have demonstrated that exposure to environmental tobacco smoke is associated with a reduction in fractional exhaled nitric oxide (FeNO) levels, elevation in eosinophil (EOS) counts and alterations in airway inflammation patterns, influencing the efficacy of glucocorticoid therapy for TH2 inflammation. No previous study has investigated the association of the extent of exposure to environmental tobacco smoke with FeNO levels. This study aimed to investigate the association of the extent of exposure to environmental tobacco smoke with FeNO level and EOS count.
Methods: In this retrospective cohort study, we included 12766 individuals from the National Health and Nutrition Examination Survey 2007–2012. The extent of exposure to environmental tobacco smoke was assessed by measuring serum cotinine levels. Participants were categorised into quintiles based on their cotinine levels. Logistic regression models were developed to evaluate the association of serum cotinine levels with FeNO levels and EOS count.
Findings: In the unadjusted and adjusted models, the highest quintile of serum cotinine levels (>105 ng/ml) was significantly negatively associated with FeNO levels. However, low-to-moderate quintiles of serum cotinine levels were not significantly associated with FeNO levels. Based on sensitivity analyses, the negative associations between the highest quintile of serum cotinine levels and FeNO levels remained consistent among participants with asthma, chronic bronchitis and respiratory symptoms within 7 days. Increased serum cotinine levels were significantly associated with increased EOS counts, which in turn were significantly associated with increased FeNO levels. EOS significantly mediated 7.59% of cotinine-associated reductions in FeNO levels.
Conclusions: Our findings indicated that high levels of tobacco smoke exposure are associated with a decrease in FeNO levels and an increase in EOS count. The smoking status should be considered when evaluating type 2 airway inflammation based on FeNO levels and EOS count.
Introduction
The subtypes of airway inflammation include neutrophilic, eosinophilic, mixed and oligocytic inflammation. Airway eosinophilic inflammation is defined as a blood eosinophil (EOS) count ≥300 cells·μL−1 and/or a sputum EOS count ≥3% [1]. Airway eosinophilic inflammation is sensitive to inhaled corticosteroids (ICS) [2]. In particular, in patients with asthma and chronic obstructive pulmonary disease (COPD) exhibiting airway eosinophilic inflammation, treatment with ICS can ameliorate symptoms, reduce acute attack frequency and improve lung function [3]. Therefore, diagnosing airway eosinophilic inflammation is important. Fractional exhaled nitric oxide (FeNO) levels, along with blood EOS counts, are considered indicators of airway eosinophilic inflammation [4]. Moreover, FeNO levels are closely associated with an individual’s response to allergens, airway hyper-responsiveness and impaired lung function [5,6], thus enabling the diagnosis of airway eosinophilic inflammation. They are helpful for guiding ICS and IgE-targeted therapies for patients with COPD, asthma and chronic cough. Therefore, FeNO and eosinophils are of great significance in the management of airway diseases. Nitric oxide (NO) serves as an endogenous regulatory molecule whose production is regulated by NO synthase (NOS), which is predominantly produced by inducible NOS in bronchial epithelial cells. Exhaled NO levels can be measured by quantifying NO concentration in exhaled breath.
Smoking induces alterations in airway inflammation types, thereby affecting the efficacy of ICS therapy in patients with asthma and COPD. Consequently, investigating the influence of smoking on type 2 airway inflammation has become a focal point of research. Previous studies have grouped light and heavy smokers together, making it difficult to determine the specific extent of tobacco smoke exposure that leads to changes in airway inflammation types, thus resulting in contradictory research findings. No previous study has investigated the association of the extent of exposure to environmental tobacco smoke with FeNO levels. Furthermore, although FeNO and EOS are associated with airway eosinophilic inflammation and act through different pathways, it remains unknown whether EOS play a mediating role in reducing FeNO levels induced by tobacco smoke exposure. Cotinine is the primary metabolite of nicotine and is significantly positively correlated with the extent of tobacco smoke exposure [7]. The estimated elimination half-life of cotinine (approximately 15–20 h) is longer than that of nicotine [8]. Therefore, cotinine has been widely used as a biomarker for tobacco exposure [9-12], as explained in detail in the NHANSE database (https://wwwn.cdc.gov/Nchs/Nhanes/2011-2012/COTNAL_G.htm). In the current study, cotinine was used to determine the level of tobacco smoke exposure.
Materials and Methods
Study Design and Population
The National Health and Nutrition Examination Survey (NHANES) is a programme of studies designed to assess the health and nutritional status of adults and children in the United States (US). During each survey cycle, a sample of participants is selected from the US non-institutionalised civilian population using a complex, stratified, multistage probability cluster sampling design. We analysed data from the participants of the NHANES from 2007 to 2012. A total of 16,784 participants aged ≥18 years had available data on cotinine. The National Center for Health Statistics (NCHS) Institutional Review Board (Hyattsville, MD) approved the study protocols, and all participants provided written informed consent.
FENO
FENO was measured using Aerocrine NIOX MINO®, which features a dynamic flow restrictor that stabilises the flow rate at 50 ml/s. The NHANES protocol required two reproducible FENO measurements in accordance with the testing procedures recommended by the manufacturer and similar to those published by the American Thoracic Society and European Respiratory Society. If either or both of the first two valid FENO measurements are <30 ppb and the measurements differ by ≤2 ppb or if both measurements are >30 ppb and within 10% of each other, then the test was considered reproducible and complete. Two values below or above the limit of detection were also considered reproducible.
Cotinine
Serum samples were processed, stored and shipped to the Division of Laboratory Sciences, National Center for Environmental Health and Centers for Disease Control and Prevention for analysis. Serum cotinine level was measured via isotope dilution–high-performance liquid chromatography–atmospheric pressure chemical ionisation–tandem mass spectrometry (ID–HPLC–APCI–MS/MS). Briefly, the serum sample was spiked with methyl-D3 cotinine as an internal standard, and after an equilibration period, the sample was applied to a basified solid-phase extraction column. Cotinine was extracted from the column with methylene chloride; the organic extract was concentrated, and the residue was injected into a short C18 HPLC column. The eluant from these injections was monitored using APCI–MS/MS, and the m/z 80 daughter ion from the m/z 177 quasi-molecular ion was quantitated, along with additional ions for the internal standard, external standard and confirmation. Cotinine levels were calculated from the ratio of native to labelled cotinine in the sample based on a comparison with a standard curve.
Other Variables of Interest
Age, sex and race/ethnicity were self-reported. Body mass index (BMI) was calculated using the height and weight measured at the mobile examination centre. Race and ethnicity were categorised as non-Hispanic Black, other Hispanic, non-Hispanic white and non-Hispanic other race, based on categories provided by NHANES investigators. Self-reported data on engaging in strenuous exercise within 1 h, consumption of NO-rich vegetables within 3 h , consumption of NO-rich meat within 3 h, use of oral or inhaled steroids within 2 days and development of respiratory symptoms within 7 days were collected using a computer-assisted personal interview system. Asthma and chronic bronchitis were defined according to self-reported diagnosis by a physician. A complete blood count was performed using the Beckman Coulter MAXM instrument in MECs, and all participants underwent blood cell analysis.
Selection of the Study Population
We conducted a cross-sectional study using aggregated data from three NHANES cycles (2007/2008, 2009/2010 and 2011/2012) in which serum cotinine was tested. A total of 16,784 adults completed the serum cotinine test during this survey period (Figure 1). Among them, 3280 were excluded due to missing data on exhaled NO (3227) and EOS (53). Additionally, 738 participants were excluded due to the following missing covariate data: asthma; chronic bronchitis; engaging in strenuous exercise within 1 h; consumption of NO-rich vegetables within 3 h; consumption of NO-rich meat within 3 h; use of oral or inhaled steroids within 2 days and development of cough, cold or respiratory illness within 7 days. Finally, 12766 participants were included in the study. The participants were categorised into five groups based on cotinine levels: Q1 (first quintile), Q2 (second quintile), Q3 (third quintile), Q4 (fourth quintile) and Q5 (fifth quintile).
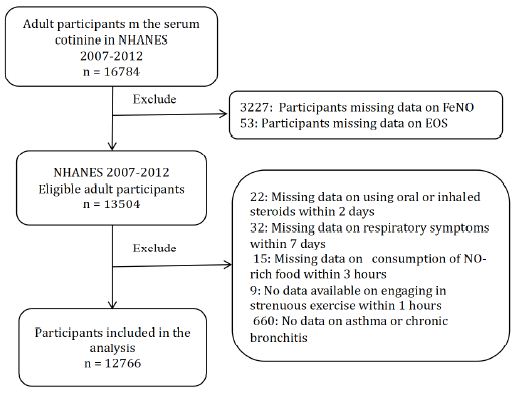
Figure 1: Flow diagram of the study. Abbreviations: FeNO: fractional exhaled nitric oxide; EOS: eosinophils; ICS: inhaled corticosteroids; CI: confidence interval; OR: odds ratio; SD: standard deviation.
Statistical Analysis
Continuous variables of age, BMI at enrolment and laboratory findings were expressed as median (interquartile range) or mean ± standard deviation (SD). The remaining categorical variables were expressed as n (%). The participants were categorised into quintiles based on the cotinine levels provided by NHANSE: Q1 (0.011), Q2 (0.011–0.027), Q3 (0.027–0.104), Q4 (0.104–105) and Q5 (≥105). Quintiles based on cotinine levels can effectively reflect the distribution of tobacco smoke exposure levels among the participants. Participants in the highest quintile (Q5) were considered to have high levels of tobacco smoke exposure. Logistic regression models were used to investigate the odds ratios (ORs) and 95% confidence intervals (CIs) of FeNO levels according to serum cotinine levels (quintiles). In adjusted model 1, the adjusted covariates included cotinine, age, , BMI and ethnicity. In adjusted model 2, the adjusted covariates were asthma, chronic bronchitis, EOS, engaging in strenuous exercise within 1 h, consumption of NO-rich vegetables within 3 h, consumption of NO-rich meat within 3 h, use of oral or inhaled steroids within 2 days, development of respiratory symptoms within 7 days and covariates included in model 1. A sensitivity analysis was conducted using the logistic regression model among participants with such as chronic bronchitis , asthma, and respiratory symptoms within 7 days prior to testing. After weighting the data with the sample weights (full sample 2-year interview weight) obtained from the NHANS 2007–2012 demographics file, logistic regression analysis was performed to explore the relationship between tobacco exposure and FeNO levels in the US population. Additionally, logistic regression models were utilised to explore the association between cotinine levels (quintiles) in the participants and higher EOS counts (≥0.3 × 10³ cells/µl). Logistic regression models were also used to analyse the association between EOS counts in the participants and higher FeNO levels (>25 bbp). Correlation coefficients (Spearman’s rho and Kendall’s tau) were calculated to investigate the cotinine–EOS association. This study examined the proportion of mediation through EOS in the associations of cotinine levels and FeNO using the R (R4.2.1) based on the mediation method recommended by Hayes [13]. The data were analysed using R (R4.2.1) and SPSS version 21.0 (IBM Corp., Armonk, NY, USA). The statistically significant cut-off of the two-sided P-value was 0.05.
Results
Characteristics of the Participants
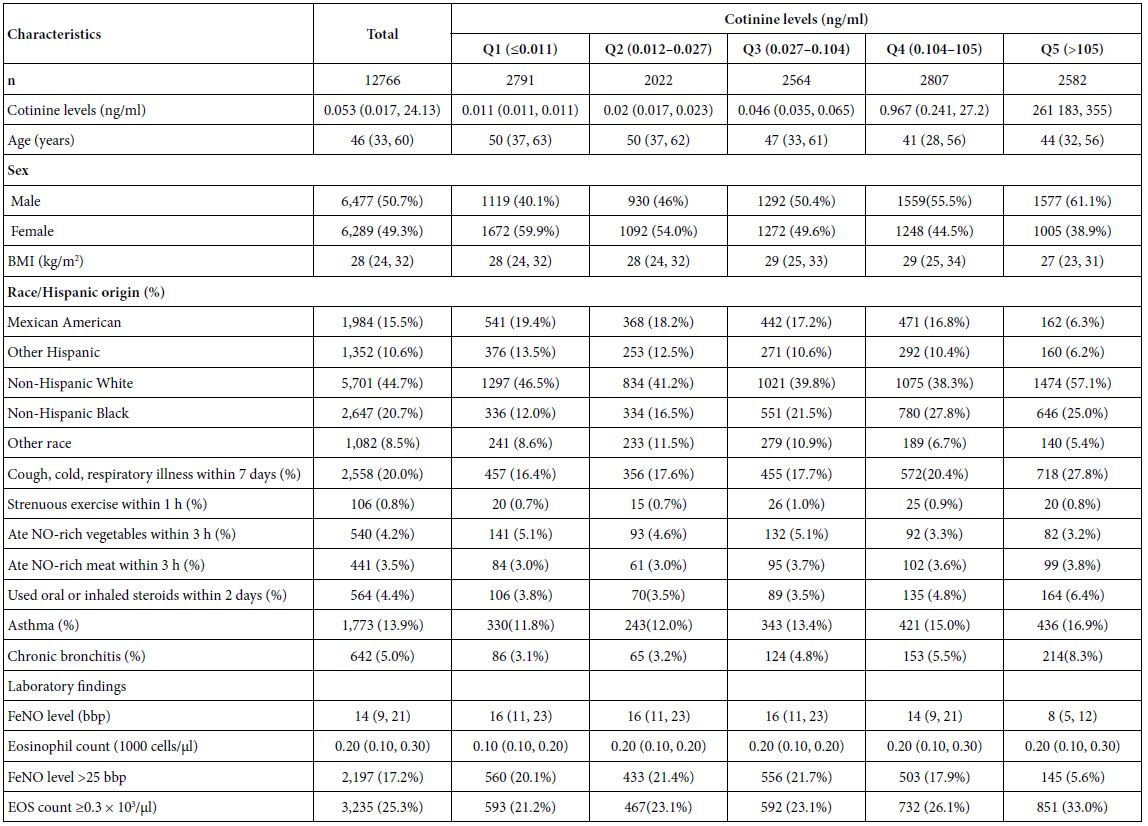
Table 1 describes the socio-demographic, anthropometric, race, primary disease and laboratory data of the participants. Approximately 17.5% (2446/13,945) of the participants had FeNO levels >25 bbp, and approximately 21.5% (3194/13,945) had EOS counts ≥0.3 × 10³/µl. The median age of the participants was 43 (20, 60) years. In total, 2844 (20.4%) participants had cough, cold or respiratory illness within the past 7 days, 1721 (12.4%) had asthma, and 459 (4.1%) had chronic bronchitis. In order to ensure that the survey results can represent the entire US population, we weighted the data. The characteristics of the US adults were showed in the Table S4.
Table 1: Characteristics and laboratory data of the participants according to cotinine levels (n = 12766).
Association of Cotinine Levels with FeNO Levels
Table 2 presents the risk of higher FeNO levels (>25 bbp) associated with serum cotinine levels categorized into quintiles among participants. In the unadjusted models, participants with the highest quintile of serum cotinine levels (>105 ng/ml) showed decreased FeNO levels compared with those with the lowest quintile of serum cotinine levels (0.011 ng/ml) (OR, 0.24 [0.20, 0.29]). There were no significant differences in FeNO levels of participants between Q3 and the lowest quantile of cotinine levels (21.6% vs 19.5%) as well as between Q2 and the lowest quantile of cotinine levels (21.7% vs 19.5%) (Table 2). After adjusting for potential confounders, similar results were observed in models 1 and 2. In model 2, a 1 SD increase in cotinine level was associated with lower FeNO levels (OR, 0.47 [0.42, 0.517]) (Table 2). Sensitivity analyses performed among participants with asthma, recent respiratory symptoms, and chronic bronchitis yielded consistent findings (Tables S1-S3). After weighting the sample, the negative association between cotinine and FeNO levels remained consistent across the US population (Table S5).
Table 2: Adjusted ORs and 95% CIs for the association of cotinine levels with the risk of high FeNO level (n = 12766).
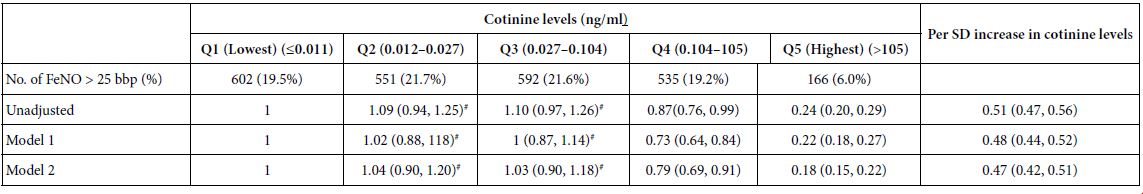
#P > 0.05 Abbreviations: FeNO: fractional exhaled nitric oxide; EOS: eosinophils; CI: confidence interval; OR: odds ratio; SD: standard deviation.
Logistic regression model 1 included covariates of cotinine, age, sex, BMI, race and EOS count. Logistic regression model 2 included covariates of use of oral or inhaled steroids within 2 days, development of respiratory symptoms within 7 days, consumption of NO-rich food within 3 h, engaging in strenuous exercise within 1 h, asthma, chronic bronchitis and covariates in model 1.
Association of Cotinine Levels with EOS Levels
Compared with participants with the lowest quintile of cotinine levels, those with the highest quintile of cotinine levels had higher EOS count (≥0.3 × 10³ cells/µl) (OR 1.82 [1.61, 2.06]). The ORs were 1.87 (1.64, 2.13) and 2.39 (2.09, 2.74) in models 1 and 2, respectively (Table 3). However, no statistically significant difference in EOS counts was observed between Q3 and the lowest quintile of cotinine levels and between Q2 and the lowest quintile of cotinine levels. This study revealed that higher cotinine levels were positively associated with EOS count in all models (Table 3). A 1 SD increase in cotinine levels was associated with elevated EOS count (ORs of 1.14, 1.14 and 1.24 in the unadjusted model, model 1 and model 2, respectively). Correlation analyses revealed significant positive correlations between cotinine and EOS levels (Spearman’s rho: r = 0.074, P < 0.0001; Kendall’s tau: r = 0.097, P < 0.0001).
Table 3: Adjusted ORs and 95% CIs for the association of cotinine levels with EOS count (n = 12766).
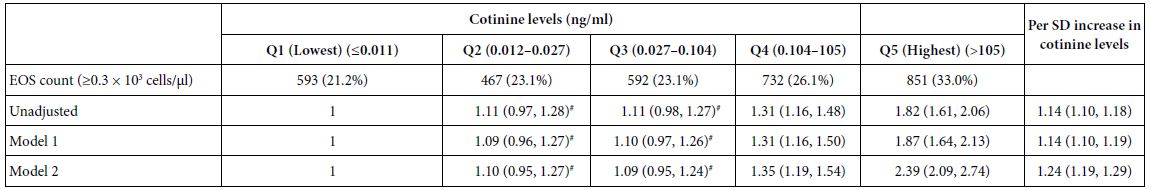
#P > 0.05 Abbreviations: FeNO: fractional exhaled nitric oxide; EOS: eosinophils; ICS: inhaled corticosteroids; CI: confidence Interval; OR: odds ratio.
Logistic regression model 1 included covariates of cotinine, age, sex, BMI, race and FeNO level. Logistic regression model 2 included covariates of use of oral or inhaled steroids within 2 days, development of respiratory symptoms within 7 days, consumption of NO-rich food within 3 h, engaging in strenuous exercise within 1 h prior to testing, asthma, chronic bronchitis and covariates in model 1.
Association of EOS Count with FeNO Levels
This study revealed a positive association between EOS count and FeNO levels. The participants were categorized into quintiles based on the EOS counts (Table 4). The results showed that a 1 SD increase in EOS count was significantly associated with higher FeNO levels (>25 bbp) (OR 1.55 [1.48, 1.62], 1.53 [1.46, 1.60], 1.35 [1.29, 1.43] and 1.43 [1.15, 1.59] in the unadjusted model, model 1, model 2 and model 3, respectively).
Table 4: Adjusted ORs and 95% CIs for the association of EOS count with FeNO levels (n = 12766).
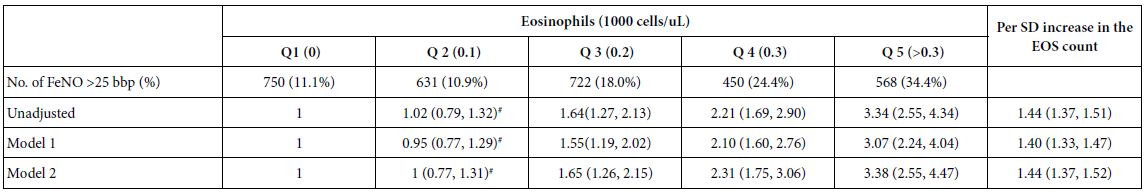
#P > 0.05 Abbreviations: FeNO: fractional exhaled nitric oxide; EOS: eosinophils; ICS: inhaled corticosteroids; CI: confidence interval; OR: odds ratio; SD: standard deviation
Multivariate linear regression model 1 included covariates of EOS, age, sex, BMI, race and cotinine level. Multivariate linear regression model 2 included covariates of use of oral or inhaled steroids within 2 days, development of respiratory symptoms within 7 days, consumption of NO-rich food within 3 h, engaging in strenuous exercise within 1 h prior to testing, asthma, chronic bronchitis and covariates in model 1.
Mediation Analyses
As shown in Table 5, significantly mediated effects by EOS were observed on the association of cotinine levels with FeNO levels. Increased EOS count significantly mediated 13% of the cotinine-associated reduction in FeNO levels. Mediation analyses were conducted using the R programming language.
Table 5: Mediated effects by EOS on the association of cotinine levels with FeNO levels (n = 12766).
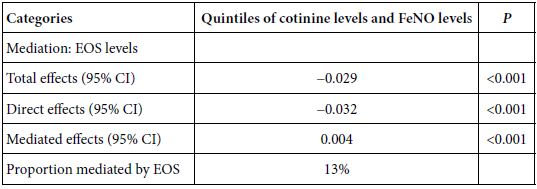
Abbreviations: FeNO: fractional exhaled nitric oxide; EOS: eosinophils; CI: confidence interval; OR: odds ratio; SD: standard deviation.
Discussion
This study revealed that participants with the highest quintile of cotinine levels (≥105 ng/ml) exhibited decreased FeNO levels compared with those with the lowest quintile of cotinine levels (0.11 ng/ml, indicating no tobacco exposure). Compared with participants with the lowest quantile of cotinine levels, no significant difference was observed in FeNO levels in those with Q2, Q3 and Q4 cotinine levels (P > 0.05). Sensitivity analyses conducted among participants with asthma, recent respiratory symptoms and chronic bronchitis revealed consistent findings. Similar results were obtained across the US population after the data were weighted. A positive association between high tobacco exposure and EOS count was observed. EOS mediated the cotinine-associated decrease in FeNO levels. Chronic airway inflammation and acute airway inflammation are associated with increased FeNO levels [14-17]. Additionally, exercise [18-20] and consumption of NO-rich foods [21-22] can cause changes in FeNO levels. Therefore, in this study, we included variables such as engaging in strenuous exercise within 1 h, consumption of NO-rich foods within 3 h, asthma, chronic bronchitis and with respiratory symptoms within 7 days as covariates in the model.
Some studies have indicated that smoking can lead to a decrease in FeNO levels [23,24] and alter airway inflammation types. These studies confirm our research findings. However, another study showed no remarkable difference in FeNO levels between smokers and non-smokers [8]. Previous studies have categorised participants into smokers, former smokers and non-smokers but failed to assess the extent of tobacco exposure. Consequently, various studies may yield conflicting conclusions. Furthermore, previous studies employed small samples that lacked representativeness. In our research, we utilised a nationally representative large sample of the adult population in the US to explore the association of tobacco exposure with FeNO levels. We employed serum cotinine level as a reliable measure to evaluate the extent of exposure to environmental tobacco smoke. Participants were categorised into quintiles based on cotinine levels: Q1 (0.011–0.0185), Q2 (0.0185–0.075), Q3 (0.075–125), Q4 (125–309) and Q5 (≥309). This approach allows us to understand the distribution of tobacco exposure levels among participants across different quintiles. We can effectively understand the trend in the effect of cotinine levels on FeNO levels by investigating the regression relationship across different quantiles. Our study demonstrated that high exposure to tobacco smoke is associated with lower FeNO levels. Ashley et al. [25] used data from the NHANES 2007–2012 to investigate the association of tobacco exposure with FeNO levels in non-smoking adolescents and found that tobacco exposure was associated with lower FeNO levels, consistent with the results of the current study. The research population in their study was a specific cohort of non-smoking adolescents. Our study further explored the effects of smoking on EOS count and the mediating role of EOS, providing a reference for the mechanism by which tobacco exposure leads to lower FeNO levels.
EOS and FeNO have been utilised as indicators of type 2 airway inflammation as well as for identifying patients experiencing asthma exacerbations [26,27], guiding corticosteroid therapy during the exacerbation of COPD 28 and determining the suitability of ICS therapy regimens [29-32]. Their importance in COPD treatment is paramount [33,34]. Considering that smoking can influence airway inflammation, there has been increasing interest in exploring the association between blood EOS counts and smoking habits. Current smoking is significantly associated with EOS counts ≥210 cells·μl−1 (OR, 1.72). Colak et al. [35] reported that a history of smoking is associated with a blood EOS count ≥300 cells·μl−1; however, the association between current cumulative tobacco exposure and EOS count remains uncertain. Our study revealed that EOS counts were elevated in participants with Q4 and Q5 serum cotinine levels. In a study involving the Copenhagen general population, Pedersen et al. [36] showed that high cumulative and daily tobacco consumption in current smokers was associated with substantial increases in EOS counts in a dose-dependent manner. However, their minimum reference value was <10 g/day of tobacco consumption. The reference for our study was the absence of tobacco exposure.
Although EOS and FeNO serve as markers for type 2 airway inflammation, they represent different aspects of this condition [37-40]. FeNO level reflects airway IL‐13 activity, whereas blood EOS count reflects systemic IL‐5 activity [22]. FeNO level is correlated with increased induced sputum levels of airway type 2 cytokines, chemokines and alarmins. In contrast, blood EOS counts are only correlated with serum IL‐5 levels in the sputum [41]. Tobacco exposure may cause a decrease in FeNO levels and an increase in EOS count through different signalling pathways. The exact mechanism underlying this effect remains unclear. The mediated analysis in the current study showed that EOS counts mediated the cotinine-associated reduction in FeNO levels, But more research is needed to confirm this. First, the effect of tobacco exposure on type 2 airway inflammation was corroborated, and the range of tobacco exposure levels that influence changes in airway inflammation types was further analysed. Second, the potential mechanism underlying the alterations in EOS counts and FeNO levels induced by tobacco exposure was investigated, revealing that EOS mediated the cotinine-associated reduction in FeNO levels. This result provides valuable insights for further elucidation of related mechanisms. Third, previous studies [23-24] have employed past and current smoking as indicators for classifying tobacco exposure. Such an approach is considered overly general and overlooks second-hand smoke exposure. In contrast, our study substituted serum cotinine levels to assess tobacco exposure levels, yielding results with increased accuracy. Finally, relevant adjustments were made by incorporating potential confounders.
Inevitably, this study had certain limitations. First, the effect of long-term smoking accumulation and duration of quitting smoking on EOS count was not considered (21). Environmental pollutants are associated with FeNO levels [42-45]. Furthermore, allergic rhinitis, eosinophilic esophagitis, atopic rhinitis and food allergy are associated with elevated levels of FeNO [46-50]. However, the NHANES 2007–2012 database lacks data on environmental pollution, allergic rhinitis, eosinophilic esophagitis, atopic dermatitis and food allergies. Second, smoking induces neutrophilic inflammation. The effect of smoking-related neutrophil inflammatory factors on FeNO levels requires further investigation. Third, disease history relies on self-reporting, which is susceptible to individual subjectivity. Finally, the utilisation of retrospective data may lead to data loss, measurement errors and inaccuracies. In conclusion, this study demonstrated that tobacco exposure can cause a decrease in FeNO levels and an increase in EOS counts. The smoking status should be considered when evaluating type 2 airway inflammation using FeNO and EOS count. The reduction in FeNO levels due to tobacco exposure is partially mediated by EOS. High levels of tobacco exposure can lead to a distinct type of airway inflammation characterised by elevated EOS count but decreased FeNO levels. This airway inflammation type should be classified as a subtype separate from typical airway eosinophilic inflammation. These findings provide clinicians with a scientific basis for the diagnosis, treatment and management of patients with airway inflammation.
Conflict of Interest
The authors declare that they have no conflicts of interest.
Funding
This study was supported by Scientific Research Fund Project of Hunan Provincial Health Commission of China (No. D202303028856).
Data Availability
The data underpinning this article were obtained from the National Health and Nutrition Examination Survey (NHANES) 2007–2012. The datasets utilized and analyzed in the present study are available from the corresponding author upon reasonable request.
Authors’ Contributions
Xingfang Hou, Shufen Hou, Chenggong Hou, Xuelian Chen, and Yuling Tang conducted this study. Xingfang Hou was responsible for the conceptualization, methodology, investigation, formal analysis, preparation of the original draft, provision of resources, and visualization. Shufen Hou and Chenggong Hou contributed to data curation and investigation. Yuling Tang and Xuelian Chen provided supervision, reviewed the manuscript, and managed project administration. Xingfang Hou, Yuling Tang, and Xuelian Chen were designated as guarantors of the paper, ensuring the integrity of the work from inception to publication. All authors reviewed and approved the final manuscript.
References
- Cosío BG, Pérez De Llano L, Lopez Viña A, Torrego A, Lopez-Campos JL, et al. (2017) Th-2 signature in chronic airway diseases: towards the extinction of asthma-COPD overlap syndrome? The European Respiratory Journal. 49. [crossref]
- Janin S,Rochat T (2007) Phenotypes of severe persistent asthma in adults. Revue Medicale Suisse. 3: 2663-2667.
- Lea S, Higham A, Beech A, Singh D (2023) How inhaled corticosteroids target inflammation in COPD. European Respiratory Review. 32. [crossref]
- Soter S., Barta I.Antus B (2013) Predicting sputum eosinophilia in exacerbations of COPD using exhaled nitric oxide. Inflammation. 36: 1178-1185. [crossref]
- Thorhallsdottir A. K., Gislason D., Malinovschi A., Clausen M., Gislason T., et al. (2016) Exhaled nitric oxide in a middle-aged Icelandic population cohort. Journal of Breath Research. 10. [crossref]
- Nerpin E, Ferreira DS, Weyler J, Schlunnsen V, Jogi R, et al. (2021) Bronchodilator response and lung function decline: Associations with exhaled nitric oxide with regard to sex and smoking status. The World Allergy Organization Journal. 14. [crossref]
- Sepkovic DW, Haley NJ (1985) Biomedical applications of cotinine quantitation in smoking related research. American Journal of Public Health. 75: 663-665. [crossref]
- Jarvis MJ, Russell MA, Benowitz NL, Feyerabend C (1988) Elimination of cotinine from body fluids: implications for noninvasive measurement of tobacco smoke exposure. American Journal of Public Health. 78: 696-698. [crossref]
- Hecht SS (2004) Carcinogen derived biomarkers: applications in studies of human exposure to secondhand tobacco smoke. Tobacco Control. 13 Suppl 1(Suppl 1): i48-56. [crossref]
- Benowitz NL (1996) Cotinine as a biomarker of environmental tobacco smoke exposure. Epidemiologic Reviews. 18: 188-204. [crossref]
- Benowitz NL (1983) The use of biologic fluid samples in assessing tobacco smoke consumption. NIDA Research Monograph. 48: 6-26. [crossref]
- Etzel RA (1990) A review of the use of saliva cotinine as a marker of tobacco smoke exposure. Preventive Medicine. 19: 190-197. [crossref]
- Hayes Andrew F (2017) Introduction to mediation, moderation, and conditional process analysis: A regression-based approach: Guilford publications.
- Delen FM, Sippel JM, Osborne ML, Law S, Thukkani N, et al. (2000) Increased exhaled nitric oxide in chronic bronchitis: comparison with asthma and COPD. Chest. 117: 695-701. [crossref]
- Kharitonov SA, Yates D, Robbins RA, Logan-Sinclair R, Shinebourne EA, et al. (1994) Increased nitric oxide in exhaled air of asthmatic patients. Lancet. 343: 133-135. [crossref]
- Kharitonov SA, Wells AU, O’connor BJ, Cole PJ, Hansell DM, et al. (1995) Elevated levels of exhaled nitric oxide in bronchiectasis. American Journal of Respiratory and Critical Care Medicine. 151: 1889-1893. [crossref]
- Mormile M, Mormile I, Fuschillo S, Rossi FW, Lamagna L, et al. (2023) Eosinophilic Airway Diseases: From Pathophysiological Mechanisms to Clinical Practice. International Journal of Molecular Sciences. 24. [crossref]
- Persson MG, Wiklund NP, Gustafsson LE (1993) Endogenous nitric oxide in single exhalations and the change during exercise. The American Review of Respiratory Disease. 148: 1210-1214. [crossref]
- Maroun M. J., Mehta S., Turcotte R., Cosio M. G.,Hussain S. N (1985) Effects of physical conditioning on endogenous nitric oxide output during exercise. J Appl Physiol. 79: 1219-1225. [crossref]
- Massaro AF,Drazen JM (1985) Exhaled nitric oxide during exercise: site of release and modulation by ventilation and blood flow. J Appl Physiol. 80: 1863-1864. [crossref]
- Olin AC, Aldenbratt A, Ekman A, Ljungkvist G, Jungersten L (2001) Increased nitric oxide in exhaled air after intake of a nitrate-rich meal. Respiratory Medicine. 95: 153-158. [crossref]
- Duncan C., Dougall H., Johnston P., Green S., Brogan R., et al. (1995) Chemical generation of nitric oxide in the mouth from the enterosalivary circulation of dietary nitrate. Nature Medicine. 1: 546-551. [crossref]
- Silkoff PE, Singh D, Fitzgerald JM, Eich A, Ludwig-Sengpiel A (2017) Inhaled Steroids and Active Smoking Drive Chronic Obstructive Pulmonary Disease Symptoms and Biomarkers to a Greater Degree Than Airflow Limitation. Biomarker Insights. 12. [crossref]
- Nagasaki T, Matsumoto H, Nakaji H, Niimi A, Ito I, et al. (2013) Smoking attenuates the age-related decrease in IgE levels and maintains eosinophilic inflammation. Clinical and Experimental Allergy: Journal of the British Society for Allergy and Clinical Immunology. 43: 608-615. [crossref]
- Merianos AL, Jandarov RA, Cataletto M, Mahabee-Gittens EM (2021) Tobacco smoke exposure and fractional exhaled nitric oxide levels among U.S. adolescents. Nitric Oxide. 117: 53-59. [crossref]
- Oshikata C, Tsuburai T, Tsurikisawa N, Ono E, Higashi A, et al. (2008) [Cutoff point of the fraction of exhaled nitric oxide (FeNO) with the off-line method for diagnosing asthma and the effect of smoking on FeNO]. Nihon Kokyuki Gakkai Zasshi. 46: 356-362. [crossref]
- Smit LA, Heederik D, Doekes G, Wouters IM (2009) Exhaled nitric oxide in endotoxin-exposed adults: effect modification by smoking and atopy. Occupational and Environmental Medicine. 66: 251-255. [crossref]
- Bateman ED, Hurd SS, Barnes PJ, Bousquet J, Drazen JM, et al. (2008) Global strategy for asthma management and prevention: GINA executive summary. The European Respiratory Journal: Official Journal of the European Society for Clinical Respiratory Physiology. 31: 143-178. [crossref]
- Bafadhel M., Mckenna S, Terry S, Mistry V, Pancholi M, et al. (2012) Blood eosinophils to direct corticosteroid treatment of exacerbations of chronic obstructive pulmonary disease: a randomized placebo-controlled trial. American Journal of Respiratory and Critical Care Medicine. 186: 48-55. [crossref]
- Pavord I. D., Lettis S., Locantore N., Pascoe S., Jones P. W., et al. (2016) Blood eosinophils and inhaled corticosteroid/long-acting β-2 agonist efficacy in COPD. Thorax. 71: 118-125. [crossref]
- Pascoe S, Locantore N, Dransfield MT, Barnes NC, Pavord ID (2015) Blood eosinophil counts, exacerbations, and response to the addition of inhaled fluticasone furoate to vilanterol in patients with chronic obstructive pulmonary disease: a secondary analysis of data from two parallel randomised controlled trials. Lancet Respir Med. 3: 435-442. [crossref]
- Siddiqui S. H., Guasconi A., Vestbo J., Jones P., Agusti A., et al. (2015) Blood Eosinophils: A Biomarker of Response to Extrafine Beclomethasone/Formoterol in Chronic Obstructive Pulmonary Disease. American Journal of Respiratory and Critical Care Medicine. 192: 523-525. [crossref]
- Hartl S., Breyer M. K., Burghuber O. C., Ofenheimer A., Schrott A., et al. (2020) Blood eosinophil count in the general population: typical values and potential confounders. The European Respiratory Journal: Official Journal of the European Society for Clinical Respiratory Physiology. 55. [crossref]
- Pavord ID, Chanez P, Criner GJ, Kerstjens HAM, Korn S, et al. (2017) Mepolizumab for Eosinophilic Chronic Obstructive Pulmonary Disease. The New England Journal of Medicine. 377: 1613-1629.
- Çolak Y, Afzal S, Nordestgaard BG, Marott JL, Lange P (2018) Combined value of exhaled nitric oxide and blood eosinophils in chronic airway disease: the Copenhagen General Population Study. The European Respiratory Journal: Official Journal of the European Society for Clinical Respiratory Physiology. 52. [crossref]
- Pedersen KM, Çolak Y, Ellervik C, Hasselbalch HC, Bojesen SE, et al. (2019) Smoking and Increased White and Red Blood Cells. Arteriosclerosis, Thrombosis, and Vascular Biology. 39: 965-977. [crossref]
- Couillard S., Laugerud A., Jabeen M., Ramakrishnan S., Melhorn J., et al. (2022) Derivation of a prototype asthma attack risk scale centred on blood eosinophils and exhaled nitric oxide. Thorax. 77: 199-202. [crossref]
- Couillard S, Do WIH, Beasley R, Hinks TSC, Pavord ID (2022) Predicting the benefits of type-2 targeted anti-inflammatory treatment with the prototype Oxford Asthma Attack Risk Scale (ORACLE). ERJ Open Res. 8. [crossref]
- Shrimanker R, Keene O, Hynes G, Wenzel S, Yancey S (2019) Prognostic and Predictive Value of Blood Eosinophil Count, Fractional Exhaled Nitric Oxide, and Their Combination in Severe Asthma: A Post Hoc Analysis. American Journal of Respiratory and Critical Care Medicine. 200: 1308-1312. [crossref]
- Ortega HG, Yancey SW, Mayer B, Gunsoy NB, Keene ON, et al. (2016) Severe eosinophilic asthma treated with mepolizumab stratified by baseline eosinophil thresholds: a secondary analysis of the DREAM and MENSA studies. Lancet Respir Med. 4: 549-556. [crossref]
- Couillard S., Shrimanker R., Chaudhuri R., Mansur A. H., Mcgarvey L. P., et al. (2021) Fractional Exhaled Nitric Oxide Nonsuppression Identifies Corticosteroid-Resistant Type 2 Signaling in Severe Asthma. American Journal of Respiratory and Critical Care Medicine. 204: 731-734. [crossref]
- Fan Z, Pun VC, Chen XC, Hong Q, Tian L, et al. (2018) Personal exposure to fine particles (PM(2.5)) and respiratory inflammation of common residents in Hong Kong. Environmental Research. 164: 24-31. [crossref]
- Maestrelli P., Canova C., Scapellato M. L., Visentin A., Tessari R., et al. (2011) Personal exposure to particulate matter is associated with worse health perception in adult asthma. Journal of Investigational Allergology & Clinical Immunology: Official Organ of the International Association of Asthmology (INTERASMA) and Sociedad Latinoamericana de Alergia e Inmunologia. 21: 120-128. [crossref]
- Xu T, Hou J, Cheng J, Zhang R, Yin W, et al. (2018) Estimated individual inhaled dose of fine particles and indicators of lung function: A pilot study among Chinese young adults. Environ Pollut. 235: 505-513. [crossref]
- Zhang Z, Zhang H, Yang L, Chen X, Norbäck D, et al. (2022) Associations between outdoor air pollution, ambient temperature and fraction of exhaled nitric oxide (FeNO) in university students in northern China – A panel study. Environmental Research. 212(Pt C). [crossref]
- Huang Q, Li Y, Li C, Zhang X, Du X, et al. (2023) Cigarette smoke aggravates asthma via altering airways inflammation phenotypes and remodelling. The Clinical Respiratory Journal. 17: 1316-1327. [crossref]
- Saranz RJ, Lozano NA, Lozano A, Alegre G, Robredo P, et al. (2022) Relationship between exhaled nitric oxide and biomarkers of atopy in children and adolescents with allergic rhinitis. Acta Otorrinolaringol Esp (Engl Ed). 73: 286-291. [crossref]
- Guida G, Rolla G, Badiu I, Marsico P, Pizzimenti S, et al. (2010) Determinants of exhaled nitric oxide in chronic rhinosinusitis. Chest. 137: 658-664. [crossref]
- Kaur P, Chevalier R, Friesen C, Ryan J, Sherman A, et al. (2023) Diagnostic role of fractional exhaled nitric oxide in pediatric eosinophilic esophagitis, relationship with gastric and duodenal eosinophils. World Journal of Gastrointestinal Endoscopy. 15: 407-419. [crossref]
- Galiniak S, Rachel M (2022) Fractional Exhaled Nitric Oxide in Teenagers and Adults with Atopic Dermatitis. Adv Respir Med 90(4): 237-245. [crossref]