Monthly Archives: June 2024

Grandparental Childcare and Maternal Labor Supply: A Short Commentary

DOI: 10.31038/IGOJ.2024524


China has experienced a widening of the gender gap in labor force participation, characterized by a decreasing percentage of female employees. This trend is potentially exacerbated by the relaxation of the one-child policy, as the primary responsibility for childcare falls on mothers, subsequently reducing women’s labor supply. The situation is further intensified by the restricted availability of formal childcare services, as having access to daycare services increases labor force participation (MLFP) by 24–29% in urban China. For children under the age of three, the work-family conflicts become evident for working mothers. Thus, grandparental childcare emerges as a practical solution [1-3].

According to recent study published in International Sociology [4], which uses data from the 2018 China Family Panel Studies (CFPS), the impact of grandparental childcare on mothers’ labor supply was analyzed. It was observed that grandparental childcare could significantly enhance mothers’ labor force participation rate and extend their weekly working hours. Regression analysis indicated a significant positive association between grandparental childcare and mothers’ labor force participation, notably amplifying labor participation and working hours for mothers with children aged 0 to 2 years. The study also confirmed that higher educational attainment and enrollment of children in formal childcare institutions significantly increased mothers’ labor force participation and working hours. Comparison between one-child and multi-child families revealed that grandparental childcare significantly bolstered labor force participation, particularly in one-child families. However, the augmentation in weekly working hours was marginally superior in multi-child families.

The research affirms that grandparental childcare promotes mothers’ labor force participation and working hours by lessening childcare obligations and facilitating a balance between work and family life. Moreover, the influence of grandparental childcare was more pronounced on the labor supply for mothers with children aged 0 to 2 years due to these children’s ineligibility for preschool and requirement of intensive care. This highlights the effective role of grandparental childcare in compensating for the limited services, easing women’s childcare responsibilities, and sustaining professional progression without significant interruptions.

The findings emphasize the necessity to establish a comprehensive childcare system that inclusively engages the government, family, and community to ease childcare burdens on women. Recommendations include the incorporation of flexible retirement plans and skill- enhancing training initiatives for grandparents in the childcare strategies. The findings also underscore the need to ensure women- friendly professional arrangements and extend accessible and affordable childcare resources, especially within the legal framework that permits up to three children in a home.

However, certain limitations exist in the study. One is the unavailability of women’s pre-childbirth labor supply data in CFPS, which could potentially lead to an underestimation of the correlation between grandparental childcare and maternal labor supply. The study also focused exclusively on labor force participation and working hours without considering the effects on work types and job specificity. A relatively small sample size of maternal grandparents providing childcare suggests a need for further research to differentiate between paternal and maternal grandparental support influences. Lastly, the current study does not explore the underlying causes of grandparental childcare preferences, which could be an area of further investigation to broaden the understanding in this domain.

In conclusion, the study underscores the significant role of grandparental childcare in bolstering maternal labor force participation in China, especially for mothers with infants and toddlers. It highlights the need for a comprehensive childcare system and flexible policies to balance women’s professional and familial roles. However, the study’s limitations suggest the need for more extensive research. Future work could explore the root causes of grandparental childcare preferences and the differential impacts of maternal and paternal grandparental support.

References

  1. Leng A, Kang F (2022) Impact of two-child policy on female employment and corporate performance: Empirical evidence from Chinese listed companies from 2010 to Humanities & Social Sciences Communications 9: 451.
  2. Wu X (2022) Fertility and maternal labor supply: Evidence from the new two-child policies in urban Journal of Comparative Economics 50: 584-598.
  3. Du F, Dong XY, Zhang Y (2019) Grandparent-provided childcare and labor force participation of mothers with preschool children in urban China. China Population and Development Studies, 2, 347-368.
  4. Bai H, Li M, Hong Y (2024) Grandparental childcare and maternal labor supply in Chinese families with young children: Evidence from the China Family Panel International Sociology 39(4).
fig 2

Pan Cancer Analysis Indicates TREM2 as a Target for Cancer Treatment

DOI: 10.31038/CST.2024924

Abstract

TREM2 is a receptor that interacts with a diverse range of ligands, many of which are characteristic indicators of tissue injury. TREM2 activity is limited to a few specific areas in physiological, but in pathological conditions, the TREM2 pathway becomes crucial for detecting tissue damage and preventing its spread. The TREM2 receptor is a crucial signaling hub in myeloid cells that is activated in response to tissue damage. It plays a key role in immune reprogramming. Studies have demonstrated that TREM2 is involved in regulating immunosuppressive, phagocytosis, survival, and healing functions in myeloid cells associated with neurodegenerative and metabolic pathologies. Although the significance of TREM2 in various diseases is well recognized, there is a lack of study on the relationship between TREM2 and human malignancies. Hence, our understanding of the connection between TREM2 and cancer is currently limited. In this study, we conduct a comprehensive analysis of TREM2 in several datasets including Protein Alta, Blood Alta, The Cancer Genome Atlas (TCGA), and single cell RNA Alta. We investigate the expression of TREM2, analyze its clinical aspects, and perform survival analysis on a variety of cancer patients. This study provides valuable insights into the potential of targeting TREM2 for cancer treatment in the future.

Keywords

TREM2; Pan cancer; Immune Evasion; Lipid Metabolism; Prognosis

Introduction

Recently, the scientific community has focused on the significant functions of myeloid cells in several diseases. Triggering receptor expressed on myeloid cells-2 (TREM2) has been identified as a crucial immunological signaling hub that is activated in these diseases [1- 6]. Scientists and biotechnology businesses are working towards activating TREM2 to induce microglia to engulf and eliminate amyloid-beta (Ab) plaques. The effectiveness of these strategies, currently being evaluated as a therapy for neurodegenerative disease [7,8], may also extend to autoimmune diseases and obesity-related comorbidities [6,9]. For instance, in conditions like atherosclerosis, where TREM2+ macrophages encircle aortic plaques, reactivating these macrophages can promote the engulfment of plaques and regulate inflammation [10]. TREM2 functions by suppressing NF- kappa-B signaling upon exposure to lipopolysaccharide. It enhances phagocytosis [11], reduces the production of pro-inflammatory cytokines and nitric oxide [12], prevents apoptosis, and increases the expression of IL10 and TGFB [13]. During periods of oxidative stress, it enhances the activation of anti-apoptotic NF-kappa-B signaling and ERK signaling [14]. The fundamental concept behind these tactics is to amplify TREM2 signaling through the use of agonistic drugs in order to augment the reparative functions of macrophages and microglia.

In addition to being expressed on immunosuppressive myeloid cells [15-18], there have been reports indicating that tumor cells also express TREM2 [19,20]. TREM2 expression on tumor cells may contribute to the formation of an immunosuppressive and pro-growth niche, working in coordination with myeloid cells for immune inhibition. As a result, T cell infiltration is excluded [21] and the efficacy of immune checkpoint inhibitors is downregulated [21]. Tumor cells also affect, influence, and educate myeloid cells, which in turn favor tumor growth. This interaction creates a cooperative and immunosuppressive environment. The expression and activities of TREM2 on microglia cells have been well elucidated [8,17,22]. Zhang et al. demonstrated that the levels of TREM2 mRNA and protein expression were markedly elevated in gastric cancer samples compared to normal gastric tissues [20,23]. However, they did not attribute the expression of TREM2 to any specific cell type. TREM2 has been proposed as a potential target in glioma and hepatocellular carcinoma. Studies have demonstrated that increased expression of TREM2 is linked to progression and advanced stage of tumors in these types of cancer [24,25].

In this research article, we hypothesized that the expression of TREM2 on tumor cells holds significant implications for tumor treatment and prognosis. Here we present a comprehensive analysis of TREM2 expression across many types of malignancies and normal tissues, with a focus on pan cancer. Our data shows that TREM2 has significant upregulation in various cancer types, particularly in metastatic tumors. Moreover, elevated levels of TREM2 are indicative of unfavorable prognosis outcomes in patients’ overall survival of many tumor types.

Results

TREM2 has Differential Expression Among Tissue Types and Cell Lines

Firstly, we made an all-tissue types expression analysis of TREM2 (Figure 1A). The Consensus Normalized expression (NX) levels were derived by integrating data from three transcriptomics datasets (HPA, GTEx, and FANTOM5) using an internal normalization workflow. These data include in total 55 tissue types and 6 blood cell types. The color-coding system is established according to tissue groups, which are composed of tissues that share similar functional characteristics. The color-coding system is established according to tissue groups, which are composed of tissues that share similar functional characteristics. We found that adipose tissue has the highest degree of TREM2 positivity, followed by brain, and lung, which is in accordance with the knowledge that TREM2 functions for lipid metabolism and M2 type macrophage functions.

Secondly, we wanted to know whether TREM2 are also expressed by blood cell types. The transcript expression levels obtained from the internal normalization pipeline for 18 blood cell types and total peripheral blood mononuclear cells (PBMC) are referred to as Normalized expression (NX). The color-coding system is determined by the lineage of blood cell types, which includes B-cells, T-cells, NK- cells, monocytes, granulocytes, dendritic cells, and total PBMC. An overview of the single cell RNA (NX) data encompassing all sorts of single cells. The process of color-coding involves categorizing cells into groups depending on their functional properties. Cell type analysis shows that Hoffbauer cells have the highest expression of TREM2, followed by Kupffer cells, blood and immune cells, monocytes (Figure 1B). The RNA expression summary provides a consensus of RNA data based on normalized expression (NX) data from three distinct sources: internally generated Human Protein Atlas (HPA) RNA-seq data, RNA-seq data from the Genotype-Tissue Expression (GTEx) project, and CAGE data from the FANTOM5 project.

In order to have a more detailed information of TREM2 expression among different cell types, we made a heatmap to show TREM2 expression in different cell types including B cells, macrophages, neutrophils, T cells and NK cells. Cell type markers were represented by the logarithm of transcripts per million (log(pTPM)) and their corresponding z-scores. The heatmap in this section displays the expression of the currently selected gene (at the top) and well-established markers for different single cell type clusters in this tissue. The left panel displays the cell type with which each marker is connected. The process of color-coding involves grouping cell types based on their shared functional properties (Figure 1C).

The concept of a Z-score involves transforming a variable so that its standard deviation becomes 1 and its mean becomes 0. Therefore, comparing all the genes is simplified due to their shared center and spread (Figure 1).

fig 1

Figure 1: TREM2 has differential expression among tissue types and cell lines. A Pan-tissue type expression analysis of TREM2, different tissue types have a differential expression of TREM2, with adipose has the highest TREM2 expression, followed by brain, and lung. We integrate data from three transcriptomics datasets (HPA, GTEx, and FANTOM5) using an internal normalization workflow. These data include in total 55 tissue types. B TREM2 are also expressed by blood cell types. We showed the transcript expression levels obtained from the internal normalization pipeline for 18 blood cell types. Hoffbauer cells have the highest expression of TREM2, followed by Kupffer cells, blood and immune cells, monocytes. C Heatmap analysis to show TREM2 expression in different cell types including B cells, macrophages, neutrophils, T cells and NK cells.

TREM2 are Highly Expressed by a Variety of Tumors

There are some studies which indicates that TREM2 are expressed by tumor cells. In order to have a more comprehensive idea of TREM2 expression on a variety of tumor types, we made a pan-cancer analysis of TREM2 expression among tumors and normal counterparts. We find that TREM2 are much highly expressed by tumors than the normal counterparts (Figure 2A). The pan-cancer analysis page presents the spectrum of gene expression for TREM2 gene across all tissues, utilizing RNA Seq data obtained from both normal and cancerous tissues. Mechanically, TREM2 promote tumor growth by upregulating PI3K-mTOR. We thus made a correlation between TREM2 and MTOR (Figure 2B). Compared with normal tissues, tumor cells have higher TREM2 and MTOR, supporting the idea that TREM2 facilitate tumor growth by upregulating MTOR and anabolic process.

Metastatic tumors differ from the original tumor site in many ways, usually the metastatic tumor cells are more aggressive and had high capacity for invasion and migration [26,27]. However, whether TREM2 plays a role in tumor metastasis is not clear. We made a comparison of TREM2 gene RNA expression level among normal, tumor and metastatic tumors (Figure 2C-2K). For all tumor types, the metastatic tumor has the highest level of TREM2, compared with the original tumor site, while the normal tissue has the lowest TREM2 RNA level. The Normal, Tumor, and Metastatic analysis offers comprehensive analysis of TREM2 in a specific tissue type utilizing gene chip-based data. Figure 2C-2K are esophageal squamous cancer, skin cancer, ovarian cancer, prostate cancer, thyroid cancer, colon cancer, kidney renal cancer, breast cancer, pancreatic ductal cancer (Figure 2).

fig 2

Figure 2: TREM2 are highly expressed by a variety of tumors. A Pan-cancer analysis of TREM2 expression among tumors and normal counterparts. The pan-cancer analysis page presents the spectrum of gene expression for TREM2 gene across all tissues, utilizing RNA Seq data obtained from both normal and cancerous tissues. In most tumors, TREM2 is higher than normal tissues. B Correlation analysis between TREM2 and MTOR shows a positive correlation between the two genes, supporting the idea that TREM2 facilitate tumor growth by upregulating MTOR and anabolic process. C-K TREM2 expression in normal, tumor, and metastatic parts. From C-K they are esophageal squamous cancer, skin cancer, ovarian cancer, prostate cancer, thyroid cancer, colon cancer, kidney renal cancer, breast cancer, pancreatic ductal cancer.

TREM2 has Different Staining Intensity Among Tumors

Although tumor cells usually have higher TREM2 expression level than the normal tissues, there are still some differential TREM2 staining intensity on tumor samples, and we classified them into negative, moderate, and strong. A selection of four standard cancer tissue samples that are representative of the overall staining pattern summarizes antibody staining in 20 distinct malignancies.

We get the TREM2 protein expression data from the Human Protein Atlas, from the immunohistochemical staining results of 4 types of tumors, we can see that tumors exhibit a differential staining intensity of TREM2 (Figure 3A-3D). Moderate cytoplasmic positivity was observed in malignant cells. Numerous cases of breast and colorectal cancer were significantly stained with TREM2 antibody. Several cases exhibited additional membranous positivity.

The percentage of patients (maximum 12 patients) with high and median protein expression levels is indicated by color-coded bars for each cancer. The cancer varieties are color-coded based on the type of normal organ from which they originate (Figure 3).

fig 3

Figure 3: TREM2 has different staining intensity among tumors. All IHC data are from the Human Protein Atlas. A Immunohistochemical staining of TREM2 protein in breast tumor, from left, middle, right they are negative, moderate, and strong TREM2 staining. B Immunohistochemical staining of TREM2 protein in lung squamous carcinoma, from left, middle, right they are negative, moderate, and strong TREM2 staining. C Immunohistochemical staining of TREM2 protein in prostate cancer, from left, middle, right they are negative, moderate, and strong TREM2 staining. D Immunohistochemical staining of TREM2 protein in hepatocellular carcinoma, from left, middle, right they are negative, moderate, and strong TREM2 staining.

High TREM2 Indicates Short Overall Survival in Many Cancer Types

The Survival Scatter plot displays the clinical outcome (i.e., whether the individual is deceased or alive) for all people in the patient cohort, using the same data as the related Kaplan-Meier plots. The x-axis displays the expression levels (FPKM) of the studied gene in the tumor tissue during the initial diagnosis. The y-axis represents the duration of time that has passed since the diagnosis, measured in years. Patients were categorized into two categories, namely “low” (below the cut-off point) or “high” (above the cut-off point), based on their degree of expression (Figure 4A-4H). Figure 4A-4H are breast cancer, esophageal squamous cancer, head and neck cancer, kidney renal cancer, lung adenocarcinoma, pancreatic ductal cancer, stomach adenocarcinoma, testicular germ cell tumor. This survival analysis indicated that high TREM2 expression of tumor cells could predict poor prognosis and short overall survival of patients for many cancer types. The x-axis represents the time of surviving in years, whereas the y-axis represents the likelihood of survival. They present a summary of the link between mRNA expression level and patient survival using Kaplan-Meier plots.

Both axes are accompanied with kernel density curves that illustrate the density of the data along the axes. The density map on the right displays the distribution of data density for the years of survival of deceased patients with both high and low expression levels. The data is divided based on the cutoff indicated by the vertical dashed line in the Survival Scatter plot (Figure 4).

fig 4

Figure 4: High TREM2 indicates short overall survival in a variety of tumor types. Kaplan-Meier plots analysis of TREM2 expression and patients’ overall survival. Patients were categorized into two categories, namely “low” (below the cut-off point) or “high” (above the cut-off point), based on their degree of expression. From A-D are breast cancer, esophageal squamous cancer, head and neck cancer, kidney renal cancer. From E-H are lung adenocarcinoma, pancreatic ductal cancer, stomach adenocarcinoma, testicular germ cell tumor.

Discussion

TREM2 gene is responsible for encoding an innate immune receptor that belongs to the immunoglobulin family [28]. In humans, this gene is located on chromosome 6, while in mice, it is positioned on chromosome 17 [28]. TREM2 is present on macrophages, dendritic cells, osteoclasts, and microglia [29,30]. The ligands that bind to TREM2 include ApoE, phosphatidylserine, sphingomyelin, Aβ, dead neurons, and damaged myelin [2,31]. TREM2 associates with the adaptor protein TyroBP or DAP12 to create a signaling complex. The process of ligand binding to TREM2 initiates phagocytosis and chemotaxis, while also exerting a negative regulatory effect on TLR- induced inflammatory responses [32,33]. Microglia create a network that covers the central nervous system (CNS) and perform functions such as sensing, maintaining the environment, and protecting against harmful internal and external stimuli. This helps prevent long-lasting inflammation in the brain, which can lead to damage and degeneration of nerve cells [22,34]. The extracellular domain of TREM2 can be secreted as a soluble protein known as sTREM2 (soluble TREM2). The levels of sTREM2 rise with age and under pathological situations.

Microglia lacking the TREM2 protein exhibit heightened autophagy in a mouse model of Alzheimer’s disease [35]. The absence of TREM2 inhibited mTOR activation and triggered compensatory AMPK and ULK1 activation, as well as autophagy, in BMDMs when faced with metabolic stress [36]. The integration of metabolic and RNA-seq data analysis uncovered abnormalities in metabolites and enzymes associated with glycolysis, TCA cycle, and pentose phosphate pathway in TREM2–/– BMDMs.

In contrast to AD, cancer presents a contrasting difficulty. TREM2’s pro-inflammatory and immunosuppressive effects have a negative impact, facilitating tumor development and evasion of the immune system [18]. The approach in cancer treatment involves inhibiting the signaling of TREM2 or removing TREM2+ myeloid cells from the tumor microenvironment. This enables the reactivation of the T cell driven immune response against the tumor. Utilizing anti-TREM2 antibody-dependent cellular cytotoxicity (ADCC) or monoclonal antibodies that function as TREM2 antagonists to reverse the immune-suppressive milieu of myeloid cells is a prominent and promising approach in cancer immunotherapy. Shi- Ting Li discovered that the expression of TREM2 was considerably higher in glioma tissues compared to non-tumorous brain tissues. Moreover, the expression of TREM2 exhibited a strong correlation with the pathological grade and overall survival of glioma patients [17].

CD8+ cytotoxic T lymphocytes play a crucial role in regulating tumor growth by eliminating cancer cells that display major histocompatibility complex class I molecules. Nevertheless, there is a communication of immune suppression occurring between cancer cells and other cell types present in the tumor microenvironment (TME), including cancer-associated fibroblasts, regulatory T cells, and M2-polarized macrophages. This communication leads to the inhibition of the immune response carried out by CD8+ T cells. Analysis of human tumor samples from various primary carcinomas, such as skin, liver, lung, breast, bladder, colon, stomach, pancreas, and kidney, has revealed the presence of TREM2+ macrophages in 75% of the samples. This suggests that TREM2 expression may play a role in the development of an immunosuppressive phenotype. TREM2 promotes phagocytosis and decreases the release of pro- inflammatory cytokines by macrophages, hence playing a role in regulating the immune response during infection. Existing evidence indicates that the expression of TREM2 on cells of the monocyte- macrophage lineage may have an immunoregulatory function in cancer by promoting an immunosuppressive environment [21].

TREM2 is expressed by many cell types present in the tumor microenvironment (TME). TREM2 may possess tumor cell intrinsic capabilities, in addition to its role in stromal cells and fibroblasts, that can either suppress or promote tumor growth, depending on the specific kind of cancer. Hence, it is crucial for us to gain a deeper comprehension of the processes by which TREM2 influences tumor suppression or oncogenic behavior in various cancer types.

The inhibition of TREM2 in the U87 and U373 glioma cell lines led to a substantial decrease in cell proliferation, migration, and invasion. The absence of TREM2 in glioma resulted in a notable upregulation of cleaved caspase 3 and Bax, accompanied by a downregulation of Bcl2, MMP2, MMP9, CXCL10, and CXCR3.

Our work unveils a universal expression of TREM2 by many tissues and cell types, by tumor cells and especially metastatic tumors. Furthermore, high expression of TREM2 is often indicative of short overall survival for many cancer types. Tumors with high TREM2 usually have high MTOR activity and hence promote tumor growth in this way. By gaining more knowledge about the signaling pathway, the genes that are affected by it, and the regulators of TREM2 expression, we may discover new targets and different approaches by targeting TREM2.

Availability of Data and Materials

The data generated in the current study can be obtained from the corresponding author at 109274952@qq.com.

Authors’ Contributions

Ruimin Wang and Rui Wang were responsible for the conception and design. Yuan Fang and Jingqiu Zhang conducted the data analysis and interpretation. Ruimin Wang composed the manuscript, which was subsequently revised by Jingqiu Zhang. The final manuscript was approved by all authors who read and reviewed it.

Acknowledgement

None

Grant Support

Rui Wang is sponsored by the China Scholarship Council (202206920039). The research received financial support from the Natural Science Foundation of Suqian Science and Technology Bureau (K201903, Z2018076, Z2018213, and Z2022065). Jiangsu Association for Science and Technology (JSTJ-2022-004).

Patient Consent for Publication

Not applicable

Competing Interests

The authors indicated no potential conflicts of interest.

References

  1. Xiong D, Y Wang and M You (2020) A gene expression signature of TREM2hi macrophages and γδ T cells predicts immunotherapy response. Nature Communications 11(1) [crossref]
  2. Hsieh CL (2009) A role for TREM2 ligands in the phagocytosis of apoptotic neuronal cells by J Neurochem, 109(4): 1144-56. [crossref]
  3. Wang E (2019) A Subset of TREM2(+) Dermal Macrophages Secretes Oncostatin M to Maintain Hair Follicle Stem Cell Quiescence and Inhibit Hair Cell Stem Cell, 24(4): 654-669.e6. [crossref]
  4. Schlepckow K (2017) An Alzheimer-associated TREM2 variant occurs at the ADAM cleavage site and affects shedding and phagocytic EMBO Mol Med, 9(10): 1356-1365. [crossref]
  5. Wang S (2020) Anti-human TREM2 induces microglia proliferation and reduces pathology in an Alzheimer’s disease J Exp Med, 2020. 217(9) [crossref]
  6. Sharif O (2021) Beneficial Metabolic Effects of TREM2 in Obesity are Uncoupled from its Expression on Macrophages. Diabetes [crossref]
  7. Gisslen M (2019) CSF concentrations of soluble TREM2 as a marker of microglial activation in HIV-1 Neurol Neuroimmunol Neuroinflamm, 6(1): e512. [crossref]
  8. Kiialainen A (2005) Dap12 and Trem2, molecules involved in innate immunity and neurodegeneration, are co-expressed in the Neurobiol Dis, 18(2): 314-22. [crossref]
  9. Liu C (2019) TREM2 regulates obesity-induced insulin resistance via adipose tissue remodeling in mice of high-fat feeding. J Transl Med, 17(1): 300.[crossref]
  10. Endo-Umeda K (2022) Myeloid LXR (Liver X Receptor) Deficiency Induces Inflammatory Gene Expression in Foamy Macrophages and Accelerates Arterioscler Thromb Vasc Biol, 42(6): 719-731.[crossref]
  11. Khantakova D, S Brioschi and M Molgora (2022) Exploring the Impact of TREM2 in Tumor-Associated Macrophages. Vaccines (Basel) 10(6) [crossref]
  12. Sessa G(2004) Distribution and signaling of TREM2/DAP12, the receptor system mutated in human polycystic lipomembraneous osteodysplasia with sclerosing leukoencephalopathy dementia. Eur J Neurosci, 20(10): 2617-28.[crossref]
  13. Yi S,(2020) IL-4 and IL-10 promotes phagocytic activity of microglia by up-regulation of Cytotechnology, 72(4): 589-602. [crossref]
  14. De Veirman K(2019) Myeloid-derived suppressor cells induce multiple myeloma cell survival by activating the AMPK Cancer Lett, 442: 233-241.[crossref]
  15. Daws MR (2001) Cloning and characterization of a novel mouse myeloid DAP12- associated receptor family. Eur J Immunol, 31(3): 783-91. [crossref]
  16. Katzenelenbogen Y (2020) Coupled scRNA-Seq and Intracellular Protein Activity Reveal an Immunosuppressive Role of TREM2 in Cancer. Cell, 182(4): 872-885.e19. [crossref]
  17. Neumann H. and K Takahashi (2007) Essential role of the microglial triggering receptor expressed on myeloid cells-2 (TREM2) for central nervous tissue immune J Neuroimmunol, 184(1-2): 92-9. [crossref]
  18. Nakamura K and MJ Smyth (2020) TREM2 marks tumor-associated Signal Transduct Target Ther, 5(1): 233. [crossref]
  19. Li C (2021) High expression of TREM2 promotes EMT via the PI3K/AKT pathway in gastric cancer: bioinformatics analysis and experimental verification. J Cancer, 12(11): 3277-3290. [crossref]
  20. Zhang X(2018) High TREM2 expression correlates with poor prognosis in gastric Hum Pathol 72: 91-99. [crossref]
  21. Zhang H (2022) Immunosuppressive TREM2(+) macrophages are associated with undesirable prognosis and responses to anti-PD-1 immunotherapy in non-small cell lung cancer. Cancer Immunol Immunother 71(10): 2511-2522. [crossref]
  22. Suarez-Calvet M (2016) Early changes in CSF sTREM2 in dominantly inherited Alzheimer’s disease occur after amyloid deposition and neuronal injury. Sci Transl Med 8(369): 369ra178. [crossref]
  23. Li C (2021) High expression of TREM2 promotes EMT via the PI3K/AKT pathway in gastric cancer: bioinformatics analysis and experimental verification. J Cancer 12(11): 3277-3290. [crossref]
  24. Overexpression of TREM2 enhances glioma cell proliferation and invasion: a therapeutic target in human glioma. [crossref]
  25. Zhou L (2022) Integrated Analysis Highlights the Immunosuppressive Role of TREM2(+) Macrophages in Hepatocellular Front Immunol 13: 848367. [crossref]
  26. Nguye B (2022) Genomic characterization of metastatic patterns from prospective clinical sequencing of 25,000 Cell, 185(3): 563-575.e11. [crossref]
  27. Ndlovu MN (2009) Hyperactivated NF-{kappa}B and AP-1 transcription factors promote highly accessible chromatin and constitutive transcription across the interleukin-6 gene promoter in metastatic breast cancer Mol Cell Biol, 29(20): 5488-504. [crossref]
  28. Deczkowska A, A Weiner and I Amit (2020) The Physiology, Pathology, and Potential Therapeutic Applications of the TREM2 Signaling Pathway. Cell, 181(6): 1207-1217. [crossref]
  29. Paloneva J (2003) DAP12/TREM2 deficiency results in impaired osteoclast differentiation and osteoporotic features. J Exp Med. 198(4): 669-75. [crossref]
  30. Humphrey MB (2006) TREM2, a DAP12-associated receptor, regulates osteoclast differentiation and function. J Bone Miner Res 21(2): 237-45. [crossref]
  31. Ferrara SJ (2021) TREM2 is thyroid hormone regulated making the TREM2 pathway druggable with ligands for thyroid hormone receptor. bioRxiv, [crossref]
  32. Hamerman JA (2006) Cutting edge: inhibition of TLR and FcR responses in macrophages by triggering receptor expressed on myeloid cells (TREM)-2 and J Immunol, 177(4): 2051-5. [crossref]
  33. Hamerman JA (2016) Negative regulation of TLR signaling in myeloid cells— implications for autoimmune diseases. Immunological reviews, 269(1): 212-227. [crossref]
  34. Gratuze M, C Leyns and DM Holtzman (2018) New insights into the role of TREM2 in Alzheimer’s Mol Neurodegener, 13(1): 66.
  35. Li C (2019) TREM2 inhibits inflammatory responses in mouse microglia by suppressing the PI3K/NF-kappaB Cell Biol Int 43(4): 360-372. [crossref]
  36. Ulland TK (2017) TREM2 Maintains Microglial Metabolic Fitness in Alzheimer’s Cell 170(4): 649-663.e13. [crossref]

Application of Meal Replacement in Patients with Type 2 Diabetes

DOI: 10.31038/EDMJ.2024823


Medical nutrition therapy (MNT) is the foundation of standardized diabetes management. According to guidelines, healthcare providers should customize diet plans to align with patients’ personal and cultural values, preferences, and treatment goals to ensure optimal adherence and benefits. Nevertheless, due to the limited medical resources, many patients with type 2 diabetes mellitus (T2DM) could not access to the guidance of MNT. Meal replacement (MR) provides a practical solution for portion control and caloric restriction. It is a commercial pre-packaged selection of foods, which typically consists of a combination of carbohydrates, fats, and proteins with added vitamins and minerals, in the form of milkshakes, nutrition bars, or soup. MR is commonly utilized to replace one or two main meals (partial meal replacement, PMR), or all meals (total meal replacement, TMR) per day. It has been demonstrated to improve dietary quality, weight management, and glycemic control of patients with T2DM [1-4].

Some guidelines recommend diabetic patients to use MR [5,6], but the optimal prescription of MR for patients with T2DM and its applicable objects remain uncertain. A prior meta-analysis explored the role of MR in the management of T2DM, which showed that MR led to significant reductions in body weight, BMI, HbA1c and fasting glucose compared with traditional weight loss diets [4]. However, due to the limited RCT clinical evidence available at that time, the certainty and precision of the effect estimates were restricted. As the evidence has been growing, a more comprehensive analysis of the efficacy and safety of MR, especially investigating the treatment effect of different MR administration manners in patients with different clinical backgrounds, is necessary for more detailed clinical recommendations. Therefore, we conducted a meta-analysis and systematic review with subgroup analyses to provide novel information that helps to guide MR applications in different clinical settings [7].

Overall Effects of MR on Patients with Type 2 Diabetes

A total of 17 randomized controlled trials involving 2112 participants were ultimately included in the study. Compared with conventional diabetic diets (CDs), MR significantly reduced HbA1c (MD -0.46%, P<0.001), fasting blood glucose (FBG, -0.62mmol/L, P<0.001), body weight (-2.43kg, P<0.001) and BMI (-0.65kg/m2, P<0.001), as well as improved other cardiometabolic risk factors. The MR-based dietary pattern further improved the glycemic control and adipose indicators in T2D patients. Our primary findings are similar to previous study and demonstrate the benefits of MR in the management of T2DM. Moreover, due to the increased number of included trials and a larger sample size, we were able to evaluate the impact of various patient characteristics and MR interventions on outcomes through subgroup analysis.

Tailoring MR Strategies for Diabetes Management

There were significant discrepancies in MR prescription and clinical characteristics of the included patients among studies investigating the efficacy of MR in patients with T2DM. For instance, MR was administered for varying duration, prescribed as TMR or PMR, and utilized with or without caloric restriction and exercise. Additionally, these studies included both those involving insulin users and those excluding them, with the minimum BMI criteria ranging from 18.5 kg/m2 to 30 kg/m2. The huge variability in clinical trials is not conducive to the precise utilization of MR. In order to identify who are more suitable for MR interventions, and determine the appropriate MR prescriptions for diverse clinical situations, we performed subgroup analyses in the systematic review and meta-analysis.

TMR vs. PMR

Several studies using TMR had similar interventions methods. The intervention consisted of total meal replacement (800-853 kcal/day MR for about 12 weeks), stepped food reintroduction (2-8 weeks), and structured support for long-term weight loss maintenance. The safety and efficacy of this intervention mode have been validated. Our subgroup analyses revealed that TMR led to greater improvement in HbA1c (-0.72% vs. -0.32%, P=0.01), FBG (-1.45 vs. -0.56mmol/L, P=0.02), body weight (-6.57 vs. -1.58kg, P<0.001), and BMI (-2.78 vs. -0.37kg/m2, P<0.001) than PMR. Therefore, for the purpose of improving both glycemic control and weight management, TMR under the guidance of professional doctors and nutritionist may be a preferred option for patients with T2DM.

MR with or Without Caloric Restriction

Several studies using MR additionally implemented caloric restriction, with restriction levels including 800-850 kcal/d, 500 kcal or a 25% energy deficit, and 20 kcal/kg·d. In our subgroup analyses, MR with caloric restriction showed more reductions in body weight (-3.20 vs. -0.75kg, P<0.001) and BMI (-0.84 vs. -0.24 kg/m2, P=0.003) compared with those without caloric restriction. MR with caloric restriction had a more favorable impact on weight management, highlighting the important role of caloric restriction in the management of T2DM, as emphasized in the guideline [8]. Meal replacement is a viable method to achieve portion control and caloric restriction.

MR and Anti-diabetes Treatment

Insulin

Compared to non-insulin users, patients on insulin are likely to have diabetes of increased severity and may have compromised pancreatic function [9]. Thus, many lifestyle intervention studies excluded patients treated with insulin. Brown et al. conducted a trial involving 90 participants with T2DM who were receiving insulin therapy and had a median duration of diabetes of 13.0 (9.0-20.0) years. They found that these participants achieved greater weight loss, glycemic control and quality of life through TMR intervention. In our subgroup analyses, MR showed comparable benefits in studies that included patients using insulin and those that didn’t (HbA1c -0.42% [-0.67, -0.16] vs. -0.54% [-0.83, -0.25], P=0.53; FBG -0.63 mmol/L [-1.48, 0.21] vs. -0.67 mmol/L [-1.05, -0.30], P=0.93; weight loss -4.23 kg [-7.08, -1.39] vs. -2.52 kg [-3.59, -1.44], P=0.27; BMI -2.36 kg/m2 [-4.49, -0.23] v s. -0.63 kg/m2 [-0.90, -0.36], P=0.11). Our study increases the evidence showing that MR usage is advantageous for both patients treated with or without insulin.

Some studies have reported the impact of MR on insulin treatment. Brown et al. and Kempf et al. have suggested the advantages of MR in terms of insulin discontinuation and reduction of insulin dosage. After one year of intervention, the changes in insulin dose were -47.3 ± 36.4U/day and -16.6 ± 33.6U/day in the MR intervention group in the two studies, compared to -33.3 ± 52.9 U/day and -1.4 ± 25.2 U/day in the control group, respectively [10,11]. But Shirai et al. did not observe significant difference in insulin discontinuation or reduction of insulin dose after a 24-week PMR intervention [12].

Oral Anti-diabetic Drugs

Besides, MR interventions have been reported to significantly reduce the use of oral anti-diabetes drugs [13-15], among which sulfonylureas were reported most frequently [10,12,16]. When using intensive MR intervention, such as TMR, it is advisable to presciently reduce the dose of anti-diabetes drugs, avoiding the occurrence of hypoglycemic events.

Overall, individuals on anti-diabetic drugs can safely use meal replacements, potentially reducing therapy intensity. However, high-quality trials are needed due to variability in previous studies.

MR and the Remission of T2DM

Recent studies indicated that MR, as part of lifestyle intervention, also holds significant potential in reversing T2DM. The DiRECT used TMR (825-853 kcal/day formula diet for 3-5 months), stepped food reintroduction and structured support for long-term weight loss maintenance. Diabetes remission rates was 46% at 1 year [14] and over 30% at 2 years [17]. The DIADEM-I trial adopted a dietary strategy similar to DiRECT, achieving 61% remission at 1 year [15]. These findings are clinically important as they demonstrated that MR, as part of intensive lifestyle intervention, is feasible in inducing T2DM remission in community settings.

Conclusion

MR holds a significant position in the medical nutrition therapy for patients with T2DM. The challenge of its application lies in tailoring MR interventions to suit individual characteristics. Current data suggests that appropriate calorie restriction and TMR may yield greater benefits, while both patients treated with or without insulin could similarly benefit from MR usage. Nonetheless, MR and structured support may be challenging for some patients, and long-term adherence to MR and lifestyle changes may be difficult to maintain. The current studies have laid the groundwork for personalized MR strategies, but more clinical studies are needed to ultimately refine the precise and effective MR utilization in the management of T2DM.

References

  1. Astbury NM, Piernas C, Hartmann-Boyce J, Lapworth S, Aveyard P, Jebb SA (2019) A systematic review and meta-analysis of the effectiveness of meal replacements for weight loss. Obes Rev 20(4): 569-587. [crossref]
  2. Thom G, Lean M (2017) Is There an Optimal Diet for Weight Management and Metabolic Health? Gastroenterology 152(7): 1739-1751. [crossref]
  3. Egger G (2006) Are meal replacements an effective clinical tool for weight loss? Med J Aust 184(2): 52-53. [crossref]
  4. Noronha JC, Nishi SK, Braunstein CR, et al. (2019) The Effect of Liquid Meal Replacements on Cardiometabolic Risk Factors in Overweight/Obese Individuals With Type 2 Diabetes: A Systematic Review and Meta-analysis of Randomized Controlled Trials. Diabetes Care 42(5): 767-776. [crossref]
  5. Draznin B, Aroda VR, Bakris G, et al. (2022) 8. Obesity and Weight Management for the Prevention and Treatment of Type 2 Diabetes: Standards of Medical Care in Diabetes-2022. Diabetes Care 45(Suppl 1): S113-S124. [crossref]
  6. Garber AJ, Handelsman Y, Grunberger G, et al. (2020) Consensus Statement by the American Association of Clinical Endocrinologists and American College of Endocrinology on the Comprehensive Type 2 Diabetes Management Algorithm. Endocr Pract 26(1): 107-139. [crossref]
  7. Ye W, Xu L, Ye Y, et al. (2023) . Efficacy and Safety of Meal Replacement in Patients With Type 2 Diabetes. J Clin Endocrinol Metab 108(11): 3041-3049. [crossref]
  8. Evert AB, Dennison M, Gardner CD, et al. (2019) Nutrition Therapy for Adults With Diabetes or Prediabetes: A Consensus Report. Diabetes Care 42(5): 731-754.
  9. Goldenberg JZ, Day A, Brinkworth GD, et al. (2021) Efficacy and safety of low and very low carbohydrate diets for type 2 diabetes remission: systematic review and meta-analysis of published and unpublished randomized trial data. BMJ [crossref]
  10. Brown A, Dornhorst A, McGowan B, et al. (2020) Low-energy total diet replacement intervention in patients with type 2 diabetes mellitus and obesity treated with insulin: a randomized trial. BMJ Open Diabetes Res Care 8(1) [crossref]
  11. Kempf K, Altpeter B, Berger J, et al. (2017) Efficacy of the Telemedical Lifestyle intervention Program TeLiPro in Advanced Stages of Type 2 Diabetes: A Randomized Controlled Trial. Diabetes Care 40(7): 863-871. [crossref]
  12. Shirai K, Saiki A, Oikawa S, et al. (2013) The effects of partial use of formula diet on weight reduction and metabolic variables in obese type 2 diabetic patients–multicenter trial. Obesity research & clinical practice 7(1): e43‐54. [crossref]
  13. Cheskin LJ, Mitchell AM, Jhaveri AD, et al. (2008) Efficacy of meal replacements versus a standard food-based diet for weight loss in type 2 diabetes – A controlled clinical trial. Diabetes Educator 34(1): 118-127. [crossref]
  14. Lean MEJ, Leslie WS, Barnes AC, et al. (2017) Primary care-led weight management for remission of type 2 diabetes (DiRECT): an open-label, cluster-randomised trial. Lancet. [crossref]
  15. Taheri S, Zaghloul H, Chagoury O, et al. (2020) Effect of intensive lifestyle intervention on bodyweight and glycaemia in early type 2 diabetes (DIADEM-I): an open-label, parallel-group, randomised controlled trial. Lancet Diabetes Endocrinol 8(6): 477-489. [crossref]
  16. Li Z, Hong K, Saltsman P, et al. (2005) Long-term efficacy of soy-based meal replacements vs an individualized diet plan in obese type II DM patients: relative effects on weight loss, metabolic parameters, and C-reactive protein. Eur J Clin Nutr 59(3): 411-418. [crossref]
  17. Lean MEJ, Leslie WS, Barnes AC, et al. (2019) Durability of a primary care-led weight-management intervention for remission of type 2 diabetes: 2-year results of the DiRECT open-label, cluster-randomised trial. Lancet Diabetes Endocrinol 7(5): 344-355. [crossref]
fig 1

Prevalence and Associated Factors of Neonatal Hypoglycemia among Neonates Admitted to Neonatal Intensive Care Units in Northwest Amhara Region Comprehensive Specialized Hospitals, Northwest Ethiopia, 2022

DOI: 10.31038/EDMJ.2024822

Abstract

Introduction: Neonatal hypoglycemia is a metabolic problem characterized by decreased in blood glucose. It is the leading cause of neonatal mortality and is associated with multiple factors associated with neonatal hypoglycemia. However, there are limited studies on the prevalence and factors associated with neonatal hypoglycemia in the study area.

Objective: This study aimed to assess the prevalence and associated factors of neonatal hypoglycemia among neonates admitted to neonatal intensive care units in Northwest Amhara Region Comprehensive Specialized Hospitals, Northwest Ethiopia, in 2022.

Method: An institutional-based cross-sectional study was carried out among 497 neonates admitted to neonatal intensive care units in Northwest Amhara Region Comprehensive Specialized Hospitals from October 3, 2022 to November 3, 2022. A systematic random sampling technique was used to select study participants. Data were collected through maternal interviews using structured questionnaires and neonatal chart reviews using checklists. Finally, the data were entered into Epi-Data version 4.6.0.6 and analyzed using STATA version 14.0. Descriptive statistics were used to summarize the variables. Both bi-variable and multi-variable logistic regression models were used for the analysis. AOR and 95% CI were used to measure association and strength, with statistical significance assessed at a p-value <0.05

Results: The prevalence of neonatal hypoglycemia in the study area was 27.2% with 95%CI (23.4-31.4%). In this study variables such as maternal age 20-35 years [(AOR: 0.35, (95%CI: 0.167-0.73)], preterm birth [(AOR=2.60, 95%CI: 1.07-6.36)], low birth weight [(AOR: 3.07, 95%CI: 1.26-7.46)] and hypothermia [(AOR: 2.58, 95%CI: 1.27-5.23)], were factors associated with neonatal hypoglycemia.

Conclusions and recommendations: The prevalence of neonatal hypoglycemia in the neonatal intensive care unit of the northwest Amara region is relatively high. Preterm, low birth weight and hypothermia were significant factors for neonatal hypoglycemia. It is better for neonatal care providers in neonatal intensive care units to prioritize premature newborns or those with low birth weight and to follow the warm chain protocol.

Keywords

Hypoglycemia, NICU, Prevalence

Background

The term “hypoglycemia” refers to a low blood glucose level [1]. Neonatal hypoglycemia is defined as a blood glucose level of less than 40 mg/dL (2.2 mmol/L) [2]. It can be transient or persistent, and most cases of neonatal hypoglycemia are transient and respond simply to treatment, with a good prognosis [3]. The numerical explanation of neonatal hypoglycemia remains controversial [4]. Neonatal hypoglycemia is the most common metabolic problem observed in neonatal intensive care units [5].

In developing countries, the overall prevalence of neonatal hypoglycemia is 5%-15% of all babies [6]. In Sub-Saharan Africa, neonatal hypoglycemia affects (11%-30.5%) in all newborns [7-9]. Neonatal mortality is highest in South Asia and Sub-Saharan Africa (SSA) with mortality rates (NMR) of 24, and 27 deaths per 1,000 live births respectively, and hypoglycemia is a contributing factor [10,11]. Studies have found that neonates with hypoglycemia had higher mortality than neonates with normoglycemic [12-14].

Ethiopia ranks among the top countries with the highest number of neonatal deaths and has made little progress in lowering the neonatal mortality rate (NMR), According to the 2019 Ethiopian Demographic Health Survey (EDHS), NMR in Ethiopia was 33 /1000 live births [15]. Neonatal hypoglycemia is the most significant contributor to neonatal mortality [16]

Severe, prolonged hypoglycemia in the neonatal period can have devastating outcomes, including apnea, irritability, lethargy, seizures, long-term neurodevelopmental disabilities, cerebral palsy, and death. Neonates with persistent hypoglycemia have significantly higher rates of morbidity and mortality and 25 to 50% have developmental disabilities [17,18].

Direct costs attributable to the acute management of neonatal hypoglycemia can be large, particularly if the infant is admitted to the neonatal intensive care unit [19]. Both healthcare-related costs and the impact on quality of life due to, the long-term outcomes of neonatal hypoglycemia accrue over the lifetime of neonates [20]. Neonates who experienced neonatal hypoglycemia had a combined discounted hospital and post-discharge cost greater than neonates without hypoglycemia [21]

Various studies have shown that certain variables are associated with neonatal hypoglycemia, including premature infants; small for gestational age (SGA); large for gestational age (LGA); post-maturity; twins; infants of diabetic mothers; infants born to mothers who receive high-glucose infusion before delivery, delayed initiation of feeding, perinatal asphyxia, sex of the baby, meconium aspiration syndrome, and respiratory distress syndrome(RDS) [7,9,22,23].

There are limited studies in Ethiopia on the prevalence and factors associated with neonatal hypoglycemia among newborns admitted to the neonatal intensive care unit in the Northwest Amhara Region Comprehensive Specialized Hospitals. Although the Ethiopian national guidelines recommend early initiation of breastfeeding and prevention of hypothermia at birth to prevent hypoglycemia due to maternal, neonatal, and institutional problems, delays in feeding initiation and hypothermia are major problems observed among neonates admitted to NICUs [24]. Therefore this study aimed to determine the prevalence of neonatal hypoglycemia and identify the factors associated with neonatal hypoglycemia among newborns admitted to the neonatal intensive care unit in the Northwest Amhara Region Comprehensive Specialized Hospitals.

Methods and Materials

Study Design, Period, and Setting

An institution-based cross-sectional study was conducted from October 3, 2022, to November 3; 2022. This study was conducted in the Northwest Amhara region’s comprehensive specialized hospital, in Northwest Ethiopia. The Amhara region is the second-largest and most populous Region in Ethiopia with a total population of a 31 million [25]. In the Northwest Amhara region, there are five comprehensive specialized hospitals (CSH). These were the University of Gondar CSH, Felege Hiwot CSH, Tibebe Ghion CSH, Debre Tabor CSH, and Debre Markos CSH. The UoGCSH is located in the town of Gondar. Although neonatal hospitalization varies, this hospital has an average annual admission of 4560 and an average monthly admission of 380 neonates. Felege Hiwot and Tibebe Ghion CSH were found in Bahir Dar. These hospitals have an average annual neonatal admission of 1836 and 1920 neonates, and an average monthly admission of 153 and 160, respectively. Debre Tabor CSH, which is found in Debre Tabor town, has an average annual neonatal admission of 1560, and an average monthly admission of 130. Debre Marko’s CSH was found in the town of Debre Marko’s. This hospital has 1692 annual neonatal admissions; an average monthly admission of 141. These hospitals have NICUs with a mix of health professionals (neonatal and comprehensive nurses, general practitioners, pediatricians, and other staff). The major services in the NICU include general neonatal care services, blood and exchange transfusions, phototherapy, and ventilation support such as continuous positive air pressure.

Population Selection and Participation

The source population consisted of all neonates and their mothers who were admitted to the neonatal intensive care unit of the Northwest Amhara Region Comprehensive Specialized Hospitals. All neonates with their mothers who were admitted to the neonatal intensive care units during the study period comprised the study population. All neonates with their mothers who were admitted to the neonatal intensive care unit during the time of data collection were included in the study. Neonates whose mothers were critically ill, abandoned neonates and neonates with incomplete charts during the data collection period were excluded from the study.

Sample Size Determination and Sampling Procedures

For the first objective, the sample size was calculated by using a single population proportion formula taking the prevalence of neonatal hypoglycemia at 25% in St. Paul Hospital [9]

for 1

P=proportion hypoglycemia=25%

d = margin of error 4%

Z α/2= the corresponding Z score of 95% CI=1.96

n = Sample size.

By adding a 10% non-response rate, a total of 497 participants were included in the study.

For the second objective, the sample size was calculated using the double proportion formula by considering significant factor variables (Table 1).

Table 1: Sample size calculation by factors for the second objective. Data were collected through a review of the neonate’s medical chart it is not experiments on humans and/or the use of human tissue samples.

Neonatal Hypoglycemia

Variables

P1 P2 Power OR

Sample size

Prematurity

66%

22.89% 80% 6.537(26) 55

Low birth weight

24.3% 9.75% 80% 2.979(26)

258

Finally, the largest sample size which is obtained by the first objective (497) was taken.

Sampling Technique and Procedure

In the Northwest Amhara region, there were five comprehensive specialized hospitals: UoGCSH 380/month, FHCSH 153/month, TGCSH 160/month, DTCSH 130/month, and DMCSH has 141/month. In total, 964 neonates and their mothers were admitted to the hospital from October 3, 2022, to November 3, 2022. Based on the final calculated sample size proportional allocation was performed for each hospital. Systematic random sampling was used in this study. The k interval was determined (964/497; K = 2). After determining the Kth interval, the first neonates with mothers were selected randomly, and then based on the bed number of the neonates every other two neonates with mothers were selected using a systematic sampling technique.

Study Variables and Their Measurements

The outcome variable was the prevalence of neonatal hypoglycemia among neonates admitted to the neonatal intensive care unit. The independent variables were as follows: 1. socio-demographic factors (maternal age, residency, marital status, educational status and maternal occupation); 2. Obstetric factors (ANC follow-up, parity, mode of delivery, duration of labor, place of delivery, number of current pregnancies) 3. Maternal factors (DM, pregnancy-induced hypertension, preeclampsia, eclampsia, maternal HIV/AIDS, maternal drugs) 4. Neonatal factors (sex, gestational age, age at admission, birth weight, weight for gestational age, time of initiation of feeding, perinatal asphyxia (PNA), temperature, respiratory distress syndrome (RDS), sepsis, meconium aspiration syndrome)

Neonatal Hypoglycemia

A baseline or first blood glucose measurement value of less than 40 mg/dl in neonates [27].

Hypothermia

A baseline axillary body temperature below 36.5°C [28].

Perinatal Asphyxia

Apgar score of less than 7 in the 5th minute.

Macrosomia

Birth weight of 4000 grams and above.

Neonatal Respiratory Distress Syndrome

Diagnosed based on the presence of one or more of the following signs: an abnormal respiratory rate, expiratory grunting, nasal flaring, chest wall recessions, and thoracoabdominal asynchrony with or without cyanosis [29], and Physician diagnosis.

Pregnancy-induced Hypertension

Blood pressure greater than 140/90 mm Hg occurring after the 20th week of pregnancy or during the first 24 hours postpartum without evidence of proteinuria.

Preeclampsia

New-onset hypertension with proteinuria with or without edema.

Eclampsia

It is the development of convulsions coma or both in the clinical setting of preeclampsia.

Small for Gestational Age

It is related to birth weight and gestational age if the birth weight is less than the 10th percentile [28]

Large for Gestational Age

It is related to birth weight and gestational age if the birth weight is greater than the 90th percentile [28]

Incomplete Chart

Charts with one of the following factors are missed (gestational age, birth weight, neonatal age, parity, place of delivery, body temperature, maternal age and type of pregnancy, and random blood glucose level.

Data Collection Tool and Procedure

The data were collected using interviewer-administered and chart review through structured, pretested questionnaires that were adapted from a questionnaire developed from previous studies [9,20,23,28,31,42]. The questionnaire contains four sections: The first section contains five questions regarding the socio-demographic characteristics of the mothers. The second section contains six questions regarding the obstetric characteristics of the mothers; the third section contains six questions regarding maternal-related characteristics, and the fourth section contains eleven questions related to neonatal-related characteristics. The data were collected by five BSc nurses who worked in a neonatal intensive care unit and supervised by four MSc nurse professionals. Primary data was collected through structured questionnaires by using interviews, and secondary data were collected through a review of the neonate’s medical chart by using checklists to take the baseline neonatal characteristics such as blood glucose, body temperature, and birth weight.

Data Quality Assurance

To ensure the quality of the data, a pretest was given among 5% (25) neonates with their mothers at Dessie CSH. The training was given to all data collectors and supervisors on the purpose of the study, how to get informed consent, and the technique of selecting the study participants from the neonatal intensive care unit. The data was further assured through careful planning and translation of the questionnaire; the English version was translated into the local language, Amharic. To maintain the validity of the tool, its content was reviewed by senior pediatric and child health specialist nurses and instructors. Then the questions were checked for clarity, completeness, consistency, sensitivity, and ambiguity. The completeness of the collected data was checked onsite daily during data collection and received prompt feedback from the supervisor and the principal investigator. All completed data collection forms were examined for completeness and consistency during data management, storage, cleaning, and analysis.

Data Processing and Analysis

Data were checked, coded, and entered into Epi-Data version 4.6.0.6 and exported to STATA version 14 for analysis. Descriptive statistics were carried out using the mean, frequency, percentage, proportion, tables, and figures to present the findings. The outcome variable was dichotomized and coded as 0 and 1, representing those who are not hypoglycemia and hypoglycemia, respectively. Pearson rank chi-square assumption fulfillment was checked for categorical variables. An adjusted odd ratio (AOR) with a 95% CI was used to assess the relationship between factors associated with the occurrence of the outcome variable. A logistic regression model was used, and bi-variable and multi-variable logistic regression was done to determine the association between each independent variable and the outcome variable. Variables having p-value <0.25 in variables logistic regression analysis were taken into multivariable logistic regression analysis. In multivariable analyses, variables whose p-value was ≤, 0.05 were considered statistically significant. Multicollinearity was checked by using variance inflation factors (VIF = 1.04–4.17, mean VIF=1.59) and model goodness of fit test was checked by Hosmer and Lemeshow goodness of fit tests (p = 0.55)

Results

Socio-demographic Characteristics of the Mothers

In this study, a total of 497 study participants were enrolled, with a response rate of 96.18% The mean (±SD) age of mothers was 28.33 (±4.8) years, and the majority of 398 (83.25%), were between the ages of 20 and 35, with 273 (57.11%) living in urban. Of the mother’s educational status 124 (25.94%) completed secondary school and 142 (29.71%) were college and above; the majority of participants 455 (95.19%) were married (Table 2).

Table 2: Socio-demographic characteristics of study participants in Northwest Amhara region comprehensive specialized hospitals, 2022(n=478).

Variables

Categories frequency(n)

Percent (%)

Maternal age <20 years

17

3.56

20-35 years

398

83.26

>35Years

63

13.18

Marital status Married

455

95.19

Single

19

3.97

Divorced

4

0.84

Residency Urban

273

57.11

Rural

205

42.89

Educational status unable to read and write

128

26.78

primary school

84

17.57

Secondary school

124

25.94

College and above

142

29.71

Occupation Government Employee

99

20.71

Private employee

38

7.95

Merchant

63

13.18

Daily labor

5

1.05

House Wife

273

57.11

Maternal Clinical Related Factors

Among a total of 478 participants, 47 (9.83%) were diabetics Miletus, of which 42 (89.36) gestational diabetics Miletus; 69 (14.44%) were pregnancy-induced hypertension, of which 46 (66.67) eclampsia; 46 (9.62%) were given medications during pregnancy, and 16 (3.35%) were given medications during labor (Table 3).

Table 3: Maternal Clinical related factors of study participants in Northwest Amhara region comprehensive specialized hospitals, 2022(n=478).

Variables

 Categories Frequency (n)

Percent (%)

Maternal diabetic Mellitus Yes

47

9.83

No

431

90.17

Type of diabetic mellitus Pre gestational

5

10.64

Gestational

42

89.36

Pregnancy-induced hypertension Yes

69

14.44

No

409

85.56

Type Pregnancy-induced hypertension Preeclampsia

23

33.33

Eclampsia

46

66.67

Medication use during Pregnancy (Except iron-folic acid) Yes

46

9.62

No

432

90.38

Type of medication use during pregnancy Amoxicillin

2

4.35

Magnesium sulfate

38

82.6

Hydrazine

2

4.35

Ceftriaxone

4

8.7

Medication is given during labor and delivery Yes

16

3.35

No

462

96.65

Type of Medication given during labor and delivery Oxytocin

6

37.5

Ampicillin

4

25

Dexamethasone

6

37.25

HIV/AIDS

Yes

9

1.88

No

469

98.12

Obstetric Related Factors

Out of 478 maternal interviews and reviewed charts neonates admitted in NICU regarding Obstetric factors-More than half, 248(51.88%) of mothers were multipara. 425 (88.91%) had ANC follow-up, and 454 (94.98%) had a duration of labor less than 24 hours. Around two-thirds, 306 (64.02%) of mothers gave birth via spontaneous vaginal delivery (Table 4).

Table 4: Obstetric factors of study participants in Northwest Amhara region comprehensive specialized hospitals, 2022(n=478).

Variables

Category Frequency(n)

Percent (%)

Parity Primipara

230

48.12

multi para

248

51.88

ANC follows up on the current pregnancy Yes

425

88.91

No

53

11.09

Number of ANC follow-up 1 time

12

2.51

2times

37

7.74

3 times

125

26.15

4 and above

251

52.51

Duration of labor <24 hours

454

94.98

>24 hours

24

5.02

Place of delivery Hospital

294

61.51

Health center

64

34.31

Home

20

4.18

Modes of delivery Spontaneous vaginal delivery

306

64.02

Assisted vaginal delivery

52

10.88

Cesarean section

120

25.10

Number of current pregnancies?

Single

410

85.77

multiple

68

14.23

Neonatal Related Factors

Among admitted neonates more than half of 263 (55.02%) were male. Around 207 (43.31%) were preterm and 213 (44.56%) of them had low birth weight. Around two-thirds (65.6%) of the neonates had hypothermia. in respect of to Weight for Gestational age 439 (91.84%) was appropriate for gestational age. 223 (46.65%) of neonates were started feeding within one hour. Around one-third, 149 (31.17%) of the neonates had respiratory distress syndrome, and 60 (12.55%) of the neonates were meconium aspiration syndrome (Table 5).

Table 5: Neonatal-related factors of study participants in Northwest Amhara region comprehensive specialized hospitals, 2022(n=478).

Variables

Category

Frequency(n)

Percent (%)

Male

263

55.02

Female

215

44.98

Age at admission <24 hours

351

73.43

≥24 hours

127

26.57

Gestational age Preterm

207

43.31

Term

261

54.60

Post-term

10

2.09

Birth weight

Low birth weight

213

44.56

Normal birth weight

254

53.14

Macrosomia

11

2.30

Weight for Gestational age Small for gestational age

22

4.60

Appropriate for gestational age

439

91.84

Large for gestational age

17

3.56

Axillary body temperature at admission

Hypothermia

287

60.04

Normothermic

154

32.22

hyperthermia

 37

7.74

Initiation of feeding Within one hour

223

46.65

After one hour

255

53.35

Respiratory distress syndrome Yes

No

149

329

31.17

68.83

No

329

68.83

Meconium aspiration syndrome Yes

60

12.55

No

418

87.45

Sepsis Yes

290

60.67

No

188

39.33

PNA Yes

 49

10.25

No

 429

89.75

Neonatal hypoglycemia Yes

130

27.20

No

348

72.80

Prevalence of Neonatal Hypoglycemia

The study revealed that the prevalence of baseline neonatal hypoglycemia was found to be 27.2% with 95%CI (23.4-31.4%) (Figure 1).

fig 1

Figure 1: Prevalence of neonatal hypoglycemia among neonates admitted to neonatal intensive care units in Northwest Amhara Region Comprehensive Specialized Hospitals, Northwest Ethiopia, 2022.

Factors Associated with Neonatal Hypoglycemia

Bivariable analysis was carried out on all of which variables having p-value <0.25: maternal age, maternal diabetes miletus, pregnancy-induced hypertension, medication use during pregnancy and labor, parity, place of delivery, duration of labor and mode of delivery, age at admission, feeding initiation time, gestational age, birth weight, axillary body temperature, RDS, PNA, and sepsis. Then multivariable logistic regression analysis was used to adjust possible confounders. In multivariable logistic regression analysis factors that were significantly associated which showed p-value < 0.05 neonatal hypoglycemia were After controlling confounders in the final model, maternal age between 20 and 35 years, preterm, low birth weight, and hypothermia.

Maternal age group 20- 35 years old were 65% less likely to be hypoglycemic (COR; 95%CI 0.35, 0.17-0.73) as compared to the maternal age above 35 years old of the mothers.

Preterm neonates were 2.6 times more likely to be hypoglycemic as compared to term neonates (AOR = 2.60, 95% CI: 1.07, 6.36).

Low-birth-weight neonates were 3.07 times more likely to be hypoglycemic than neonates delivered with normal birth weight (AOR = 3.07, 95%, CI: 1.26–7.46).

The neonates who had hypothermia were 2.58 times more likely to develop neonatal hypoglycemia as compared to those who had normal body temperature (AOR = 2.58, 95% CI: 1.27–5.23) (Table 6).

Table 6: Bi-variable and multivariable logistic regression of neonatal hypoglycemia among neonates admitted to neonatal intensive care units in Northwest Amhara Region Comprehensive Specialized Hospitals, Northwest Ethiopia, 2022.

Variable

Categories  Neonatal Hypoglycemia COR with 95% CI AOR with 95% CI
Yes

No

Maternal age <20 years

8 (47.06%)

9(52.94%) (52.2.94%) 1.44(0.49-4.25) 1.13(0.29-4.37)

20-35 years

98 (24.62%) 300 (75.38%) 0.53(0.30- 0.93)

0.35(0.167-0.73)**

>35Years

24 (38.10%)

39(61.90%) 1 1

Maternal diabeticmellits

Yes

18(38.30%) 29(61.70%) 1.77(0.95- 3.31)

1.87(0.86-4.06)

No

112(25.99%)

319(74.01%) 1

1

Pregnancy-induced hypertension Yes

28(40.58%)

41(59.42%) 2.06(1.21-3.49)

1.07(0.47- 2.45)

No

102(24.94%)

307(75.06%) 1

1

Medication use during pregnancy pregnancy Yes

22(47.83%)

24(52.17%) 2.75(1.49-5.10)

2.11(0.81-5.52)

No

108(25.00%)

32(475.00%) 1

1

Medication use during labor Yes

7(43.75%)

9(56.25%) 2.14(0.78-5.88)

2.41(0.70-8.30)

No

123(26.62%)

339(73.38%) 1

1

Parity Primipara

70(30.43%)

160(69.57%) 1.37(0.92-2.05)

1.37(0.81-2.34)

Multipara

60(24.19%)

188(75.81%) 1

1

Duration of labor <24 hours

120(26.43%)

334(73.57%) 1

1

>24 hours

10(41.67%)

14(58.33%) 1.99(0.86-4.60)

2.08(0.67-6.45)

Place of delivery Hospital

90(30.61%)

204(69.39%) 1

1

Health center

36(21.95%)

128(78.05%) 0.64(0.41-0.99)

0.68 (0.39-1.19)

Home

4(20.00%)

16(80.00%) 0.57(1.18-1.74)

0.93(0.25-3.50)

Mod of delivery SVD

70(22.88%)

236(77.12%) 1

1

Instrumental

14(26.92%%

38(73.08%) 1.24(0.64-2.4)

1.62(0.73-3.63)

C/s

46(38.33%)

74(61.67%) 2.09(1.33-3.3)

1.19(0.65-2.17)

Age at admission <24 hours

107(30.48%)

244(69.52%) 1.98(1.19 -3.28)

0.67(0.33-1.37)

>24 hours

23(18.11%)

104(81.89%) 1

1

Gestational age Term

32(12.26%)

229(87.74%) 1

1

Preterm

96(46.38%)

111(53.62%) 6.18(3.91-9.80)

2.60(1.07-6.36)*

Post-term

2(20.00%)

8(80.00%) 1.79(0.36-8.79)

1.15(0.19-7.03)

Birth weight Normal birth weight

31(12.20%)

223(87.80%) 1

1

Low birth weight

98(46.01%)

115(53.99%) 6.13(3.86-9.73)

3.07(1.26-7.46)*

Macrosomic

1(9.09%)

10(90.91%) 0.72(0.09-5.81)

0.83 (0.09-747)

Body temperature Hypothermia

111(38.68%)

176(61.32%) 5.84(3.26-10.47)

2.58(1.27- 5.23)**

Hyperthermia

4(10.81%)

33(89.19%) 1.12(0.845-0 .35)

2.14(0.59-7.63)

Normothermic

15(9.74%)

139(90.26%) 1

1

Initiation of feeding Within 1 hour

33(14.80%)

190(85.20%) 1

1

After 1 hour

97(38.04%)

158(61.96%) 3.53(2.26-5.53)

1.75(0.97-3.15)

Respiratory distress syndrome Yes

62(41.61%)

87(58.39%) 2.74(1.79-4.17)

0.55(0.28-1.05)

No

68(20.67%)

261(79.33%) 1

1

Sepsis Yes

64(22.07%)

226(77.93%) 0.52(0.34-0.78)

0.91 (0.55 -1.53)

No

66(35.11%)

122(64.89%) 1

1

PNA Yes

17(34.69%)

32(65.31%) 1.49(0.79-2.78)

1.69(0.72-3.99)

No

113(26.34%)

316(73.66%) 1

1

Discussion

This study revealed that the prevalence of neonatal hypoglycemia was 27.2% with 95%CI (23.4-31.4%). The findings are consistent with those previously conducted in Ethiopia St. Paul Hospital (25%) [9] and Nigeria (30.5%) [30]. The possible reasons in Ethiopia St. Paul Hospital may have used a similar study design and similarity in the neonatal intensive care unit setting and the possible reasons in Nigeria may be due to similar sources of the population were used.

On the other hand, the findings of this study are lower than the study conducted in Iraq (39.1%) [31] and New Zealand (51%) [23]. This may be because these two studies were used among neonates identified as high-risk groups. In Iraq, the study was conducted among low birth weight and preterm neonates and excluded healthy term newborns, whereas in New Zealand source of the population only infants of diabetic mothers.

On the contrary, the result of this study is higher than the study conducted in Eastern Ethiopia (21.2%) [32], Uganda (2.2%) [33] and (7.5%) [34], Côte d’Ivoire (15.9) [35], Nigeria (11%) [22], India (15.38%) [36], Israel (23.2) [37], Iraq (16.25%) [38], and China (16.9%) [39] The possible explanation for Uganda may be due to the difference in the study area and the number of study participants. It was conducted in the community which is different from institutional-based because less likely to gate healthy individuals compared to the community-based study area and the large number of study participants involved in the study. In Nigeria, the possible reasons may be that the study conducted included a smaller sample size, and neonates less than 24 hours of age were included in the study [22]. The study conducted in Iraq and India excludes infants born to diabetic mothers, neonates born to hypertensive mothers, and newborns with severe congenital malformations [36,38]. Another possible justification is that the study conducted in China used a lower cut-off point (30.6 mg/dL) to diagnose neonatal hypoglycemia compared to the current study [39].

Neonates delivered from mothers who had a maternal age of 20- 35 years old were 65% less likely to develop neonatal hypoglycemia as compared to the maternal age above 35 years old of the mothers. This finding is supported by Saint Paul‘s Hospital in Ethiopia [9] and India [40]. The possible justification is that mothers who are 20–35 years old are more likely to have higher levels of maternal human capital, which includes maturity, experience, self-esteem, and mental health, than older mothers (> 35 years old) [41]. The ideal childbearing age is between 20 and 35 years old. This is the time when having the highest number of good quality eggs available and pregnancy-related risks are lowest compared to maternal ages older than 35 years [42]. Advanced maternal age at birth (35 years and older) is associated with gestational diabetes, pre-eclampsia, preterm birth, low birth weight, low Apgar scores, and neonatal hypoglycemia [43]

The study revealed that preterm neonates were 2.6 times more likely to be hypoglycemic as compared to term neonates. This finding is supported by a study conducted in Eastern Ethiopia [32], Nigeria [7], New Zealand [23], Iran [38], Indonesia [26], and Macedonia [44]. The possible reason may be that preterm newborns have higher metabolic demands. In preterm infants, the enzymes involved in gluconeogenesis are expressed at low levels; thus, their ability to produce endogenous glucose is poor, contributing to their risk of severe or prolonged low glucose concentrations [45]. Preterm neonates are uniquely predisposed to developing hypoglycemia and its associated complications due to their limited glycogen and fat stores, their inability to generate new glucose using gluconeogenesis pathways, and their decreased ability to breastfeed effectively [46]

In this study, low birth weight neonates were 3.07 times more likely to be hypoglycemic as compared to normal birth weight neonates. This is in keeping with other studies in the study: Khartoum  [47], Nigeria [7], New Zealand [23], Indonesia [26], and Japan [48], Since neonates with low birth weight are at risk for hypoglycemia because they are born with decreased glycogen stores, decreased adipose tissue and experience increased metabolic demands because of their relatively large brain size [49].

According to the current study, hypothermic neonates were 3.58 times more likely to be hypoglycemic as compared to neonates with normal body temperature. This finding is supported by the studies conducted in Eastern Ethiopia [32], Uganda [34], Nigeria [22], Israel [50], Iran [38], China [39] and India [40]. The possible justification is that newborn hypothermia develops, the baby gets cold, and it uses up more glycogen to keep warm. Then the baby must utilize his glucose stores to keep warm, and then the blood sugar drops and they become hypothermic and hypoglycemic, and the glucose requirement increases in neonates who have hypothermia, which will increase the utilization of glucose [51].

Limitations of the Study

This study does not include other risk factors like Polycythemia, rhesus hemolytic disease, and neonatal jaundice because the study design is a cross-sectional study design.

This study does not see the fluctuation of blood glucose after the management of neonates having low blood glucose.

Conclusions

The prevalence of neonatal hypoglycemia in the study area was relatively high. Furthermore, it was found that maternal age between twenty and thirty-five, preterm birth, low birth weight, and hypothermia were significantly associated with neonatal hypoglycemia.

Recommendations

For Hospitals and Health Care Providers

Every neonatal intensive care unit should have its own thermostat and humidity control so that neonatal intensive care unit personnel can adjust the thermostat as needed for any neonates. Neonatal intensive care units’ temperature and humidity should be documented four times per day. The postnatal and neonatal intensive care units should be suitably arranged for the delivery unit so that mothers can’t be in difficulty of skin-to-skin contact during intra-facility transportation. The practice of warm chain should also be supervised regularly.

Neonatal care providers have to adhere to the routine practice of warm chain by giving the most prioritized attention to newborns with health problems, preterm and low birth weight newborns Mothers should also be oriented about thermal care during their antenatal care while they are in labor, delivery, and postnatal unit. The mothers also apply kangaroo mother care especially for preterm and low birth weight newborns.

Health education about neonatal hypoglycemia and its risk factors and preventive measures should be given to all families starting from ANC follow-up.

It is better to regularly screen out pregnant mothers for maternal obstetric factors like pregnancy-induced hypertension and chronic illness so that they will be alarmed as this can put them at risk of delivery being preterm and low birth weight which may lead to poor neonatal adaptation and many associated co-morbidity that leads to neonatal hypoglycemia. Healthcare providers who work in the labor and delivery ward and neonatal intensive care unit routinely check the neonates’ blood sugar levels.

Amhara Health Bureau

Integrate the need for training for health professionals on general prevention of hypoglycemia and develop standard protocols for all facilities to aware all the health professionals attending delivery and working in NICUs. To strengthen the service of the neonatal intensive care unit, medical equipment and medical team including a neonatologist, pediatrician, medical doctor, and neonatal nurse have to fulfill.

Researchers

Further studies have to be carried out to address the other factors associated with neonatal hypoglycemia and also to determine the outcomes of this hypoglycemia neonate using a follow up study.

Declarations

Consent for Publication

Not applicable.

Author Contributions

AGA developed the research idea, designed the study, and was involved in proposal writing, training and supervision of the data collectors, analysis and interpretation of the results, and preparation of the manuscript. EGM and AWA participated in the critical revision of the proposal, study design, analysis and interpretation of the results, and writing of the manuscript. All authors contributed to the article and approved the submitted version.

Data Availability Statement

The original contributions presented in the study are included in the article; further inquiries can be directed to the corresponding author.

Ethics Approval and Consent to Participate

Ethical clearance was obtained from the ethical review committee of the School of Nursing on behalf of the institutional review board of the University of Gondar. An official letter was written to the Northwest Amhara region’s Comprehensive Specialized Hospitals for permission and support from the Ethical Review Committee of the School of Nursing with ref. no. SN/032/2015 on 03/10/2022 (G.C.) and with ref.no. SN/032/2015.A written permission letter was obtained from Amhara Public Health Institute for each hospital (ref. no. አሕጤኢ/ዋ/ዳ/03/1611). Finally, permission was obtained from the NICU head of each hospital to access the mother’s and neonates’ medical charts. As this is a prospective study, consent must come from the mothers. The confidentiality of the information was strictly maintained by omitting any personal identifier (name and medical record number) during the data collection.

Acknowledgments

First, the authors would like to express their deepest gratitude to the University of Gondar, College of Medicine and Health Sciences, and School of Nursing for providing me with this opportunity and financial support. Next, we would also like to acknowledge the Amhara Public Health Institute for permitting me to conduct the study at each hospital, and we would also like to thank the Northwest Amhara Region Comprehensive Specialized Hospital NICU Coordinators and healthcare providers for giving me general information related to the study area and study population. Finally, we would also like to extend our special thanks to the data collectors, supervisors, and study participants for their great contributions to the success of this study.

Funding Statement

Financial support was received from University of Gondar. The funding institution had no role in the preparation of the manuscript or in the decision to publish.

Conflict of Interest

The authors declare that the research was conducted in the absence of any commercial or financial relationships that could be construed as a potential conflict of interest.

Publisher’s Note

All claims expressed in this article are solely those of the authors and do not necessarily represent those of their affiliated organizations, or those of the publisher, the editors, and the reviewers. Any product that may be evaluated in this article, or claim that may be made by its manufacturer, is not guaranteed or endorsed by the publisher.

References

  1. Berard LD, Blumer I, Houlden R, Miller D, Woo V (2013) Monitoring glycemic control. Canadian journal of diabetes. 37: S35-S9. [crossref]
  2. NICU guideline 2021. 2017;1: 277.
  3. Training NICUN, Manual P (2021) Neonatal Intensive Care Unit (NICU) TrainingParticipants’ Manual Federal Ministry of Health. 2021.
  4. Kallem VR, Pandita A, Gupta G (2017) Hypoglycemia: when to treat? Clinical Medicine Insights: Pediatrics. 11: 1179556517748913. [crossref]
  5. Hansen AR, Stark AR, Eichenwald EC, Martin CR (2022) CLoherty and Stark’s Manual of neonatal care: Lippincott Williams & Wilkins;
  6. Makker K, Alissa R, Dudek C, Travers L, Smotherman C, Hudak ML (2018) Glucose gel in infants at risk for transitional neonatal hypoglycemia. American Journal of Perinatology. 35(11): 1050-6. [crossref]
  7. Efe A, Sunday O, Surajudeen B, Yusuf T (2019) Neonatal hypoglycemia: prevalence and clinical outcome in a tertiary health facility in North-Central Nigeria. Int J Health Sci Res. 9: 246-51.
  8. Mukunya D, Odongkara B, Piloya T, Nankabirwa V, Achora V, Batte C, et al (2020) Prevalence and factors associated with neonatal hypoglycemia in Northern Uganda. [crossref]
  9. Nurussen I, Fantahun B (2021) Prevalence And Risk Factors of Neonatal Hypoglycaemia at St. Paul’s Hospital Millennium Medical College, Ethiopia. Ethiopian Journal of Pediatrics and Child Health. 16(1).
  10. Blencowe H, Krasevec J, De Onis M, Black RE, An X, Stevens GA, et al (2019) National, regional, and worldwide estimates of low birth weight in 2015, with trends from 2000: a systematic analysis. The Lancet Global Health. 7(7): e849-e60.[crossref]
  11. Wardlaw T, You D, Hug L, Amouzou A, Newby H (2014) UNICEF Report: enormous progress in child survival but greater focus on newborns urgently needed. Reproductive health. 11(1): 1-4. [crossref]
  12. Dedeke I, Okeniyi J, Owa J, Oyedeji G (2011) Point-of-admission neonatal hypoglycemia in a Nigerian tertiary hospital: incidence, risk factors and outcome. Nigerian Journal of Paediatrics. 38(2): 90-4.
  13. El-Mekkawy MS, Ellahony DM (2019) Prevalence and prognostic value of plasma glucose abnormalities among full-term and late-preterm neonates with sepsis. Egyptian Pediatric Association Gazette. 67(1): 1-7.
  14. Masaba BB, Mmusi-Phetoe RM (2020) Neonatal survival in Sub-Sahara: a review of Kenya and South Africa. Journal of multidisciplinary healthcare. 13: 709.[crossref]
  15. Demographic E (2019) Health survey: Addis Ababa. Ethiopia and Calverton, Maryland, USA: Central Statistics Agency and ORC macro.
  16. EN. T (2021) Clinical Reference Manual for Advanced Neonatal Care in Ethiopia Ministry of Health ©UNICEF.. Frontiers in Endocrinology 12: : 59-62.
  17. De Angelis LC, Brigati G, Polleri G, Malova M, Parodi A, Minghetti D, et al (2021) Neonatal hypoglycemia and brain vulnerability. Frontiers in Endocrinology. 12: 634305.
  18. Thornton PS, Stanley CA, De Leon DD, Harris D, Haymond MW, Hussain K, et al(2015) Recommendations from the Pediatric Endocrine Society for evaluation and management of persistent hypoglycemia in neonates, infants, and children. The Journal of Pediatrics. 167(2): 238-45.[crossref]
  19. Glasgow MJ, Harding JE, Edlin R, Alsweiler J, Chase JG, Harris D, et al (2018) Cost analysis of treating neonatal hypoglycemia with dextrose gel. The Journal of Pediatrics. 198: 151-5. e1.[crossref]
  20. Harding JE, Harris DL, Hegarty JE, Alsweiler JM, McKinlay CJ (2017) An emerging evidence base for the management of neonatal hypoglycemia. Early human development. 104: 51-6.[crossref]
  21. Glasgow MJ, Edlin R, Harding JE (2021) Cost burden and net monetary benefit loss of neonatal hypoglycemia. BMC Health Services Research. 21(1): 1-13.[crossref]
  22. Ochoga MO, Aondoaseer M, Abah RO, Ogbu O, Ejeliogu EU, Tolough GI (2018) Prevalence of Hypoglycaemia in Newborn at Benue State University Teaching Hospital, Makurdi, Benue State, Nigeria. Open Journal of Pediatrics. 8(2): 189-98.
  23. Mitchell NA, Grimbly C, Rosolowsky ET, O’Reilly M, Yaskina M, Cheung P-Y, et al (2020) Incidence and risk factors for hypoglycemia during fetal-to-neonatal transition in premature infants. Frontiers in Pediatrics. 8: 34. [crossref]
  24. Tesfay EN (2021) Clinical Reference Manual for Advanced Neonatal Care in Ethiopia Ministry of Health 2021 ©UNICEF. Frontiers in Endocrinology. 12: 59-62.
  25. Ethiopia FDRo (2019) Public Expenditure and Financial Accountability (PEFA) Assessment (Regional Government of Amhara) Final Report
  26. Yunarto Y, Sarosa GI (2019) Risk factors of neonatal hypoglycemia. Paediatrica Indonesiana. 59(5): 252-6.
  27. Ng. 2021. 2017;2017;1: 277.
  28. Lunze K, Hamer D (2012) Thermal protection of the newborn in resource-limited environments. Journal of Perinatology. 32(5): 317-24. [crossref]
  29. Sweet DG, Carnielli V, Greisen G, Hallman M, Ozek E, Te Pas A, et al (2019) European consensus guidelines on the management of respiratory distress syndrome–2019 update. 115(4): 432-50. [crossref]
  30. West B, Aitafo J (2020) Prevalence and Clinical Outcome of Inborn Neonates with Hypoglycaemia at the Point of Admission as seen in Rivers State University Teaching Hospital, Nigeria. Journal of Pediatrics, Perinatology and Child Health. 4(4): 137-48. [crossref]
  31. Rajab AS, Chalabi DA, Al-Rabaty AA (2018) Prevalence and severity of hypoglycemia in a sample of neonates in Erbil city. Zanco Journal of Medical Sciences (Zanco JMed Sci) 22(1): 13440.
  32. Sertsu A, Nigussie K, Eyeberu A, Tibebu A, Negash A, Getachew T, et al (2022) Determinants of neonatal hypoglycemia among neonates admitted at Hiwot Fana Comprehensive Specialized University Hospital, Eastern Ethiopia: A retrospective cross-sectional study. SAGE Open Medicine. 10: 20503121221141801. [crossref]
  33. Mukunya D, Odongkara B, Piloya T, Nankabirwa V, Achora V, Batte C, et al (2020) Prevalence and factors associated with neonatal hypoglycemia in Northern Uganda: a community-based cross-sectional study. Tropical Medicine and Health. 48(1): 1-8. [crossref]
  34. Nabuuma T (2022) Prevalence and factors associated with abnormal glycemic status among term neonates admitted to special care unit Kawempe National Referral Hospital: Makerere University.
  35. Ouattara GJ, Cissé L, Koffi G, Yao J-JA, Enoh J, Sei C, et al (2017) Clinical and Epidemiological Features and Management of Neonatal Hypoglycemia at the University Teaching Hospital of Treichville (Abidjan-Côte d’Ivoire) Open Journal of Pediatrics. 7(4): 320-30.
  36. Magadla Y (2016) Infants of diabetic mothers: maternal and infant characteristics and incidence of hypoglycemia: Faculty of Health Sciences, University of the Witwatersrand.
  37. Zigron R, Rotem R, Erlichman I, Rottenstreich M, Rosenbloom JI, Porat S, et al (2022) Factors associated with the development of neonatal hypoglycemia after antenatal corticosteroid administration: It’s all about timing. International Journal of Gynecology & Obstetrics. 158(2): 385-9. [crossref]
  38. Sabzehei MK, Otogara M, Ahmadi S, Daneshvar F, Shabani M, Samavati S, et al (2020) Prevalence of Hypoglycemia and Hypocalcemia Among High-Risk Infants in the Neonatal Ward of Fatemieh Hospital of Hamadan in 2016-2017. Hormozgan Medical Journal. 24(1): e94453e.
  39. Zhou W, Yu J, Wu Y, Zhang H (2015) Hypoglycemia incidence and risk factors assessment in hospitalized neonates. The Journal of Maternal-Fetal & Neonatal Medicine. 28(4): 422-5. [crossref]
  40. Sasidharan C, Gokul E, Sabitha S (2010) Incidence and risk factors for neonatal hypoglycemia in Kerala, India. Ceylon Medical Journal. 49(4)
  41. Kessler RC, Berglund P, Demler O, Jin R, Merikangas KR, Walters EE (2005) Lifetime prevalence and age-of-onset distributions of DSM-IV disorders in the National Comorbidity Survey Replication. Archives of general psychiatry. 62(6): 593-602.
  42. Fall CH, Sachdev HS, Osmond C, Restrepo-Mendez MC, Victora C, Martorell R, et al (2015) Association between maternal age at childbirth and child and adult outcomes in the offspring: a prospective study in five low-income and middle-income countries (COHORTS collaboration) The Lancet Global Health. 3(7): e366-e77.
  43. Wambach KA, Cole C (2000) Breastfeeding and adolescents. Journal of Obstetric, Gynecologic, & Neonatal Nursing. 29(3): 282-94. [crossref]
  44. Stomnaroska O, Petkovska E, Jancevska S, Danilovski D (2017) Neonatal hypoglycemia: risk factors and outcomes. Prilozi (Makedonska akademija na naukite i umetnostite Oddelenie za medicinski nauki)
  45. Carmen S (1986) Neonatal hypoglycemia in response to maternal glucose infusion before delivery. Journal of Obstetric, Gynecologic, & Neonatal Nursing. 15(4): 319-23.
  46. Sharma A, Davis A, Shekhawat PS (2017) Hypoglycemia in the preterm neonate: etiopathogenesis, diagnosis, management and long-term outcomes. Translational pediatrics. 6(4): 335. [crossref]
  47. Hussein SM, Salih Y, Rayis DA, Bilal JA, Adam I (2014) Low neonatal blood glucose levels in cesarean-delivered term newborns at Khartoum Hospital, Sudan. Diagnostic Pathology. 9(1): 1-4.
  48. Shimokawa S, Sakata A, Suga Y, Isoda K, Itai S, Nagase K, et al. Incidence and risk factors of neonatal hypoglycemia after ritodrine therapy in premature labor: a retrospective cohort study. Journal of Pharmaceutical Health Care and Sciences. 2019;5(1): 1-7.
  49. Abramowski A, Ward R, Hamdan AH. Neonatal hypoglycemia (2021) StatPearls [Internet]: StatPearls Publishing;.
  50. Bromiker R, Perry A, Kasirer Y, Einav S, Klinger G, Levy-Khademi F (2019) Early neonatal hypoglycemia: incidence of and risk factors. A cohort study using universal point of care screening. The Journal of Maternal-Fetal & Neonatal Medicine. 32(5): 786-92.
  51. Adamkin DH, editor Neonatal hypoglycemia (2017) Seminars in Fetal and Neonatal Medicine; Elsevier.
fig 2

Effects of a Serotonin Receptor Peptide on Behavioral Pattern Separation in Sham- vs. Mild Traumatic Brain Injured Rats

DOI: 10.31038/EDMJ.2024821

Abstract

Aims: Behavioral pattern separation is a hippocampal-dependent component of episodic memory and a sensitive marker of early cognitive decline. Here we tested whether mild traumatic injury causes loss of pattern separation in the rat and for its prevention by a novel neuroprotective peptide fragment of the human serotonin 2A receptor (SN..8).

Methods: Lateral fluid percussion was used to induce mild traumatic brain injury in male Sprague- Dawley rats. Rats were trained to distinguish between a stable vs unstable swim platform separated by increasing distances (4.5 vs 3.0 vs 1.5 feet) in a modification to the classic Morris water maze. Peptide SN..8 vs scrambled version of same amino acids (2 mg/kg) was administered via intraperitoneal route (1-, 3- and 5-days) after lateral fluid percussion or sham injury. Rats received three weeks of training and two weeks of testing before injury and were tested again at 2 and 5-weeks after injury.

Results: There was a gradient of decreasing incorrect responses to the choice between (stable vs unstable platform) as the platform separation distance was increased from 1.5 to 3.0 to 4.5 feet consistent with behavioral pattern separation. Systemic administration of SN..8 peptide (vs scrambled) peptide was associated with statistically significant lower rate of incorrect responses (at both 4.5 feet and 3.0 feet platform separation) in traumatic brain- injured rats (but not in sham-injured rats) tested at 2-weeks post-injury. Five weeks after injury, the rats had largely recovered and exhibited a much lower overall rate of incorrect responses across both drug and injury subgroups.

Conclusions: Introduction of an unstable platform (choice phase of the Morris water maze) at varying distances from the stable platform resulted in behavior having the hallmark of pattern separation. Our data are the first to suggest that systemic administration of (2 mg/kg) SN..8 peptide immediately after mild traumatic brain injury (lateral fluid percussion) appeared to protect against loss of behavioral pattern separation in the rat.

Introduction

Accelerated cognitive decline frequently complicates traumatic brain injury (TBI) [1]. Pattern separation- the ability to encode similar spatial representations as distinct objects [2] is a hippocampal- dependent component of working memory [2]. Loss of pattern separation is an early marker of cognitive decline in humans [3]. The serotonin 2A receptor (5HT2A) is expressed on neurons, and neural progenitor cells in the dentate gyrus and hippocampus [4]. Agonists of the 5HT2A receptor in this brain region were reported to impair recall of spatial memory [5]. We designed a peptide identical to a sub-region of the human 5HT2AR (SN..8) involved in long-lasting receptor activation [6,7]. Systemic administration of SN..8, in a genetic strain of rats (Zucker) harboring neurotoxic 5-HT2A receptor activating IgG plasma autoantibodies [8] enhanced acquisition and recall of spatial memory in sham, but not in traumatic brain-injured lean Zucker rats [9]. Here we tested a different strain of rat, adult male Sprague-Dawley, for neuroprotection by SN..8 when administered immediately after mild traumatic brain injury (mTBI) in a pattern separation task which is hippocampal dependent and a highly sensitive marker of early cognitive decline.

Methods

Peptides

The linear synthetic peptide, corresponding to a fragment of the serotonin 2a receptor, SCLLADDN (SN..8) and a scrambled version LASNDCLD (LD.8) were both synthesized at Lifetein, Inc. (Hillsborough, NJ). Each peptide was provided as the hydrochloride salt and had purity > 95%. The lyophilized peptides were stored (in the presence of dessicant) at −40 degrees C prior to use. Before each experiment, peptide was reconstituted fresh in sterile saline at the indicated concentration.

Animals

All procedures were conducted in accordance with the NIH Guide for the Care and Use of Laboratory Animals and were approved by the Institutional Animal Care and Use Committee of the Veterans Affairs Medical Center (East Orange, New Jersey). Male SD rats n =38 (8-weeks-old) were obtained from Charles River Laboratories (Kingston, NY) and were individually housed with modest enrichment (wooden block). Rats were provided ad libitum access to food and water and maintained in a 12 h light/dark cycle with lights on at 0700. Training and testing were performed during the light phase of the light/ dark cycle. They underwent pattern separation pre-training training for 12 days over three weeks and testing for 6 days over two weeks. At approximately 17 weeks of age, rats underwent surgery (craniectomy) and injury (lateral fluid percussion) (See Timeline, Figure 1).

fig 1

Figure 1: Timeline of experimental procedures

Injections

Peptide (SN..8 or LD.8) was dissolved in sterile saline (2 mg/kg) and administered via intraperitoneal (IP) route 1-, 3- and 5-days after mild TBI vs sham injury.

Surgery/Injuries

Craniectomy and delivery of a pressure wave (lateral fluid percussion) procedures were carried out as previously reported [10]. The procedures are briefly summarized here. Day 1: Craniectomy-A 4 mm diameter craniectomy was performed under anesthesia with isoflurane, 3mm posterior and 3.5mm lateral to the bregma was made unilaterally in either the left or right parietal bone (figure). During the craniectomy, the skull was removed but the dura mater remains intact. A luer-lock connector was glued to the skull surrounding the craniectomy. A plastic cylinder about 2 mL was placed surrounding the craniectomy to protect the luer-lock connector. Dental cement was placed inside the plastic cylinder. A small Kim wipe was inserted inside the luer-lock to keep the dura moist and clean of debris. Lateral Fluid Percussion Injury– Twenty-four hours after the surgery, rats were anesthetized with isoflurane at 5 liters/min for (1min 30sec). The Kim wipe was removed from the luer-lock and filled with sterile saline. The luer-lock was then connected to the fluid percussion device and once rats reacted to a strong toe pinch, the fluid percussion injury was delivered to the exposed dura matter dorsal to the parietal lobe, via a voice-coil piston device. The pressure sensors located at the end of the pistol records PSI waves. Acute signs (Table 1) were recorded at the time of injury, including: startle, apnea (time in seconds from the time of injury to the time the rat returns to regular breathing) and righting reflex (RR= time in seconds from the time of injury until the time the rat fully supports its weight on all four paws). Sham animals underwent all procedures except they did not receive the fluid percussion injury.

Table 1: Acute signs of injury in rats randomized to either SN..8 or scrambled LD..8 peptide injections and mild TBI vs sham injury

tab 1

Behavioral Tests

Pattern Separation

A sixty-three- inch diameter metal pool with a stable and unstable platform visible above water line was used to complete the pattern separation task. The stable platform fully supports the weight of the rat and enables them to completely climb out of the water. The unstable platform appears identical to the stable platform; however, it does not support the rats’ weight and will not allow the rat to the climb out of the water.

Training

All animals underwent 3 weeks of training consisting of 4 consecutive training days per week of followed by 3 days of rest, e.g. week 1, training days 1-4; week 2 training days 5-8, week 3, training days 9-12 (Figure 1). This was followed by six days of baseline testing.

Training Day 1: Animal learns that to ‘escape’ from the pool, must be from stable platform. The maximum time for each trial is 60 seconds (60s); the rat must remain on the stable platform for 30 seconds (30s) to complete the trial. If after the 60s they can’t find the stable platform, they are guided to it and must stay on it for 30s before being removed. During trial 1, they are placed on the stable platform in the middle of the pool. In trial 2, they are placed in the middle between the platform and the edge of the pool approximately 12 inches from the platform. In trial 3, they are placed on the edge of the pool approximately 32 inches.

Training Day 2: Animal are run through a classic water maze protocol where the platform stays in the same location during all three trials. Stable platform is placed in quadrant 1 of the pool and rats undergo 3 trials with 1 hour time in between trials. The starting location of the rat changes in between trials. During trial 1, the starting location of the animals was between quadrant 1 and 2. In trial 2, the starting location was between quadrant 2 and 3. In trial 3, the starting location was between quadrant 3 and 4 (Figure 2).

fig 2

Figure 2: Training in the pattern separation task

Training Days 3-4: animal learns to search for stable platform within trials. Here, the location of the stable platform and the start position of the animal’s changes between trials. Within each trial, all animals are put in the water twice (sample phase and choice phase). During all three trials, the starting location of the animals to the platform is 4.5ft. During trial 1 the starting location of the animals was between quadrant 1 and 4. In the sample and choice phase, the stable platform is in quadrant 2. In trial 2, the starting location to the platform was between quadrant 3 and 4 and the location of the stable platform remained in quadrant 1 for both sample and choice phase. Trial 3 starting location to the platform was between quadrant 2 and 3 and the location of the stable platform remained at quadrant 4 for both the sample and choice phase.

Training Days 5-6: Introduction of unstable platform. Animal learns to search for stable platform within a trial and ignore unstable platform. The stable platform and the start point of the animals stayed the same between trials. During trial 1, animals run through easy pattern separation where the sample phase only consists of the stable platform and during the choice phase, we introduced the unstable platform. The unstable platform is placed in the water during the choice phase. For trial 2 and 3, the stable and the unstable platform are in the water at the same, at different location. The starting location of the animals during all three trials remain the same. Animal are run through “easy pattern separation” with the distance from the starting location to the platform to be 4.5ft.

Training Days 7-12: animal learns to search for stable platform within a trial and ignore unstable platform. Run animal through easy pattern separation task (at 4.5 ft from start location). Start location of animals, location of stable and unstable platform changes during each trial. After 12 days it was determined that approximately 25% of rats were correctly choosing the stable vs unstable platform, and in order to avoid ‘overtraining’ no further baseline training trials were performed.

Test Trials

Testing consists of sample phase and choice phase which begin 3 days after training and span 6 days over a two-week time period (three days per week). Results in the choice phase are indicative of pattern separation. The start location (pool quadrant) and the relative location of the unstable and stable platforms changes between individual testing trials (3 trials per day) and on each new testing day. Between the sample and choice phases, the rats are removed from the platform and given a 30- second break. There is an additional one- hour break between each successive trial.

Scoring/Data Collection

During testing, an incorrect response is when the rats touch and attempt to climb the unstable platform. The number of times each rat attempt to go to the unstable trial within each trial is recorded and percent incorrect is calculated as [incorrect responses/total responses].

Statistics

Student’s t-test was used for single comparisons. A P-value <0.05 was considered significant and values are expressed as means ± SEM. There was no correction for multiple comparisons.

Results

Acute Signs of Mild TBI (Lateral Fluid Percussion)

Mean apnea time and mean righting reflex time were significantly longer in rats subjected to mTBI vs sham-injury (Table 1). There was no statistically significant difference in mean apnea time or mean righting reflex time following lateral fluid percussion in rat subgroups randomized to treatment with SN..8 vs scrambled peptide injections on days 1, 3 and 5 after injury. The mean peak pressure (PSI, pounds per square inch) applied during the fluid percussion wave did not differ significantly between rats treated with SN..8 vs scrambled peptide following mTBI (Table 1).

Behavioral Pattern Separation (BPS)

Baseline

In baseline pre-injury testing, rats made fewer errors (14.2 vs 26.7 vs 35.8%) in behavioral pattern separation (Figure 3) at greater distance(s) between the (stable and unstable) platforms i.e. 4.5 vs 3.0 vs 1.5 feet. The observed gradient of increasing error rate as the spatial representations become less dissimilar is consistent with pattern separation. The difference in baseline error rate at platform separation distance of 4.5 vs 1.5 feet was statistically significant (N=39; P< 0.01). Because of the much higher baseline error rate at 1.5 foot platform separation distance, post-injury data was only analyzed and reported for the 3.0 and 4.5 foot platform separation distances.

fig 3

Figure 3: Baseline pattern separation declines by decreasing distance between platforms

Post-Injury

Rats treated with SN..8 vs scrambled peptide displayed significantly lower error rates (two weeks post-injury): (6.7 vs 25.9 %; N=19, P< 0.01) at both 4.5 feet and (20.0 vs 42.7% (N=19; P= 0.039); at 3.0 feet platform separation (Figure 4). There was no significant difference in BPS performance between SN..8 vs scrambled peptide- treated sham-injured rats two weeks’ post-injury (Figure 5). Across all drug and injury subgroups, the composite error rate was significantly lower at five- vs. two- weeks’ post-injury (7.75 +/- 4.4 vs 17.09 +/9%; P = 0.009) (Figure 6). This may be consistent (in part) with spontaneous recovery from injury after 5 weeks and increased experience with the task. In summary, systemic SN..8 (2 mg/kg) administered in three successive alternate daily doses (starting 1 day after mTBI) appeared to have a neuroprotective effect on early loss of behavioral pattern separation in adult male SD rats.

fig 4

Figure 4: Treatment with SN..8 vs scrambled peptide after mTBI is associated with significantly improved behavioral pattern separation at A) 4.5 feet and B) 3.0 feet platform distances.

fig 5

Figure 5: Treatment with SN..8 vs scrambled peptide sham injury is associated with no significant differences in behavioral pattern separation at A) 4.5 feet and B) 3.0 feet platform distance.

fig 6

Figure 6: Substantial improvement in pattern separation performance 5 weeks post-injury

Discussion

Behavioral pattern separation is thought to be a component of working memory which has an underlying neural circuitry that largely resides in the dentate gyrus and hippocampus [11]. Transient impairment in behavioral pattern separation reported here is consistent with a prior report that spatial memory was impaired (early 1-7 days) but recovered spontaneously 21 days following mild TBI (lateral fluid percussion) in Sprague-Dawley rats [10]. The mean peak pressure, apnea period, and righting reflex times experienced (by SD rats) in the present study were slightly lower than reported in the prior study [10], but apnea and righting reflex times are consistent with mild traumatic brain injury. Our findings suggest that introducing an unstable platform during the choice phase of the classic Morris water maze test is a useful method to model behavioral pattern separation in rats.

The mechanism of transient impairment of pattern separation following mTBI (lateral fluid percussion) in the SD rat is unknown. Cortical expression of both 5HT2A and a related catecholamine receptor, the alpha 1 adrenergic receptor was reported to increase (in rodents) following different forms of TBI [12, 13]. Much less is known about possible catecholamine receptor changes in the hippocampus following TBI. The hippocampus receives a dense projection of serotonergic fibers from the dorsal raphe [14]. The 5HT2AR was reported to mediate in part changes in synaptic input to hippocampal granule cells [15] which could result in impaired development of newly-born neurons derived from dentate gyrus neural progenitor cells. Reduced dentate gyrus neurogenesis is one of the mechanisms thought to underly impaired pattern separation [11]. Dentate gyrus neurogenesis plays an important role not only in pattern separation but also mood regulation, and in a prior study we found that human depression patients harbored plasma 5-HT2AR activating IgG autoantibodies [16] which impaired the survival and differentiation of rat DG neural progenitor cells [17,18] in vitro.

SN..8 is a small peptide having an amino acid sequence identical to that of a subregion of the second extracellular loop of the human 5HT2AR involved in mediating long-lasting receptor activation [6]. Although the SN..8 mechanism of action is not completely understood, it prevented neurotoxicity (in vitro) mediated by Ig isolated from plasma of patients with neurodegenerative disorders including Parkinson’ disease, dementia [18] and major depressive disorder [6]. Immunoglobulin G from a subset of patients with TBI displayed increased binding to the human 5HT2A receptor second extracellular loop peptide [6] (which includes SN..8). Baseline presence of 5HT2AR peptide binding in plasma human TBI IgG predicted accelerated (two-year) prospective decline in cognitive function in thirty-five older adult TBI patients [19].

Our underlying hypothesis is that long-lasting 5HT2AR agonist Ig may mediate in part cognitive decline following TBI. It is not clear to what extent Ig may have been a contributory factor in Sprague-Dawley rat since in our preliminary experiments (not shown here) the titer and potency of SD plasma Ig was significantly lower than what we had previously reported in the Zucker rat [8]. Still SN..8 may serve either as a ‘decoy receptor’ to prevent neurotoxicity from 5-HT2AR- targeting agonist Ig and/or stabilize an inactive conformation of the 5HT2AR. It is not known whether dysregulated serotonergic input to the hippocampus (following mTBI) might alter synaptic input to developing neurons in the dentate gyrus [15,20] which could result in reduced neurogenesis [20,21] which is a hallmark of reduced pattern separation [11].

In a prior study, systemic (IP) administration of SN..8 (vs. scrambled peptide) strengthened both recall and acquisition of spatial learning after sham injury (but not after mild traumatic brain injury) in Zucker lean rats. Genetic strain differences between Sprague- Dawley and Zucker rats might account in part for a neuroprotective effect (following mTBI) by SN..8 in SD but not in Zucker rats. It is also possible that pattern separation is a more sensitive method for detecting the earliest cognitive impairment changes following mTBI. More study using pattern separation in different genetic strains of rat can help clarify the differences.

Acknowledgments

Supported in part by a grant from the New Jersey Commission on Brain Injury Research NJCBIR PIL022 to MBZ; and a grant from the Department of Veterans Affairs, Office of Research and Development, Technology Transfer Program (Wash, DC) to MBZ.

References

  1. Walker KR, Tesco G (2013) Molecular mechanisms of cognitive dysfunction following traumatic brain Front Aging Neurosci 5: 29. [crossref]
  2. Yassa MA, Stark CE (2011) Pattern separation in the hippocampus. Trends Neurosci. 34 (10): 515-25
  3. Stark SM, Yassa MA, Stark CE (2010) Individual differences in spatial pattern separation performance associated with healthy aging in Learn Mem. May 21;17 (6): 284-8 [crossref]
  4. Xu T and Pandey S C (2000) Cellular localization of serotonin (2A) (5HT (2A)) receptors in the rat brain. Brain Res. Bull. 51, 499-505. [crossref]
  5. Zhang G, Stackman RW Jr (2015) The role of serotonin 5-HT2A receptors in memory and cognition. Front Pharmacol 6: 225 [crossref]
  6. Zimering MB (2019) Autoantibodies in Type-2 Diabetes having Neurovascular Complications Bind to the Second Extracellular Loop of the 5-Hydroxytryptamine 2A Endocrinol Diabetes Metab J 3: 118. [crossref]
  7. Zimering MB (2021) A serotonin 2A receptor decoy peptide potently lowers blood pressure in male Zucker diabetic fatty rats. Endo Diab Metab J 5: 1-13. [crossref]
  8. Zimering MB, Grinberg M, Burton J, Pang K (2020) Circulating Agonist Autoantibody to 5-Hydroxytryptamine 2A Receptor in Lean and Diabetic Fatty Zucker Rat Endocrinol Diabetes Metab J 4: 413. [crossref]
  9. Grinberg M, Burton J, Pang KCH, Zimering MB (2023) Neuroprotective Effects of a Serotonin Receptor Peptide Following Sham Mild Traumatic Brain Injury in the Zucker Rat. Endocrinol Diabetes Metab J Volume 7 (3): 1-9. [crossref]
  10. Pang KC (2015), et al., Long-lasting suppression of acoustic startle response after mild traumatic brain injury. J Neurotrauma, 32 (11): p. 801-10. [crossref]
  11. Dupret D, Revest JM, Koehl M, Ichas F, De Giorgi F, et al (2008) Spatial relational memory requires hippocampal adult neurogenesis. PLoS One 3: e1959. [crossref]
  12. Collins SM, O’Connell CJ, Reeder EL, Norman SV, Lungani K, Gopalan P, Gudelsky GA, Robson MJ (2022) Altered Serotonin 2A (5-HT2A) Receptor Signaling Underlies Mild TBI-Elicited Deficits in Social Dominance. Front Pharmacol. 15;13: 930346. [crossref]
  13. Kobori N, B Hu and PK Dash (2011) Altered adrenergic receptor signaling following traumatic brain injury contributes to working memory dysfunction. Neuroscience, 172: p. 293-302. [crossref]
  14. Kohler C, Steinbusch H (1982) Identification of serotonin and non-serotonin- containing neurons of the mid-brain raphe projecting to theentorhinal area and the hippocampal formation: a combined immunohistochemical and fluorescent retrograde tracing study in the rat brain. Neuroscience 7: 951-975. [crossref]
  15. Nozaki K, Kubo R, Furukawa Y (2016) Serotonin modulates the excitatory synaptic transmission in the dentate granule J Neurophysiol. 115 (6): 2997-3007 [crossref]
  16. Zimering MB (2017) Diabetes Autoantibodies Mediate Neural- and Endothelial Cell- Inhibitory Effects Via 5-Hydroxytryptamine- 2 Receptor Coupled to Phospholipase C/Inositol Triphosphate/Ca2+ J Endocrinol Diab. 4 (4): 1-10 [crossref]
  17. Zimering MB, Behnke JA, Thakker-Varia S, Alder J (2015) Autoantibodies in Human Diabetic Depression Inhibit Adult Neural Progenitor Cells In vitro and Induce Depressive-Like Behavior in Rodents. J Endocrinol Diabetes. [crossref]
  18. Zimering MB (2018) Circulating Neurotoxic 5-HT2A Receptor Agonist Autoantibodies in Adult Type 2 Diabetes with Parkinson’s Disease. J Endocrinol Diabetes. [crossref]
  19. Zimering MB, Grinberg M, Myers CE, Bahn G (2022) Plasma Serotonin 2A Receptor Autoantibodies Predict Rapid, Substantial Decline in Neurocognitive Performance in Older Adult Veterans with Endocrinol Diabetes Metab J. 6 (1): 614 [crossref]
  20. Zimering MB, Mirkovic N, Pandya M, Zimering JH, Behnke JA, Thakker-Varia S, Alder J, Donnelly RJ (2016) Toxic Immunoglobulin Light Chain Autoantibodies are Associated with a Cluster of Severe Complications in Older Adult Type 2 J Endocrinol Diabetes. [crossref]
  21. Tozuka Y, Fukuda S, Namba T, Seki T, Hisatsune T (2005) GABAergic excitation promotes neuronal differentiation in adult hippocampal progenitor cells. Neuron. [crossref]

Brain Health Best Practice Score: How Do Organizations Measure Up?

DOI: 10.31038/AWHC.2024723


Businesses and institutions rely on brain power to make important decisions, to solve critical challenges, and to think creatively and analytically. Employees also report that their work plays a major role in their brain health. However, most employees are reporting that work negatively impacts their brain, and the Organization for Economic Cooperation and Development’s (OECD) New Approaches to Economic Challenges initiative estimates that impaired brain health is costing the global economy as much as $8.5 trillion a year in lost productivity. This calls attention to the need for organizations to promote a healthy brain culture in their workforce, involving the implementation of programs and policies and creating an environment that supports brain health and function [1-4].

The HERO Health and Well-being Best Practices Scorecard in Collaboration with Mercer© (HERO Scorecard) is a free online survey that was designed as an educational and benchmarking tool to help employers identify and assess their use of practices that support more effective health and well-being initiatives. Version 5 of the HERO Scorecard was updated in 2021 to include recent emerging best practices in health and well-being initiatives in each of the six domains that the Scorecard measures (i.e., strategic planning, organizational and cultural support, programs, program integration, participation strategies, and measurement and evaluation). In late 2023, HERO convened a group of workforce brain health experts for an exhaustive review of the Scorecard to identify the workforce health and well-being practices that related to brain health. After extensive discussion, the final proposed practices were assigned tentative scores (out of a possible 100 points). Six independent subject matter experts then reviewed the proposed items and scores. Their feedback was combined and informed further revisions to the items included and final point allocations. A list of all practices included in the Brain Health Best Practice Score can be found in the HERO Scorecard user’s guide. In brief, the score is an indication of an organization’s adoption of practices related to policies, leadership support, programs, lifestyle behaviors, and the built environment. Table 1 provides a breakdown of the number of practices and points by section for the Brain Health Best Practice Score [5].

Table 1: Brain Health Best Practice Score Questions, Practices, and Points by Section

Scorecard section

Number of questions Number of practices

Points

Strategic planning

5

21 25.25

Organizational & Cultural Support

8 45

34.25

Programs

7

34 18.50

Program Integration

4 11

6.50

Participation Strategies

3

9 7.25

Measurement & Evaluation

1 7

8.25

TOTAL

28

127

100

Among the 388 organizations that completed the HERO Scorecard Version 5 through March 31, 2024, Brain Health Best Practice Scores were retroactively calculated. Organizations were categorized in many ways to examine variations in Brain Health Best Scores by size, industry type, percent of employees working remotely, geographic location, percent of workforce that is female, and age of employees.

  • Organizations were categorized by size into small (<500; n=118), midsize (500 to <5,000; n=161), and large (5,000+; n=104)
  • Industry type differences were assessed between financial (n=37), hospitals/healthcare clinics (n=36), technical/ professional services (n=68), government (n=52), education (n=58), manufacturing (n=34), and other (n=55), as well as for organizations that identified as high tech (n=90)
  • The percentage of employees working remotely was categorized as fully in-person (n=38), <25% remote (n=150), 25 to <50% remote (n=54), 50% to <75% remote (n=39), and 75% or more remote (n=70).
  • Geographic location was categorized as organizations with headquarters in Western (n=135), Midwestern (n=86), Northeastern (n=83), and Southern (n=81) regions.
  • Percent of workforce that is female was categorized as ≤40% of employees are female (n=141), 41 to 59% of employees are female (n=101), and ≥60% of employees are female (n=136).
  • Age of workforce was categorized as above the median age (>43 years; n=162) of responding organizations average age of employees and equal to and below the median age (≤43 years; n=211).

The mean Brain Health Best Practice Score for all respondents was 46.2 points. When comparing the Brain Health Best Practice Score by organization size (Table 2), large organizations received higher scores (mean = 58.8 points) than small organizations (mean = 33.2 points) or midsize organizations (mean = 46.9 points).

Table 2: A comparison of Brain Health Best Practice Score by Organization Size

n

Brain Health Score (X ± SD)

Small (<500 employees)

118

33.2 ± 18.4

Midsize (500 to <5,000 employees)

161

46.9 ± 19.3

Large (>5,000 employees)

104

58.8 ± 18.7

Large variations in Brain Health Best Practice Scores were observed among different industry types, with mean scores ranging from 40.8 for governmental organizations to 60.5 for financial service companies (Table 3).

Table 3: A comparison of Brain Health Best Practice Score by Industry

n

Brain Health Score (X ± SD)

Education

58

47.3 ± 22.5

Financial services

37

60.5 ± 20.6

Government

52

40.8 ± 16.3

Hospitals/Healthcare clinics

36

48.1 ± 22.6

Manufacturing

34

41.2 ± 20.0

Other services

55

41.5 ± 19.9

Tech/professional services

68

47.0 ± 20.3

Identified as High Tech

90

50.7 ± 21.0

Not identified as High Tech

294

44.6 ± 20.9

Brain Health Best Practice Scores differed among organizations with varying proportions of remote workforce. Overall, the organizations that reported being fully in-person scored the lowest of all groups with a score of 37.0. By contrast, organizations that reported 25-49% of their employees regularly work remotely reported the highest average score of 54.7. Table 4 displays the Brain Health Best Practice Score for all remote workforce categories.

Table 4: A Comparison of Brain Health Best Practice Score by Percent of Workforce that Regularly Working Remote.

n

Brain Health Score (X ± SD)

Fully in-person

38

37.0 ± 21.2

<25% remote

150

46.5 ± 20.6

25% to <50% remote

54

54.7 ± 21.5

50% to <75% remote

39

47.4 ± 20.2

75% + remote

70

42.9 ± 19.9

The comparison by U.S. geographic regions revealed minimal differences in the Brain Health Best Practice Score by region (Northeastern 47.2 ± 22.4, Midwest 46.1 ± 22.2, Southern 44.4 ± 21.0, West 47.0 ± 20.0). Similarly, there were minimal differences in the Brain Health Best Practice Score by the percent of female in the workforce. Organizations with ≤40% of employees that are female scored the lowest (43.3 ± 21.6), whereas organizations with similar percentages of male and female employees and those with ≥60% female employees scored slightly higher (41-59% female = 48.5 ± 19.3, ≥60% female = 47.4 ± 22.7). Finally, the average Brain Health Best Practice Score was found to be comparable between organizations that report an average employee age above 43 years (45.9 ± 22.1) and those with an average employee age ≤ 43 years (46.9 ± 21.0).

Overall, these findings highlight numerous opportunities for improvement in the implementation, promotion, and evaluation of workforce health and well-being initiatives to address brain health. Insights from neuroscience highlight the connection between physical health, mental health, and brain health.Organizations need to understand these connections in order to develop successful workforce health and well-being initiatives that positively impact the brain health of their workforce, ultimately leading to more healthy, happy, and productive employees. The HERO Scorecard’s Brain Health Best Practice Score can act as an educational tool to help organizations better understand how practices related to physical health, mental health, social connection, etc. are associated with brain health. Further, it can help inform an organization’s strategic plan by identifying areas of opportunity in which new programs, policies, and interventions can be implemented with the goal of improving workforce brain health. Organizations are encouraged to take the HERO Scorecard annually to measure progress and identify new areas of opportunity and focus [5,6].

References

  1. The Business Collaborative for Brain Health (2024) Available from https:// org/about
  2. Imboden M (2024) Maintaining Brain Health: An Imperative for Successful Aging and Business Performance 38(4)
  3. Robinson B (2023) Work Damages Your Brain Health, But 4 Strategies Can Improve It, Study Finds. Available from: https://www.forbes.com/sites/ bryanrobinson/2023/03/02/work-damages-your-brain-health-but-4-strategies-can- improve-it-study-finds/
  4. Organization for Economic Co-operation and Development (OECD)(2020) OECD Health Statistics. Available from: https://www.oecd-ilibrary.org/social-issues- migration-health/data/oecd-health-statistics_health-data-en
  5. HERO Scorecard. HERO (2024) Available from: https://hero-health.org/hero- scorecard/
  6. Kelly O Brien, MPA (2024) Unlocking Workplace Brain Health to Fuel Prosperity and Healthy Longevity 38(4).

The Cultural Elements in the Experience of Caregiving for Family Members with Alzheimer’s Disease

DOI: 10.31038/PSYJ.2024641

Abstract

With the increasing life expectancy, the world is facing population aging and related diseases. In this context, Alzheimer’s disease is one of the main neurodegenerative diseases that occur during the aging process. It compels family members of affected individuals to dedicate themselves to their care. Consequently, those who provide care are called family caregivers. They are engaged in a demanding caregiving relationship. The experience of caregiving is influenced by the cultural background of the caregivers.

This article aims to understand the cultural factors at play in the lived experience of caregiving among family caregivers. To achieve this, a clinical method, primarily case study, was employed, and data were collected through semi-structured interviews with caregivers in facilities dedicated to elderly care. Thematic content analysis revealed that Alzheimer’s disease is not universally perceived by all caregivers as a rupture. Some view their role as legitimate and rewarding (feeling useful, responsible, and competent). Cultural factors such as intergenerational solidarity and the desire not to contradict ancestors dominate their representation of the caregiving relationship.

Therefore, these cultural factors play an undeniable role in the caregiving relationship with close relatives who are experiencing illness. Taking these factors into account could be beneficial for the assistance provided to family caregivers.

Keywords

Alzheimer’s disease, Family caregiver, Lived experience, Caregiving relationship

Introduction

According to the World Health Organization (WHO) in 2022 [1], the proportion of people aged 60 and over in the global population will nearly double from 12% to 22% between 2015 and 2050. This rapid aging of the population necessitates significant efforts by all countries to prepare their social and health systems for this demographic shift. By 2050, the median age of the global population is expected to increase by 10 years, reaching 36 years.

As the world’s population ages, the incidence of Alzheimer’s disease and other types of dementia continues to rise. Alzheimer’s is a degenerative disease that causes brain lesions and is not a normal part of aging. Globally, approximately 46.8 million individuals are affected by dementia, with 58% residing in low-income countries. The frequency of new dementia cases is estimated at one every 3.2 seconds, totaling 9.9 million new cases annually. The WHO report from 2023 [2] projected a new dementia case every 4 seconds, equivalent to 10 million cases per year.

The impact of Alzheimer’s disease extends beyond individual patients, affecting families, caregivers, and communities. Understanding the cultural factors involved in caregiving for Alzheimer’s patients is crucial for providing effective support and improving the quality of life for both patients and their families.

In Africa, as in most southern countries, population aging poses numerous challenges, including the care of elderly individuals with reduced autonomy (Golaz, 2013). The current proportion of elderly individuals stands at 5.5% and is expected to more than triple by 2050 (Sajoux, Golaz, & Lefèvre, 2015), leading to increased demands for social protection and healthcare. Research indicates that elderly individuals in Africa face a significant burden of morbidity and disability, often due to chronic conditions that are frequently overlooked or untreated [3].

Within the context of large extended families in Africa, it becomes the duty of children to provide daily support and care for their parents, preserving the dignity and integrity of their ailing and dependent parents. African family dynamics consistently demonstrate this sense of duty toward parents, whether in North, West, South, or Central Africa.

In this context, caregiving for parents takes on an exclusive dimension, reversing traditional parent-child roles. In the eyes of children, parents are recognized for having provided unwavering attention, protection, and care, even during times of empowerment and strong family bonds.

Many informal caregivers actively engage in caring for sick individuals. In this study, we will use the term “caregiver” to define someone who primarily assists a dependent person within their immediate environment with daily activities [4]. Natural caregivers, family caregivers, or close caregivers encompass anyone who provides care or support.

Natural Caregivers: Understanding Their Role and Challenges

A natural caregiver, also known as a family caregiver or informal caregiver, refers to anyone who provides care and support to a family member, friend, or neighbor with physical or mental disabilities, chronic illness, or precarious health. These caregivers may be of any age and come from diverse backgrounds. Their profiles vary due to individual circumstances (such as age, gender, and cultural identity) and the specific needs of the person they assist (such as age and the nature of their disability).

According to the Quebec Institute of Statistics, 21.1% of the Quebec population aged 15 and older are natural caregivers. Their contributions are exceptional, but they may also require specific support and services. Many natural caregivers may not even realize they fall into this role, especially if the support they provide is occasional or if they have no direct family connection to the person they assist. However, the government adopts an inclusive definition of natural caregivers.

Definition of Natural Caregivers

A natural caregiver is defined by the Law Recognizing and Supporting Natural Caregivers as someone who provides support to one or more individuals in their close circle—regardless of age or life circumstances—who experience temporary or permanent physical, psychological, psychosocial, or other forms of disability. This support can be continuous or occasional, short-term or long-term, and is offered on a non-professional basis. It is provided freely, knowingly, and revocably with the goal of promoting the recovery of the person being cared for and maintaining or improving their quality of life at home or in other living environments. The support can take various forms, including transportation, assistance with personal care and household tasks, emotional support, and coordination of care and services. It may also have financial implications for the caregiver or impact their ability to care for their own physical and mental health or fulfill other social and family responsibilities.

Understanding the cognitive evaluation that natural caregivers make of their situation is crucial for adapting to the evolving circumstances and preventing feelings of burden. While natural caregivers share similar situations, their experiences can vary significantly. Adaptation skills and coping strategies play an essential role in managing the caregiving burden.

Indeed, natural caregivers constantly face what is known as “stressful situations,” defined as “a situation that an individual perceives as significantly impactful to their well-being and potentially exceeding their resources” [5].

Within this context, culture—understood as the collective characteristics of a specific group of people—becomes one of the factors influencing the caregiving experience among family caregivers of individuals with Alzheimer’s disease. According to Abou [6], culture encompasses the ways of thinking, acting, and feeling within a community, relating to nature, humanity, and the absolute. Group culture functions as a system that ensures coherence, facilitates organization, and symbolically regulates social life. It serves as a container where both implicit and explicit beliefs and convictions of the group reside. Culture thus acts as a knowledge system that organizes individuals within a given group around symbols, explicit and implicit concepts, and functions as a collective entity.

In line with this perspective, this article aims to explore the cultural elements at play in the caregiving experience among family caregivers.

Methodology of the Study

In line with the study’s objective, we employed the clinical method, which is fundamentally qualitative and relies on case study analysis. This choice is justified by its focus on the uniqueness of each case, allowing for in-depth understanding. Specifically, we prioritized studying the functioning and lived experience of family caregivers in their caregiving situation.

The case study approach aims to capture the singularity of each case. We conducted the study within Wellbeing associations in Yaoundé, APAC in Douala (Cameroon), and the Geronto-Geriatric Center in Melen-Libreville (Gabon). Participants were selected based on the following inclusion criteria: being a parent of the affected individual, being of legal age, serving as the primary caregiver for at least 6 months, not having a history of psychiatric illness, and obtaining a negative score on the Mini Zarit test.

After obtaining their consent, we emphasized confidentiality and anonymity. Subsequently, we proceeded with data collection.

In this study, we employed the clinical method, which is fundamentally qualitative and relies on case study analysis. This choice allows us to delve deeply into the psychological functioning of participants and comprehensively explore their experiences. Specifically, we focused on understanding the functioning and lived experience of family caregivers in their caregiving situation.

To collect data, we conducted semi-structured interviews. These interviews allowed participants to express themselves freely, providing valuable insights. We transcribed the spoken data to facilitate analysis. Our approach involved thematic content analysis, identifying essential themes or units of meaning. We selected key passages to empirically ground our analysis.

Results

Case Presentation

Case KM

KM is a 55-year-old widow, Catholic, and of Bamiléké ethnicity. She completed her education up to the first year of high school (1ère D). KM describes herself as an active woman in society, occupied by her profession as a “bayam-sellam.” This occupation involves purchasing staple food products in bulk from farms and selling them at retail prices in city markets. KM is the third of five siblings. For the past 10 months, she has been caring for her sick father. During the interview, she appeared relaxed and generously shared a wealth of information with us.

Case ED

ED is a 55-year-old woman from the Sanaga Maritime region, and she follows the Protestant faith. Despite her limited elementary education (CEPE – Certificate of Primary and Elementary Studies) obtained in Edéa, she expresses herself quite well in French. Her general knowledge surpasses her educational level, particularly regarding Alzheimer’s disease and societal matters. ED is a homemaker, married, and proud mother of five children.

Case LA

LA is a 35-year-old Cameroonian woman from the West region, specifically from the Bangangté tribe. She completed the equivalent of the third grade and works as a Community-Based Rehabilitation (CBR) agent. Her focus is on children and adolescents with disabilities.

Case P

P is a 30-year-old young military officer whom we met at the Geronto-Geriatric Hospital in Melen, Libreville, Gabon. He belongs to the Fang ethnic group, follows the Catholic faith, and holds a BEPC (Certificate of Basic Education). He is the second of three siblings, with the third sibling having passed away. As a single individual without children, he plays the primary caregiving role for his mother, who has been suffering from Alzheimer’s disease for several years.

In the relationship between KM and her parent, in addition to these moral values, we can see the influence of tradition that she upholds. She bases her motivation for fully playing her role as a caregiver on recognizing the bonds of kinship and a sense of moral obligation due to the care her parents provided in the past. She states, “I take care of my parent because I love them, and especially because they are my father.” Furthermore, she attributes to tradition a role akin to the superego, dictating the moral principles she follows. According to her, “If I were to abandon my parent during this illness, the ancestors and even God would be against me.” She adds, “According to tradition, a child should never abandon their parent.” For KM, caring for her parent is both a moral duty and a traditional obligation.

KM’s altruism means that she doesn’t concern herself with absent siblings in the caregiving relationship with their father. She is willing to give herself entirely for her brothers and sisters.

As for ED, her motivations in the caregiving relationship with her parent are evident in how promptly she mobilizes when her older brother expresses any concern about their mother’s health. She doesn’t hesitate to drop everything and rush to the village to assess the situation. She recounts, “When my mother fell ill, my older brother called me, saying that Mom wanted me, that she constantly mentioned my name, and that maybe she had something to tell me. So I went to the village… I asked her if I could take her with me to Douala, and she agreed. Then I sought my brother’s approval, and he gave his consent”. Beyond this dedication and constant concern, ED stands out with the certainty that she can take better care of her sick parent than anyone else: “But I want to stay by her side to make sure she gets better. I am convinced that no one can care for her like I can because I love my mother so much!”

In her altruistic spirit, ED acknowledges the sacrifices her mother made for her since childhood. This brings to mind authors such as Piaget, Wallon, Winnicott, and ethologists who emphasize the attachment bond between mother and child from early years, with lasting effects on the child’s personality. For ED, being close to her ailing mother evokes pleasant moments of affection, motivating her: “I have an opportunity to be close to her and repay what she has done for me since my childhood. I genuinely enjoy taking care of her because she’s my mother.”

According to her, it’s when parents are elderly that they become more valuable, contrary to modern notions of aging as a depleted, tired phase with nothing left to offer the younger generation: “Yes, even our village mothers become more endearing as they age because they have so much wisdom to share”.

In LA’s verbatim, we can discern her love not only for her grandmother but also for her own mother, who has always been caring toward her and her siblings. It’s as if through this assistance, she is also serving her own mother. Additionally, LA has experienced two divorces that affected her. Following the second divorce, she decides to live in the village and dedicate herself to caring for her grandmother. As the mother of her own mother, she believes her grandmother deserves her full devotion. It’s not only her duty to help but also a blessing to have a grandmother: “It’s normal; she’s my grandmother. I’m happy to take care of her, and I don’t complain even when it’s tough. It’s my duty as a granddaughter. Isn’t having a grandmother a blessing?”

In P’s case, we cannot overlook the positive influence of family harmony on lightening the burden of caring for their sick mother. Mr. P emphasizes that unlike families where discord prevails and individuals tend to shirk their responsibilities, in their family, a spirit of mutual aid ensures that no one feels “abandoned” in their caregiving duties. He highlights the importance of consultation in their relationship with their mother: “We consult on everything related to our mother’s health. Since her illness, we discuss her care more frequently”. It’s also worth noting that common sense prevails among the members of this family. While the older brother’s wife could have borne the responsibility of caring for their mother according to certain traditions, the brothers, especially our participant, come to her aid because she already has other significant family duties. This exemplifies practical wisdom within the family, contributing to lightening the burden. As our participant puts it, “The responsibility was too great to place solely on the wife, who already had a family to feed, care for, and children to educate. It was our duty as Mama T’s sons.”

He expresses gratitude for all the effort his mother put into raising them, especially their late sister. “Contrary to any hardship, I feel good because she has always been there for us, especially our late sister, whose passing deeply affected her. I’m content to take care of her”.

KM’s verbal expressions clearly reveal that cultural factors significantly influence her experience of caregiving for her father. She places great importance on the older generation, and her fear of ancestral retribution due to neglect is evident in her words: “According to tradition, a child should never abandon their sick father… If I even said he was wicked, may God forgive me…” Additionally, feelings of guilt and penance are present. KM believes that any wrongdoing toward parents is punished by God and ancestors. Out of fear of potential curses resulting from past misdeeds, she views caring for her parent as a form of penance.

Furthermore, KM emphasizes that her father deserves respect and honor in their culture: “He means everything to me. Besides, don’t you know that among the Bamiléké, parents are more cherished by children than anything else? If someone neglects their sick father, they don’t understand what they’re seeking, and they may even face curses!”.

According to KM, there is a belief that a curse awaits those who dare to neglect their sick or elderly parents. This starkly contrasts the treatment of older individuals in Western civilization versus African culture. While the former often involves retirement homes for the elderly, the latter keeps the elderly among their own, where they are cherished by their offspring. Like gathering around a fire, children find joy in surrounding their ailing father each evening, listening to stories, riddles, and advice. Even when ill, KM’s father remains a central figure around whom the children love to gather. This desire to be close to her sick father is particularly pronounced because other siblings envy KM. They believe she alone receives all the blessings from their father, while they must wait for holidays and vacations to share in them: “If any of them could leave their work to replace me, I’m sure they wouldn’t hesitate. During celebrations, the whole family gathers around Dad, and we celebrate together.”

Another testament to KM’s unwavering dedication to her father is her indignant response when asked about potential challenges in the caregiving relationship: “What problem could he cause me? I’ve been here since I understood he was ill. I’m proud to be his daughter, and I cannot neglect his illness!”.

ED’s family embodies the harmony characteristic of African families at large. This is evident in her older brother’s desire to have the sick mother sent to his home. Failing that, he sends one of his wives to assist our participant, ED, who insists on staying with the patient: “The family takes great care. My older brother even sent one of his wives to lend me a hand. He even asked me to send Mom to the village because there’s more family there. But I want to stay by her side to ensure she gets better.”

Despite knowing that tradition demands unwavering devotion from every child toward their parents, ED doesn’t need reminders. For her, it would be strange to act otherwise. Hence, she criticizes and feels indignant toward children who neglect their parents during illness: “We all know that even if tradition doesn’t explicitly require it, caring for parents is non-negotiable. If someone feels unable to do so, either they have a problem, or they’re not truly a child. I have no issues. Instead, I see it as an opportunity to be close to her and repay what she has done for me since my childhood. Taking care of her brings me genuine pleasure because she’s my mother”.

For LA, the notion of ancestral respect is sacred. She neglects her own needs in favor of those of her patient, and by extension, her own mother and other elders in the family. Even the patient’s numerous whims don’t cause her to lose her composure. She manages everything as best as she can. When necessary, she ensures she follows the patient during her wanderings to keep her in sight and avoid upsetting her. “Her biggest whims include eating everything and sometimes doing things her own way. But knowing it’s due to her illness, I endure and manage… It used to bother me a lot, but over time, I’ve grown accustomed to it. When she wants to leave, I let her and follow from a distance or send the children, as she can no longer cover long distances quickly.”

In P’s case, cultural factors influencing their experience primarily revolve around communal living. This manifests as harmony and cooperation among family members, where nobody shirks tasks but instead contributes willingly. Additionally, in this family, elders are revered, as Mr. P points out. This reverence for elders is a typical trait in African culture: “Elders are sacred beings among us”.

Discussion of Results

In Africa, old age is perceived not only as a time of rest but also as a sacred period for “reconnecting with the divine” (Tabboni, 2006, cited by Sadio-Ba Gning, 2015). Bourdieu previously noted that the entire relationship with the future is motivated by a desire to collaborate with God [7]. Consequently, old age is meant to involve contemplation and even asceticism for the elderly. Perceptions of old age, primarily shaped by implicit contracts, remind descendants of the intergenerational debt they must repay throughout their lives to their ancestors. In this context, participation in mosque or church discussions, visits to the sick, and pilgrimages to Islamic and Christian holy sites are highly valued. This assistance, which adheres to social norms, underscores the commitment children make to caregiving when their parents need assistance.

Old age represents a time of relinquishing personal plans, consolidated piety, strengthened moral authority, and the transfer of decision-making and economic power from the elderly to their descendants—the ones capable of maintaining family hierarchy and ensuring both material and moral survival.

Indeed, the care of elderly individuals in Africa follows a differentiation that favors male descendants with good socioeconomic status, often at the expense of women and younger siblings (Gning & Antoine, 2015). Descendants view old age as a “social retreat,” allowing parents to reap the fruits of their investments, sacrifices, and deprivations in peace and comfort. The elderly maintain precedence, arbitrate conflicts, and serve as guarantors of family cohesion (Golaz, 2007). Old age symbolizes a golden era, conferring respect, power, and social recognition. It becomes a means to revitalize the “social contract” of lineage.

In Africa, the need for assistance extends beyond professional care. Considering the trajectory of illness and care as developed by Corbin and Strauss [8], we recognize the significance of the family framework in dynamically rethinking the involvement of family members in providing necessary care for their loved ones. Communication, dialogue, and family solidarity play crucial roles in caregiving, whether rooted in blood ties, traditional values, or religious pillars. Each subject demonstrates that the family is the essential support system for bearing the burden of care.: Gning, S., & Antoine, P. (2015).

In Vieillir en Afrique (pp. 15-30). L’Harmattan. “Boquet and colleagues [9] drew attention to the cultural values of social groups and the social change that affects families, as the meaning attributed to assistance largely depends on it. It appears that intergenerational solidarity within the culture and the sense of gratification experienced in the caregiver-care recipient dyadic relationship are the cultural factors involved in the experience of caregiving among family caregivers of individuals with Alzheimer’s disease [10-21].

Conclusion

The objective of this article was to understand the cultural factors at play in the caregiving experience among family caregivers of individuals with Alzheimer’s disease. To achieve this, we used a clinical method, specifically case studies. Data were collected through semi-structured interviews with four caregivers from Wellbeing associations in Yaoundé, APAC in Douala (Cameroon), and the Geronto-Geriatric Center in Melen-Libreville (Gabon).”

Following a thematic content analysis, the obtained results reveal that Alzheimer’s disease is not necessarily perceived as a rupture by all caregivers. Some view their role as legitimate and rewarding (feeling useful, responsible, and competent). Cultural factors such as intergenerational solidarity and the desire not to upset ancestors dominate their representation of the relationship with their close relative. Consequently, these cultural factors play an undeniable role in providing assistance to close family members in situations of illness.

Taking these factors into account could be beneficial for the support offered to family caregivers. Beyond the daily care of individuals with Alzheimer’s disease, family caregivers also require psychological support to provide them with additional resources for coping with the situation. This, in turn, contributes to improving their quality of life.

References

  1. World Health Organization (2022). Aging and Health.
  2. World Health Organization (2023). Dementia.
  3. Aboderin IA,Beard JR. (2015). Older people’s health in sub-Saharan Africa. The Lancet 385: 9-11. [crossref]
  4. Confederation of Family Organisations in the European Union (2007). European Charter for Family Carers. COFACE Families Europe.
  5. Coudin G. (2004). The reluctance of family caregivers to use gerontological services: A psychosocial approach. Psychology & NeuroPsychiatry of Aging 2: 285-296.
  6. Abou S. (1981). Cultural identity. Anthropos.
  7. Bourdieu P. (1982). Rites as acts of institution. Actes de la recherche en sciences sociales 43: 58-63.
  8. Corbin J M, Strauss A. (1988). Unending work and care: Managing chronic illness at home. Jossey-Bass
  9. Bocquet H, Berthier F, Pous J. (1996). Role and burden of caregivers for dependent elderly people: An epidemiological approach. Aging, Health, and Society 143-162.
  10. Cuijpers P. (2017). Four decades of outcome research on psychotherapies for adult depression: An overview of a series of meta-analyses. Canadian Psychology 58: 1-7.
  11. Darnaud T. (2003). Alzheimer’s disease and its victims… Cahiers critiques de thérapie familiale et de pratiques de réseau 133-147.
  12. Ducharme F. (2006). Family and care for the elderly: Challenges and strategies.
  13. Etters L, Goodall D, Harrison B E. (2008). Caregiver burden among dementia patient caregivers: A review of the literature. Journal of the American Association of Nurse Practitioners 20: 423-428.
  14. Aging in Rural Sereer Communities in Senegal: From Family Life to Social and Health Isolation of Very Elderly Individuals. In L. Nowik and B. Lecestre-Rollier (Eds.), Aging in Southern Countries (pp. 119-138). Karthala.
  15. Polygamy and Older Persons in Senegal. Mondes en développement 3: 31-50.
  16. Towards a New Definition of Intergenerational Relations in Gusii Rural Communities (Southwest Kenya). Intergenerational Relations in Africa: A Plural Approach 231-249.
  17. Dependency in Africa. Gerontology and Society 36145.2: 77-89.
  18. Gottlieb BH, Rooney J A. (2004). Coping effectiveness: determinants and relevance to the mental health and affect of family caregivers of persons with dementia. Aging & Mental Health 8: 364-373.
  19. Michon A, Deweer B, Pillon B, Agid Y, Dubois B. (1994). Relation of anosognosia to frontal lobe dysfunction in Alzheimer’s disease. J NeurolNeurosurgPsychiatry 57: 805–809.
  20. Assessment of Burden in Natural Caregivers: Properties of the French Version of the Brief Burden Interview. Revue québécoise de psychologie 25: 187-202.
  21. Africa, a Young and Heterogeneous Continent Destined to Age: Challenges in Social Protection for Older Persons. Mondes en développement 3: 11-30.
FIG 7

Landscapes of Origin: Geoparks and Pilgrimage

DOI: 10.31038/GEMS.2024641

Abstract

This is an ethnological analysis of six unique geology reserves (or geoparks) each being the center of a larger geological landscape (or geoscape). Each park has been given special historical preservation status in the United States because of its cultural meanings to Native Americans and its special geological features. Ethnographic studies were funded to understand the special cultural connections between individual geological areas and cultural a more general ethnological perspective on such heritage places. The authors of this analysis participated in the ethnographic study of four of the six affiliated Native Americans. This analysis further compares these findings, drawing out four themes common across the case studies and thus producing geoparks.

Keywords

Landscapes of origin, Geoparks, Geoscapes, Pilgrimage, North American, Native American sacred areas

Background

The most current understanding of the UNESCO preference for using geology heritage terms like geoparks for research and management is discussed in a special issue of the journal Land entitled Geoparks, Geotrails, and Geotourism—Linking Geology, Geoheritage, and Geoeducation that was edited by Margaret Brocx and Vic Semeniuk [1]. They summarize the worldwide movement towards using these concepts to better understand heritage places that involve a number of geoparks and geotrails that have been established, e.g., UNESCO. Global Geoparks where the geology, geotours, and local economy are linked for the well-being of the local people and operate under the auspices of UNESCO, and National or State-oriented geoparks/geotrails where the geology is identified as significant and preserved in conservation estates and utilized for tours, education, and other commercial purposes. Well-designed and organized geoparks/geotrails provide valuable sites for geoeducation, including suitable localities for collecting minerals and fossils, and all types of geoparks/geotrails can function for geotourism. Geotours in geoparks/geotrails provide excellent opportunity for introducing the public and students to the wealth of information and history that the Earth has to offer and professional geologists to the diversity of Earth Science globally. This analysis contributes to our understanding of the UNESCO use of geoparks by demonstrating how Effigy Mounds National Monument (NM) and its surrounding ceremonial landscape fits into a broader discussion of multi-ethnic [Ethnicity is the social organization of cultural difference (Barth 1969). We use ethnic groups here to denote socially defined subdivisions of a common cultural heritage. Ethnic group membership tends to be organized by a number of boundary mechanisms, which may include shared religious practices, ancestry and descent, origin stories, geographies of and attachments to place, and language] ceremonial centers also known here as Landscapes of Origin and geoscapes. The purpose of this ethnological analysis is to show that, while Effigy Mounds has its own unique functions and connections, it parallels other ceremonial centers discussed in this analysis. The six case studies presented here were selected to demonstrate how some time-keeping elements using geological features, healing places, and renewal ceremonial locations are comparable with other heritage geoparks. In a book entitled Landscapes of Origin in the Americas: Creation Narratives Linking Ancient Places and Present Communities, Jessica Christie (2009) [2] assembled nine case studies of how Native American ethnic groups understand, use, and are attached to origin places. The cases are from North, Central, and South America. The organizing thesis of her book is that Creation is a complex concept which variously can mean where we came into previous worlds, where we came into the current world, or where we were culturally recreated as a result of some monumental event.

All Creation events discussed here, and thus their recounting through time, are tied totopographic places and, often, multiple geological features. Normally these places are topographically spectacular—the junctions of large rivers, a salt deposit in the caldera of a massive volcano, a mountain in a flat terrain, or the outcropping of a special mineral for making ceremonial pipes. Landscape of Origin naturally has a destination area, which is the focus of various kinds of ceremonies such as those associated with world balancing and conflict resolution activities, individual vision quests, and spiritual healing. At the center of the destination there often are a series of sequential use protocols which we have termed local ceremonial landscapes [4,5]. The journey to the destination center typically occurs along well established pilgrimage trails, which in turn have functionally special locations for ceremony (Grassy pubs). This ethnological analysis helps us to understand Effigy Mounds by placing it in a wider Native American heritage geoscape frame.

Landscapes of Origin

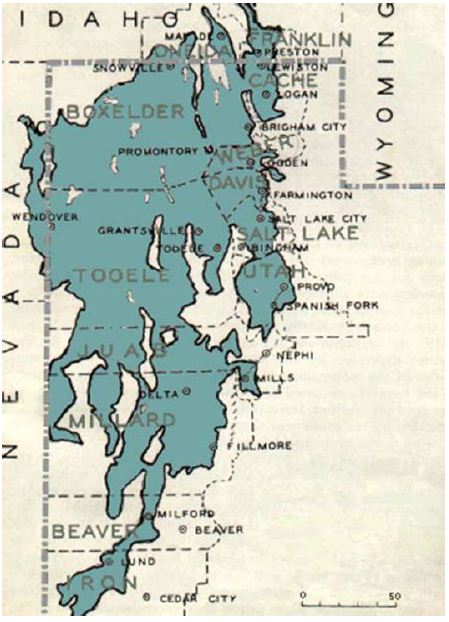
Tribal representatives describe Effigy Mounds [Effigy Mounds is used in this article instead of the acronym Effigy Mounds NM in order to talk about not only the monument lands but also the surrounding immediate landscape. The distinction upholds Native American uses shared during ethnographic interviews] as a large ceremonial center, which is located in an extensive, functionally integrated cultural landscape, called here a Landscape of Origin. The Effigy Mounds center and landscape have been used by many different Native American groups for thousands of years. Native American people have long maintained connections to Effigy Mounds through ceremonial activity and their origin and creation stories. Effigy Mounds also has been understood as an area free from inter-ethnic conflict; thus all culturally associated tribes have an inherent right to visit for ceremonial activities and conflict is not allowed in this sacred space. With these core understandings, it is important to place Effigy Mounds into a broader discussion of multi-ethnic ceremonial centers (Figure 1).

FIG 1

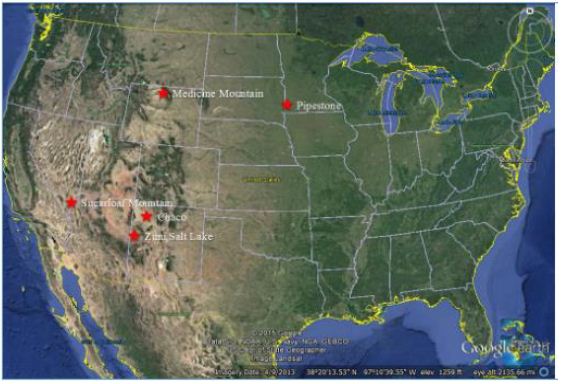
Figure 1: Map Placing the Five Multi-Ethnic Ceremonial Areas

This essay describes and compares six (6) Native American Landscapes of Origin including Effigy Mounts, in North America. The five other cases are (1) Pipestone National Monument (Pipestone), (2) Medicine Wheel/Medicine Mountain National Historic Landmark (Medicine Mountain), (3) the Zuni Salt Lake and Sanctuary (Zuni Salt Lake), (4) Chaco Culture National Historical Park (Chaco), and (5) Sugarloaf /Gold Strike Canyon (Sugarloaf Mountain) (Figure 2.1). The patterns or elements of these well-known Native American geoparks and geoscapes are used to situate Effigy Mounds as a ceremonial center.

Effigy Mounds

In the past, a number of Native American groups visited places located within the monument boundaries and the surrounding landscape for a variety of reasons, such as holding ceremony, burying their dead, and maintaining the mounds (Figure 2). While at this ceremonial center, interactions between the diverse groups were peaceful, due to the shared value of the mounds as a neutral zone for ceremonial use (Figure 2).

FIG 2

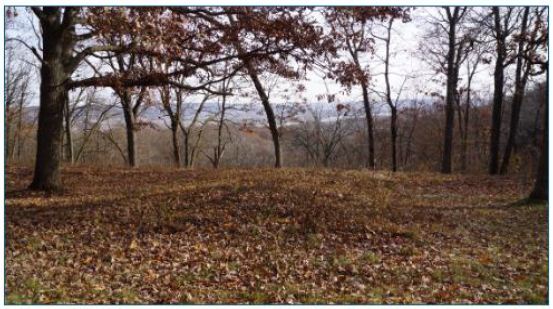
Figure 2: Landscape and Viewscape from the Marching Bear Group

Howey, whose work focused on mound groups in northern Michigan, suggests that mound groups may have served as ceremonial areas that build on pan-residential interaction and trade [6]. She argues that embedding these centers in the sacred allows members of communities from separate territories to meet and exchange goods where liturgical order ensures moral behavior, therefore public ritual restrains individual competition or hostility [6]. In short, the political functions of public ritual were just as important as the religious functions. These mounds were centered in shared ritual that brought communities from great distances. These relationships strengthened social bonds between territorially distinct groups and added group interdependencies through economic specialization. Building upon his research on mounds in South America, Dillehay [7] notes that once monuments are engaged in public ritual, they organize people’s responses and patterns of interaction. Similar cultural use patterns occurred along the Upper Mississippi River watershed. Tribal representatives maintained that these mounds served as a gathering place for the celebration of the solstice and other ceremonies, as well as the final resting place for spiritual leaders and other deceased community members from a number of tribes. Through time, Effigy Mounds continued to be a sacred place, or spiritual center, lending credence that it was seen as hallowed ground and a place of nonviolence.

Origin Stories

Effigy Mounds are a key component of many Native American tribes’ oral histories and creation stories. According to ethnographic interviews conducted during this study, Dakota, Ioway, and Winnebago have stories that connect them with the various mound groups within the monument. Tribal representatives noted that the zoomorphic effigies are closely linked to medicine and clan origins and migration. In particular, the Marching Bear Group found in the South Unit is associated with a period in history where the Ioway, Winnebago, and others were once part of one larger group of people. At one point the various clans within this larger society agreed to separate peacefully into multiple tribes. An Ioway representative noted that the formation of the Marching Bear Group is representative of that event (Figure 3). Each group broke away and headed their separate ways, one by one.

FIG 3

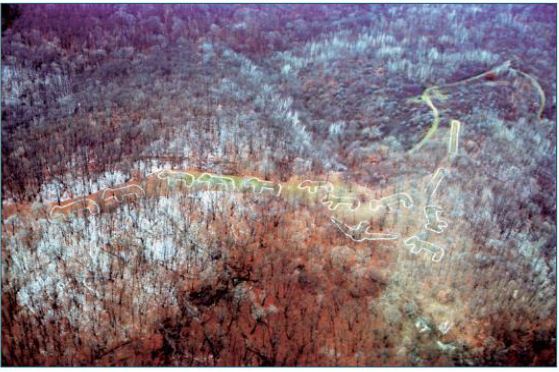
Figure 3: Aerial View of Marching Bear Group in the South Unit of Effigy Mounds (NPS)

Ho-Chunk oral histories tell of an origin story that tribal representatives believe corresponds to the Marching Bear Group: One night, the Great Spirit appeared to Bear in a dream, “My son,” he said, “it is time to leave your home and go to a new home I have made for you. No longer will you eat solely from the water. There will be other food that I have out there for you to eat.” So Bear called a council with all the other animals, including Wolf, Deer, Eagle, and Buffalo. It was decided that Deer would lead the way, so he and his people left first. Bear and his people left in the second group, followed by Wolf in the third group. Buffalo left the next morning. The final animal to leave was the mighty Eagle. Before he departed, he blessed the people who were left behind. Eagle then flew into the sunrise and disappeared over the mountains. The spirits of the early people watched them leave with tears in their eyes, but happiness in their hearts [8]. Oral history, such as the Ioway and Ho-Chunk stories, reaffirms contemporary Native American people’s connections to Effigy Mounds.

Pilgrimage and Ceremonial Activity

Human societies form complex connections and relationships with the environment that surrounds them. Their cultural understandings of the land are shared and transferred over generations through oral traditions and ceremony [9,10]. Many cultural groups, or ethnic groups, can hold different understandings of the same land [3]. For many Native American people, these engagements are grounded in their epistemologies and oral traditions [11-13]. Places are connected through songs, oral history, human relations, ceremony, and both physical and spiritual trails. These connections create synergistic relationships between people, places, and objects during ceremony. These types of connections and relationships are important for understanding the concept of pilgrimage. The act of pilgrimage involves religious specialists traveling to unique and powerful places and landscapes along special, well-established ceremonial pathways. As the religious specialists, or pilgrims, follow these trails, they perform ritual acts, which are critical to successfully completing the pilgrimage ceremony. The pilgrimage process allowed the pilgrims to gain knowledge and power at their destination places to use in ceremonies to restore balance and promote sustainability in their home communities.

The term pilgrimage is used here to describe the ceremonial journey cultural and religious leaders took when they visited the Effigy Mounds NM area. The UofA team chose this term because it was believed to be the best way to describe how the tribal leaders’ travel and visitation to their area would have hade social and spiritual importance. During pilgrimages, the travelers are left without their normal social structure, and a community or communitas (even if it is temporary) is formed [14]. Pilgrims use these new relationships to develop protocols for how to behave and perform rituals along the trail. These roles are based on the pilgrims’ ceremonial responsibilities and needs that are necessary for a successful pilgrimage. Ceremonial activity brings together people from different communities and cultural backgrounds [15-19].

Effigy Mounds served as a major ceremonial destination place for many Native American groups for thousands of years. Religious specialists followed specific trails, which included both terrestrial and water travel components. During their journeys, religious specialists likely visited places to pray and leave offerings along the routes in order to physically and spiritually prepare themselves to enter Effigy Mounds. Once they reached their destination place, religious specialists engaged in certain types of ceremonial activities. It is believed that certain types of activities occurred seasonally while others occurred annually at Effigy Mounds. According to some of the tribal representatives, ceremonies occurring at various locations within the monument were tied directly to time keeping. At least one mound group found on the high bluffs was constructed and placed in such ways that solar and lunar movements could be observed during the summer solstice. Time keeping is an important activity that exists in all human societies. Designated medicine men/religious specialists were trained for this task by tracking the movements of the planets, stars, moon, and the sun. Originally, physical time was marked at stable places on the landscape. Time often dictates and influences when specific human activities, such as ceremony, take place. Tracking solar and lunar movements plays an especially important role in agriculture; time keeping helps determine the best time for planting and harvesting produce [20]. Another major ceremonial component of Effigy Mounds was the annual activity of reconnecting with the ancestors and memorializing the deceased, as noted by tribal representatives. Annually, Native American people from connected communities visited Effigy Mounds for funeral ceremonies. Families worked together to bring in raw materials to repair and stabilize the mounds. Native American people brought the remains of important community members or religious leaders to be placed in the burial mounds at Sny Magill or on the high bluffs. Additionally, as part of the ritual activities, offerings would be brought and placed in and around the mounds.

Historical Accounts

Reuben Thwaites documented Prairie du Chien, which is located just across the Mississippi River (Figure 4), as a key trading center amongst numerous Native American tribes. [21] asserts that up to 6,000 Native Americans would visit annually. Blaine [22] makes a similar assessment about the region, referring to Prairie du Chien as an “older Indian trading rendezvous.” The proximity to the Wisconsin and Yellow River further affirms the magnitude of trade in this area, tying this landscape to the west via the Yellow River, and to the Great Lakes region via the Wisconsin River. Materials found within the burial mounds in and around Effigy Mounds also help frame the context of centralized trade in this area. Located within the mounds were traces of copper, mica, shells, and obsidian. It is speculated that each one of these materials was traded from areas to the north, south, east, and west.

FIG 4

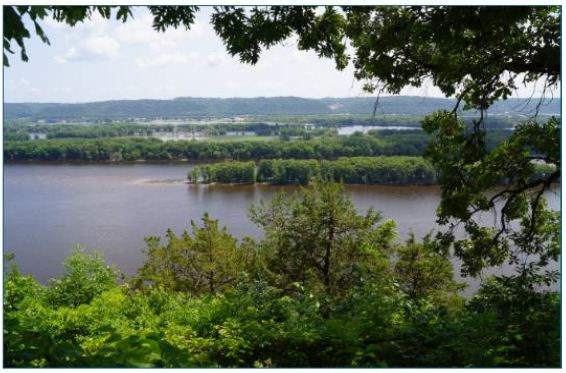
Figure 4: View of Prairie du Chien from Effigy Mounds

Native American people came together in the Prairie du Chien area for other types of events aside from trade rendezvouses. Early Euro-Americans in the region noted accounts of Native American people coming together to take part in ceremonial games, such as lacrosse. According to the Ho-Chunk Nation’s timeline of their tribal history, over 300 people representing the Winnebago, the Fox, and the Sioux gathered to participate in a large lacrosse tournament near Prairie du Chien [23].

Landscapes of Origin Cases Elsewhere

Various ceremonial centers found in North America were utilized by multiple ethnic groups for a wide range of purposes. These locations had ritualistic and ceremonial components related to Native American epistemology and reinforced both intra- and inter- tribal bonds. Among these locations are: (1) Pipestone, (2) Medicine Mountain, (3) Zuni Salt Lake, (4) Chaco, and (5) Sugarloaf Mountain. The following section provides information on these locations and shows the parallels between them and Effigy Mounds.

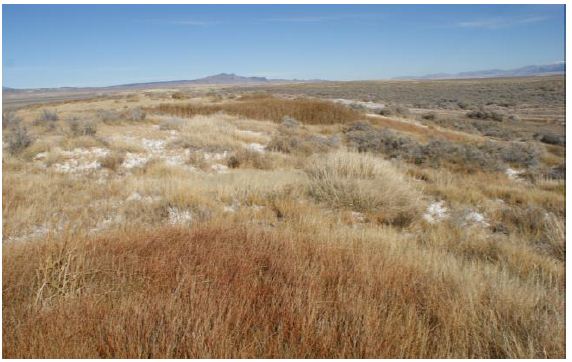
Pipestone National Monument Case One

Pipestone National Monument (Pipestone) is located in Pipestone County, near the three-state border of Minnesota, South Dakota, and Iowa (Figure 5). Before the arrival of Europeans, various Native American groups lived in the vicinity of the present-day monument. They, along with other Native American groups who did not live in the immediate vicinity of the monument, visited the quarry in order to obtain catlinite to manufacture ceremonial pipe bowls and other objects. The stone gets its name from nineteenth-century artist, George Catlin, who described and painted it. The monument takes its name from this resource, and later the quarry and adjacent area became a national monument in 1937 [24].

FIG 5

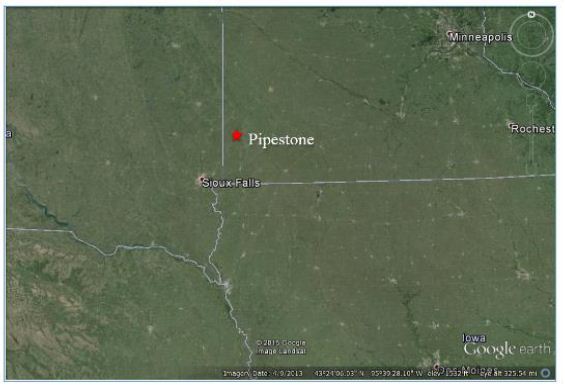
Figure 5: Pipestone Landscape

Before Euro-American settlers introduced drastic changes to its natural landscape, the monument included some wetlands and tall grass prairies. This area was under natural fire and drought cycles that preserved its open grassland ecosystems. The monument lies on the outer, southwestern edge of the “Prairie Lake” subregion of the Northeastern Plains, which is characterized by inland lacustrine and riverine drainage systems that once fed both grasslands and wetlands [25]. The ancient heritage cultural landscape of the Pipestone quarries was the product of several Native American tribes who made use of the area, and specifically the pipestone, since A.D. 1400-1450 (Figure 6). These included the Poncas, Omahas, Ioways, Otoes, Sacs, Foxes, and Sioux, although the latter were in control of the Coteau des Prairies by the early 1700s. Sioux interest in the quarries and surrounding region are attested to through migration stories and documented annual pilgrimages to this ceremonial center to obtain pipestone. The Sioux also went there to perform rituals, hold ceremonies, gather plants, and hunt wildlife. Some camp and village sites were established periodically in the region, as were breastworks or enclosures presumed to be defensive structures [24].

FIG 6

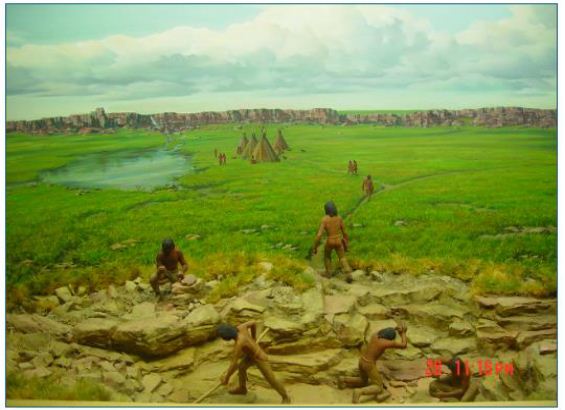
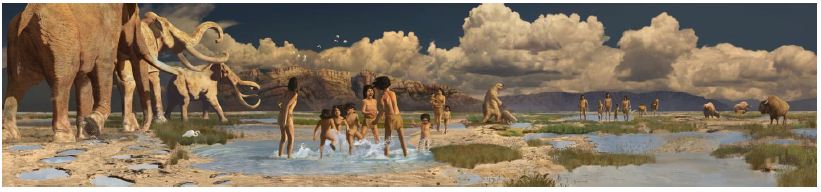
Figure 6: Artist’s Rendition of Ceremonial Activity at Pipestone from the Monument Visitor Center

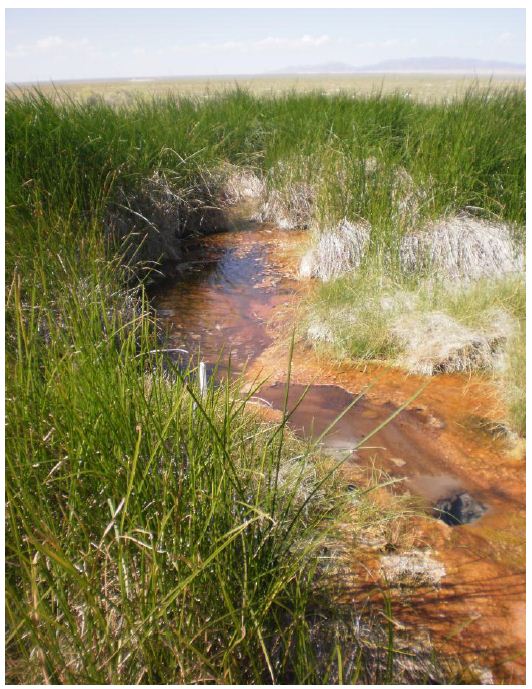
While ceremonial activities may have occurred elsewhere, it seems that the healing and ritual activities primarily involved the water, the waterfalls, and the view of the treeless prairie from the quartzite ridge. Overall, most activities involved one or more of four primary features in the traditional cultural landscape: the waterfalls, the Pipestone quarries, the Three Maidens, and Leaping Rock [5]. The sacred nature of the Pipestone local ceremonial landscape began with medicine plants and rites-of-passage rituals. Then, according to Sioux oral history, White Buffalo Women brought the pipe to the Sioux and the practice of quarrying pipestone began. Native American interpretations and attachments to the place persisted through time, although they became secondary to quarrying the pipestone [5]. The Cree also have oral histories about the sacred pipe and the creation of the catlinite quarry at Pipestone. Catlin [26] recorded one story of a Cree that had visited Pipestone: …in the time of a great freshet, which took place many centuries ago, and destroyed all the nations of the earth, all the tribes of the red men assembled on the Conteau du Prairie, to get out of the way of the waters. After they had all gathered here from all parts, the water continued to rise, until at length it covered them all in a mass, and their flesh was converted into red pipe stone. Therefore, it has always been considered neutral ground – it belonged to all tribes alike, and all were allowed to get it and smoke it together. Catlin documented several tribes’ origin stories of Pipestone. Each attributed the use of Pipestone to multiple groups, and each tribe emphasized Pipestone as a place of peace. For thousands of years, during which Native American people used this ceremonial center, it was primarily a male place where medicine men sought plants for healing, performed rites-of-passage, and pursued vision quests. One such rite involved a four-day submergence in the Pipestone Creek (Figure 7), after which boys became men and could be counted on to have the stamina necessary for hunting and fighting [5].

FIG 7

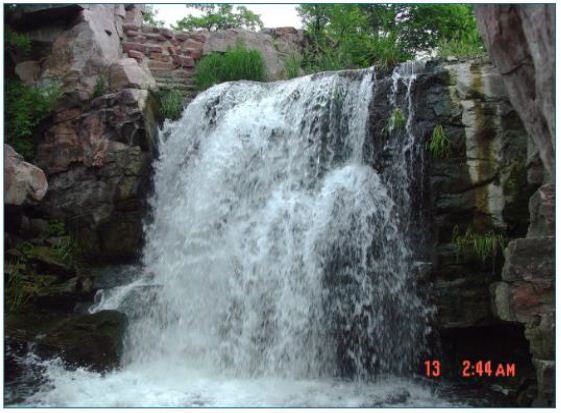
Figure 7: Winnewissa Falls along Pipestone Creek

Upon arriving at the ceremonial center, they would set up camp away from the quarries. Once greeted by thunder and lightning storms, the men would make ceremonial camps near the Three Maidens and begin to prepare themselves by cleansing in the creek and giving prayers and tobacco offerings at the Three Maidens, which is the gateway into the sacred areas of Pipestone. If thunder and lightning greeted them again, the place had heard their prayers and given them permission to enter the site. If thunder and lightning did not occur, the men may have returned to the ceremonial camp for more preparation or to the main camp to prepare for the return home [5]. Having entered the quarry sites, many of which paralleled the quartzite ridge for nearly a mile, the men who were not quarrying might continue with sweats and prayers until they were needed. Upon entering a quarry, each man would make a tobacco offering to indicate their purity and to protect them while they worked. When they were done, they took the offerings with them to show respect for the spirits of the sacred area [5].

Medicine Wheel/Medicine Mountain Case Two

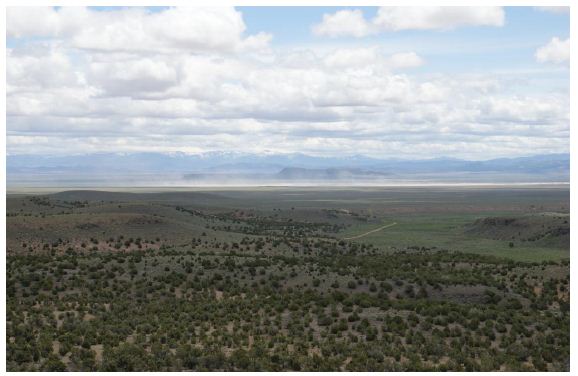
Medicine  Wheel/Medicine  Mountain  National  Historical Landmark (Medicine Mountain) is a large ceremonial center in present day Wyoming (Figure 8). Many Native American groups such as the Arapaho, Bannock, Blackfeet, Cheyenne, Crow, Kootenai- Salish, Plains Cree, Shoshone, and Sioux have all come to this area for ritual activity over the course of at least 7,000 years. Medicine men/religious leaders visited the mountain for a range of ceremonial activities related to doctoring and vision questing. During recent ethnographic studies, tribal religious leaders and tribal elders have pointed out that even across the many different groups connected to Medicine Mountain, there is a common and shared understanding of the spiritual and ceremonial importance of this landscape [27,28].

FIG 8

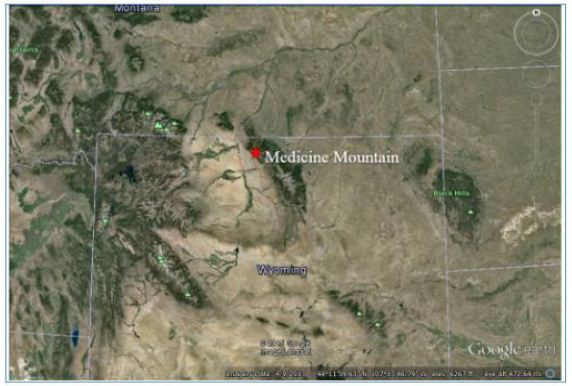
Figure 8: Medicine Mountain Landscape

Medicine Mountain (Figure 9) is at the center of numerous ceremonial trails leading into the area from different directions. Once religious leaders approached the base of the mountain, they would ascend the eastern slope. The trails along the eastern side of the mountain have been interpreted by some Native Americans as being linked to the notion that Medicine Mountain is not just a mountain, but rather it is a spirit lodge in a very literal sense [27-29]. The mountain houses important spirits, and for those visiting the mountain, they must approach it in the same culturally appropriate manner as you would a spirit lodge (Sun Dance or ceremonial lodges). In order to do so, it must be approached from the east.

FIG 9

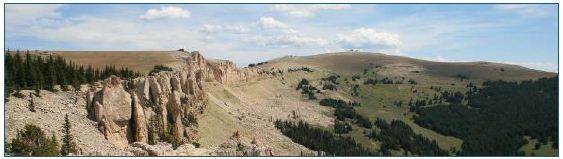
Figure 9: Medicine Mountain (NPS 2015)

The trails leading up the eastern flank of the mountain are marked with rock cairns surrounded by ritually deposited materials, or offerings. Numerous features are located along the trails up the mountain, such as stone-lined arrow effigies, rock cairns, prayer shrines, patches of medicinal plants, and places for short- and long- term occupancy. When reaching the top of the mountain, religious leaders had access to designated areas for vision questing along the rim [27-29]. The Bighorn Medicine Wheel on the ridge west of the Medicine Mountain summit is the principal ceremonial site (Figure 10). Native Americans have described it as “the altar” for Medicine Mountain. Healing ceremonies for sick individuals who have made the pilgrimage tothe mountain are performed in the northeastern part of the district [27-29].

FIG 10

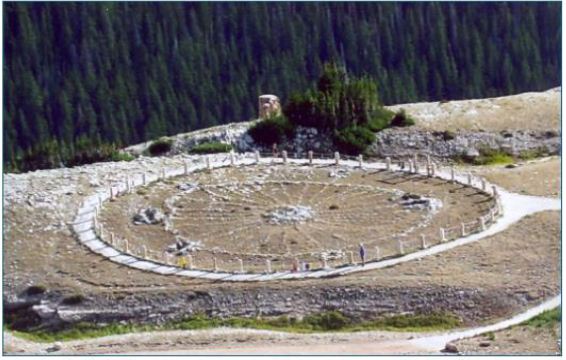
Figure 10: Bighorn Medicine Wheel

The large medicine wheel at the top of the mountain is also a ceremonial destination place. The medicine wheel has been used for two distinct ceremonial purposes during two time periods. It is believed that Native Americans first used the medicine wheel as a time keeping instrument with a select and highly specialized group of religious leaders involved in time keeping ceremonies. It was likely their pilgrimages to Medicine Mountain occurred at different periods than those for vision quest. At a later point in time, the medicine wheel became an area associated with doctoring ceremonies. During healing ceremonies, balance would be restored to both the patient and the surrounding environment [27-29].

Zuni Salt Lake and Sanctuary Case Three

Located 42 miles south of the Pueblo of Zuni, the Zuni Salt Lake and Sanctuary (Zuni Salt Lake) (Figure 11) is a ceremonial center that is approximately ten miles in circumference. This landscape of origin is on the NRHP as a historic archaeology district rather than a TCP due to the number of inholding private properties. The lake is located in a circular depression and contains a large concentration of salt. The crater was formed by volcanic activity associated with the two cinder cones found at the south side of the lake [30]. People are often drawn to volcanic sites; volcanic activity plays a key role in the development of unique minerals and biotic communities. Volcanoes are seen as special places, especially to Pueblo communities, whose membership often refer to them as Earth Navels [31]. This ceremonial center features in the oral histories of Acoma, Hopi, Laguna, and Zuni. Each pueblo has individual origin stories that account for the lake and the Salt Woman who resides in it. Duff et al. [32] identifies the Salt Woman in each pueblo’s history, known as Ma’lokyyattsik’i to the Zuni, Öng.wùuti to the Hopi, and Mina Koya to Acoma and Laguna (Figure 11).

FIG 11

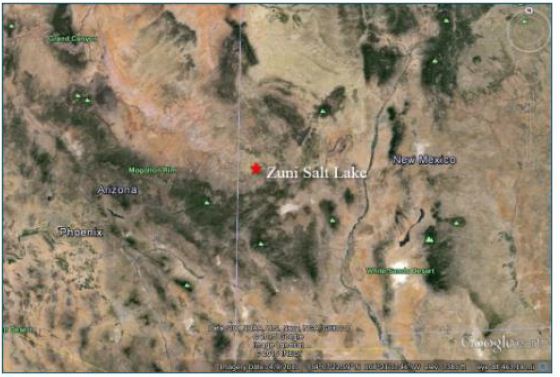
Figure 11: Zuni Salt Lake Landscape

Stories about Salt Woman have common themes among various Pueblo peoples. Salt Woman took a long journey to each of the tribes before she settled down at the salt lake, and her home can still be identified by the people in these respective locations. While living with the tribes she was not respected: some people wanted her to leave because of her appearance, and some even polluted her home. The Salt Woman eventually left the tribes and traveled east on the back of an eagle where she met Turquoise Man. From there she traveled south, leaving remnants of her travels behind, and eventually settled at the lake (Figure 12) [32].

FIG 12

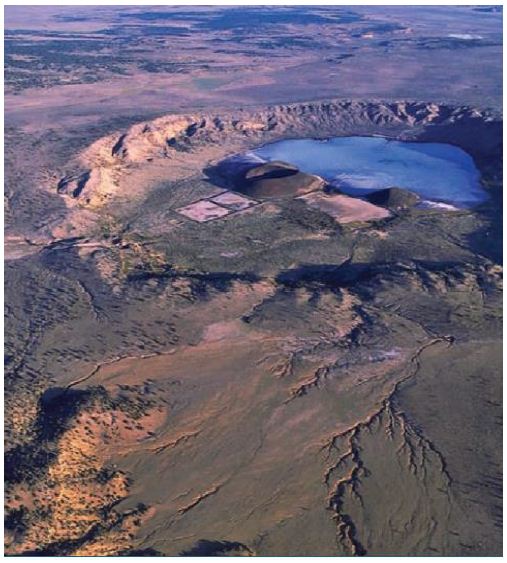
Figure 12: Ariel View of Zuni Salt Lake (Duff et al. 2008)

Realizing their mistakes, the Pueblos reconnect with the Salt Woman at Zuni Salt Lake by collecting the sacred salt from the lake. Out of respect for Salt Woman, the Zuni Salt Lake area is a conflict-free area. Today, the sacred salt is acknowledged as spiritually important to the people and used for ceremony and healing. The lake is surrounded by prehistoric trails that connect associated Pueblos. Contemporary pilgrimages take these pueblos to Zuni Salt Lake via these trails for ceremony and ritual collecting of this highly valued salt (Figure 13) [32,33].

FIG 13

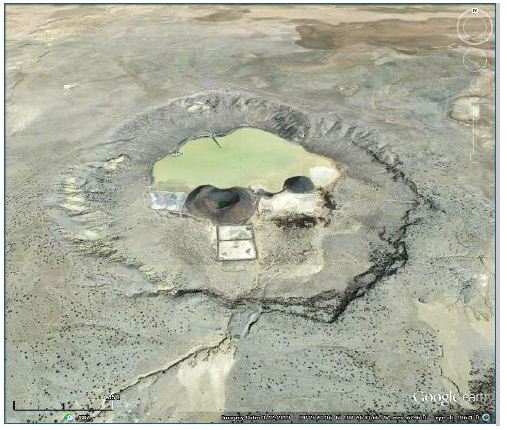
Figure 13: Aerial View of Zuni Salt Lake Taken from Google Earth

Oday, Zuni Salt Lake is protected by the Pueblo of Zuni. In order to access this sacred location, individuals would have to obtain permissions from governing Pueblo of Zuni officials. According to an elder from the Pueblo of Zuni, the idea of getting permission to visit the site is problematic because all culturally affiliated pueblos have rights to the sacred landscape, not just Zuni [32].

Chaco Culture Case Four

Chaco Culture National Historical Park (Chaco) (Figure 14) is located in the San Juan Basin of the Four Corners region of New Mexico in the Southwestern United States. Chaco is a large regional ceremonial center that builds on complex inter-tribal relationships [34-36]. Numerous Western Pueblo tribes are culturally affiliated with Chaco, including Acoma Pueblo, Hopi Tribe, Nambe Pueblo, Navajo Nation, Pojoaque Pueblo, Santa Ana Pueblo, Santa Clara Pueblo, Santo Domingo Pueblo, Tesuque Pueblo, Zia Pueblo, and Zuni Pueblo [36].

FIG 14

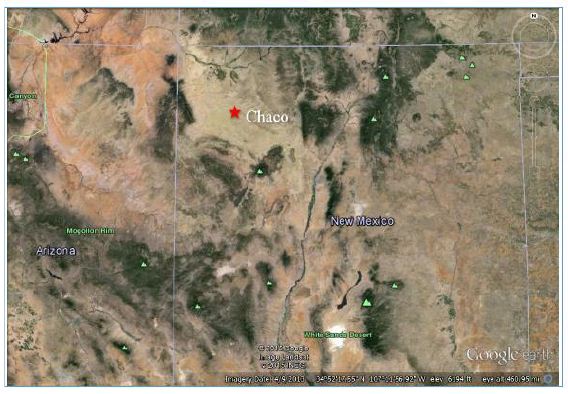
Figure 14: Chaco Landscape

Chaco was a regional pilgrimage center [37] and likely remained a destination of special importance and continued to be visited through pilgrimages after the fall of Chacoan culture [36,37] argue that “undertaking the pilgrimage [to Chaco] was a way to demonstrate one’s commitment to the religious system centered at Chaco and the identity and moral system tied to it.” Connections to distant communities are evident in exotic materials found within the canyon, such as macaw remains, which trace this linkage as far away as Mesoamerica. Much of the ceramics and lithic remains found within Chaco were identified as non-local, and great houses contained hundreds of rooms with sleeping platforms [37]. Estimates put the peak population of Chaco between 2,100 and 2,700. However, construction of structures and agricultural fields at Chaco could have supported much greater numbers [38]; this suggests Chaco served not as a larger pueblo for year-round living but as a ceremonial center for seasonal visitors. Lekson [39] also argues that Chaco served as the regional ceremonial center that was linked to Aztec Ruins and Casas Grandes (Paquimé) through the Chaco Meridian, a longitudinal line at approximately 108 degrees west that connects these three ceremonial centers.

Construction in Chaco suggests a ceremonial use of the great houses (Figure 15) within the area. According to Sofaer [40], “major buildings of the ancient Chacoan culture of New Mexico contain solar and lunar cosmology in three separate articulations: their orientations, internal geometry, and geographic interrelationships.” There are a series of great houses (Figure 15), large multi-level developments, often oriented with solar, lunar, and cardinal directions built within line of site with one another (NPS N.d. a) [41].

FIG 15

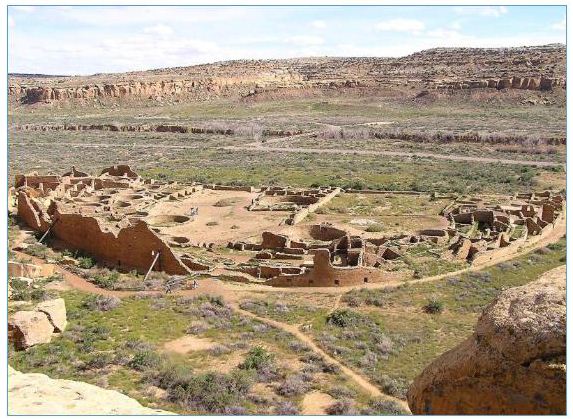
Figure 15: The Pueblo Bonito Great House as Seen from a Cliff

A unique system of signal fires connected the great houses of Chaco. Signaling stations played a major role in the organization of Chacoan communities. These stations, which were lit with fires and intensified with reflective materials such as mica or selenite, are located along the roads of Chaco, creating connections between the great houses [42]. Signal fires can have a wide range of purposes, such as for ritual and ceremony, warfare, hunting, scheduling, and even defense [43]. These signal fires are located in high areas with unobstructed views to the next, typically on a tall building or a hill. Selenite, a highly reflective material, was found at some of the signaling sites across Chaco [43]. These signaling stations were capable of quickly carrying information across the canyon to each great house, allowing ceremonies to be conducted simultaneously across the entire region.

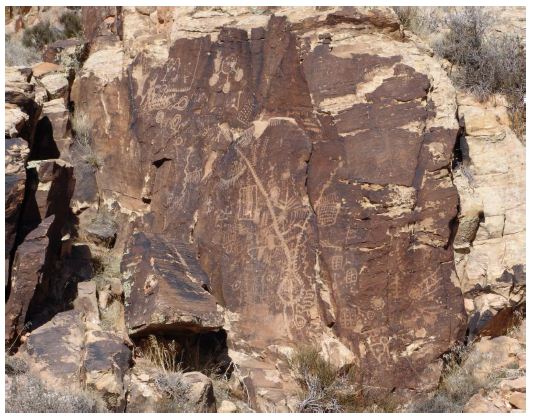
Fajada Butte (Figure 16) is a large topographic feature that stands over 400 feet high. It was one of the primary ceremonial destination places for religious leaders who traveled from other Chacoan communities. These journeys would be part of major events that were marked by the Sun Dagger. Also, trips would be made to this area for continuous interactions with the sites and shrines, ceremonies, interactions with other religious specialists to share ideas, and for teaching inexperienced people about time keeping and the movements of the sun, moon, and stars. The Sun Dagger on Fajada Butte is in the southeastern gap of the primary canyon in Chaco, approximately one kilometer to the east of Chacra Mesa (Figure 17). The dagger is formed by three large sandstone slabs that collimate sunlight onto two spirals [44,45]. The slabs result from a natural rock fall, not human engineering. While impossible to date the rock fall and peckings, it can be inferred that ancestral Native Americans carved the spirals after observing the light patterns for numerous annual cycles, thus using naturally occurring patterns and human made alternations to engineer a calendar [36,44].

FIG 16

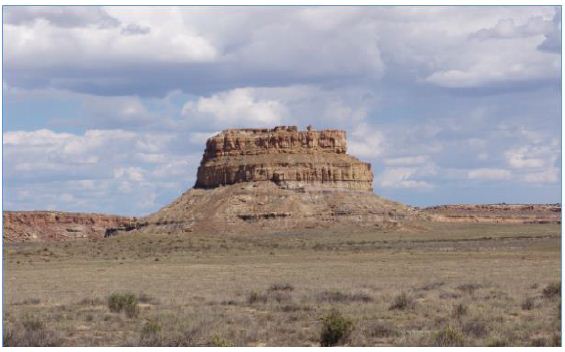
Figure 16: Fajada Butte

FIG 17

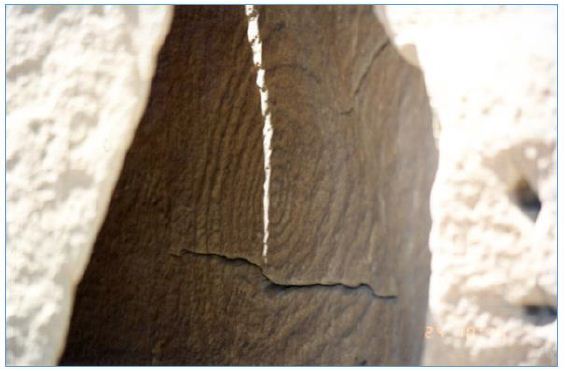
Figure 17: The Sun Dagger Over a Petroglyph at Fajada Butte

Along the predominant ledge just below the Sun Dagger, there are a series of rooms that extend around most of butte. These rooms have been exposed due to erosion processes. In nearly all of the rooms that were visited during the 1994 study, pieces of pottery were found. One of the rooms is circular shaped and visiting tribal representatives believed it to be a kiva. It has been estimated that 20 to 30 rooms were built at this level, and they are believed to be the rooms where time keeping specialists lived during ceremonial activities on the butte [36]. Rooms were used by more experienced specialists to teach newcomers about celestial movements. Near the roofs of these rooms are various calendars and peckings which have been identified as representing clans, origin beings, ancestral beings, and physical representations of time. In accordance with traditional and contemporary use patterns of Pueblo households, theroofs of these rooms were seen as appropriate places to study, teach, and record the movements of the stars, sun, and moon [36].

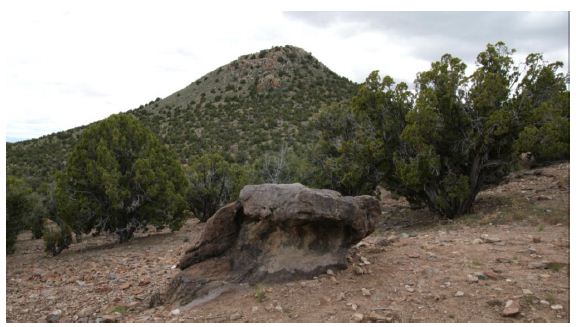
Sugarloaf Mountain/Goldstrike Canyon

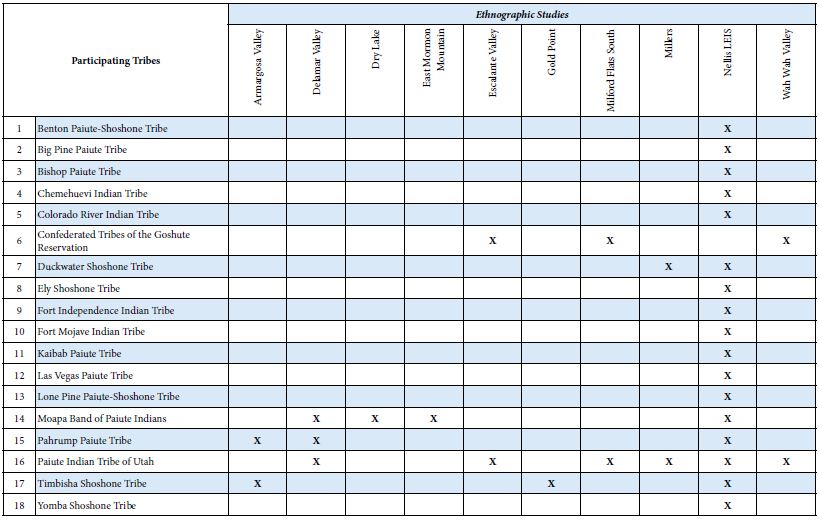
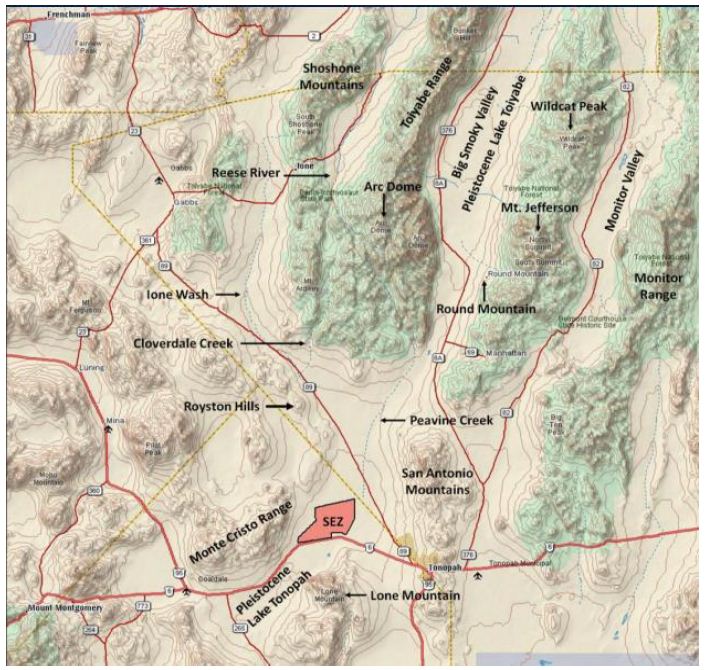
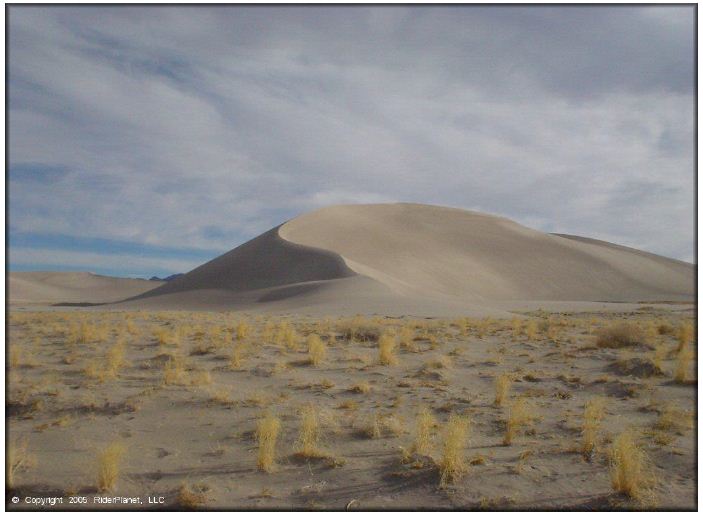
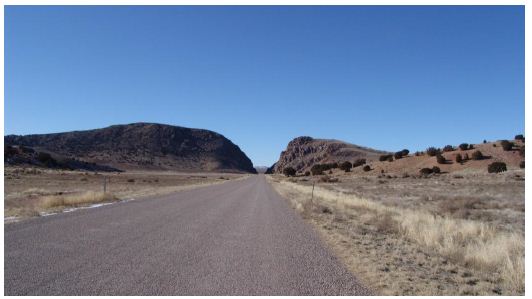
Sugarloaf Mountain/Gold Strike Hot Springs (Sugarloaf Mountain) is the fifth Landscape of Origin to be described and used to compare with Effigy Mounds (Figure 18). Sugarloaf Mountain is a valuable point of comparison because it was the first Native American cultural property that existed in two U.S. states (Arizona and Nevada) to be placed on the NRHP as a Native American TCP. In addition, the Sugarloaf Mountain TCP includes a portion of the Colorado River where Indian people traditionally moved between the hot spring canyon in Nevada and the ceremonial mountain in Arizona (Figure 19). Because Sugarloaf Mountain has been placed on the NRHP, this description uses text from the formal document.

FIG 18

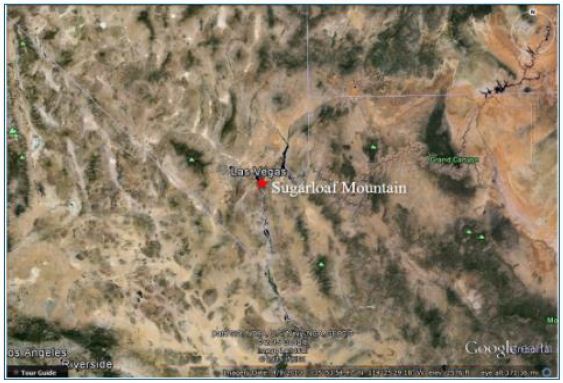
Figure 18: Sugarloaf Mountain Landscape

FIG 19

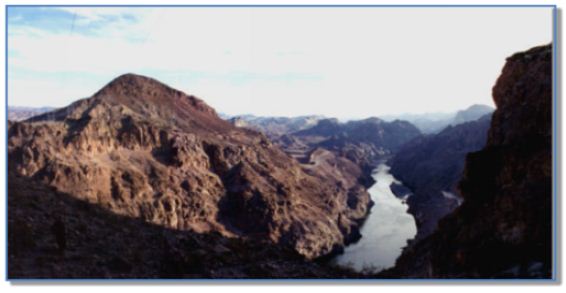
Figure 19: Sugarloaf Mountain and the Colorado River

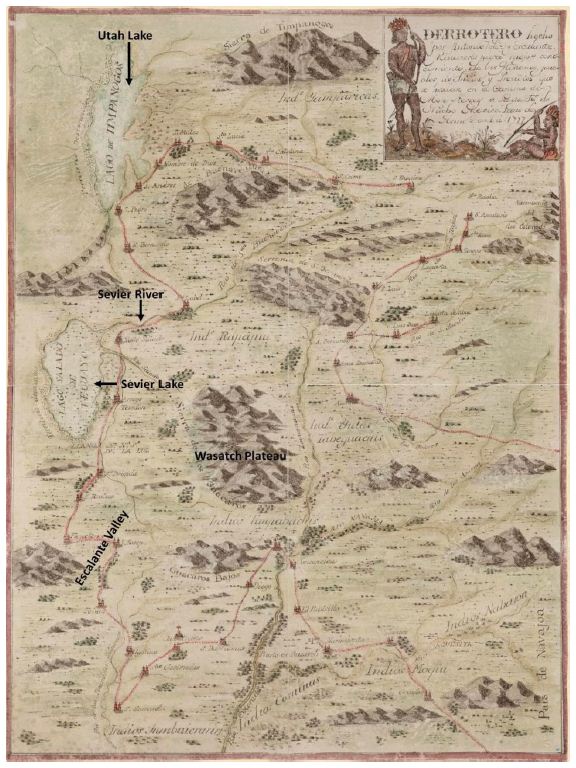
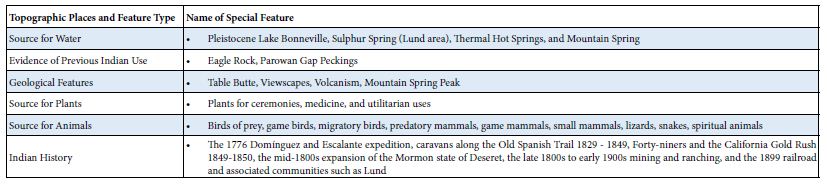
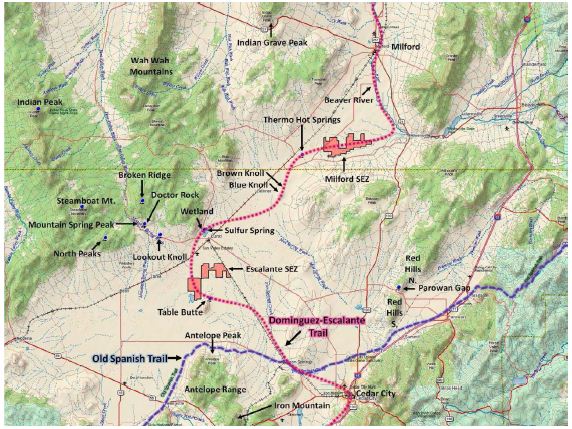
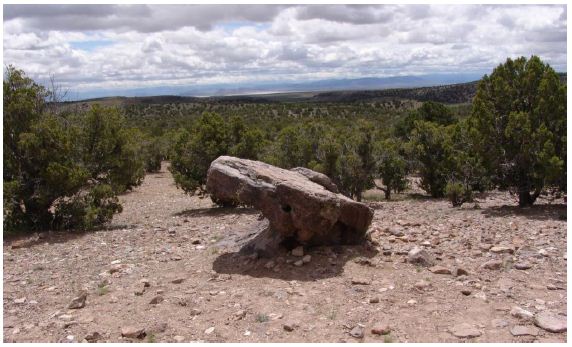
This property (a technical term used in the TCP nomination process) was successfully evaluated as a part of a larger cultural landscape of origin that has significance to a number of Native American tribes in the region. Although the TCP evaluation focused primarily on the mountain and the hot spring canyon located just across the Colorado River to the west, its cultural significance is, in large part, determined by its place within this larger landscape of origin setting. The Southern Paiutes, Hualapais, and Mohaves have all traditionally used Sugarloaf Mountain as a place for practicing spiritual, scientific, educational, political, economic, and social activities. The long-term presence of Native Americans at Sugarloaf Mountain is evidenced by physical artifacts that include two noticeable demarcated ceremonial clearings, apetroglyph, a turquoise mine at the base of the mountain, a cave with grindstones for corn or paint, small healing rocks, and several lithic scatters [46]. In addition to archeological evidence, historical and contemporary documentation confirms the existence of strong connections between Sugarloaf Mountain and the Southern Paiutes, Hualapais, and Mohaves. These intimate and deeply forged connections to Sugarloaf Mountain are integral to the maintenance of cultural, spiritual, ecological, and historic continuity between the ancient people of southern Nevada and their contemporary descendants. Today, the preservation of sacred knowledge and traditional cultural practices through the education of young people hinges upon the recognition and protection of those sacred places of the Southern Paiutes, Hualapais, and Mohaves that have not been irrevocably altered. Sugarloaf Mountain is such a place [46]. Amongst the Mohaves, Sugarloaf Mountain is repeatedly mentioned as a place that is tied to the sacred mountain, Avikwame. In travel songs, bird songs, and celebratory songs, Sugarloaf Mountain is noted as the northern most boundary as well as a spiritual place of power, which islinked to the Origin Mountain, Avikwame. The Hualapais also experience enduring connections to Sugarloaf Mountain. Upon arriving to Sugarloaf Mountain, one Hualapai elder began to speak in the cry voice about that which came before. In the presence of the mountain, she re-experienced the memories of her ancestors whose presence at Sugarloaf remains strong. She relayed how elders, adults, youths, and babies were forced to leave their ancestral lands and march to La Paz. Many were shot, thrown into pits full of slain humans, and even buried alive. Hualapai women and children were frequently killed alongside Hualapai men. Those who were not shot often died of European diseases and starvation. Today the Hualapai meet each year to conduct a three-day ceremony to mourn and honor the people who died on the march to La Paz [46]. The Southern Paiutes also experience intimate connections with Sugarloaf Mountain. According to several elders, Sugarloaf Mountain is on the Salt Song Pathway to the afterlife. Although first recorded at the turn of the century, the Salt Songs have their origins in times before Euro-American histories. The Southern Paiutes continue to sing the Salt Songs today. As a result, the sacred places that are mentioned in these songs remain central to Southern Paiute identity and culture. This is confirmed in ethnographic interviews. The elders explained that “Sugarloaf is a sacred place to Southern Paiutes. It is the only place of its kind that is used as a path to communicate with spiritual beings in the area” [46]. In addition, “The doctor rocks, crystals, and offering places in this area were placed here by the Creator for Southern Paiutes and others” [46].

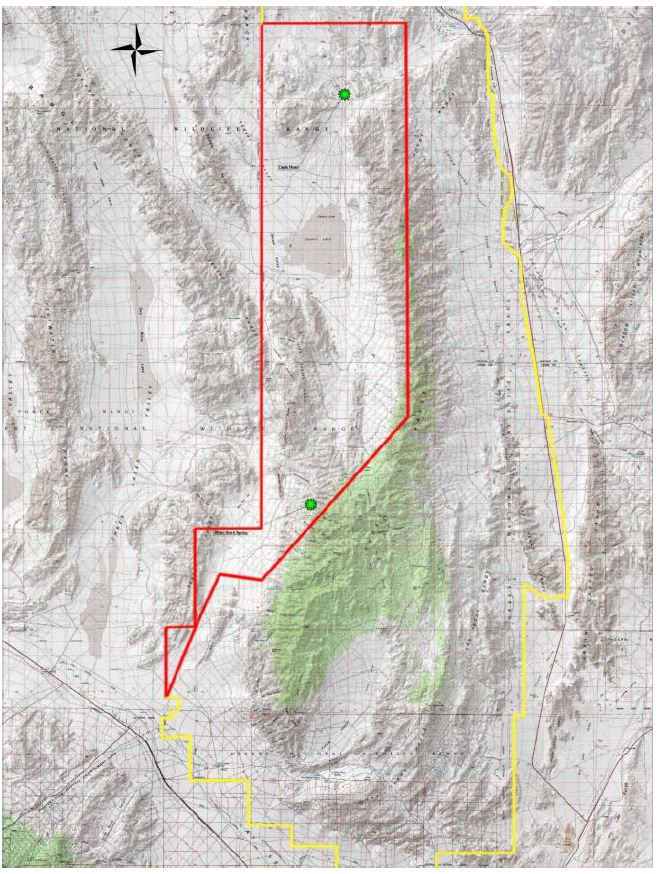
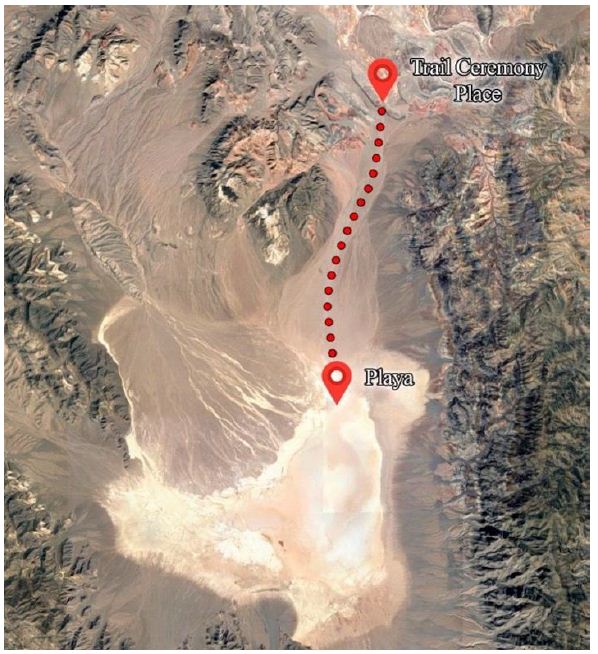
Since time immemorial, Southern Paiutes, Hualapais, and Mohaves have practiced cultural observances at Sugarloaf Mountain. On the top of Sugarloaf, individuals and shamans used the ceremonial clearings for spiritual purposes, astronomical observances, teaching, and both political and social gatherings. The base of Sugarloaf Mountain has frequently been used in connection with healing activities utilizing doctor rocks, plants, and whiptail lizards [46]. Today Sugarloaf Mountain is integral to the maintenance and perpetuation of the cultural traditions of the Southern Paiute, Hualapai, and Mohave. This sacred place serves as a location where cultural traditions and knowledge can be conveyed from generation to generation. As there are many factors that endanger the cultural traditions of these groups, it is essential to protect and preserve Sugarloaf Mountain so that it may continue to play its critical role in the transmission of knowledge from elders to youths. Many elders agree that Sugarloaf Mountain is “a good place to teach children and let them understand better what it’s all about” [46]. Sugarloaf Mountain has always been a ceremonial destination place where individuals, medicine men/ religious specialists, and healers have gone to develop and practice their knowledge. Amongst the Southern Paiutes, Sugarloaf Mountain has served as an area where people have gone to educate and prepare themselves for sacred ceremonies occurring at Gypsum Cave. Sugarloaf Mountain has also served as a community learning center. “The old people used to meet here with the Hualapais, Chemehuevi Paiutes, Moapa Paiutes and others for spiritualpurposes,” [46]. In addition, Sugarloaf Mountain has traditionally served as “a place away from main villages, where people came to talk about common interests,” [46]. Today the Southern Paiute, Hualapai, and Mohave express a unified desire to maintain these practices and thus ensure their knowledge and traditions will be kept alive and rejuvenated amongst younger generations [46]. The following are discussions of specific key cultural components of Sugarloaf Mountain as a TCP which is located within a larger Landscape of Origin. Figure 20 is a representation of the Sugarloaf landscape with the three pilgrimage trails marked in brown.

FIG 20

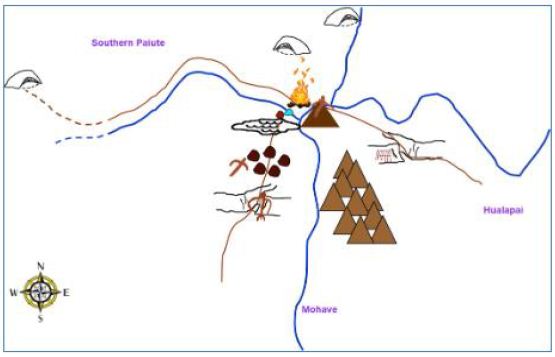
Figure 20: Diagram of Sugarloaf Mountain Pilgrimage Trails and Associated Features

A Landmark

Sugarloaf Mountain has been used as a landmark as well as a ceremonial center for the exchange of knowledge over thousands of years. This knowledge comes from elder teachers as well as the mountain itself, which the Southern Paiute, Hualapai, and Mohaves have been taught to attune themselves towards, and thus accrue knowledge from multiple rather than singular educational sources. As much of this knowledge is learned directly from the mountain itself, this place is integral to cultural traditions [46].

A Ceremonial Area

The ceremonial activities constitute one of the central functions of Sugarloaf Mountain. These activities involved both individual shamans and groups of people who regularly convened on Sugarloaf Mountain to worship, develop knowledge, and express knowledge through healing practices. These activities included astronomical observations, rituals, vision quests, and the collective augmentation of knowledge [46].

Vision Questing Area

Sugarloaf Mountain also served as a location for vision quests that sometimes involved both individuals and whole families. These vision quests occurred at Sugarloaf Mountain because it was a known center of power. Today this same power is acknowledged and understood by the Southern Paiute, Hualapai, and Mohave elders. The recognition of this power explains their need to teach their children at this location [46].

A Healing Area

Sugarloaf Mountain has always played an integral role in the healing traditions of the Southern Paiute, Hualapai, and Mohave. In both prehistoric and historic times successful healing required an in-depth knowledge of the healing resources provided at Sugarloaf Mountain, as well as a respectful relationship with this source of power. The power of Sugarloaf Mountain helped them to prepare themselves for receiving the songs necessary for healing, as well as the knowledge to utilize the water, doctor rocks, lizard tails, plants, and regions of healing in a manner conducive to physical and spiritual restoration [46].

An Area for Ceremony and Intertribal Gatherings

Sugarloaf Mountain has been repeatedly noted as a place of power. Those who gathered at Sugarloaf Mountain did so under varying circumstances. Frequently, the gathering focused on spiritual and educational purposes, which speaks to the focus on events that contributed to cultural continuity. It is suggested in interviews that Native Americans gathered at Sugarloaf Mountain under political pretenses including the Ghost Dance. Therefore, the ceremonial clearings had multiple functions [46].

A Component of a Cultural Landscape

Sugarloaf Mountain expresses its power through all of the elements of nature, which are understood to manifest in concert rather than as discrete entities. Sugarloaf Mountain exists as a place of power within a larger plane of interconnections. Tribal representatives noted that it is related to other significant places including Gypsum Cave and Avikwame. Sugarloaf Mountain has functions and uses that are simultaneously unique yet integrally related to places beyond itself. The cultural features/elements found at Sugarloaf Mountain are part of a larger cultural entity, preserving the larger traditions of multiple ethnic groups. The mountain and its natural/cultural elements are a significant part of a cognized landscape important to tribes in the region. From the top of Sugarloaf Mountain, the people who frequented this place had a viewscape that connected the mountain and its people to the four directions and the sacred places noted in both songs and oral histories [46].

A TCP with Continued Cultural Centrality

The Southern Paiutes, Hualapais, and Mohaves are invested in protecting and continuing their relationships with Sugarloaf Mountain because it is a ceremonial place in a landscape of origin and a significant source of knowledge and power. The designated boundaries of the TCP are shown in Figure 21. This power does not express itself in a unilinear fashion, wherein only humans benefit. Instead, the Southern Paiutes, Haulapais and Mohaves strive to create relationships that are mutually respectful, knowledge-based, and balanced [46].

FIG 21

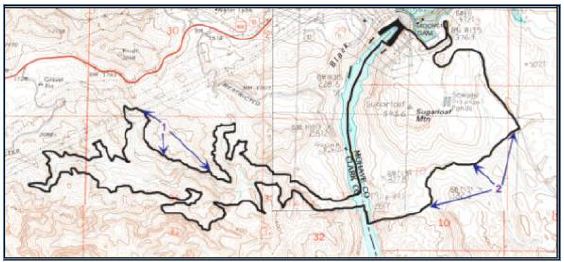
Figure 21: Sugarloaf Mountain TCP Boundaries (Stoffle et al. 2000)

The Southern Paiute, Hualapai, and Mohave elders repeatedly voiced the need to bring their youth to Sugarloaf Mountain. This desire stems from the power of the place, as well as the educational process that has always played a primary function at this sacred landscape.

Discussion

These six case studies are comparable examples of geoparks in Landscapes of Origin. The purposes and uses of these places were different from place to place, however, there are distinct similarities. Numerous Native American tribes connected to these geoplaces have used these ceremonial centers for thousands of years. The connections that these groups have to these landscapes are complex and layered, and shift throughout time. Sacred connections to these areas are culturally significant to many different Native American people.

Landscapes of Origin – Creation

Common themes exist between these ceremonial centers and Effigy Mounds. One example is the connections made through origin stories. Places like Zuni Salt Lake, Chaco, and Pipestone are associated with multiple origin stories from surrounding Native American tribes. At Zuni Salt Lake, Salt Woman, the creator being that resides in the lake, features in the origin stories of Zuni, Acoma, Hopi, and Laguna. Furthermore, she continues to serve an important role in their cultures by providing salt to the associated Pueblos. Similarly, affiliated Pueblo groups have creation stories that tell of clan migrations through Chaco. At Pipestone, Sioux accounts attribute the creation of Pipestone to White Buffalo Woman, while Cree accounts associate the place with a great flood and the coming together of many different ethnic groups. Similarly, culturally affiliated tribes at Effigy Mounds have origin stories that link clan migrations to specific mound groups within the monument.

Landscapes of Origin – Ceremony

There are parallels between ritual activities conducted at Effigy Mounds and previously discussed ceremonial centers. For example, Effigy Mounds, Chaco, and Medicine Mountain have features used in time keeping ceremonies. Activities that occur at these three ceremonial centers are linked to solar and lunar observations made by religious leaders of the community. Tracking time was used for a range of activities including agriculture, pilgrimage, and balancing ceremonies. Chaco, a pilgrimage destination place, housed religious leaders from across the region to conduct large scale ceremony involving solar and lunar observations at Fajada Butte. Religious leaders were positioned throughout the canyon to conduct simultaneous ceremonies, which were coordinated through signal fires. Medicine Mountain also had a time keeping component; the medicine wheel itself was a calendar used to track the passage of time. Other ceremonies at Medicine Mountain involved healing and vision questing. At Effigy Mounds, a linear mound at the Marching Bear Group lines up perfectly with the sun during the summer solstice, similar to the structures across Chaco or the spokes of the Bighorn Medicine Wheel. Locations along the bluffs of Effigy Mounds and surrounding areas, such as Pikes’ Peak, contained evidence of fire use, which was used potentially to coordinate a region-wide simultaneous ceremony.

Landscapes of Origin – Pilgrimage

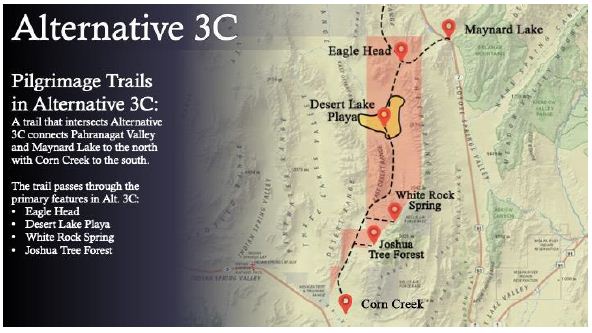
Pilgrimage is the third common theme among the landscapes of origin discussed in this article. Pilgrimages to these sacred landscapes involved patterned movements along predetermined routes and trail networks. The movement of people along these routes were part of the ceremonies themselves. Religious specialists traveled great distances to engage with these landscapes. Along the trails, the specialists (also referred to as pilgrims) visited shrines, leaving offerings and saying prayers. These acts provided the pilgrims with knowledge they needed to continue with their journeys. The six (6) case studies have well defined and understood trail systems that lead to the ceremonial destination places from the various home communities of the connected ethnic groups. For example, at Sugarloaf, Southern Paiute religious specialists traveled along trails from the west, Mohave people traveled from the south, and Hualapai traveled from the east to reach the mountain. The trails to Sugarloaf share similar features and places of prayer; along these trails a similar pecked figure is found, which is also found on the top of Sugarloaf Mountain. At Medicine Mountain, pilgrimage trails lead to the mountain from all directions, however these trails all come together at the base of the eastern slope of the mountain. All religious specialists seeking to engage the Medicine Wheel for ceremony must approach it from an easterly direction in a manner that parallels how one enters a medicine lodge. Effigy Mounds is a known destination place for many different ethnic groups, which would have used unique land and water trails to approach this scared landscape. River navigation likely played a key component in pilgrimage. Religious specialists would have canoed down the Mississippi, Wisconsin, and Yellow Rivers to reach their destination.

Landscapes of Origin – Conflict Free Zones

An important component of landscapes of origin in Native North America is the multi-ethnic use/neutral component to these places. Places, such as Pipestone and the Zuni Salt Lake, are well documented as playing an important role in the ritual, ceremony, and pilgrimage of multiple affiliated tribes and pueblos who have a shared use of the place and its resources. Pipestone and Zuni Salt Lake’s origin narratives indicate that the neutrality of the place is a part of respecting the creator being that resides in the landscape. Multiple narratives account for the multi-ethnic use of Pipestone, many of which were documented by Catlin [26] during his visit to Coteau des Prairie, though the territory was controlled by the Sioux during his travels. Similarly, Nicollet wrote about Pipestone being a place of peace that was visited at different times of the year by different tribes [47]. Zuni Salt Lake has an identified Sanctuary, 182,000 acres approximately ten miles around the lake, which was added to the NRHP. The area includes pilgrimage trails and religious shrines that play important roles in the ritual use of Zuni Salt Lake. This area is traditionally void of any violence out of respect for the Salt Woman [32]. The bluffs of Effigy Mounds were central to the ceremony conducted by multiple visiting Native Americans, but likely they were a part of a greater landscape that extended along the Mississippi River and across the river in Prairie du Chien, which was a documented trading hub and ceremonial center for visiting tribes. In order not to disrupt ceremonies at the mounds or the economic and cultural ties between these groups, this area would similarly be declared neutral grounds rooted in the creation narratives of the landscape. The common themes that have been highlighted throughout this analysis show that multi-ethnic ceremonial centers exist in Native North America, exist because of special geological features, and have ritual and cultural-historical components to them. Effigy Mounds fits into the definition of a multi-ethnic ceremonial center, because Native Americans have long-term spiritual connections to the mounds and the mounds serve as physical links to Creation stories. While the uses of Effigy Mounds are tribal and place specific, the broader pattern of this ceremonial center is found elsewhere. Like the five Zuni Salt Lake, Medicine Wheel, Chaco, and Sugarloaf Mountain, Effigy Mounds continues to hold cultural meaning and spiritual importance to contemporary tribal peoples.

References

  1. Brocx Margaret, Vic Semeniuk (2024) Geoparks, Geotrails, and Geotourism – Linking Geology, Geoheritage, and Geoeducation. Special Issue of Land. Multidisciplinary Digital Publishing Institute.
  2. Christie Jessica (2009) Landscapes of Origin in the Americas: Creation Narratives Linking Ancient Places and Present Tuscaloosa: University Alabama Press.
  3. Barth Fredrik (1969) Ethnic Groups and Boundaries: The Social Organization of Culture
  4. Stoffie RichardW, Kathleen A. Van Vlack, Richard W Arnold (2006) Paa’oasta Hunuvi: Water Bottle Canyon Traditional Cultural Property Study Bureau of Applied Research in Anthropology, University of Arizona, Tucson.
  5. Toupal Rebecca S, Richard W Stoffie, Nathan O’Meara, Jill Dumbauld (2004) Takuśkaŋśkaŋ Ćaŋnomoke: The Everchanging Pipestone Quarries Sioux Cultural Landscapes and Ethnobotany of Pipestone National Monument, Minnesota. Prepared for the National Park Tucson, AZ: Bureau of Applied Research in Anthropology, University of Arizona.
  6. Howey Meghan CL (2012) Mound Builders and Monument Makers of the Northern Great Lakes, 1200-1600. Norman: University of Oklahoma Press.
  7. Dillehay Tom (2007) Monuments, Empires, and Resistance: the Araucanian Polity and Ritual Narratives Cambridge: Cambridge University Press.
  8. Smith, David Lee (1997) Folklore of the Winnebago Norman, OK: University of Oklahoma Press.
  9. Hicks, Dan, Laura McAtackney, and Graham Fairclough. 2007. Envisioning Landscape: Situations and Standpoints in Archaeology and Walnut Creek, CA: Left Coast Press.
  10. Stoffie Richard W, Rebecca S Toupal, Nieves Zedeño (2003) Landscape, Nature, and Culture: A Diachronic Model of Human-Nature Adaptations. In: Nature Across Cultures: Views of Nature and the Environment in Non-Western Cultures. Pg: 97-114. Helaine Selin, editor. Dordrecht, The Netherlands: Kluwer Academic Publishers.
  11. Anyon, Roger, T.J. Ferguson, Loretta Jackson, and Lillie Lane. (1996) Native American Oral Traditions and Archaeology. SAA Bulletin 14(2)
  12. Basso Keith H (1996) Wisdom Sits in Places: Landscape and Language among the Western Apache. Albuquerque, NM: University of New Mexico Press.
  13. Deloria Vine (2003) God is Golden, Colorado: Fulcrum Press.
  14. Turner Victor (1974) Pilgrimage and Studia Mssionalia. 23: 305-327.
  15. Van Vlack, Kathleen, Richard Stoffie, Evelyn Pickering, Katherine Brooks, Jennie (2013) Unav-Nuquaint: Little Springs Lava Flow Ethnographic Investigation. Prepared for the National Park Service. Bureau of Applied Research in Anthropology, University of Arizona, Tucson AZ
  16. Van Vlack Kathleen. (2012) Puaxant Tuvip: Powerlands Southern Paiute Cultural Landscapes and Pilgrimage Trails.
  17. Van Vlack, Kathleen (2012) Southern Paiute Pilgrimage and Relationship Journal of Ethnology 51: 129-140.
  18. Van Vlack, Kathleen (2018) Puha Po to Kavaicuwac: a Southern Paiute Pilgrimage in Southern International Journal of Intangible Heritage. 129-141.
  19. Van Vlack Kathleen (2022) Dancing with Lava: Indigenous Interactions with an Active Volcano in Arizona. In Anthropological Perspectives on Environmental Edited by A. Sjölander Lindqvist. London: Pelgrave MacMillian. Pg: 29-53.
  20. Stoffie Richard, G Rogers, F Grayman, G Bulletts-Benson, K Van Vlack, J Medwied- Savage (2008a) Timescapes in Conflict: Cumulative Impacts to a Solar Calendar. Impact Assessment and Project Appraisal 26: 209-218.
  21. Thwaites Reuben G (1888) Collections of the State Historical Society of Madison, WI: Democrat Printing Company, State Printers.
  22. Blaine, Martha Royce (1995) The Ioway Indians. Norman, OK: University of Oklahoma Press.
  23. Ho Chunk Nation (2015) Timeline of Ho-Chunk Ho-Chunk Nation.
  24. Zedeño, Maria Nieves, Chrisopher Basaldu (2004) Pipestone National Monument, Native American Cultural Affiliation and Traditional Association Study. Prepared for the National Park Service. Tucson, AZ: Bureau of Applied Research in Anthropology, University of Arizona.
  25. Anfinson Scott F (1997) Southwestern Minnesota St. Paul: Minnesota Historical Society Press.
  26. Catlin George (1841) Letters and Notes on the Manners, Customs, and Condition of the North American Indians (1832-1839) 2 Volume II. Minneapolis, MN: Ross and Haines, Inc.
  27. Boggs James P (1997) Medicine Mountain Ethnographic Project. Report on file, USFS Bighorn National Forest, Sheridan, Wyoming and Wyoming State Historic Preservation Office, Cheyenne.
  28. Boggs James P (2003) Medicine Mountain and the Bighorn Medicine Wheel between Two Worlds: A Native American Cultural Landscape in Twenty-First Century North Report on file, USFS Bighorn National Forest, Sheridan, Wyoming and Wyoming State Historic Preservation Office, Cheyenne.
  29. Simmons Thomas, R Laurie Simmons (2009) Medicine Mountain National Historic Landmark Nomination, Big Horn National Forest, Wyoming. Prepared for United States.
  30. Cummings David (1968) Geologic Map of the Zuni Salt Lake Volcanic Crater, Catron County, New Mexico. Washington D.C.: USGS.
  31. Ortiz Alfonso (1969) The Tewa World: Space, Time, Being, and Becoming in a Pueblo Chicago, Illinois: University of Chicago Press.
  32. Duff Andrew I, TJ Ferguson, Susan Bruning, Peter Whitely (2008) Collaborative Research in a Living Landscape: Pueblo Land, Culture, and History in West-Central New Mexico. Archaeology Southwest 22.
  33. Ferguson TJ, Kurt Dongoske, Leigh Jenkins, Mike Yeatts, Eric Polingyouma (1993) Working Together: The Roles of Archaeology and Ethnohistory in Hopi Cultural CRM 16, Special Issue: 27-37.
  34. Cameron, Catherine M, H Wolcott Toll (2001) Deciphering the Organization of Production in Chaco Canyon. American Antiquity 66: 5-13.
  35. Schillaci, Michael A (2003) The Development of Population Diversity at Chaco Kiva. 68(3): 221-245.
  36. Stoffie Richard W, Michael J Evans, M Nieves Zedeño, Brent W Stoffie, Cindy J. Kesel (1994) American Indians and Fajada Butte: Ethnographic Overview and Assessment for Fajada Butte and Traditional (Ethnobotanical) Use Study for Chaco Culture National Historical Park, New Tucson, AZ: Bureau of Applied Research in Anthropology, University of Arizona.
  37. Kantner John, Kevin J Vaughn (2012) Pilgrimage as Costly Signal: Religiously Motivated Cooperation in Chaco and Nasca. Journal of Anthropological Archaeology 31: 62-82.
  38. Lekson Stephen H, William B Gillespie, Thomas C Windes1(986) Great Pueblo Architecture of Chaco Canyon, New Mexico. Albuquerque: University of New Mexico Press.
  39. Lekson Stephen H (1999) The Chaco Meridian: Centers of Political Power in the Ancient Southwest. Walnut Creek, CA: AltaMira Press.
  40. Sofaer A (2007) The Primary Architecture of the Chacoan Culture: A Cosmological In The Architecture of Chaco Canyon, New Mexico. Stephen H. Lekson (ed.) University of Utah Press
  41. N.d. History & Culture. National Park Service.
  42. Lekson Stephen H (2006) The Archaeology of Chaco Canyon: An Eleventh-century Pueblo Regional Santa Fe, N.M: School of American Research Press.
  43. Swanson Steve (2003) Documenting Prehistoric Communication Networks: A Case Study in the Paquimé Polity. American Antiquity 68: 753-767.
  44. Newman EB, KR Mark, R G Vivian (1982) Anasazi Solstice Marker: The Use of a Natural Rockfall. Science. 217: 1036-1038.
  45. Sofaer A, RM Sinclair, L Doggett (1982) Lunar Markings on Fajada Butte, Chaco Canyon, New Archaeoastronomy in the New World, edited by A. F. Aveni, pp 169- 181. Cambridge University Press.
  46. Stoffie, Richard , Maria Nieves Zedeño, A. Eisenberg, Rebecca Toupal, A. Carroll, F. Pittaluga, et al. (2000) Ha’tata (The Backbone of the River): American Indian Ethnographic Studies Regarding the Hoover Dam Bypass Project. Tucson, AZ: Bureau of Applied Research in Anthropology, University of Arizona.
  47. Bray Edmund C. Martha Coleman Bray (1976) Toppling of Rock Slopes. Proceedings of the Specialty Conference on Rock Engineering for Foundations and Slopes. 2: 201-234.
FIG 11

Cultural Meaning of Playas to Native Americans

DOI: 10.31038/GEMS.2024634

Abstract

The heritage cultural contexts of playas are poorly understood by United States federal and state agencies because there has been a persistent theory that these topographic features are marginal to Native American life. Despite this perspective, Native American peoples in formal public ethnographic interviews persistently state that these playas are old living areas going back to a time (end of the Pleistocene) when the lakes were full and surrounded by lush vegetation. Slowly the lakes receded but Indian people continued to live along their shores. Given the tens of thousands of years that Indian people have lived along the edges of these lakes, it is unsurprising that they should remember those past times and return to the playas today, seeking connection with their ancestors and the places that sustained them and permitted the formation of an ancient heritage way of life. The analysis is based on field ethnographic interviews with Paiute, Shoshone, and Goshute people.

Keywords

Pleistocene, Native American culture, Playas as Heritage, Persistent culture, Great basin ethnography, Ethnogeology

Playas as Native American Heritage Places

People from western cultures have regularly viewed desert playas of the western United States as sterile and of little utility except for gathering salt or minerals. In line with this unimportant valuation of desert playas by western observers, many call the region “The Great American Wasteland” [1]. The region’s culturally affiliated Native Americans, however, tend to view these playas as heritage areas extending back in deep time to the Pleistocene when they were filled with lakes, surrounded by wetlands, and drained by permanent streams. According to the University of Utah’s Shoshoni Dictionary[2] (Shoshoni Language Project 2024), the Goshute people refer to themselves as the Newe[nɨwɨ] or Newenee [nɨwɨnɨɨ] meaning the Person or the People. There have been times throughout their history where they have been referred to as Kutsipiuti (Gutsipiuti) or Kuttuhsippeh which translates to “People of the dry earth” or “People of the Desert” (literally: “dust, dry ashes People”) [1,3]. Goshute means people covered with dust, dusty people, or desert, terms which were reiterated generations later in Halmo et al. [4]. In the same study, contemporary Goshute people who are fluent in their language use the term in reference to the white alkali dust that lines the lowest portions of most valleys [4,5]. Our analysis explains why the playa dust symbolizes heritage connections with the land and past lives. Native American heritage perspectives regarding playas are required in national searches for places to drop bombs, make landing strips for large military aircraft, build industrial scale solar arrays, and mine rare earth minerals, including lithium. Native American cultural impacts regarding proposed federal land use are required by law and regulation and must be clearly articulated during environmental impact assessments. The spatial focus of this analysis is the Great Basin of the western U.S. It is largely defined by internal draining, endorheic lakes and rivers. Because of its unique topography, the Great Basin has been characterized by its state of being largely filled with water during the much wetter Pleistocene, as well as its dry salt, mineral, and sand flats in the latter Holocene. Playa is the term normally used to discuss these salty, white sand, mineral deposits (Figure 1).

FIG 1

Figure 1: The Great Basin

The temporal frame for this heritage analysis of playas is operationally defined as the late Pleistocene, which occurred between 128,000 BP and 11,700 BP, and the Holocene, from 11,700 BP to modern times. Scientific studies have placed Native Americans in the region at least by 37,000 BP with the geoarchaeology dates of 23,000- 21,000 BP at White Sands, New Mexico [6,7] and 38,900 to 36,250 BP at the Hartley locality, a mammoth kill site situated near the Rio Puerco, New Mexico [8]. These new geoscience dates indicate that Indigenous Peoples experienced this area as both a massive wetland filled with lakes, rivers, and swamps and later as an arid desert with intermittent streams, sand dunes, small artesian springs, and heritage playas.

Pleistocene in the Great Basin

The Late Pleistocene ecology of the Great Basin and western Colorado Plateau regions was rich in fauna and flora. Central to this supportive habitat were wet forested uplands, full grasslands, and long wetlands located along a complex network of streams feeding into medium and large lakes [9]. American Indian people lived here, hunting, gathering, making trails, building communities, and engaging the topographically interesting landscape with ceremonial activities. Large mammals, like mammoth, roamed these habitats from the lowest wetlands up to 8,990 feet where the Huntington Mammoth remains were found – a subalpine environment in the late Pleistocene [9]. While contemporary scholars often focus their studies on charismatic species like mammoth, dozens of medium sized mammals were found as well including camels, horses, ground sloths, skunks, bears, sabretooth cats, American lions, flat-headed peccaries, muskoxen, mountain goats, pronghorn antelope, and American cheetahs. Many smaller mammals were also present. Like their mammal cousins, avian species were abundant and ranging in different sizes from the largest being the Incredible Teratorn with a wingspan of 17 feet and the Merriam’s Teratorn with a wingspan of 12 feet (both related to the condors and vultures) to the smallest hummingbirds [9]. Other birds included flamingos, storks, shelducks, condors, vultures, hawks, eagles, caracaras, lapwings, thick-knees, jays, cowbirds, and blackbirds. The biodiversity of the land and air was matched by the fish species and with large numbers in the streams and lakes. There were at least 20 species of fish including whitefish, cisco, trout, chum, dace, shiner, sucker, and sculpin [9]. The fish species traveled widely across the Great Basin through a variety of interconnected lakes and streams. The massive late Pleistocene Lake Bonneville was a central portion of this hydrological network supporting fish species, and by implications of great biodiversity in flora and fauna (Figure 2).

FIG 2

Figure 2: Pleistocene Lakes in the western Great Basin [9]

Grayson concluded his analysis with an ecological assessment of the late Pleistocene natural conditions in the Great Basin region. “The large number of species of vultures, condors, and teratorns in the Late Pleistocene Great Basin raises a number of interesting ecological questions…the fact that there were so many species of these birds here suggests that the mammal fauna of the time was not only rich in species, but also rich in number of individual animals” [9]. Paleo- Indian populations were also well supported by this bounty of nature.

This Native American analysis of heritage playas is based on tribally approved public ethnographic findings derived from two major U.S. federal level environmental impact studies, generally referred to as either an Environmental Impact Study (EIS) or an Environmental Impact Assessment (EIA). Both EIAs were considered nationally important and referenced a Legislative EIS or a Programmatic EIS. The first study involves the US. Air Force and a Congressional review of a proposal to expand the Nevada Test and Training Range (NTTR) managed by the Nellis Air Force Base (Figure 3). The study involved three proposals for withdrawing lands from other federal agencies and adding them to the NTTR. Congressional review was required because the proposals involve multiple federal agencies and only the Congress has the authority to make these decisions [10]. The final report was called a Legislative EIS (LEIS).

FIG 3

Figure 3: Legislative EIS Proposed Withdrawn Study Areas [11]

The second study involved a Solar Programmatic EIS of nine proposed large-scale energy developments centered on large playas [12]. The playas are located on lands managed by the U.S. Bureau of Land Management (BLM) (Figure 4). These study areas were identified by a scientific team who suggested that establishing the social zones on playas was most effective. These areas were already managed by the federal government and the playas were largely devoted to natural and cultural resources [13]. The involved American Indian tribal governments and their appointed cultural representatives participated in the Solar PEIS to explain the meaning and cultural centrality of the plants, animals, spiritual trails, healing places, and places of historic encounters that exist in these playa lands.

FIG 4

Figure 4: Solar Map [12]

Both studies were funded by the involved federal agencies (U.S. Air Force and Bureau of Land Management) and conducted by a research team from the School of Anthropology at the University of Arizona, Tucson, AZ. These two large scale environmental impact assessments involved extensive and ancient playas occupied since the late Pleistocene by Native Americans. Formal government-to- government consultation with the participation of culturally affiliated Native American tribes was a foundation for each study. Each tribe selected representatives for field interviews and reviewed and approved the resulting ethnographic findings and recommendations.

Methods

The study areas of the LEIS and Solar PEIS were defined by the management agencies, but the University of Arizona ethnographers were asked to send invitation letters for study participation to culturally affiliated tribes. Those tribes interested in participating in the study were subsequently invited to participate. Each participating tribe had experience with the UofA ethnographic study team, so the parameters of the study were both clear and understood. The UofA methods have been published elsewhere (Stoffie 2007; 2000). The study methods were developed with participating tribal elders and tribal cultural departments.The following table cross-references participating tribes and the studies involved in this analysis. The reviewed and tribally approved research findings are available at Solar PEIS [12,13] and LEIS Websites [11] (Table 1).

Table 1: Cross-Referenced Chart of Tribes to Ethongraphies

TAB 1

In all studies, participating tribes selected culturally knowledgeable elders to visit the study area. Elders were provided Per diem, lodging, and transportation during the fieldwork. The timing and location of the site visits were influenced by the physical condition of elders. As a rule, up to 3 hours were available at each study site and all elders were provided with a confidential interview. The report text was written by the UofA study team and then sent to elders for review, corrections, and approval. Once the elder study team approved their text, it was sent to their tribal government who checked the text to be assured it did not contain confidential cultural knowledge. In all cases, the findings were available in final public report [12].

Playas as Heritage Places

The following are research studies where ethnographic interviews have been conducted with the permission of culturally affiliated tribal governments regarding their connections to a playa. The cases have been selected because they are both comparative and contrastive, thus providing a variety of cultural perspectives on the meaning of playas. We assert that the resulting database provides a solid foundation for an ethnographic statement on Native people and heritage playas.

Desert Lake Playa

Desert Lake Playa was observed and discussed by tribal representatives during field visits as part of the LEIS (Figure 5). It was said by tribal representatives that Desert Lake is a portal through which power flows and connects to other locations, people, and living ancestors of this sacred land [14]. These larger connections of the lake include the Southern Paiutes to the south and east and Shoshones to the west and north.

FIG 5

Figure 5: Location of Desert Lake Playa in LEIS Area 3c Proposed Withdrawal from the Desert National Wildlife Refuge.

A central pilgrimage trail documented by LEIS tribal representatives passes through a topographic constriction called Eagle Head and then connects with Desert Lake Playa (Figures 6 and 7). From the playa, the trail goes to other sacred features to the north and south [14]. Nuvagantu or Mount Charleston to the south, in the Spring Mountains the primary origin mountain range for Southern Paiute peoples, and Coyote’s Jar, or Pahranagat Valley to the north, a second origin location for Pahranagat and Moapa Paiutes, indicate a significance of the area tied to the oral histories of Native American people [16]. Visiting representatives identified the playa as the destination place, while others described the trail as a connection to their origin spots.

FIG 6

Figure 6: Satellite Picture of the Desert Lake Playa South along the Pilgrimage Trail from Eagle Head Gap [15].

FIG 7

Figure 7: Places along a pilgrimage trail that both goes to and passes through Desert Lake Playa.

A proposal to improve the Alamo Road, which crosses a portion of the Desert Lake Playa, created an EIA project study area of 322 acres of archaeology inventory and three backhoe trench excavations [17]. Seven archaeological sites were recorded, two of which were recommended as eligible for the National Register of Historic Places. This archaeology study documents that the area was occupied from the Middle Archaic to the Late Ceramic periods. Further carbon dating suggests occupation dates of 6970 BP and 2000 BP. The study is important to this analysis because it documents temporally old Native presence in the wetlands that formed around Desert Lake. Ethnographic interviews concluded that Desert Lake Playa is a Culturally Sensitive Area and a Scared Site and should be nominated to the National Register of Historic Places [14] as a Traditional Cultural Property (TCP) under Criterion D: history of yielding, or potential to yield, information important in prehistory or history. The ethnographic study concluded that for a very long time, the Desert Lake Playa developed a lush environment with a plentiful water source for the fauna and flora. As the playa gradually dried, Native American people continued to visit the playa feature, leaving offerings that remain today as archaeological investigations have determined. The connection between the Desert Lake Playa and a traditional pilgrimage trail to the north and south is a critical component of this history of Native American use, as are oral histories about spiritual beings that reside in playas even after the water has gone. Not only does the playa yield information about its cultural uses, but it also holds evidence of climate fluctuations that otherwise impacted the aboriginal communities throughout the broader landscape. The playa is considered a functional and thus still active portal to other dimensions.

Big Smoky Valley

A single study is useful because it produces ethnographic findings of a people, their culture, and their environment (for more on ethnography see- Agar [18]; Mead [19]). Multiple single comparative case studies become the basis for ethnological findings (for more on ethnology see- Benedict [20]; Lowie [21]). Shoshone tribal representatives were asked to evaluate the cultural importance of resources and places in the southern end of Big Smoky Valley, Nevada [22]. Big Smoky Valley is a north-trending basin within the Basin and Range physiographic province in south-central Nevada. The valley is roughly 567,700 acres and stretches 115 miles approximately 44 miles east of the California/Nevada border, 15 miles northwest of Tonopah, Nevada. The area has been perceived as aboriginal Shoshone lands since the Pleistocene.The environmental assessment of Big Smoky Valley was one of nine study areas considered for the large-scale solar farm to be placed on playa lakes formed during the late Pleistocene [12]. Each proposal focused on a large playa. Tribal consultations and findings were reviewed and approved by tribal government. During fieldwork, tribal representatives expressed deep knowledge of the now largely dry playas, which represented a time when large lakes and wetlands filled the valleys and were the central homes of Native American peoples. Cultural continuity back to the Pleistocene was expressed in each PEIS study.

Lake Tonopah

Central in the interpretation of Big Smoky Valley is a massive late Pleistocene Lake, wetland, river, and stream hydrological system dominated by what is called today ancient Lake Tonopah. This hydrological system supported both complex biodiversity and biocomplexity for tens of thousands of years—possibly since the Pleistocene as did a similar hydrological system centered on Fish Lake Valley and Columbus Marshes to the west [23] (Figure 8). According to their oral history, Indian people forever lived in this productive environment, and it became and continues to be centrally cultural in their lives.

FIG 8

Figure 8: The Big Smoky Valley Landscape and Pleistocene Lake Toiyabe

The watershed of ancient Lake Tonopah extends generally downhill from the north to the south along what is known today as Big Smoky Valley (Figure 8). This enclosed hydrological system is about 62 miles north to south and 21 miles east to west. Prominent mountains and ranges surround the major river, wetlands, and lakes in this watershed. Viewing this watershed anti-clockwise we find Lone Mountain in the southeast. San Antonio Mountains are in the East. Mount Jefferson and Wildcat Peak are high points in the Taquima Mountain Range, which defines the eastern edge of Big Smoky Valley. Round Mountain and Arc Dome are the southern and most visible portions of the Toiyabe Range, which is a portion of the Shoshone Mountains. Ironically the northern portion of Round Mountain is the headwater of the major north-flowing Reese River. The southeast side of Round Mountain contains Peavine Canyon, out of which flows the Peavine River. Royston Hills and Big Smoky Mountains define the watershed in the west as does the Monte Cristo Range in the southwest. Water flows off the slopes of all these mountains and hills, but Peavine River is the prominent hydrological feature today, as it flows down slope along the entire Big Smoky Valley to the current site of ancient Lake Tonopah. This hydrological system was a cultural and natural center in the lives of many Shoshone people for thousands of years.

While many individual resources and historic events were identified as significant in the Big Smoky Valley, this land was especially identified as the Origin place for the Shoshone people [22]. In ethnographic interviews, the Shoshone tribal representatives stipulated that because they have lived in these lands since the end of the Pleistocene and throughout the Holocene (or approximately 37,000 BP), they understand the dramatic shifts in climate and ecology that have occurred over these millennia.

Crescent Dune

Native American lifeways were dramatically influenced by natural shifts, but certain religious and ceremonial practices persisted unchanged. These traditional ecological understandings are carried from generation to generation through the recounting of origin stories occurring in mythic times and by strict cultural and natural resource conservation rules. At the time of the late Pleistocene, Big Smoky Valley was a wetland dominated by lakes, streams, and marshes. One Shoshone elder remembered that wetter, late Pleistocene landscape:

Just up the valley, from talking with elders and stuff, that’s where the Shoshone people started. That’s their Creation point. From there, they dispersed out into the north, south, east, and west. That’s where all the Shoshone came from, Smoky Valley, Monitor Valley. But then again, if we look at the stories, the people and the earth, they talk about a migration over water. We see that when the water skipper brought the coyote back with his little basket full of children that he made, they’re coming over water. Maybe these archaeologists have it wrong when they say that the people walked on the land. In out stories, they talk about coming over on a boat. I guess it would be a boat, if you look at the analogies. Again, we’re going back to the time when the animals talked, they conversed with each other, interacted with each other, and had ability to have children with each other. This is basically the Creation story, what I’m sharing with you. I listen to the Southern Paiute story and they talk about the Ocean Woman. You know, if you look at them, theirs is similar to ours, tied with the water. They’re the same as us. They didn’t come over walking, marching on the land like people think. They came over on the water. So we came over here in the time where this was all under water [22].

Although the climate has shifted, steams, seasonal playas and springs still dot the landscape and Shoshone use of the landscaped adapted to the drier conditions of the post-Pleistocene period. Streams originate in the mountains and at the base of the surrounding mountains and foothills, while springs provide water and luscious landscapes. Water occupies an important cultural role in the lives of Shoshone people. Natural water sources, called gwizho’naipe or life- producing water [24], play a large function in crucial rituals as well as day to day life. According to one elder:

Smoky Valley stands out. The whole valley is connected. The sand dunes and White Mountains stand out. I’m from the mountains so the mountains stand out. I was raised in the mountains so I’m a mountain person. 10,000 years ago, there was a big old lake right here where we’re sitting on [22].

In addition to the now seasonal and perennial lakes and streams, traditional Native American use of spiritual places persist. These include, for example, Crescent Dune, which is located in and around the playa with its own ecology today of pure sand and special plants. In Figure 9, Crescent Dune is viewed along with a large deposit of sand and Indian Ricegrass (Oryzopsis hymenoides), which is an ancient Native American food seen growing around Crescent Dune.

FIG 9

Figure 9: Crescent Dune in Big Smoky Valley

The dune rises above the valley bottom providing both a place of solitude and elevated viewscapes. Native traditional knowledge of sand dunes is extensive, and it is discussed in many of our ethnographic studies including the PEIS interviews of Big Dune on the Pleistocene Amargosa River in Nevada [25]. Dunes associated with Pleistocene lakes are understood as being a topographic feature placed at Creation for spiritual renewal and healing. According to a tribal representative, the Dunes Sing to Native people and convey information needed for ceremony. These dunes have eyes to watch over the land and a voice to share its messages in the songs that it sings and the stories it continues to tell our people ever since the beginning of time [25].

Escalante Desert

The Escalante Desert (Figure 10) is the southern portion of the extensive Pleistocene Lake Bonneville that continuously extended from Idaho to southern Utah [26]. The remains of Lake Bonneville are massive salt flats and the Great Salt Lake of northern Utah. Lake Bonneville filled its component lakes with sand, minerals, and salt which became the bottom of remnant playas like those in the Escalante Desert (Figure 11).

FIG 10

Figure 10: Escalante Desert with Wasatch Mountains to the east

FIG 11

Figure 11: Pleistocene Lake Bonneville with Southern End Filling What is Now Escalante Desert, Iron County Utah [22].

The Escalante Desert American Indian study area was traditionally occupied, used, aboriginally owned, and historically related to the Numic-speaking peoples of the Great Basin and western Colorado Plateau. This American Indian study area extends beyond the boundaries of the study area because of cultural resources in the surrounding landscape. The Paiute Indian Tribe of Utah (PITU) and the Confederated Tribes of the Goshute Reservation (CTGR) participated in the Solar PEIS field consultations to represent the cultural interests of Numic peoples. These Numic-speaking peoples have gone on record in past projects and stipulate again here that they are the American Indian people responsible today for the cultural resources (natural and manmade) in this study area. Their ancestors were placed here by the Creator, and they have subsequently lived in these lands while maintaining and protecting these places, plants, animals, water sources, and the cultural signs of their occupation. These Numic-speaking peoples further stipulate that because they have lived in these lands since the end of the Pleistocene and throughout the Holocene, they deeply understand the dramatic shifts in climate and ecology that have occurred over these millennia. Indian lifeways were dramatically influenced by these natural shifts, but certain religious and ceremonial practices continued unchanged. These traditional ecological understandings are carried from generation to generation through the recounting of origin stories occurring in Mythic Times and by strict cultural and natural resource conservation rules. PITU and CTGR have participated in this PEIS in order to explain the meaning and cultural centrality of the plants, animals, spiritual trails, healing places, and places of historic encounters that exist in these lands.

Escalante Desert (Figure 12) is named after the 1776 Spanish Fathers Escalante and Dominguez Expedition who became the first European to document the valley and the Native people living there (Figure 13). The expedition had followed well-traveled Native trails in an attempt to reach the Pacific Coast of North America. They failed, however, in this goal and turned back at the prominent hot spring in the valley. They returned via an alternative set of trails and would document the massive 1780 smallpox pandemic at Hopi on their journey to the northern New Spanish capital of Santa Fe. Because it was a government sponsored and formally approved expedition a gifted map maker was a part of the hundreds of participants.

FIG 12

Figure 12: The Escalante Desert, Utah is Generally Bounded by Enterprise in the South, Cedar City in the East, Lund in the North, and Modena in the West (Google Earth).

FIG 13

Figure 13: Escalante and Dominguez Expedition Map [22]

The Solar PEIS consulting tribes desired to be formally contacted on a government-to-government basis whenever projects or proposed land management actions occur on and/or near the following culturally special topographic places and features such as viewscapes, mesas from volcanic eruption, animals, and cultural plants for medicine and ceremony (Table 2). Points of contact with Euro Americans are remembered for their devastation due to diseases, armed conflicts, the arrival of grazing animals which ate Indian gardens and horticultural plants, and eventually settlement and physical removal from water and land.

Table 2: Table of Type and Names of Culturally Significant Topographic Features and Places

TAB 2

A few of these cultural places and features are indicated in this map (Figure 14) that identifies their spatial relationships with each other. Their temporal relationships are hundreds of thousands of years apart. Some of these are briefly discussed in this analysis to illustrate the heritage complexity of Escalante Desert.

FIG 14

Figure 14: Map of Special Cultural Features Considered in This Analysis [22]

Eagle Rock Ceremonial Complex

Eagle Rock is a translation of a Paiute name for an ancient healing rock. It is visually connected to the Escalante Deseret, which can be seen to the east from a landscape photo (Figure 15). The healing rock is spiritually connected though the Puha energy of the prominent mountain peak nearby, which is used for vision questing and restoring medicine songs. Next to Eagle Rock is Mountain Spring, which is used for bathing and water related plants. Nearby is Sulphur Spring, which is for purification before and after ceremony and healing.

FIG 15

Figure 15: Eagle Rock looking east to the Wasatch Mountains

According to an elder, Indian people came to this location from great distances to conduct important ceremonies. Eagle Rock, a famous doctor rock (Figure 16), was identified by tribal representatives as a key cultural feature in the Escalante Valley. Tribal representatives linked Eagle Rock to places such as Sulphur Springs, Mountain Spring Peak, and Mountain Spring and they thought these areas formed a large ceremonial complex. Tribal representatives described this as a traditional area used by Southern Paiute Puha’gants (shamans) and most likely Goshute shaman to tend to people who were ill and in need of rebalancing and healing. The Puha’gants would conduct complex healing ceremonies that could only be performed in a place of Puha, such as a doctor rock.

FIG 16

Figure 16: Eagle Rock Looking West with Mountain Spring in Background

According to an elder, rain and snow run-off from the mountains to the northwest also flow into the Escalante Valley. It is important from a Numic perspective to understand the hydrological system in this region. The flow of Puha follows the flow of water across a given landscape and connects places, people, and other elements. As water drains from the mountains in and around Eagle Rock and Mountain Spring Peak (each a place with high concentrations of Puha), the water and the Puha flow into the valley, connecting them with places like Table Butte, located to the southeast of the valley [22].

Thermo Hot Spring

These springs have been the center of activities in the immediate area since time immemorial. The hot springs are unique because they are located in the center of a valley instead of lying in a more typical location along the fault at the base of an uplifted mountain range. Thus, the Thermo Hot Springs (Figures 17 and 18) have a commanding view of the surrounding region—a 360-degree viewscape that is even further facilitated by the fact that the springs are perched above the surrounding ground by an estimated fifty feet. The views from this location include the Cricket Mountains to the north, the Mineral Mountains to the east, the Black Mountains to the south, and the San Francisco Mountains to the west. To the north is Sevier Lake and to the south is the southern expanse of the Escalante Valley. For millennia, Indian people have traveled to these special hot springs to engage in a variety of ceremonial activities. These activities include the curing of individuals using both the sulfuric muds and the mineralized hot waters. Other Indian people came to the hot spring to purify themselves before going to distant destinations where special activities such as vision quests or ceremonial balancing activities would occur. The hot springs were also visited by Puha‘gants (shamans) to acquire songs and Puha (power) needed to help their communities.

FIG 17

Figure 17: Grasses atop Thermo Hot Springs

FIG 18

Figure 18: Water from Hot Spring Mound

Water from the hot springs is used in healing ceremonies both at the springs and at other locations. Patients would come to hot springs at the instruction of or accompanied by a Puha’gant. Before entering a hot spring, Indian people would speak to the spirit of the spring, introducing themselves, and tell the spirit what type of healing was needed. Indian people have traditionally carried water from hot springs back to individuals who were unable to leave home due to age or illness [27]. Healing places occur at the locations where doctors take patients to conduct healing ceremonies or that doctors go to in order to gain insight into how to heal. Hot springs are recognized as strong sources of healing-Puha that derives from their form and characteristics, such as thermal heat or the location of the hot spring. A Puha’gant is required to facilitate the healing. Powerful minerals like paint and obsidian are used in the ceremony to assist in the healing. Hot springs are places of mixed power. Hot springs, like all water, were created for expressed and varying purposes. They can be embedded in powerful rivers, like the Pumpkin Springs in the lower Grand Canyon, canyons, like those in the Gold Strike Canyon [28], and small rivers, like those along the Virgin River near Hurricane, Utah [27]. Numic elders have stated that hot springs were also used by shamans for ritual purification prior to visiting sacred caves, valleys, or other spiritual locations, such as Parowan Gap. Such purification was necessary in order to prepare the mind and body for a safe and proper interaction with spiritual beings.

Parowan Gap

Parowan Gap (Figure 19) is a portal to the valley and the ceremonial places it contains. Before entering, prayers were made, and permission was requested. These ceremonies occurred because the valley is itself a living being with rights. This valley was a home to people. Like here and there, something attracted people to certain places where they could find medicine or food or things like that. That‘s what all these mountains and flats produced for those people. The times have changed things. Even if it‘s invisible, it changed. And the people start to change their ways without realizing or some of the times, they were forced to change. And the dances, like I said, ask for blessings for more wildlife and plants. They still have those dances [to keep the world in order]. Yeah they had round dances and certain times, like early in the morning, they’d have a sunrise ceremony. That’s when they thank the Mother Earth when the sun is coming up. They’d get a bucket of water and drink a little while they’re praying. They do that with an eagle feather usually. So a lot of Indian people are still very serious about doing those ceremonies, preserving our relationship with the earth [22].

FIG 19

Figure 19: Parowan Gap

Parowan Gap is one of the ceremonial places identified in the valley by Southern Paiute tribal representatives. People on pilgrimage (Puhahivats) would travel through Parowan Gap as part of the ceremonial process to and from areas out in the Escalante Valley. The gap between the volcanic ridge is a place where Puha collects, and it serves as a physical and spiritual transition zone between the Southern Paiute communities and the sacred areas out in the valley. The Parowan Gap trail follows the natural waterways and passes through the narrow and constricted opening in the Red Hills. Narrow spaces such as this contribute to the overall cultural meaning of physical and spiritual trails, especially to the Puhahivats moving along them to reach a pilgrimage destination place [29-31]. It is in these constrictions that Puha concentrates as a result of geological barriers.

A PITU Tribal Representative Explains How Parowan Gap Functioned for Puhahivats

Yeah, this is a gathering place, coming through, this is a main travel route. As a destination they used to stop here; this is where they used to have the houses, right through here and on top. They used to have different places where the medicine men would pray. It‘s a long climb up there. When I was here when I was growing up, I heard that some old fellas a long time ago found some gold up there inside one of the hills up there. Apparently, way in there someplace. They found the gold up there and they took it out and took it home, then came back to get some more and couldn‘t find it. It disappeared. Someone had put the gold there [as an offering]. Yeah, in a little sack or something [22]. Parowan Gap is associated with a Southern Paiute Creation story that explains the existence of a gap in the middle of the volcanic ridge and the presence of thousands of rock peckings and rock paintings (tumpituxwinap) (Figure 20). Places with tumpituxwinap are areas used by religious specialists during ceremonial activities, because these rock peckings and paintings are believed to be derived from supernatural authorship. According to the Southern Paiute Creation Story, the rocks were once people, and they became rocks for the benefit of humanity. The images on the rocks are related to this transformation and are part of the living universe. Southern Paiute people hold strong beliefs that the rocks are alive, have Puha, and spiritual value.

FIG 20

Figure 20: Rock Peckings in Parowan Gap

The peckings are used by religious specialists during ceremonial activities because these rock peckings and paintings are believed to be derived from supernatural authorship. According to the Southern Paiute Creation Story, the rocks were once people, and they became rocks for the benefit of humanity. The images on the rocks are related to this transformation and are part of the living universe. Southern Paiute people hold strong beliefs that the rocks are alive and have Puha and spiritual value.

Discussion

The previous ten ethnographic studies document that playas are culturally central heritage places for participating Native American tribes. The studies also document the cultural connections between the playas, their host valley, and the surrounding mountains that have provided water to the valley bottoms since the Pleistocene. Combining the playas, the valleys where they are located, and the surrounding mountain provide a heritage assessment framework for a holistic understanding of why and how Native Americans are culturally attached to this complex landscape. These study observations are consistent despite cultural and linguistic differences between the eighteen participating tribes.

These ethnographic studies specifically document that a holistic heritage assessment centered on a large playa will typically involve the following:

  1. A persistent Pleistocene Lake that is the center of this heritage landscape and the source of the salts and minerals that compose the playa.
  2. A residual wetland surrounding the Pleistocene Lake regardless of whether it is shrinking or expanding due to climate shifts.
  3. An overflow river that connects places along the playa valley which connects it with other similar valleys during wetter periods but continues to serve as a traditional path for both the normal movement of people and subsequent ceremonial movement. It does this because puha tends to flow along extant and ancient waterways.
  4. A large singing sand dune that often existed before the end of the Pleistocene because it was derived from and even older intervals of climate change and glacial shifts.
  5. An origin place or mythic time portal located at a self-voiced perturbance such as a volcanic outcrop or hot spring which was defined in the valley or along its edges at Creation for the use of Native peoples.
  6. An abundance of animals and plants that have occurred and are missing today like Mammoths and Saber Tooth Tigers but are remember and continue to be a spiritual presence.
  7. An abundance of animals and plants that have become increasingly spiritual such as the horned toad as the valley becomes dryer.

A tribal representative from Pahrump and Timbisha, during the Amargosa River PEIS study [25,32] provided an understanding of the cultural meanings associated with playas and their surrounding heritage landscapes. These are paraphrased below:

Geologic resources include a range of culturally significant features such as minerals used as paint sources, salts used in curing, quartz deposits used to make tools, volcanic basalt boulders used to hold the prayers of travelers, mountain tops used for vision questing, and fossil evidence of rivers used as devices for teaching about the past. All these geologic resources are alive according to the shared epistemology of our Numic-speaking peoples. The Creator made geologic resources alive by placing Puha in them when the Earth was formed. Today the geologic resources discussed here in Amargosa River Valley all have a place in the lives and history of Indian people.

Federal agencies are beginning to recognize the presence of Native people in these Pleistocene ecosystems. This is appropriate because the scientific dating of Native people in these areas extends now to about 40,000 BP thus placing people and megafauna and massive wet ecosystems together. White Sands National Monument is such a federal response, and it has illustrated this shift in perspective with paintings of Native people and the animals and ecosystems of the heritage past (Figure 21).

FIG 21

Figure 21: Human & Animals Trackway, Printed with permission of Karen Carr 2024 [32]

Native Americans involved in our ethnographic studies have asserted that the image above accurately represents their oral history of these ancient times. Of importance are the heritage implications of ancient places, animals, plants, springs, and now dry lakes and rivers being celebrated by land managers museums, geoarchaeologists, and of course, the ability of new generations of Native people to be connected with their lives in Time Immemorial.

References

  1. Chamberlin R (1913) Place and Personal Names of the Goshute Indians of Proceedings of the American Philosophical Society 52: 1-20.
  2. Shoshoni Language Project. Shoshoni Dictionary [Internet]. Shoshoni Dictionary. 2021 [cited 2024 May 8].
  3. Steward J (1943) Cultural Element Distributions: XXIII, Northern and Gosiute 3rd ed. Berkley, CA, USA: University of California Press. (Anthropological Records; vol. 8).
  4. Halmo D, Stoffie R, Evans M (1993) Paaitu Nanasuagaindu Pahonupi (Three Sacred Valleys): Cultural Significance of Gosiute, Paiute, and Ute Plants. Human Organization 52: 142-150.
  5. Stoffie R, Evans M, Halmo D (1989) Paitu Nanasuagaindu Pahonupi (Three Sacred Valleys): An Assessment of Native American Cultural Resources Potentially Affected by Proposed U.S. Air Force Electronic Combat Test Capability Actions and Alternatives at the Utah Test and Training Range. Ann Arbor, Michigan, USA: University of Michigan.
  6. Bennett M, Bustos D, Pigati J, Springer K, Urban T, et al. (2021) Evidence of humans in North America during the Last Glacial Maximum. Science 373: 1528-1531. [crossref]
  7. Pigati JS, Springer KB, Honke JS, Wahl D, Champagne MR, et (2023) Independent age estimates resolve the controversy of ancient human footprints at White Sands. Science 382: 73-75. [crossref]
  8. Rowe T, Stafford TW, Fisher D, Enghild J, Quigg JM, et (2022) Human Occupation of the North American Colorado Plateau 37,000 Years Ago. Frontiers in Ecology and Evolution. 10.
  9. Grayson D (1993) The Desert’s Past: A Natural Prehistory of the Great Basin. Washington D.C, USA: Smithsonian Institution Press.
  10. Padrilla Estrada K (2018) Nellis Air Force Base Drops Expansion Bomb on Southern The Nevada Independent.
  11. Nellis Air Force NTTR Military Land Withdrawal, Legislative Environmental Impact Statement [Internet]. NTTR Military Land Withdrawal, Legislative Environmental Impact Statement.
  12. Solar PEIS (2022) Ethnographic Analyses for Nine Proposed SEZs. Social Energy Development Programmatic EIS Information Center [Internet]. Ethnographic Analyses for Nine Proposed SEZs. Social Energy Development Programmatic EIS Information Center.
  13. Argonne National Lab (2024) Utility-Scale Solar Programmatic Bureau of Land Management. Argonne [Internet]. Utility-Scale Solar Programmatic EIS. Bureau of Land Management. Argonne.
  14. Stoffie R (2018) Nellis LEIS: Native American Ethnographic Study. In Las Vegas, NV, USA.
  15. Stoffie R, Arnold R, Van Vlack K (2022) Landscape Is Alive: Nuwuvi Pilgrimage and Power Places in Nevada. Land 11.
  16. Stoffie R, Toupal R, Zedeño M, Patrick B (2002) East of Nellis: Cultural Landscapes of the Sheep and Pahranagat Mountain Ranges, An Ethnographic Assessment of American Indian Places and Resources in the Desert National Wildlife Range and the Pahranagat National Wildlife Refuge of Nevada. Tucson, AZ, USA: Bureau of Applied Research in Anthropology, University of Arizona.
  17. Wriston T, Gilreath A, Duke D (2007) Desert Dry Lake Archaeological and Geomorphological Survey, North of Las Vegas, Nevada. Davis, CA, USA: Far Western Anthropological Research Group.
  18. Agar M (1996) The Professional Stranger: An Informal Introduction to Leeds, England: Emerald Publishing.
  19. Mead M (1928) Coming of Age in Samoa: A Psychological Study of Primitive Youth for Western New York, NY, USA: William Morrow and Co.
  20. Benedict R (1946) The Chrysanthemum and the Sword: Patterns of Japanese Boston, MA: Houghton Miffiin.
  21. Lowie R (1937) The History of Ethnological Ann Arbor, Michigan: University of Michigan Press.
  22. Stoffie, R, Van Vlack K, Johnson H, Dukes P, De Sola S, et (2011) Tribally Approved American Indian Ethnographic Analysis of the Proposed Escalante Solar Energy Zone [Internet]. Tucson, AZ, USA: Bureau of Applied Research in Anthropology, University of Arizona.
  23. Reheis MC, Caskey J, Bright J, Paces JB, Mahan S, et (2019) Pleistocene lakes and paleohydrologic environments of the Tecopa basin, California: Constraints on the drainage integration of the Amargosa River. GSA Bulletin 132: 1537-1565.
  24. Gould D, Glowacka M (2004) Nagotooh (Gahni): The Bonding between Mother and Child in Shoshoni Tradition. Ethnology 43: 185-191.
  25. Stoffie R, Van Vlack K, Johnson H, Dukes P, De Sola S, et al. (2011) Tribally Approved American Indian Ethnographic Analysis of the Proposed Amargosa Valley Solar Energy Zone [Internet]. Tucson, AZ, USA: Bureau of Applied Research in Anthropology, University of Arizona.
  26. Laabs B, Munroe J (2016) THE RELATIVE TIMING OF LATE PLEISTOCENE GLACIER AND PLUVIAL LAKE MAXIMA IN THE NORTHERN GREAT BASIN, NEVADA AND UTAH, U.S.A.
  27. Stoffie RW, Austin DE, Fulfrost BK, Phillips III AM, Drye TF (1995) Itus, Auv, Te’ek (Past, Present, Future) [Internet]. Bureau of Applied Anthropology, University of Arizona.
  28. Stoffie R, Zedeño M, Eisenberg A, Toupal R, Carroll A, et (2000) (The Backbone of the River): American Indian Ethnographic Studies Regarding the Hoover Dam Bypass Project. Tucson, AZ, USA: Bureau of Applied Research in Anthropology, University of Arizona.
  29. Van Vlack K (2012) Southern Paiute Pilgrimage and Relationship Formation. Journal of Ethnology 51: 129-140.
  30. Van Vlack K (2012) Puaxant Tuvip: Powerlands Southern Paiute Cultural Landscapes and Pilgrimage Trails, [PhD Dissertation]. [Tucson, AZ]: University of Arizona.
  31. Van Vlack K (2018) Puha Po to Kavaicuwac: A Southern Paiute Pilgrimage in Southern International Journal of Intangible Heritage 13: 129-141.
  32. Carr K (2024.) Humans and Animals Trackway, White Sands National Monument.
fig 1

Safety Practice and Associated Factors among Waste Handlers at Selected Government Hospitals in Somali Region, Eastern Ethiopia: A Hospital Based Cross- Sectional Study

DOI: 10.31038/PSYJ.2024634

Abstract

Background: Healthcare waste is produced from various therapeutic procedures in hospitals, such as chemotherapy, dialysis, surgery, delivery, resection of gangrenous organs, autopsy, biopsy, and injections, and most of the wastes are toxic, harmful, carcinogenic, and infectious materials. Medical Waste handlers faced massive exposure to hazardous waste and occupational accidents as a result of manual handling of waste and working under unfavorable conditions. There are limited studies and updated information concerning these issues in the country.

Objective: To assess safety practice and associated factors among waste handlers at public hospitals in Somali Region, Ethiopia.

Method: An institutional-based cross-sectional study was carried out among 417 waste handlers in selected public hospitals from June 15 to July 15, 2021. Data were collected from respondents by using a simple random sampling technique. The collected data were entered into Epi-data 3.1 software and exported to SPSS 20 for analysis. Bi-variable analysis was done, and variables with p-values below 0.25 were identified as candidates for multi-variable analysis. Then multi-variable analysis was done, and an adjusted odd ration was computed and interpreted. A p-value less than 0.05 is the cut-off point for determining the significance of the association.

Result: The proportion of current safe practice among public hospital waste handlers was found to be 38.2% (95% CI: 33.2, 43.1). Good availability of safety materials (AOR=9.3; 95% CI: 5, 17.2), Good knowledge (AOR=7.2; 95% CI: 3.7, 14), a positive attitude (AOR: 5.4; 95% CI: 2.53, 11.47), and age group were significantly associated with safety practice.

Conclusion: The proportion of safe practices among hospital waste handlers was found to be low compared to national and international standards. Good knowledge, a positive attitude, a good supply of safety materials, and an age group are the determinants of safety practice. To provide good safety practice, adequate professional support and supervision should be in place to increase their knowledge about safety precautions, and similarly, providing enough safety materials is recommended to strengthen adherence to safety practice among hospital waste handlers.

Keywords

Safety Practice, Determinant Factors, Waste Handlers, Government hospitals, Somali Region, Ethiopia

Introduction

Workers and waste pickers handling solid waste throughout the world are exposed to occupational health and accident risks related to the content of the materials they are handling, emissions from those materials, and the equipment being used [1]. About 85% of wastes produced in health facilities are non-hazardous, and the remaining 15% of health care waste is characterized as hazardous and can pose a number of health risks [2,3]. Waste handlers are often at higher risk than health care professionals. Because healthcare professionals produce the waste and throw it in the garbage. However, waste handlers handle it extensively throughout, and mostly very little attention is given to their safety [4]. Medical waste handlers are working in a very poor and unsafe working environment, and mostly they are victims of occupational health hazards from poor safety practices [5]. The prevalence of needle stick injuries, sharp injuries, and blood and body fluid splashes among hospital waste handlers is higher because of the lack of personal protective equipment while on duty and inappropriate waste segregation practices [6]. The occupational safety of health care waste handlers cannot be overlooked because health care waste handlers are at constant risk of exposure to blood-borne pathogens .In Ethiopia, we have a set of Standard Precautions for health safety practices that have been demonstrated to be effective in reducing the occurrence of adverse healthcare events. Additionally, the set can help medical waste handlers and healthcare providers assess the degree to which safe practices have already been implemented in their settings and the degree to which the practices provide tangible evidence of the medical waste handler’s safety improvement and increased patient satisfaction and loyalty [7].

Worldwide, information on the spread of infections resulting from waste handling is limited. Studies from developed countries have shown that occupational exposure to waste may result from exposure to various work hazards [8]. There are studies showing different health complaints, such as respiratory problems [9,10], increased risk of hepatitis A and B [11,12] and skin diseases [13], for people working in waste handling. In addition, self-reported risks, including musculoskeletal, fatigue, gastrointestinal, and hearing complaints, were also identified [14]. Professional-related risk assessment reports showed that waste collectors had the third highest needle stick injury rate (18.4 per 1000 per year) and the second highest other sharps injury rate (7.1 per 1000 per year) compared with healthcare workers [15]. One study showed that each year, waste collectors reported 50–100 puncture wounds as a result of collecting medical waste from private medical practitioners and from the disposal of needles by drug addicts [16].Health care waste should be collected and transported in a safe way to avoid unnecessary exposure [17,18]. But about 58.8% and 41.2% of waste handlers were exposed to blood and body fluids due to carrying overfilled waste bags, which increase the risk of infection for different pathogens like HBV, HCV, and HIV/AIDS, and about 47% of medical waste handlers, had at least one accidental Sharp injury because of improperly discarded needles and sharp materials [19,20].Unavailability or shortage of personal protective devices aggravates the risk of acquiring infection while exposed to hazardous wastes (5). Waste handlers usually do not wear sufficient protective clothing during waste handling, which increases the potential risk of accidents .Inappropriate collection, storage, processing, transport, and handling of the health care waste exposes the staff of the facility, patients, and their attendants to the risk of serious health hazards. Many healthcare facilities in developing countries dispose of their waste in dustbins along with general waste; some even re-use sharps and syringes, thereby increasing the risk of transmission of infections [21].

Even though the impact of healthcare waste on healthcare workers is well described globally [22], less attention is given to waste collectors, and countrywide official statistical data do not address the health and working conditions of waste handlers [23].The study done in Eastern Ethiopia also showed that 30% of waste handlers were exposed to any sharp materials due to improper handling, poor waste segregation, and poor utilization of personal protective equipment (5). Waste handlers in Hawassa city in south Ethiopia have reported that they have experienced needle-stick injuries at least once in their lives at the different healthcare facilities, ranging from 25–100% [24,25].Studies in developing countries, including Ethiopia, indicate that there are limitations on safe waste handling practices among health care waste handlers due to different factors. However, there are few studies conducted regarding the prevalence of safety practices among hospital waste handlers in Ethiopia, and less attention is given to the prevalence of safety practices and factors exposing waste handlers to possible injuries and accidents. Hence, the intended study will determine the prevalence of safety practice and its associated factors among hospital medical waste handlers, which in turn will enable us to understand the overall situation of safety practice and minimize those factors that hinder the safety practice of hospital waste handlers.

Methods and Materials

Study Area and Period

The study was conducted in the Somali region, which is the second-largest and easternmost of the ten regions. The regional state borders the Ethiopian states of Afar and Oromia and the chartered city of Dire Dawa to the west, as well as Djibouti and Somalia to the south and north-east. Based on the 2007 census conducted by the central statistical agency of Ethiopia, the Somali region has a total population of 7,445, 2219, consisting of 3,472,490 men and 3,972,729 women. Urban inhabitants’ number 1,489,044 or 20% of the population and a further 5,956,175 or 80% were pastoralists and farmers. This region has an estimated density of 20.9 people per square kilometer in an area of 279,252 square kilometers. The region is divided into six councils and 93 districts for administrative purposes. The Somali Regional Health Bureau is responsible for the overall Health activity in the region.

There are Ten Primary Hospitals, Two General hospitals, and One Referral Hospital in the Somali region, namely, Dagahbour Primary Hospital, Qabri Dahare Primary Hospital, Warder Primary Hospital, Filtu Primary Hospital, Dollo Ado Primary Hospital, Raso Primary Hospital, Hargelle, Sitti/Biki Primary Hospital, Gashamo Primary Hospital, Fik Primary Hospital, Karamara General Hospital, Godey General Hospital, and Jig-jiga University. Sheik Hassen Yabare Referral Hospital, respectively, and the major common services given by those general hospitals and referral hospitals are maternal and child health services, prevention and control of major communicable diseases, non-communicable disease prevention and control, emergency services, laboratory services, and operational services. Generally, in the Somali region, there were approximately 710 medical waste handlers working in government hospitals. In selected hospitals, there were around 458 medical waste handlers. The study was conducted from June 15 to July 15, 2021, at public hospitals in the Somali Region and Eastern Ethiopia.

Study Design

Hospital based cross-sectional study was employed.

Source Population

Source populations were waste handlers working in Somali region public hospitals.

Study Population

All selected waste handlers working in the selected public hospitals during study period.

Inclusion Criteria

All waste handlers were enrolled in the selected government hospitals, present on duty during data collection period.

Exclusion Criteria

Waste handlers who were absent during the time of data collection and those with hearing impairments.

Sample Size Determination

Sample Size Calculation for the 1st Objective

The sample size for the first objective had been determined using the single population proportion formula by considering the prevalence of safe practice as 44.1% [26,27] from a previously conducted study on safety practice among waste handlers in Adisababa city administration public hospitals in central Ethiopia. Hence, assuming a 5% marginal error (d), a 95% confidence level (alpha=0.05), and the sample size for the first objective, it can be calculated as follows:

FOR

n=required sample size

Z=the standard normal deviation at 95%confidence interval=1.96

P=expected proportion (44.1%)

d=margin of error that can be tolerated 5% (0.05)

1-p=proportion of population that do not possess the character of interest.

Therefore n=(1.96) ^2 .0.441(1-0.559)=379

(0.05) ^2

=379 and by adding 10% non-response rate 417 was the sample size for the 1st objective.

Sample Size Calculation for the 2nd Objective

Sample size for specific objective 2 was calculated using the statcalc for sample size and power for cohort or cross-sectional studies of Epi Info version 7, considering the following assumptions (Table 1):

Therefore, from the calculated sample sizes for both objectives, the maximum sample size from the first objective, 417, was taken as the study sample since it covers the two objectives.

Table 1: Sample size determination for second specific objective using some important factors of safety practice

Factor

Cl Power (1-β) Ratio Proportion of outcome among exposed Proportion of outcome among un-exposed OR

Sample size(n)

Good Knowledge (27)

95%

80% 1 (Good) 53.3% (Poor) 24%  

3.57


100

Received Training (28)

95%

80% 1 (Trained) 73% (Not trained)53% 2.39

202

(Yes) Availability of colour coded bin (29)

95%

80% 1 (Yes)74.2% (No)31.1% 6.3

50

Sampling Technique

There are Ten Primary Hospitals, Two General hospitals, and One Referral Hospital in the Somali region; Three Primary Hospitals and One General Hospital were selected by lottery. Whereas the referral hospital was selected purposefully. Then the calculated sample size was proportionally allocated to each selected hospital based on the number of total medical waste handlers they had. To determine the total number of participants from each selected health facility, a computer-generated simple random sampling technique was used.

Sampling Procedure

Sampling procedure is shown in Figure 1.

fig 1

Figure 1: Schematic presentation of sampling procedure of waste handlers at selected government hospitals in Somali Region, Ethiopia 2021.

Data Collection Tool and Procedure

The data was collected by the interviewer through a structured questionnaire. A structured questionnaire was developed by the principal investigator after reviewing WHO, FMOH infection prevention guidelines, and different literature with modifications based on research objectives. Prior to the actual data collection, the questionnaire was adjusted and corrected based on the pre-test result, and the final questionnaire was translated into Somali and then back to English to ensure its consistency. Finally, one environmental health scientist and two public health professionals conducted face-to-face interviews to collect the data using the Somali version questionnaire.

Variables

Dependent Variable

Safety practice (Safe/Unsafe)

Independent Variables

Socio-Demographic and Economic Factor

  • sex
  • Age
  • Marital status
  • Educational Status
  • monthly income

Work Related Factors

  • working hours per day,
  • working departments/units,
  • Work experience

Waste handlers risk perceptions

  • Attitudes
  • Knowledge about safety practice

Organizational factors

  • Training,
  • Supportive supervision,
  • Availability of equipment’

Data Quality Control

To maintain the quality of the data, adequate training was given to data collectors and supervisors for three days on the techniques of data collection. The questionnaire was pre-tested by taking 5% of the study sample at one of the selected hospitals. The collected data was checked for completeness and consistency. Each questionnaire was coded and cleaned. Then the coded and cleaned data was entered into Epi-data version 3.1 software.

Operational Definition

Safety practice is the practice of using personal protective equipment’s such as (heavy duty glove, gown, boots and masks), hygiene, vaccination for HBV and appropriate waste segregation with separated bins to prevent oneself from disease causing microorganisms.

Waste handlers are cleaners that are involved in the handling of medical wastes.

Safe Practice

Respondents who scored more than mean of correct answer for seven practice questions with yes or no answer were classified as safe practiced [28].

Good Knowledge

Medical waste handlers who correctly responded4 and above out of the 7 knowledge-based questions were considered as having good knowledge [30].

Good Attitude

Attitude questions responses were indicated with the three-point Likert type scale of measurement as “         Disagree”, “neutral”, and Agree” and numerical values of 1,2 and 3 respectively were given. The mean score was determined after computing attitude assessing questions[26].

Good Supplies Availability

The presence of supplies like personal protective equipment’s (heavy duty glove, gown, masks and boots), three colour coded bins and hand washing facilities like soap and anti-septic hand rub.

Trained

Waste handlers who got any types of training concerning safe waste handling.

Data Processing and Analysis

The completeness of the data was checked manually and coded accordingly. The coded and cleaned data was entered into the computer using EpiData version 3.1 and exported to SPSS version 20. After completion of data entry, it was cleaned before analysis. A description of frequency, mean, proportion, and SD was done for the first objective. Binary logistic regression was employed to identify factors associated with safety practices. Initially, bivariate analysis was done, and variables with a p-value below 0.25 were identified as candidates for multivariate analysis. Then multi-variable analysis was done, and an adjusted odd ration was computed and interpreted. A p-value less than 0.05 is the cut-off point for determining the significance of the association. The results of the study were presented in text, tables, and graphs. Multi-collinearity was checked by the variance inflation factor (VIF), and the goodness of model fit was checked by the Hosmer-Lemeshow test.

Ethical Consideration

An ethical clearance letter was acquired from the ethical review board of the College of Medicine and Health Sciences, Jigjiga University, and a permission letter was secured from the regional health bureau and delivered to the public hospital administrations. Written informed consent was secured from each participant. The confidentiality of the information and the privacy of the study participants were maintained. The participation was voluntary, and they had the right to withdraw from the interview if it was not comfortable for them.

Dissemination and Utilization of Finding

The findings will be disseminated to Jigjiga University, the School of Graduate Studies, the School of Public Health, the Department of Epidemiology, the Somali Regional Health Bureau, and those selected hospitals through presentations and printed materials.

Results

Socio–demographic Characteristics and Work Related Factors of Respondents

From the total sample of 417 included in the study. 401 waste handlers were interviewed, with a response rate of 96.2%. The mean age of the study participants was 32.1 (SD 6.1) years, and all respondents were females (100%). About 118 (29.4%) of them were in the age group 31–35 years. Married hospital waste handlers were 220 (54.9%), while 251 (66.1%) were illiterate. The majority of them, 255 (63.6%), had greater than 5 years of working experience, and 235 (58.6%) of them had an income level of 2000 birr per month. Two hundred eighty-four (70.8%) waste handlers were working their job in regular time (8 hours only). As compared with the other departments, the highest numbers of participants (133, 33.2%) and 69, 17.2%) were from the emergency and surgical wards, respectively (Table 2).

Table 2: Socio demographic characteristics and work related factors of medical waste handlers in selected public hospitals in Somali region, Eastern Ethiopia, August, 2021(N=401).

Sn

Variables Category Frequency

Percentage (%)

1 Age ≤25yrs

56

14%

26-30yrs

107

26.7%

31-35yrs

118

29.4%

>35yrs

120

29.9%

2 Marital status Married

265

66.1%

Single

97

24.2%

Widowed

17

4.2%

Divorced

22

5.5%

3 Religion Muslim

296

73.8%

Orthodox

49

12.2%

Protestant

24

6%

Other

32

8%

4 Education level Illiterate

251

62.6%

Primary(1-8)

108

26.9%

Secondary(9-12)

28

7%

Diploma & above

14

3.5%

5 Service year ≤5yrs

146

36.4%

>5yrs

255

63.6%

6 Monthly Income ≤2000ETB

235

58.6%

>2000ETB

166

41.4%

7 Working hours per day ≤8hrs

284

70.8%

>8hrs

117

29.2%

8 Working departments Outpatient

50

12.5%

Emergency

133

33.2%

Laboratory

33

8.2%

Surgical

69

17.2%

Medical

33

8.2%

Pediatric

46

11.5%

Gyne & Obs

28

7%

Other

9

2.2%

Proportion of Safety Practice

The proportion of safe practice in this study was found to be153 (38.2%) with 95% CI: 33.2, 43.1) (Figure 2).

fig 2

Figure 2: The prevalence of safety practice among medical waste handlers at selected government hospitals in, Somali Region, Eastern Ethiopia, August 2021. Safety Practice of health care waste handlers.

About 108 (25.9%) of them wore at least four and above four types of personal protective equipment during the handling of health care waste. where 44 (11% of them) washed their hands at all the selected critical times of hand washing. Two hundred (49.9%) of the waste handlers were immunized for HBV. Among the medical waste handlers who participated in the study, 63.6% separated hazardous and non-hazardous waste during the collection and transportation of hospital waste to the disposal site. Nearly 90% of them used a separated, color-coded bin system during collection. But 265 (66.1%) were mixing waste stored at separate bins during transportation of hospital waste to the disposal site. Only 112 (27.9%) of them asked for decontamination of hazardous waste before disposal.

Among the respondents, 384 (95.8%) had ever had a needle stick injury. 127 (30.1%) of the respondents reported that they use antiseptic hand rub after handling medical waste, and 397 (99%) of the respondents reported that they hadn’t ever received post-exposure prophylaxis for HIV/AIDS. About 17 (4.2%) of the waste handlers had the intention to move medical waste using trolleys in the future.

Only 51 (12.7%) medical waste handlers of the study participants reported that they had been exposed to the blood or other body fluids of patients through contact; 383 (95.5%) of these waste handlers reported that they had ever faced a sharp injury in the last year. Finally, among all waste handlers asked, 153 (38.2%) of them were practicing safely, and the rest (248, 61.8%) were practicing unsafely (Table 3).

Table 3: The prevalence of safety practice among waste handlers in selected public hospitals of Somali region, eastern Ethiopia, August 2021.

Sn

Safety practice Category Frequency

Percentage (%)

1 Wore at least four and above four types of personal protective equipment’s

Yes

108

25.9%

No

293

73.1%

2 Hand washing at five critical time

Yes

44

11%

No

357

89%

3 Immunized for HBV

Yes

200

49.9%

No

201

50.1%

4 use colour coded bine system

Yes

360

89.8%

No

41

10.2%

5 separate hazardous and non-hazardous waste

Yes

255

63.6%

No

146

36.4%

6 Ask decontamination of waste before disposal

Yes

112

27.9%

No

289

72.1%

7 Mix waste stored in a separate bins during transportation

Yes

265

66.1%

No

136

33.9%

8 Ever had needle stick injury

Yes

17

4.2%

No

384

95.8%

9 Have you faced a sharp

Yes

18

4.5%

Injury in the last one year

No

383 95.5%
10 Have you ever exposed to blood or other body fluids of patients through contact

Yes

51

12.7%

No 350

87.3%

11 Ever got post exposure prophylaxis for HIV/ADIS

Yes

4 1%
No 397

99%

12 Move medical waste using trolley

Yes

17 4.2%
No 384

95.8%

13 Do you use antiseptic hand rub

Yes

127 30.1%
No 274

64.9%

Safety practice

Safe practice

153 38.2%
Unsafe practice 248

61.8%

Knowledge of the Respondents Regarding Safety Practice

Concerning knowledge of the study participants 244(60.9%) of the respondents were having knowledge about safety practice (Figure 3).

fig 3

Figure 3: Proportion of knowledge on safety practice of the study participants at selected public hospitals in Somali region, eastern Ethiopia, August 2021.

Knowledge of the Respondents Regarding Safety Practice

Out of 401 respondents, seven knowledge questions with a yes or no answer were asked to assess their knowledge about safety practices. 289 (72.1%) of the respondents knew they were at risk of hospital-associated infections. Nearly 70% of them knew that washing hands with plain soap and water inhibits resident flora, and 68.2% of them knew that gloves should be used not only in anticipation of blood or body fluid exposure. The majority of the respondents (274, or 68.3%) knew being vaccinated for the HBV vaccine was a means of preventing infection. Nearly 60% of them had knowledge of post-exposure prophylaxis. Nearly 61% of study participants had good knowledge (Table 4).

Table 4: Safety practice Knowledge related item responses of the study at selected public hospital waste handlers in Somali region, Ethiopia, August 2021.

Sn

Knowledge Category Frequency

Percentage (%)

1 Are hospital waste handlers are at risk of infections

Yes

289 72.1%
No 112

27.9%

2 Washing hand with plain soap and water inhibit resident flora

Yes

277 69.1%
No 124

30.9%

3 Gloves should be worn if blood or body fluid exposure is anticipated

Yes

276 68.2%
No 125

31.8%

4 Washing your hands with soap and alcohol decrease transmission of infectious disease

Yes

284 70.8%
No 117

29.2%

5 Immunized for HBV is a means of prevention from infections

Yes

274 68.3%
No 127

31.7%

6 Getting PEP with in 72hr of exposure is a means of treatment

Yes

240 59.9%
No 161

40.1%

7 Have you ever heard about safety practice

Yes

293 73.1%
No 108

26.9%

Knowledge about safety practice

Good

244 60.9%
Poor 157

39.1%

Attitude of Health Care Waste Handlers about Safety Practice

A total of 401 respondents were asked five attitude questions with Likert-type scale options ranging from “disagree to agree to assess their attitude about safety practices. The majority of them, 195 (48.6%), agreed that washing hands with soap or alcohol-based antiseptics decreased the risk of transmission of hospital-acquired infections. Nearly 56.1% of them disagreed that gloves provide complete protection against acquiring or transmitting hospital-acquired infections, and 252 (62.8%) disagreed that hand washing is unnecessary when gloves are worn. About 245 (61.1%) of the study participants disagreed that frequent hand washing damages the skin and causes cracking, dryness, irritation, and dermatitis. A total of 235 (58.6%) of the study participants disagreed that hospital waste handlers have a very low risk of acquiring infection from improperly disposed hospital waste. More than 50% (209) of the study participants had a positive attitude towards. Safety practices (Table 5).

Table 5: Attitude about safety practice of public hospital waste handlers in Somali region, Ethiopia, August 2021.

Sn

Attitude Category Frequency

Percentage (%)

1 Glove provides complete protection against acquiring /transmitting infections Disagree

225

56.1%

Neutral

46

11.5%

Agree

130

32.4%

2

Washing hands with soap or alcohol based antiseptic decrease the risk of transmission of hospital acquired infections

Disagree

161

40.2%

Neutral

45

11.2%

Agree

195

48.6%

3 Hand washing is unnecessary when gloves are worn Disagree

252

62.8%

Neutral

22

5.5%

Agree

127

31.7%

4

You have a very low risk of acquiring infection from improperly disposed hospital wastes

Disagree

235

58.6%

Neutral

106

26.4%

Agree

60

15%

5 Frequent hand washing damages skin and causes cracking, dryness, irritation and dermatitis Disagree

245

61.1%

Neutral

58

14.5%

Agree

98

24.4%

Attitude

Positive attitude

209

52.1%

Negative attitude

192

47.9%

Organizational Factors Affecting Safety Practice of Hospital Waste Handlers

Out of 401 waste handlers interviewed, 185 (46.2%) had gained any type of training about safety practices, 177 (44.1%) were supervised regularly by the organization, and 39 (9.7%) had both training and regular supportive supervision (Figure 4).

fig 4

Figure 4: Organizational factors affecting safety practice of hospital waste handlers in Somali region, Eastern, Ethiopia, August 2021.

Availability of Personal Protective Equipment’s among Waste Handlers

A total of 401 respondents were interviewed to check the availability of personal protective equipment in the health facility. From the interviewed respondents, almost 251 (95%) of them responded that gloves were available, while 376 (93.8%) of them responded that gowns were available. Almost 62.6% of them also responded that masks were available. Nearly 14.7% of them answered that caps were available, and 24 (6%) of them responded that goggles were available at the facilities. A few respondents (2.5%) responded that boots were available at the hospitals during the data collection period (Figure 5).

fig 5

Figure 5: Availability of personal protective equipment’s among waste handler in selected government hospitals in Somali region, Eastern, Ethiopia, August 2021.

Factors Associated with Safety Practice

Bivariate Analysis of Socio-demographic Factors Relating with Safety Practice

In this study, there is a significant association between respondent’s age and safety practices. Waste handlers whose age is between 31 and 35 years were 78% times (COR=0.22, 95% CI=0.13, 0.379; P=0.0001) less likely to be safe practiced compared to waste handlers whose age is included in other age categories. Also, health care waste handlers whose age is between 26 and 30 were 87% times (COR=0.13, 95% CI=0.72, 0.24; P=0.0001) less likely to be safe practiced compared to waste handlers whose age is included in other age categories.

The service year also showed a significant association with safety practices. Waste handlers who have worked less than or equal to 5 years were 34% (COR=0.66, 95% CI 0.44, 0.998; P=0.049) times less likely to be safe practiced compared to waste handlers who have worked greater than 5 years of working experience (Table 6).

Table 6: Sociodemographic and work related factors associated with safety practice using bivariate logistic regression at public hospitals in Somali Region, Eastern Ethiopia, August 2021.

Variable

Category Safety Practice COR (95% CI) P-value
Safe Unsafe
Age In Years ≤25yrs

4

52 0.033(0.11-0.098) 0.0001*

26-30yrs

25 82 0.131(0.72-0.237)

0.0001*

 31-35yrs

40

78 0.22(0.13-0.379) 0.0001*

>35yrs

84 36 1.00
Marital status Married

102

163 0.52 (0.22-1.25) 0.145

Single

32 65 0.41(0.16-1.1)

0.06

Widowed

7

10 0.58(0.16-2.1) 0.41

Divorced

12 10 1.00
Education Illiterate

84

167 1.84(0.5-6.79) 0.36

Primary(1-8)

54 54 3.67(0.97-13.88)

0.056

Secondary(9-12)

12

16 2.75(0.63-12.1) 0.18

Diploma & above

3 11 1.00
Monthly income ≤2000ETB

97

138 1.38(0.1-2.1) 0.126

>2000ETB

56 110 1.00
Service year ≤5yrs

55

114 0.66(0.44-0.998) 0.049*

>5yrs

98 134

1.00

Working hours ≤8hrs

103

163 1.1(0.69-1.62) 0.81

>8hrs

50 84 1.00
Working unit Outpatient

15

35 0.54(0.21-0.81) 0.398

Emergency

52 81 0.8(0.44-2.1)

0.75

Laboratory

7

26 0.34(0.17-0.86) 0.17

Surgical

28 41 0.85(0.65-3.1)

0.83

Medical

13

20 0.81(0.67-2.94) 0.79

Pediatric

21 25 1.1(0.5-2.93)

0.95

Gyne & Obs

13

15 1.1(0.43-5.64) 0.92

Others

4 5 1.00

Bivariate Analysis of Associated Variables Relating with Safety Practice

In this study, there was a statistically significant association between knowledge of waste handlers and safety practice. Waste handlers who had good knowledge were 4.3 times safer than those who had poor knowledge (COR=4.3, 95% CI 2.75, 6.75; P=0.0001).

Regarding attitude, there is also a significant association between attitude and safety practice. Respondents who had a positive attitude were 1.66 times (COR=1.66, 95% CI 1.1–2.6; P=0.024) more likely to be safe practitioners compared to respondents who had a negative attitude toward safety practices.

Whereas availability of materials is associated with safety practice, health care waste handlers who had availability of safety materials were 7.1 times (COR=7.1, 95% CI 4.4, 11.46; P=0.0001) more likely to be safe practitioners than those who had a shortage of safety materials (Table 7).

Table 7: Associated variables about safety practice of waste handlers using bivariate logistic regression at government hospitals in Somali Region, Eastern Ethiopia, August 2021.

Safety practice

COR (95% CI) P-value
Variable Categories Safe Unsafe
Knowledge Good 116 104 4.3(2.72-6.75) 0.0001*
Poor 37 144 1.00
Attitude Positive 113 156 1.67 (1.1,2.6) 0.024*
Negative 40 92 1.00
Training


Trained 83 111 1.46(0.976-2.19) 0.065
Not trained 70 137 1.00
Availability of materials


Good 125 96 7.1(4.4-11.46) 0.0001*
Poor 28 152 1.00

Multivariate Logistic Regression Analysis of Safety Practice among Hospital Waste Handlers in Somali Region, Ethiopia, August 2021

Bivariate logistic regression was done, and variables with p-values <0.25 were selected for the multiple logistic regression analysis, and multicollinearity was checked by looking at the VIF (variance inflation factor) in the linear regression model. In the bivariate analysis, it was found from socio-demographic variables: age group, had a statistically significant association with safety practice (p-value <0.05). From work-related variables, service year was significantly associated with safety practices. Also, the results revealed in the bivariate analysis of the variables, including knowledge, attitude, and availability of supplies, were significantly associated with safety practice.

In multivariate logistic regression, the confounding effect of one variable over the other variables was adjusted. Based on this, age category, knowledge of the participants, attitude, and availability of safety supplies were significantly associated with safety practice at a P-value of <0.05 (Table 8).

The odds of respondents with a positive attitude were 5.4 times more likely to be safe practiced compared to respondents who had a negative attitude toward safety practice (AOR: 5.4; 95% CI: 2.53, 11.47; P=0.05). The odds of waste handlers with good knowledge were 7.21 times safer than those who had poor knowledge (AOR=7.21, 95% CI 3.7–14; P=0.05). The odds of respondents who had availability of safety materials were 9.3 times higher than those who had a shortage of safety materials (AOR=9.3, 95% CI 5, 17.2); p=0.05. The odds of waste handlers with an age category between 31 and 35 years were 81.1% less likely to be safe practitioners than those whose age group was greater than 35 years (AOR=0.189, 95% CI: 0.094, 0.38; P=0.05). The results of the final multiple logistic regression models are found in the Table 8.

Table 8: Result of multiple logistic regression analysis on safety practice among hospital waste handlers in Somali region, Eastern Ethiopia, August, 2021.

Variable

Category Safety practice  COR (95% CI) AOR (95%CI)
Safe

Unsafe

Age in years ≤25yrs

4

52 0.03(0.11-0.098) 0.047(0.014-0.16)*

26-30yrs

25 82 0.13(0.72-0.237)

0.146(0.065-0.33)*

31-35yrs

40

78 0.22(0.13-0.379) 0.189(0.094-0.38)*

>35yrs

84 36 1.00

1.00

Service year ≤5years

55

114 0.66(0.44-0.998) 1.2(0.62-2.34)

>5years

98 134 1.00

1.00

Knowledge Good

116

104 4.3(2.72-6.75) 7.21(3.7-14)**

Poor

37 144 1.00

1.00

Availability of materials Good

125

96 7.1(4.4-11.46) 9.3(5-17.2)**

Poor

28 152 1.00

1.00

Attitude Positive

113

156 1.66 (1.1,2.6) 5.4(2.53-11.47)**

Negative

40 92 1.00

1.00

Discussion

The overall current prevalence of safety practice among hospital waste handlers in this study was 38.2% (95% CI: 33.2, 43.1). The finding was higher as compared with the study done in Shiraz, Iran [31]. This difference might be due to the difference in the study design, setting, and time of the study, as well as the implementation of different reforms by the federal ministry of health at hospitals like infection prevention and patient safety, which were promoting the safety practices of hospital waste handlers.

The prevalence of this study was lower than the prevalence of safety practice among medical waste handlers in Addis Ababa town and with research done in Gonder town among waste collectors, 44.1% (95% CI: 37.3-51) and 45% (95% CI: 40.3-49.4), respectively [26,32]. This difference might be due to the difference in the study setting and time, as well as the implementation of hospital infection prevention protocols. The number of participants with good safety practices reported in the finding was lower than the study done at KwaZulu-Natal (50%) [33]. This difference may be due to the study setting and time. Also, the finding was lower than the findings from Cameroon, in which 100% of the medical waste handlers used all the appropriate protective gear [34]. This difference might be due to the study setting, the difference in knowledge of hospital waste handlers, and the attention given to safety by the governing body. The finding was also lower than the finding from Debra Markos (80%) [35]. This difference may be due to the lower sample size they used.

In principle, all medical waste handlers should properly utilize personal protective equipment during the handling of medical wastes [5]. However, in this study, only 25.9% of medical waste handlers properly utilized personal protective equipment. The result was better than the study done in tertiary care health facilities at Shiraz Iran hospitals, the metropolitan city of Pakistan, and Adis Ababa government hospitals, in which 15%, 22.8%, and 25.2% of waste handlers utilized personal protective equipment properly[26,31,36]. This difference might be due to the implementation of different initiatives by the ministry of health like CASH, infection prevention, and patient safety, as well as an increase in knowledge of hospital-acquired infections among medical waste handlers.

In this study, attitude was shown to be an independent predictor of safety practice among medical waste handlers. The odds of safety practice among waste handlers with a positive attitude were 5.4 (AOR: 5.4; 95% CI: 2.53, 11.47; P=0.05) times higher than those who had a negative attitude. This was slightly higher with the study done in Adisababa [26] which showed that health care waste handlers with favorable attitudes had 4.78 (AOR=4.78, 95% CI 1.64, 13.9) higher safe practices compared to respondents with unfavorable conditions. The difference might be due to the setting in which the study was conducted, the lower sample size they used, and the difference in providing pre-service and in-service supervision to increase their intention for safe medical waste handling.

The odds of safety practice among waste handlers with good knowledge were 7.21 (AOR=7.21, 95% CI 3.7–14; p=0.05) times higher than those who had poor knowledge. This was slightly higher with the study done by DebreMarkos and Adisababa [32,36], which showed that waste handlers with good knowledge practiced safety more than those with poor knowledge. The findings of this study were inconsistent with those of a study done in South India [8]. The difference might be due to the difference in study settings, which were undertaken at a tertiary care hospital, and the sampling techniques they used, which were purposive sampling, which may introduce selection bias, and that the knowledge acquired may not necessarily be translated into practice.

The odds of safety practice among waste handlers with adequate supplies were 9.3 (AOR=9.3, 95% CI 5, 17.2); p=0.05 times higher than those with a lack of supplies. This finding was higher in studies conducted in DebreMarkos and Adisababa [26,37], in which those respondents with adequate supplies had good safety practices. This difference might be due to the attention given by the state health bureau and hospital administration to the fulfillment of the required supplies and inputs. In this study, the age group has shown a significant association with safety practices among medical waste handlers. The odds of waste handlers with an age group between 31 and 35 years were 81.1% (AOR=0.189, 95% CI: 0.094, 0.38; P=0.05) times less likely to be safe practitioners than those whose age group is greater than 35 years. The findings were lower with the study done in Bahardar [38], which showed that respondents in the age group 30-35 years had 4.1 (AOR=4.1, 95% CI: 1.27, 13.4) times more safe practices compared to their counterparts. The difference might be due to the lower sample proportion they used.

Limitation of the Study

The study was conducted only in government hospitals, which do not represent private hospitals. Moreover, since this study was a cross-sectional study, it may not allow for the establishment of a causal link between the factors associated with safety practices.

Conclusion

The result of this study showed that the level of safety practice was low compared to the national and international standards among hospital waste handlers in relation to waste handling and safety, which may increase the chance of getting infected with hospital-acquired infections and occupational infections. So reducing those problems through adequate professional support and supervision should be in place to increase their knowledge about safety precautions, and availing of safety supplies should be implemented to increase adherence to safety practices among hospital waste handlers. This study will also help hospital administrators take appropriate interventions, including providing important PPE, motivating the worker to utilize it properly, and planning to improve the safety practices of medical waste handlers working in public hospitals in the Somali Region.

References

  1. Cointreau S (2018) Occupational and environmental health issues of solid waste management: special emphasis on middle-and lower-income countries. Urban Papers. 2006.
  2. Xiao F. A novel multi-criteria decision making method for assessing health-care waste treatment technologies based on D numbers. Engineering Applications of Artificial Intelligence 71: 216-25.
  3. Prüss-Üstün A, Giroult E, Rushbrook P, Organization WH (2019) Safe management of wastes from health-care activities: World Health Organization;
  4. Cook E, Velis C, Woolridge A, Stapp P, Edmondson S (2020) Medical and healthcare waste generation, storage, treatment and disposal: A systematic review of risks to occupational and public health.
  5. Alemayehu T, Worku A, Assefa N (2016) Medical waste collectors in eastern Ethiopia are exposed to high sharp injury and blood and body fluids contamination. Prev Inf Cntrl 2: 2.
  6. Fatusi A, Moyosola A. Bamidele, Abimbola O. Sowande, Jennifer Pearson (2016) Infection Prevention and Control and Health Care Waste Management for Waste Handlers. Aidsfree Nigeria Training Manual. 46.
  7. Geberemariyam BS, Donka GM, Wordofa B (2018) Assessment of knowledge and practices of healthcare workers towards infection prevention and associated factors in healthcare facilities of West Arsi District, Southeast Ethiopia: a facility-based cross-sectional study. Archives of Public Health 76: 1-11. [crossref]
  8. WHO: . Aide memoire for a national strategy for safe and appropriate use of injections. Department of Blood Safety and ClinicalTechnology. Geneva; 2003.
  9. Heldal KK, Thorn J, Djupesland P, Wouters I, et al. (2013) Upper airway inflammation in waste handlers exposed to bioaerosols. Occup Environ Med 60: 444-450. [crossref]
  10. Yang CY, Chuang HY, Tsai SS, Wu TN, et al. (2011) Adverse health effects among household waste collectors in Taiwan. Environ Res 85: 195-9. [crossref]
  11. Dounias G RG (2016) Prevalence of hepatitis A virus infection among municipal solid-waste workers. Int J Clin Pract 60: 1432-6.
  12. Luksamijarulkul P, Charupoonphol P (2018) Risk behaviours, occupational risk and seroprevalence of hepatitis B and A infections among public cleansing workers of Bangkok Metropolis. Hepat Mon 8: : 35-40. .
  13. Kuusisto S, Rantio T, Priha E, Tuhkanen T (2017) PCB contaminated dust on indoor surfaces – health risks and acceptable surface concentrations in residential and occupational settings. Chemosphere 67: 194-201. [crossref]
  14. PPFM K (2012) Effectiveness of interventions to reduce workload in refuse collectors. Coronel Institute for Occupational and Environmental Health, AmCOGG: Center for Research into Health and Health Care 51: 79-87.
  15. Alamgir H, Cvitkovich Y, Astrakianakis G, Yu S, Yassi A (2008) Needlestick and other potential blood and body fluid exposures among health care workers in British Columbia, Canada. American Journal of Infection Control 2008;36: 12-21. [crossref]
  16. Rachiotis G, Papagiannis D, Markas D, Thanasias E, Dounias G, et al. (2012) Hepatitis B virus infection and waste collection: prevalence, risk factors, and infection pathway. American Journal of Industrial Medicine 55: 650-5. [crossref]
  17. Mote BN, Kadam SB, Kalaskar SK, Thakare BS, Adhav AS, et al. (2016) Occupational and environmental health hazards (physical and mental) among rag-pickers in Mumbai slums: A cross-sectional study. Sci J Pub Health 4: 1-10.
  18. Jayakrishnan T, Jeeja MC, Bhaskar R (2013) Occupational health problems of municipal solid waste management workers in India. Int J Env Health Eng 2(1): 42.
  19. Shiferaw Y, Abebe T, Mihret A (2011) Hepatitis B virus infection among medical waste handlers in Addis Ababa, Ethiopia. BMC Research Notes 4: 1-7. [crossref]
  20. Soliman SM, Ahmed AI (2007) Overview of biomedical waste management in selected Governorates in Egypt: A pilot study. Waste Management 27: 1920-3. [crossref]
  21. Tadesse ML, Kumie A (2014) Healthcare waste generation and management practice in government health centers of Addis Ababa, Ethiopia. BMC Public Health 14: 1-9. [crossref]
  22. Ruoyan G, Huijuan L, Chengchao Z, Jiangjiang H, et al. (2010) Investigation of health care waste management in Binzhou District, China. Waste Manag Res 30: 246-50. [crossref]
  23. Blenkharn J, Odd C (2008) Sharps injuries in healthcare waste handlers. Annals of Occupational Hygiene 52: 281-6. [crossref]
  24. Alamgir H, Cvitkovich Y, Astrakianakis G, Yu S, Yassi A (2008) Needlestick and other potential blood and body fluid exposures among health care workers in British Columbia, Canada. American Journal of Infection Control 36: 12-21. [crossref]
  25. Haylamicheal ID, Yirsaw BD, Zegeye HA (2011) Assessing the management of healthcare waste in Hawassa city, Ethiopia. Waste Manag Res 29: 854-62. [crossref]
  26. Tekle T, Abegaz T, Wondimagne A, Abdo ZA (2021) Safety Practice and Associated Factors Among Waste Handlers in Governmental Hospitals in Addis Ababa, Ethiopia. European Journal of Preventive Medicine 9: 107-13.
  27. Muluken A, Haimanot G, Mesafint M (2014) Healthcare waste management practices among healthcare workers in healthcare facilities of Gondar town, Northwest Ethiopia.
  28. Mesfin A, Worku W, Gizaw Z (2013) Assessment of Health Care Waste Segregation Practice and Associated Factors of Health Care Workers in Gondar University Hospital, North West Ethiopia.
  29. Gulilat K, Tiruneh G (2014) Assessment of knowledge, attitude and practice of health care workers on infection prevention in health institution Bahir Dar city administration. Sci J Public Health 2: 384-3.
  30. Mariam FAaZAA (2018) Medical Waste Handling Practice and Associated Factors among Cleaners in Public Hospitals under Addis Ababa Health Bureau, Addis Ababa, Ethiopia.
  31. Lakbala P, Azar FE, Kamali H (2012) Needlestick and sharps injuries among housekeeping workers in hospitals of Shiraz, Iran. BMC Research Notes 5: 1-5. [crossref]
  32. Mesfin A, Gizaw Z (2013) Assessment of Health Care Waste Segregation Practice and Associated Factors of Health Care Workers in Gondar University Hospital, North West Ethiopia, 2013.
  33. Anozie OB, Lawani LO, Eze JN, Mamah EJ, Onoh RC, et al. (2017) Knowledge, attitude and practice of healthcare managers to medical waste management and occupational safety practices: Findings from Southeast Nigeria. Journal of Clinical and Diagnostic Research: JCDR 11: IC01. [crossref]
  34. Gillian Dzekashu L AJ, Mbacham WF (2016) Medical waste management and disposal practices of health facilities in kumbo east and kumbo west health districts. J Environ Health Sci 2: 1-9.
  35. Deress T, Jemal M, Girma M, Adane K (2019) Knowledge, attitude, and practice of waste handlers about medical waste management in Debre Markos town healthcare facilities, northwest Ethiopia. BMC Research Notes 12: 1-7.
  36. Kumar R, Samrongthong R, Shaikh BT (2013) Knowledge, attitude and practices of health staff regarding infectious waste handling of tertiary care health facilities at metropolitan city of Pakistan. J Ayub Med Coll Abbottabad 25: 109-12. [crossref]
  37. Patwary MA, O’Hare WT, Sarker MH (2011) Assessment of occupational and environmental safety associated with medical waste disposal in developing countries: a qualitative approach. Safety Science 49: 1200-7.
  38. Lulie Walle EA (2017) Safety Practice Among Medical Waste Collectors in souther Ethiopia Journal of Prevention & Infection Control 2: 7