Monthly Archives: April 2024

Experiments in Mind Genomics + Artificial Intelligence: Helping “College Towns” Deal with the Natural Rebelliousness of the Students

DOI: 10.31038/MGSPE.2024431

Abstract

Using a combination of Mind Genomics thinking and artificial intelligence through LLMs (Large Language Models), the paper shows how police officers can understand the different mind-sets of students and others in college towns. The paper shows how to deal with a specific mind-set, INDIFFERENT, in order to encourage law-abiding behavior. The approach is generalizable, easy to use anywhere and anytime, with the ability for the user to incorporate situation-specific information as deemed relevant.

Keywords

Artificial intelligence, Authority, College towns, Mind genomics, Mind-set, Students

Introduction

Police officers in college towns often face unique challenges due to a diminished respect for the local police force. With the presence of a large student population, many young adults may have negative perceptions of law enforcement based on their own experiences or the influence of peers. This lack of respect can lead to conflicts and tensions between students and police officers, making it difficult for law enforcement to effectively serve and protect the community [1-3].

One potential solution to the issue of diminished respect for the local police force in college towns is to prioritize community engagement and outreach. By fostering positive relationships with students, law enforcement can work to build trust and mutual respect. This may involve hosting events, providing educational opportunities, and creating open lines of communication between police officers and the community [4,5].

It is also important to address the influence of leftist agendas on college campuses, which may promote anti-authoritarian attitudes and encourage students to resist or protest against law enforcement. Creating dialogue and promoting understanding between students with diverse backgrounds and beliefs can help bridge the gap between different mind-sets and foster a culture of respect for local authority [6-8].

Additionally, addressing systemic issues such as inequality and discrimination within the criminal justice system can help improve perceptions of law enforcement in college towns. By promoting policies and practices that prioritize fairness and accountability, police officers can work to earn the respect and trust of the community. Ultimately, finding effective strategies to promote respect for local authority among high school and college-aged students requires a multifaceted approach. By addressing societal attitudes, promoting community engagement, and fostering understanding between diverse groups, law enforcement can work to create a safer and more cohesive community for all residents.

Using Mind Genomics Thinking Coupled With AI (LLM, Large Language Models)

Mind Genomics is a new way of looking at how people think and how they make decisions. It helps us understand the different mind-sets of students in a college and high school town. By using Mind Genomics, we can learn more about what makes students think, and how we can better help them succeed. When we do a Mind Genomics analysis of the mind-sets of students in a college and high school town, we can see patterns in how they think about certain things. For example, we might find that high school students are more likely to be motivated by competition, while college students are more interested in collaboration. This information can help us cater our teaching methods to better meet the needs of each group.

The research strategy of Mind Genomics creates a set of messages about a topic, mixes these messages together to create vignettes, presents these vignettes to respondents, survey takers, obtains their ratings, and identifies the contribution to the rating of each messaging using OLS (Ordinary Least Squares) regression. The approach sounds more convoluted than conventional rating scales, but Mind Genomics ends up being far more productive and far less subject to biases. It is impossible to game the Mind Genomics system. The respondents end up evaluating the vignettes, the systematic variations, with disinterest, allowing real feelings to come through in the ratings. The result is far more actionable insights into the way people think and to the way people react [9-12].

Mind Genomics may give us a deeper understanding of the different mind-sets of students in a college and high school town. By analyzing these mind-sets, we can tailor our approaches to teaching and learning to better meet the needs of our students. This can lead to improved academic outcomes and a more positive learning environment for everyone involved. By understanding the different mind-sets of students in a college and high school town, we can create programs and initiatives that address their unique needs. For example, we might offer different types of study materials or extracurricular activities based on what we know about how students think and learn. This can lead to more engaged and successful students overall [13].

Mind Genomics Thinking and Artificial Intelligence

The evolving interaction between Mind Genomics and artificial intelligence (AI) is revolutionizing the way we understand human thinking patterns and behavior. Mind Genomics to identify mind-sets or ways people think about a particular topic, can be enhanced by the use of AI, specifically Large Language Models (LLMs), to provide content and insights. This collaboration allows for a deeper exploration of the nuances and variations in how individuals perceive and process information [14]. Through the use of AI, researchers can specify a topic and have LLMs generate expanded content on that topic based on the identified mind-sets. This capability enables a more comprehensive understanding of the various perspectives and thought processes which exist within a given population. By being able to delve into the intricacies of different mind-sets, researchers can gain valuable insights into how people approach and engage with specific subjects.

One of the key benefits of integrating Mind Genomics with AI is the ability to identify and analyze patterns in human thinking at a scale and speed that were previously unattainable. This advanced technology allows for the exploration of a wide range of mind-sets and thought processes, leading to a more holistic view of human cognition and behavior. By instructing the LLM to expand on topics and explore different mind-sets, researchers can uncover new connections and patterns that may have previously been overlooked.

The ultimate benefit to society when Mind Genomics thinking is linked with generative AI is the potential for greater innovation and understanding in various fields, such as psychology, marketing, and education. By gaining a more in-depth understanding of how people think and approach different topics, researchers can develop more targeted and effective strategies for communication and problem-solving. This advancement could lead to the development of more personalized services and products to better meet the needs and preferences of individuals within a population.

Directing AI (LLM) to Identify Student Mind-Sets in a Town, and How to Deal With Them

The remaining paper is given over to showing how to use Mind Genomics thinking and AI to synthesize mind-sets and to understand what to do in the town, given those synthesized mind-sets. We will focus specifically on one mind-set, the INDIFFERENT mind-set, knowing that what we present here can be done easily for every other mind-set.

Step 1: Write the Prompt (Table 1) and Receive a Preliminary Group of Mind-sets

Table 1 shows the prompt provided to the Mind Genomics program, www.BimiLeap.com. The program allows the user to interact with the LLM (ChatGPT 3.5) in the section called Idea Coach. The prompt in bold letters gives background, requesting the name and nature of each mind-set. The mind-sets themselves are not specified.

The bottom of Table 1 shows 15 mind-sets generated by the LLM in response to the request. The mind-sets are sorted alphabetically, although they did not emerge as such. The Idea Coach is programmed to provide a maximum of 15 options, doing so in the interest of cost and space. It is important to keep in mind that there might be many more mind-sets that LLM could generate.

Table 1: 15 mind-sets generated by the LLM

TAB 1

Step 2: Instruct the LLM to Provide Deeper Information About One Mind-set (INDIFFERENT).

Table 2 shows a more complete prompt requesting six pieces of information about each mind-set. Once again, keep in mind that no mind-sets are specified in Table 2. The LLM will return with different mind-sets. Each mind-set will be dealt with in detail following steps 1-6 in Table 2. In the interest of space, we look only at one of these mind-sets, INDIFFERENT.

Table 2: The prompt to provide six answers to each mind-set. The prompt does not specify the mind-set

tab 2

Table 3 shows the information immediately returned by the LLM for the mind-set INDIFFERENT. The important thing about Table 3 is the completeness of the information provided by the LLM. That is, with virtually no input information whatsoever, the artificial intelligence is able to synthesize a great deal of information about this so-called indifferent mind-set and provide it to us in a way that we can use it. The output is firstly informational, such as name, nature, how it came to develop, and how it thinks about authority, respectfully. Secondly, the output is actionable, first in terms of how to change the mind-set to become more respectful, and then providing slogans to use with this mind-set to get it to respect the police and the local authority.

Table 3: Information immediately returned by the LLM about the INDIFFERENT mind-set

tab 3

Using slogans to emphasize ideas is a smart idea because they are easy to remember and catchy. When a slogan is repeated over and over, it sticks in people’s minds and helps to reinforce the message being communicated. Slogans are special because they are short and to the point, making them easy for people to understand. They can also create a sense of unity and belonging among a group of people who share the same beliefs or ideas. In addition, slogans can be used to motivate and inspire people to take action or make a change. Overall, slogans are a powerful tool for getting a message across and can have a lasting impact on the way people think and act.

Step 3: Receive Deeper Analysis of Results from Each “Iteration,” Using the Summarizer Function Built Into the Mind Genomics Program

Understanding key ideas, themes, and perspectives is important because it helps us make sense of the world around us (see Table 4). When we take the time to explore different ideas and perspectives, we gain a deeper understanding of how things relate to each other and why people think and act the way they do. This type of learning helps us develop critical thinking skills, empathy, and a more open-minded mind-set. One way to think about understanding ideas is like solving a puzzle. Each idea is like a piece of the puzzle and when you put them all together, the bigger picture emerges more clearly. Themes are like the patterns and colors in the puzzle which help tie everything together. Perspectives are like looking at the puzzle from different angles to get a better view of the whole picture. By understanding key ideas, themes, and perspectives, we gain a better appreciation for diversity and different ways of thinking.

Table 4: Summarization of Key Ideas, Themes, and Perspectives

tab 4

When we think about interested audiences versus opposing audiences (Table 5), we can learn different perspectives and ideas about a topic. Interested audiences are people who are already interested in the subject, so they may have more knowledge and positive opinions. Opposing audiences are people who have different views and may disagree with what is being discussed. By considering both, we can get a complete picture of the issue and understand all sides. The benefit to thinking about this is that it helps us see the full picture and make informed decisions.

Table 5: Summarization of Interested Audiences versus Opposing Audiences

tab 5

For the police force in Millersville requesting this information, the benefit is that they can gather a wide range of opinions and ideas about a problem they are facing. By looking at both interested and opposing audiences, they can get a better understanding of the issue and find potential solutions that consider all perspectives. A deeper education into the problem can be achieved by considering opposing points of view because it allows for a more thorough analysis and consideration of different angles. By looking at different opinions, the police force can uncover new insights and strategies for addressing the problem effectively.

Alternative viewpoints provided by the LLM are important because they help us see things from different perspectives (Table 6). Just like how looking at a picture from different angles can give us a better understanding of what it is, listening to different viewpoints can help us understand a topic better. For example, if one person thinks that chocolate is the best flavor of ice cream, but someone else thinks that vanilla is the best, hearing both of their opinions can help us think about what flavor we might like the best. Having different viewpoints can also make our discussions more interesting, because we can learn new things and hear different ideas that we might not have thought of on our own.

Table 6: Summarization of Alternative Viewpoints

tab 6

When trying to figure out what is missing from a topic (Table 7), it is productive to combine critical thinking and generative AI. Start by reviewing the existing data and findings related to the topic at hand. Look for patterns, trends, and common themes that emerge from the data. This will identify gaps or missing pieces of information that may not have been explored or considered in previous research. Additionally, consider the potential implications and applications of the existing findings – are there any unanswered questions or unexplored areas that could provide valuable insights?

Table 7: Summarization of What is Missing

tab 7

Afterwards, use LLM (generative AI) to pose new questions or ideas to further expand the existing knowledge base. Use AI algorithms to analyze the data and identify potential areas of interest that have not been fully explored. This may generate innovative research questions or hypotheses which will drive new discoveries in the field of Mind Genomics and LLM experiments. By combining critical thinking skills with the power of generative AI, it may be possible to uncover hidden insights and overlooked perspectives, leading to a more comprehensive understanding of the topic.

To generate innovative ideas from a topic, it is essential to ask thought-provoking questions which challenge existing assumptions and push boundaries. Questions should be exploratory in nature, aiming to uncover hidden opportunities or unmet needs within the topic. For example, questions could focus on questioning the status quo, exploring unconventional perspectives, and considering the implications of emerging technologies or trends. Through a combination of critical thinking and generative AI tools, it is possible to generate a wide range of questions that spark creative thinking and lead to innovative solutions. In this way, the process of asking and answering questions can serve as a powerful tool for uncovering innovations from a topic (Table 8).

Table 8: Summarization of Innovations

tab 8

Discussion and Conclusions

AI may assist officers in college towns understand how students and “townies” think by analyzing data and identifying trends in behavior. This allows the police and other local authorities to “foresee” issues before they occur and take measures to safeguard the community. The use of artificial intelligence allows police departments in college towns to handle various situations more quickly and effectively. This might make the community safer for everyone, especially children, and allow the police to get along better with the residents.

Using AI to teach courses may help new police officers learn more rapidly by providing compelling training materials and video games. This may educate students about the many circumstances they may encounter at work and how to manage them effectively. In actual situations, the ability of AI to process large quantities of data makes it possible for officers to make better decisions and respond to situations more quickly.

Officers with greater experience may utilize AI to get fresh perspectives by evaluating data and generating predictions. This may help them identify patterns and trends in crime rates and behavior, allowing them to devise more effective approaches to prevent and solve crimes.

The most important thing, however, is the ability of the process described here to “teach” on virtually any topic. The LLM contains a wealth of information. The ability to extract that information through easy to create prompts in the “Idea Coach” feature in the www.BimiLeap.com platform is an educational tool with as many uses as there are situations to deal with, mind-sets to understand.

Acknowledgment

The authors thank our clerical professional, Vanessa Marie B. Arcenas, for continuing help in preparing these manuscripts.

References

  1. Ruddel R, Thomas MO and Way LB (2005) Breaking the chain: Confronting issueless college town disturbances and riots. Journal of Criminal Justice 33(6): 549-560.
  2. Williams LS and Nofziger S (2003) Cops and the college crowd: Young adults and perceptions of police in a college town. Journal of Crime and Justice 26(2): 125-151.
  3. Woldoff RA and Weiss KG (2018) Studentification and disorder in a college town. City & Community 17(1): 259-275.
  4. Cardarelli AP, McDevitt J and Baum K (1998) The rhetoric and reality of community policing in small and medium‐sized cities and towns. Policing: An International Journal of Police Strategies & Management 21(3): 397-415.
  5. Patten R, Alward L, Thomas M and Wada J (2016) The continued marginalization of campus police. Policing: An International Journal of Police Strategies & Management 39(3): 566-583.
  6. Baldwin DL (2021) In the shadow of the ivory tower: How universities are plundering our cities. Bold Type Books.
  7. Kamen S (2020) The People’s Republic of Ann Arbor: The Human Rights Party and College Town Liberalism. Michigan Historical Review 46(2): 31-69.
  8. Marginson S (2011) Higher education and public good. Higher education quarterly 65(4): 411-433.
  9. Gofman A and Moskowitz H (2010) Isomorphic permuted experimental designs and their application in conjoint analysis. Journal of sensory studies 25(1): 127-145.
  10. Moskowitz HR, Gofman A, Beckley J and Ashman H (2006) Founding a new science: Mind genomics. Journal of sensory studies 21(3): 266-307.
  11. Moskowitz HR, Wren J and Papajorgji P (2020) Mind genomics and the law. LAP LAMBERT Academic Publishing.
  12. Porretta S, Gere A, Radványi D and Moskowitz H (2019) Mind Genomics (Conjoint Analysis): The new concept research in the analysis of consumer behaviour and choice. Trends in food science & technology 84: 29-33.
  13. Moskowitz H, Kover A and Papajorgji P (2022) Applying mind genomics to social sciences. IGI Global.
  14. Rane NL, Tawde A, Choudhary SP and Rane J (2023) Contribution and performance of ChatGPT and other Large Language Models (LLM) for scientific and research advancements: a double-edged sword. International Research Journal of Modernization in Engineering Technology and Science 5(10): 875-899.

Enhancing Patient-Centered Care in Leukemia Treatment: Insights Generated by a Mind-Set Framework Co-developed with AI

DOI: 10.31038/CST.2024914

Abstract

Leukemia is a challenging and complex cancer which significantly impacts patients’ lives. Understanding patient perspectives and needs is crucial for providing effective care and support. This study develops a framework for understanding patient mind-sets and their implications for leukemia care with the assistance of AI. Through the identification of five key mind-sets (Proactive, Anxious, Acceptance, Emotional, and Uncertain) and the mapping of the leukemia journey stages, we analyze patient needs and perspectives at each stage. The findings reveal critical points for intervention and support and suggest strategies for tailoring communication and care to patient mind-sets. We also propose a set of sample questions and tools for assessing patient mind-sets in clinical practice. The mind-set framework offers valuable insights for improving patient-provider communication, enhancing psychosocial support, and optimizing treatment adherence and outcomes. This study contributes to the growing body of knowledge on patient-centered leukemia care and provides a foundation for future research and practice. This framework provides a valuable tool for healthcare providers to deliver more personalized, effective patient care and support in leukemia.

Introduction

Leukemia is a life-altering cancer which poses significant physical, emotional, and social challenges for patients. As they navigate the complex journey of diagnosis, treatment, and survivorship, patients may experience a wide range of emotions, uncertainties, and coping strategies. Understanding patient perspectives and needs is essential for providing effective, compassionate, and patient-centered care. The importance of patient-centered care in oncology has been increasingly recognized in recent years. Studies have shown that incorporating patient perspectives and preferences into treatment planning can lead to improved patient satisfaction, treatment adherence, and health outcomes [1,2]. In the context of leukemia, research has highlighted the diverse psychosocial needs of patients and the importance of tailored support throughout the cancer journey [3,4]. The concept of patient mind-sets, or the cognitive and emotional frameworks through which individuals approach their health experiences, has gained attention as a valuable tool for understanding and addressing patient needs. The work of Howard R. Moskowitz, a pioneer in the field of consumer psychology, has demonstrated the power of mind-set segmentation in developing targeted marketing strategies [5]. Moskowitz’s approach involves identifying distinct consumer mind-sets based on their attitudes, beliefs, and preferences, and tailoring product offerings and communication strategies to each segment. While originally developed in the context of consumer behavior, the mind-set segmentation approach has since been applied to various domains, including healthcare [6], and has since been updated to incorporate contributions from AI [7]. Building on this foundation, we developed an AI-assisted methodology to develop a detailed patient mind-set framework for leukemia care. In this study, we aim to develop a framework for understanding patient mind-sets and their implications for leukemia care and support. By identifying key mind-sets, mapping the leukemia journey stages, and proposing tools for assessing patient mind-sets, we seek to provide insights into patient experiences and inform strategies for enhancing care and support throughout the leukemia journey. Our approach draws upon the principles of mind-set segmentation, as well as the growing body of literature on patient-centered care in oncology.

It is important to note that whereas the concept of patient mind-sets offers a valuable lens for understanding patient experiences, it should not be used to stereotype or pigeonhole individuals. Patients may exhibit characteristics of multiple mind-sets, and their perspectives and needs may evolve throughout the cancer journey. The mind-set framework is intended to serve as a guide for tailoring care and support, rather than a rigid classification system. Healthcare providers should use the framework in conjunction with other patient-centered assessment tools and engage in ongoing dialogue with patients to ensure that their individual needs and preferences are met.

Method

Developing the Mind-set Framework

The mind-set framework was developed through an iterative process of conversational prompting and analysis using the Claude.ai Opus language model [8]. Five key mind-sets were identified: Proactive, Anxious, Acceptance, Emotional, and Uncertain. Each mind-set was further elaborated upon, with descriptions of their characteristics, thought processes, and needs.

Mapping the Leukemia Journey Stages

The mapping of the leukemia journey stages was accomplished through the AI-assisted conversation. A comprehensive map of the leukemia journey was developed, including 11 key stages: Initial Diagnosis, Further Testing and Classification, Treatment Planning, Transplant Consideration (if applicable), Induction Therapy, Hospital Discharge, Consolidation Therapy, Maintenance Therapy, Monitoring and Follow-up, Supportive Care, and Survivorship and Long-term Care.

Analyzing Patient Needs and Perspectives

To explore patient needs and perspectives at each stage of the leukemia journey, a series of stage-specific questions was developed through the AI-assisted conversation. The resulting analysis of patient needs and perspectives was synthesized from this AI-generated content, providing a comprehensive profile of the key concerns, emotions, and support needs at each stage of the leukemia journey for each of the five identified mind-sets.

Results

Patient Mind-sets and Their Implications

The analysis revealed five distinct patient mind-sets, each with specific characteristics, needs, and implications for care (Table 1). Mapping these mind-sets to the stages of the leukemia journey provided a framework for understanding patient experiences and tailoring support strategies. The five identified mind-sets (Proactive, Anxious, Acceptance, Emotional, and Uncertain) represent distinct approaches to the leukemia journey, with significant implications for patient needs, preferences, and coping strategies.

Table 1: Patient mindsets and their implications

Mind-Set

Key Characteristics

Implications for Care and Support

Proactive Information-seeking, active decision-making, problem-solving Benefit from detailed explanations, collaborative care planning, and resources for self-management
Anxious Worry, fear, need for reassurance and support Require frequent reassurance, emotional support, and guidance in managing fears and uncertainties
Acceptance Realistic, action-oriented, focus on normalcy Benefit from clear, direct communication and support in maintaining a sense of normalcy
Emotional Strong need for emotional support, validation, coping Require extensive validation, empathy, and resources for coping with the psychological impact of the journey
Uncertain Doubt, indecision, need for clarity and guidance Benefit from guidance, decision support, and help in navigating complex decisions and adapting to changing circumstances

The Proactive mind-set is characterized by a desire for information, active involvement in decision-making, and a focus on problem-solving. Patients with this mind-set may benefit from detailed explanations of their diagnosis and treatment options, collaborative care planning, and resources for self-management. Healthcare providers should engage these patients in shared decision-making and provide them with the tools and information they need to take an active role in their care. In contrast, patients with an Anxious mind-set may struggle with worry, fear, and a need for frequent reassurance and support. These patients require a high level of emotional support and guidance in managing their fears and uncertainties. Healthcare providers should prioritize clear, empathetic communication and connect these patients with resources for mental health support and stress management. The Acceptance mind-set is characterized by a realistic, action-oriented approach to the leukemia journey, with a focus on maintaining a sense of normalcy. Patients with this mind-set may benefit from clear, direct communication about their diagnosis and treatment plan, as well as support in adapting to the challenges of cancer while maintaining their daily routines and activities. Patients with an Emotional mind-set have a strong need for validation, empathy, and emotional support throughout their journey. They may struggle with the psychological impact of cancer and require extensive resources for coping and self-care. Healthcare providers should prioritize empathetic, non-judgmental communication and connect these patients with counseling and support services. Finally, the Uncertain mind-set is characterized by doubt, indecision, and a need for clarity and guidance. Patients with this mind-set may struggle to navigate the complex decisions and challenges of the leukemia journey and may benefit from decision support tools, clear explanations of their options, and ongoing guidance from their healthcare team.

The Leukemia Journey and Patient Experiences

The mapping of the leukemia journey stages reveals key medical and social challenges at each point in the patient experience (Table 2).

Table 2: The Leukemia journey and corresponding patient experiences

Stage

Description

Key Challenges

Support Needs

Initial Diagnosis Receiving the news of a leukemia diagnosis Shock, fear, uncertainty, complex decisions about testing and treatment Emotional support, clear information, guidance in decision-making
Further Testing and Classification Undergoing additional tests to determine the specific type and subtype of leukemia Anxiety about test results, understanding implications of diagnosis Clear explanations of tests and results, emotional support, guidance in understanding diagnosis
Treatment Planning Discussing and deciding on the best course of treatment based on the type of leukemia and individual factors Emotional impact of diagnosis, communication with loved ones, weighing treatment options and side effects Psychosocial support, resources for communication and decision-making, detailed information on treatment options
Transplant Consideration (if applicable) Evaluating the need for and feasibility of a stem cell transplant Complex decision-making, fear and uncertainty about transplant process Detailed information about transplant options and process, emotional support, decision-making tools
Induction Therapy Receiving intensive chemotherapy to achieve remission Intense physical and emotional challenges, managing side effects, maintaining normalcy Support in managing side effects, emotional coping strategies, resources for maintaining a sense of normalcy
Hospital Discharge Transitioning from inpatient to outpatient care Uncertainties, transition to home care, new support needs Guidance in transitioning to home care, resources for managing challenges, ongoing support
Consolidation Therapy Receiving additional chemotherapy to prevent relapse Ongoing management of side effects, emotional coping, lifestyle adjustments Strategies for managing side effects, emotional support, resources for adapting to lifestyle changes
Maintenance Therapy Receiving long-term, low-dose chemotherapy to maintain remission Long-term management of side effects, emotional coping, adapting to a “new normal” Ongoing support for managing side effects and emotional challenges, resources for maintaining quality of life
Monitoring and Follow-up Undergoing regular check-ups and tests to monitor for signs of relapse Fear of recurrence, need for vigilance, redefinition of normalcy Psychosocial support, guidance in managing fear and uncertainty, resources for redefining normalcy
Supportive Care Receiving comprehensive care to address physical, emotional, and practical needs throughout the journey Navigation of complex physical, emotional, and social needs Comprehensive support for physical, emotional, and social needs, coordination of care across multiple providers
Survivorship and Long-term Care Adjusting to life after treatment and managing long-term effects Integration of cancer experience into identity and purpose, ongoing physical and emotional challenges, fear of long-term effects Resources for finding meaning and purpose, ongoing support for physical and emotional well-being, guidance in managing long-term effects of treatment

The leukemia journey is marked by a series of medical and social challenges which evolve over time, from the initial shock and uncertainty of diagnosis to the long-term implications of survivorship. At each stage, patients face a unique set of physical, emotional, and practical concerns which require targeted support and intervention. The AI-discovered stages not only make intuitive sense but resemble stages published in IQVIA’s global patient and carer experience survey (2013), funded by a consortium of three leukemia patient advocacy networks. Table 3 shows that the IQVIA framework covers the same stages in a more summary form [9]. The AI-generated stages map perfectly to the IQVIA stages while offering greater specificity. From a clinical perspective, both maps “work” but the AI-generated stages seem be able to guide the patient experience in a more granular fashion throughout the leukemia journey.

Table 3: Leukemia Stages, IQVIA and Study Stages Mapped

IQVIA Framework

Current Study Stages Developed by AI

Diagnosis Initial Diagnosis; Further Testing and Classification
Watch and wait Treatment Planning (note: primarily for CLL patients)
Treatment Treatment Planning; Transplant Consideration (if applicable); Induction Therapy; Hospital Discharge; Consolidation Therapy; Maintenance Therapy
Ongoing Monitoring Monitoring and Follow-up
Living with Leukemia Survivorship and Long-term Care; Supportive Care

The initial stages of diagnosis and treatment planning are often characterized by intense emotions, complex decision-making, and a need for clear, compassionate communication from the healthcare team. As patients progress through treatment, they may struggle with the physical and emotional toll of therapy, as well as the challenges of maintaining a sense of normalcy in their daily lives. The transition to post-treatment survivorship brings its own set of uncertainties and support needs, as patients grapple with the fear of recurrence, the need for ongoing monitoring, and the task of integrating the cancer experience into their identities and life narratives. Across all stages of the journey, patients require a comprehensive, patient-centered approach to care that addresses their medical, emotional, and social needs. This may include providing clear, understandable information about diagnosis and treatment options, offering psychosocial support and resources for coping, and facilitating communication and decision-making with loved ones and the healthcare team. By understanding the unique challenges and support needs at each stage of the journey, healthcare providers can tailor their interventions and resources to better meet the needs of individual patients and families.

Enhancing Patient Care and Support

The mind-set framework offers valuable insights for enhancing patient care and support throughout the leukemia journey (Table 4).

Table 4: Strategies for Enhancing Patient Care and Support

Mind-Set

Communication Strategies

Support Strategies

Critical Points for Intervention

Proactive Provide detailed explanations, engage in collaborative decision-making, offer resources for self-management Encourage active participation, provide tools for tracking and managing care, connect with peer support and information resources Initial diagnosis, treatment planning, transitioning to survivorship
Anxious Offer frequent reassurance, validate emotions, provide clear and concise information Provide emotional support, connect with mental health resources, offer relaxation and stress-management techniques Initial diagnosis, treatment planning, induction therapy, hospital discharge, monitoring and follow-up
Acceptance Use clear, direct communication, focus on actionable steps and realistic expectations Support in maintaining a sense of normalcy, provide practical resources for managing challenges, encourage a focus on the present Treatment planning, induction therapy, hospital discharge, consolidation and maintenance therapy
Emotional Provide empathy and validation, allow ample time for emotional expression, offer coping strategies Connect with emotional support resources, provide counseling referrals, encourage journaling and other expressive outlets Initial diagnosis, treatment planning, induction therapy, hospital discharge, monitoring and follow-up, supportive care and survivorship
Uncertain Offer guidance and decision support, provide clear information, explore options and alternatives Provide decision-making tools, connect with peer support and information resources, offer ongoing guidance and support Initial diagnosis, treatment planning, transplant consideration, hospital discharge, monitoring and follow-up, supportive care and survivorship

By understanding the unique needs and concerns of each mind-set, healthcare providers can tailor their communication and support strategies to better meet the needs of individual patients. This may involve providing detailed explanations and resources for Proactive patients, offering reassurance and emotional support for Anxious patients, using clear and direct communication for Acceptance patients, providing empathy and coping strategies for Emotional patients, and offering guidance and decision support for Uncertain patients. As patients progress through treatment, their needs may shift depending on their mind-set and the challenges they face. For instance, Anxious patients may require ongoing reassurance and emotional support during induction therapy and hospital discharge, whereas Acceptance patients may benefit from practical resources for managing side effects and maintaining a sense of normalcy during consolidation and maintenance therapy. The framework also highlights the importance of supporting patients during the transition to survivorship, when they may face new challenges related to long-term side effects, emotional adjustment, and redefining their sense of normalcy. Healthcare providers should be attuned to the unique needs of each mind-set during this stage and provide appropriate resources and support, such as counseling referrals for Emotional patients and peer support connections for Uncertain patients. By using the mind-set framework to guide patient care and support strategies at these critical points, healthcare providers can ensure that patients receive the targeted, personalized support they need to navigate the challenges of the leukemia journey and achieve the best possible outcomes. It is important to note that patients’ needs and preferences may evolve over time. Healthcare providers should use the mind-set framework as a starting point for understanding and addressing patient needs but should also remain attuned to the unique experiences and perspectives of each individual. Regular check-ins and ongoing communication with patients can help providers adapt their support strategies as needed and ensure that patients feel heard, understood, and supported throughout their journey. Tools for assessing patient mind-sets at any point in the journey can make valuable contributions to ensuring that care is patient-centered. These tools are presented next in part IV.

Tools to Assess Patient Mind-sets and Communicate Properly

This section provides a set of tools and resources to help clinicians assess and respond to patient mind-sets throughout the leukemia journey. The tools are designed to complement the mind-set framework and journey mapping discussed above, offering practical guidance for tailoring communication and support to the unique needs and perspectives of each patient. Section 1 presents the Patient Mind-Set Questionnaire, a simple tool for identifying a patient’s primary mind-set at the beginning of their leukemia journey. By asking patients to select the statement that most closely aligns with their thoughts and feelings, clinicians can quickly gain insight into the patient’s overall approach to coping with their diagnosis and treatment. The questionnaire is accompanied by a set of instructions for patients and clinicians, as well as a discussion of the potential benefits and limitations of assigning patients to a single primary mind-set (Table 5). Section 2 introduces a stage-specific approach to assessing patient mind-sets throughout the leukemia journey. For each of the 11 stages identified in the journey map, a key question and set of keywords are provided to help clinicians identify the secondary mind-sets that may emerge in response to the unique challenges and priorities of that stage. By listening for these keywords and themes in patient responses, clinicians can gain a more nuanced understanding of each patient’s needs and adapt their communication and support strategies accordingly (Table 6).

Table 5: The Patient Mind-Set Questionnaire (PMQ) to discover the patient’s mind-set

Patient Mind-Set Assessment Questionnaire

Which Statement Do You Most Agree With? (Patient)

Mind-Set Assignment Key (Healthcare Staff)

1.  I try to focus on the present and take things one day at a time. (Acceptance)

Acceptance

2.  I often feel anxious or worried about my leukemia and treatment. (Anxious)

Anxious

3.  I need a lot of emotional support to cope with my leukemia journey. (Emotional)

Emotional

4.  I prefer to be actively involved in my care and treatment decisions. (Proactive)

Proactive

5.  I often feel unsure about my treatment options and what to expect. (Uncertain)

Uncertain

©2024. Stephen D. Rappaport and Howard R. Moskowitz

It is important to note that whereas the tools presented here offer a structured approach to assessing patient mind-sets, they should be used as part of a broader, holistic assessment that takes into account each patient’s unique background, experiences, and goals. In addition to these mind-set-specific tools, clinicians may also benefit from using more general patient-reported outcome measures and quality of life assessments to gain a comprehensive understanding of each patient’s well-being and support needs.

Patient Mind-Set Assessment Questionnaire and Assignment Key

The Patient Mind-Set Questionnaire (PMQ) presented in Table 5 can be used during the initial consultation or early in the patient’s leukemia journey to help clinicians understand their primary mind-set and tailor their communication and support strategies accordingly. The PMQ can be incorporated into EHR systems as a standard component of the patient intake/onboarding process and/or as a tool for assessing the patient’s mind-set as they go through stages of the journey from diagnosis to survivorship. By take a patient’s mind-set “pulse” at various times, healthcare staff can detect mind-set shifts and adjust accordingly to the patient.

Note that during administration of the Questionnaire, the patient sees only the statements. The mind-set assignment is done afterwards, either automatically or manually depending on the mode of administration.

Patient Instructions:

“Please read the following statements carefully and select the one that most closely resembles your thoughts and feelings about your leukemia journey. If you feel that more than one statement applies to you, please choose the one that you identify with the most.”

Doctor Instructions:

“Provide the Patient Mind-Set Questionnaire to your patient during the initial consultation or early in their leukemia journey. Encourage them to read each statement carefully and select the one that most closely aligns with their thoughts and feelings. If a patient expresses difficulty choosing just one statement, guide them to select the one they identify with the most. After the patient has selected their statement, use the Mind-Set Key to assign the mind-set.”

Patient Mind-Set Interview

The Patient Mind-Set Interview (PMI) presented in Table 6 is a second approach to mind-set identification, envisioned to be used in clinical settings with the patient, and as an adjunct tool with the PMQ. Here the medical professional asks an empathic question directly to the patient. The table provides a sample patient response, keywords and non-verbal cues that can assist medical staff with assigning the patient to a mind-set. The PMI can be used at any time throughout the patient’s journey.

Table 6: Mind-set interview assigner with sample patient reply, keywords important to listen for, and non-verbal cues emerging from observation.

Mind-Set

Sample Patient Reply

Keywords to Listen For

Non-verbal Cues

Proactive “I like to research my options, ask questions, and work closely with my healthcare team to develop a plan that feels right for me.” research, options, questions, plan, involved, decide, work together Actively takes notes, asks questions, engages in shared decision-making, maintains eye contact, confident posture
Anxious “To be honest, I often feel quite overwhelmed and worried. I really need a lot of reassurance and support from my healthcare team and loved ones.” overwhelmed, worried, reassurance, support, anxious, afraid, uncertain Fidgets, appears restless, seeks frequent reassurance, tense, furrowed brows, worried expression, shaky voice, on the verge of tears
Acceptance “I try to accept the situation and focus on taking things one day at a time. I trust my healthcare team to guide me through this.” accept, focus, present, day at a time, trust, guide, cope Appears calm, attentive, nods in understanding, makes statements reflecting acceptance or focus on the present, neutral or slightly positive facial expression
Emotional “I experience a wide range of emotions and really need help processing my feelings and finding healthy ways to cope with the challenges.” emotions, help, processing, feelings, cope, challenges, support Cries, expresses strong emotions, seeks physical comfort, expressive, animated facial expressions and hand gestures, difficulty focusing due to emotional state
Uncertain “To be honest, I often feel quite unsure about what to do. I would really appreciate more information and guidance to help me make decisions about my care.” unsure, information, guidance, decisions, options, clarify, explain Appears hesitant, indecisive, frequently asks for clarification, puzzled or contemplative facial expression, processes information slowly, struggles to understand

Question: “As we navigate your leukemia journey together, it would be helpful for me to understand how you typically cope with challenging situations. Could you share with me how you usually respond when faced with difficult news or decisions related to your health?”

Independent of the method used, PMQ or PMI, assigning a patient to their primary mind-set based on the questionnaire can be valuable for clinicians in several ways:

  1. Tailored Communication: Understanding a patient’s primary mind-set allows clinicians to adapt their communication style to best meet the patient’s needs. For example, a proactive patient may appreciate detailed information and a collaborative approach, whereas an anxious patient may benefit from reassurance and clear, concise explanations.
  2. Personalized Support: By identifying a patient’s primary mind-set, clinicians can provide targeted support and resources which align with the patient’s coping style and emotional needs. This may include connecting patients with relevant support groups, offering tailored coping strategies, or providing additional resources for self-management, respectively.
  3. Anticipating Challenges: Knowing a patient’s primary mind-set can help clinicians anticipate potential challenges or barriers to treatment adherence and enable these to be actively addressed. For instance, an uncertain patient may require more guidance and decision-making support, whereas an emotional patient may need additional emotional care throughout their journey.
  4. Building Trust and Rapport: By demonstrating an understanding of a patient’s primary mind-set and adapting the approach accordingly, clinicians can foster a stronger therapeutic alliance and build trust with their patients. This can lead to improved communication, shared decision-making, and better overall patient satisfaction.

Suggestions for Clinical Practice

  1. Incorporate the Patient Mind-Set Assessment Questionnaire into initial patient consultations. The benefits are identified primary mind-sets and tailored communication and support strategies accordingly.
  2. Use the stage-specific Patient Mind-Set Assessment Questions and associated keywords to assess secondary mind-sets throughout the leukemia journey, and adapt care plans as appropriate.
  3. Provide training for healthcare providers on recognizing and responding to different patient mind-sets to enhance patient-centered care and support.
  4. Develop a comprehensive resource library with mind-set-specific support materials, such as coping strategies, educational resources, and referrals to support services.
  5. Integrate the mind-set framework into multidisciplinary care team discussions to ensure a consistent, patient-centered approach across all aspects of leukemia care.

Discussion

Implications of the Mind-set Framework for Leukemia Care

The mind-set framework has significant implications for improving patient-provider communication, shared decision-making, and psychosocial support in leukemia care. By understanding patient mind-sets and their associated needs and preferences, healthcare providers can engage in more effective, patient-centered communication and collaborate with patients to develop personalized care plans. The framework highlights the importance of tailoring communication and support strategies to the unique needs and perspectives of each patient. For example, patients with a Proactive mind-set may benefit from detailed explanations and collaborative decision-making, wherease those with an Anxious mind-set may require frequent reassurance and emotional support. By adapting their approach to the individual patient, healthcare providers can foster a stronger therapeutic alliance, improve patient satisfaction, and optimize treatment adherence and outcomes. The mind-set framework also emphasizes the importance of providing comprehensive, multidisciplinary support throughout the leukemia journey. This includes addressing patients’ medical, emotional, and social needs, and connecting them with appropriate resources and support services. By taking a holistic, patient-centered approach to care, healthcare providers can help patients navigate the complex challenges of the leukemia journey and maintain the best possible quality of life.

Limitations and Future Research Directions

Whereas this study provides a valuable foundation for understanding patient mind-sets and their implications for leukemia care, it is not without limitations. The mind-set framework was developed through a qualitative, AI-assisted analysis of patient experiences and may require further validation through larger, more diverse patient samples. Future research could explore the application of the mind-set framework to other cancer types and chronic illnesses, as well as the development of specific interventions and tools for assessing and addressing patient mind-sets in clinical practice. Another limitation of this study is its reliance on a single AI language model for the generation and analysis of patient perspectives. Whereas the Claude.ai model provided valuable insights and suggestions, it is important to acknowledge that AI-generated content may not fully capture the complexity and nuance of real patient experiences. Future research could incorporate data from patient interviews, focus groups, surveys or experiments to further refine and validate the mind-set framework. Additionally, the mind-set framework presented in this study is intended as a conceptual tool to understand and address patient needs, rather than a prescriptive or exhaustive classification system. Further research is needed to explore the ways in which patient mind-sets may intersect with other factors such as age, gender, cultural background, and socioeconomic status, as well as develop more nuanced and inclusive approaches to patient-centered care. Despite these limitations, the mind-set framework offers a promising avenue for future research and practice in leukemia care and beyond. By providing a structured approach to understanding and addressing patient needs, the framework can inform the development of targeted interventions, resources, and support services which optimize patient experiences and outcomes. Addressing these limitations through further research will strengthen the framework and its practical applications.

Conclusions

This study offers a novel framework to understand patient mind-sets and their implications for leukemia care and support. By identifying five key mind-sets (Proactive, Anxious, Acceptance, Emotional, and Uncertain) and mapping the leukemia journey stages, we provide actionable insights into patient experiences, needs, and preferences throughout the leukemia journey. The mind-set framework suggests strategies to tailor communication, support, and care to the unique needs of each mind-set, and highlights critical points for intervention and support. We also propose a set of sample questions and tools for assessing patient mind-sets in clinical practice which can help healthcare providers better understand and address individual patient needs. These findings have significant implications for improving patient-provider communication, enhancing psychosocial support, and optimizing treatment adherence and outcomes in leukemia care. We call for further study to gauge the value of integrating mind-set-based approaches into leukemia care and envision a future in which all patients receive personalized, compassionate, and effective support throughout their cancer journey.

We close with a suggestion for five future directions:

  1. Validate the mind-set framework through larger, more diverse patient samples and explore its applicability to other cancer types and chronic illnesses.
  2. Develop and test specific interventions and tools for assessing and addressing patient mind-sets in clinical practice, such as mind-set-based communication training programs for healthcare providers.
  3. Investigate the impact of mind-set-tailored care on patient outcomes, including treatment adherence, quality of life, and overall satisfaction with care.
  4. Explore the potential for technology-based solutions, such as mobile apps or web-based platforms, to support the assessment and management of patient mind-sets throughout the leukemia journey.
  5. Conduct longitudinal studies to examine how patient mind-sets may evolve over time and in response to different stages of the leukemia journey and identify factors that contribute to mind-set transitions and adaptations.

References

  1. Epstein RM, Street RL (2011) The Values and Value of Patient-Centered Care. Ann Fam Med 9: 100-103.
  2. Rathert C, Wyrwich MD, Boren SA (2013) Patient-Centered Care and Outcomes: A Systematic Review of the Literature. Medical Care Research and Review 70(4): 351-379.
  3. Albrecht, Tara A, Rosenzweig, Margaret (2012) Management of Cancer-Related Distress in Patients with a Hematologic Malignancy. Journal of Hospice & Palliative Nursing 14(7): p 462-468.
  4. Bryant AL, et al. (2015) Patient-reported symptoms and quality of life in adults with acute leukemia: a systematic review. Oncol Nurs Forum 42(2): E91-E101. [crossref]
  5. Moskowitz HR et. al. (2006) Founding A New Science: Mind Genomics. Journal of Sensory Studies, Volume 21(3): 266-307.
  6. Moskowitz HR, Gofman A. (2007) Selling blue elephants: how to make great products that people want before they even know they want them. Wharton School Publishing.
  7. Moskowitz HR, Rappaport SD, Papajorgi P, Wingert S, and Mulvey T. (2024) ‘Diabesity’ – Using Mind Genomics thinking coupled with AI to synthesize mind-sets and provide direction for changing behavior. AJMCRR 3(3): 1-13.
  8. Anthropic (2024) Meet Claude.
  9. IQVIA (2023) Global Patient and Carer Experience Survey 2021-2022. IQVIA Institute.
fig 1

CE-UV/LIF Analysis of Organic Fluorescent Dyes for Detection of Nanoplastics in Water Quality Testing

DOI: 10.31038/NAMS.2024724

Abstract

Nanoplastics in the environment is rarely monitored due to the current limitation of detection technology and research strategies. Capillary electrophoresis (CE) can be coupled with ultraviolet (UV) and laser-induced fluorescence (LIF) detection for the analysis of fluorescent rhodamine dyes with high sensitivity. These organic dyes interact with polystyrene nanoplastics present in a water sample to undergo adsorption. A decrease of CE-LIF peak height represents a loss of dye concentration due to binding with the nanosphere surfaces. A standard calibration curve has been constructed for CE-LIF analysis of polystyrene nanosphere standard solutions using a rhodamine 6G concentration of 125 µg/mL, background electrolyte solution of 10 mM Na2HPO4 at pH 5.0, electrokinetic sample injection at 18 kV for 6 s, applied voltage of 18 kV across the total capillary length of 68 cm, diode laser operating at 8 V, λex at 480 nm, λem at 580 nm, and avalanche photosensor reverse-biased at 60 V. The fused silica capillary, after being conditioned with the background electrolyte solution for 30 min each day, yields good peak shapes, reproducible peak heights, and only slight variations in migration time. Each CE-analysis is completed within 10 min. Experimental binding data for rhody dye is modelled on the linear Langmuir isotherm equation to determine an adsorption capacity of 27-30 mg/g of nanospheres. The Freundlich isotherm model returns a similar adsorption capacity of 22 mg/g. The detection limit is 0.1 µg of polystyrene nanospheres in 1.6 mL of water sample for CE-LIF analysis.

Keywords

Binding isotherms, Capillary electrophoresis, Laser-induced fluorescence, Nanoplastics, Polystyrene, Rhodamine dyes, UV detection

Introduction

Nanoplastics are a group of synthetic polymer materials on the nanoscale size between 1 and 100 nm. Nanoplastics are primarily produced in laundry wastewater as acrylate, nylon, and polyester fibers [1]. They are normally present as colloids, and so their fate is governed by interfacial properties [2]. Incidentally produced nanoplastics exhibit a diversity of chemical compositions (most commonly polystyrene, polypropylene and polyethylene terephthalate) and physical morphologies that is typically absent from engineered nanomaterials [3]. Such diversity means that it is never straightforward to quantitively analyze water for an assessment of all suspended nanoplastics [4]. The contamination of freshwater lakes and rivers by nanoplastics represents an emerging global issue regarding their potential risk to aquatic life in these important ecosystems and flora, fauna, wildlife, and humans downstream. Pollution associated with nanoplastics can be tackled through source reduction, circular economy, and waste management [5]. Current water treatment processes are ineffective at removing nanoplastics; unlike microplastics, they are too small to be captured by conventional filtration systems. Their small size range enables nanoplastics to easily escape standard water separation and purification techniques [6,7]. The occurrence of microplastics in six major European rivers and their tributaries was investigated and reviewed based on the results from environmental studies that assessed the abundance of microplastics in different water columns [8]. Release of nanoplastics from drinking water bottles was characterized by SEM, XPS, SPES and µ-Raman Analysis [9]. Spherical organic nanoparticles from bottled water were collected effectively through a tangential flow ultrafiltration system [10]. Polyethylene terephthalate nanoplastics collected from commercially bottled drinking water were detected with an average mean size of 88 nm; their concentration was estimated to be 108 particles/mL by nanoparticle tracking analysis [11]. A new study has reported the levels of micro- and nano-particles released in carbonated beverage bottles range from 68 to 4.7×10⁸ particles/L, potentially posing health risks to humans. Polypropylene bottles released more particles than polyethylene terephthalate and polyethylene bottles [12]. The occurrence of micro- and nano-plastics (with particle diameters from 0.7 to 20 μm) in plastic bottled water has been assessed, and the median concentration was 359 ng L−1. Polyethylene was the most detected polymer, while polyethylene terephthalate was found at the highest concentrations [13]. The content of microplastic and nanoplastic particles in raw water, tap water, and drinking water was analyzed. Plastic particles were found in all water samples, with an average abundance ranging from 204 to 336 particles/L in raw water, from 22 to 33 particles/L in tap water, and from 25 to 73 particles/L in drinking water [14]. Pyrolysis gas chromatography–mass spectrometry allows for the simultaneous identification and quantification of nine nanoplastic types, including polyethylene terephthalate, polyethylene, polycarbonate, polypropylene, polymethyl methacrylate, polystyrene, polyvinylchloride, nylon 6, and nylon 66, in environmental and potable water samples based on polymer-specific mass concentration. Limits of quantification ranged from 0.01 to 0.44 µg/L [15]. The lower microplastics abundance in tap water than in natural sources indicates their removal in drinking water treatment plants [16]. This evidence should encourage the consumers to drink tap water instead of bottled water, to limit their exposure to micro- and nano-plastics. More than one hundred studies on microplastics in food, water, and beverages were reviewed by Vitali et al [17].

It is difficult to categorically state the detrimental effects of nanoplastics due to the nascent stage of their characterization in aquatic environments. The toxic effects of nanoplastics on living organisms have systematically been reviewed [18,19], and studied [20]. Potential interactions of nanoplastics with other substances in a complex water matrix could lead to improper quantification. Nanoplastics have been reported to bind with several types of organic contaminants in water environments due to their high surface area-to-volume ratio and the nature of their surfaces. These contaminants include polycyclic aromatic hydrocarbons, polychlorinated biphenyls, pharmaceuticals, heavy metal ions, fly ash, bisphenol A, antibiotics, and ammonium nitrogen. Inadvertent release of additives and contaminants adsorbed on nanoplastics in organism bodies poses more significant threats to living organisms than the nanoplastics themselves. New scientific evidence suggests that nanoplastics can attach to bacteria and viruses. In summary, this interplay of nanoplastics and water contaminants adds another layer of implications to quantitative analysis. In real exposure scenarios, formation of bio- and eco-coronas on nanoplastics is inevitable and displays various complex structures. Complete degradation of nanoplastics dispersed in water and exposed to simulated sunlight takes about a month for polystyrene and 2 years for polyethylene. These findings highlight the pervasiveness of nanoplastic pollution in our environment and underscore the importance of new research into detection methods. Modern instrumental methods for nanoplastics analysis (such as dark-field hyperspectral microscopy, micro-Fourier transform infrared imaging, surface enhanced Raman scattering/imaging, fluorescence microscopy, and atomic force microscopy) demonstrate many drawbacks including analysis time, availability, costs, detection limit, matrix digestion, and sample pretreatment. Although a LOD of 5 ppm was achieved in bottled water, tap water, and river water, single polystyrene nanoplastic particles can be only visualized down to 200 nm on the substrate. The treatment of environmental water samples is a particular challenge, due to their matrix complexity. Reliable techniques are lacking for isolating and pre-concentrating nanoplastics. It is crucial to integrate sample preparation regarding matrix effects into the development of any new instrumental method for nanoplastics analysis [21-39].

One feasible approach to the detection of nanoplastics with a substantial heterogeneity involves the addition of an organic fluorescent dye that interacts with their surfaces. Any binding can be determined, in principle, by a quantitative analysis of the dye before and after interaction with the nanoplastic to obtain a meaningful % binding result. The choice of organic dyes appropriate for binding plays a crucial part in the analysis of nanoparticles and nanoplastics in water. Absorption of ultraviolet (UV) light is a universal detection mode for organic compounds containing one or more aromatic rings. Better analytical sensitivity and selectivity can be expected from dyes that absorb the output wavelength of a laser and emit at a characteristic fluorescence wavelength for laser-induced fluorescence (LIF) detection. Capillary electrophoresis (CE) is an analytical separation technique that relies on the use of a fused silica capillary filled with a background electrolyte (BGE) solution to separate the dye from any interfering organic compounds. The capillary is operating under an applied voltage, in the kV range, between a positive cathode at the inlet and a negative anode at the outlet. Positively charged dyes will migrate rapidly towards the point of detection, being separated from each other due to differences in electrophoretic mobility. Neutral dyes will be transported by the forward electroosmotic flow, as a bundle without separation, through the capillary. Negatively charged dyes will take longer migration times to reach the detection point if their electrophoretic mobility in the reverse direction is not as high as the electroosmotic mobility. High detection selectivity is guaranteed if using fluorescence dyes that can be excited by a 480-nm diode laser. The binding analysis would be reliable if a mixture of organic dyes is employed to test the binding properties of each type of nanoplastic in water under controlled conditions of pH, ionic strength, and modifier.

This work aims at the development of a CE-LIF method for the analysis of dye mixtures, towards the quantitative analysis of nanoplastics without interference by other types of nanoparticles. Rhodamine is well documented in the scientific literature as the basis of chemosensors with colorimetric and fluorometric signals for the rapid detection of various metal ions, organic molecules, and biomolecules [40-43]. This dye becomes strongly emissive with versatile colors (red, orange, or purple), especially when the spirolactam ring is opened by a chelation mechanism. Among different rhodamine moieties, rhodamine B and 6G are very commonly used.

They offer unique optical properties including high photostability, large Stokes shift, and tunable fluorescence with structural derivatization of the side arms.

Materials and Methods

Mesityl oxide (MO), 4-dicyanomethylene-2-methyl-6-(4-dimethylaminostyryl)-4H-pyran (DCM), disodium fluorescein (DF), fluorescein adenosine triphosphate (FATP), rhodamine 6G hydrochloride (R6G·HCl), rhodamine B, and sodium phosphate dibasic (Na2HPO4) were obtained from Millipore Sigma (Oakville, Ontario, Canada). Invitrogen fluorescent dyes, coumarin 503 and coumarin 540A, were sourced from ThermoFisher Scientific (Waltham, Massachusetts, USA). Polystyrene 3080A nanospheres with an average diameter of 81 ± 3 nm were supplied by ThermoFisher Scientific (Fremont, California, USA).

To prepare the 10 mM background electrolyte (BGE) solution, 0.284 g of Na2HPO4 was accurately weighed and dissolved in 150 mL of distilled deionized water (DDW) in a 200 mL conical flask. The solution was stirred continuously until Na2HPO4 fully dissolved. The pH was adjusted to 5.0 by the careful addition (three drops) of concentrated hydrochloric acid (HCl, 37% w/w) using a digital pipette for precision. After each acid increment, the solution was stirred, and the pH was checked and adjusted as necessary. The final volume was brought up to 200 mL with DDW to achieve the intended concentration. The prepared BGE (pH 5.0) was then stored in a clean container and rechecked for pH consistency before use.The CE-UV/LIF setup consisted of an SRI Model 203 chromatography data system box (Las Vegas, USA) acting as both the controller for the high-voltage power supply and a station for converting the detector output voltage into a digital signal, acquired by PeakSimple software. The UV detection employed a Bischoff Lambda 1010 detector (Metrohm Herisau, Switzerland), while the LIF system comprised a 480-nm diode laser paired with a Hamamatsu H7827 series photosensor module (Iwata City, Japan). Rhodamine B and R6G were prepared at a concentration of 5 mg in 2 mL of methanol or distilled water, ensuring effective fluorescence intensity, even in an acidic medium. Samples were introduced by electrokinetic injection at 18 kV for 6 seconds. A fused silica capillary, preconditioned with NaOH, distilled water and BGE for 30 minutes, was used for the CE analysis, which typically ran at 18 kV for 40 minutes. The percentage binding was calculated using the formula: (initial peak height – final peak height)/initial peak height = decrease in peak height/initial peak height​. The LIF detector’s 480-nm laser employed a low applied voltage setting of 4.5 V to remove the polyimide coating within 1 second, creating a 1.0-mm clear window on a new capillary. All standard fluorescence excitation/emission spectra were recorded using a Horiba Fluoromax-4 spectrometer (Burlington, Ontario, Canada). The study of the effect of pH on the percentage binding of rhodamine B dye with polystyrene nanospheres was conducted to optimize sensitivity. The BGE’s pH was adjusted to pH 4.0 or 10.0 using either 12 M HCl or 10 M NaOH, respectively. The capillary was conditioned at each pH for 30 minutes (using 0.1 M NaOH for 10 minutes, distilled water for 10minutes, then the BGE for 10 minutes) prior to use in the CE-LIF analysis. Replicate runs of the CE system at each pH tested the reproducibility of the characteristic migration time of the dye, indicating the capillary’s stable condition.

In the preparation of nanoplastic standards for external calibration, a measured aliquot (1 µL) of a polystyrene nanospheres stock suspension was meticulously diluted using DDW (279 µL) inside a glass vial (2 mL capacity). The dilute nanoplastic suspension was subjected to manual agitation followed by ultrasonication in a water bath (for 2 minutes) to attain homogeneity. Concurrently, for the preparation of a working fluorescent dye solution, R6G dye (0.20 mg) was dissolved in the BGE solution (pH 5.0, 1.6 mL) inside another glass vial, culminating in a concentration of 125 µg/mL after ultrasonication in a water bath (for 2 minutes). Thereafter, the dilute nanoplastic suspension (commencing from 4 µL, increasing in steps of 4 µL, and culminating at 40 µL) was pipetted into the R6G solution (1.6 mL) in a glass vial. After each incremental addition, the mixture was subjected to manual agitation followedby ultrasonication in a water bath (for 2 minutes) to attain homogeneity. Prior to CE-LIF analysis, a baseline noise characterization of the instrumental system was performed. To reaffirm the reproducibility of the measurement results, each mixture was analyzed in triplicate.

Results and Discussion

The dyes that are useful for UV/LIF detection of nanoplastics would have to be unique and not easily found in nature or common industries, which is why R6G, DCM, disodium fluorescein and coumarins were chosen for the present study [44]. The first couple of fluorescent dyes tested were R6G.HCl (50%) and DCM (50%) in a rhody dye mixture. These two dyes were chosen as their fluorescence could be induced by the diode laser output wavelength of 480 nm and their emission could be detected through an optical interference filter with a narrow band-pass centered at 580 nm. R6G has an absorption maximum of 530 nm and an emission maximum of 556 nm due to the xanthene rings [45]. The DCM happens to be a charge-neutral molecule that was useful as a marker to indicate where neutral analyte peak appeared on the CE migration time scale. Although DCM absorbs maximally at 481 nm, it fluoresces the most at an orange wavelength of 644 nm due to the cyanine structure [46]. Conversely, R6G.HCl produces a R6G.H+ cation that was separated from DCM by CE, so no neutral dyes could interfere with its quantitative analysis. Several other dyes were also tested for better analytical sensitivity. They included coumarin 503, coumarin 540A, and disodium fluorescein, which all were capable of being excited by the 480-nm laser light. Disodium fluorescein was expected to emit a strong intensity of fluorescent light in the green portion of the visible spectrum at 531 nm. Although it has a stable xanthene ring structure similar to R6G, fluorescein is negatively charged [47]. Coumarin 540A was expected to be the best dye as its maximum absorption wavelength is 460 nm which matched the laser output wavelength of 480 nm very well [48]. Coumarin 503 was chosen as an alternative that might not be ideal because its maximum emission wavelength is 490 nm but it could still emit fluorescence in the blue-green region beyond 520 nm. This coumarin is a neutral compound due to the lack of charges on its molecules [49]. Both coumarin 503 and coumarin 540A are in a class of fluorescent dyes comprising the coumarin ring, which is an aromatic ring with a cyclic hydrocarbon chain impregnated with an ester and a single double bond.

Two detectors were used in the present CE study; they were a UV detector and an LIF detector as illustrated in Figure 1. The UV detector was reliable and consistent. Following the Beer’s law, UV absorbance was directly proportional to the dye concentration via its molar absorptivity in the wavelength range between 190 nm and 210 nm. Then mesityl oxide (0.1% by volume in methanol) was run to both test the electroosmotic flow (EOF) of BGE solution through the capillary and determine the migration time of all neutral molecules. Using 10 mM Na2HPO4 as the BGE solution at pH 9.4, the CE-UV peak for MO appeared at 4.20±0.03 min. Next, the rhody dye mixture was analyzed and produced a strong CE peak followed by a weak peak with UV detection. With BGE at pH 8.0, CE-UV analysis produced three FATP peaks at 6.01, 16.37 and 24.04 min and one MO peak at 5.60±0.07 min as expected from the use of a less alkaline pH.

fig 1

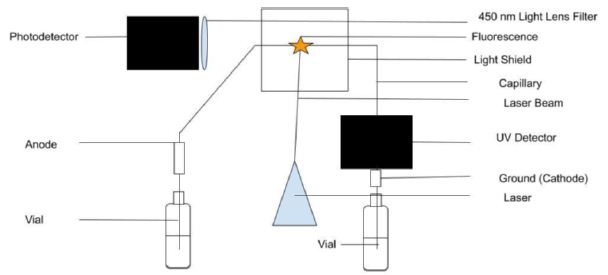
Figure 1: Capillary electrophoresis setup with UV light absorption and laser-induced fluorescence emission detectors. Light shields to stop the laser beam and block room light are not shown for clarity.

The rhody dye mixture was used to analyze an aqueous sample containing polystyrene nanospheres (1.3 mg/mL) by measuring the strong CE-UV peak after each standard addition. The resultant peak height, corrected for a dilution factor and expressed in milli-absorbance units (mAU), was plotted against the spiked volume of rhody dye. As it can be seen in Figure 2(a), depicting the spiking of diluted polystyrene nanospheres with rhodamine dye for CE-UV analysis, revealed that the standard calibration curve demonstrated linearity prior to reaching saturation of the UV detector’s signal output. Most notably, extrapolation of the trend line in Figure 2(b) backwards intersected the x-axis at an intercept value (approximately 0.01 µg/mL), suggesting an initial dye concentration. This detection implies the substantial binding between the dye molecules and the polystyrene nanospheres, causing the apparent dye concentration in solution to diminish. A limitation in utilizing UV detection is the possible interference from uncharacterized components in the water matrix that absorb UV light at the same wavelength of 200 nm. Such components could co-migrate with the rhodamine dye during CE analysis, leading to confounded results. This interference underscores the need for careful control of matrix effects, particularly when assessing trace-level nanoplastic contamination.

fig 2

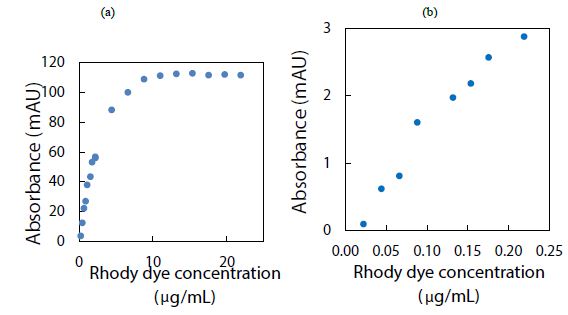
Figure 2: Spiking diluted polystyrene nanospheres with rhody dye for CE-UV analysis: (a) high dye concentrations, and (b) low dye concentrations. BGE solution: 10 mM Na2HPO4 at pH 9.4; UV detection wavelength: 200 nm.

To establish a baseline signal and gauge potential interferences, the intrinsic fluorescence of the dye was first characterized in the absence of polystyrene nanospheres. This control measurement enabled the determination of the dye’s peak height, providing a reference for comparison once polystyrene nanospheres were introduced. By doing so, any changes attributable to the interactions between the dye and the nanoplastics could be accurately quantified. Furthermore, the incorporation of replicate blank samples, devoid of both dye and nanoplastics, facilitated the assessment of background noise and matrix effects on UV detection at 200 nm. These measures ensured that the subsequent analysis of nanoplastic-dye interactions was robust against potential confounding signals.

Alternatively, LIF was potentially more sensitive by about 100 times using an avalanche photosensor to measure the emission intensity. Both detectors determined an unknown concentration of the dye using standard solutions with known concentrations to construct a calibration curve. Disodium fluorescein dissolved fully in water/methanol (10:8 v/v) and produced a CE-LIF peak at the migration time of 4.96±0.48 min. However, DF had a flaw of contaminating the capillary inlet and hence the BGE solution, raising the baseline fluorescence significantly after several runs. Coumarin 503 and coumarin 540A were not fully dissolved in water/methanol (10:8 v/v). Their light blue cyan and green emissions required a different interference filter for optimal LIF detection. Therefore, the rhody dye was better for the CE-LIF setup as they had good solubility, migration times, and peak heights. Using a BGE solution at pH 9.4, the R6G and DCM peaks were observed at 3.53 min and 3.66 min respectively in Figure 3. Adding the LIF detector caused no noticeable harm to the original CE-UV system, requiring only the 480-nm laser beam to create a clear window on the same capillary for LIF detection. The capillary proved itself to be capable of generating repeatable results within the day, separating charged dyes of different characteristic migration times.

fig 3

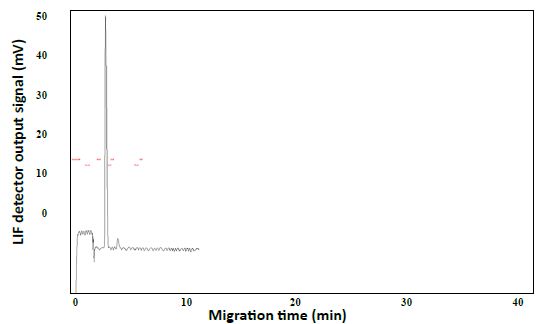
Figure 3: CE-LIF analysis of rhody dye. BGE solution: 10 mM Na2HPO4 at pH 9.4; applied voltage on diode laser: 5.0 V; λex: 480 nm; photosensor reverse bias: 60 V; λ em: 580 nm.

Next, the CE-LIF method was combined with frontal analysis to minimalize experimental errors due to a reduction in the manipulation of samples. Improved reproducibility was evidenced by replicate analysis of the rhody dye at different concentrations to construct the standard calibration curve shown in Figure 4. The electric charges of nanoplastics can significantly impact their physiochemical properties, solubility, electrophoretic mobility, reactivity, and binding interactions with other substances in water [50]. Their charge state depends on a variety of factors like the type of plastic material, the pH of water, and any surface coatings or modifications on the nanoplastics. Certain plastic materials can have intrinsic polarity when immersed in water. For example, polyethylene nanoparticles are generally neutral in charge but become negatively charged above pH 2.5 after surface oxidation [51]. Certain types of nanoplastics acquire a negative charge due to the presence of specific functional groups that ionize in water, e.g., polyacrylic/methacrylic acids (containing -COOH groups), polystyrene sulfonate (containing -SO3H groups), and polyethylene terephthalate (its surface can be converted into -COOH and -OH groups). Negatively charged plastics attract positively charged toxins in the environment, leading to potential health hazards if consumed by local organisms [52]. Other types of plastics have a natural propensity to become positively charged when immersed in water, like poly diallyl dimethyl ammonium chloride (with quaternary ammonium groups), poly-4-vinylpyridine, and polyethyleneimine [53]. The surface of nanoplastics may be coated or modified to create cationic nanoplastics. For example, cationic polystyrene nanoparticles can be produced by incorporating positively charged groups (such as -NH3+) on the surface [54]. Consequently, any changes of ionic charge affect the interaction of nanoplastics with water contaminants.

fig 4

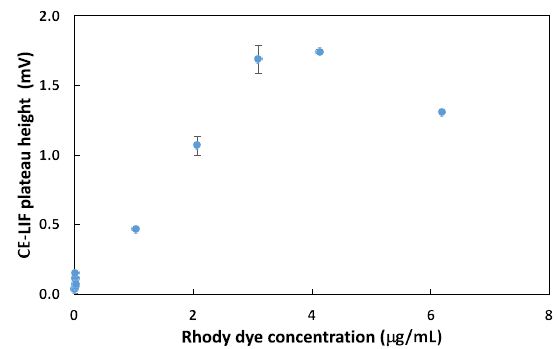
Figure 4: Combination of CE-LIF with frontal analysis to construct a standard calibration curve for rhody dye at different concentrations. BGE solution: 10 mM Na2HPO4 at pH 9.4; applied voltage on diode laser: 5.0 V; λ ex: 480 nm; photosensor reverse bias: 60 V; λ em: 580 nm.

Experimentally, using CE-LIF in the conventional analysis mode, both the % binding and the amount of rhody dye bound with 2.8 mg of polystyrene nanoparticles were determined. As presented in Figure 5(a), nearly 100% quantitative binding onto the nanoparticle surfaces was achieved at the lowest concentrations of rhody dye studied. This adsorption capacity of the nanoplastics was commensurate with their small particle size which has a direct correlation to large surface area, providing more sites for dye adsorption. Conversely, as shown in Figure 5(b), the amount of dye bound seemed to be reaching a saturation level with the highest dye concentrations studied.

fig 5

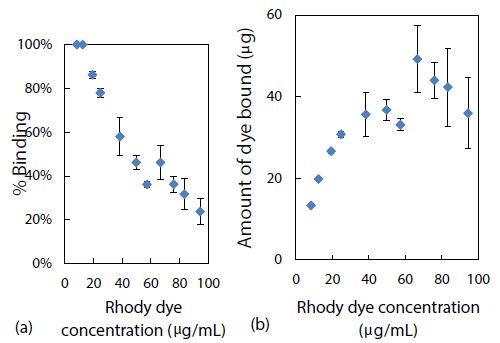
Figure 5: Effect of rhody dye concentration on (a) % binding and (b) amount of dye bound, with 2.8 mg of polystyrene nanospheres.

The Langmuir adsorption model was attempted by fitting the above binding data with this linear isotherm equation Ce/qe = Ce/qmax + 1/KLqmax for ce from 2.7 to 16 mg/mL, as demonstrated in Figure 6(a). The maximum adsorption capacity (qmax) for a saturated surface was determined from the reciprocal of slope to be 30 mg/g of nanospheres, and the half-saturation coefficient or Langmuir equilibrium constant (KL) was then calculated from the y-intercept to be 4.8 mL/mg of rhody dye. The same binding data was next fitted with another isotherm equation 1/qe = 1/qmax + 1/qmaxKLce for cross-checking purposes. As shown in Figure 6(b), qmax was determined from the reciprocal of y-intercept to be 27 mg/g of nanospheres, and KL was calculated from the quotient of intercept and slope to be 2.8 mL/mg. Although the two qmax results were similar within model fitting errors, the two KL results were rather discrepant mainly due to a larger statistical weight being put on the low ce data points that skewed the slope. New results are reporting that the adsorption equilibrium constant of triclosan in a suspension of pristine polystyrene nanoparticles (100 nm) is 2.78 L/g [55]. Ion strength greatly affects the outer sphere complexation due to compression of the double electrical layer on each particle surface. The qmax value of a nanoplastic surface is hypothetically influenced by two crucial factors: chemical composition and nanoporous structures. Clearly, the R-square values of 0.8655 and 0.9171 suggested that the Langmuir adsorption isotherm might not be the best model for the binding of rhody dye on polystyrene nanospheres. The Langmuir model assumes that the adsorbate (rhody dye) molecules bind with a homogeneous surface of the adsorbent (polystyrene nanosphere) to form a monolayer without any interaction between the adsorbed molecules. It implies that the energy of adsorption on a homogeneous surface is independent of surface coverage, which may not be true. The nonlinear curves in Figures 6(a) and 6(b) however indicated that the Langmuir model was far from ideal for describing the binding of rhody dye with polystyrene nanospheres.

fig 6

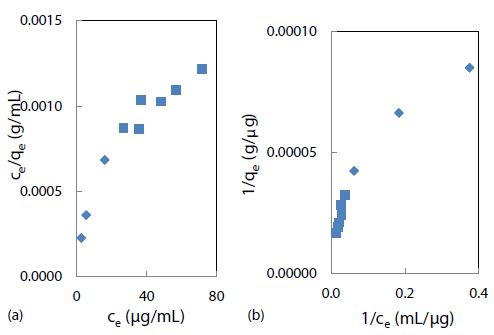
Figure 6: Langmuir isotherm models of rhody dye binding with 2.8 mg of polystyrene nanospheres at room temperature (23 ± 1°C): (a) ce/q= ce/qmax +1/KL + qmax and (b) 1/qe = 1/qmax + 1/qmaxKLce.

The Freundlich adsorption isotherm, qe = Kfce1/n, is another equation widely used for data fitting to model the relationship between the sorbed mass (qe) on a heterogeneous surface per unit weight of adsorbent and the aqueous concentration (ce) at equilibrium [56]. Although the Freundlich equation is purely empirical, it provided important information regarding adsorption of rhody dye on the polystyrene nanospheres. The Freundlich isotherm plot in Figure 7(a) shows linearity from 2.7 up to 40 mg/mL (approximately 50% of maximum saturation), above which it became nonlinear. As shown in Figure 7(b), a linearized plot of log qe = log Kf + 1/n log ce, yielded an equilibrium partition coefficient Kf = 11 mg/g and a Freundlich exponential coefficient n = 2.0 through the y-intercept and slope respectively. Kf is a comparative measure of the adsorption capacity for the adsorbent, and it indicates the Freundlich adsorption capacity. Then qmax was calculated from n times Kf to be 22 mg/g at room temperature (23 ± 1oC). The empirical constant n is related to the heterogeneity of the adsorbent surface [57]. For a favourable adsorption, 0 < n < 1, while n > 1 represents an unfavourable adsorption, and n = 1 indicates a linear adsorption [58]. A larger n value means that the system is more heterogeneous, which usually results in non-linearity of the adsorption isotherm [59]. A Freundlich exponential coefficient (n) in the range from 0.71 to 1.15 is newly reported for the adsorption of triclosan on pristine polystyrene nanoparticles.

fig 7

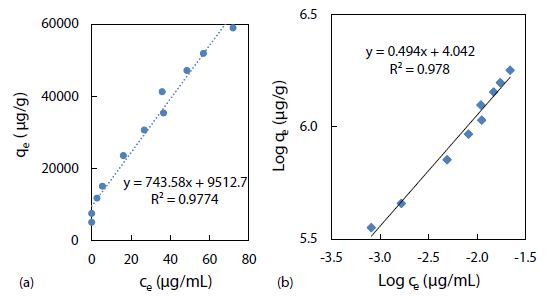
Figure 7: Freundlich isotherm models of rhody dye binding with 2.8 mg of polystyrene nanospheres at room temperature (23 ± 1°C): (a) qe = Kf ce1/n, and (b) log qe = log Kf + 1/n log ce.

The CE-LIF method was combined with electrokinetic sample injection to achieve rapid analysis of rhodamine B dye (migration time = 2.52 ± 0.01 min) at different concentrations to construct the standard calibration curve shown in Figure 8. A linear relationship is evident between the CE-LIF peak height for rhodamine B and the dye concentration up to 500 μg/mL, thanks to the short optical pathlength for laser excitation inside the fused silica capillary with an inner diameter of only 100 μm. Apparently, 400 μg/mL would be an optimal dye concentration of spiking with diluted polystyrene to repeat the CE-LIF analysis. Note that the peak height for each concentration was not maximal because the interference filter transmitted the fluorescence emission light most efficiently at a wavelength of 580 ± 5 nm which was rather different from the maximum emission wavelength of 645-650 nm for rhodamine B (in 10 mM BGE at pH 9.0), as illustrated in Figure 9(a). The same interference filter was a good match for DCM that exhibited a maximum emission wavelength of 550-570 nm in Figure 9(b).

fig 8

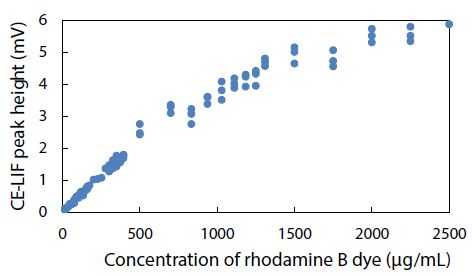
Figure 8: Combination of CE-LIF with electrokinetic sample injection to construct a standard calibration curve for rhodamine B dye at different concentrations. BGE solution: 10 mM Na2HPO4 at pH 9.4; applied voltage on diode laser: 10 V; λ ex: 480 nm; photosensor reverse-bias: 60 V; λ em: 580 nm.

fig 9

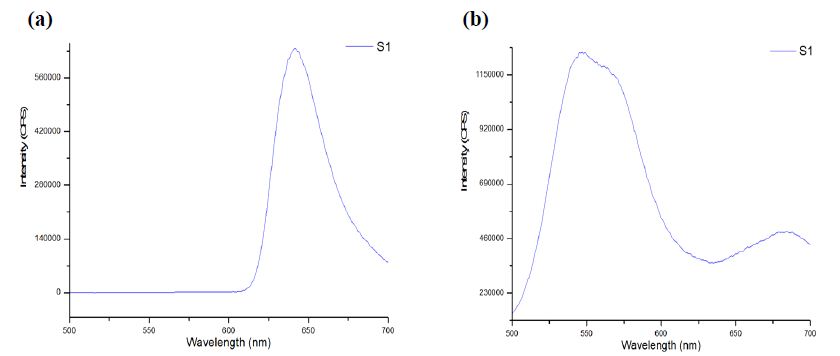
Figure 9: Fluorescence emission spectra obtained using Fluoromax-4 with λ ex of 480 ± 5 nm from (a) rhodamine B dye, and (b) DCM, in 10 mM Na2HPO4 at pH 9.5.

Environmental conditions like pH, salinity, and temperature could influence the degree of dye adsorption onto nanoplastics. The effect of pH on the electrophoretic migration of rhodamine B was studied next. Figure 10 shows the normal trend of a longer migration time with a lower pH, as expected from a decrease in electroosmotic flow of the BGE solution. Note that two data points are presented for pH 6 based on duplicate measurements. The trend also indicated that each pH was ready for CE-LIF analysis after conditioning the capillary for 30 min. Sensitivity of the CE-LIF analysis, in terms of % binding, could be maximized after binding tests were conducted over a range of pH levels to determine an optimal pH based on Figure 11. A high result of 77% was obtained at pH 4.0 for the binding of rhodamine B with polystyrene nanospheres. This effect can be explained by the pKa of 3.2 for rhodamine B; [60] and pH 9.9 for zero charge on polystyrene nanoplastics [61]. As the pH approached 4.0, the zeta potential of nanospheres became stabilized at +50 mV. The effect of pH on the ionization of rhodamine B had previously been reported [62]. There was apparently a stronger interaction between rhodamine B and polystyrene nanospheres at a lower pH. However, pH 5 was a better choice than pH 4 for the CE-LIF determination of nanospheres because the % binding of rhodamine B had a smaller standard deviation and the migration time of 7.7 min was shorter for each sample analysis.

fig 10

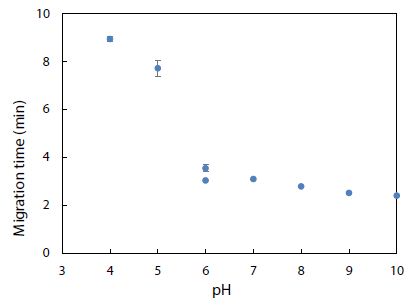
Figure 10: Effect of pH on migration time of rhodamine B dye. Error bars indicate one standard deviation of uncertainty observed at each pH.

fig 11

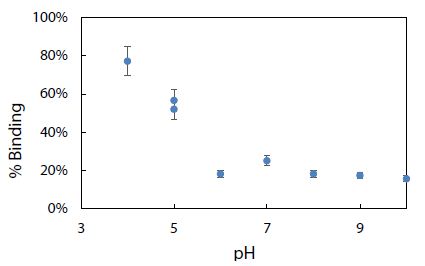
Figure 11: Effect of pH on % binding of rhodamine B dye with 2.8 mg of polystyrene nanospheres.

Using the BGE solution at pH 5 to condition the capillary, rhodamine 6G standard solutions were analyzed by CE-LIF to construct the calibration curve shown in Figure 12. The linear dynamic range can be seen to go from near zero up to approximately 150 mg/mL, in which the rhodamine 6G peak appeared at a migration time of 7.8 ± 0.2 min. This migration time became 7.9 ± 0.4 min when the full concentration range was studied up to 400 mg/mL. Compared to the migration time of 7.7 ± 0.3 min obtained in Figure 10 for rhodamine B at pH 5, these two dyes are too similar in their electrophoretic mobilities (despite their different molecular structures) to be separable by the present CE analysis method. Hence, the need for other fluorescent dyes that can be resolved as distinct peaks (with different migration times) remained.

fig 12

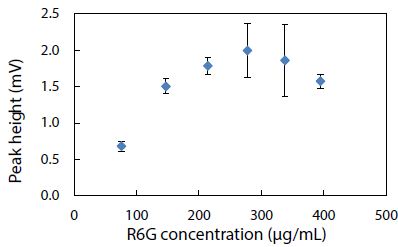
Figure 12: Standard calibration curve for CE-LIF analysis of rhodamine 6G standard solutions. BGE solution: 10 mM Na2HPO4 at pH 5.0; electrokinetic sample injection: 6 s; applied voltage on diode laser: 8 V; λ ex: 480 nm; photosensor reverse bias: 60 V; λ em: 580 nm.

To validate the CE-LIF method, a constant concentration of the fluorescent dye R6G was analyzed across varying quantities of nanospheres in a series of water samples. In Figure 13a, there is a demonstrated positive correlation between the % binding of R6G and the mass of nanospheres ranging from 0.11 to 0.45 µg. This increase in % binding can be attributed to the additional surface area provided by a greater mass of nanospheres, which presents more potential binding sites for R6G molecules. Conversely, as depicted in Figure 13b, incrementing the mass of nanospheres further (from 10 to 350 µg) inversely affects the % binding. This counterintuitive result is interpreted as the onset of nanoparticle aggregation when in high concentration within the 1.6 mL water sample [63]. Aggregation reduces the effective surface area available for R6G binding, since clusters of nanospheres offer fewer exposed binding sites compared to the same mass of dispersed nanoparticles. To ensure the reliability of quantification in samples with high nanoplastic concentrations, such as those from industrial wastewater, it is recommended to perform serial dilutions. This approach ensures that measurements fall within the linear dynamic range, exhibiting a proportional decrease in % binding, thus yielding accurate assessments (as shown in Figure 13a).

fig 13

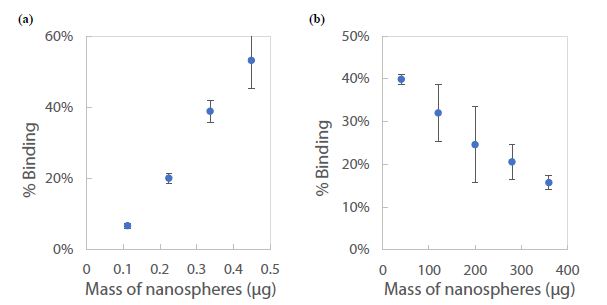
Figure 13: Standard calibration curve for CE-LIF analysis of polystyrene nanospheres in 1.6 mL of water: (a) below 1 µg, and (b) above 10 µg.  Rhodamine 6G dye concentration: 125 µg/mL; BGE solution: 10 mM Na2HPO4 at pH 5.0; electrokinetic sample injection: 6 s; applied voltage on diode laser: 8 V; λ ex: 480 nm; voltage setting on photodetector: 6.0; λem: 580 nm.

The percentage of binding (% binding) has emerged as a valuable parameter for the quantification of nanoplastics in aqueous environments. Organic dyes, owing to their high affinity for diverse types of polymers, can achieve significant levels of binding. This characteristic makes the % binding an appropriate metric for the analysis of environmental water samples, potentially revealing the prevalence and persistence of nanoplastic contaminants. In the context of aquatic ecosystems, % binding can yield insights into the duration that nanoplastics may persist and how readily they interact with organic molecules. Nonetheless, employing % binding as a determinant for nanoplastic content in water analysis comes with inherent constraints. Specifically, there is an underlying assumption that the binding of the fluorescent dye to nanoplastics reaches an equilibrium state, a condition representing a balance between the adsorbed dye on the nanoplastic surface and the dissolved unbound dye in the surrounding medium. The validity of this equilibrium assumption is critical and must be empirically established to ensure accurate quantification. The interaction dynamics between fluorescent dyes and nanoplastics are intricate and carry implications for environmental surveillance and the tracing of pollution sources. To navigate these complexities, systematic research is essential to unravel the nuances of dye-nanoplastic interactions thoroughly. In-depth exploration of these relationships not only contributes to a better understanding of nanoplastic pollution in water bodies such as those in Ontario but also aids in refining the methodologies used to evaluate and safeguard water quality.

Could nanoplastic pollution be monitored by LIF detection without CE separation, or simply conventional spectrofluorimetry using the Fluoromax-4? Such monitoring would be possible if (and only if) all bound dye molecules settled with the nanoplastics to the sample vial bottom or stopped their fluorescence due to quenching by the plastic surface. The fluorescence quenching of organic dyes bound to nanoplastics depends on several factors including the photophysical properties of fluorescent dye, the physicochemical properties of nanoplastics, and environmental conditions of water. Dyes that are sensitive to their immediate environment could undergo photo-induced electron transfer or non-radiative decay mechanisms, leading tofluorescence quenching when bound to nanoplastics. The morphology, size, and surface charge of nanoplastics could modulate the quenching. Nanoplastics with higher surface charge density may enhance quenching. Nevertheless, accurate monitoring was made easy by CE-LIF where any nanoplastics carrying bound dye molecules in the sample suspension would migrate through the capillary at a low mobility and appear as a weak broad peak at a different migration time on the electropherogram. This was the main reason why we coupled CE with LIF to develop an advanced method for the accurate determination of aqueous dye concentration (ce) at binding equilibrium. No worries about any potential errors, due to either fluorescence emission from the bound dye molecules or optical attenuation by the polymer nanoparticles, could be an issue.

Conclusion

As a part of the global water/wastewater sector concerning with environmental regulations and standards, rigorous quantification and understanding of contaminants in water are critical. The present work demonstrates how a LIF detector can be built onto a pre-existing CE-UV instrument for the sensitive determination of nanoplastics via their selective binding with organic dyes. The LIF detector can readily be placed anywhere along the length of the capillary, together with a diode laser, interference filter, and avalanche photosensor, without damaging the CE instrument. The original UV detector allows versatile analysis of many aromatic compounds including dyes while the additional LIF detector offers selective analysis of fluorescent dyes without any potential interference by organic compounds of low molecular weight that are commonly found in the aquatic environment. The CE-UV/LIF method has shown a potential to analyze real-world water samples for their nanoplastic content. It is a relatively inexpensive method for water analysis in quality control, public health, and environmental research purposes. For further development in industrial applications, the LIF detector assembly could be miniaturized for use as a retrofittable module to equip any CE-UV instrument that is commonly available in commercial research labs. This CE-based method could be further validated by high-performance liquid chromatography with UV or fluorescence detection, which is commonly accessible, for the versatile monitoring and control of water quality. We envision a future method wherein multiple fluorescent dyes could be used to detect different nanoplastic materials in water. Our studies will focus on developing efficient sample pretreatment techniques for the detection of nanoplastics in various water matrices. Sample treatment by ultrasonic homogenization can prevent aggregation/agglomeration of nanoplastics, prior to water analysis for free/residual dyes by the CE-LIF method. The interaction of nanoplastics with different water constituents requires careful exploration. Chemical methods that control and adjust the surface charge of nanoplastics to achieve better binding with fluorescent dyes would be beneficial. These new binding affinity results would provide a large dataset (dye structures, nanoplastics, matrix interferences) to facilitate water treatment quality control and management. Along with artificial intelligence-machine learning (AI-ML), fluorescent dye-based chemosensors will be better designed for future applications of CE-UV/LIF as one of the next-generation sensing technologies. Nanoplastics in lake/ground/well/tap water samples will be analyzed after sedimentation sorting, microfluidic binding with molecular dyes, CE separation, LIF detection, and barcode chemoinformatics.

Acknowledgement

We would like to thank Olay Chen for his tremendous help with the repair of a data acquisition system.

Data Availability Statement

All data generated or analyzed during this study, as presented in this published article, will be made available to any readers upon request from the corresponding author.

Disclosure Statement

No potential conflict of interest was reported by the authors.

Funding

Financial support from NSERC Canada (grant number RGPIN-2018-05320) is gratefully acknowledged.

References

  1. Lai H, Liu X, Qu M (2022) Nanoplastics and human health: hazard identification and biointerface. Nanomaterials (Basel) 12(8): 1298. [crossref]
  2. Reynaud S, Aynard A, Grassl B, Gigault J (2022) Nanoplastics: From model materials to colloidal fate. Current Opinion in Colloid & Interface Science 57, 101528.
  3. Gigault J, El Hadri H, Nguyen B, Grassl B, Rowenczyk L, et al. (2021) Nanoplastics are neither microplastics nor engineered nanoparticles. Nature Nanotechnology 16, 501-507 (2021). [crossref]
  4. Wang J, Zhao X, Wu A, Tang Z, Niu L, et al. (2021) Aggregation and stability of sulfate-modified polystyrene nanoplastics in synthetic and natural waters. Environmental Pollution 268(A), 114240. [crossref]
  5. Sarkar B, et al. (2022) Challenges and opportunities in sustainable management of microplastics and nanoplastics in the environment. Environmental Research 207, 112179. [crossref]
  6. Gigault, J, et al. (2018) Current opinion: what is a nanoplastic? Environmental Pollution 235, 1030-1034. [crossref]
  7. Murray A, et al. (2020) Removal effectiveness of nanoplastics with separation processes used for water and wastewater treatment. Water 12(3), 635.
  8. Gao S, Orlowski N, Bopf FK, Breuer L (2024) A review on microplastics in major European rivers. WIREs Water e1713.
  9. Winkler A, Fumagalli F, Cella C, Gilliland D, et al. (2022) Detection and formation mechanisms of secondary nanoplastic released from drinking water bottles. Water Research 222, 118848. [crossref]
  10. Huang Y, Wong KK, Li W, Zhao H, Wang T, et al. (2022) Characteristics of nano-plastics in bottled drinking water. Journal of Hazardous Materials 424(C), 127404. [crossref]
  11. Zhang J, Peng M, Lian E, Lu X, Asimakopoulos AG, et al. (2023) Identification of polyethylene terephthalate nanoplastics in commercially bottled drinking water using surface-enhanced Raman spectroscopy. Environmental Science & Technology 57, 22, 8365-8372. [crossref]
  12. Chen Y, Xu H, Luo Y, Ding Y, Huang J, et al. (2023) Plastic bottles for chilled carbonated beverages as a source of microplastics and nanoplastics. Water Research 242, 120243. [crossref]
  13. Vega-Herrera A, Garcia-Torné M, Borrell-Diaz X, Abad E, et al. (2023) Exposure to micro(nano)plastics polymers in water stored in single-use plastic bottles. Chemosphere 343, 140106. [crossref]
  14. Wibuloutai J, Thongkum W, Khiewkhern S, Thunyasirinon C, Prathumchai N (2023) Microplastics and nanoplastics contamination in raw and treated water. Water Supply 23(6), 2267-282.
  15. Okoffo ED, Thomas KV (2024) Quantitative analysis of nanoplastics in environmental and potable waters by pyrolysis-gas chromatography-mass spectrometry. Journal of Hazardous Materials 464, 133013. [crossref]
  16. Gambino I, Bagordo F, Grassi T, Panico A, De Donno A (2022) Occurrence of microplastics in tap and bottled water: current knowledge. International Journal of Environmental Research Public Health 19(9), 5283. [crossref]
  17. Vitali C, Peters RJB, Janssen HG, Nielen MWF (2023) Microplastics and nanoplastics in food, water, and beverages: part I. occurrence. TrAC Trends in Analytical Chemistry 159, 116670.
  18. Shen M, Zhang Y, Zhu Y, Song B, et al. (2019) Recent advances in toxicological research of nanoplastics in the environment: A review. Environmental Pollution 252(A), 511-521. [crossref]
  19. Paul MB, Stock V, Cara-Carmona J, Lisicki E, Shopova S, et al. (2020) Micro- and nanoplastics – current state of knowledge with the focus on oral uptake and toxicity. Nanoscale Advances 2, 4350-4367.
  20. Saavedra J, Stoll S, Slaveykova VI (2019) Influence of nanoplastic surface charge on eco-corona formation, aggregation and toxicity to freshwater zooplankton. Environmental Pollution 252(A), 715-722. [crossref]
  21. Trevisan R, et al. (2022) Nanoplastics in aquatic environments: impacts on aquatic species and interactions with environmental factors and pollutants. Toxics 10(6), 326. [crossref]
  22. Feng H, Liu Y, Xu Y, Li S, Liu X, et al. (2022) Benzo[a]pyrene and heavy metal ion adsorption on nanoplastics regulated by humic acid: cooperation/competition mechanisms revealed by molecular dynamics simulations. Journal of Hazardous Materials 424(B), 127431. [crossref]
  23. Hu S, Mo Y, Luo W, Xiao Z, Jin C, et al. (2022) Aqueous aggregation and deposition kinetics of fresh and carboxyl-modified nanoplastics in the presence of divalent heavy metals. Water Research 222, 118877. [crossref]
  24. Zhao H, Huang X, Wang L, Zhao X, Yan F, et al. (2022) Removal of polystyrene nanoplastics from aqueous solutions using a novel magnetic material: adsorbability, mechanism, and reusability. Chemical Engineering Journal 430(4), 133122.
  25. Cortés-Arriagada D (2021) Elucidating the co-transport of bisphenol A with polyethylene terephthalate nanoplastics: a theoretical study of the adsorption mechanism. Environmental Pollution 270, 116192. [crossref]
  26. Magrì D, Veronesi M, Sánchez-Moreno P, Tolardo V, Bandiera T, et al. (2021) PET nanoplastics interactions with water contaminants and their impact on human cells. Environmental Pollution 271, 116262. [crossref]
  27. Zhao H, Huang X, Yang Y, Wang L, Zhao X, et al. (2023) The role of available nitrogen in the adsorption of polystyrene nanoplastics on magnetic materials. Water Research 229, 119481. [crossref]
  28. Zając M, et al. (2023) Exposure to polystyrene nanoparticles leads to changes in the zeta potential of bacterial cells. Scientific Reports 13, 9552. [crossref]
  29. Cao J, et al. (2022) Coronas of micro/nano plastics: a key determinant in their risk assessments. Particle & Fibre Toxicology 19(1), 1-25. [crossref]
  30. Balakrishnan G, et al. (2023) Fate of polystyrene and polyethylene nanoplastics exposed to UV in water. Environmental Science: Nano 10, 2448-2458.
  31. Fakhrullin R, et al. (2021) Dark-field/hyperspectral microscopy for detecting nanoscale particles in environmental nanotoxicology research. Science of The Total Environment 772, 145478. [crossref]
  32. Hufnagl B, et al. (2022) Computer-assisted analysis of microplastics in environmental samples based on μFTIR imaging in combination with machine learning. Environmental Science & Technology Letters 9(1), 90-95. [crossref]
  33. Schiavi S, et al. (2023) Plasmonic nanomaterials for micro- and nanoplastics detection. Applied Sciences 13, 9291.
  34. Shorny A, Steiner F, Hörner H, Skoff SM (2023) Imaging and identification of single nanoplastic particles and agglomerates. Scientific Reports 13, 10275.
  35. Alink JWM (2023) Quantification of nanoplastics in a baby bottle and a reusable water bottle by fluorescence microscopy and atomic force microscopy. University of Trent student thesis, 97123.
  36. Fang C, et al. (2023) Microplastics and nanoplastics analysis: options, imaging, advancements and challenges. Trends in Analytical Chemistry 166, 117158.
  37. Chang L, Jiang S, Luo J, Zhang J, Liu X, et al. (2022) Nanowell-enhanced Raman spectroscopy enables the visualization and quantification of nanoplastics in the environment. Environmental Science: Nano 9, 542-553.
  38. Vitali C, et al. (2023) Microplastics and nanoplastics in food, water, and beverages: part I. occurrence. Trends in Analytical Chemistry 159, 116670.
  39. Tornero Q, et al. (2023 Chapter 4 – Methods of sampling and sample preparation for detection of microplastics and nanoplastics in the environment. Current Developments in Biotechnology and Bioengineering Elsevier, 79-97.
  40. DK Iyer, A Shaji, SP Singh, A Tripathi, A Hazra, et al. (2023) A review on rhodamine probes for metal ion recognition with a future on artificial intelligence and machine learning. Coordination Chemistry Reviews 495, 215371.
  41. S Sarkar, A Chatterjee, K Biswas (2023) A recent update on rhodamine dye-based sensor molecules: a review. Critical Reviews in Analytical Chemistry. [crossref]
  42. Sano T, Losakul R, Schmidt H (2023) Dual optofluidic distributed feedback dye lasers for multiplexed biosensing applications. Scientific Reports 13, 16824.
  43. Wang Y, Wang X, Ma W, Lu R, et al. (2022) Recent developments in rhodamine-based chemosensors: a review of the years 2018-2022. Chemosensors, 10, 399.
  44. Duarte FJ, Costela A (2013) Dye Lasers. In Encyclopedia of Modern Optics, 2nd edition; Elsevier, 2018.
  45. Rhodamine 6G (2013) Exciton. Luxottica.
  46. 4-(Dicyanomethylene)-2-methyl-6-(4-dimethylaminostyryl)-4H-pyran. Exciton. Luxottica, 2013.
  47. https://exciton.luxottica.com/laser-dyes.html (accessed November 11, 2023).
  48. Disodium Fluorescein. Exciton. Luxottica, 2013. https://exciton.luxottica.com/laser-dyes.html (accessed November 11, 2023).
  49. Coumarin 540A. Exciton. Luxottica, 2013. https://exciton.luxottica.com/laser-dyes.html (accessed November 11, 2023).
  50. Coumarin 503. Exciton. Luxottica, 2013. https://exciton.luxottica.com/laser-dyes.html (accessed November 11, 2023).
  51. Ali I, et al. (2022) Interaction of microplastics and nanoplastics with natural organic matter (NOM) and the impact of NOM on the sorption behavior of anthropogenic contaminants – a critical review. Journal of Cleaner Production 376, 134314.
  52. Ioannidis I, et al. (2023) Microplastics and disposable face masks as trojan horse for radionuclides pollution in water bodies – a review with emphasis on the involved interactions. Sustainable Chemistry for the Environment 1, 100005.
  53. Yang Z, et al. (2023) Micro- and nanoplastics and their potential toxicological outcomes: state of science, knowledge gaps and research needs. NanoImpact 32, 100481. [crossref]
  54. Qiao J, et al. (2012) Synthesis and properties of chemically cross-linked poly(vinyl alcohol)- PAAm-co-DADMAC for anion-exchange membranes. Solid State Ionics 214, 6-12.
  55. Feng LJ, et al. (2023) Short-term exposure to positively charged polystyrene nanoparticles causes oxidative stress and membrane destruction in cyanobacteria. Environmental Science: Nano.
  56. Chen C, Sun C, Wang B, Zhang Z, Yu G (2024) Adsorption behavior of triclosan on polystyrene nanoplastics: The roles of particle size, surface functionalization, and environmental factors. Science of The Total Environment 906, 167430.
  57. DeMessie JA, Sorial GA, Sahle-Demessie E (2022) Chapter 9 – Removing chromium (VI) from contaminated water using a nano-chitosan-coated diatomaceous earth. Separations of Water Pollutants with Nanotechnology 15, 163-176.
  58. Chiban M, Soudani A, Sinan F, Persin M (2011) Single, binary and multi-component adsorption of some anions and heavy metals on environmentally friendly Carpobrotus edulis plant. Colloids and Surfaces B: Biointerfaces 82(2), 267-276. [crossref]
  59. Babayemi AK, Onukwuli OD (2017) Equilibrium studies and optimization of phosphate adsorption from synthetic effluent using acid modified bio-sorbent. American Journal of Engineering and Applied Sciences 10 (4): 980-991.
  60. Lesmana SO, Febriana N, Soetaredjo FE, Sunarso J, Ismadji S (2009) Studies on potential applications of biomass for the separation of heavy metals from water and wastewater. Biochemical Engineering Journal 44(1), 19-41.
  61. Mchedlov-Petrossyan NO, Kukhtik VI, Alekseeva VI (1994) Ionization and tautomerism of fluorescein, rhodamine B, N,N-diethylrhodol and related dyes in mixed and nonaqueous solvents. Dyes and Pigments 24(1), 11-35.
  62. Ramirez L, Ramseier Gentile S, Zimmermann S, Stoll S (2019) Behavior of TiO2 and CeO2 nanoparticles and polystyrene nanoplastics in bottled mineral, drinking and Lake Geneva waters: Impact of water hardness and natural organic matter on nanoparticle surface properties and aggregation. Water 11, 721. [crossref]
  63. Al-Kandari H, Kasák P, Mohamed A, Al-Kandari S, Chorvat D, et al. (2018) Toward an accurate spectrophotometric evaluation of the efficiencies of photocatalysts in processes involving their separation using nylon membranes. Catalysts 8, 57.

Glucagon-like Peptide 1 Receptor Agonists, Heart Failure, and Critical Appraisal: How the STEP-HFpEF Trial Unmasks the Need for Improved Reporting of Blinding

DOI: 10.31038/EDMJ.2024813


The history of medical science demonstrates the effects of randomness where chance unmasks nature’s secrets. Penicillin’s accidental discovery of a contaminated Petri dish led to a new paradigm in the landscape of illness where the primary cause of human mortality was no longer infectious diseases but rather chronic, non-communicable disease, namely cardiovascular disease (CVD) [1]. Diabetes mellitus is an independent risk factor associated with a 2-to-4-fold increase in CVD-related mortality, and thus researchers have sought to identify new efficacious treatments [2,3]. One potential modality was identified in the 1980s as a mediator of glucagon-like effects: increased insulin secretion in a glucose-dependent manner while simultaneously blocking gastric acid secretion and motility [4]. It was named glucagon-like peptide 1 (GLP1) and synthetic forms of receptor agonists (GLP1RA) were later studied in clinical trials for the treatment of diabetes mellitus type 2. Despite numerous FDA approvals for this class of drugs due to their impact on blood glucose control, the promise around GLP1RAs seems somewhat analogous to penicillin: a chance finding of improved CVD outcomes and weight loss for patients with obesity who were treated, first with diabetes but then even those without a diabetes diagnosis [5,6]. Beyond the excitement surrounding these drugs and their impact on patient outcomes for CVD, there also exists significant market pressure from the financial sector with a projected $1 trillion in revenue globally over the next 30 years related to GLP1Ras [7]. In such a climate, the voice of clinicians can help ensure new treatments are adopted through the lens of the quintuple aim of healthcare [8]. This is to ensure implementation occurs with the greatest fidelity equitably and could optimally function within the infrastructure of a healthcare system with limited resources. However, barriers in the standard reporting of data related more broadly to blinded randomized controlled trials (RCTs) impede clinicians’ ability to complete the appraisal process. The 2023 RCT titled STEP-HFpEF (Effect of Semaglutide 2.4 mg Once Weekly on Function and Symptoms in Subjects with Obesity-related Heart Failure with Preserved Ejection Fraction) demonstrated the possible benefit of GLP1RA in heart failure. The trial was funded by the manufacturer of the study drug, and included adults with a left ventricular ejection fraction greater than 45%, and a body mass index greater than 30 kg/m2. It assessed a primary two-part endpoint of both numeric change in subjective scoring of the Kansas City Cardiomyopathy Questionnaire (KCCQ) score plus a percentage change in body weight over a 12-month time frame. The KCCQ is a validated questionnaire that assesses subjective data related to a patient’s symptoms with scores ranging from 0 to 100. Results showed those treated with semaglutide had an average decrease in KCCQ of 7.8 (16.7 with semaglutide versus 8.7) and a 10% decrease in body weight loss (13.3% versus 2.6%). The authors concluded the use of GLP1RA improved heart failure symptoms in the heart failure population though it had limitations given a small proportion of enrollees were of non-white ethnicity which such that it could limit the external validity of the results. However, STEP-HFpEF offers a key lesson related to the application of critical appraisal that clinicians and researchers alike can glean when first evaluating the internal validity of a trial. Clinicians must assess for the preservation of blinding in RCTs where this is performed. Unmasking, where the blinding process fails to be implemented appropriately for either patients or care staff, could compromise a study’s results via the entry of ascertainment bias [9,10]. In response to a letter to the editor for the STEP-HFpEF trial, the authors said, “38% of the responding placebo recipients believed they had received semaglutide” [11]. Worded another way, it is inferred that 62% of respondents guessed correctly in the placebo group. Unfortunately, no data was provided for the semaglutide arm. With such a large proportion of patients identifying their assigned arm, it may be reasonable to question whether the behaviors and expectations of participants were compromised. Did a similar percentage of participants in the treatment arm guess correctly given their achieved weight loss, and thus had a higher subjective rating in the KCCQ questionnaire? A conservative goal should be for less than 20% of participants to identify their assignment where the blinding process is preserved correctly. Given that possibly more than three times that threshold guessed correctly, even despite differences in secondary endpoints of the trial, clinicians would be wise to think critically about adding this study as evidence to expand the use GLP1RAs for the indication of heart failure.

Though blinding is essential to the internal validity of a trial, STEP-HFpEF reveals a shortcoming of the status quo regarding information dissemination within the research community for blinded RCTs. The manuscript and supplement do not report data or blinding indices related to the evaluation of the blinding process despite the investigators having at least assessed for this in the placebo group based on their response. For greater transparency, publishers of blinded RCTs would benefit from making the assessment and reporting of blinding in both intervention and control arms a standard practice. In fairness to the authors, since it is not standard to have such data provided as part of the peer-review process, it is reasonable to have foregone this step at present. However, my question is, “should we though?”. Adding such reporting is imperative given the potential of ascertainment bias to inaccurately inflate efficacy outcomes, Objective demonstration of a trial’s internal validity will more readily ensure high-value practices are appropriately adopted [12]. Going forward, let us be thoughtful and transparent in the assessment of efficacy for new practices, ensuring the innovations of today achieve their desired outcome tomorrow in improving human health based on sound evidence versus adopting low-value practices based on noise. When nature reveals its secrets at random, the onus is on us to determine how best to apply that new knowledge.

References

  1. Maeda H (2018) The Rise of the Current Mortality Pattern of the United States, 1890-1930. Am J Epidemiol 187(4): 639-46. [crossref]
  2. Raghavan S, Vassy JL, Ho Y-L, et al. (2019) Diabetes Mellitus-Related All-Cause and Cardiovascular Mortality in a National Cohort of Adults. J Am Heart Assoc 8(4): e011295. [crossref]
  3. Skyler JS, Bergenstal R, Bonow RO, et al. (2009) Intensive glycemic control and the prevention of cardiovascular events: implications of the ACCORD, ADVANCE, and VA diabetes trials: a position statement of the American Diabetes Association and a scientific statement of the American College of Cardiology Foundation and the American Heart Association. Diabetes Care 32(1): 187-92. [crossref]
  4. Holst JJ (2007) The physiology of glucagon-like peptide 1. Physiol Rev 87(4): 1409-39.
  5. Leite AR, Angélico-Gonçalves A, Vasques-Nóvoa F, et al. (2022) Effect of glucagon-like peptide-1 receptor agonists on cardiovascular events in overweight or obese adults without diabetes: A meta-analysis of placebo-controlled randomized trials. Diabetes Obes Metab 24(8): 1676-80.
  6. Iqbal J, Wu H-X, Hu N, et al. (2022) Effect of glucagon-like peptide-1 receptor agonists on body weight in adults with obesity without diabetes mellitus-a systematic review and meta-analysis of randomized control trials. Obes Rev 23(6): e13435. [crossref]
  7. The battle over the trillion-dollar weight-loss bonanza (2024) The Economist .
  8. Nundy S, Cooper LA, Mate KS (2022) The Quintuple Aim for Health Care Improvement: A New Imperative to Advance Health Equity. JAMA [crossref]
  9. Schulz KF, Grimes DA (2002) Blinding in randomised trials: hiding who got what. Lancet 359(9307): 696-700. [crossref]
  10. H B, L N, Ce D (2004) Assessment of blinding in clinical trials. Controlled clinical trials 25(2). [crossref]
  11. Semaglutide and Heart Failure with Preserved Ejection Fraction and Obesity (2023) New England Journal of Medicine 389(25): 2397-9.
  12. Wang Y, Parpia S, Couban R, et al. (2024) Compelling evidence from meta-epidemiological studies demonstrates overestimation of effects in randomized trials that fail to optimize randomization and blind patients and outcome assessors. J Clin Epidemiol 165: 111211. [crossref]
fig 1

Glucagon and Beyond: Future Perspectives in Childhood

DOI: 10.31038/EDMJ.2024812

Abstract

In a century of research, it has gradually become clear that glucagon should no longer be considered only as a counter-regulatory hormone of insulin accordingly to its role in the physiopathogenesis of metabolic pathologies such as diabetes, obesity and fatty liver appears to be decisive. As hyperglucagonemia represents the common feature of various metabolic pathologies not only in adults but also in pediatric patients, glucagon can be a problem but also a solution in the field of metabolic diseases. In fact, opposing therapeutic strategies have been developed which inhibit or enhance the activity of glucagon depending on the clinical situation and are also applied in pediatric age. This review aims to take stock of the situation on the physiopatogenetic role of glucagon in metabolic pathologies and bring together the dots of recent discoveries leading to the hypothesis of new solutions in the management and prevention ofthesepathologies.

Keywords

Glucagon, NAFLD, Obesity, Diabetes, Children

Introduction

In 2023 we celebrated the centenary of the discovery of glucagon, which occurred almost by chance since it was initially isolated as a contaminant of the first insulin preparations in 1923. However, the hormonal role of glucagon was only established in the 1950s. Recently, animal and human studies have confirmed the essential role of glucagon in glucose metabolism but have suggested equal importance for amino acid and lipid metabolism [1]. As considered an anti-insulin hormone, it was early on used to treat insulin-induced hypoglycemic coma episodes in people with Type 1 Diabetes Mellitus (T1DM). Nevertheless, a key step in the history of glucagon has been the discovery of its role and the role of α-cells in the physiology and pathophysiology of Type 2 diabetes (T2DM) and obesity [2]. In the last decades, research on glucagon has been slowed down by the difficulty encountered in carrying out glucagonemia measurements [3] which seems to have been overcome thanks to the development of a new high-quality ELISA method [4]. Currently, a century after the discovery of glucagon, there is still a lot to learn about this second pancreatic hormone and it seems necessary to re-elaborate the discoveries achieved so far to lay the foundations for innovative research projects.

Necessary Physiology Hints

Glucagon was initially known to be antagonist to insulin for its opposite metabolic effects on glucose metabolism. In particular, glucagon acts directly on glucose metabolism through three main mechanisms: in the liver, glucagon increases glucose production by stimulating glycogenolysis and gluconeogenesis [5] while in adipose tissue, glucagon stimulates lipolysis with the release of fatty acids and subsequent formation of ketone bodies in the liver [6] resulting both in a net increase of blood glucose levels; in contrast, glucagon acts on β-cells by inhibiting insulin production, thereby, giving a major contribute in maintaining glucose homeostasis. Therefore, glucagon binds specifically to Glucagon Receptor (GCGR), detected mainly in b-cells, liver cells and adipocytes [7]. However, the glucagon receptor has a wide distribution in the body and this explains its multiple known and potential effects. In fact, GCGR is also found in kidneys, heart, lymphoblasts, spleen, brain, adrenal glands, retina, and gastrointestinal tract [8]. Glucagon also controls indirectly blood sugar levels in the kidney through renal excretion by increasing water reabsorption and glomerular filtration and thereby glucose reabsorbtion [9]. Nevertheless, it is currently known that the role of glucagon is not limited to maintaining glucose homeostasis. In fact, glucagon appears to be the basis of a physiological response of satiety induced by meal, as glucagon concentrations increase during the consumption of a mixed meal [10]. The regulatory mechanisms that control glucagon-induced satiety are poorly understood but mediation of vagal afferent fibers in the hepatic branch that transmit signals to the central nervous system is hypothesized [5]. Furthermore, Glucagon promotes weight loss having a direct effect on slowing gastric emptying and increasing energy expenditure [11]. The mechanism of action of glucagon in the remaining areas of the body where its receptor is represented, such as retina, heart and gatrointestinal tract, still remains to be clarified.

Glucagon and Liver-α cell Axis

The main end organ for glucagon is the liver where a feedback axis, the “liver-alpha cell axis” (Figure 1), has been established [12]. In fact, the net increase in hepatic plasma glucose secretion, due to glucagon induced glycogenolysis and gluconeogenesis, determines a direct inhibition of glucagon secretion from α-cells. Furthermore, glucagon increases hepatic absorption and turnover of amino acids, leading to decreased aminoacids levels and inducing, thereby, ureagenesis, which again reduces the secretion of glucagon. Also, glucagon increases hepatic β-oxidation and decreases lipogenesis, lowering the circulating concentration of free fatty acids (FFAs). Although, a plausible mechanism through which lower circulating FFAs may inhibit glucagon secretion has not yet been established [6].

fig 1

Figure 1: The liver-α-cell-axis in health. Modified from American Diabetes Association [The Liver-α-Cell Axis in Health and in Disease, American Diabetes Association, 2022]. Copyright and all rights reserved. Material from this publication has been used with the permission of American Diabetes Association.

Hyperglucagonemia: The Main Character

Metabolic disorders have long been thought to be caused by total or relative insulin deficiency: this is known as Insulin-centric theory [13]. However, in 1978 Unger and collaborators, in contrast to the insulinocentric theory and in light of discovery of the effects of glucagon, proposed the theory of bihormonal regulation [14]. They found that some metabolic disturbances associated with diabetes, such as elevated lipolysis, increased proteolysis, and impaired glucose utilization are directly caused by insulin deficiency; while others, such as decreased glycogensynthesis, increased ketogenesis, elevated liver glycogenolysis, and gluconeogenesis, are direct effects of excess glucagon. Lately, between the end of the twentieth century and the beginning of the twentyfirst century, the glucagonocentric theory was established, already intuited by Unger and his collaborators, supported by the following evidence: in mice lacking GCGR, insulin deficiency does not cause hyperglicemia, in humans hyperglucagonemia has been established in all forms of diabetes, therefore, excess glucagon represents the sine qua non for the development of hyperglycemia [15]. Physiologically, hypoglycemia represents the main stimulus to glucagon secretion. However, in individuals with diabetes, therefore in conditions of hyperglycemia, there is a paradoxical increase in glucagon in conditions of hyperglycemia. Until recently, this dynamic, which leads to hyperglucagonemia, was explained exclusively through the tonic inhibition exerted by insulin on α-cells, in light of the concept of unidirectional flow from beta to alpha cells [16]. Until the 2000s, it was, therefore, thought that the impact of alpha cells on β cell function was negligible, probably because the studies were mostly based on rodent islets in which α-cells are less represented than in humans [17]. Eventually, in the new millennium, a more sophisticated model of intra-islets vascular system with bidirectional flow and circulation integrated with the exocrine pancreas, was recognized. Therefore, an active role of α-cells has been recognized from both a physiological and pathophysiological point of view, leading to the concept of cross-talk between alpha- and beta-cells [18].

The Role of the Inter-cellular Cross-talk

Glucagon and insulin receptors are expressed on both alpha- and beta-cells, proving that there is a reciprocal relationship between them. Insulin exerts a tonic inhibition on glucagon production by α-cells directly through insulin receptor, therefore, a decrease in insulin induces increased glucagon production [19]. As GCGRs are more abundant in β-cells than Insulin Receptors in α-cells, it has been demonstrated that glucagon secretion acts a direct effect on insulin release [20]. Moreover, in condition of hyperglycemia, β-cells in close contact with the alpha cells release more insulin compared with β-cells deprived of these contacts [21]. It has also been shown that people with T2DM show elevated α-cell-to-β-cell mass ratios, potentially because α-cells are necessary for mantaining β-cell insulin secretion [22]. Although the action on GCGR, glucagon seems to stimulate insulin secretion predominantly via the GLP1 (glucagon-like peptide 1) receptor expressed on β-cell surface [23].

Hyperglucagonemia: The Common Feature

It is known that T1DM and T2DM recognize a different pathogenesis, but these two pathologies have in common hyperglucagonemia whose pathogenetic role has long been overlooked. Lack of postprandial suppression and subsequent glucagon hypersecretion is characteristic in patients with T1DM or T2DM [24]. Even individuals with subtle glucose metabolism disturbances without having clear diabetes mellitus may have excess glucagon in response to the OGTT [25]. Different causes of hyperglucagonemia can be hypothesized and, although it seems difficult to make a clear distinction between metabolic pathologies, since some of them constitute a continuum, recognizing the predominant mechanism in each of them could guide the therapeutic choice and determine a better efficacy, as summarized in the Table 1.

Table 1: Different causes of hyperglucagonemia

Main causes of hyperglucagonemia

Metabolic pathologies

1)       Lack of suppression from insulin deficit T1DM
2)       Role of incretins T2DM – OBESITY
3)       Liver glucagon receptor resistance T2DM – OBESITY
4)       altered liver-alpha cell axis NAFLD

Hyperglucagonemia in Obesity and NAFLD

It is known that Nonalcoholic Fatty Liver Disease (NAFLD) represents the most common chronic liver disease in children and adolescents and represents an early risk factor for the development of obesity and T2DM [26]. Studies revealed that hyperglucagonemia is more closely related to obesity and fatty liver disease than to diabetes: fasting hyperglucagonemia also occurs in individuals with obesity and normal glucose tolerance [27]. The proposed hypothesis is that NAFLD drives hepatic resistance to glucagon by altering the liver-alpha cell feedback mechanism (Figure 2) and thus resulting in increased circulating levels of aminoacids that stimulate α-cells to secrete glucagon resulting in hyperglucagonemia [28]. In fact, a study conducted in 2020 showed greater glucagon resistance at the level of liver aminoacid turnover in individuals with obesity and NAFLD compared to healthy lean (non-steatotic) individuals [29]. Given its causal role in hyperglucagonemia, plasma glucagon concentration could also be useful for identifying pediatric patients most at risk for NAFLD [30].

fig 2

Figure 2: The liver-α-cell-axis in disease. Modified from American Diabetes Association [The Liver-α-Cell Axis in Health and in Disease, American Diabetes Association, 2022]. Copyright and all rights reserved. Material from this publication has been used with the permission of American Diabetes Association.

Hyperglucagonemia in Obesity and T2DM

In metabolic disorders such as T2DM and obesity the alteration of incretin production seems to prevail as possible mechanism responsible for hyperglucagonemia. About that, a study was conducted on patients aged 10 to 18 years with obesity and varying glucose tolerance from Impaired Glucose Tolerance (IGT) up to T2DM compared to controls with normal glucose tolerance. The authors demonstrated that, compared to controls, obese patients with impaired glucose tolerance exhibit a reduction in GLP1 levels in parallel with the increase in postprandial glucagon levels while an increase in fasting glucagon levels in parallel with a reduction in fasting GLP-1 levels [31]. These differences became more evident the more glucose tolerance was reduced. Therefore, an important role must also be recognized in the alteration of incretin levels. In light of this, it seems reasonable to deduce that T2DM therapy with GLP1 has a stronger rationale rather than metformin. Furthermore, a chronic hyperglycemic condition has been shown to increase the expression of the GCGR on the liver and decrease its downstream signaling. This means that a real mechanism of hepatic receptor resistance to glucagon is established [32]. Additionally, it is also hypothesized that the pathophysiology of T2DM is based on a mutation in the gene that codes for the GCGR [33,34].

Hyperglucagonemia and T1DM

In the light of what has been seen on the interaction between alpha- and beta-cells, in subjects affected by T1DM, insulin deficiency leads to the lack of tonic inhibition exerted by β-cell on α-cell, therefore, there is an increase in glucagonemia. Additionally, glucagon seems to play a crucial role especially evident in case of diabetic ketoacidosis (DKA) [35]. Thus, in insulin deficiency, glucagon prevails, FFAs are transferred from the circulation to the mitochondria of the liver cells. Then, the oxidation of FFAs takes place, and acetyl-CoA is produced and is used for the synthesis of ketone bodies [36]. However, there is a difference between the ketogenesis induced by physiological conditions such as fasting in order to find an alternative source of energy and the ketogenesis induced by pathological conditions like uncontrolled T1DM [37] in which it is the result of dysregulated metabolism and a lack of insulin and is not intended to function as an energy source [38]. It is widely known that DKA can cause several adverse events and multiply the risk of developing diabetic complications as ketones lead to increased oxidative stress and inflammation which affect mainly cardiomyocytes, erythrocytes, and endothelial cells [39]. Additionally, elevated plasma ketone concentrations appear to be involved in reducing cell surface insulin receptors, leading to increased Insulin Resistence [40]. Since during DKA glucagon production is increased and is responsible for harmful effects on the body exactly like insulin deficiency, it could probably be useful to intervene on hyperglucagonemia and not just manage hyperglycemia and insulin deficiency.

Therapeutic Perspectives in Metabolic Disorders

Hyperglucagonemia and α-cell hyperplasia drive and accelerate metabolic dysfunction [41]. However, studies indicate that, through intra-island paracrine communication, α-cells could enhance β-cell function and preserve them. In fact, increased secretion of glucagon in metabolic diseases is the result of an α-cell and possibly also gut-derived adaptation for the maintenance of energy balance in favor of the β cells [42]. Whether hyperglucagonemia in metabolic disease is a pathogenic responsible or represents a metabolically helpful adaptation remains unclear [43].

What is the appropriate therapeutic approach? In consideration of the fundamental role that glucagon plays in the pathogenesis of metabolic disorders, the main current therapies and those currently under study are based precisely on the management of glucagonemia. The best choice of type of therapy depends on the type of metabolic disorder and its stage.

Glucagon Antagonism

Hyperglycemia patients treated with insulin is driven, at least in part, by hyperglucagonemia and, therefore, contrastable by antagonization of glucagon secretion or action [44]. GCGR antagonism has been proposed as a pharmacological approach for the treatment of T1DM or T2DM, and it is possible through receptor antagonists, monoclonal antibodies (mAbs) against GCGR and antisense oligonucleotides that reduce receptor expression [45]. GCGR mAbs can also induce b-cell regeneration through the trans-differentiation of a portion of pancreatic α-cells or δ-cells into β-cells [46]. A single dose of REMD-477 (Volagidemab) significantly reduces insulin requirement in patients with T1D improving glycemic control without serious adverse reactions [47]. Data are limited and require further study.

The Multi-effectiveness of GLP-1 Analogues

Last but not least Glp-1 analogues (GLP1A) are now well-known and widely used drugs for the treatment of obesity, but they seem even more effective than insulin and metformin in the management of T2DM and could find application as an additional therapy also in T1DM.

The strength of the GLP1A is represented by its pleiotropy: enhances glucose-dependent insulin secretion; inhibits glucagon secretion; promotes the survival, growth and regeneration of pancreatic β-cells; slows gastric emptying and reduces food intake (GLP1A also find application in the pharmacological therapy of pediatric obesity)[48].

It is reasonable to assume that even with GCGR mutations in β-cells, the binding of glucagon to GLP-1R is conserved, therefore, GLP-1A overcome the limits of GCGR antagonism too.

GLP-1A in T2DM

Currently, first-line therapies for the treatment of T2DM in children over 10 years of age and adolescents, in addition to diet and exercise, include insulin and metformin while GLP-1A as a second line. Nowdays the incidence of juvenile-onset diabetes (JOD) is increasing accordingly the increasing prevalence of obesity in adolescents [49] and it must be considered that, compared with adult-onset T2DM, JOD is associated to: more severe impairment of pancreatic B-cell function, which is further complicated by the increase in insulin resistance associated with obesity and puberty; higher rates of microvascular and macrovascular complications, despite a shorter disease duration than in other types of diabetes; higher treatment failure rate of metformin, which is used as a first-line drug for type 2 diabetes [50]. Therefore, there will likely be an increasing use of GLP-1A prior to the initiation of insulin given their potential benefits on weight and glycemic control but especially the antagonistic action of glucagon. In fact, a study showed that weekly treatment with Dulaglutide was superior to placebo in improving glycemic control over 26 weeks among young people with type 2 diabetes treated with metformin and/or insulin [51].

GLP-1A in T1DM

In T1DM, residual β-cell function is minimal, if not completely absent. Therefore, GLP-1A cannot have any effect on the stimulation of insulin secretion in these subjects. In addition to glycemic control which represents the target of insulin therapy, two other non-negligible aspects in the management of T1DM concern weight gain and the paradoxical increase in glucagon refractory to the action of the administered insulin [52]. A study demonstrated better glycemic control, weight reduction, a lower insulin daily dose and especially a significant reduction in total and postprandial glucagon levels in patients with combined therapy insulin-GLP1A [53]. Moreover, other Authors showed that postprandial glucagon levels tend to progressively increase with the duration of T1DM and correlate positively with deterioration of glycemic control and loss of β-cell function [54]. If GLP-1 levels followed the rising trend of glucagon while GLP-1 is thought to negatively modulate glucagon secretion, there would be a difference between the action obtained from physiological levels of GLP-1 and pharmacological ones during therapy with GLP-1A. In light of these results, a new starting point can be defined for the rationale for the use of GLP-1A in association with insulin therapy. Also, in a recent trial, Liraglutide appears to exert an inhibitory effect on ketogenesis through glucagon reduction [55]. Furthermore, another work shows that Liraglutide, not only markedly suppresses the post-prandial excursion of glucagon in a dose-dependent manner, but it also suppresses fasting plasma FFAs concentrations, and therefore ketogenesis, in patients with T1DM [56].

New Challanges

Hyperglucagonemia represents a fundamental pre-requisite for the development of all forms of diabetes but also obesity, and it is due to insulin deficiency, glucagon receptor resistance, imbalance of incretin secretion, and impaired liver-alpha cell axis. Hepatic steatosis, present in almost all obese pediatric patients, could be the main responsible for the establishment of glucagon-resistance. Therefore, hyperglucagonemia could also be considered a valid marker for the development of metabolic diseases in pediatric patients, as useful tool in the prevention strategy. Whereas, the challenge in pharmacological research is to balance the beneficial effects of glucagon on body weight and lipid metabolism with its hyperglycemic effects. Therefore, dual- and tri-agonists combining glucagon with incretin hormones have been developed and studied as anti-diabetic and anti-obesity therapies [57,58]. The GIP/GLP-1-agonist Tirzepatide has been approved by FDA for the treatment of T2DM, and according to clinical studies, Tirzepatide proved to be more effective than Semaglutide also in reducing body weight in patients with obesity [59]. Finally, among the therapeutic perspectives, the real challenge is to approach metabolic pathologies by trying to broaden the targets of action. What if we were only treating part of diabetes by giving insulin and metformin? What if we also considered glucagon in the management of diabetic ketoacidosis? There are numerous questions still unanswered. Shifting the focus of therapy can represent a winning strategy in the management of metabolic pathologies and this is what we hope for, especially for the pediatric population.

Conflict of Interest Statement

The authors have no conflicts of interest to declare.

Funding Sources

This study was not supported by any sponsor or funder.

Author Contributions

Conceptualization, Writing and Editing – G.D.P. and A.M.;

Project administration and Supervision – F.C.;

All authors read and approved the final manuscript.

References

  1. Holst JJ (2023) Glucagon 100 years Important, but still enigmatic. Peptides 161: 170942. [crossref]
  2. Scheen AJ, Lefèbvre PJ (2023) Glucagon, from past to present: a century of intensive research and controversies. Lancet Diabetes Endocrinol 11(2): 129-38. [crossref]
  3. Holst JJ, Wewer Albrechtsen NJ (2019) Methods and Guidelines for Measurement of Glucagon in Plasma. Int J Mol Sci 20(21): 5416. [crossref]
  4. Kobayashi M, Maruyama N, Yamamoto Y, Togawa T, et al. (2023) A newly developed glucagon sandwich ELISA is useful for more accurate glucagon evaluation than the currently used sandwich ELISA in subjects with elevated plasma proglucagon‐derived peptide levels. J Diabetes Investig 14(5): 648-58. [crossref]
  5. Müller TD, Finan B, Clemmensen C, DiMarchi RD, et al. (2017) The New Biology and Pharmacology of Glucagon. Physiol Rev 97(2): 721-66.
  6. Galsgaard KD, Pedersen J, Knop FK, Holst JJ, et al. (2019) Glucagon Receptor Signaling and Lipid Metabolism. Front Physiol 10: 413.
  7. Zhang H, Qiao A, Yang D, Yang L, et al. (2017) Structure of the full-length glucagon class B G-protein-coupled receptor. Nature 546(7657): 259-64. [crossref]
  8. Wendt A, Eliasson L (2020) Pancreatic α-cells – The unsung heroes in islet function. Semin Cell Dev Biol 103: 41-50. [crossref]
  9. Bankir L, Bouby N, Blondeau B, Crambert G (2016) Glucagon actions on the kidney revisited: possible role in potassium homeostasis. Am J Physiol-Ren Physiol 311(2): F469-86. [crossref]
  10. Unger RH, Orci L (1976) Physiology and pathophysiology of glucagon. Physiol Rev 56(4): 778-826.
  11. Heppner KM, Habegger KM, Day J, Pfluger PT, et al. (2010) Glucagon regulation of energy metabolism. Physiol Behav 100(5): 545-8.
  12. Hædersdal S, Andersen A, Knop FK, Vilsbøll T (2023) Revisiting the role of glucagon in health, diabetes mellitus and other metabolic diseases. Nat Rev Endocrinol 19(6): 321-35. [crossref]
  13. Banting FG, Best CH, Collip JB, Campbell WR, et al. (1922) Pancreatic Extracts in the Treatment of Diabetes Mellitus. Can Med Assoc J 12(3): 141-6. [crossref]
  14. Unger RH (1978) Role of glucagon in the pathogenesis of diabetes: The status of the controversy. Metabolism 27(11): 1691-709. [crossref]
  15. Lee Y, Berglund ED, Wang M, Fu X, et al(2012) Metabolic manifestations of insulin deficiency do not occur without glucagon action. Proc Natl Acad Sci 109(37): 14972-6.
  16. Samols E, Stagner JI, Ewart RB, Marks V(1988) The order of islet microvascular cellular perfusion is B—-A—-D in the perfused rat pancreas. J Clin Invest 82(1): 350-3. [crossref]
  17. Cabrera O, Berman DM, Kenyon NS, Ricordi C, et al. (2006) The unique cytoarchitecture of human pancreatic islets has implications for islet cell function. Proc Natl Acad Sci 103(7): 2334-9. [crossref]
  18. Almaça J, Caicedo A (2020) Blood Flow in the Pancreatic Islet: Not so Isolated Anymore. Diabetes 69(7): 1336-8. [crossref]
  19. Ishihara H, Maechler P, Gjinovci A, Herrera P-L, et al. (2003) Islet β-cell secretion determines glucagon release from neighbouring α-cells. Nat Cell Biol 5(4): 330-5. [crossref]
  20. Habegger KM, Heppner KM, Geary N, Bartness TJ, et al. (2010) The metabolic actions of glucagon revisited. Nat Rev Endocrinol 6(12): 689-97. [crossref]
  21. Wojtusciszyn A, Armanet M, Morel P, Berney T, et al. (2008) Insulin secretion from human beta cells is heterogeneous and dependent on cell-to-cell contacts. Diabetologia 51(10): 1843-52. [crossref]
  22. Fujita Y, Kozawa J, Iwahashi H, Yoneda S, et al. (2018) Human pancreatic α‐ to β‐cell area ratio increases after type 2 diabetes onset. J Diabetes Investig 9(6): 1270-82. [crossref]
  23. Svendsen B, Larsen O, Gabe MBN, Christiansen CB, et al. (2018) Insulin Secretion Depends on Intra-islet Glucagon Signaling. Cell Rep 25(5): 1127-1134.e2. [crossref]
  24. Brown RJ, Sinaii N, Rother KI (2008) Too Much Glucagon, Too Little Insulin. Diabetes Care 31(7): 1403-4.
  25. Bagger JI, Knop FK, Lund A, Holst JJ, Vilsbøll T(2014) Glucagon responses to increasing oral loads of glucose and corresponding isoglycaemic intravenous glucose infusions in patients with type 2 diabetes and healthy individuals. Diabetologia 57(8): 1720-5. [crossref]
  26. Smith SK, Perito ER (2018) Nonalcoholic Liver Disease in Children and Adolescents. Clin Liver Dis 22(4): 723-33.
  27. Wewer Albrechtsen NJ, Junker AE, Christensen M, Hædersdal S, et al. (2018) Hyperglucagonemia correlates with plasma levels of non-branched-chain amino acids in patients with liver disease independent of type 2 diabetes. Am J Physiol-Gastrointest Liver Physiol 314(1): G91-6. [crossref]
  28. Suppli MP, Lund A, Bagger JI, Vilsbøll T, et al. (2016) Involvement of steatosis-induced glucagon resistance in hyperglucagonaemia. Med Hypotheses 86: 100-3. [crossref]
  29. Suppli MP, Bagger JI, Lund A, Demant M, Van Hall G, Strandberg C, et al(2020) Glucagon Resistance at the Level of Amino Acid Turnover in Obese Subjects With Hepatic Steatosis. Diabetes 69(6): 1090-9. [crossref]
  30. Castillo‐Leon E, Cioffi CE, Vos MB(2020) Perspectives on youth‐onset nonalcoholic fatty liver disease. Endocrinol Diabetes Metab 3(4): e00184.
  31. Manell H, Staaf J, Manukyan L, Kristinsson H, et al. (2016) Altered Plasma Levels of Glucagon, GLP-1 and Glicentin During OGTT in Adolescents With Obesity and Type 2 Diabetes. J Clin Endocrinol Metab 101(3): 1181-9. [crossref]
  32. Bozadjieva Kramer N, Lubaczeuski C, Blandino-Rosano M, Barker G, et al. (2021) Glucagon Resistance and Decreased Susceptibility to Diabetes in a Model of Chronic Hyperglucagonemia. Diabetes 70(2): 477-91. [crossref]
  33. Hager J, Hansen L, Vaisse C, Vionnet N, et al(1995) A missense mutation in the glucagon receptor gene is associated with non-insulin-dependent diabetes mellitus. Nat Genet 9(3): 299-304.
  34. Gough SCL, Saker PJ, Pritchard LE, Merriman TR, et al. (1995) Mutation of the glucagon receptor gene and diabetes mellitus in the UK: association or founder effect? Hum Mol Genet 4(9): 1609-12.
  35. Veneti S, Grammatikopoulou MG, Kintiraki E, Mintziori G, et al. (2023) Ketone Bodies in Diabetes Mellitus: Friend or Foe? Nutrients 15(20): 4383.
  36. Shi L, Tu BP (2015) Acetyl-CoA and the regulation of metabolism: mechanisms and consequences. Curr Opin Cell Biol 33: 125-31.
  37. Sherwin RS, Hendler RG, Felig P(1976) Effect of Diabetes Mellitus and Insulin on the Turnover and Metabolic Response to Ketones in Man. Diabetes 25(9): 776-84. [crossref]
  38. Hall S, Wastney M, Bolton T, Braaten J, et al. (1984) Ketone body kinetics in humans: the effects of insulin-dependent diabetes, obesity, and starvation. J Lipid Res 25(11): 1184-94. PMID: 6440941. [crossref]
  39. Kanikarla-Marie P, Jain SK(2015) Hyperketonemia (Acetoacetate) Upregulates NADPH Oxidase 4 and Elevates Oxidative Stress, ICAM-1, and Monocyte Adhesivity in Endothelial Cells. Cell Physiol Biochem 35(1): 364-73. [crossref]
  40. Kanikarla-Marie P, Jain SK(2016) Hyperketonemia and ketosis increase the risk of complications in type 1 diabetes. Free Radic Biol Med 95: 268-77.
  41. Lee YH, Wang M-Y, Yu X-X, Unger RH (2016) Glucagon is the key factor in the development of diabetes. Diabetologia 59(7): 1372-5.
  42. Zhang Y, Han C, Zhu W, Yang G, et al. (2021) Glucagon Potentiates Insulin Secretion Via β-Cell GCGR at Physiological Concentrations of Glucose. Cells 10(9): 2495. [crossref]
  43. Finan B, Capozzi ME, Campbell JE (2020) Repositioning Glucagon Action in the Physiology and Pharmacology of Diabetes. Diabetes 69(4): 532-41. [crossref]
  44. Unger RH, Cherrington AD (2012) Glucagonocentric restructuring of diabetes: a pathophysiologic and therapeutic makeover. J Clin Invest 122(1): 4-12. [crossref]
  45. Patil M, Deshmukh NJ, Patel M, Sangle GV (2020) Glucagon-based therapy: Past, present and future. Peptides 127: 170296. [crossref]
  46. Gu L, Cui X, Lang S, Wang H, et al. (2019) Glucagon receptor antagonism increases mouse pancreatic δ-cell mass through cell proliferation and duct-derived neogenesis. Biochem Biophys Res Commun 512(4): 864-70. [crossref]
  47. Pettus J, Boeder SC, Christiansen MP, Denham DS, et al. (2022) Glucagon receptor antagonist volagidemab in type 1 diabetes: a 12-week, randomized, double-blind, phase 2 trial. Nat Med 28(10): 2092-9. [crossref]
  48. Toft-Nielsen M-B, Damholt MB, Madsbad S, Hilsted LM, et al. (2001) Determinants of the Impaired Secretion of Glucagon-Like Peptide-1 in Type 2 Diabetic Patients. J Clin Endocrinol Metab 86(8): 3717-23. [crossref]
  49. Pyle L, Kelsey MM (2021) Youth-onset type 2 diabetes: translating epidemiology into clinical trials. Diabetologia 64(8): 1709-16. [crossref]
  50. TODAY Study Group (2012) A Clinical Trial to Maintain Glycemic Control in Youth with Type 2 Diabetes. N Engl J Med 366(24): 2247-56.
  51. Arslanian SA, Hannon T, Zeitler P, Chao LC, et al. (2022) Once-Weekly Dulaglutide for the Treatment of Youths with Type 2 Diabetes. N Engl J Med 387(5): 433-43.
  52. Frandsen CS, Dejgaard TF, Madsbad S (2016) Non-insulin drugs to treat hyperglycaemia in type 1 diabetes mellitus. Lancet Diabetes Endocrinol 4(9): 766-80.
  53. Ilkowitz JT, Katikaneni R, Cantwell M, Ramchandani N, et al. (2016) Adjuvant Liraglutide and Insulin Versus Insulin Monotherapy in the Closed-Loop System in Type 1 Diabetes: A Randomized Open-Labeled Crossover Design Trial. J Diabetes Sci Technol 10(5): 1108-14. [crossref]
  54. Fredheim S, Andersen M-LM, Pörksen S, Nielsen LB, et al. (2015) The influence of glucagon on postprandial hyperglycaemia in children 5 years after onset of type 1 diabetes. Diabetologia 58(4): 828-34. [crossref]
  55. Garg M, Ghanim H, Kuhadiya ND, Green K, et al. (2017) Liraglutide acutely suppresses glucagon, lipolysis and ketogenesis in type 1 diabetes. Diabetes Obes Metab 19(9): 1306-11. [crossref]
  56. Kuhadiya ND, Dhindsa S, Ghanim H, Mehta A, et al. (2016) Addition of Liraglutide to Insulin in Patients With Type 1 Diabetes: A Randomized Placebo-Controlled Clinical Trial of 12 Weeks. Diabetes Care 39(6): 1027-35. [crossref]
  57. Urva S, Coskun T, Loh MT, Du Y, et al. (2022) LY3437943, a novel triple GIP, GLP-1, and glucagon receptor agonist in people with type 2 diabetes: a phase 1b, multicentre, double-blind, placebo-controlled, randomised, multiple-ascending dose trial. The Lancet 400(10366): 1869-81. [crossref]
  58. Knerr PJ, Mowery SA, Douros JD, Premdjee B, et al. (2022) Next generation GLP-1/GIP/glucagon triple agonists normalize body weight in obese mice. Mol Metab 63: 101533. [crossref]
  59. Heise T, Mari A, DeVries JH, Urva S, Li J, Pratt EJ, et al. (2022) Effects of subcutaneous tirzepatide versus placebo or semaglutide on pancreatic islet function and insulin sensitivity in adults with type 2 diabetes: a multicentre, randomised, double-blind, parallel-arm, phase 1 clinical trial. Lancet Diabetes Endocrinol 10(6): 418-429. [crossref]

Palliative Medicine Symptom Management for Geriatric Patients

DOI: 10.31038/JPPR.2024712

Abstract

The landscape of palliative medicine, particularly concerning symptom management in older adults with serious illnesses, continues to evolve, necessitating periodic updates to clinical approaches and guidelines. This article provides a comprehensive exploration of the challenges, strategies involved in optimizing the quality of life for this vulnerable population, and a commentary of the “Symptom Management in the Older Adult: 2023 Update.

Introduction

Geriatric palliative medicine seeks to enhance the quality of life for older adults facing serious illnesses. It underscores the importance of viewing symptom management through a holistic lens, considering not only physical symptoms but also psychosocial and existential aspects. Frailty is highlighted as a significant factor influencing symptom management decisions, necessitating tailored approaches along the illness trajectory. Moreover, the impact of external factors such as the opioid epidemic and the COVID-19 pandemic underscores the dynamic nature of symptom management in this context.

Pain Management

Pain management in older adults with serious illnesses represents a multifaceted challenge requiring a nuanced and individualized approach. Chronic pain, a prevalent issue in this population, not only diminishes quality of life but also poses unique barriers to effective management. The “Symptom Management in the Older Adult: 2023 Update” delves into the complexities of pain assessment, pharmacologic interventions, and non-pharmacologic strategies tailored to the specific needs of older patients facing serious illnesses.

Assessment Challenges

Assessing pain in older adults presents unique challenges due to factors such as underreporting and atypical pain presentations. Older adults may attribute pain to aging or hesitate to report it, leading to underestimation of its prevalence and severity. Moreover, comorbidities and cognitive impairment can obscure pain assessment, as pain may manifest as behavioral changes rather than verbal expressions. We emphasize the importance of adopting a patient-centered approach, prioritizing the patient’s pain experience and preferences in the assessment process.

Pharmacologic Interventions

Pharmacologic interventions remain cornerstone modalities in pain management, but their use in older adults requires careful consideration of factors such as frailty, comorbidities, and medication interactions. Opioids, while effective for pain relief, are often underutilized due to concerns about side effects and addiction. We advocate for judicious opioid prescribing, starting at the lowest effective dose and titrating slowly while monitoring for adverse effects. It also emphasizes the importance of patient and caregiver education regarding opioid use, dispelling myths, and addressing concerns to optimize adherence and safety.

Adjuvant Agents and Non-Pharmacologic Strategies

In addition to opioids, adjuvant agents play a crucial role in pain management, particularly in older adults with complex medical profiles. Non-opioid analgesics such as acetaminophen and nonsteroidal anti-inflammatory drugs (NSAIDs) offer alternative options for mild to moderate pain, but their use requires careful monitoring for adverse effects, especially in older adults with comorbidities such as renal impairment or gastrointestinal bleeding risk. Beyond pharmacologic interventions, non-pharmacologic strategies play a pivotal role in holistic pain management approaches. We seek to highlight the importance of integrating non-pharmacologic modalities such as physical therapy, acupuncture, cognitive-behavioral therapy, and mindfulness-based interventions into pain management plans. These modalities not only complement pharmacologic treatments but also address psychosocial factors contributing to pain perception and coping mechanisms.

Individualized Care

Central to effective pain management in older adults is the principle of individualized care. Each patient’s pain experience is unique, influenced by factors such as cultural background, psychological resilience, and social support networks. The commentary advocates for a personalized approach that considers the patient’s goals, preferences, and values when formulating pain management plans. Shared decision-making between patients, caregivers, and healthcare providers ensures alignment with patient priorities while optimizing treatment outcomes.

Challenges and Opportunities

While significant progress has been made in pain management approaches for older adults with serious illnesses, challenges persist, necessitating ongoing research and innovation. Our review acknowledges the need for further studies to elucidate optimal pain management strategies tailored to the complex needs of older patients. Additionally, addressing barriers such as stigma surrounding opioid use and expanding access to multidisciplinary pain management services are crucial steps toward improving pain care delivery and outcomes in this vulnerable population. Pain management in older adults with serious illnesses requires a comprehensive, multidimensional approach that integrates pharmacologic and non-pharmacologic modalities while prioritizing patient-centered care. By addressing the unique challenges and opportunities inherent in pain assessment and treatment, healthcare providers can enhance the quality of life for older adults facing serious illnesses, mitigating the burden of pain and promoting overall well-being.

Fatigue

Fatigue emerges as a prevalent and distressing symptom in older adults with chronic diseases. Early recognition and intervention to mitigate its impact on patients’ well-being is important. While we acknowledge the limited evidence base for fatigue management in this population, we emphasize the need to explores potential pharmacologic and non-pharmacologic interventions tailored to individual patient needs.

Neurologic and Psychiatric Symptoms

Depression, anxiety, insomnia, and delirium represent significant challenges in the management of older adults with serious illnesses. There is a complex interplay between these symptoms and the importance of comprehensive assessment and management strategies needs to be of primary focus. There needs to be continued discussion regarding pharmacologic interventions while weighting the need for caution and individualization, particularly considering the older adult population’s unique characteristics and vulnerabilities.

Respiratory Symptoms

Dyspnea and cough are common respiratory symptoms that can significantly impact the quality of life for older adults with serious illnesses. There are various approaches to symptom management, including both pharmacologic and non-pharmacologic interventions. For some patients, there may be a role of opioids in managing dyspnea depending on individualized treatment plans tailored to the underlying etiology and patient preferences.

Gastrointestinal Symptoms

Constipation, nausea, vomiting, and cachexia/anorexia are prevalent gastrointestinal symptoms in older adults with serious illnesses. Extra attention should be placed towards obtaining an accurate diagnosis and creating individualized treatment approaches, considering factors such as comorbidities and medication interactions. It provides an overview of pharmacologic and non-pharmacologic interventions aimed at alleviating these distressing symptoms and improving patients’ overall well-being.

Miscellaneous Bothersome Symptoms

The commentary addresses additional bothersome symptoms such as itching and hiccups, highlighting potential causes and treatment options. It emphasizes the importance of a comprehensive approach to symptom management, considering both pharmacologic and non-pharmacologic interventions tailored to individual patient needs.

Summary

In summary, the “Symptom Management in the Older Adult: 2023 Update” provides a thorough examination of the complexities involved in optimizing the quality of life for older adults with serious illnesses. Through a multidimensional approach that considers physical, psychosocial, and existential aspects, the review offers insights into tailored symptom management strategies. However, it also acknowledges the limitations of the current evidence base and underscores the need for further research to enhance our understanding and improve outcomes in this population. Overall, the review serves as a valuable resource for clinicians navigating the intricacies of palliative care in older adults.

FIG 1

Revisiting MC Carbide Formation in a Ni-Co-Cr Alloy with Additions of Carbon and Distinct Transition Metal Elements W, Ta, Ti or Hf

DOI: 10.31038/NAMS.2024723

Abstract

We revisit the formation of MC carbides in a model Ni-Co-Cr alloy containing carbon and the transition metal elements Hf, W, Ta, or Ti. We aim at illustrating that the thermodynamic stability of the MC carbides sensitively depends on the transition metal at case. All investigated alloys contain 1.15 at.% C and 1.20 at.% M (Hf, W, Ta, or Ti) being added to the baseline alloy Ni-31.3Co-31Cr (at.%). The selected carbon content is rather high and significantly higher compared to common superalloys, featuring carbide-reinforced alloys as potential candidates for laser based manufacturing. Thermodynamic computations using the Thermo-Calc software and the TCNi8 database show that only HfC is stable over the entire temperature range from room temperature up to the eutectic temperature of HfC formation, which is just above the solidus temperature of the Hf and C containing alloy.

Keywords

MC mono-carbides, Transition metal carbides, Thermodynamic computations, Carbide-reinforced alloys

Introduction

In most nickel-base alloys, transition metal mono-carbides (MC) with the crystal structure of NaCl [1] form in-situ during the late stages of solidification following a terminal eutectic reaction. In casting conditions, the MC carbides are therefore found in interdendritic regions only, quite often displaying the so-called Chinese script morphology [2-4]. These carbides are efficient to reduce grain boundary sliding during creep, but may deteriorate the tensile ductility and fatigue resistance by offering crack initiation sites and preferential crack propagation paths. Laser based processing, e.g. laser powder bed fusion, opens up new pathways for controlling the size and distribution of in-situ formed carbides. Recent articles have indeed reported that nano-sized and well-dispersed carbides are obtained by additive manufacturing in a number of Ni-based alloys [5-8], however the nature of the carbides is largely dependent on the alloy composition. This motivated us to revisit the thermodynamic stability of carbides in a model Ni-Co-Cr alloy containing carbon and the transition metal elements Hf, W, Ta, or Ti using thermodynamic computations with the software Thermo-Calc and the TCNi8 database [9]. In this short article, we will report on computed phase equilibria as function of temperature. In addition, we display the evolution of the solute content of Hf, W, Ta, or Ti in the solid solution matrix phase with the FCC face centered cubic crystal structure. We recall that phase equilibria are relevant for devising heat treatments and certainly for considerations of the phases in equilibrium with one another at the envisaged operation temperature. They are not sufficient for understanding phase evolution under the fast and directional solidification conditions inherent to laser processing.

Phase Equilibria and Thermodynamic Stability of MC Carbides

To address the question regarding the formation of carbides and the stability range of MC carbides we devised a generic alloy composition with carbon C and the transition metal M in nearly equimolar quantity (Table 1). Four alloys were defined accordingly; their composition in being listed in Table 1. For convenience we use wt.% instead of at.%.

Table 1: Overview of alloy compositions

Alloy composition

Ni

Co

Cr

C

M = (Hf, Ta, W, Ti)

Generic (M), at.%

35.35

31.3 31.0 1.15

1.20 M

Alloy 1 (Hf), wt.%

36.0

32.0

28.0

0.24

3.72 Hf

Alloy 2 (W), wt.%

36.0

32.0

28.0

0.24

3.83 W

Alloy 3 (Ta), wt.%

36.0

32.0

28.0

0.24

3.77 Ta

Alloy 4 (Ti), wt.%

37.0

32.9

28.8

0.25

1.03 Ti

The computed phase equilibria are shown in the left-hand diagrams (a) of Figures 1-4, displaying the volume fraction of equilibrium phases as function of temperature. In all cases the low fraction range was chosen spanning from 0.0 to 0.2, i.e. from 0 to 20 vol.% The right-hand diagrams, labelled (b), display the corresponding evolution of the solute content inside the solid solution FCC phase, focusing on the element M, either Hf, W, Ta or Ti, by case.

Alloy 1 containing M=Hf in an amount of 1.2 at.% (3.72 wt.%) forms HfC from the last solidifying liquid (Figure 1a). The eutectic reaction LiquidŽFCC+HfC+Liquid’ extends over a rather wide temperature interval, which calls for special attention when applying laser-based additive manufacturing. The HfC is outstandingly stable over the widest temperature range down to room temperature. Below 700°C a trace amount of Cr23C6 forms in addition, but not at the expense of HfC. The Hf content in the FCC solid solution (Figure 1b) is very limited with a maximum value at T@1200°C as low as 0.2 at.% and gradually decreasing with decreasing temperature.

FIG 1

Figure 1: Thermodynamic equilibria in Alloy 1 with M=Hf

Alloy 2 containing M=W in an amount of 1.2 at.% (3.83 wt.%) forms Cr7C3 carbides from the very last solidifying liquid (Figure2a). All tungsten remains dissolved in the FCC solid solution. Around T@900°C the Cr7C3 carbide transforms to (Cr,W)23C6 along with a modest decrease of the W content in the solid solution. The R-phase Co27Cr18W8 stable below ~600°C finally consumes significant amounts of the dissolved W.

FIG 2

Figure 2: Thermodynamic equilibria in Alloy 1 with M=W

Alloys 3 and 4 with M=Ta and M=Ti, respectively, behave quite similar with MC and Cr7C3 carbides co-existing at high temperatures (Figures 3 and 4). A small difference relates to the carbide in the eutectic, being Cr7C3 in alloy 3 and TiC in alloy 4. Accordingly, the maximum solute content of Ta in the FCC solid solution is higher than that of Ti. In both alloys the Cr7C3 carbide transforms to (M,Cr)23C6 at around 820°C. The MC carbides remain stable down to about 680°C, where they dissolve in favor of the intermetallic compounds Ni3Ta (Struktur-bericht designation D0a) or Ni3Ti (Strukturbericht designation D024).

FIG 3

Figure 3: Thermodynamic equilibria in Alloy 3 with M=Ta

FIG 4

Figure 4: Thermodynamic equilibria in Alloy 4 with M=Ti

Comparing the alloys at case one must conclude that HfC is outstandingly stable from a thermodynamic viewpoint. In the absence of “parasitic” Cr7C3 carbides the Cr content of the FCC solid solution phase is also highest in Alloy 1, which may be relevant for the oxidation behavior. For convenience Table 2 lists the full composition of the FCC solid solution phase at T=1050°C, seen as a potential operation temperature.

Table 2: Calculated composition of the FCC solid solution matrix at T=1050°C

FCC composition

Ni

Co

Cr

C

M = (Hf, Ta, W, Ti)

Alloy 1 (Hf), wt.%

37.4

33.3

29.0

0.02

0.31 Hf

Alloy 2 (W), wt.%

36.8

32.7

26.7

0.05

3.83 W

Alloy 3 (Ta), wt.%

36.9

32.8

27.3

0.05

2.96 Ta

Alloy 4 (Ti), wt.%

37.6

33.4

28.5

0.05

0.48 Ti

Summary and Outlook

We revisited the formation of MC carbides in a model Ni-Co-Cr alloy containing carbon and the transition metal elements M being Hf, W, Ta, or Ti. A generic alloy composition was devised with carbon C and the transition metal M in nearly equimolar quantity, i.e. 1.15 at.% C and 1.20 at.% M. We used thermodynamic computations to reveal phase equilibria as function of temperature, thus helping to understand the sequence of phase formation and possible phase transitions. The results are summarized as follows:

(1) All alloys give rise to in-situ carbide formation, with distinct carbides solidifying from the last fraction of liquid in a so-called terminal eutectic reaction.

(2) Among the investigated transition metal elements M, hafnium is the only element to provide fully stable MC-type carbides and thus an alloy composed of FCC and HfC over the widest temperature range.

(3) For the nearly equimolar carbon and hafnium content, virtually all C and Hf are bonded in the HfC, leading to an FCC solid solution with low Hf and C content. In the absence of “parasitic” Cr7C3 the Cr-content of the FCC solid solution is highest.

On this thermodynamic background, one may further proceed to design alloys for casting and laser-based additive manufacturing. Laser based processing, e.g. laser powder bed fusion, opens up new pathways for controlling the size and distribution of in-situ formed carbides, taking advantage of the fast and directional solidification inside travelling melt pools. First experiments with an alloy composition close to Alloy 1 were already performed by the authors and submitted to publication.

Acknowledgement

The authors would like to acknowledge P. Berthod and co-workers from the Université de Lorraine, Institut Jean Lamour, France for many fruitful discussions on carbide-reinforced alloys.

Competing Interest Statement

The authors have no competing interests to declare.

Data Availability Statement

To reproduce our figures the Software Thermo-Calc and the database TCNi8 are required.

References

  1. Nakamura K, Yashima M (2008) Crystal structure of NaCl-type transition metal monocarbides MC (M=V, Ti, Nb, Ta, Hf, Zr), a neutron powder diffraction study, Materials Science and Engineering B, 148: 69-72.
  2. Murata Y, Suga K, Yukawa N (1986) Effect of transition elements on the properties of MC carbides in IN-100 nickel-based superalloy, Journal of Materials Science 21: 3653-3660.
  3. Berthod P (2009) High temperature properties of several chromium-containing Co-based alloys reinforced by different types of MC carbides (M = Ta, Nb, Hf and/or Zr), Journal of Alloys and Compounds 481: 746-754.
  4. Conrath E, Berthod P (2018) Properties of a HfC-reinforced nickel-based superalloy in creep and oxidation at 1100 C, Materials Science 53: 861-867.
  5. Wang R, Zhu G, Yang C, Zhou W, Wang D, et al. (2020) Novel selective laser melting processed in-situ TiC particle-reinforced Ni matrix composite with excellent processability and mechanical properties, Materials Science and Engineering A 797: 140145.
  6. Xia T, Wang R, Bi Z, Wang R, Zhang P.et al. (2021) Microstructure and mechanical properties of carbides reinforced nickel matrix alloy prepared by selective laser melting, Materials 14: 4792.
  7. Kim YK, Yu JH, Kim HS, Lee KA (2021) In-situ carbide-reinforced CoCrFeMnNi high-entropy alloy matrix nanocomposites manufactured by selective laser melting: Carbon content effects on microstructure, mechanical properties, and deformation mechanism, Composites Part B. Engineering 210: 108638.
  8. Chen H, Lu T, Wang Y, Liu Y, Shi T, et al. (2022) Laser additive manufacturing of nano-TiC particles reinforced CoCrFeMnNi high-entropy alloy matrix composites with high strength and ductility, Materials Science and Engineering A 833: 142512.
  9. Kaplan B, Blomqvist A, Selleby M, Norgren S (2015) Thermodynamic analysis of the W–Co–Cr system supported by ab initio calculations and verified with quaternary data, Calphad 50: 59-67.