Abstract
Respondents evaluated unique sets of 48 different combinations of elements (so-called vignettes), describing airline services, first rating interest, and second, selecting the emotion closest to their feel, from a list of five feelings/emotions. The test stimuli comprised mixtures of elements, features of the airline’s service, combined according to an experimental design. Each of 54 respondents evaluated a unique set of vignettes arrayed to ensure that the ratings could be analyzed by OLS (ordinary least-squares) regression. Two mind-sets emerged, MS1 being travel process and MS2 being fun and entertainment. The individual elements were linked to the emotions as well, providing a nuanced view of the elements beyond the ability to drive interest in the airline. The paper ends by introducing the PVI, personal viewpoint identifier, to assign a new person to a mind-set, providing a prescription of the specific words to say to the respondent to break through the everyday clutter, and excite interest in the offering.
Introduction
The world of travel and leisure collapsed during the 2020 Covid-19 pandemic [1-3]. Earlier in the decade, as travel was surging, the issues emerged about just ‘what’ the customer wanted in what was becoming a highly competitive environment. The period from 2009 to 2019 saw the emergence of the world from a financial debacle, the melt-down of 2008. Companies began to compete on what they could offer the customer. The emergence of e-commerce, and -shopping for travel changed the balance of knowledge, making the travel agent less important. Customers could use the Internet with programs like Kayak, Orbitz, and so forth to discover and piece together prices, amenities, schedules, etc. [4,5].
Within this world of information and increased customer demand, as well as direct to consumer, issues began to emerge about what features are important to acquire and satisfy customers [6]. In addition, however, interest in consumer requests was accompanied by a growing understanding that emotions play a role in decision making as well [7]. The question emerged about how to link elements to emotions as well, providing two pieces of information; how the element drives decisions, and how the element drives emotions, respectively In papers published by author Moskowitz and colleagues, introduced an approach using experimental design to design test stimuli, and a method to assess liking responses to these test stimuli, and especially determine the acceptance of the the underlying individual phrases, elements, the building blocks of the vignettes [8,9].
The study reported here presents one of the early studies in the use of the emerging psychological science of Mind Genomics to understand how people think about the features of travel, both in terms of motivation to act, and in terms of the linkage of emotion to the specific element. The ingoing assumption was that through the approach of Mind Genomics, explained below, it would be possible to do a simple study to understand the mental ‘valence’ of ideas in the mind of the consumer.
Understanding the Mind of the Consumer through Systematics (Mind Genomics)
Mind genomics is an emerging science with heritage from psychology, consumer research, statistics, and anthropology [10]. The objective of a Mind Genomics study is to understand how people make decisions about the everyday aspects of their lives. Mind Genomics works at the level of the granular, at the simplest levels of experience, which we might call ‘bottom-up’. This means that the information is specific, g expressed in the language of the person who is doing the experiencing, rather than in a summarizing, detail-sparse, high level language that might be used for a professional report.
The study reported here represents one of the earliest mindset cartographies, defined operationally as small studies which take a snapshot of an experience or a situation, with relatively few people. The objective of cartography is to map out the area, rather than confirm/falsify a hypothesis in the way Karl Popper and his associates might do so [11]. Mind Genomics reveal patterns which suggest a hypothesis, rather statistically test a hypothesis. The reason for that seemingly bold statement is that the conventional ways scientist to test hypothesis involve focusing the study, minimizing the noise so that the ‘signal’ can come through. Mind Genomics works in the opposite way, inserting ‘noise’ by testing the stimulus in y different ways, akin to the MRI (magnetic resonance image). It is the set of patterns generated by the MRI, and recombined, which lets the signal come through clearly.
Applying Mind Genomics to the Customer-facing Aspects of an Air Flight
We illustrate how Mind Genomics reveals the responses to an ordinary situation of the 21st century, specifically what people want as amenities on an airline. As the case study unfolds, we will see how Mind Genomics deals with what is interesting at a cognitive, interpretation level, and then at an emotional level, viz., the emotions selected by the respondent while reading a vignette.
The objective of the study was to identify the features of a flight as might offered by an airline seeking to burnish its image. Among the many offers that an airline could provide, in the language of the airline, how does Mind Genomics reveal the importance of the different offers, identify the emotions which relate or link to those offers, and uncover new mind-sets, groups of people showing different, even radically different responses to the same stimuli?
The process follows a series of steps, which we now explicate, showing the step, the data, and the conclusions emerging from each step.
Step 1: Select the Topic, Ask 6 Questions Relevant to the Topic, and for Each Question Provide 6 Answers
The original study was done in 2012. At that time, the primary design was the so-called ‘6×6’, or six questions, each with six answers, and a unique set of 48 combinations or vignettes for each respondent. The reason for the larger design can be traced to the early years of internet-based research. The respondents were recruited from a panel (Open Venue, Inc.,) located in Toronto Canada, but servicing the United States. Respondents at the time were not yet ‘oversampled’ by having every internet transaction followed by a short survey for satisfaction, or so it seems today.
During the first 15 years of these past two decades, it was possible to get consumer respondents to participate in interviews on the web lasting 15 to 20 minutes each. The dropout rate was low, around 33%, and the cost was modest. One benefit of the early introduction of Mind Genomics into internet-based research was the possibility of larger, longer studies, the current 6×6 design, and two rating questions. Today, with the shortening of attention span, with the various media and social media competing for attention, it is no longer possible to do the types of studies reported here. The studies can be of the same type, but significantly shorter. The new approach comprises 4 questions and four answers to each question and is known by the phrases ‘4×4’ or ‘four by four’.
Table 1 shows the 36 elements, arranged by question, and then the six answers (elements) to each question. It is important to keep in mind that the selection of elements need not be perfect. Most researchers are accustomed to thinking a great deal about the choice of elements. Some of that thinking comes from the fact that the researcher fails to perceive research as an iterative process and assumes that the research of this type is always final, conclusive. When the researcher realizes that one can do these early-stage cartographies quickly, inexpensively, and iteratively, the attitude changes from ‘getting the right elements for the not-to-be repeated study’ to ‘getting into the field, getting a feel of what ‘works’, and the iterating a few more times during the next day or two.’
Table 1: The six questions and the six answers to each question.
| Question A: What are travel perks? | |
| A1 | Fly with us and your bags will fly free |
| A2 | Extra carry-on bags….No extra charge when choosing our airline |
| A3 | Special monthly offers |
| A4 | Enjoy VIP perks with our executive club membership |
| A5 | Frequent flyers of our airline get frequent flyer miles |
| A6 | Special holiday deals |
| Question B: What are personal travel conditions? | |
| B1 | Comfy leather seats |
| B2 | Extra legroom with your seat |
| B3 | Wider seats in both coach and first-class sections |
| B4 | Enjoy peaceful privacy with unlimited luxury in first-class |
| B5 | Adjustable personal heating and air conditioning |
| B6 | Private area for nursing infants |
| Question 3: How do you make travel easier/more fun? | |
| C1 | Ticket fees updated online every 24 hours |
| C2 | Unlimited in-flight shopping with payment options available |
| C3 | Book flights through our NEW mobile app |
| C4 | City guide scouts HOT SPOTS for each destination |
| C5 | Largest number of planes with WiFi |
| C6 | Book car rental and hotel reservations all from one website |
| Question D: What type of club facilities do you offer? | |
| D1 | Club members gain access to private lounge in terminals |
| D2 | FREE club membership |
| D3 | Open bar in Pre-flight lounge |
| D4 | Priority boarding privileges for club members |
| D5 | When joining our club your 1st flight is 9 Dollars! |
| D6 | Frequent flyers get extra carry-on bags |
| Question E: What type of food do you feature? | |
| E1 | Fresh food prepared daily |
| E2 | Affordable meals |
| E3 | Large variety of snacks |
| E4 | Baby Formula available on menu for nursing mothers |
| E5 | International cuisine |
| E6 | Meals prepared to your preference |
| Question F: How do you relieve the schedule & baggage related anxieties? | |
| F1 | Mobile app reminds you of your flight 24 hours before boarding |
| F2 | Gift card given if flights are late |
| F3 | 24/7 baggage assistance |
| F4 | Live status for the whereabouts of incoming flights |
| F5 | 30min guarantee for incoming baggage |
| F6 | Top Security guaranteed at airports |
Step 2: Create Combinations of Answers (Vignettes), Present Them to the Respondent in Sets of 2-4 Answers, the Set Evaluated as a Single Offering
The underlying experimental design creates 48 unique combinations for each person. 36 of those combinations comprising four answers (elements), and 12 of those 48 combinations comprising three answers. No vignette can ever comprise two answers from one question to avoid combinations which could be mutually contradictory. The combinations are dictated by a single basic underlying design. The design is permuted so that the mathematical structure is the same, but the specific combinations differ for each respondent. The beauty of the design permutation strategy is that we know ahead of time that each respondent will have evaluated the precisely correct combinations to create an individual level model for that person. In the world of statistics, Mind Genomics uses a within-subjects design, which can be analyzed down to the level of a single respondent, that respondent level analysis becoming relevant for clustering the respondents into mind-sets.
The fact that each respondent evaluates a full experimental design makes Mind Genomics metaphorically akin to the MRI (magnetic resonance imaging). The MRI tool takes different snapshots of an underlying tissue, 2-dimensional, but puts them together afterwards by a computer program. The result is a three- dimensional represent Obtained by combining many-2 dimensional representations. The same holds for the Mind Genomics approach. We get a better understanding of the nature of responses to a situation by having many snapshots or many respondents looking at different combinations of the same topic. Rather than worrying about being correct in our initial choice of the stimuli to test, we create a pathway requiring absolutely no knowledge, although it does require that the researcher to identify phrases to use.
Before leaving this underlying experimental design, it is worth reinforcing the state above regarding Karl Popper’s view of the need to work with hypotheses. Mind Genomics differs from the conventional science which is interested in falsifying or confirming a hypothesis. To falsify with confidence, one would like to make the measures as free of variability as possible. In such a case, the strategy is to test the same stimuli many times to suppress by variability by averaging. Mind Genomics prescribes measuring the entire space, even with noise, letting the pattern emerge out of the seeming noise. Mind Genomics suppress the noise by averaging the underlying patterns, so that the noise drops out. The happy result is that Mind Genomics experiments (viz., studies, surveys) cover a great deal of the ‘design space,’ and reveal inherent patterns in a clear way. The underlying ‘story’ is easy to discern.
Step 3: Present the Test Stimuli, Vignettes, and Get Ratings
Figure 1 shows an example of four steps in the process, these steps manifesting themselves in screen during the Mind Genomics experiment. The four steps are shown as a single slide.
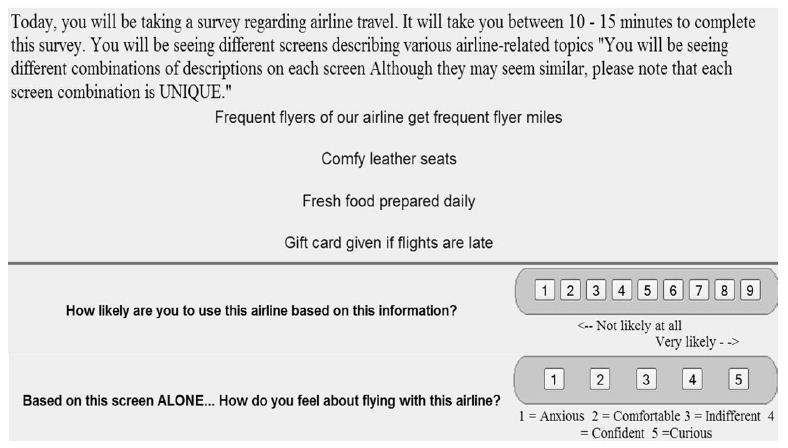
Figure 1: Example of the respondent experience, who sees instructions, a vignette and two ratings scales, use the airline, and select an emotion.
The top portion of Figure 1 shows the orientation/instructions. The instructions say as little as possible about the topic. The goal is to have the elements convey the information because it will be the reactions to the elements which make all the difference.
The second section of Figure 1 shows a four-element vignette, viz., and a vignette comprising four answers.
The third section of Figure 1 shows the first rating scale; ‘use this airline’ (expected action)
The fourth section of Figure 1 shows the second rating scale, ‘select an emotion.’
Often critics complain that it is impossible for a person to make a judgment unless the vignettes are complete. Experience over the last 35 years with Mind Genomics shows this criticism to be invalid, although there is some need for instruction. People have no problem once the vignette is put into context with a few relevant pieces of information. A vignette having only one piece of information is hard to evaluate. An example is a vignette presenting only the brand name, or a price or a benefit. There is no sense of a ‘something’ being evaluated. By the time we get to two and certainly three elements things become a lot easier. The ‘something’ emerges, although the something is simply a set of ideas strung together without connectives. Nonetheless, respondents very rarely say that they have a difficulty answering the questions when there are several elements in the same vignette.
A great deal of the criticism of Mind Genomics comes from individuals who are looking at the process as a long, tortuous process. Most of the people who complain are either academics or marketers. The typical run-of-the-mill person has no problem going through 48 of these vignettes, when the vignettes are properly presented. The respondent is instructed to rate the vignette, doing so by ‘intuition’ and ‘gut feel’. It is here that respondents occasionally begin by trying to be consistent, but since these vignettes come and go so quickly, a typical respondent simply stops trying to be consistent, goes into almost an automatic state, and responds honestly to the combinations. The respondent cannot game the system. That is exactly what is desired, in an honest evaluation. The mind genomics approach forces the respondent to be honest because no human being could follow this combination rapidly enough when the combinations come once a every 8-12 seconds each, in an unrelenting fashion. This evaluation time suffices for the respondent to read the vignette, or at least glance at the vignette, and assign two ratings.
After the respondent completed the evaluation of the 48 vignettes, they completed a second questionnaire, comprising a self-description, in terms of who they are, what they do, and what they think about traveling and airlines. The respondents also were asked to list one feature that they feel to be most important.
For Mind Genomics studies, the best practice is to work with a professional company which specializes in getting respondents to participate on these online studies, whether the studies are called surveys, experiments, or some other label. The respondents may not be totally representative of the entire population, but they are as close as one is going to get to a representative population of the ultimate consumer or relevant party. Efforts to get free panelists may work in some rare situations, but over the past two decades it has become the norm to use panel providers, who incentive the panelists to participate in these studies. In this way the data come in quickly, at relatively low cost.
Step 4: Prepare the Data for Analysis by Transforming the Rating to Create New Variables
The 9-point Likert Scale may be used in the way it is, but it will be far more relevant to create a new binary scale for question #1 (use the airline), and five new binary scales for question #2 (select the emotion from a set of five).
The rationale for creating a binary scale is the effort needed to understand and then to explain the meaning of each scale point on a 9-point scale. Managers make yes/no decision, and prefer black and white answers, or at least black and white measures (viz., not use the airline vs. use the airline). When the 9-point scale is transformed to a binary scale, no/yes, it becomes easier for the manager to understand and use the data. Managers can understand yes in know quite easily. It does not take a lot of effort to explain the results. There is of course a loss of granularity, but that is to be expected and welcomed because it also reduces the confusion in interpreting the results.
The first transformation is the binary transformation using scale #1, the 9-point rating scale. By convention, viz., long term processes in consumer research, the scale is divided between 6 and 7. Ratings of 6 and below are assigned the value 0. Ratings of 7 and above are assigned the rating 100.
The second transformation is done using scale #2, the emotion. Each of the five emotions becomes its own scale. When the emotion is selected (and the other four not selected), the newly created variable corresponding to the selected variable is assigned the value 100. The other four newly created variables, viz., those not selected, are assigned the value 0. It should be kept in mind that this second ‘scale’, viz., select the emotion, is not a rating scale in the way we think of scales, but rather the lowest form of measurement, called the nominal scale by psychophysicist SS Stevens [12]. The five scale points, 1,2,3,4, and 5, do not have any metric value. They are simply placeholders to tell us what was selected.
The two transformations j prepare the data for OLS (ordinary least squares) regression analysis, which link the transformed ratings to the presence/absence of elements.
One final note is in order. OLS regression requires variation in the dependent variable, viz., variation in the transformed rating. This variation can be vanishingly small, but it must be in the data to prevent the regression analysis from ‘crashing.’ A prophylactic measure adds a random number around 10-5 to each newly transformed variable, a low number which does not material affect the OLS regression but prevents the OLS regression program from ‘crashing.’
Step 5: Create an Equation for Each Person, and Cluster People Based on the Pattern of Their Coefficients
The underlying experimental design enables the researcher to relate the presence/absence of the 36 elements to the responses, even at the level of the individual. This so-called ‘within-subjects design’ allows the estimation of the following equation at the level of each respondent, even though each respondent evaluated a unique set of 48 vignettes or combinations:
Binary Response Variable = k0 + k1(A1) + k2(A2) … k36(F6).
The foregoing equation uses the transformed variable from question #1, which had been transformed from a 9-point Likert Scale [13] to a binary scale (see Step 4 above).
Each respondent generates a vector of 37 numbers, an additive constant and 36 coefficients, one coefficient for each of the 36 elements. We ignore the additive constant, focusing just on the 36 coefficients. These coefficients show how the respondent weights the information to drive the judgment of ‘use.’
Through the statistical methods known as cluster analysis [14], we divide the respondents into two and then three groups, based upon the pattern of coefficients. In this case, with a small base size of 54 respondent we isolate two large clusters that were interpretable (MS1 and MS2), and a small cluster of 4 respondents that could not be interpreted. We thus selected a three-cluster solution, but do not pay attention to the third cluster, or third group (MS3). Note that the terms MS1, MS2, and MS3 are short-hand versions for the phrase mind-set, whose meaning will become clear.
At this point it is important to note that the entire clustering operation except for rejecting clusters or naming them is a purely mathematical operation, based upon creating groups of objects (respondents) showing mathematically ‘similar patterns.’ There is no attempt to name the mind-sets. Up to now everything is ‘objective,’ at least in the mathematical sense.
Step 6: Create an Equation for All Respondents, for Total, for Mind-sets, and for Genders
Step 5 showed the equation, estimated by OLS regression. The equation comprises both an additive constant (k0), and 36 individual coefficients.
Binary Response Variable = k0 + k1(A1) + k2(A2) … k36(F6).
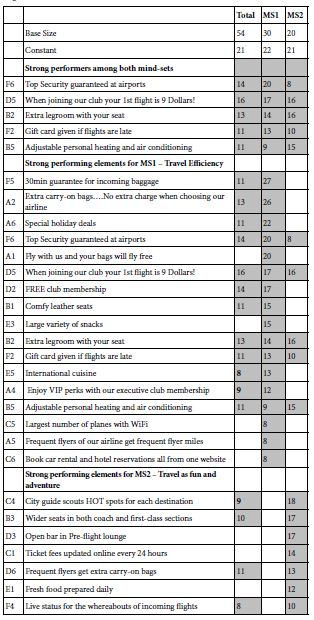
Table 2 shows the parameters of the equations, first estimated for all vignettes evaluated by the total panel, and then estimated for all vignettes evaluated by respondents assigned to MS1, and then respondents assigned to MS2. Table 2 shows only the positive coefficients. To show all coefficients (viz., 36 for each subgroup) overwhelms the reader, and prevents patterns from emerging clearly. Neither zero coefficient nor negative coefficients teach us as much as do the positive coefficients.
Table 2: Performance of the strong performing elements by Total Panel and by the two larger mind-sets.
The parameters are interpreted as follows:
Additive constant – This is the parameter k0. The additive constant is the expect proportion of responses of value 7, 8, or 9 in the absence of elements. By design, all vignettes comprised three or four elements, so no vignettes ever comprised zero elements. The additive constant can be estimated, however, and represents the ‘baseline’ interest in using the airline, in the absence of any additional information. A simile is a statue. The additive constant is the base of the statue.
The elements, in turn, are the additive or subtractive values. We do not show the negative coefficients, which would subtract from the additive constant. We do show the positive coefficients because they are the more important for understanding the nature of the respondent’s thinking.
Table 2 shows a low additive constant, values 21-22, meaning that in the absence of elements (a theoretical situation, as noted above), we expected only one in five ratings to be ‘use the airline.’ It will be the elements, especially those with high coefficients, which drive the choice. These are the elements which ‘perform strongly.’ The operational definition of ‘perform strongly’ is a coefficient of +8 or higher, corresponding to a ‘t’ statistic of about 2 or higher, and a probably of randomness of 0.05 or lower. These cut-off points are obtained by an analysis of variance of the regression model data from the total panel. The strong performing elements are shown as shaded cells.
The strong elements for each mind-set tell the story, whether travel efficiency (MS1) or travel as fun and adventure (MS2). The names for the mind-sets are the major contribution in the interpretation. The creation of the elements requires critical thinking. The mind-sets themselves, however, emerge without any input from the researcher, other than being named.
The elements in Table 2 sorted by strongest to weakest, first by those elements which perform strongly among both mind-sets, then those elements which perform strongly among Mind-Set 1 (valuing travel efficiency (business travelers)), and then those elements which perform strongly among Mind-Set 2 (valuing travel as fun (leisure travelers)).
The data suggest strong performing elements, some performing well in both mind-sets. Two elements should not surprise, one dealing with price, the other with comfort:
When joining out club your 1st flight is 9 Dollars!
Extra legroom with your seat
One element has virtually no appeal at all
Baby Formula available on menu for nursing mothers
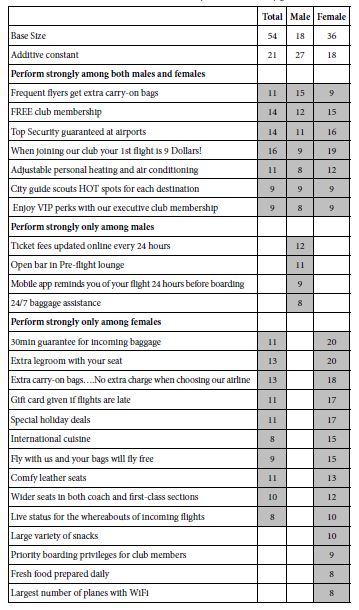
It is important to emphasize at this point that what seems obvious, namely the two different groups of respondents appear to emerge seamlessly, is in fact not so obvious at all. Consider, for example, another way to divide the respondents, viz., by gender. Table 3 shows radical differences between genders in their responses to the elements. The genders differ in terms of the elements which score highly. Yet, there is no clear story which summarizes the differences between the genders regarding the elements which perform strongly.
Table 3: Performance of the elements by Total Panel and by gender.
Step 7: Link Emotions to Elements
Question #2 required the respondent to select a single emotion/feeling to describe how the respondent felt after reading vignette. As described above, we can link the elements to each emotion/feeling by creating five new variables, as well as two summary variables (positive, negative)
The ordinary least-squares equation fits the same type of equation as we have seen above, without, however, the additive constant. In these analyses, coefficients of 10 or higher, are operationally considered to be strong.
We get a sense of the linkages for the Total Panel from Table 4. The Summary linkages suggest five strong linkages with positive emotions (comfortable, confident, and curious):
Table 4: Linkage of elements with emotions. Data from the Total Panel. Strong linkages of 10 or higher are shown in by the shaded cells.
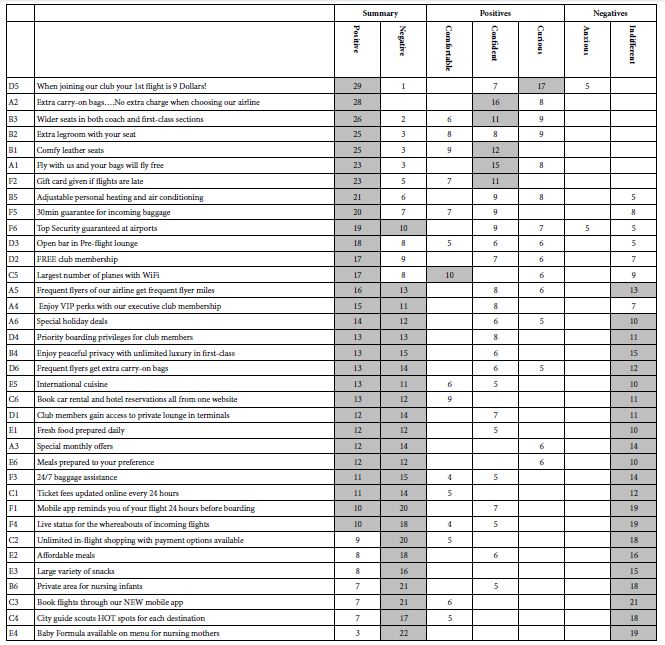
When joining our club your 1st flight is 9 Dollars!
Extra carry-on bags….No extra charge when choosing our airline
Wider seats in both coach and first-class sections
Extra legroom with your seat
Comfy leather seats.
The summary also suggests five strong linkages to negative feelings/emotions (anxious, indifferent)
Private area for nursing infants
Baby Formula available on menu for nursing mothers
Book flights through our NEW mobile app
Mobile app reminds you of your flight 24 hours before boarding
Unlimited in-flight shopping with payment options available
It is important to recognize the potential power of linking elements to emotions. Knowing the linkage of an element with an emotion gives a sense of why the element performs the way it does and may increase the ability to fine tune the message to eliminate the negative feeling/emotion.
Step 8: Generalize the Results by Assigning a NEW PERSON to One of the Two Mind-sets
The data presented here provides an in-depth look at responses to offerings of amenities by airlines. The effort to create the study is relatively small; a day or even less should suffice to pick the topic, discuss the questions, select the answers, and run the study on the internet with 100-200 respondents. The newer versions, with four questions and four elements are even faster. The time for running the experiment is also short; 17-20 minutes for a panel or group of 50-100 people, who can run the study on the internet. Finally, the data analysis is automatic, with the researching getting the report within 1-2 minutes after the study is completed.
The issue is not the study, but rather the generalizability of the results, and the use of the data, both for knowledge-building and for direct marketing. Studies using 50-100 respondents can be set up and executed quickly, especially within the ‘new’ framework of 4×4, viz., four questions, each with four answers. The templated approach (www.BimiLeap.com) makes that effort simple. Yet, at the end of the single Mind Genomics experiment or iterated set of experiments, there is still the need to ‘use’ the data to solve real-world issues, perhaps involving hundreds, thousands, or even millions of people. How then can the researcher generalize the results?
A great deal of ‘foundational research’ regarding attitudes works from the top down, identifying general patterns of responses, so-called personas, which are akin to the mind-sets, but usually for a broader topic area, such as travel in general [15,16]. The objective of the research is to assign a new person to one of these general personas, and then attempt to offer that ‘persona’ (and thus the individual) the appropriate message. The effort is cumbersome, expensive, open to a great deal of interpretation. All too often the effort ends up with the researcher and the marketer ‘guessing’ what to communicate to and what to offer to each persona, viz., each overarching general ‘mind-set.’ The personas may be clear as general descriptions, but the descent from the general to the particular remains a stumbling block. That is, knowing the ‘general’ does not automatically mean knowing ‘the particular in this instance.’
Mind Genomics approaches the problem in a different fashion. Mind Genomics works at the granular level, from the bottom up, remaining in the granular. Here, the granular comprises the relevant, limited aspects of travel, represented by 36 different, concrete ideas, ideas which can be instantiated in specific actions. The emergent mind-sets are quite different from each other. Time after time, these mind-sets emerge as the key to both to better understand the customer, and to better put that understanding into action.
The focus on granularity has led to a simple, virtually algorithmic approach which assigns new people to the appropriate mind-set. The data from the mind-sets (Table 2) prescribe the appropriate messages. During the past several years, authors Gere and Moskowitz have developed the PVI, the personal viewpoint identifier. The PVI comprises a set of six specific statements, taken from the set of statements shown in Table 2. The statements are those which best differentiate among two or three mind-sets, when artificial and disturbing ‘noise’ or random variability in inserted into the data table, in a so-called Monte Carlo simulation [17]. The PVI works by creating six questions (six elements from the study), each rated on a two-point scale. The pattern of responses to the six questions generates the information need to assign a person to one of the two (or three) emergent mind-sets, discovered through the Mind Genomics experiment.
The PVI set-up is templated and uses the Mind Genomics output. Table 5 shows the set-up section for the PVI. Not shown are the inputs for the three optional questions about why the PVI respondent travels, and the full set of data from which the PVI will created the algorithm to assign the respondent to a mind-set.
Table 5: The first part of the set-up for the PVI template.
| Question Text | Mindset1 | Mindset2 | Mindset3 | |
| Air1-2021 | ||||
| 1 | Mind Set Name | MS1 Organized | MS2 Fun | |
| 2 | Mind Set Feedback | Look at flight to be organized, safe, efficient | Look at flight as fun and adventure | |
| 3 | Mindset Page | Possible Links | Possible Links | |
| 4 | Mindset Video | Possible Links | Possible Links | |
| 5 | Question to be asked in the PVI | (High Anchor) Seriously consider the airline | (Low Anchor) Not a good enough offer |
Table 5 shows the five initial steps requiring judgment. This information is not automatically provided by the PVI algorithm.
1. The first step requires the researcher to provide the names for the mind-sets.
2. The second step requires the researcher to provide feedback to the respondent who fills out the PVI, with the feedback sent in an email, as well as placed into a database. Respondents are not only interested in the mind-set to which they belong, but want to know about their mind-set, and the other mind-sets.
3. The third step, an optional one, allows the researcher to drive the respondent to a landing page, based upon the mind-set to which the respondent has just been assigned.
4. The fourth step, also optional, optional one, allows the researcher to drive the respondent to a video, based upon the mind-set to which the respondent has just been assigned. Either the respondent is guided to a landing page, to a video, or neither.
5. The fifth step shows the two questions to be used when the respondent rates each of the six elements in the PVI.
Figure 2 shows the actual PVI created for this study from the viewpoint of what the respondent receives to complete. The PVI link is shown below, and is current as of Spring, 2021.
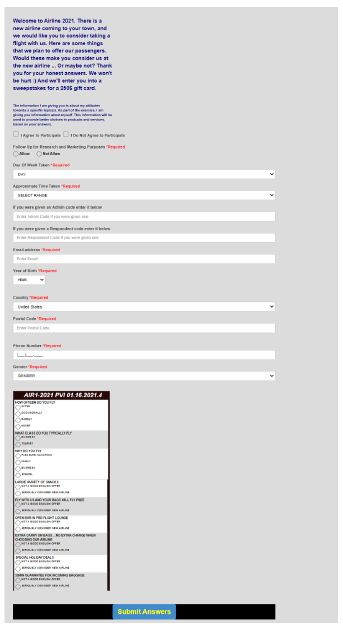
Figure 2: The PVI screen as the respondent see it.
https://www.pvi360.com/TypingToolPage.aspx?projectid=1271&userid=2018
The PVI begins with a short orientation about the project, and then requests the respondent to answer several background questions, such as age, gender, etc.
The second part of the PVI comprises three questions about the respondent as a flier (viz., frequency, reason for flight, passenger class).
The third part of the PVI presents six questions, and the two answers. The order of these six questions varies from respondent to respondent. The pattern of answers assigns a respondent to one of the two mind-sets.
The respondent who participates in the PVI questionnaire devotes approximately 60-90 seconds to the study. The objective is to identify WHO the respondent is, WHAT the respondent thinks or does, and then the mind-set to which the respondent BELONGS. This knowledge can be used to understand what to offer to the person through a designated landing page or video ‘fine-tuned’ to the mind-set, or to understand the mind-sets of people in different populations regarding the topic. It is important to keep in mind that once the mind-set is determined, the data can be used to select the precise words to use in advertising, or for research.
The feedback emerging from the study might well be incorporated into the landing page or video, to which the newly ‘mind-typed’ respondent is directed as part of the search process. The prospect, no longer a respondent in the PVI, would be led to one of the two different landing pages or videos, constructed according to Figures 3 or 4, respectively.
Discussion and Conclusions

Figure 3: The structure of information for the landing page or video: Mind-Set 1: Business Travelers.

Figure 4: The structure of information for the landing page or video: Mind-Set 2: Leisure Travelers.
As presented here, the Mind Genomics method provides a fast, easy to use, inexpensive knowledge creation and knowledge deployment system. The worldview of Mind Genomics differs from the worldview of applied research in that the data can be archived and directly integrated in a bigger database. The coefficients have ratio-scale properties (a 20 is twice as much as a 10), the coefficients are scale-independent since they come from a binary transform, and the coefficients can be stored for comparison across years, topics, and even disciplines. In a sense, the coefficients comprise the basis of a ‘wiki of the mind’.
The important thing to keep in mind is that the data are cognitively rich, and self-evident. That is, there is no tortuous experiment to tease out the way ‘nature works.’ The patterns emerge quite simply. The patterns which emerge are either meaningful or not meaningful. Mind Genomics simply restructures parts of everyday life, giving the information a numerical value based upon the linkage with either a rating question, or an emotion. Instead of those questions, the questions can deal with price, with occasion, and so forth, in which case the results emerging from the cartography would provide the foundation for a ‘cognitive economics,’ or ‘cognitive anthropology.’ Finally, the ability to mind-type many people on many mind-sets provides a unique opportunity to create a true ‘wiki of the mind’, linked with actual people, so that one may understand more fully how the ‘mind type’ manifests itself in the behavior of the everyday.
Acknowledgment
Attila Gere thanks the support of the Premium Postdoctoral Researcher Program of the Hungarian Academy of Sciences.
The authors wish to thank the late Steven Onufrey, Ms. Janna Kaminsky, and Prof. Martin Braun of Queens College for their help on this project, in Mathematics 101, Queens College of the City University of New York.
References
- Neuburger L, Egger R (2020) Travel risk perception and travel behaviour during the COVID-19 pandemic 2020: a case study of the DACH region. Current Issues in Tourism 1-14.
- Nicola M, Alsafi Z, Sohrabi C, Kerwan A, Al-Jabir A et al. (2020) The socio-economic implications of the coronavirus pandemic (COVID-19): A review. International Journal of Surgery 78: 185-193.
- Wilson ME, Chen LH (2020) Re-starting travel in the era of COVID-19: preparing anew. Journal of Travel Medicine 27: 108.
- Choi K, Wang Y, Sparks B (2019) Travel app users’ continued use intentions: it’sa matter of value and trust. Journal of Travel & Tourism Marketing 36: 131-143.
- Lu J, Mao Z, Wang M, Hu L (2015) Goodbye maps, hello apps? Exploring the influential determinants of travel app adoption. Current issues in Tourism 18: 1059-1079.
- Cheyne J, Downes M, Legg S (2006) Travel agent vs internet: What influences travel consumer choices? Journal of Vacation Marketing 12: 41-57.
- Andrade EB, Ariely D (2009) The enduring impact of transient emotions on decision making. Organizational Behavior and Human Decision Processes 109: 1-8.
- Levin LA, Langer KM, Clark DG, Colquhoun TA, Callaway JL et al. (2012) Using mind genomics® to identify essential elements of a flower product. Horticultural Science 47: 1658-1665.
- Moskowitz H, Silcher M, Beckley J, Minkus-McKenna D, Mascuch T (2005) Sensory benefits, emotions and usage patterns for olives: using Internet-based conjoint analysis and segmentation to understand patterns of response. Food Quality and Preference 16: 369-382.
- Moskowitz HR (2012) ‘Mind genomics’: The experimental, inductive science of the ordinary, and its application to aspects of food and feeding. Physiology & Behavior 107: 606-613. [crossref]
- Wilkinson M (2013) Testing the null hypothesis: The forgotten legacy of Karl Popper? Journal of Sports Sciences 31: 919-920. [crossref]
- Baker BO, Hardyck CD, Petrinovich LF (1966) Weak measurements vs. strong statistics: An empirical critique of SS stevens’ proscriptions NN statistics. Educational and Psychological Measurement 26: 291-309.
- Joshi A, Kale S, Chandel S, Pal DK (2015) Likert scale: Explored and explained. Current Journal of Applied Science and Technology 396-403.
- Dubes, Richard, Anil K. Jain (1980) Clustering methodologies in exploratory data analysis. Advances in Computers 19: 113-228.
- Brower M (2017) Claritas (formerly Nielsen) Segmentation and Market Solutions. The Charleston Advisor 18: 15-20.
- Zhang Y, Mohammadian A (2006) An Exploratory Analysis of the Household Travel Behavior and Lifestyle Choices. Applications of Advanced Technology in Transportation 665-670.
- Rubinstein RY, Kroese DP (2016) Simulation and the Monte Carlo method. John Wiley & Sons 10.