Monthly Archives: December 2020

Current Utility of Chimeric Antigen Receptor T-Cell Therapy in Non-Small Cell Lung Cancer

DOI: 10.31038/CST.2020542

Abstract

Although the utilization of chimeric antigen receptor (CAR) T-cells for the treatment of non-small cell lung cancer (NSCLC) has traditionally been severely limited, numerous recent technological advancements have allowed for rapid progression of the field in various forms. With the maturation of techniques such as genotyping, immunohistochemistry, large-scale antibody production, and ultra-high throughput screening among many others, the production of novel NSCLC-focused CAR T-cells encompassing a wide array of structural designs and functions has yet to undergo a transition comparable to that of the previous decade. Indeed, the number and quality of modern antigens, antibodies, short-chain variable fragment (scFv) sequences, ligands, and inhibitors available for designing and bioengineering CARs have allowed for a markedly increased understanding of the mechanisms and processes necessary for the successful production of a CAR T-cell line. Most notably, advances in antigen understanding, targeting, and manipulation, CAR module integration, interaction, and compatibility, and immune cell modulation are three approaches currently at the focal point of NSCLC-focused CAR T-cell production. Herein, we briefly discuss the current status of each of these three strategies; novel targeting of NSCLC tumor-specific antigens, bispecific and physiological CAR T-cells, and inhibitory CAR T-cells, in the ongoing development of viable NSCLC management options.

Keywords

Non-small cell lung cancer, Chimeric antigen receptor, T-cell, Short-chain, Variable fragments, Antigen specificity [200]

Introduction

Despite the numerous modern-day treatments, therapies, and procedures, lung cancer continues to claim more lives than any other cancer, accounting for 23% (72,500/year) and 22% (63,220/year) of all cancer deaths in males and females, respectively, in the United States [1]. Additionally, while other forms of cancer, such as Ewing tumor, transformed from a 0% to a 90% 5-year survival rate between 1970 and 1994, lung cancer, from 1973-2000, only saw a 10.7% to 17.0% increase in 5-year survival rate despite the addition of several modalities of treatment to the physician’s arsenal [2-4]. Indeed, lung cancer, in particular non-small cell lung cancer (NSCLC), which comprises 85% of all lung cancer cases, has long eluded therapeutic interventions largely due to the lack of identified and targetable tumor-specific motifs that allow for sparing of host tissue from simultaneous destruction in addition to adequate tumor stroma penetration, solid tumor T-cell infiltration, and generation of an immune response capable of overcoming the tumor’s immunosuppressive microenvironment [5].

With the advancement of immunotherapeutic techniques and approaches, however, NSCLC treatment began to dramatically evolve and, from 2000-2014, 5-year survival rate had increased from 17.0% to 21.2%, or at a rate that is 29% faster than that generated through progress between 1973 and 2000 [2-4]. These new-age immunotherapeutic techniques and approaches, namely adoptive cell therapy (ACT, mainly referring to chimeric antigen receptor T-cell therapy, CAR T-cells), general/nonspecific immunotherapeutic approaches (e.g complement system-targeted approaches), monoclonal antibodies, oncolytic cancer viruses, and cancer vaccines, have all made significant progress since their introduction with CAR T-cells of the ACT subtype recently making very significant advancements for the first time in solid tumor therapy since they were first developed by Kuwana et al. in 1987 [6].

Indeed, although CAR T-cells were first produced in 1987 by Kuwana et al., it was not until 2013 that Feng et al. conducted the first clinical trial to study the safety and possibility of using CAR T-cells as immunotherapy for patients with NSCLC in which 2 out of 11 patients displayed partial response (PR) and 5 out of 11 patients had stable diseases (SD) [7]. Feng et al. used an endothelial growth factor receptor-binding (EGFR) single chain fragment variable (scFV) sequence to generate an anti-EGFR scFv-CD137-CD3z CAR which was then cloned into the lentiviral backbone pWPT which produced a plasmid that was subsequently transfected into patient CAR T cells [7]. In addition to the aforementioned results, this study also paved the way for establishing acceptable safety and toxicity outcomes of CAR T-cell therapy in that the most common adverse reactions were grades 1-2 skin irritation, nausea, vomiting, dyspnea, serum amylase elevation, and hypotension with one patient experiencing a cytokine level fluctuation-independent transient grade 3-4 serum lipase elevation [7].

Since Feng et al. conducted their study, numerous other groups have taken on to not only developing their own CAR T-cells, but also to modifying the molecular components of the CAR such that the cells demonstrate higher potency while simultaneously inducing fewer and less severe toxic effects [8]. In this review, we aim to summarize the current status of CAR T-cell immunotherapy and its modified derivative approaches with respect to NSCLC treatment. Although the use of CAR T-cells has yet to mature into a first line NSCLC treatment, recent developments have greatly increased the potential to effectively implement CAR T-cells in the targeting of tumor antigens and subsequent cytotoxic tumor eradication. Following is a description of newly developed CAR T-cell approaches and modifications along with a curation of newly identified, NSCLC-specific target antigens and their adoption into CAR T-cells.

Novel Targeting of NSCLC Tumor-Specific Antigens

Selectively targeting a tumor-specific antigen is one of the largest hurdles CAR T-cell therapy must overcome in order to effectively causes solid tumor regression, such as is the case in NSCLC, thus, until the recent surge in both antigen identification and antigen-specific targeting molecular candidates, development of CAR T-cells for the use in NSCLC had been largely stagnant [9-11]. For example, K1, the first monoclonal antibody isolated with affinity for mesothelin, was isolated in 1992, however, the potential to utilize it as an immunotherapeutic or diagnostic tool did not present until 2007 when Ho et al. both quantitatively and qualitatively characterized its expression in both healthy and NSCLC tissue through a combination of reverse transcription-polymerase chain reaction (RT-PCR), immunoblotting, immunohistochemistry, and flow cytometry [12-14]. In characterizing its expression, Ho et al. determined mesothelin to be a therapeutic target candidate as its expression was significantly elevated in NSCLC with the mesothelin precursor protein presenting in 82% of lung adenocarcinomas and the mature form in 55% [13].

These advancements catalyzed the field’s understanding of mesothelin expression as further studies, such as Kachala et al.’s, found an association between mesothelin expression and reduced overall survival (OS) and recurrence free survival (RFS) rates, indicating a significant potential for mesothelin to be targeted by a CAR T-cell [15]. Multivariate analysis following adjustment for previously identified risk factors revealed an association between mesothelin expression and both reduced OS and RFS (HR = 1.78; 95% CI, 1.26-2.50; P < 0.01 and HR = 1.67; 95% CI, 1.21-2.27; P < 0.01, respectively) which presented in vitro in the form of increased cell proliferation, invasion, and migration [15]. Furthermore, their cohort study (n = 1,209) analyzing tissue microarrays of tumors and normal lung tissue found mesothelin expression in 69% of lung adenocarcinomas with 20% of patients expressing high levels while normal lung tissue showed no mesothelin expression, thus further implicating mesothelin as a CAR T-cell target with potential for reduced off-target toxicity [15].

In a similar manner, the membranous-bound prostate stem cell antigen (PSCA) and mucin-1 (MUC1) proteins were also found to be associated with NSCLC through protein expression studies. In the case of PSCA, Kawaguchi et al. investigated its expression in NSCLC through the analysis of primary tumors (n = 97) and metastatic lymph nodes (n = 21) using immunohistochemistry and found elevated PSCA expression in 94 out of 97 primary tumors and in all metastatic lymph nodes [16]. In addition, Kawaguchi et al. found a positive correlation between PSCA expression level and advanced pathological T-factor and stage (T1 vs. T2-T4, P = 0.014; Stage 1 vs. Stage II-IV, P = 0.029) along with a significantly higher disease-free survival (DFS) rate for patients with low PSCA expression, overall insinuating a potentially pathological function of PSCA in NSCLC and its viability as a CAR T-cell target [16]. Situ et al. conducted a similar study with MUC1 through the analysis of 178 NSCLC specimens via immunohistochemistry and found elevated MUC1 expression, as defined via immunohistochemical scoring and subsequent receiver operating characteristic curve analysis, in 74.1% of NSCLCs along with associated worse OS and DFS (P = 0.011 and P = 0.008, respectively) [17]. Through multivariate analysis, MUC1 was confirmed as an independent prognostic factor for NSCLC in terms of both OS and DFS (P = 0.008 and P = 0.004, respectively), further suggesting MUC1’s role as an adverse indicator of NSCLC and thus as a potential target antigen [17].

Less than a decade later, Wei et al. investigated the significance of MUC1 and PSCA’s elevated levels in NSCLC and made second generation MUC1-specific CAR T-cells and PSCA-specific CAR T-cells consisting of short-chain variable fragments (scFv) derived from humanized 1G8 anti-PSCA and anti-MUC1 HFMG2 antibodies coupled with signaling domains from CD28 and CD3z [18]. Lentiviral vectors encoding the CARs were transfected into pre-activated human T cells and final expression of anti-MUC1 and anti-PSCA CAR in T cells was confirmed via RTPCR analysis of the scFv sequences. Preliminary in vitro data showed significant killing of both PSCA+ and MUC1+ cell lines and confirmed PSCA-CAR and MUC1-CAR T cell specificity [18]. In vivo data generated using a PDX mouse model originating from a PSCA+, MUC1- patient tumor demonstrated significant suppression of NSCLC tumor mass growth following PRCA-CAR T-cell therapy and no significant effect in mice treated with MUC1-CAR T cells alone [18]. When MUC1 and PSCA-CAR T-cells were used to treat a PDX mouse model generated from a PSCA+, MUC1+ NSCLC patient tumor, both treatments resulted in dramatically inhibited tumor growth [18]. Furthermore, when both MUC1 and PSCA-CAR T-cells were co-administered, tumor inhibition, in the form of mass, was reduced significantly more than either MUC1 or PSCA-CAR T-cell treatment (P = 0.001 and P = 0.01, respectively) [18].

Vascular endothelial growth factor (VEGF), an angiogenic factor, has also been identified as a potential CAR T-cell target and underwent initial investigation based on the successful application of platinum-based chemotherapeutics in combination with a VEGF-A-specific mAb in providing an overall survival benefit for advanced disease NSCLC patients [19,20]. In their retrospective study, Bonnesen et al. conducted immunohistochemical studies on 102 NSCLC patient tissue samples by incubating the tissues in monoclonal antibodies to both VEGF-A and its receptor, vascular endothelial growth factor receptor 2 (VEGFR2), and assessed semi-quantitatively via intensity-percentage estimation and through Kaplan-Meier survival curves for evaluation of the proteins’ expression-prognosis relationship [20]. Analysis showed 98 out of 102 samples expressing VEGF-A and 95 out of 102 samples expressing VEGFR2 with overall indication for poor prognosis in co-expression as shown by Seto et al. and Koukourakis et al but not according to Bonnesen et al.’s analysis [20-22].

Throughout their studies, Chinnasamy et al. utilized the ubiquitous appearance of VEGFR2 in tumor vasculature and to develop a VEGFR2-CAR T-cell line that showed the ability to produce CAR T cells with not only the capacity to traffic to solid tumors, but also to operate in concert with exogenous interleukin 2 (IL-2) to enhance the immune system’s ability to overcome the immunosuppression caused by the tumor microenvironment (TME) [23]. Building off of these results, Zhang et al. devised a method to engineer a CAR T-cell with inducible protein expression via IL-12 composite promoter-containing binding motif mediated through a TCR-activated nuclear factor [24]. IL-12 was chosen due to its ability to act as a proinflammatory cytokine that mediates both adaptive and innate immune responses [25]. In a subsequent study, the group tested their VEGFR2-CAR T-cells on a five different solid tumors and found that, when the tumors expressed VEGFR2, only those treated with the IL-12-producing VEGFR2-CAR T-cells were effective in mediating tumor regression and could do so without the need for any exogenous IL-2 administration as previously required [25].

Zhang et al. also focused on growth factors, however, they instead investigated EGFR variant III (EGFRvIII), a tumor-specific, mutated version of EGFR which was first documented to greatly enhance tumorigenic capacity by Nishikawa et al. in 1994 [26,27]. Zhang et al. utilized a third-generation CAR designed by subcloning EGFRvIII single chain antibody, CD8a hinge, CD28 and 4-1BB costimulatory molecules, and CD3z glycoprotein into a pMSCV plasmid and subsequent transfection of the virus-packaging cell line [27]. Anti-tumor activity of the EGFRvIII-CART T-cell line was evaluated in vitro which revealed EGFRvIII-CAR T-cells co-cultured with EGFRvIII-expressing A549 cells proliferate at a much higher rate than the control group, suggesting a greater ability of the cell line to express and secrete its cytotoxic factors such as perforin, granzyme B, IFNg, and TNFa [27]. Subsequent in vivo testing in a human A549 metastatic mouse model of lung cancer revealed that, 90 days following treatment, EGFRvIII-CAR T-cell treatment significantly reduced the number of metastatic lesions formed and increased the OS to 62.5% from 0% as observed in the control group [27].

Bispecific and Physiological Chimeric Antigen Receptor T-cells

While advancements in antigen identification and modulation allowed for multiple expressed proteins to become CAR T-cell targets in the treatment of NSCLC, the risk of on-target toxicity persists as the aforementioned tumor-associated antigens (TAA) are rarely completely exclusive to malignant tissue and can frequently be found in lower numbers as a part of normal tissue. For example, with the advent of second generation CAR T-cells came an increased potency, and thus, even antigens expressed at low levels outside of the tumor were present in sufficient levels to cause an autoimmune-induced on-target toxic effect in the form of a cytokine storm such as was the case in a patient undergoing anti-ERBB2 CAR T-cell therapy for metastatic colon cancer [28]. In order to mitigate the potential for on-target toxicity, some groups, such as Lanitis et al., have turned to engineering bispecific tandem CAR T-cells in which the activating CAR component is dissociated from the costimulatory signal CAR component with the intention of requiring both undergoing independent stimulation reactions prior to any cytotoxic effect from the CAR T-cell occurring [29]. The concept behind this approach is such that the two antigens required to stimulate both the activating component and costimulatory component can be selected to both primarily reside on tumor tissue and as two targeted tumor antigens are an exceedingly rare occurrence on normal tissue, requiring the same CAR T-cell to interact with both dramatically relieves the on-target toxic burden [29]. Lanitis et al. developed one of the first bispecific tandem CAR T-cell line, opting to target mesothelin and a-folate receptor (FRa) as the group had previously constructed applicable lentiviral vector backbone constructs [30]. The anti-mesothelin CAR was composed of a P4 scFv linked to a CD8a hinge with transmembrane domain and connected solely via CD3z signaling component while the costimulatory anti-FRa CAR was composed of the MOv-19 scFv, a CD8a hinge, and a CD28 transmembrane region and intracellular motif [30]. In vivo mouse studies demonstrated significantly more potent inhibition of tumor growth in the bispecific tandem CAR T-cell treatment group than anti-mesothelin CAR alone on tumors that coexpressed the two TAAs of interest (P = 0.028) while simultaneously displaying much lower activity against cells displaying only one TAA of interest (P = 0.0045) [30].

Kloss et al. employed a similar approach using prostate-specific membrane antigen (PSMA) and PSCA and encountered similar phenomena as Lanitis et al.; treatment with bispecific cells in tissues expressing both TAAs of interest resulted in significantly more potent inhibition of tumor growth than single TAA-targeting CAR T-cells (P = 0.01), however, their anti-PSMA and anti-PSCA bispecific CAR T-cell did not spare tissues expressing single TAAs of interest [31]. This was attributed to utilizing two highly efficient CARs, thus, upon switching to a less specific scFv for PSCA, Lz1, Kloss et al. demonstrated simultaneous eradication of tumors coexpressing both TAAs and sparing of cells expressing a single TAA of interest (P = 0.05 and P = 0.05) [31].

One of the first groups to apply bi-specific physiologic CAR T-cells to NSCLC, Chu et al., did so by developing an anti-fluorescein-5-isothiocyanate (FITC) CAR to indirectly target FRa and FRb through the direct targeting of a bispecific ligand composed of FITC bound to folate to function as a bridge between the anti-FITC CAR and FRa/b, acting as a “switch” that induces the formation of a pseudoimmunological synapse [8]. Chu et al. tested the efficacy of their anti-FITC CAR T-cells in combination with folate-FITC ligand to determine whether it can redirect the anti-FITC CAR T cells to an FRa-expression A549 cell line and, through the measurement of lactate dehydrogenase (LDH) released into culture media, determined a highly potent, cytolytic reaction had taken place (EC50 = 0.094 +- 0.116 nM) against the A549-FRa cells while the same cells in the presence of control CAR T-cells failed to present any signs of cytolytic activity [8]. Additionally, Che et al.’s bispecific ligand also showed a dose-titratable, highly potent cytolytic activity towards FRb-positive cells, thus suggesting that a single CAR T-cell can not only target tumor cells, but also the FRb-expression tumor-associated macrophages in NSCLC [8].

Next Generation CAR T-Cells: Inhibitory Chimeric Antigen Receptors

A younger modality of CAR T-cell modification and effect modulation revolves around altering the endogenous T-cell inhibitory pathways in order to reduce potential CAR toxicity or broaden cell applicability and enhance anti-tumor efficacy [32]. An application of iCARs with strong prospects for the treatment of NSCLC constructed by Riese et al. in which a negative regulator of the T-cell receptor (TCR) signaling pathway was deleted with the intention of inhibiting an inhibitor to increase signaling efficiency [33]. Riese et al. focused on two highly expressed isoforms of diacylglycerol kinase (dgk), dgka and dgkz, which function to metabolize diacyl glycerol (DAG) such that downstream RAS and extracellular signal-regulated kinase (ERK) are limited in activation and reduce the stimulation of nuclear transcription factors [33,34]. The augmentation of TCR signal transduction is hypothesized to play a major role in overcoming CD8+ T-cell inhibition by the TME and potentially lead to a more robust anti-tumoral response [33]. Dgkz deficient mice were challenged with Listeria-ova in order to generate activated dgkz-deficient CD8+ T-Cells which were subsequently transferred to tumor-bearing mice and showed significantly reduced tumor size (P = 0.05) and increased persistence of effector cells, however, tumors were not fully eradicated, thus indicating treatment via dgkz knockout is not sufficient individually [33]. As a result, additional modification resulted in an anti-mesothelin CAR transduction into the activated CD8+ T-cells which demonstrated enhanced cytotoxicity in dgkz single knock-out T cells [33]. These effects were profoundly increased in dgkz, dgka double knock-out (DKO), anti-mesothelin CAR transduced CD8+ T-cells (P = 0.0001) along with augmentation of ERK signaling, CD 69 expression, FASL and TRAIL expression, and TGFb resistance [33]. Lastly, DKO anti-mesothelin CAR T-cells were subcutaneously coinfected with mesothelin-expressing TC1 cells, a murine NSCLC, with tumors excised following a 10-day incubation period, the results of which suggested significant DKO anti-mesothelin CAR T-cell efficacy against the mesothelin-expressing TC1 NSCLC cell line [33].

Conclusion

The application of CAR T-cells for the treatment of solid tumors, in particular NSCLC, is a quickly developing paradigm and its many recent successes indicate it to be an increasingly promising field. As discussed, CAR T-cells, in a very short duration of time, have made tremendous progress in a field that merely a decade ago seemed utterly out of reach through the development and evolution of novel tumor-specific antigen targeting, bispecific and physiological CARs, and iCARs. While progress has been extraordinarily fast-paced and widespread, novel and ongoing investigations must continue not only in the form of developing CAR T-cells, but also bettering our understanding of the tumor microenvironment in NSCLC and the underlying mechanisms so as to develop survival prolonging techniques via a multi-faceted approach.

References

  1. Rebecca L. Siegel, Kimberly D. Miller, Ahmedin Jemal (2020) Cancer statistics. CA: A Cancer Journal for Clinicians 70: 7-30.
  2. Guido Pastore, Maria Luisa Mosso, Fabrizio Carnevale, Luca Cordero di Montezemolo, Marco Forni, et al. (2001) Survival trends of childhood cancer diagnosed during 1970-1994 in Piedmont, Italy: A report from the Childhood Cancer Registry. Med Pediatr Oncol 36: 481-488.
  3. Janakiraman Subramanian, Thomas Regenbogen, Gayathri Nagaraj, Alex Lane, Siddhartha Devarakonda, et al. (2013) Review of Ongoing Clinical Trials in Non–Small-Cell Lung Cancer: A Status Report for 2012 from the ClinicalTrials.gov Web Site. Journal of Thoracic Oncology 8: 860-865. [crossref]
  4. Claudia Allemani, Tomohiro Matsuda, Veronica Di Carlo, Rhea Harewood, Melissa Matz, et al. (2018) Global surveillance of trends in cancer survival 2000-14 (CONCORD-3): Analysis of individual records for 37 513 025 patients diagnosed with one of 18 cancers from 322 population-based registries in 71 countries. The Lancet 391: 1023-1075. [crossref]
  5. Nan Chen, Xiaoyu Li, Navin Chintala K, Zachary Tano E, Prasad Adusumilli S (2018) Driving CARs on the uneven road of antigen heterogeneity in solid tumors. Curr Opin Immuno 51: 103-110. [crossref]
  6. Yoshihisa Kuwana, Yoshihiro Asakura, Naoko Utsunomiya, Mamoru Nakanishi, Yohji Arata, et al. (1987) Expression of chimeric receptor composed of immunoglobulin-derived V resions and T-cell receptor-derived C regions. Biochemical and Biophysical Research Communications, 149: 960-968. [crossref]
  7. Kaichao Feng, Yelei Guo, Hanren Dai, Yao Wang, Xiang Li, et al. (2016) Chimeric antigen receptor-modified T cells for the immunotherapy of patients with EGFR- expressing advanced relapsed/refractory non-small cell lung cancer. Sci China Life Sci 59: 468-479. [crossref]
  8. Wenqi Chu, Yixiong Zhou, Qi Tang, Min Wang, Yongjia Ji, et al. (2018) Bi-specific ligand-controlled chimeric antigen receptor T-cell therapy for non-small cell lung cancer. Biosci Trends 12: 298-308. [crossref]
  9. Stefan Kiesgen, Leonardo Chicaybam, Navin Chintala K, Prasad Adusumilli S (2018) Chimeric Antigen Receptor (CAR) T-Cell Therapy for Thoracic Malignancies. J Thorac Oncol 13: 16-26. [crossref]
  10. Masha Zeltsman, Jordan Dozier, Erin McGee, Daniel Ngai, Prasad Adusumilli S (2017) CAR T-cell therapy for lung cancer and malignant pleural mesothelioma. Transl Res 187: 1-10. [crossref]
  11. Diana Darowski, Sebastian Kobold, Christian Jost, Christian Klein (2019) Combining the best of two worlds: Highly flexible chimeric antigen receptor adaptor molecules (CAR- adaptors) for the recruitment of chimeric antigen receptor T cells. MAbs 11: 621-631. [crossref]
  12. Kai Chang, Ira Pastan, Mark Willingham C (1992) Isolation and characterization of a monoclonal antibody, K1, reactive with ovarian cancers and normal mesothelium. Int J Cancer 50: 373-381. [crossref]
  13. Ho M, Bera TK, Willingham MC, Onda M, Hassan R, et al. (2007) Mesothelin Expression in Human Lung Cancer. Clinical Cancer Research 13: 1571-1575. [crossref]
  14. Nelson Ordóñez G (2003) Application of Mesothelin Immunostaining in Tumor Diagnosis. The American Journal of Surgical Pathology 27: 1418-1428. [crossref]
  15. Kachala SS, Bograd AJ, Villena-Vargas J, Suzuki K, Servais EL, et al. (2014) Mesothelin Overexpression Is a Marker of Tumor Aggressiveness and Is Associated with Reduced Recurrence-Free and Overall Survival in Early-Stage Lung Adenocarcinoma. Clinical Cancer Research 20: 1020-1028. [crossref]
  16. Takeshi Kawaguchi, Masayuki Sho, Takashi Tojo, Ichiro Yamato, Takeo Nomi (2010) Clinical Significance of Prostate Stem Cell Antigen Expression in Non-small Cell Lung Cancer. Japanese Journal of Clinical Oncology 40: 319-326.
  17. Dongrong Situ, Jian Wang, Yun Ma, Zhihua Zhu, Yi Hu, et al. (2011) Expression and prognostic relevance of MUC1 in stage IB non-small cell lung cancer. Med Oncol 28: 596-604. [crossref]
  18. Xinru Wei, Yunxin Lai, Jin Li, Le Qin, Youdi Xu, et al. (2017) PSCA and MUC1 in non- small-cell lung cancer as targets of chimeric antigen receptor T cells. Oncoimmunology 6: 1284722. [crossref]
  19. Alan Sandler, Joan H Schiller, David H Johnson, Rober Gray, Michael Perry C, et al. (2006) Paclitaxel–Carboplatin Alone or with Bevacizumab for Non–Small-Cell Lung Cancer. N engl J med 355: 2542-2540. [crossref]
  20. Barbara Bonnesen, Helle Pappot, Julie Holmstav, Birgit Guldhammer Skov (2009) Vascular endothelial growth factor A and vascular endothelial growth factor receptor 2 expression in non-small cell lung cancer patients: Relation to prognosis. Lung Cancer 66: 314-318. [crossref]
  21. Takashi Seto, Masahiko Higashiyama, Hiroko Funai, Fumio Imamura, Kazutsugu Uematsu, et al. (2006) Prognostic value of expression of vascular endothelial growth factor and its flt-1 and KDR receptors in stage I non-small-cell lung cancer. Lung Cancer 53: 91-96. [crossref]
  22. Michael I Koukourakis, Alexandra Giatromanolaki, Philip E Thorpe, Rolf A Brekken, Efthimios Sivridis, et al. (2000) Vascular Endothelial Growth Factor/KDR Activated Microvessel Density versus CD31 Standard Microvessel Density in Non-Small Cell Lung Cancer. Tumour Bilogy
  23. Dhanalakshmi Chinnasamy, Zhiya Yu, Marc Theoret R, Yangbing Zhao, Rajeev Shrimali K, et al. (2010) Gene therapy using genetically modified lymphocytes targeting VEGFR-2 inhibits the growth of vascularized syngenic tumors in mice. J Clin Invest 120: 3953-3968. [crossref]
  24. Ling Zhang, Sid Kerkar P, Zhiya Yu, Zhili Zheng, Shicheng Yang, et al. (2011) Improving Adoptive T Cell Therapy by Targeting and Controlling IL-12 Expression to the Tumor Environment. Molecular Therapy 19: 751-759. [crossref]
  25. Chinnasamy D, Yu Z, Kerkar SP, Zhang L, Morgan RA, et al. (2012) Local Delivery of lnterleukin-12 Using T Cells Targeting VEGF Receptor-2 Eradicates Multiple Vascularized Tumors in Mice. Clinical Cancer Research 18: 1672-1683. [crossref]
  26. Nishikawa R, Ji XD, Harmon RC, Lazar CS, Gill GN, et al. (1994) A mutant epidermal growth factor receptor common in human glioma confers enhanced tumorigenicity. Proceedings of the National Academy of Sciences 91: 7727-7731.
  27. Zhao Zhang, Jun Jiang, Xiaodong Wu, Mengyao Zhang, Dan Luo, et al. (2019) Chimeric antigen receptor T cell targeting EGFRvIII for metastatic lung cancer therapy. Front Med 13: 57-68, February. [crossref]
  28. Richard Morgan A, James Yang C, Mio Kitano, Mark Dudley E, Carolyn Laurencot M, et al. (2010) Case Report of a Serious Adverse Event Following the Administration of T Cells Transduced With a Chimeric Antigen Receptor Recognizing ERBB2. Molecular Therapy 18: 843-851. [crossref]
  29. Eugene A Zhukovsky, Richard J Morse, Marcela V Maus (2016) Bispecific antibodies and CARs: Generalized immunotherapeutics harnessing T cell redirection. Current Opinion in Immunology 40: 24-35. [crossref]
  30. Lanitis E, Poussin M, Klattenhoff AW, Song D, Sandaltzopoulos R, et al. (2013) Chimeric Antigen Receptor T Cells with Dissociated Signaling Domains Exhibit Focused Antitumor Activity with Reduced Potential for Toxicity In Vivo. Cancer Immunology Research 1: 43-53. [crossref]
  31. Christopher Kloss C, Maud Condomines, Marc Cartellieri, Michael Bachmann, Michel Sadelain (2013) Combinatorial antigen recognition with balanced signaling promotes selective tumor eradication by engineered T cells. Nat Biotechnol 31: 71-75. [crossref]
  32. Fan Zou, Lijuan Lu, Jun Liu, Baijin Xia, Wanying Zhang, et al. (2019) Engineered triple inhibitory receptor resistance improves anti-tumor CAR-T cell performance via CD56. Nat Commun 10: 4109.
  33. Riese MJ, L-C Wang S, Moon EK, Joshi RK, Ranganathan A, et al. (2013) Enhanced Effector Responses in Activated CD8+ T Cells Deficient in Diacylglycerol Kinases. Cancer Research 73: 3566-3577. [crossref]
  34. Daniel Ritt A, María Abreu-Blanco T, Lakshman Bindu, David Durrant E, Ming Zhou, et al. (2016) Inhibition of Ras/Raf/MEK/ERK Pathway Signaling by a Stress-Induced Phospho-Regulatory Circuit. Molecular Cell 64: 875-887. [crossref]
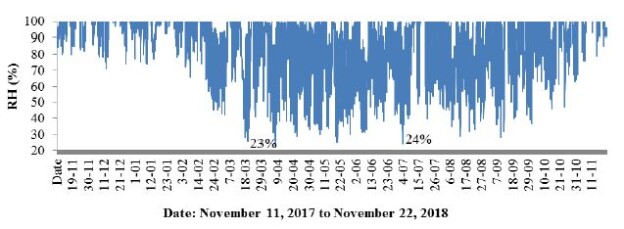
fig 7

Long-Term Conductivity Measurements as a Source of Knowledge about Tree Life Cycles

DOI: 10.31038/GEMS.2020223

Abstract

The underlying physiological processes for tree activities in winter are still unclear, and changes occurring during the growing season have been observed mainly on the basis of tedious phenological research. Devices, constructed and tested in a 3-year cycle by the Department of Forest Sites and Ecology, allows for tracking the activity of a tree throughout the year by using integrated measurements of conductivity, temperature and air humidity. That can be tracked online (see web site https://thingspeak.com/channels/698713). Observations on the impacts to four tree species (Acer pseudoplatanus, Alnus glutinosa, Carpinus betulus, Fagus sylvatica), were made for when temperatures fall below 0°C, during the spring activity phase, during the maximum of summer activity and during the autumn decline in activity. Thanks to the conductivity measurement method, tracking the activity of the trees year-round is easy. The sensors showed that the trees were active (although at a low level) during the winter; the real dormancy period was noted when the air temperature dropped below – 5.7 Co. For some temperature values, the conductivity is inhibited both in winter and in summer. The described method in this paper of measuring the conductivity of a tree may be very useful for future research related to trees, phenology, climate change and other ecological research. It can also be used as a utility tool that may, for example, be of interest to producers of maple syrup, as it indicates the moment when trees enter the phase of its most intensive production.

Keywords

Conductivity, Tree phenology, Winter dormancy period

Introduction

Climate change and its causes and consequences are one of the most important themes of modern natural sciences. These changes are most visible, among others, in phenological studies. Phenology (the science that measures the timing of life cycle events for plants and animals) is strongly controlled by climate and has consequently become one of the most reliable bioindicators of ongoing climate change [1]. Equally, due to the climate change, over the past two decades there has been a renewed interest in the overall impact of phenological shifts in forest ecosystems, [2] but sometimes the beginning (or end) of a season or a phenophase is difficult to define[3]. Unambiguously determining the factors trigging phenological phases is even more difficult. Some authors have suggested that the life cycle phases of plants, such as bud bursting, leafing or flowering are linked to the chilling period length [46], while others are linked to the photoperiod, [7-10] temperature of the previous autumn [11], nutrient availability [12], precipitation [13,14], humidity [15] or light regime [16]. An overwhelming number of phenological studies have confirmed that temperature is the main driver for phenological events, [17] while all other factors are supposed to capture some of the remaining, unexplained variance. The underlying physiological processes for this temperature sensitivity remain unclear, and temperature sensors for budburst have not yet been found [18,19]. Generally, high volumes of data have indicated a prolonged vegetative period in plants growing in a temperate climate, [2023] and the changes in the development phases of trees during the growing season are widely understood, but our knowledge of trees entering the winter dormancy period is limited. The aim of the current paper was to show the potential of using conductivity as a measure of tree activity during a long-term period in an ecological approach. Additionally, the following hypotheses were set for the current research study:

  • Trees species differ in their measured conductivity values,
  • Conductivity can be a measure of differences in the daily and seasonal activities of trees,
  • Trees can remain active during the “dormancy period”,
  • Conductivity can be a useful tool in determining the correlation between tree activities and factors such as temperature and humidity.

The electrical conductivity of any medium is proportional to the number and mobility of its electrical charges (i.e., ions, dissociated molecules, and surface absorbed ions). During the conduction of an electric current, the ionic charges do not move and the passage of the electric current (including in plant tissues) is achieved by transferring the induced electromagnetic field between neighbouring ions, regardless of whether they are free or attached to the membranes or cell wall surfaces. The path of the current in healthy tissues is through channels of the cell walls, resulting in a current that is related to impedance due to the separation of charges (ions) at tissue boundaries [24]. The existing methods for measuring the flow of fluids in trees illustrate the water management of plants and determine the intensity of transpiration of a single tree. Currently, the most common method of measuring the flow of fluids in trees is the thermal method, which uses the measurement of the water flow rate in the tree trunk. This is called “sap-flow,” which consists of delivering a single or long-lasting heat pulse to the stem and measuring the temperature of the fluid at a short distance over the heated trunk zone. The use of sap-flow techniques requires the use of an energy-consuming heating element, which limits the use of these devices over a long period in most field conditions. The individual sap-flow methods also have limitations in capturing slow and fast flows [25]. Sap flow sensors are a low-cost and practical option to measure tree transpiration. However, there remain significant errors with theoretical and empirical equations that aim to directly estimate transpiration from thermal based measurements. The heat pulse velocity based methods are excellent in correlating relative changes in transpiration rates but exhibit large errors in estimating amounts of transpiration. Where whole plant water use or the amount of transpiration is of primary interest, sap flow sensors must be calibrated [26] and due to some model assumptions, it does not reflect the daily and seasonal activity of trees. Trees in temperate climate zones, due to environmental and mainly climatic factors, undergo periods of active growth and rest [27]. Tree activity is regulated by biochemical processes that change the chemical composition of the cellular cytoplasm and permeability (fluidity) of cell membranes [28]. These processes are also reflected in the sap-flow and the changing rate of its flow both throughout the day and the whole year, in connection with the regulation of the water management of the plant. Thanks to their anatomical structure, trees can transport water with mineral salts (xylem vessels) and nutrients (phloem vessels). The transport of electrolyte juices (a substance capable of conducting electricity) is a feature that only living organisms possess, and the transport intensity depends on the activity of a given tree. Dry wood is a dielectric and does not conduct electricity. Using these properties, the Department of Forest Sites and Ecology (Poznań University of Life Sciences, Faculty of Forestry) has constructed a set of sensors (ConTeH) that automatically register the tree conductivity, temperature and humidity at an assumed time interval. Following long term testing, sensors were first placed in beech and sycamore trees, and then in alder and hornbeam trees in natural conditions. The aim of the paper was to show the potential of using conductivity measurements as the method of registering the daily and seasonal activity and the method’s effects on environmental and ecological studies. This study’s results should help in understanding the environmental factors trigging tree phenology and may possibly assist in increasing the ease and precision of phenology research. Sanders-DeMott and Templer [29] wrote that “the influence of winter climate change on ecosystem responses to warming may have important implications for our understanding of terrestrial ecosystem function in a changing climate”, called “for the integration of established winter climate change methods with ecosystem-scale warming approaches in regions with seasonal snow cover” and highlighted “the need for additional attention to the gap in our understanding of how climate change across seasons influences ecosystem processes”. We believe that the method and the results described in our manuscript may help fill this gap.

Methods

Data Logger Description

The device used in this study is a compact data logger that comprehensively records microhabitat factors such as temperature, relative humidity and light intensity. The sensor has also been equipped with an innovative measurement system for the physiological activity of trees that examines the electrical properties of their living tissues. The device records changes in the electrical conductivity of a tree between the probes placed in its trunk (Figure 1). The control processor at every defined time interval activates a generator that sends a current pulse with alternating characteristics to the probes (to avoid electrolysis). Depending on the conductivity of the resulting system (probe-tissue-tree-probe) to the microcontroller returns a signal of unique frequency, which is a measurement of the conductivity of the tree. The device can be powered by the built-in rechargeable battery from a photovoltaic cell integrated to the device, thereby ensuring constant, stabilized voltage from three 1.5 V batteries. The device has an electrically erasable memory that allows uninterrupted recording of the data set for 270 days. The device’s accurate temperature-compensated, real-time clock system is in operation, which starts the procedure of measuring and recording data at a strictly defined time. Complementing the apparatus is a General Packet Radio Service (GPRS) module sending data to the server, which transmits the results to the indicated mobile devices (smartphone, tablet, laptop). The idea of the device is to create a capacitor with a wooden dielectric between the probes of the device. Due to the constant transport and movement of sap-flow in the tree, the dielectric properties of the system (probe-wood-probe) depend on the amount of sap-flow in the pores (vessels) of the wood. The microcontroller, which has a fixed time interval (1 hour), uses a generator to pulse a small, alternating electric field on the device probes. Being analogous to conductometry (which is used only in liquids) and solutions used in the measurement of admittance, to avoid an unfavourable electrolysis phenomenon between the probes, the presented solution was also used to pass through the alternating current system. Depending on the amount of electrolyte (plant juice) present in the phloem and xylem, the electrical capacity of the system is unique, and thus demonstrates the value of the current flowing between the probes. The consequence of the different capacities of the system is the different amount of current conduction through the wood tissue. Variable values of the flowing current, which reflect the activity of the trees and is expressed in Hz (during the first tests – mV) affect the frequency of the generator. Because the cell chemistry and the rate of transpiration are variable over a 24-hour period, as well as annually, this measurement is the determinant of the tree’s activity at a given moment. During the growing season, depending on the species, these values range (also within 24 hours) from a few hundred to approximately 4000 Hz. With the decrease in activity, the number of Hz decreases to the minimum level recorded by the device of 50 Hz (equivalent to approximately 20 pF (picofarad)) corresponding to the lack of conductivity, which indicates the cessation of processes responsible for transport and active change in the chemical composition of vegetable juice. The device additionally records the date and time of the measurement along with microclimatic parameters, i.e., air temperature and relative humidity.

fig 1

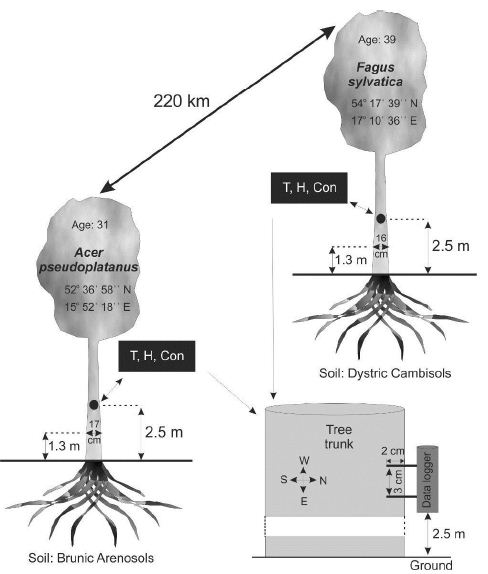
Figure 1: Characteristics of the examined trees. T, H, and Con in the graph mean temperature, humidity and conductivity measured by the data loggers, respectively.

Tree Selection

The prototype of the device was developed for research studying the causes of mass beech (Fagus sylvatica) bark stripping by deer in the northern part of Poland.

The second prototype device was mounted on sycamore (Acer pseudoplatanus). This species was chosen due to intensive production of sap, similar to popular maple syrup usually made from the xylem sap of sugar maple and other maple species. The difference between juice leakage in beech and sycamore is clearly visible when wounding the trees in spring, but no measurements have been made so far.

The method of embedding devices on trees and the features of the trees and their locations are given in Figure 1. Trees of similar height, circumference and age were chosen.

The devices were mounted at a height of 2.5 m, on the north side of both types of trees so that direct light would not fall on them.

Results

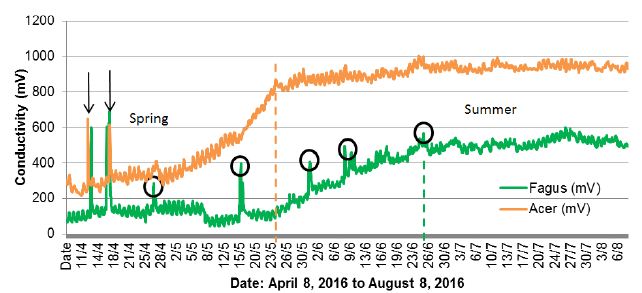
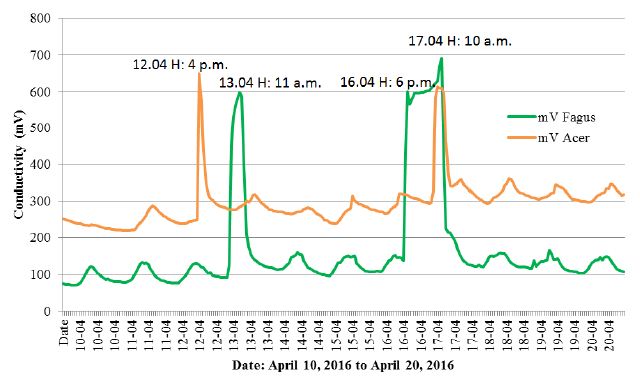
The results of measurements received between April 8, 2016 to August 8, 2016 were quite intriguing. In addition to the assumed effects, among which both species of trees showed a low early spring conductivity, high conductivity in the summer and a definite difference in the conductivity between beech and sycamore (Figure 2), an anomaly was also noted. This anomaly contained an almost simultaneous reaction from both trees, manifested by a rapid, short-lived increase in conductivity (Figures 2 and 3) on April 12-13, 2016 and April 16-17, 2016.

fig 2

Figure 2: Changes in conductivity in sycamore and beech trees in the period from April 8, 2016 to August 8, 2016.

fig 3

Figure 3: Enlarged section of Figure 2, with the anomaly periods.

The two black arrows indicate an anomaly in the course of the graph, constituting an identical reaction of sycamore and beech growing 220 km away from each other (Figure 1). The vertical dashed lines (brown and green) mark the entry of trees in the summer period, when they were full of tree activity after the period of spring leaf development. The black circles indicate other peaks of Fagus conductivity. An enlarged section of Figure 2 with anomalies is given in Figure 3.

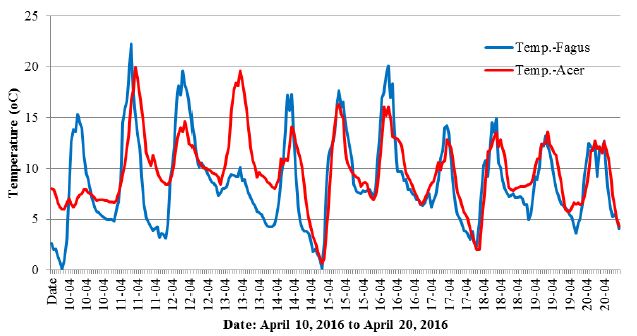
This coincidence for both tree species was not observed after April 17, but after this date additional interesting changes are still visible in the beech graph, according to the following dates: April 26, May 16 and 31, June 8, 16 and 24 (Figure 2). Explaining such rapid changes of tree activity with the influence of air temperature or air humidity is difficult, as at the time there was standard variability in the weather conditions prevailing in the spring in Poland, with warm days and cool nights (Figure 4). A correlation between the indicated anomalies and the intensity of storm phenomena [30] and moon phases was not found either.

fig 4

Figure 4: Changes in the air temperature for the period shown in Figure 3.

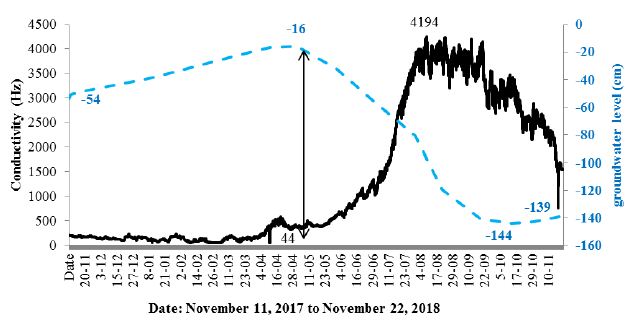
Preliminary results proved to be highly promising in terms of the reaction of trees to changing environmental conditions, so they were used for long-term observations of changes that occur in other tree species. The result of a year-round conductivity measurement cycle is shown for Alnus glutinosa (Figure 5). This species was selected due to its different life cycle, which, as in all deciduous species in Poland, depends on the seasons; however, the black alder additionally depends on the hydrological cycle and is characterized by significant fluctuations in the depth of the groundwater table, from water occurring on the surface to a depth of 140 cm below ground (Figure 5).

fig 5

Figure 5: Changes in conductivity in an alder tree and the groundwater table at the edge of an alder forest between November 11, 2017 to November 22, 2018.

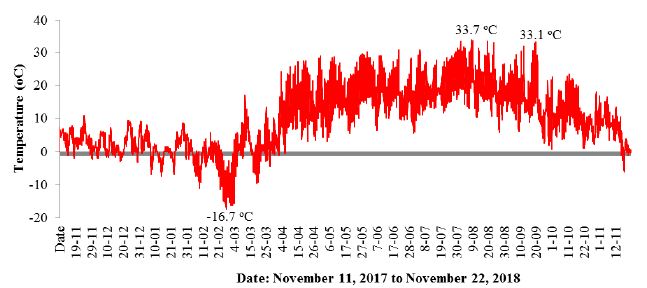
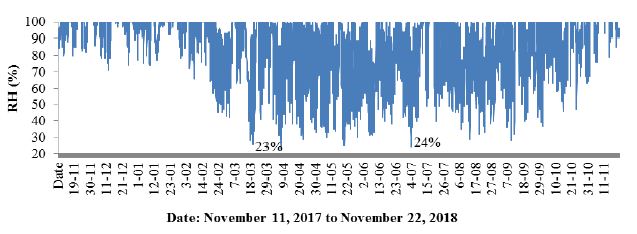
In addition to the conductivity, data were collected on the course of changes in air temperature (Figure 6) and air humidity (Figure 7).

fig 6

Figure 6: Changes in air temperature in an alder forest between November 11, 2017 to November 22, 2018.

fig 7

Figure 7: Changes in air humidity in an alder forest between November 11, 2017 to November 22, 2018.

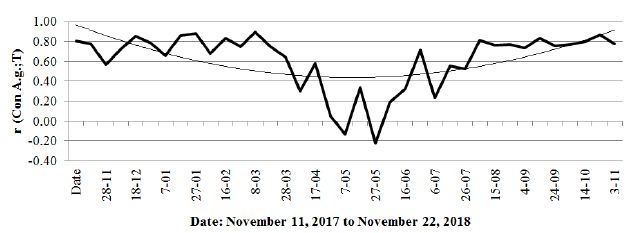
A correlation coefficient was calculated for conductivity and temperature (Figure 8), which gave quite an interesting result.

fig 8

Figure 8: Correlation coefficient (r) between the conductivity of the black alder tree and the air temperature.

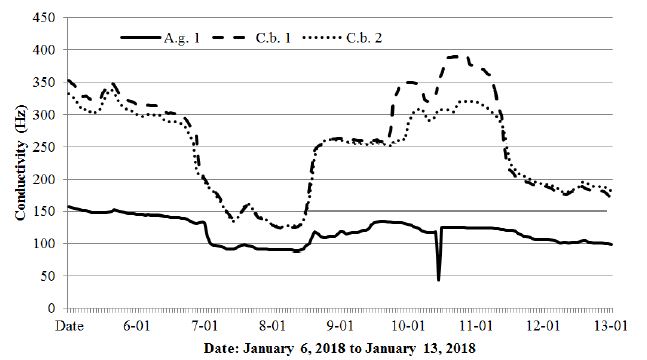
This coefficient gives high positive values in the autumn and winter period, when the temperature decrease correlates with a drop in the conductivity and in the summer period when the temperature rise is also related to the increase in conductivity. A comparison of the conductivity and groundwater table (Figure 5) indicates a strong relationship between the increase in conductivity in the summer and the sharp decrease in the groundwater level. The examined tree, as well as other alders in its surroundings, can be assumed to have strongly transpired, thereby causing a loss of water in the habitat. Notably, however, the decrease in the correlation coefficient to the negative values during the period of maximum humidity of the habitat occurred during very high (as for Polish conditions) temperatures. The root system at its full soil water capacity did not conduct enough water to supplement the deficiency associated with strong transpiration. Data are also provided by analysing the course of conductivity in short cycles (several days), which is shown by comparing the aforementioned alder and 2 hornbeams (Carpinus betulus) growing at a distance of 100 m from Alnus glutinosa (Figure 9).

The combination of these data clearly indicates a relationship of conductivity with a temperature drop, with the negative values of the conductivity values in both tree species approaching each other. Notably, on January 11, both species showed a marked decrease in conductivity at the same time, while the air temperature increased. Additionally, the conductivity value in the alder at that moment fell to below 50 Hz, which meant no conductivity was measured. Notably, the dormancy period for the tested trees began when temperatures fell below -5°C. The relationship between low air temperatures and conductivity is also thoroughly illustrated by Figures 11 and 12, which are a continuation of the changes in air and conductivity temperatures, as shown in Figures 9 and 10, respectively.

fig 9

Figure 9: Changes in the conductivity of the alder (A.g.1) and two hornbeam trees (C.b. 1, C.b. 2) from January 6, 2018 to January 13, 2018.

fig 10

Figure 10: Changes in air temperature in the alder forest and oak-hornbeam forest from January 6, 2018 to January 13, 2018.

fig 11

Figure 11: Changes in conductivity of the alder (A.g.1) and two hornbeam trees (C.b. 1, C.b. 2) from March 1, 2018 to March 8, 2018.

fig 12

Figure 12: Changes in air temperature in the alder forest and the oak-hornbeam forest from March 1, 2018 to March 8, 2018.

The period from March 1-8, 2018 shown in Figures 11 and 12 was chosen due to the extremely low temperatures (-16.3°C) recorded in the studied area with reference to the black alder and hornbeam. Admittedly, the temperature course shown in Figure 12 fluctuated strongly throughout the day, assuming higher values during the day and lower values at night, but the cumulative long period of low temperatures brought all the tested trees to dormancy. The spring awakening from this state took place on March 5, when the air temperatures exceeded values above 0°C for a long period. The fullness of spring, which in Poland usually falls in May, resulted in increased activity of the trees described above, simultaneously showing differences between species (hornbeam showed much higher conductivity), as well as individual differences within the same species (Figures 13).

fig 13

Figure 13: Combined changes of conductivity and air temperature for the black alder (A.g.) and hornbeams (C.b. 1, C.b. 2) from May 8, 2018 to May 15, 2018.

Discussion

Many papers devoted to seeking the relationship between climatic factors and plant phenology have problematically researched single factors rather than their comprehensive and combined action [4,3135]. A certain factor may, however, have a unique effect in different years, depending on the complex impacts of other factors. For example, Chuine & Courb [34] studied the effect of budburst summer temperatures on the growth timing. They finished their studies in one growing season, although the effects may be different in different years depending on the humidity of the given period. This phenomenon is indicated, among others, by Laube et al. [15], who concluded that air humidity influenced the onset dates, and suggested that air water uptake via aboveground tissue might be involved. The obtained results presented in this paper can confirm this theory. Undoubtedly, the conductivity measurement method in this study can be used in phenological studies, thereby combining in a more precise way the tree phenological stages with the combined impacts of air temperature, air humidity, and water resources available for plants and its transport in tree tissues. Preliminary results show that the life cycle phases of plants cannot be considered in the context of individual factors such as the chilling period, photoperiod, temperature, precipitation, humidity or light regime, but it is instead always a complex combination of factors with varying intensity depending on the season. However, the relationship between air temperature and water resources available for trees always plays a key role in these analyses, which results in correlating the daily and seasonal activity of trees with air temperature, atmospheric precipitation and air humidity. This study’s method provides such future research possibilities. The described anomaly recorded for sycamore and beech is likely a cumulative effect of several factors that are difficult to capture. The mechanism of this phenomenon may be similar to the formation of ocean rogue waves, as described by Birkholz et al. [36]. In this study, the authors stated that practical predictions likely appear unrealistic, despite the determinism in the system. However, the described phenomenon gives grounds for further research in this direction. In the context of research on phenology, the behaviour of trees in the dormancy period, as well as in research into the impact of climate change on trees, the data shown in Figures 11 and 12 are considered particularly valuable. Figure 11 shows how the alder and hornbeams awoke from the dormancy period on March 3, when the temperature rose sharply from -15.7 to 3.6°C, and when the winter period finally ended between March 4 and March 5, when the temperature was last recorded -7.5 (Figure 12). From that moment, all the trees that hitherto had no activity, entered the awakening phase, albeit with varying intensity. This phenomenon appears to be the first spectacular demonstration of the ending of the dormancy period.

Conclusion

The sensors used in this study underwent a three-year period of tests performed on 4 tree species (Acer pseudoplatanus, Alnus glutinosa, Carpinus betulus and Fagus sylvatica), thereby providing data that allow us to draw the following conclusions:

a) The study device passed the tests successfully at the air temperature range from -17.4°C to 33.7°C;

b) The system used to supply the device with energy allows for maintenance-free operation for up to 270 days in battery mode or for an unlimited period of time when the batteries are supported by a photovoltaic cell;

c) The device provides a data transfer via the GPRS network and tracks the results in the online mode;

d) Thanks to the conductivity measurement method, tracking the activity of the trees year-round is easy;

e) The sensors showed that the trees were active (although at a low level) during the winter; the real dormancy period was noted when the air temperature dropped below – 5.7;

f) The increase of tree conductivity is related to air temperature, but this relationship varies depending on the season and available water resources; in the spring season, the increase in air temperature increases the conductivity value, but in the summer heat period’s high temperatures lead to a decrease of conductivity;

g) For some temperature values, the conductivity is inhibited both in winter and in summer;

h) Differences in the conductivity between the examined tree species were also demonstrated;

i) An anomaly manifested by a simultaneous, rapid and short-lived increase in the conductivity of trees growing 220 km away from each other was also observed, although the reason for this phenomenon has not been explained yet;

j) The conducted experiment allows us to conclude that the applied method of conductivity measurements can be widely used in research related to phenology, physiology and tree ecology; it can also have a practical aspect through using measurements to determine the condition of trees.

Acknowledgment

We are grateful to Leśny Dwór and Międzychód Forest Divisions for the support.

Conflict of Interest

No potential conflict of interest was reported by the authors.

Author Contributions

PR and TW conceived the ideas and designed methodology. PR, TW and MK conducted field work and analysed the data. MK and PR wrote the manuscript.

Data Accessibility

The authors agree to deposit the data to a public repository.

References

  1. Gordo O, Sanz JJ (2010) Impact of climate change on plant phenology in Mediterranean ecosystems. Global Change Biology
  2. Vitasse Y, Lenz A, Körner C. (2014) The interaction between freezing tolerance and phenology in temperate deciduous trees. Frontiers in Plant Science.
  3. Denny EG, Gerst KL, Miller-Rushing AJ, Geraldine LT, Theresa M, et al. (2014) Standardized phenology monitoring methods to track plant and animal activity for science and resource management applications. International Journal of Biometeorology. 58: 591-601.
  4. Murray MB, Cannell MGR, Smith RI (1989) Date of budburst of 15 tree species in Britain following climatic warming. Journal of Applied Ecology 26: 693-700.
  5. Sogaard G, Johnsen O, Nilsen J, Junttila O (2008) Climatic control of bud burst in young seedlings of nine provenances of Norway spruce. Tree Physiology 28: 311-320. [crossref]
  6. Laube J, Sparks TH, Estrella N, Höfler J, Ankerst DP, et al. (2014) Chilling outweighs photoperiod in preventing precocious spring development. Global Change Biology 20: 170-182.
  7. Heide OM (1993) Daylength and thermal time responses of budburst during dormancy release in some northern deciduous trees. Physiologia Plantarum 88: 531-540. [crossref]
  8. Körner C, Basler D. (2010) Phenology under global warming. Science 327: 1461-1462.
  9. Caffarra A, Donnelly A (2011) The ecological significance of phenology in four different tree species: effects of light and temperature on bud burst. International Journal of Biometeorology 55: 711-721.
  10. Basler D, Körner C (2012) Photoperiod sensitivity of bud burst in 14 temperate forest tree species. Agricultural and Forest Meteorology 165: 73-81.
  11. Heide OM (2003) High autumn temperature delays spring bud burst in boreal trees, counterbalancing the effect of climatic warming. Tree Physiology 23: 931-936. [crossref]
  12. Jochner S, Höfler JBI, Göttlein A, Ankerst DP, Traidl-Hoffmann C, Menzel A (2013) Nutrient status: a missing factor in phenological and pollen research?. Journal of Experimental Botany 64: 2081-2092. [crossref]
  13. Penuelas J, Filella I, Comas P (2002) Changed plant and animal life cycles from 1952 to 2000 in the Mediterranean region. Global Change Biology 8: 531-544.
  14. Estiarte M, Puig G, Penuelas J (2011) Large delay in flowering in continental versus coastal populations of a Mediterranean shrub, Globularia alypum. International Journal of Biometeorology 55: 855-865.
  15. Laube J, Sparks TH, Estrella N, Menzel A (2014) Does humidity trigger tree phenology? Proposal for an air humidity based framework for bud development in spring. New Phytologist 202: 350-355.
  16. Linkosalo T, Lechowicz MJ (2006) Twilight far-red treatment advances leaf bud burst of silver birch (Betula pendula). Tree Physiology 26: 1249-1256. [crossref]
  17. Chuine I, Morin X, Bugmann H (2010) Warming, photoperiods, and tree phenology. Science 329: 277-278. [crossref]
  18. Samach A, Wigge PA (2005) Ambient temperature perception in plants. Current Opinion in Plant Biology 8: 483-486. [crossref]
  19. Penfield S (2008) Temperature perception and signal transduction in plants. New Phytologist 179: 615-628. [crossref]
  20. Menzel A, Fabian P (1999) Growing season extended in Europe. Nature
  21. Menzel A, Sparks TH, Estrella N, Elisabeth Koch, Anto Aasa, et al. (2006) European phenological response to climate change matches the warming pattern. Global Change Biology 12: 1969-1976.
  22. Ibáñez I, Primack RB, Miller-Rushing AJ, Elisabeth Koch, Anto aasa, et al. (2010) Forecasting phenology under global warming. Philosophical Transactions of the Royal Society 365: 3247-3260.
  23. Way DA (2011) Tree phenology responses to warming: spring forward, fall back?. Tree Physiology 31: 469-471.
  24. Nadler A, Raveh E, Yermiyahu U, Lado M, Nasser A, et al. (2008) Detecting Water Stress in Trees Using Stem Electrical Conductivity Measurements. Soil Science Society of America Journal 72: 1014-1024.
  25. Vandegehuchte MW (2013) Measuring sap flow and stem water content in trees: a critical analysis and development of a new heat pulse method (Sapflow+). PhD thesis, Ghent University, Belgium.
  26. Forster MA (2017) How Reliable Are Heat Pulse Velocity Methods for Estimating Tree Transpiration?. Forests 8.
  27. Kieliszewska-Rokicka B (1991) Physiology of growth and development (in Polish: Fizjologia wzrostu i rozwoju): Białobok S. (ed.) Nasze drzewa leśne, Lime-trees (in Polish: Lipy), Poznań, Arkadia. 15: 104-118.
  28. Wojtyla Ł, Adamiec M, Sobieszczuk-Nowicka E (2014) What do plants do in winter?. 1: 3-11.
  29. Sanders-DeMott R, Templer PA (2017) What about winter? Integrating the missing season into climate change experiments in seasonally snow covered ecosystems. Methods in Ecology and Evolution 8: 1183-1191.
  30. Machowski Summary of the storm season 2016.
  31. Hänninen H (1990) Modelling bud dormancy release in trees from cool and temperate regions. Acta Forestalia Fennica 213: 1-47.
  32. Hunter AF, Lechowicz MJ (1992) Predicting the timing of budburst in temperate trees. Journal of Applied Ecology 2: 597-604.
  33. Kramer K (1994) Selecting a model to predict the onset of growth of Fagus sylvatica. Journal of Applied Ecology 31: 172-181.
  34. Chuine I, Cour P (1999) Climatic determinants of budburst seasonality in four temperate-zone tree species. New Phytologist 143: 339-349.
  35. Kramer K, Ducousso A, Gömöry D, Hansen JK, Ionita L, et al. (2017) Chilling and forcing requirements for foliage bud burst of European beech (Fagus sylvatica L.) differ between provenances and are phenotypically plastic. Agricultural and Forest Meteorology 234: 172-181.
  36. Birkholz S, Brée C, Demircan A, Steinmeyer G (2015) Predictability of Rogue Events. Physical Review Letters.
fig 2

Presentation of Results Using Poly-L-Lactic Acid in the Treatment of Orofacial Harmonization

DOI: 10.31038/IJOT.2020333

Abstract

This work aims to present a case report with the use of poly-L-lactic acid for facial rejuvenation, aiming to restore the loss of soft tissue volume resulting from the natural aging process. The patient underwent treatment in 2018. The product was reconstituted in 6 ml of saline, left to stand for a period of 48 hours and at the time of application 2 ml of 2% lidocaine without vasocontritor were added. The treatment was individualized according to the patient’s specific volume and facial contour. The results were analyzed using pre- and post-procedure photographs and taking into account the perception of the harmonization context. The patient was satisfied with the result obtained. Despite the immense range of injectable products to increase facial volume, including hyaluronic acid, calcium hydroxyapatite and polymethylmethacrylate, poly-L-lactic acid proved to be a differentiated product presenting excellent results.

Keywords

Poly-L-lactic acid, Collagen, Facial rejuvenation

Introduction

Aging is a slow, progressive and inevitable process. Its occurrence involves a conjunction of intrinsic and extrinsic factors. Intrinsic aging, recognized as chronological, is physiological and natural, a result of decreased cellular metabolic activity and generally influenced by the genetic factor. But far beyond organic occurrences are factors extrinsic to aging, components that interfere and even intensify the natural events already described. Excessive exposure to ultraviolet rays and smoking can be considered the strongest determinants of the aging process. Such events involve the organism globally, but the structural loss of bone, muscle and skin is evident in regard to aesthetic repercussions, including the facial [1].

Structural loss of facial support tissues associated with physiological factors trigger a series of occurrences such as wrinkles (dynamic or static), displacement and ptosis of fat bags in addition to facial flaccidity, the latter resulting from a decrease in the production of collagen and elastin. Given the facts, the search for youthful appearance became necessary, bringing to reality the development of innovative techniques, invasive or not, in addition to the expansion of technology for the production of cosmetic products such as hyaluronic acid, calcium hydroxyapatite and polymethylmethacrylate.

Promising products include poly-L-lactic acid, approved by the Food and Drug Administration (FDA) in August 2004 and later in Europe, Canada, Australia and Brazil. Initially indicated for the treatment of lipodystrophy caused by HIV (in English, human immunodeficiency virus), the indication was extended to healthy patients who envisioned aesthetic resolution in cases of facial flaccidity [2]. This study aims to present the experience obtained in a clinical case, in which poly- L-lactic acid was used for cosmetic purposes, seeking to restore facial volume and improving its quality through the treatment of static wrinkles, mainly in the middle and lower thirds of the face.

Literature Review

Since the middle of 1898, the inclusion of materials on the face has been accepted in order to improve aesthetics. With the advent of anesthesia and the improvement of surgical procedures, in the middle of the 19th century, aesthetic procedures became more invasive. Initially, most common procedures used fat as a graft to fill volumes after trauma. In the 20th century, autologous fat became the most common filler. However, removing fat and transporting it is an invasive and time-consuming procedure that in many cases has no lasting effect. The search for an effective material with a bio stimulating effect resulted in the discovery of poly-L-lactic acid [3].

In fact, the best indication for the product is using it as a biostimulator in patients who want a natural appearance associated with the improvement of the facial flaccidity. These effects are obtained with the injection of the product mainly in the facial contour regions, including mandibular lines, nasogenian grooves, temporal region, malar region in addition to the correction of marionette lines [4].

Poly-L-lactic acid is a stimulator of neocolagenesis, showing results that last for about 2 years, longer than it’s tissue degradation (approximately 9 months), showing the stability of the collagen fibers produced. The technology involved in the production of the material is based on the fermentation of corn dextrose, which allows the synthesis of a heavy molecule (140 k Dalton), crystalline, with 2 µm to 50 µm in diameter and that under non-enzymatic tissue hydrolysis degrades to lactic acid monomers. Such monomers are phagocytosed by macrophages, degraded to glucose and carbon dioxide that will be eliminated by the respiratory route. It has a biocompatible and biodegradable character, and, in addition, allergic testing is not necessary [3].

Its clinical effects are due to the stimulus of a desired controlled subclinical inflammatory response, which leads to the recruitment of monocytes, macrophages and fibroblasts. As poly-L-lactic acid is metabolized, collagen deposition is increased with a consequent increase in dermal thickness. The production of type I collagen begins about 10 days after application and continues for a period ranging from eight to 24 months. During it’s period of activity, poly-L-lactic acid is gradually degraded by hydrolysis followed by oxidation of lactic acid. At the end of metabolization, substrate excretion occurs through urine, feces and respiration [5].

The product is packaged in a glass bottle containing a sterile lyophilized powder composed of microparticles of Poly-L-lactic Acid (PLLA), non-pyrogenic mannitol and sodium carboxymethylcellulose. It is recommended to be reconstituted with 6 ml of serum (depending on the case it can be changed to 8 ml). The bottle should not be shaken immediately after reconstitution, to avoid depositing particles not yet hydrated on its wall. After reconstitution, the product should be left to stand for a period of 24 to 72 hours before application and preferably be storage at ambient temperature (up to 30°C) or refrigerated (from 2°C to 8°C) for up to 72 hours. The longer the resting time, the greater the hydration and, consequently, the easier it is to apply without obstructing the needle. After this period, 2 mL of lidocaine (without vasoconstrictor) must be added to the vial, immediately before application; the final volume will be 10 mL, 8 mL of poly-L-lactic acid hydrated with distilled water and 2 mL of anesthetic. Immediately before it’s use, the product should be gently stirred for better homogenization, but not vigorously, in order to avoid foaming inside the bottle [2].

The PLLA use should be avoided in some facial areas, such as perioral and periorbital regions, which are regions of muscle hypermobility, and are not indicated for lip filling. Adverse reactions related PLLA use appear mainly at the injection sites of the product, such as bruises, edema, papules, nodules and granulomas [4].

Case Report

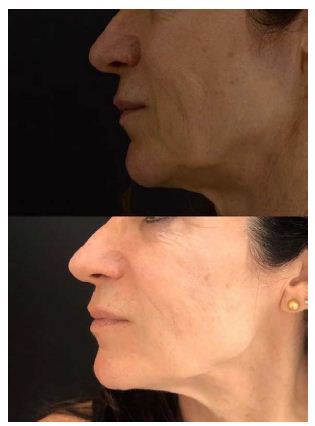
Leucoderma patient, female, 58 years old, attended the dental clinic of the specialization course in Orofacial Harmonization with a complaint of saggy skin and numerous expression lines (Figure 1).

fig 1

Figure 1: Start day.

The product was reconstituted following the manufacturer’s recommendations: 6 mL of 0.9% saline 48 hours before the procedure. Prior to the injections, 2 ml of 2% lidocaine without vasoconstrictor were added. After the aseptic maneuvers of the skin and adequate anesthesia, the product was introduced into the deep dermis, close to the subcutaneous tissue, using 22G cannulas through retroinjection technique. We gave priority to the middle and lower third of the face, including regions of the malar, maxilla, nasogenian groove and mandibular contour. At the end, a massage of the treated area was carried out in order to distribute and unify the product.

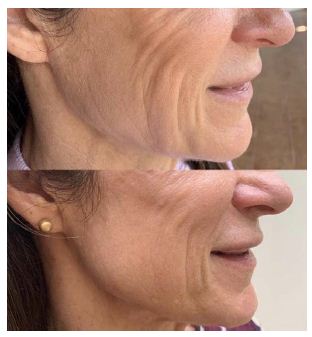
After 15 days of application, it’s possible to notice an improvement in the quality of the skin with a considerable decrease in static wrinkles in the middle third (Figure 2). The patient denies having felt or presented any type of adverse reaction to the procedure.

fig 2

Figure 2: Initial day and 15 days.

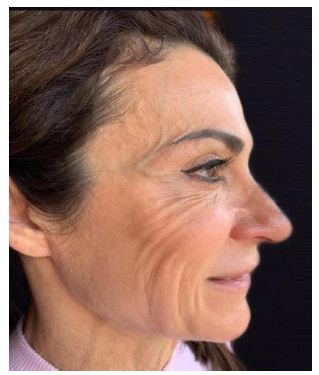
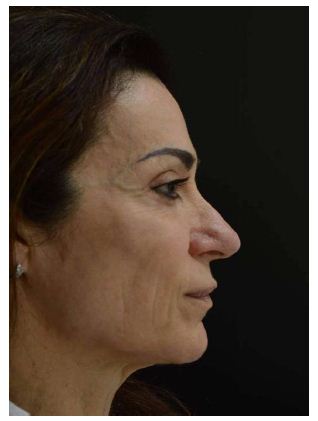
After 30 days, a significant improvement in the mandibular contour is observed, as well as the smoothing of the expression lines and attenuating facial sagging (Figures 3 and 4).

fig 3

Figure 3: 30 days.

fig 4

Figure 4: 30 days.

Final Considerations

The use of poly-L-lactic acid has been shown to be effective in the treatment of sagging skin, softening expression lines, improving mandibular contour and contributing to the restoration of facial harmony.

References

  1. Sveikata K, Balciuniene I, Tutkuviene J (2011) Factors influencing face aging. Literature review. Stomatologija, Baltic Dental and Maxillofacial Journal 13: 113-115. [crossref]
  2. Haddad A, Kadunc BV, Guarnieri C, Noviello JS, Gonzaga da Cunha M, et al. (2017) Conceitos atuais no uso do ácido poli-l-láctico para rejuvenescimento facial: Revisão e aspectos práticos. Surg Cosmet Dermatol 9: 60-71.
  3. Silva RMSF, Cardoso GF (2013) Uso do ácido poli-L-láctico como restaurador de volume facial. Rev Bras Cir Plást 28: 223-226.
  4. Machado Filho CDS, Santos TC, Rodrigues APLJM, Cunha MG (2013) Ácido PoliLLáctico: Um agente bioestimulador. Surg Cosmet Dermatol.
  5. Antonio CR, Tridico LA (2019) Biomodulação celular: O futuro da Dermatologia. Surg Cosmet Dermatol.
fig 1

Circulatory Support as a Bridge in Pediatric Heart Transplantation in Virtue of Dilated Cardiomyopathy after Appendectomy

DOI: 10.31038/JCCP.2020335

Abstract

Extracorporeal membrane oxygenator (ECMO) is utilized in the recovery of patients with cardiogenic shock, as temporary hemodynamic support for the purpose of myocardial recovery or to bridge the patient to cardiac transplantation. A 13 years old man, after appendectomy, with a complaint of facial edema, reduction in the volume of diuresis, hypotension and reduction of appetite, diagnosed with dilated cardiomyopathy, biventricular systolic dysfunction and extensive myocardial fibrosis, requiring the use of mechanical circulatory support. The patient was transplanted after 31th day of ECMO support and 116th day hospitalized was discharged. This study elucidated the importance of ECMO in the management of critically patients that progress to heart failure.

Introduction

Extracorporeal membrane oxygenation (ECMO) first successfully utilized in 1975 by Robert Bartlett, therefore, its use has become popular in adults, neonates and pediatrics patients. Used for therapy in cases of heart and/or pulmonary failure, to promote myocardial recovery, it is also used as a bridge for transplantation and implantation of long-term ventricular assist devices [1,2]. Venovenous (VV) configuration is the modality of choice in cases of respiratory failure and venoarterial (VA) is utilized in cardiorespiratory arrest or cardiogenic shock. Cannulation in patients undergoing ECMO support should be individualized, the central cannulation site can be used in patients post-cardiotomy and percutaneous femoral cannulation is the most used to patients on intensive care unit (ICU), however, percutaneous cannulation is associated with vascular involvement of the lower extremity [1,3,4].

ECMO circuit consists in a centrifugal pump, membrane oxygenator and heat exchanger, allowing keeping the patient in normothermia. The circuit induces the acute kidney injury and in these cases, it is possible to insert a hemoconcentrator to remove fluid, reduce interstitial edema and can raising the hematocrit level [3].

Case Report

A 13 years old man, 150 cm, 34 kg, after appendectomy, was seen in the emergency room with a complaint of facial edema, reduction in the volume of diuresis, tingling in the lower limbs, pallor, complaining of weakness, hypotension and reduction of appetite. Arterial pressure 80 x 50 mmHg, heart rate 80 bpm, sinus rhythm, using carvedilol, enalapril, aldactone, acetylsalicylic acid and ferrous sulphate. Patient was submitted to chest X-ray, transthoracic echocardiogram Table 1 and magnetic resonance imaging Table 2, has been shown enlargement cardiac area, the right cardiac chambers was slightly dilated and chambers demonstrated important dilatation, having diffuse left ventricular hypokinesis, mitral regurgitation. Dilated right and left pulmonary artery, enlarged pulmonary trunk diameter, biventricular systolic dysfunction, pulmonary hypertension, mild pericardial effusion and with areas of late enhancement of diffuse mesocardial non-coronary pattern, suggestive of extensive myocardial fibrosis. The diagnosis was inflammatory cardiomyopathy; however, the hypothesis giant cell myocarditis has not discarded.

Table 1: Transthoracic Echocardiogram after patient admission.

Parameter rating

Value

Reference value

Aorta (mm)

23 mm

17-23 mm

Left atrium (mm)

48 mm

19-28 mm

Right atrium (mm)

23 mm

07-26 mm

LV in diastole (mm)

70 mm

32-45 mm

LV in systole (mm)

62 mm

Interventricular septum (mm)

05 mm

06-07 mm

Posterior wall (mm)

05 mm

06-07 mm

Ejection fraction (%)

24%

60%

Table 2: Magnetic resonance imaging with paramagnetic contrast injection after patient admission.

Parameter rating

Value

Reference value

Left atrial volume (mL)

90 mL

44-102 mL

Volumetric index left atrium (mL/m²)

76 mL/m²

26-53 mL/m²

Right atrium volume (mL)

51 mL

44-102 mL

Volumetric index right atrium (mL/m²)

43 mL/m²

43 mL/m²

Anteroseptal wall thickness (mm)

04 mm

7-12 mm

Lower lateral wall thickness (mm)

03 mm

7-12 mm

End- diastolic diameter (mm)

67 mm

37-55 mm

End-systolic diameter (mm)

60 mm

End-diastolic volume (mL)

210 mL

Ejection fraction LV (%)

24%

50-70%

End-diastolic volume index (mL/m²)

176 mL/m²

53-97 mL/m²

End-systolic volume index (mL/m²)

134 mL/m²

10-34 mL/m²

Left ventricular mass (g)

58 g

Right ventricular long axis (mm)

79 mm

65-95 mm

right ventricular short axis (mm)

39 mm

22-44 mm

End-diastolic volume (mL)

58 mL

End-systolic volume (mL)

40 mL

RV Ejection fraction (%)

30%

40-60%

End-diastolic volume index (mL/m²)

49 mL/m²

67-111 ml/m²

End-systolic volume index (mL/m²)

34 mL/m²

20-48 mL/m²

Presented low cardiac output and right heart failure, the patient was referred to the pediatric ICU for hemodynamic stabilization, was necessary dobutamine infusion, furosemide administration and hydration with 0.9% sodium chloride. There was clinical worsening with reduced left ventricular ejection fraction (EF Simpson de 23% to 17%), decreased kidney function, elevation of C-reactive protein, congestive liver dysfunction, drop in oxygen saturation, nausea and vomiting. For presenting difficulty in hemodynamic management, it was necessary to increase the dose of dobutamine and started the primacor infusion, the patient was subsequently included on heart transplant waiting list. He presented severe metabolic acidosis, adrenaline 0.15 mcg/Kg/min was staterd, the intubated patient receiving mechanical ventilation and opted for the installation of ECMO circulatory support.

ECMO circuit with 3/8 diameter tubes, centrifugal pump (Rotaflow Centrifugal Pump®) and polymethylpentene oxygenator membrane (Quadrox-ID Adult – Bioline Coated – MAQUET Cardiopulmonary AG) was installed. The circuit was primed with 0.9% sodium chloride and red cell concentrate. Cannulation was performed with dissection of the right femoral artery and vein, an arterial cannula number 16 and an intravenous number 22 were introduced. A temporary intravascular shunt was placed for distal reperfusion of the femoral artery, to maintain the viability of the limb.

The heparinization was performed at a dose of 50 IU/kg bolus, thereafter heparin was infused continuously at a rate of 10 IU/kg/h, adjusted according to the activated coagulation time (ACT) (MCA 2000 FAJ®) and activated partial thromboplastin time (aPTT). Circulatory support was initiation with the flow 80 ml/ kg/min, gas flow of 0.9 and FiO² at 50%. 06 hours later after installation, it was possible to observe improvement in the patient’s hemodynamics, with return of diuresis, reduction of vasoactive drugs infusion and improvement in peripheral circulation Table 3.

12 hours later of ECMO installation, it decided a treatment of dialysate solution which circulates past the hemodiafiltration membrane, with the purpose of promoting the improvement of renal function and reducing interstitial edema. The technique was performed throughout the period in circulatory Support. The hemodialfiltration is a safe and effective technique based on hemodialysis, performed by the hemoconcentrator applied to the ECMO circuit. It is common for patients in ECMO to develop renal failure due to volume overload, and an alternative to minimize this condition is the use of continuous renal replacement therapy (CRRT), however, the disadvantages of this method are related to the pressure alarm in the entry and exit routes of the CRRT, which can interrupt the procedure and cause hemolysis and microembolism. An alternative to the use of CRRT is continuous hemofiltration that is easy to perform on the ECMO circuit [5].

Table 3: Clinical and hemodynamic parameters before and after implantation of the ECMO.

Parameters

Before ECMO After 6 h

After 12 h

Arterial pressure

85 x 58 mmHg 102 x 90 mmHg

80 x 78 mmHg

Heart rate

110 bpm 109 bpm

108 bpm

Lactate

14,7 6,0

2,8

Bicarbonate

16,2 27,8

29,7

pH

Severe metabolic acidosis 7,38

7,49

Diuresis

200 mL 870 mL

2025 mL

Vasoactie drugs

Dobutamine 10 mcg/Kg/min

Milrinone 0,5 mcg/Kg/min

Adrenalin 0,15 mcg/Kg/min

Milrinone 0,5 mcg/Kg/min

Adrenalin 0,15 mcg/Kg/min

Milrinone 0,5 mcg/Kg/min

Adrenalin 0,15 mcg/Kg/min

The patient evolved with difficulty in ventilation with unsatisfactory tidal volume. After chest X-ray examination, an important left pleural effusion was detected, which subsequently led to an improvement in pulmonary auscultation and effusion. 48 hours after ECMO installation, left ventricular decompression was realized due to a pinkish frothy discharge was found in the endotracheal tube, suggestive of acute pulmonary edema. An atrial septostomy was performed with a 9.6 mm balloon with a mean gradient of 2 mmHg. Compression of left ventricular chamber occurs due to the retrograde flow of arterial cannula, increasing afterload on left ventricular, which can result in an increase in LV end diastolic pressure and pulmonary capillary pressure, consequently in a complication of pulmonary congestion presented by the patient [4]. The patient received a transfusion of irradiated red blood cells, maintaining a hemoglobin level above 10 g/dL, in addition to platelet concentrate, fresh frozen plasma and cryoprecipitate during all circulatory support. Nutrition was of the hypercaloric parenteral without lipid emulsion. Patient was sedated with midazolam, ketamine and morphine, presenting isochoric and photoreactive pupils.

The management of ECMO was performed according to the institutional protocol ICU. Two circuit changes were necessary, the first occurred on the 9th day of ECMO and on the 17th day, due to the presence of fibrin in the post-membrane of oxygenator, the anticoagulation was into parameters (TTpa 86 to 105 seconds; TTpa ratio 2.5 to 3; TCA 180-220 seconds). On the 31th day of ECMO support, the patient was offered the organ and underwent a heart transplant. The donor was man, 39 years old and 70 kg, declared death by hemorrhagic stroke. Receptor underwent a thoracotomy, with pericardiectomy, followed by cannulation of ascending aorta, inferior and superior vena cava. Subsequently, patient was submitted the cardiopulmonary bypass (CPB) and removed from circulatory support. The cardiopulmonary bypass time was 120 minutes, anoxia time 135 minutes and the implant 55 minutes. Flow in CPB was maintained between 80-100 mL/Kg/min, the patient was maintained in moderate hypothermia 32°C. After aortic unclamping, was observed the spontaneous return of cardiac function with recovery in sinus rhythm Table 4.

Table 4: Patient blood gas analysis in ECMO support, CPB at 37°C and post-CPB.

Blood gas analysis

ECMO CPB (37° C)

Post – CPB

pH

7,51 7,34

7,42

PCO2

33 40

41

PO2

197 275

106

SatO2

99,7 100

98,8

BE

3,3 – 3,9

2,4

CO2

27,9 22,8

28,5

HCO3

26,8 21,6

27,2

Cálcio

1,20 1,50

1,27

Lactate

1,1 3,3

2,8

Glucose

115 166

158

Hematocrit

32% 29%

29%

Hemoglobin

10,8 9,8

9,5

Sodium

134 135

138

Potassium

3,7 4,8

3,5

After cardiac transplantation, the patient was referred to the ICU with dose of dobutamine (3 mcg/Kg/min), primacor (0.5 mcg/Kg/min) and nitroprusside (1.8 mcg/Kg/min), and the beginning of methylprednisolone. Echocardiography showed 69% ejection fraction, with HR of 117 bpm and MAP of 136 x 69 mmHg. Renal function was adequate (160 mL/hr), with serum urea and creatinine at normal levels. On the 3rd postoperative day, the patient was referred to the pediatric ward, however, presented 3 episodes of seizures. A computed tomography scan of the skull was performed, which showed ischemia in the occipital, bilateral temporal and right frontal regions, these are an old injury. These were the only episodes, without sequelae, and levetiracetam was prescribed.

After 116th days hospitalized, the patient was discharged, with a final diagnosis of acute mild grade (1R) transplant rejection and continuous treatment of prednisolone, Prophylactic bactrim, everolimus, enalapril, folic acid, amlodipine and levetiracetam, nystatin, omeprazole, dipyrone and tramal if necessary. Figure 1 shows the timeline of the patient’s clinical course.

fig 1

Figure 1: Timeline clinical events of the patient.

Discussion

Technological advances and improvement of technique, the ECMO became safer and more effective, not being used only in post cardiotomy cardiogenic shock, but also being used in multifactorial cardiogenic shock and/or in cardiorespiratory arrest, being possible to increase the survival time of patient. Complications in ECMO can be mechanical, occurring in the circuit (pump, membrane oxygenator, PVC tubes and cannulation), or clinical, dependent on the patient’s physiological response. The longer time on circulatory support, the greater the incidence of complications, when its management is careful and based on an institucional protocol, complications almost always not affect the final result, favoring the patient’s recovery and justifying the cost-benefit, as seen in this case report. The study ratified the importance and cost-benefit of ECMO in the management of patients in serious condition and who progress with heart failure. This support promotes individual hemodynamic stability, which allows a longer waiting time for transplantation. It’s the important of multidisciplinary work in matters of pharmacology, physiotherapy and nutrition, in addition to the adequate clinical management of the patient and ECMO, aiming the patient’s discharge without comorbidities.

References

  1. Durães AR, Figueira FAMS, Lafayette AR, Juliana de Castro Solano Martins, Sá Juliano Cavalcante de (2015) Use of venoarterial extracorporeal membrane oxygenation in fulminant chagasic myocarditis as a bridge to heart transplant. Rev Bras Ter Intensiva 27: 397-401. [crossref]
  2. Díaz R, Fajardo C, Rufs J (2017) Historia Del ECMO (Oxigenación por membrana extracorpórea o soporte vital extracorpóreo). Rev Med Clin Condes 28: 796-802.
  3. Silva MP, Caeiro D, Fernandes P, Cláudio Guerreiro, Eduardo Vilela, et al. (2017) Oxigenação por membrana extracorporal na falência circulatória e respiratória – experiência de um centro. Rev Port Cardiol 36: 833-842. [crossref]
  4. Guglin M, Zucker MJ, Bazan VM, Biykem Bozkurt, Aly El Banayosy, et al. (2019) Venoarterial ECMO for Adults: JACC Scientific Expert Panel. J Am Coll Cardiol 73: 698-716. [crossref]
  5. Cyrino FOS (2019) Relato de caso: Hemofiltração venovenosa contínua associada ao líquido de hemodiálise durante a ECMO – Benefícios metabólicos e balanço hídrico. In: Congresso da Sociedade Brasileira de Cirurgia Cardiovascular, 2019, Belo Horizonte. Brazilian Journal of Cardiovascular Surgery 2-89.

SARS-CoV-2: It is Severe and Acute, but is it Only a Respiratory Syndrome?

DOI: 10.31038/JCCP.2020332

Introduction

The first Severe Acute Respiratory Syndrome Coronavirus (SARS-CoV) endemic was identified in the Guangdong Province of southern China in November of 2002 [1]. SARS-CoV was found to spread from person-to-person via respiratory secretions. This virus was capable of causing severe respiratory symptoms and death [2]. In 2012 the CDC declared SARS-CoV a “select” agent that could pose a severe threat to public health and safety [3]. SARS-CoV and SARS-CoV-2 are classified as beta coronaviruses which contain an extended loop that varies between viruses and is considered a hypervariable region [4]. Beta coronaviruses have been responsible for more severe symptoms when compared to alpha coronaviruses. Symptoms of this SARS-CoV infection include fever, malaise, myalgia, headache, diarrhea, rigors, and respiratory distress. In severe cases, intubation of the infected person to maintain oxygenation was necessary [1]. In December 2019, the world saw the emergence of the novel SARS-CoV-2 (COVID-19) in the Hubei province in Wuhan, China. The World Health Organization (WHO) declared SARS-CoV-2 a global pandemic on March 11, 2020 [5]. This article aims to serve as a systemic review of COVID-19 symptoms during an infection and seeks to understand the role of viral testing and clearance, relapses, asymptomatic persons, and sequelae after recovery.

Virus Nomenclature

Viral respiratory infection (VRI) is the name for several types of lung infections. Viral infections enter the body through the upper respiratory tract and can cause an upper respiratory infection or lodge in the lower respiratory tract and cause infection. Infections can be classified by the causative virus (i.e. influenza) or by the syndrome they cause (i.e. pneumonia) [6]. SARS and Avian Influenza are not seen as classic respiratory infections but are often classified along with 8 viruses that demonstrate spread through person to person contact causing infection in the respiratory system.

Virus Transmission and Infection

Viral respiratory infections replicate in ciliated cells of the lung causing cytolysis of the respiratory mucosa. Respiratory viruses generally have two main modes of transmission, large particle aerosols of respiratory droplets transmitted directly from person-to-person by coughing or sneezing, or by fomites. Fomite transmission occurs indirectly when infected respiratory droplets are deposited on hands or on inanimate objects and surfaces with subsequent transfer of secretions to a susceptible subject’s nose or conjunctiva.

In 2003, Li et al. determined that SARS entered human cells via the metallopeptidase, angiotensin-converting enzyme 2 (ACE2) [7]. Immunohistochemistry for localization of ACE2 was then performed by Hamming et al. in early 2004 [8]. Their research showed ACE2 was found in many human tissues including but not limited to the endothelial cells in arteries and veins, type 1 and type 2 alveolar epithelial cells, oral mucosa, nasal mucosa, the smooth muscle cells of the muscularis mucosae and muscularis propria of the stomach, small intestine, and colon. This wide distribution of ACE2 receptors in the body could be the reason for extensive symptoms of SARS-CoV-2 which has also been confirmed to enter the body via these receptors [9]. Analogous to SARS-CoV, SARS-CoV-2 stands for Severe Acute Respiratory Syndrome Coronavirus 2, which demonstrates fever, mild to severe respiratory symptoms, GI symptoms, and fatigue. As the virus continues to spread, many other symptoms and sequelae of this novel virus have been discovered.

The body often demonstrates a rapid and severe immune reaction to SARS-CoV-2 which leads to large amounts of cytokines released into the bloodstream. This release of cytokines leads to fever and has been dubbed a “cytokine storm”. The rapid release of cytokines causes fever, swelling, fatigue, and nausea. IL-6 is a major proinflammatory cytokine cited to be responsible for the severe immune reaction to SARS-CoV-2 [10]. It has been theorized that individuals who are immunosuppressed may not exhibit as severe a reaction to the virus.

Symptomology of Sars-Cov-2

Fever

Fever is a typical physiologic response to infection and has a protective effect. Fever has also been shown to enhance the immune system during infectious disease states [11,12]. During the COVID-19 pandemic, fever has been used as one of the main criteria of determining whether or not a person qualifies for nasopharyngeal testing due to its high association with infection. In one study, researchers found that fever was present in 88.5% of persons infected (Table 1) [13].

Table 1: CDC recognized symptoms of COVID-19 [11].

Fever or chills

Cough

Shortness of breath or difficulty breathing

Fatigue

Muscle or body aches

Headache

New loss of taste or smell

Sore throat

Congestion or runny nose

Nausea or vomiting

Diarrhea

Anosmia and Ageusia

Anosmia (the loss of smell) and ageusia (the loss of taste) are also symptoms reported by COVID-19 positive patients. In Trubiano et al. they hypothesize the loss of sensory function is due to the invasion of the olfactory neuroepithelium and the olfactory bulb [14]. This hypothesis is based on research showing substantial amounts of ACE2 in the respiratory system.

GI: Nausea, Diarrhea

SARS-CoV-2 enters cells via angiotensin-converting enzyme 2 (ACE2) which is present in the lung, airway epithelia, blood vessels, and cells of the small intestine [15]. This could explain why GI symptoms have been accounted for in almost 50% of patients with COVID-19. These symptoms include nausea, vomiting, diarrhea, and abdominal pain. A subset of those infected have shown predominately GI symptoms with little to no respiratory involvement [16].

Headache

In a meta-analysis by Bolay et al. researchers describe the headache caused by COVID-19 as a “moderate-severe bilateral headache with pulsating or pressing quality, exacerbated by bending over, in the temporoparietal region or sometimes more anteriorly to the forehead, periorbital area, and sinuses.” The study shows that 10% of patients reported headaches that were commonly unrelieved by common analgesics [17].

Hypercoagulability

COVID-19 associated hypercoagulability has been widely reported upon, although it has yet to be determined if the hypercoagulability is directly caused by SARS-CoV-2 infection or by the host immune response to the virus. Many markers of inflammation have been shown to be increased in patients with severe COVID-19 infections including increased d-dimer, PT, IL-6, CRP, ESR, and decreased levels of fibrinogen. Researchers have also discovered a COVID-19 endotheliopathy, likely due to viral entrance via ACE2 receptors, causing inflammation in host endothelial cells [18].

COVID Toes

Acrocyanotic lesions of the digits have been discovered in pediatric patients with suspected COVID-19 infections. Largely healthy appearing children have presented with reddish/purple lesions of the digits which then evolve to contain black crusts. The lesions have typically resolved within two weeks [19]. Dermatologists have noted pathology of the epidermis, dermis, and capillaries of the digits, including microthrombi in two cases [20]. It is hypothesized that the acrocyanotic lesions are due to microemboli associated with SARS-CoV-2 infection.

Cardiovascular

Although currently classified as a viral respiratory illness, SARS-CoV-2 has many devastating manifestations on the cardiovascular system. In some patients with severe COVID-19 infections, physicians are seeing an increase in troponin-I and troponin-T levels correlating to myocardial damage. Other cardiovascular complications include micro-infarctions, new-onset arrhythmias, myocarditis, and pericarditis [21]. It is still undetermined if damage to the myocardium is from the virus directly or from activated macrophages attempting to clear the virus.

Issues and Consequences of Infection

Relapse

There have been increasing reports of patients who test positive by reverse transcriptase polymerase chain reaction (RT-PCR) for SARS-CoV-2 after having been deemed recovered and discharged from the hospital. The World Health Organization (WHO) published guidelines that state a patient is able to be discharged after two consecutive negative PCR results 24 hours apart [22]. In Li et al. the researchers discovered the median RNA shedding period to be 53 days with other patients shedding even longer [23]. It has not yet been determined if the positive RT-PCR is due to persistent infection with false negative testing, or reinfection after discharge.

Sequelae of Infection

Persons infected with SARS-CoV-2 are seeing long term symptoms that have yet to go away including fatigue, weakness, low-grade fevers, shortness of breath, and tachycardia [24]. Other research is investigating whether or not SARS-CoV-2 can predispose a person to cancer [25].

Viral Testing

The standard testing for SARS-CoV-2 has been RT-PCR based assays of respiratory specimens gathered by nasopharyngeal swab without swabbing the tonsils or oropharynx. The nasopharynx is the primary site for swabbing due to the presence of the virus on day one of symptoms [26]. However, RT-PCR may not be the appropriate method of testing for asymptomatic individuals who may be carriers or in the incubation phase of infection. There have been documented cases of asymptomatic persons testing positive via stool specimens after testing negative via nasopharyngeal swab [27]. In addition to missing the asymptomatic persons with SARS-CoV-2, there has been an unusually higher number of persons suffering from co-infection with other respiratory viruses. In one cohort, 80% of patients were positive for co-infection with influenza A, influenza B, mycoplasma, or legionella pneumophila [28].

Other Biomarkers of Disease

Asymptomatic Carriers

A major complication of COVID-19 arises from those deemed “asymptomatic” after testing positive via RT-PCR and showing no symptoms of infection. Some of those asymptomatic patients go on to show signs and symptoms of the disease after a prolonged incubation period, but some never develop symptoms at all. In Kong et al. it is reported that 60% of all COVID-19 cases are potentially asymptomatic and 60% of those asymptomatic persons showed evidence of pneumonia on initial spiral CT (Table 2) [29-31].

Table 2: Testable markers in COVID-19 [18,29,30].

Increased

Decreased

C-Reactive Protein

Albumin

Lactate Dehydrogenase

Lymphocytes

Erythrocyte Sedimentation Rate

Leukocytes

Aspartate and Alanine Aminotransferases

Creatine Kinase

Bilirubin

Creatinine

Amyloid A

Procalcitonin

Discussion

SARS-CoV-2 affects more than the respiratory system; it appears to be a systemic illness. The wide variety and severity of symptoms may be attributed to SARS-CoV-2 beta coronavirus classification. Beta coronaviruses tend to act differently, with broader symptoms, more severe disease, and potential for entry of the virus through various modalities. There are also documented cases of SARS-CoV-2 where the respiratory system is spared. While the portal of entry can be the respiratory system, there are other ways in which people can become infected including GI and endothelial infection. The classic clinical picture of SARS-CoV-2 with cough, loss of taste, and fatigue may or may not be the most common presentation in the long term. As testing becomes more common, we will gain a better understanding of the range of illness. Until then, this respiratory syndrome could be considered part of a more severe acute systemic illness.

References

    1. World Health Organization (2020) SARS (Severe Acute Respiratory Syndrome). World Health Organization https://www.who.int/ith/diseases/sars/en/.
    2. Severe Acute Respiratory Syndrome (SARS) (2020) American Lung Association. https://www.lung.org/lung-health-diseases/lung-disease-lookup/severe-acute-respiratory-syndrome-sars
    3. SARS (2020) Centers for Disease Control and Prevention. https://www.cdc.gov/sars/index.html
    4. Betacoronavirus (2020) Betacoronavirus – an overview|ScienceDirect Topics. https://www.sciencedirect.com/topics/neuroscience/betacoronavirus
    5. Coronavirus disease 2019 (COVID-19) Situation Report-51 (2020) World Health Organization.
    6. Tesini B (2020) Overview of Viral Respiratory Infections – Infectious Diseases. https://www.merckmanuals.com/professional/infectious-diseases/respiratory-viruses/overview-of-viral-respiratory-infections
    7. Li W, Moore M, Vasilieva N, Jianhua Sui, Swee Kee Wong, et al. (2003) Angiotensin-converting enzyme 2 is a functional receptor for the SARS coronavirus. Nature 426: 450-454. [crossref]
    8. Hamming I, Timens W, Bulthuis M, AT Lely, GJ Navis, et al. (2004) Tissue distribution of ACE2 protein, the functional receptor for SARS coronavirus. A first step in understanding SARS pathogenesis. The Journal of Pathology 203: 631-637. [crossref]
    9. Xiao L, Sakagami H, Miwa N (2020) ACE2: The key Molecule for Understanding the Pathophysiology of Severe and Critical Conditions of COVID-19: Demon or Angel? Viruses 12: 491. [crossref]
    10. Moore JB, June CH (2020) Cytokine release syndrome in severe COVID-19. Science 368: 473-474. [crossref]
    11. Symptoms of Coronavirus (2020) Centers for Disease Control and Prevention. https://www.cdc.gov/coronavirus/2019-ncov/symptoms-testing/symptoms.html.
    12. Evans SS, Repasky EA, Fisher DT (2015) Fever and the thermal regulation of immunity: the immune system feels the heat. Nature Reviews Immunology 15: 335-349. [crossref]
    13. Li LQ, Huang T, Wang YQ, Zheng-Ping Wang, Yuan Liang, et al. (2020) COVID-19 patients’ clinical characteristics, discharge rate, and fatality rate of meta-analysis. J Med Virol 92: 577-583. [crossref]
    14. Jason A Trubiano, Sara Vogrin, Jason C Kwong, Natasha E Holmes (2020) Alterations in smell or taste – Classic COVID-19? Clinical Infectious Diseases [crossref]
    15. Klopfenstein T, Kadiane-Oussou NDJ, Royer P-Y, Toko L, Gendrin V, et al. (2020) Diarrhea: An underestimated symptom in Coronavirus disease 2019. Clinics and Research in Hepatology and Gastroenterology 44: 282-283. [crossref]
    16. Qureshi H (2020) The Digestive System and the COVID-19. Journal of the Pakistan Medical Association 70: 98-100.
    17. Bolay H, Gül A, Baykan B (2020) COVID-19 is a Real Headache! Headache: The Journal of Head and Face Pain.
    18. Connors JM, Levy JH (2020) COVID-19 and its implications for thrombosis and anticoagulation. Blood 135: 2033-2040. [crossref]
    19. https://www.fip-ifp.org/wp-content/uploads/2020/04/acroischemia-ENG.pdf Figure out how to Cite this one.
    20. El Hachem M, Diociaiuti A, Concato C, R Carsetti, C Carnevale, et al. (2020) A clinical, histopathological and laboratory study of 19 consecutive Italian paediatric patients with chilblain-like lesions: lights and shadows on the relationship with COVID-19 infection. J Eur Acad Dermatol Venereol.
    21. Su Yen-Bo, Kuo Ming-Jen, Lin Ting-Yu, Chien Chian-Shiu, Yang Yi-Ping, et al. (2020) Cardiovascular Manifestation and Treatment in COVID-19. Journal of the Chinese Medical 83: 704-709. [crossref]
    22. Hoang VT, Dao TL, Gautret P (2020) Recurrence of positive SARS-CoV-2 in patients recovered from COVID-19. Journal of Medical Virology.
    23. Li N, Wang X, Lv T (2020) Prolonged SARS-CoV-2 RNA shedding: Not a rare phenomenon. J Med Virol. [crossref]
    24. D’Ambrosio A (2020) COVID-19 Sequelae Can Linger for Weeks. Medical News and Free CME Online. https://www.medpagetoday.com/infectiousdisease/covid19/86482.
    25. Hays P (2020) Clinical sequelae of the novel coronavirus: does COVID-19 infection predispose patients to cancer? Future Oncology. [crossref]
    26. Sethuraman N, Jeremiah SS, Ryo A (2020) Interpreting Diagnostic Tests for SARS-CoV-2. Jama 323: 2249. [crossref]
    27. Tang A, Tong Z-D, Wang H-L, Ya-Xin Dai, Ke-Feng Li, et al. (2020) Detection of Novel Coronavirus by RT-PCR in Stool Specimen from Asymptomatic Child, China. Emerging Infectious Diseases 26: 1337-1339. [crossref]
    28. Xing Q, Li G, Xing Y, et al. (2020) Precautions are Needed for COVID-19 Patients with Coinfection of Common Respiratory Pathogens.
    29. Procalcitonin in patients with severe coronavirus disease 2019 (COVID-19): A meta-analysis. Diagnostics.
    30. Li H, Xiang X, Ren H, et al. (2020) Serum Amyloid A is a biomarker of severe Coronavirus Disease and poor prognosis. Journal of Infection 80: 646-655.
    31. Kong W, Wang Y, Hu J, Chughtai A, Pu H (2020) Comparison of clinical and epidemiological characteristics of asymptomatic and symptomatic SARS-CoV-2 infection: A multi-center study in Sichuan Province, China. Travel Medicine and Infectious Disease.
fig 9

A Large Palatal Swelling – Not Just a Dental Abscess

DOI: 10.31038/JDMR.2020343

Abstract

Patients routinely present with intra oral swellings and commonly these are caused by dental abscesses. This case however, highlights the importance of having a differential diagnosis, and the pitfalls of managing such lesions, especially during the COVID-19 pandemic.

This report discusses a 34-year-old gentleman who presented in the Emergency Department with an intra oral swelling which appeared to be odontogenic in origin. Initially diagnosed as a dental abscess from an upper posterior tooth which was incised and drained, it was later found that the swelling was caused from cystic pathology associated with a root treated upper anterior tooth. His delayed management was due to poor attendance in primary care and this case will highlight the clinical features of his presentation and the appropriate treatment moving forward.

Clinical Relevance: To make the general dental practitioner (GDP) aware those intra oral swellings can have a multifactorial aetiology and a thorough examination is required to ascertain a definitive diagnosis and prompt referral where necessary, in order to plan the correct treatment successfully. This patient was an irregular attender in primary care, thus compromising his clinical management.

Objective Statement: To demonstrate how a common complaint must be investigated thoroughly in order to achieve a successful outcome.

Introduction

Intraoral swellings are a clinical presentation of a wide range of pathology, and clinicians should use a diagnostic sieve to rule out possible causes (Figure 1). Often intra-oral swellings can be associated with a non-vital tooth, which can cause a periapical abscess, whereby bacteria and their associated toxins spread through the apical foramen of a tooth and cause abscess formation [1]. Chronic infection in the apical tissues can initiate the development of an inflammatory cyst.

fig 1

Figure 1: Diagnostic sieve showing potential aetiology of intra oral swellings.

A cyst is a pathological cavity with fluid or semi-fluid contents lined by epithelium. Epithelial odontogenic cysts can be classified as developmental or inflammatory in origin depending on where they have been derived from, however the broad discussion of these is not within the scope of this paper. Figure 2 shows a brief overview of epithelial derived odontogenic cysts.

fig 2

Figure 2: Classification of common epithelial odontogenic cysts.

A radicular cyst arises from longstanding chronic apical infection in a non-vital tooth which stimulates the proliferation of epithelial cell remnants. These originate from the root sheath of Hertwig and are known as the cell rests of Malassez [2]. Radicular cysts are the most common odontogenic cyst in the head and neck and 60% present in the maxilla [3]. They can be found at the apex of the tooth or originate laterally from accessory root canals.

Cysts can either be sterile or become secondarily infected and this can cause both a diagnostic and management challenge.

Case Presentation

A 34-year-old gentleman presented in the Emergency Department at the Princess Royal Hospital in Telford. He was originally due for surgical drainage of a pilonidal abscess in a sister hospital however this was postponed due to his presenting complaint of an intraoral swelling. He was consequently referred to the oral and maxillofacial surgery team.

He reported a 7-year history of recurrent mouth abscesses and dental pain, with the most recent presentation persisting for 3 months. He complained of an intermittent bilateral palatal swelling which felt more right sided on the day of presentation. He also complained of anosmia after a head injury 5 years ago and difficulty breathing through his right nostril as his sinuses felt ‘constantly congested.’ He had previously drained the swelling himself on the left side of his palate with a Stanley knife.

Medically he was fit and well and had no known drug allergies. He smokes 20 cigarettes daily and drinks roughly 16 units of alcohol a week, and at the time of presentation, he did not have access to a general dental practitioner (GDP).

Initial Examination

On examination, his ABCDE assessment showed no abnormalities, he had stable observations, and an unremarkable extra-oral examination.

Intraoral examination demonstrated a generalised neglected and partially restored dentition. There was a fluctuant buccal swelling adjacent to the UR6 and a separate diffuse, firm unilateral palatal swelling extending posteriorly up to the soft palate on the right side. There was no draining sinus intra orally, but he had previously recalled the taste of pus and blood. No teeth were tender to percussion or mobile.

An orthopantomogram (OPG) was requested and can be seen in Figure 3. The OPG shows a moderately restored dentition, gross caries affecting multiple teeth and generalised horizontal bone loss. The UR2 has a suboptimal root filling which appears short of the apex and has associated periapical radiolucency. Readers are advised to see how sometimes a large cystic lesion in this area can present as a pneumatised sinus on an OPG, and due to the presence of the lesion over the maxillary sinus on the right hand side, a clear diagnostic view on the likely size of this lesion was challenging by plain film radiography alone.

fig 3

Figure 3: OPG taken on initial presentation highlighting pathology in the right maxillary antrum.

Management

Although the patient had presented with what seemed to be a chronic lesion, the acute swelling had to be managed initially. Under local anaesthesia, the fluctuant buccal swelling adjacent to the UR6 was incised and drained. Pus and blood exuded from the swelling and the patient noticed a relief in pressure in the area. The unilateral right sided palatal swelling remained mobile and intact. A course of antibiotics was prescribed and post-operative instructions were given. The patient was booked for follow up and further diagnostic imaging was requested.

A follow up computed tomography (CT) scan of the sinuses was arranged in order to assess the extent and likely cause of the lesion. The CT scan reported a large cystic unilocular lesion arising from the right maxillary alveolus, likely to be of dental origin. It showed marked superior invagination and expansion of the right maxillary sinus and a defect in the hard palate. Superiorly, a wafer-thin cortex of bone separated the lesion from the ethmoidal sinus. The lesion measures 5cm anterior-posteriorly, 4cm medial-laterally and 4.3cm craniocaudally (head to toe).

Figure 4 shows a coronal view of the lesion at its greatest width, occupying the nasal cavity on the right side. Comparing this to the left side, the lesion is clearly showing its expansion into the right inferior turbinate. Figures 5-8 demonstrate the shape and size of the lesion moving coronally in the axial view. Figure 5 demonstrates the relationship of the lesion with the UR2 and Figure 6 shows how the lesion extended buccally adjacent to the UR6. This explains the presentation of a buccal abscess adjacent to UR6, the palatal swelling, the anosmia and the history of right sided sinus congestion. Odontogenic disease is thought to be responsible for 10-12% of maxillary sinusitis cases and therefore clinicians should always consider this possibility when a patient reports sinus like symptoms [4].

fig 4

Figure 4: Coronal cross-sectional view highlighting the radicular cyst occupying right nasal cavity and inferior turbinate.

fig 5

Figure 5: Axial cross-sectional view highlighting the radicular cyst arising from UR2 tooth growing palatally.

fig 6

Figure 6: Axial cross-sectional view highlighting the radicular cyst growing buccally adjacent to UR6 tooth.

fig 7

Figure 7: Axial cross-sectional view highlighting the radicular cyst invading the right hard palate.

fig 8

Figure 8: Axial cross-sectional view highlighting the radicular cyst occupying right nasal cavity.

After discussion with the patient, he agreed to a general anaesthetic procedure for biopsy and marsupialisation of the suspected cyst. Under general anaesthetic, the opportunity was used to remove other teeth of a poor long-term prognosis, namely the UL2 and LL56. The UR2 was also removed as part of the process of marsupialisation of the cyst.

A large buccal flap was raised and the bone overlying the cyst was carefully removed to enable adequate access. A biopsy of cyst lining was taken and the cyst underwent marsupialisation, whereby the cyst lining was sutured to form a continuous layer with the buccal mucosa (Figure 9). Upon discharge, the patient was given smoking cessation advice, instructions on regular saline irrigation to the area with the use of a monojet syringe and a course of oral antibiotics.

fig 9

Figure 9: Marsupialisation of a cyst. (a) Pre-operative view of cyst originating from non-vital tooth. (b) Flap raised with buccal bone removal (with round bur shown) to gain access to cyst lining. (c) Cyst opened, drained and lining sutured to the oral mucosa. This prevents an osmotic pressure gradient forming, allowing the cyst to reduce in size prior to enucleation.

Due to the size of this lesion, it was felt prudent to obtain a good quality histological sample prior to attempting enucleation. Although the CT scan and OPG appeared to show that the lesion was associated with the UR2, an odontogenic keratocyst could not completely be ruled out. As the enucleation of an odontogenic keratocyst is more involved (often involving the use of Carnoy’s solution due to the cysts higher recurrence rate of up to 60% [5]), a definitive diagnosis was sought prior to a planned enucleation.

The histology showed a fibrous walled cyst lined by a hyperplastic squamous epithelium showing severe active chronic inflammation including hemosiderin – laden macrophages. These findings were consistent with the clinical impression of a radicular cyst.

The planned management for this patient was a follow up assessment of the lesion both clinically and radiographically. Once the cyst had reduced in size as a result of the marsupialisation, an enucleation was planned with a possible Caldwell-Luc approach. By carrying out an initial marsupialisation, any reduction in cyst size will have fewer profound complications compared to an enucleation at the same time of initial biopsy. At the time of writing this paper, the patient is currently due for follow up post marsupialisation, however due to the COVID-19 pandemic, this has been delayed.

Aetiology

The pathogenesis of a radicular cyst is a direct sequel to an apical granuloma. This is a sequel to chronic apical periodontitis which results in inflammatory cell, granulation and scar tissue formation in the periradicular tissues of a non-vital tooth. It is important to note that a granuloma need not always develop into a radicular cyst [6].

The development of a radicular cyst can be broken down into three phases; cyst initiation, cyst formation and cyst enlargement [2,6].

Cyst Initiation

As a result of the chronic inflammatory processes at the apex of the non-vital tooth, the dormant epithelial cell rests of Malassez derived from the root sheath of Hertwig, begin to proliferate. This proliferation is influenced by bacterial endotoxins, epidermal growth factors and cytokines released by various cells in the periapical lesion [2,6,7].

Cyst Formation

It is believed that the growth of these epithelial cells reaches a critical point where central cells are starved from their source of nutrition and undergo necrosis and liquefactive generation. These microcavities containing degenerative epithelial cells and tissue fluid coalesce to form a cyst cavity lined by stratified epithelium [2,6,7].

Cyst Enlargement

The exact mechanism of cyst growth is not fully understood however it is generally believed to be linked to osmosis. The necrosis of central cells and lytic breakdown products increases the osmotic pressure within the cyst compared to the surrounding stroma. This gradient draws fluid into the cyst via osmosis and increases the hydrostatic pressure. The volume expansion causes peripheral epithelial cell growth in order to maintain the cyst lining. Continuous shedding of central cells maintains an osmotic gradient causing further cyst growth, bony expansion, bone resorption and cortical thinning [8]. The average rate of expansion is thought to be roughly 5 mm per year [7].

In this case, it is likely that the cyst has been present for many years, given the history of the patient being told by his GDP “many years ago” that the UR2 tooth was of a poor long-term prognosis and should be removed.

Relevance for General Dental Practitioners (GDPs)

The case discussed shows the importance of a thorough history, clinical and radiographic examination of any patient that presents with an intra-oral swelling. The phrase ‘common things occur commonly’ often comes to mind however GDPs should not disregard uncommon and rare diagnoses which may present initially in primary care. The duration of a presenting complaint may guide diagnosis. For example, a buccal abscess may present as a two-week history of swelling whereas a large radicular cyst may present as a seven-year history of swelling.

Taking appropriate imaging is vital in achieving an accurate diagnosis and clinicians should prompt referral where necessary. It is important to note that these lesions cannot be definitively diagnosed without biopsy and histology testing.

As a rough rule, ovoid and well circumscribed periapical radiolucencies greater than 1-1.5cm in diameter may be indicative of a cyst or other pathology [9,10]. If an extraction is carried out and the cyst lining is not removed, it has the potential to remain (as a residual cyst) and continue to expand. As a result, extraction sockets should carefully be curetted to remove any granulation tissue or cyst lining that may be present.

Another treatment option to consider for these lesions is an apicectomy with removal and curettage of the associated cyst, provided that the tooth has a sound root canal treatment and coronal restoration. This is however dependent on the extent of the apical pathology.

Depending on the size of the radiolucent area radiographically, referral may be indicated.

Timely referral to secondary care in cases like these drastically improves patient outcomes and their overall treatment experience. In the above case, it is likely that the cyst has been present for some time, and unfortunately although the patient was told by his GDP when the lesion was possibly a lot more manageable, the patient reported moving geographic location and had not sought dental treatment for many years. This likely allowed for continued enlargement and expansion of the cyst. These can often remain asymptomatic until complications arise.

Conclusion

The majority of intra oral swellings are managed effectively in primary care however at times, further investigation and referral to secondary care or specialist services is required. The case discussed shows how thorough examination and accurate diagnosis are vital to allow effective management of these more complicated cases. It is thought that over 40% of periapical radiolucencies are cystic [7] and it is imperative the GDP manages these effectively as patients will routinely present to them for first line treatment in an emergency scenario.

References

  1. Siqueira JF, Rôças IN (2013) Microbiology and Treatment of Acute Apical Abscesses. Clin Microbiol Rev 26: 255-273. [crossref]
  2. Ward JP, Magar V, Franks SJ, Landini G (2004) A mathematical model of the dynamics of odontogenic cyst growth. Anal Quant Cytol Histol 26: 39-46. [crossref]
  3. Narula H, Ahuja B, Yeruli R, Baliga S, Munshi AK (2011) Conservative non-surgical management of an infected radicular cyst. Contemp Clin Dent 2: 368-371. [crossref]
  4. Chapman MN, Nadgir RN, Akman AS et al. (2013) Periapical Lucency around the Tooth: Radiologic Evaluation and Differential Diagnosis. Radiographics 33: 15-32. [crossref]
  5. Fidele NB, Yueyu Z, Zhao Y, W Tianfu, J Liu et al. (2019) Recurrence of odontogenic keratocysts and possible prognostic factors: Review of 455 patients. Med Oral Patol Oral Cir Bucal 24(4): 491-501. [crossref]
  6. Latoo S, Shah A, Jan S, et al. (2009) Radicular cyst. JK Science 11: 187-189.
  7. Soames JV, Southam JC (2005) Oral Pathology (Fourth Edition). New York: Oxford University Press.
  8. Cawson RA, Odell EW (2008) Cawson’s Essentials of Oral Pathology and Oral Medicine (Eighth Edition). Churchill Livingstone Elsevier.
  9. Scholl RJ, Kellet HM, Neumann DP, Lurie AG (1991) Cysts and Cystic Lesions of the Mandible: Clinical and Radiologic-Histopathologic Review. Radiographic 19: 1107-1124. [crossref]
  10. Dunfee BL, Sakai O, Pistey R, Gohel A (2006) Radiologic and Pathologic Characteristics of Benign and Malignant Lesions of the Mandible. Radiographics 26: 1751-1768. [crossref]
fig 1

Evaluation of Bone Regeneration Efficacy in a Rabbit Model of Femoral Condyles Defect by Polyphenols-Containing Bone Filler

DOI: 10.31038/JDMR.2020334

Abstract

The purpose of this study was to evaluate the local biological effects and bone regeneration efficacy of a polyphenols-enriched ceramic bone filler. To this end, a test article (NBR_Purple) a biphasic phosphate ceramic plus polyphenols from grape pomace and the same material without polypohenols (NBR_White), were implanted in the medial condyle of the femur bone of rabbits for 56 days. A control article of clinical use (Ostim ®), was implanted as the first control condition. There was a second control by performing the same defect at the same location but without any implanted material (void condition). Histological examination at the end of the test period shows statistically significant improvement of bone regeneration by the polyphenol-enriched material over the same material without polyphenols, supporting literature data on the involvement of polyphenol molecules in bone regeneration pathways.

Keywords

Bone filler, Polyphenols, In vivo test, Osteointegration, Histology

Introduction

Replacement of bone loss or reconstruction of bone defect is still a clinical challenge. Different type of bone substitutes are used in clinical practice for treating bone defect caused by trauma, osteoporosis or dental pathology such as periodontitis [1,2]. The mode of action of the biomaterials available on the market mainly relies on mechanical support and is thus limited to providing a functional scaffold for cell adhesion. Synthetic bone fillers, mostly based on calcium phosphate materials, have been widely used due to their good reproducibility, biocompatibility, non-immunogenicity, and also because they offer the opportunity of advanced material engineering [3,4]. Hydroxyapatite (HA) and β-tricalcium phosphate (β-TCP) are widely used in bone tissue engineering as bone filler particles [5,6].

Polyphenols are chemical compounds synthetized by plants, widely diffused in the vegetable kingdom. They exert a defense action. Grape is among fruits which contain high quantity of polyphenols, in particular red grape [7,8]. The involvement of different classes of polyphenols in molecular pathways that can involve the regeneration of bone tissue is widely studied [9-13]. A role for polyphenols in the local control of inflammatory diseases leading to bone loss, such as periodontitis or osteoporosis, has been discussed in the literature [14-23]. Coupling of polyphenols to ceramic bone fillers could spawn a new generation of materials for bone regeneration, endowed with mechanical support and biological stimulation properties. In this work we describe the in vivo outcomes of a calcium phosphate bone filler containing polyphenols from red grape pomace, implanted for 56 days in the medial condyle of the femur bone of rabbits, showing that the presence of polyphenols enhances bone regeneration properties of the biomaterial.

Materials

All chemicals were analytical-reagent grade and were purchased from Sigma-Aldrich. Red grape pomace was purchased from a local winery producer (Croatina grape from ALEMAT, Penango, AT, Italy). Ultra-pure (MilliQ) water was used for the preparation of aqueous solutions. Commercially available bone filler Ostim ® has been purchased on the market.

NBR_White

HA was used for enhancing the mechanical strength of scaffold, whereas β-TCP for its degradability; they were mixed in a percentage of 50 wt.%, respectively, to reach an optimum compromise between the two properties. The ceramic scaffolds were prepared by mixing HA and β-TCP powders (47 wt.%) with a binding agent (poly (vinyl alcohol), 3 wt.%), and ultrapure water (50 wt.%) to obtain a ceramic slurry. Dolapix CE 64 was added as a dispersing agent (1 wt.% of the solid load). The polyurethane (PU) sponge impregnation method was used to obtain a macroporous ceramic scaffold [24,25]. A commercial PU sponge slab (45 ppi) of 200 x 200 x 10 mm3 was soaked into the ceramic slurry for 90 s, followed by compression along the transverse plane (40 kPa) and left at room temperature for 5 min before repeating the cycle. Impregnation/compression cycles were repeated for 3 times. The ceramic-coated PU sponge was left to dry overnight at 37°C and sintered in a furnace at 1100°C for 12 h in air (heating rate 5°C/min), in order to obtain a porous HA/βTCP slab of 200 x 200 x 10 mm3 (a volumetric retention of 24 % was calculated). The obtained porous slab was grinded by a jaw crusher (BB 50, Retsch) and sieved in order to obtain a 300 μm – 1000 μm porous grained granulate (ceramic granulate, CG). To make the material injectable, the obtained particles were mixed with a 0.5 % v/v solution of Collagen from porcine source in a rate of 90:10 granulate:collagen solution.

Preparation of Polyphenols Rich Pomace Extract

Croatina grape pomace was received in dry form from the producer and stored at -20°C under vacuum until the beginning of the extraction process. In order to make them suitable for the extraction process, grape pomace were first washed with acidified water, dried in a circulating-air oven (37°C ± 5°C) and grinded in a bladed mill (GM 200, Retsch). The milled grape pomace (300 g) were extracted in 2000 mL of 50:50 acetone:water (v/v) by using an automatic extractor (TIMATIC Micro C). The extraction cycle is fully automatic and alternates a dynamic phase, performed at a programmed pressure, and a static phase in which a forced percolation is generated, which, thanks to the programmable recirculation, ensures a continuous flow of solvent to the interior of the plant matrix thus avoiding over-saturation. Next, the extracted solution was concentrated under reduced pressure in a rotavap and maintained in fridge between 2-4°C. Full characterization of the polyphenols enriched extracts is provided in reference [26]. As reported in the just quoted paper, main identified components include gallic acid (9.42 µg/ml), caffeic acid (1.59 µg/ml), cumaric acid (0.21 µg/ml), quercetin (2.06 µg/ml), rutin (0.19 µg/ml), malvidin-3-glucoside (37.2 µg/ml). This deeply purple-stained croatina grape pomace extract shows a total anthocyanin content of 446.7 µg/ml [26].

NBR_Purple

NBR_Purple was produced by soaking the ceramic granulate with the Polyphenols rich pomace extract in a percentage of 40 % and 60 % respectively, followed by a 24 h of evaporation process which allows the ceramic granulate to be enriched with the polyphenol molecules (Pph). Then, the ceramic granulate functionalized with polyphenols were mixed with 0.5 % v/v collagen solution from porcine source, in the ratio 90:10, to make the material injectable.

Study Design

Review and approval by the Ethical Committee of the Universidad Politécnica de Valencia were obtained prior to conduct of the study. For each rabbit, one defect measuring approximately 2 mm x 5 mm deep was created in each medial condyle at a distal position of the femur. A second defect measuring approximately 2 mm x 10 mm deep was created in each medial condyle at a proximal location of the femur (Figure 1). For that reason, each animal had four defect sites, two on each medial condyle. Three different materials and a void were implanted on each animal. The response of NBR_Purple material (test article) was compared to NBR_White (control article), Ostim® and void. Ostim® is a synthetic nanocrystalline HA bone graft, containing about 65% water and 35 % nanostructured HA particles. Evaluations were conducted at 56 days.

fig 1

Figure 1: Proximal and distal locations of bone defects at the medial condyle of rabbit femur.

This study had two end-goals:

    1. Evaluation of local biological effects after implantation based on the requirements of ISO 10993-6:2007 (Annex E) [27].
    2. Performance study by the analysis of % area occupied by trabecular bone.

Distribution of materials in distal and proximal sites at the right and left femoral condyle are reported in Table 1.

Table 1: Distribution of materials in distal and proximal sites.

Right condyle

Left condyle

Animal #

Cage # Distal Proximal Distal

Proximal

481 2 NBR_Purple NBR_White Ostim

Void

482

3 Void NBR_Purple NBR_White

Ostim

483

4 Ostim Void NBR_Purple NBR_White
484 5 NBR_White Ostim Void

NBR_Purple

486

7 Void NBR_Purple NBR_White Ostim
487 8 Ostim Void NBR_Purple

NBR_White

488

9 NBR_White Ostim Void NBR_Purple
489 10 NBR_Purple NBR_White Ostim

Void

Animal Test System

Eight New Zealand White rabbit were used for the study. Characteristics Of the animals are reported in Table 2. The rabbit is widely used for evaluation articles intended for clinical implantation. The medial condyle of the femur provides a cancellous bone site, which will mimic the bone sites of clinical use. The rabbit is a small common laboratory species with bones of sufficient size to provide meaningful data and it is accepted by ISO 10993-6:2007 as experimental animal [27]. Any response to the implanted article can be graded and compared to that of a control article.

Table 2: Test system characteristics.

Species Rabbit (Oryctolagus cuniculus)
Breed New Zealand White
Source ISOQUIMEN
Sex Female
Body Weight Range 3.6 kg to 4.0 kg at implantation
Age Approximately 20 weeks at implantation
Other conditions Nulliparous, skeletally mature
Acclimatation period 2 weeks at IBV animal facilities
Number of animals Eight
Identification method Ear tag and cage card

The rabbits were weighed. Pre-anaesthetic and anaesthetic procedures are described in Table 3. The analgesic protocol is described in Table 4. Each rabbit received an intramuscular injection of the antibiotic enrofloxacin at 10 mg/kg. After the anaesthetic had taken effect, rabbits were clipped free of fur over the lateral and medial aspects of the rear legs from the wing of the illium to the tarsus. The surgical sites were painted with povidone iodine and draped.

Table 3: Pre-anaesthetic and anaesthetic procedures.

Phase

Product Via Dosis [mg/kg]

Concentration [mg/mL]

Pre-anaesthesia

Xylazine Clorhydrate

IM 3.12

20

Pre-anaesthesia

Ketamine Clorhydrate

IM 17.5

100

Anaesthesia-Induction

Propofol

IV 3

1%

Anaesthesia-maintenance

Propofol

IV 21 mg/kg/h

1%

Table 4: Analgesic procedure.

Phase

Product

Via Dosis [mg/kg] Concentration [mg/mL]

Frequency

Pre-surgical

Butorphanol tartrate

IM 0.4 10

Once

Post-surgical immediate

Fluxin meqlumine

SC 1 50

Once

Post-surgical immediate

Butorphanol tartrate

IM 0.4 10

Once

Post-surgical deferred

Butorphanol tartrate

IM 0.4 10

3 days after surgery

Implantation Procedure

The surgical site was draped, using sterile technique, the medial aspect of the distal epiphysis of the femur over the medial condyle was exposed through a routine surgical approach. Following exposure of the bone, an initial first pilot hole was created, using a drill with an approximate 1 mm bit, centred between the distal border of the epiphysis and the insertion of the medial head of gastrocnemial muscle. Using a power drill with an approximate 2 mm drill bit, the hole was enlarged to approximately 2 mm in diameter. This distal defect had an approximate depth of 5 mm, which it was controlled with a depth gauge placed in the drill. The material was implanted following the distribution shown in Table 1. A second defect (proximal site) was created in a similar way approximately 2-3 mm away from the first implantation site. In this proximal site, the implanted material follows the distribution shown in Table 1. The proximal defect had an approximate depth of 10 mm. The articles were placed in the bone defect to fill the void and remain flush with the cortical surface. The fascia and subcuticular layer were closed with 4-0 absorbable suture and the skin was closed with an intradermal suture technique. The day of implantation was designated as Day 0. A similar procedure was followed to create the other two bone defects on the contralateral medial condyle. The materials were implanted following the distribution shown in Table 1. Two materials on each medial condyle and four materials per animal were implanted.

Each rabbit was moved to a recovery area and was monitored for recovery from anaesthetic. Once sternal recumbency was achieved, each rabbit was returned to its cage. Analgesic protocol is shown in Table 4.

Rabbit were observed daily for general health, especially at the incision site. Body weights were recorded for all animals prior to implantation, and weekly thereafter and prior to termination.

Terminal Procedures

At 56 days after implantation, the eight rabbits were euthanized. Rabbits were weighed and each rabbit was euthanized with an intravenous injection of sodium pentobarbital-based euthanasia solution. The bone implant sites and adjacent muscle tissue were examined macroscopically and the observations were recorded. Any adverse observations at the implant sites were described. Each femur was dissected free and removed. Femurs were cut as appropriate to allow the fixative (ethanol 70%) to penetrate the bone tissue for proper fixation.

Histological Procedures

Histological procedures based on undecalcified bone samples embedded in PMMA to be cut with rotary microtome are published elsewhere [28]. The defect sites with implants in place were removed by making transverse cuts through the bone proximal and distal to each implant site, taking care not to disturb the sites themselves. Each bone section was labelled to indicate its original location. From 4 to 7 slides for each block was prepared as a transverse section of the bone through the diameter of the defect and stained with toluidine blue at pH 3.5. The identity (animal number, left/right) of each bone section was maintained during processing. Each slide shows a transverse section of the medial condyle with both implantation sites (Figure 1).

The slides related to NBR_Purple and NBR_White were provided to a pathologist for the evaluation of local biological effects after implantation following the criteria described in Annex E of ISO 10993-6:2007 [27]. Six fields (400x magnification) were analysed for each of the slides, totalizing between 24 and 42 fields for the defects analysed of each independent specimen. The histological evaluation was done following standardized procedures of our laboratory. The quantification of the biological effects has been done following the instructions of the ISO 10993-6:2007 standard. In this study 16 different specimens corresponding to an epiphyseal section from both the left and right extremities of rabbit femur have been included. The specimens were toluidine blue‐stained.

Evaluation of Local Biological Effects

Microscopic analysis revealed two areas of interest in each of the specimens included one closer to the medullary canal (proximal region) and the other one localized further from that (distal region). In the bone defects, the testing biomaterials have been implanted. In some cases the defects were left empty to serve as control. The cavities have a spheroid shape and the diameter ranges from 1.10 to 4.28 mm. In the surgical entry, a thickening of fibrotic dense connective tissue could be observed, which in some cases presented biomaterial fragments, probably due to the surgical procedure. In these cases connective organized structures associated with these fragments could be observed. This connective tissue is characterized by fibroblasts and macrophages accumulation as well as by an increased vascularization.

NBR_Purple Material

NBR_Purple material was implanted in 8 specimens, 4 of them corresponding to right and 4 to left condyles. In 4 specimens the implant area is located in the proximal region, while in the other 4 in the distal region. Between 7 and 4 slides of each specimen were included in this study.

NBR_White Material

This biomaterial was implanted in 8 specimens, 4 corresponding to right and 4 to left condyles. In 4 specimens the biomaterial was implanted in the proximal region and in the other 4 in the distal region. 4‐6 slides for each of the specimens were included in this study. Quantitative analysis was performed at 400 x magnification in 6 representative fields of each of the slides included in the study.

Performance Study

Digital pictures were obtained with a video camera (Sony, Exwave HAD) attached to a macroscope (Wild, M420) with a resolution of 97.5 pixel/µm at 7.8 x magnification. The squared region of interest was defined as centred at the middle point of the implant and with a 4-mm side, which it is twice the size of the bone defect diameter. Image processing techniques based on mathematical morphology was implemented in programming macros to specifically threshold the trabecular bone to calculate % area occupied by this tissue [29,30] (ImageJ, 1.49d, Rasband, W.S., U. S. National Institutes of Health, Bethesda, Maryland, USA, http://imagej.nih.gov/ij/, 1997-2014). Five slides of every condyles (left and right) including all materials (NBR_Purple, NBR_White, Ostim, void) were studied.

Statistical Analysis

Statistical analysis of the % area occupied by trabecular bone was conducted. To perform means comparison the method employed is one-way analysis of means (not assuming equal variances) and the pairwise comparisons between materials using t tests with pooled standard deviations (R, version 2.15.1, The R Foundation for Statistical Computing). Statistical analysis of bone regeneration within the defect is presented as box plot. The box represent the 25 and 75 percentiles and the horizontal line in the box represents median value. Lines outside the box represent minimum and maximum values [31]. Average value is represented as a blue point.

Results

Macroscopic Observation

All animals gained weight over the course of the study. Eschar and skin lesions associated with the incision lines were observed for most incisions. These skin lesions were considered a common occurrence associated with surgery at this site in rabbits and did not represent any adverse reaction to the tested biomaterials (Table 5). In the weeks following the surgery, incision sites in all animals were perfectly closed and furs cover the waxed area. Only animal 481 on day 1 showed an opened end that needed a second suture following the standard suture procedure. In this case, skin wound evolution was also good. An antiseptic was applied to the sites to prevent any possible infection and all sites healed without further complications.

Table 5: Macroscopic observation.

Animal number

Left leg

Right leg

481 Implant site and muscle were macroscopically normal Implant site and muscle were macroscopically normal
482 Implant site and muscle were macroscopically normal Implant site and muscle were macroscopically normal
483 Implant site and muscle were macroscopically normal Implant site and muscle were macroscopically normal
484 Implant site and muscle were macroscopically normal Implant site and muscle were macroscopically normal
486 Implant site and muscle were macroscopically normal Implant site and muscle were macroscopically normal
487 Implant site and muscle were macroscopically normal Implant site and muscle were macroscopically normal
488 Implant site and muscle were macroscopically normal Implant site and muscle were macroscopically normal
489 Implant site and muscle were macroscopically normal Implant site and muscle were macroscopically normal

Microscopic Evaluation

Evaluation of Local Effects After Implantation

Osteointegration efficacy was evaluated implanting NBR_Purple material in the medial condyle of the femur bone of rabbits for 56 days. NBR_Purple was compared with a NBR_White bone filler, without polyphenols extract, and a commercial bone filler Ostim ®. At 56 days of implantation, a non-irritant response (index=0.0) was seen with the test (NBR_Purple) as compared to the control bone filler (NBR_White) following the comparison procedure proposed by Annex E, ISO 10993-6.

In Figure 2 are reported the percentage of area occupied by trabecular bone after 56 days of implantation, for NBR_Purple, NBR_White, Void and Ostim material, at distal site. NBR_Purple and Ostim showed the best results (42.9 ± 10.6 and 40.7 ± 5.9, respectively) followed by NBR_White (32.0 ± 9.2) and Void (28.3 ± 8.1). For NBR_Purple, there were significant differences with NBR_White and Void and there were no significant differences between NBR_Purple and Ostim (Tables 6 and 7).

fig 2

Figure 2: Box and whiskers plot of the four articles analysed at the distal site.

Table 6: Statistics descriptive at distal site.

Distal

Statistic Description

Material

Valid N

Minimum Maximum Mean

St. Dev.

NBR_Purple

22

32.11 62.48 42.92

10.65

Ostim

21

32.3 57.22 40.67

5.95

NBR_White

21

21.41 45.91 32.04

9.19

Void

20

14.47 39.51 28.28

8.15

Table 7: Pairwise comparison at distal site using t test with pooled standard deviation.

NBR_Purple

NBR_White

Ostim

NBR_White

< 0.001

Ostim

0.39773

0.00187

Void

< 0.001

0.16914

< 0.001

Figure 3 shows the percentage of area occupied by trabecular bone at proximal site, Ostim showed the best results (25.7 ± 10.6) followed by NBR_Purple (20.3 ± 10.1) and NBR_White (12.9 ± 2.2). Tables 8 and 9 report the statistical analysis among the bone filler.

fig 3

Figure 3: Box and whiskers plot of the four articles analysed at the proximal site.

Table 8: Statistics descriptive at proximal site.

Proximal

Statistic Description

Material

Valid N

Minimum Maximum Mean

St. Dev.

NBR_Purple

20

3.63 33.13 20.26

10.11

Ostim

21

7.35 40.52 25.73

10.62

NBR_White

20

7.43 17.40 12.92

2.88

Void

21

7.75 15.71 11.96

2.16

Table 9: Pairwise comparison at proximal site using t test with pooled standard deviation.

NBR_Purple

NBR_White

Ostim

NBR_White

0.00294

Ostim

0.02309

< 0.001

Void

< 0.001

0.68414

< 0.001

In all cases, higher value of area occupied by trabecular bone are observed at distal site by comparison with proximal site. This observation could be due as it is an area with more density of trabecular bone. Besides, proximal zone is very close to the beginning of the medullary canal and the dispersion of the material in this canal could be more frequent than expected.

Figure 4 reported the histological images for the specimens’ number 487I, NBR_Purple bone filler. An area of 3.20 mm of diameter with several new-formed spongy bone tissue could be observed. This tissue contained small and isolates biomaterial deposits. In some locations, fatty tissue and macrophages could be observed. Several bone-forming and bone-resorption cells could be observed (Figure 4A-4C).

fig 4

Figure 4: Histological section of NBR_Purple implanted in sample 487I.

The same sample, 487I, is represented in Figure 5 for NBR_White. Histological images of this sample presented a 3.40 mm diameter spheroid area with small biomaterial deposit surrounded by fatty tissue, which presented in some locations a moderate inflammatory infiltrate along with venous sinuses.

fig 5

Figure 5: Histological section of NBR_White implantend in sample 487I.

Discussion

Polyphenols are attracting more and more attention in the field of bone regeneration thanks to their anti-oxidant and anti-inflammatory properties [15,32,33]. In particular, in the field of oral health, clinical evidence has shown that flavanoids have beneficial effect on periodontitis [17-19,34], an oral inflammatory disease of polymicrobial origin that causes the disruption of gingival connective tissue and the alveolar bone supporting the teeth. Commercially available bone filler materials work through a simple scaffolding effect, providing osteoconduction. The new approach involving the biomolecular modification of biomaterials aims at enhancing the host tissue response through biologically active molecules delivered from the device or linked to the device surface [35-38]. In this broad scenario, the use of polyphenols from different source is widely investigated [32,39-45]. Grape pomace is an interesting source of polyphenols, and polyphenols-rich pomace extract are of particular interest due to the heterogeneity of the mixture, which makes these extract extremely interesting, since it contains a large number of polyphenols classes. Potentially beneficial effects of polyphenols have been reported in various study. For example, cell biology and in vivo rodent model studies [34,46,47] have demonstrated that flavanoids regulated the inflammatory response in periodontal components, and preserve effects on periodontal ligaments and alveolar bone tissues [48]. Another class of polyphenols, proanthocyanidins, has been shown both in vitro and in vivo to have a protective effect against oxidative stress and periodontitis [15,49]. The role of polyphenols in molecular signalling mechanisms behind bone anabolism has been recently reviewed [50] and potentials of polyphenols in bone-implant devices have been described [51].

Based on existing literature evidences, in the present work, a polyphenols-rich pomace extract combined to a biphasic phosphate ceramic bone filler was tested in vivo and compared to the same material without polyphenols and a couple of other controls. The study demonstrates in vivo that the presence of polyphenols enhances the osteointegration of the calcium phosphate bone filler. The results show that there is an higher value of the area occupied by trabecular bone after 56 days by the bone filler with polyphenols (NBR_Purple) and the bone filler without polyphenols (NBR_White). These results, support the several studies that have investigated the ability of polyphenols to improve and maintain bone health, showing clear positive effects on bone regeneration.

Conclusion

The study here reported demonstrates that at 56 days after implantation at distal and proximal sites in rabbit femoral condyles, the polyphenols-enriched bone filler NBR_Purple shows higher value of trabecular bone regeneration than those of the same material without polyphenols NBR_White. Assuming that the trabecular bone regeneration in an empty defect (Void condition) could be considered as physiological trabecular bone regeneration after a bone defect creation, NBR_Purple showed a 1.5 times regeneration enhancement at distal site and 2.1 times regeneration enhancement at proximal site. Present in vivo data support the role of polyphenols molecules in the stimulation of bone regeneration mechanisms.

References

    1. Figueiredo M, Henriques J, Martins G, Guerra F, Judas F, et al. (2010) Physicochemical characterization of biomaterials commonly used in dentistry as bone substitutes – Comparison with human bone. J Biomed Mater Res – Part B Appl Biomater 2: 409-419. [crossref]
    2. Iviglia G, Kargozar S, Baino F (2019) Biomaterials, current strategies, and novel nano-technological approaches for periodontal regeneration. J Funct Biomater 1: 3. [crossref]
    3. Tadic D (2004) A thorough physicochemical characterisation of 14 calcium phosphate-based bone substitution materials in comparison to natural bone. Biomaterials 6: 987-994. [crossref]s
    4. Samavedi S, Whittington AR, Goldstein AS (2013) Calcium phosphate ceramics in bone tissue engineering: A review of properties and their influence on cell behavior. Acta Biomater 9: 8037-8045. [crossref]
    5. Iviglia G, Morra M, Cassinelli C, Torre E, Rodriguez Y, et al. (2018) New collagen-coated calcium phosphate synthetic bone filler (Synergoss®): A comparative surface analysis. Int J Appl Ceram Technol 4: 910-920.
    6. Zhang L, Hanagata N, Maeda M, Minowa T, Ikoma T, et al. (2009) Porous hydroxyapatite and biphasic calcium phosphate ceramics promote ectopic osteoblast differentiation from mesenchymal stem cells. Sci Technol Adv Mater 2: 025003.
    7. Cantos E, Espín JC, Tomás-Barberán FA (2002) Varietal differences among the polyphenol profiles of seven table grape cultivars studied by LC-DAD-MS-MS. J Agric Food Chem 20: 5691-5696. [crossref]
    8. Rothwell J, Pérez-Jiménez J, Neveu V, A M-R, N M, et al. (2013) Phenol-Explorer 3.0: a major update of the Phenol-Explorer database to incorporate data on the effects of food processing on polyphenol content. Database 2013: 070. [crossref]
    9. Yamaguchi M, Ma ZJ (2001) Effect of Polyphenols on Calcium Content and Alkaline Phosphatase Activity in Rat Femoral Tissues in Vitro. Biol Pharm Bull 12: 1437-1439. [crossref]
    10. Hämäläinen M, Nieminen R, Vuorela P, Heinonen M, Moilanen E (2007) Anti-inflammatory effects of flavonoids: Genistein, kaempferol, quercetin, and daidzein inhibit STAT-1 and NF-κB activations, whereas flavone, isorhamnetin, naringenin, and pelargonidin inhibit only NF-κB activation along with their inhibitory effect on iNOS expression and NO production in activated macrophages. Mediators Inflamm 2007: 45673. [crossref]
    11. Yamaguchi M, Arbiser JL, Weitzmann MN (2011) Honokiol stimulates osteoblastogenesis by suppressing NF-κB activation. Int J Mol Med 6: 1049-1053. [crossref]
    12. Prouillet C, Mazière JC, Mazière C, Wattel A, Brazier M, et al. (2004) Stimulatory effect of naturally occurring flavonols quercetin and kaempferol on alkaline phosphatase activity in MG-63 human osteoblasts through ERK and estrogen receptor pathway. Biochem Pharmacol 7: 1307-1313. [crossref]
    13. Miyake M, Arai N, Ushio S, Iwaki K, Ikeda M, et al. (2003) Promoting Effect of Kaempferol on the Differentiation and Mineralization of Murine Pre-osteoblastic Cell Line MC3T3-E1. Biosci Biotechnol Biochem 6: 1199-1205. [crossref]
    14. Govindaraj J, Emmadi P, Puvanakrishnan R (2010) In vitro studies on inhibitory effect of proanthocyanidins in modulation of neutrophils and macrophages. Indian J Biochem Biophys 3: 141-147.
    15. Govindaraj J, Emmadi P, Deepalakshmi, Rajaram V, Prakash G, et al. (2010) Protective effect of proanthocyanidins on endotoxin induced experimental periodontitis in rats. Indian J Exp Biol 2: 133-142. [crossref]
    16. Govindaraj J, Emmadi P, Puvanakrishnan R (2011) Therapeutic effects of proanthocyanidins on the pathogenesis of periodontitis–an overview. Indian J Exp Biol 2: 83-93. [crossref]
    17. Palaska I, Papathanasiou E, Theoharides TC (2013) Use of polyphenols in periodontal inflammation. Eur J Pharmacol 720: 77-83. [crossref]
    18. Leena Sankari S, Aravindha Babu N, Rani V, Priyadharsini C, Masthan KMK (2014) Flavonoids-Clinical effects and applications in dentistry: A review. J Pharm Bioallied Sci 1: 26-29.
    19. Bunte K, Hensel A, Beikler T (2019) Polyphenols in the prevention and treatment of periodontal disease: A systematic review of in vivo, ex vivo and in vitro studies. Fitoterapia: 30-39. [crossref]
    20. Shen C-L, Wang P, Guerrieri J, Yeh JK, Wang J-S (2008) Protective effect of green tea polyphenols on bone loss in middle-aged female rats. Osteoporos Int 7: 979-990. [crossref]
    21. Lee JH, Jin H, Shim HE, Kim HN, Ha H, et al. (2010) Epigallocatechin-3-gallate inhibits osteoclastogenesis by down-regulating c-Fos expression and suppressing the nuclear factor-kappaB signal. Mol Pharmacol 1: 17-25. [crossref]
    22. Nakamura H, Ukai T, Yoshimura A, Kozuka Y, Yoshioka H, et al. (2010) Green tea catechin inhibits lipopolysaccharide-induced bone resorption in vivo. J Periodontal Res 1: 23-30. [crossref]
    23. Gómez-Florit M, Monjo M, Ramis JM (2014) Identification of quercitrin as potential therapeutic agent for periodontal applications. J Periodontol 7: 966-974. [crossref]
    24. Vitale-Brovarone C, Baino F, Verné E (2009) High strength bioactive glass-ceramic scaffolds for bone regeneration. J Mater Sci Mater Med 2: 643-653. [crossref]
    25. Vitale-Brovarone C, Verné E, Robiglio L, Appendino P, Bassi F, et al. (2007) Development of glass-ceramic scaffolds for bone tissue engineering: characterisation, proliferation of human osteoblasts and nodule formation. Acta Biomater 2: 199-208. [crossref]
    26. Torre E, Iviglia G, Cassinelli C, Morra M, Russo N (2020) Polyphenols from grape pomace induce osteogenic differentiation in mesenchymal stem cells. Int J Mol Med 6: 1721-1734. [crossref]
    27. ISO/EN10993-6 (2007) Biological evaluation of medical devices – Part 6: Tests for local effects after implantation. Int Organ Stand.
    28. Peris Serra J, Prat Pastor J, Comín Clavijo M, Dejoz R, Roger I, et al. (1993) Técnica histológica para la inclusión en metilmetacrilato de muestras óseas no descalcificadas. Rev española cirugía Osteoartic 166: 231-238.
    29. Huber FX, Berger I, McArthur N, Huber C, Kock HP, et al. (2008) Evaluation of a novel nanocrystalline hydroxyapatite paste and a solid hydroxyapatite ceramic for the treatment of critical size bone defects (CSD) in rabbits. J Mater Sci Mater Med 1: 33-38. [crossref]
    30. Huber FX, McArthur N, Heimann L, Dingeldein E, Cavey H, et al. (2009) Evaluation of a novel nanocrystalline hydroxyapatite paste Ostim in comparison to Alpha-BSM – more bone ingrowth inside the implanted material with Ostim compared to Alpha BSM. BMC Musculoskelet Disord 10: 164. [crossref]
    31. Luo T, Wu C, Zhang Y (2012) The in vivo osteogenesis of Mg or Zr-modified silicate-based bioceramic spheres. J Biomed Mater Res – Part A 9: 2269-2277. [crossref]
    32. Córdoba A, Satué M, Gómez-Florit M, Hierro-Oliva M, Petzold C, et al. (2015) Flavonoid-modified surfaces: Multifunctional bioactive biomaterials with osteopromotive, anti-inflammatory, and anti-fibrotic potential. Adv Healthc Mater 4: 540-549. [crossref]
    33. Torre E (2017) Molecular signaling mechanisms behind polyphenol-induced bone anabolism. Phytochem Rev 6: 1183-1226. [crossref]
    34. Özden FO, Sakallioğlu EE, Sakallioğlu U, Ayas B, Erişgin Z (2017) Effects of grape seed extract on periodontal disease: An experimental study in rats. J Appl Oral Sci 2: 121-129. [crossref]
    35. Morra M (2007) Biomolecular modification of implant surfaces. Expert Rev Med Devices 3: 361-72. [crossref]
    36. Brett E, Flacco J, Blackshear C, Longaker MT, Wan DC (2017) Biomimetics of Bone Implants: The Regenerative Road. Biores Open Access 1: 1-6.
    37. Morra M, Cassinelli C, Torre E, Iviglia G (2018) Permanent wettability of a novel, nanoengineered, clinically available, hyaluronan-coated dental implant. Clin Exp Dent Res 5: 196-205.
    38. Bryers JD, Giachelli CM, Ratner BD (2012) Engineering biomaterials to integrate and heal: The biocompatibility paradigm shifts. Biotechnol Bioeng 8: 1898-1911. [crossref]
    39. Zhang X, Ferraris S, Prenesti E, Verné E (2013) Surface functionalization of bioactive glasses with natural molecules of biological significance, part II: Grafting of polyphenols extracted from grape skin. Appl Surf Sci : 341-348.
    40. Gomez-Florit M, Pacha-Olivenza MA, Fernández-Calderón MC, Córdoba A, González-Martín ML, et al. (2016) Quercitrin-nanocoated titanium surfaces favour gingival cells against oral bacteria. Sci Rep 1: 22444.
    41. Gómez-Florit M, Monjo M, Ramis JM (2015) Quercitrin for periodontal regeneration: effects on human gingival fibroblasts and mesenchymal stem cells. Sci Rep 5: 16593. [crossref]
    42. Cazzola M, Corazzari I, Prenesti E, Bertone E, Vernè E, et al. (2016) Bioactive glass coupling with natural polyphenols: Surface modification, bioactivity and anti-oxidant ability. Appl Surf Sci : 237-248.
    43. Cazzola M, Vernè E, Cochis A, Sorrentino R, Azzimonti B, et al. (2017) Bioactive glasses functionalized with polyphenols: in vitro interactions with healthy and cancerous osteoblast cells. J Mater Sci 15: 9211-9223.
    44. Cazzola M, Ferraris S, Boschetto F, Rondinella A, Marin E, et al. (2018) Green tea polyphenols coupled with a bioactive titanium alloy surface: In vitro characterization of osteoinductive behavior through a KUSA A1 cell study. Int J Mol Sci 8: 2255. [crossref]
    45. Tsuchiya S, Sugimoto K, Kamio H, Okabe K, Kuroda K, et al. (2018) Kaempferol-immobilized titanium dioxide promotes formation of new bone: Effects of loading methods on bone marrow stromal cell differentiation in vivo and in vitro. Int J Nanomedicine 13: 1665-1676. [crossref]
    46. Gennaro G, Claudino M, Cestari TM, Ceolin D, Germino P, et al. (2015) Green tea modulates cytokine expression in the periodontium and attenuates alveolar bone resorption in type 1 diabetic rats. PLoS One 8: 0134784. [crossref]
    47. Tominari T, Matsumoto C, Watanabe K, Hirata M, Grundler FMW, et al. (2015) Epigallocatechin gallate (EGCG) suppresses lipopolysaccharide-induced inflammatory bone resorption, and protects against alveolar bone loss in mice. FEBS Open Bio 5: 522-527. [crossref]
    48. Fernández-Rojas B, Gutiérrez-Venegas G (2018) Flavonoids exert multiple periodontic benefits including anti-inflammatory, periodontal ligament-supporting, and alveolar bone-preserving effects. Life Sci 209: 435-454. [crossref]
    49. Houde V, Grenier D, Chandad F (2006) Protective effects of grape seed proanthocyanidins against oxidative stress induced by lipopolysaccharides of periodontopathogens. J Periodontol 8: 1371-1379. [crossref]
    50. Torre E (2017) Molecular signaling mechanisms behind polyphenol-induced bone anabolism. Phytochem Rev 6: 1183-1226. [crossref]
    51. Torre E, Iviglia G, Cassinelli C, Morra M (2018) Potentials of polyphenols in bone-implant devices. In: Janica Wong, ed. Polyphenols. IntechOpen 2018.
fig 1

Proficiency Monitoring of Allergen-Specific IgE macELISA – 2020

DOI: 10.31038/IJVB.2020432

Abstract

The purpose of this study was to evaluate the reproducibility of results yielded using a macELISA for detection of allergen specific IgE in dogs and cats when run by nine different individuals in seven separate affiliated laboratories. Samples of 24 different sera samples were independently evaluated in each laboratory by differing operators in a single blinded fashion. For evaluations completed by multiple operators, the average inter-operator variance was calculated to be 3.5% (range = 2.0-4.8%). The average intra-assay variance among reactive assay calibrators in all laboratories was 4.1% (range = 0.8-7.1%). The overall inter-assay inter-laboratory variance evident with reactive calibrators was consistent among laboratories and averaged 9.8% (range 7.5-10.5%). All laboratories yielded similar profiles and magnitudes of responses for replicate unknown samples; dose response profiles observed in each of the laboratories were indistinguishable. Correlation of EAU observed for individual allergens between and among all laboratories was strong (r > 0.90, p < 0.001). Collectively, the results demonstrated that ELISA for measuring allergen specific IgE is reproducible, and documents that consistency of results can be achieved not only in an individual laboratory, but among different operators and between laboratories using the same ELISA.

Keywords

IgE, ELISA, Proficiency, Atopy, Allergy, Immunotherapy, Cross-reactive carbohydrate

Introduction

Since the monoclonal based enzyme linked immunoassay (macELISA) for detection of allergen specific IgE in dogs and cats manufactured by Stallergenes Greer was first characterized [1], it has been adopted for use in multiple diagnostic service laboratories. To ensure inter-laboratory standardization and establishment of quality control measures that ensure the uniformity, consistency, and reproducibility of results among laboratories that perform the assays are maintained, Stallergenes Greer has instituted a proficiency monitoring program, to be completed on an annual basis, for laboratories that routinely run the macELISA. This program is designed to evaluate the proficiency of laboratories in completing the assay and ensures that individual operators yield consistent and reproducible results. The inaugural proficiency evaluations, initiated in 2009 [1] and repeated in 2010 [2], in six different laboratories documents that inter-laboratory standardization and quality control measures in the veterinary arena were on the immediate forefront and that uniformity, consistency, and reproducibility of results between laboratories is achievable. The reproducibility of results among different laboratories documented in the subsequent proficiency evaluations completed in 2013 [3], 2016 [4], 2018 [5], and 2019 [6] confirm that consistent and reproducible results using this assay have been evident for more than a decade. Importantly, the 2019 proficiency evaluation was the first documentation of the assay reproducibility since the characterization of the incidence of IgE antibodies that are specific for cross reactive carbohydrates determinants (CCD) evident in serum derived from dogs and cats and adopting a cross-reactive carbohydrate inhibitor in the sample diluent [6,7]. The results presented herein summarize the comparative results observed in the affiliate laboratories for the most recent proficiency evaluations, which also included the CCD inhibitor, that were completed in September 2020.

Materials and Methods

All serum samples, buffers, coated wells, calibrator solutions, and other assay components were aliquants of the respective lots of materials manufactured at Stallergenes Greer’s production facilities (located in Lenoir, NC, USA) and supplied as complete kits to the participating laboratories along with the exact instructions for completing the evaluations.

Participating Laboratories

Seven independent Veterinary Reference Laboratories (VRLs) participated in the 2020 proficiency evaluation of macELISA. Participating laboratories included three separate IDEXX laboratories located in Memphis, Tennessee, Kornwestheim, Germany, and Markham, Ontario Canada. Other affiliated European laboratories that participated in this evaluation included Agrolabo (Scarmagno, Italy), Laboratories LETI (Barcelona, Spain), and Ceva Biovac (Beaucouzé, France). Stallergenes Greer Laboratories (Lenoir, NC) served as the prototype for evaluation of macELISA; the 2020 evaluations included results reported by three separate and independent operators. Because the performance characteristics of macELISA in Stallergenes Greer’s VRL have been well documented for use over an extended period [1-6] all results observed in the other participating laboratories were compared directly with the results observed in Stallergenes Greer’s reference laboratory.

Serum Samples

Separate pollen and mite reactive sera pools as well as non-reactive sera pools were prepared from cat and dog serum samples that previously had been evaluated using the macELISA for detection of allergen-specific IgE in dogs and cats. The allergen-specific reactivity of each sera pool ranged from nonreactive to multiple pollen or mite reactivity’s. These sera pools and admixtures of the pools were used to construct a specific group of samples that exhibited varying reactivity to the allergens included in the evaluation panel. Twenty-one samples were included in the blinded evaluation conducted by each laboratory. Two known pollen reactive control samples and one non-reactive control sample were also included; replicates of these identical samples were included as unknown blinded samples. Also included in the array of samples was a five tube three-fold serial dilution of a highly pollen-reactive pool, diluted into non-reactive sera, which served to document the dose response evident within the assay. Samples evaluated included in the 2020 were replicate samples of those evaluated in the 2019 proficiency evaluation [6]. All samples were stored at -20°C for the interim between testing.

Calibrators

Mite reactive calibrator solutions of predetermined reactivity in the macELISA were prepared as three-fold serial dilutions of a sera pool highly reactive to Dermatophagoides farinae, Acarus siro, and Tyrophagus putrescentiae. Replicates of each were evaluated in each assay run and served as a standard response curve for normalizing results observed with the various samples. All results were expressed as ELISA Absorbance Units (EAU) which are background-corrected observed responses expressed as milli absorbance.

Buffers

The buffers used throughout have been previously described [1-7] and included: a) well coating buffer: 0.05 M sodium carbonate bicarbonate buffer, pH 9.6; b) wash buffer: phosphate buffered saline (PBS), pH 7.4, containing 0.05% Tween 20, and 0.05% sodium azide; c) reagent diluent buffer: PBS, pH 7.4, containing 1% fish gelatin, 0.05% Tween 20 and 0.05% sodium azide. The buffer used for dilution of serum samples was identical to the reagent diluent buffer, but it has been supplemented (2.5 mG/mL) with a cross-reactive carbohydrate inhibitor derived from the carbohydrate components present in bromelain (BROM-CCD) [7]. BROM-CCD was prepared in house and remains a proprietary product of Stallergenes Greer (Lenoir, NC, USA).

Allergen Panel

The allergen panel was a 24 allergen composite derived from the array of allergens that are included in the specific panels routinely evaluated in the various laboratories; the composite allergen panel consisted of 4 grasses, 6 weeds, 6 trees, 5 mites, and 3 fungi. The protocol for coating and storage of wells has been previously described [1-7].

Sample Evaluations – macELISA

The operational characteristics and procedures for the macELISAs have been previously described [1-6]. Following incubation of allergen coated wells with an appropriately diluted serum sample, allergen-specific IgE is detected using a secondary antibody mixture of biotinylated monoclonal anti-IgE antibodies, streptavidin alkaline phosphatase as the enzyme conjugate, and p-nitrophenylphosphate (pNPP) as substrate reagent. Specific IgE reactivity to the allergens is then estimated by determining the absorbance of each well measured at 405 nM using an automated plate reader. All results are expressed as ELISA Absorbance Units (EAU), which are background-corrected observed responses expressed as milli absorbance [1].

Statistics

A coefficient of variation was calculated as the ratio of standard deviation and means of the responses observed for the calibrator solutions within different runs in multiple laboratories. Pearson’s correlation statistic was used for inter-laboratory comparison among individual allergens. Statistical analyses were conducted using EXCEL (2016; Microsoft; Redmond, WA, USA).

Results

The assay variance (% CV) observed with the calibrator solutions in the different laboratories are presented in Table 1 and are representative of the assay reproducibility in the various laboratories. The average intra-assay % CV among positive calibrators (#1-4) was 4.1% (range = 0.8-7.1%); differences among laboratories or between assays and within assay runs were not detected. No substantial difference in results among various operators were revealed. The average inter-operator variance documented for Stallergenes Greer technicians was calculated to be 3.5% (range = 2.0-4.8%). The average inter-assay variance (% CV) observed in Stallergenes Greer’s laboratory with the positive calibrators from multiple runs over a one year period has been documented at 8.9% (range 7.1% -9.7%), and the inter-laboratory % CV among reactive calibrators also remained relatively constant (average 12.1%; range 11.2-13.4%). The results of the current evaluation (Table 1) are consistent with these unpublished findings [1-7]; the inter-assay variance among positive calibrators for all laboratories included in this evaluation was calculated to be 7.2% (range = 4.1-8.7%). Similar to previously published studies [1-7], the intra-assay variability was higher with negative calibrator #5 (average 6.2%; range 1.0-15.8%), and a similar increased intra-assay variability was evident with the background ODs (average 9.1%; range 2.6-24.6%). A negative response is classified as anything with an EAU below 150 [1]. Any analysis of results below this threshold, especially when looking at %CV and relative differences, should be done so cautiously.

Table 1: Calculated variance of macELISA calibrator solutions observed with different laboratory runs by multiple operators during the 2019 Proficiency evaluation.

table 1

*Calibrator #1 is prepared as a dilution of a sera pool which is highly reactive to mite allergens; Calibrators #2 – #5 are prepared as a serial 3-fold dilution of calibrator #1.

Background responses observed with diluent in place of serum sample.

To evaluate the strength of association with the magnitude of EAU results observed for each allergen among the different laboratories a Pearson’s correlation coefficient was determined (Microsoft Excel 2016) for each laboratory pair. Because the macELISA is designed to yield comparable responses in dog and cat samples, comparison of results among affiliate laboratories included both cat and dog samples as a single population of sera samples [5-7]. These results (Table 2) demonstrate that very high inter-laboratory correlation (r > 0.90; p < 0.001) is evident between the results observed in Stallergenes Greer’s laboratory and those observed in six affiliate laboratories for all mites and pollen allergens. The correlation (Pearson’s) of results observed with the fungal allergens within or between any of the testing laboratories was also substantial. However, the majority of results for the fungal allergens fell within the lower range of reactivity or within the negative range of the response curve (<150 EAU). Consequently, the correlation of results among laboratories for the fungal allergens was somewhat less than the correlation evident with the mite and pollen allergens. The overall correlation of results observed in the various laboratories are summarized in Table 3; a very strong correlation (r > 0.90, p < 0.001) was demonstrated between and among the results of the participating laboratories.

Table 2: Inter-laboratory correlation of macELISA results observed with individual allergens in Stallergenes Greer Laboratory and the results observed in the individual affiliate laboratories.

table 2

*Pearson Correlation Coefficient (r); Good Correlation (r > 0.8, p<0.001).

Table 3: Inter-laboratory correlation of macELISA results observed among individual affiliate laboratories.

table 3

*Pearson Correlation Coefficient (r); Good Correlation (r > 0.8, p<0.001).

For an evaluation of the dose response in this ELISA, a five tube three-fold serial dilution a reactive dog sera pool was prepared using a negative sera pool as diluent. Each of the dilutions was then evaluated by all of the participating laboratories as unknown independent samples. Similar responses were yielded by all of the laboratories and the results observed within the various laboratories are encompassed by the acceptable variance limits [1-3] (±20%) established for macELISA. Further, the magnitude of responses observed in each laboratory was reduced in direct proportion to dilution. Consequently, the dose responses for the individual allergens are presented as aggregate responses. The results presented in Figure 1 confirm the sera pool was highly reactive to grass, weed, and tree pollen allergens, but it was not reactive to mites and fungi. To be expected, the magnitude of responses observed in each laboratory was reduced in direct proportion to dilution. Results from the final tube in the dilution scheme yielded results that were indistinguishable from negative responses, indicating a dilution extinction of detectable response.

fig 1

Figure 1: Dose response evident in macELISA with a pollen reactive serum pool.

The current evaluations were the second proficiency determination that was completed using a sample diluent that incorporated an inhibitor of cross reactive carbohydrate determinant (CCD) reactivity that might be evident in the serum sample. Further, the serum samples evaluated in this proficiency evaluation were replicate samples of the proficiency evaluation completed in 2019 [6] that had been stored frozen for the interim between evaluations. The correlation (Pearson) of results yielded in each of the participating laboratories with the individual allergens in the 2019 proficiency evaluation and those yielded in the current study is presented in Table 4. Overall, a very strong correlation (r > 0.90; p < 0.001) of the magnitude of responses was demonstrable for all allergens evaluated and all laboratories that participated in the evaluation.

Discussion

Consistent with previous proficiency evaluations of laboratories that routinely run the monoclonal antibody cocktail based enzyme linked immunoassay (macELISA) manufactured by Stallergenes Greer [1-6] the results of the present study demonstrate that the intra-assay variance observed with the positive calibrators evident among the various runs within each of the laboratories remains relatively low and indistinguishable among the various laboratories. Likewise, the inter-assay variance within each laboratory remained relatively constant and the results from all laboratories are demonstrably similar and the CV of the positive responses was relatively constant across the entire range of reactivity tested. The results demonstrate that the variability between and among the affiliate laboratories and technicians are indistinguishable from the results evident within and between runs completed in the laboratory of Stallergenes Greer. Thus, any and all laboratories and technicians included in the study are equally proficient in providing consistent results for all allergens tested and the results are well within the acceptable variance limits (±20%) established for this assay and reflects the robustness of the assay [1].

For more than a decade we have documented the reproducibility and robust character of the macELISA and demonstrated that comparable reproducibility of results can be achieved for a panel of identical sera samples when evaluated across multiple years [1-6]. However, it has recently been shown that incorporation of a CCD inhibitor is critical for reduction of false positive reactions that occur due to the binding of certain IgE to these carbohydrate groups that are common among pollen allergens [7-13]. To address these potential increases in signal due to CCD specific IgE antibodies evident in some sera samples, an inhibitor of the IgE antibodies has been incorporated as an essential component in macELISA [7]. In the 2019 proficiency evaluation we documented that inclusion of BROM-CCD inhibitor in our serum diluent [6] does not affect the intra-assay or inter-assay variance of the test and the results present herein confirm this observation. Further, the results presented in Table 4 demonstrate that responses of similar magnitude to the individual allergens in the panel were yielded in both of the 2019 and 2020 proficiency evaluations. These results document an excellent overall correlation (r > 0.90; p < 0.001) of results that were observed in the participating laboratories in each of the two proficiency evaluation periods; the correlation of responses to the individual allergens included in panel was also very strong. Inherently, the results of this comparative evaluation not only demonstrate excellent reproducibility of the assay in multiple laboratories over time, the data also document the stability of allergen specific IgE in serum samples stored frozen for at least one year.

Table 4: Correlation of macELISA results among individual affiliate laboratories observed during 2019 and 2020 proficiency evaluations.

table 4

*Pearson Correlation Coefficient (r); Good Correlation (r > 0.8, p<0.001).

There is no compelling evidence that the level of allergen specific IgE correlates with severity of clinical disease [14-17]. However, an evaluation that purports to measure allergen specific IgE should have a reduction in signal that is directly proportional to the dilution factor of the test ligand [18]. Similar responses were yielded by all of the laboratories for the samples that comprised the dose response and the results observed within the various laboratories are encompassed by the acceptable variance limits (±20%) established for macELISA [1-3]. Further, the magnitude of responses observed in each laboratory was reduced in direct proportion to dilution. Consequently, the dose responses for the individual allergens are presented as aggregate responses (Figure 1). The responses of greatest magnitude were evident with the grass pollen allergens, and these responses were reduced in direct proportion to dilution; the magnitude of responses ranged from near maximum to those that were indistinguishable from background responses. The reaction profiles for grass allergens also appear to be parallel and quite similar in magnitude of response. Whether or not these like responses result because of a similar level of co-sensitization or allergen epitope similarity combined with cross-reaction remains to be determined. Although the responses evident to differing tree and weed allergens are more variable in magnitude of response, the observed response in each laboratory was reduced in direct proportion to dilution. The positive response profiles evident with these allergens also appear to be parallel and, it becomes evident that the detectability of allergen specific IgE within this assay spans at least a 150-fold dilution range. Responses to mite and fungal allergens were lacking in the original sample.

We have demonstrated a continued reliability and reproducibility of our macELISA with the open publication of our proficiency testing procedures and results [1-6]. We encourage other groups to determine and document similar findings; however, we emphasize the importance of identifying results below the cutoff of 150 EAU merely as non-reactive and consequently negative responses. The reproducibility of the assay for these responses need to be defined only as negative and their numerical values become meaningless; comparison of EAU values are meaningful for reactive samples only (EAU > 150). Because the magnitude of specific responses is dependent on the concentration of allergen-specific IgE that can span a wide range, a better means of comparison of repeat results for individual samples in an assay of this sort is to evaluate the correlation (perhaps Pearson statistic) of results that might exist.

The lack of a regulatory mandated quality assurance program for serum allergen specific IgE testing in companion animals, that independently monitors performance of all laboratories and assay formats, prompts Stallergenes Greer to accept the responsibility for continued evaluation of laboratories that routinely use the company’s assays. Information presented herein documents the continued commitment of Stallergenes Greer and its affiliate laboratories to providing a stream of information relating these results to the veterinary community.

Funding

Funding for this study was provided by Stallergenes Greer.

References

  1. Lee KW, Blankenship KD, McCurry ZM, Esch RE, Douglas J DeBoer, et al. (2009) Performance characteristics of a monoclonal antibody cocktail-based ELISA for detection of allergen-specific IgE in dogs and comparison with a high affinity IgE receptor-based ELISA. Vet Dermatol 20: 157-164. [crossref]
  2. Lee KW, Blankenship KD, McCurry ZM, Kern G, Rick Ruffner, et al. (2012) Reproducibility of a Monoclonal Antibody Cocktail Based ELISA for Detection of Allergen Specific IgE in Dogs: Proficiency Monitoring of macELISA in Six US and European Laboratories. Vet Immunol Immunopathol 148: 267-275. [crossref]
  3. Lee KW, Blankenship K, Kinney Mc B, Kern G, Jesse Buch, et al. (2015) Proficiency monitoring of monoclonal antibody cocktail–based enzyme-linked immunosorbent assay for detection of allergen-specific immunoglobulin E in dogs. Journal of Veterinary Diagnostic Investigation. 27: 461-469. [crossref]
  4. Lee K, Blankenship K, Kinney Mc B, Kern G, et al. (2017) Continued Proficiency Monitoring of Monoclonal Antibody Cocktail-Based Enzyme-Linked Immunosorbent Assay for Detection of Allergen Specific Immunoglobulin E in Dogs – 2016. Integr J Vet Biosci 1: 1-10.
  5. Lee K, Blankenship K, Kinney Mc B, Kern G, et al. (2018) Proficiency Monitoring of Allergen Specific IgE macELISA ̶ 2018. Integr J Vet Biosci 2: 1-6.
  6. Enck K, Lee K, Blankenship K, McKinney B, et al. (2019) Proficiency Monitoring of Allergen-Specific IgE macELISA – 2019. Integr J Vet Biosci 3: 1-6.
  7. Lee KW, Blankenship KD, McKinney BH, Morris DO (2020) Detection and Inhibition of IgE for cross-reactive carbohydrate determinants evident in an enzyme linked immunosorbent assay for detection of allergen specific IgE in the serum of dogs and cats. Vet Dermatol.
  8. Altmann F (2016) Coping with cross-reactive carbohydrate determinants in allergy diagnosis. Allergo J Int 25: 98-105.
  9. Holzweber F, Svehla E, Fellner W, Dali T, Stubler S, et al. (2013) Inhibition of IgE binding to cross-reactive carbohydrate determinants enhances diagnostic selectivity. Allergy 68: 1269-1277. [crossref]
  10. Yokoi H, Yoshitake H, Matsumoto Y, Kawada M, et al. (2017) Involvement of cross-reactive carbohydrate determinants-specific IgE in pollen allergy testing. Asia Pac Allergy 7: 29-36.
  11. Kaulfürst-Soboll H, Mertens M, Brehler R, von Schaewen A (2011) Reduction of cross-reactive carbohydrate determinants in plant foodstuff: elucidation of clinical relevance and implications for allergy diagnosis. PLoS One 6: 17800. [crossref]
  12. Ito K, Morishita M, Ohshima M, Sakamoto T, et al. 2005 Cross-reactive carbohydrate determinant contributes to the false positive IgE antibody to peanut. Allergol Int 54: 387-392.
  13. Mari A, Iacovacci P, Afferni C, Barletta B, et al. (1999) Specific IgE to cross-reactive carbohydrate determinants strongly affect the in vitro diagnosis of allergic diseases. J Allergy Clin Immunol 103: 1005-1011. [crossref]
  14. DeBoer DJ, Hillier A (2001) The ACVD task force on canine atopic dermatitis (XVI): laboratory evaluation of dogs with atopic dermatitis with serum-based “allergy” tests. Vet Immunol Immunopathol 81: 277-287. [crossref]
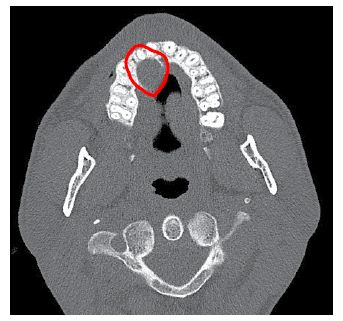
  15. Gorman NT, Halliwell, REW (1989) Atopic Diseases. In: Halliwell REW, Gorman NT. Veterinary Clinical Immunology 232-252.
  16. Griffin CE, DeBoer DJ (2001) The ACVD task force on canine atopic dermatitis (XIV): clinical manifestation of canine atopic dermatitis. Vet Immunol Immunopathology 81: 255-269. [crossref]
  17. Griffin CE, Hillier A (2001) The ACVD task force on canine atopic dermatitis (XXIV): allergen-specific immunotherapy. Vet Immunol Immunopathol 81: 363-383. [crossref]
  18. Tijssen P. (1993) Processing of data and reporting of results of enzyme immunoassays. In: Burdon, RH, van Knippenberg PH, editors. Practice and Theory of Enzyme Immunoassays 385-421.