Abstract
The purpose of this study was to evaluate the reproducibility of results yielded using a macELISA for detection of allergen specific IgE in dogs and cats when run by nine different individuals in seven separate affiliated laboratories. Samples of 24 different sera samples were independently evaluated in each laboratory by differing operators in a single blinded fashion. For evaluations completed by multiple operators, the average inter-operator variance was calculated to be 3.5% (range = 2.0-4.8%). The average intra-assay variance among reactive assay calibrators in all laboratories was 4.1% (range = 0.8-7.1%). The overall inter-assay inter-laboratory variance evident with reactive calibrators was consistent among laboratories and averaged 9.8% (range 7.5-10.5%). All laboratories yielded similar profiles and magnitudes of responses for replicate unknown samples; dose response profiles observed in each of the laboratories were indistinguishable. Correlation of EAU observed for individual allergens between and among all laboratories was strong (r > 0.90, p < 0.001). Collectively, the results demonstrated that ELISA for measuring allergen specific IgE is reproducible, and documents that consistency of results can be achieved not only in an individual laboratory, but among different operators and between laboratories using the same ELISA.
Keywords
IgE, ELISA, Proficiency, Atopy, Allergy, Immunotherapy, Cross-reactive carbohydrate
Introduction
Since the monoclonal based enzyme linked immunoassay (macELISA) for detection of allergen specific IgE in dogs and cats manufactured by Stallergenes Greer was first characterized [1], it has been adopted for use in multiple diagnostic service laboratories. To ensure inter-laboratory standardization and establishment of quality control measures that ensure the uniformity, consistency, and reproducibility of results among laboratories that perform the assays are maintained, Stallergenes Greer has instituted a proficiency monitoring program, to be completed on an annual basis, for laboratories that routinely run the macELISA. This program is designed to evaluate the proficiency of laboratories in completing the assay and ensures that individual operators yield consistent and reproducible results. The inaugural proficiency evaluations, initiated in 2009 [1] and repeated in 2010 [2], in six different laboratories documents that inter-laboratory standardization and quality control measures in the veterinary arena were on the immediate forefront and that uniformity, consistency, and reproducibility of results between laboratories is achievable. The reproducibility of results among different laboratories documented in the subsequent proficiency evaluations completed in 2013 [3], 2016 [4], 2018 [5], and 2019 [6] confirm that consistent and reproducible results using this assay have been evident for more than a decade. Importantly, the 2019 proficiency evaluation was the first documentation of the assay reproducibility since the characterization of the incidence of IgE antibodies that are specific for cross reactive carbohydrates determinants (CCD) evident in serum derived from dogs and cats and adopting a cross-reactive carbohydrate inhibitor in the sample diluent [6,7]. The results presented herein summarize the comparative results observed in the affiliate laboratories for the most recent proficiency evaluations, which also included the CCD inhibitor, that were completed in September 2020.
Materials and Methods
All serum samples, buffers, coated wells, calibrator solutions, and other assay components were aliquants of the respective lots of materials manufactured at Stallergenes Greer’s production facilities (located in Lenoir, NC, USA) and supplied as complete kits to the participating laboratories along with the exact instructions for completing the evaluations.
Participating Laboratories
Seven independent Veterinary Reference Laboratories (VRLs) participated in the 2020 proficiency evaluation of macELISA. Participating laboratories included three separate IDEXX laboratories located in Memphis, Tennessee, Kornwestheim, Germany, and Markham, Ontario Canada. Other affiliated European laboratories that participated in this evaluation included Agrolabo (Scarmagno, Italy), Laboratories LETI (Barcelona, Spain), and Ceva Biovac (Beaucouzé, France). Stallergenes Greer Laboratories (Lenoir, NC) served as the prototype for evaluation of macELISA; the 2020 evaluations included results reported by three separate and independent operators. Because the performance characteristics of macELISA in Stallergenes Greer’s VRL have been well documented for use over an extended period [1-6] all results observed in the other participating laboratories were compared directly with the results observed in Stallergenes Greer’s reference laboratory.
Serum Samples
Separate pollen and mite reactive sera pools as well as non-reactive sera pools were prepared from cat and dog serum samples that previously had been evaluated using the macELISA for detection of allergen-specific IgE in dogs and cats. The allergen-specific reactivity of each sera pool ranged from nonreactive to multiple pollen or mite reactivity’s. These sera pools and admixtures of the pools were used to construct a specific group of samples that exhibited varying reactivity to the allergens included in the evaluation panel. Twenty-one samples were included in the blinded evaluation conducted by each laboratory. Two known pollen reactive control samples and one non-reactive control sample were also included; replicates of these identical samples were included as unknown blinded samples. Also included in the array of samples was a five tube three-fold serial dilution of a highly pollen-reactive pool, diluted into non-reactive sera, which served to document the dose response evident within the assay. Samples evaluated included in the 2020 were replicate samples of those evaluated in the 2019 proficiency evaluation [6]. All samples were stored at -20°C for the interim between testing.
Calibrators
Mite reactive calibrator solutions of predetermined reactivity in the macELISA were prepared as three-fold serial dilutions of a sera pool highly reactive to Dermatophagoides farinae, Acarus siro, and Tyrophagus putrescentiae. Replicates of each were evaluated in each assay run and served as a standard response curve for normalizing results observed with the various samples. All results were expressed as ELISA Absorbance Units (EAU) which are background-corrected observed responses expressed as milli absorbance.
Buffers
The buffers used throughout have been previously described [1-7] and included: a) well coating buffer: 0.05 M sodium carbonate bicarbonate buffer, pH 9.6; b) wash buffer: phosphate buffered saline (PBS), pH 7.4, containing 0.05% Tween 20, and 0.05% sodium azide; c) reagent diluent buffer: PBS, pH 7.4, containing 1% fish gelatin, 0.05% Tween 20 and 0.05% sodium azide. The buffer used for dilution of serum samples was identical to the reagent diluent buffer, but it has been supplemented (2.5 mG/mL) with a cross-reactive carbohydrate inhibitor derived from the carbohydrate components present in bromelain (BROM-CCD) [7]. BROM-CCD was prepared in house and remains a proprietary product of Stallergenes Greer (Lenoir, NC, USA).
Allergen Panel
The allergen panel was a 24 allergen composite derived from the array of allergens that are included in the specific panels routinely evaluated in the various laboratories; the composite allergen panel consisted of 4 grasses, 6 weeds, 6 trees, 5 mites, and 3 fungi. The protocol for coating and storage of wells has been previously described [1-7].
Sample Evaluations – macELISA
The operational characteristics and procedures for the macELISAs have been previously described [1-6]. Following incubation of allergen coated wells with an appropriately diluted serum sample, allergen-specific IgE is detected using a secondary antibody mixture of biotinylated monoclonal anti-IgE antibodies, streptavidin alkaline phosphatase as the enzyme conjugate, and p-nitrophenylphosphate (pNPP) as substrate reagent. Specific IgE reactivity to the allergens is then estimated by determining the absorbance of each well measured at 405 nM using an automated plate reader. All results are expressed as ELISA Absorbance Units (EAU), which are background-corrected observed responses expressed as milli absorbance [1].
Statistics
A coefficient of variation was calculated as the ratio of standard deviation and means of the responses observed for the calibrator solutions within different runs in multiple laboratories. Pearson’s correlation statistic was used for inter-laboratory comparison among individual allergens. Statistical analyses were conducted using EXCEL (2016; Microsoft; Redmond, WA, USA).
Results
The assay variance (% CV) observed with the calibrator solutions in the different laboratories are presented in Table 1 and are representative of the assay reproducibility in the various laboratories. The average intra-assay % CV among positive calibrators (#1-4) was 4.1% (range = 0.8-7.1%); differences among laboratories or between assays and within assay runs were not detected. No substantial difference in results among various operators were revealed. The average inter-operator variance documented for Stallergenes Greer technicians was calculated to be 3.5% (range = 2.0-4.8%). The average inter-assay variance (% CV) observed in Stallergenes Greer’s laboratory with the positive calibrators from multiple runs over a one year period has been documented at 8.9% (range 7.1% -9.7%), and the inter-laboratory % CV among reactive calibrators also remained relatively constant (average 12.1%; range 11.2-13.4%). The results of the current evaluation (Table 1) are consistent with these unpublished findings [1-7]; the inter-assay variance among positive calibrators for all laboratories included in this evaluation was calculated to be 7.2% (range = 4.1-8.7%). Similar to previously published studies [1-7], the intra-assay variability was higher with negative calibrator #5 (average 6.2%; range 1.0-15.8%), and a similar increased intra-assay variability was evident with the background ODs (average 9.1%; range 2.6-24.6%). A negative response is classified as anything with an EAU below 150 [1]. Any analysis of results below this threshold, especially when looking at %CV and relative differences, should be done so cautiously.
Table 1: Calculated variance of macELISA calibrator solutions observed with different laboratory runs by multiple operators during the 2019 Proficiency evaluation.
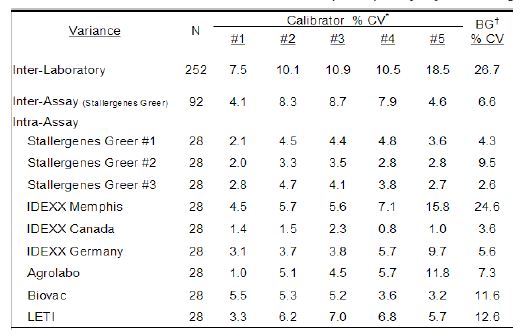
*Calibrator #1 is prepared as a dilution of a sera pool which is highly reactive to mite allergens; Calibrators #2 – #5 are prepared as a serial 3-fold dilution of calibrator #1.
†Background responses observed with diluent in place of serum sample.
To evaluate the strength of association with the magnitude of EAU results observed for each allergen among the different laboratories a Pearson’s correlation coefficient was determined (Microsoft Excel 2016) for each laboratory pair. Because the macELISA is designed to yield comparable responses in dog and cat samples, comparison of results among affiliate laboratories included both cat and dog samples as a single population of sera samples [5-7]. These results (Table 2) demonstrate that very high inter-laboratory correlation (r > 0.90; p < 0.001) is evident between the results observed in Stallergenes Greer’s laboratory and those observed in six affiliate laboratories for all mites and pollen allergens. The correlation (Pearson’s) of results observed with the fungal allergens within or between any of the testing laboratories was also substantial. However, the majority of results for the fungal allergens fell within the lower range of reactivity or within the negative range of the response curve (<150 EAU). Consequently, the correlation of results among laboratories for the fungal allergens was somewhat less than the correlation evident with the mite and pollen allergens. The overall correlation of results observed in the various laboratories are summarized in Table 3; a very strong correlation (r > 0.90, p < 0.001) was demonstrated between and among the results of the participating laboratories.
Table 2: Inter-laboratory correlation of macELISA results observed with individual allergens in Stallergenes Greer Laboratory and the results observed in the individual affiliate laboratories.
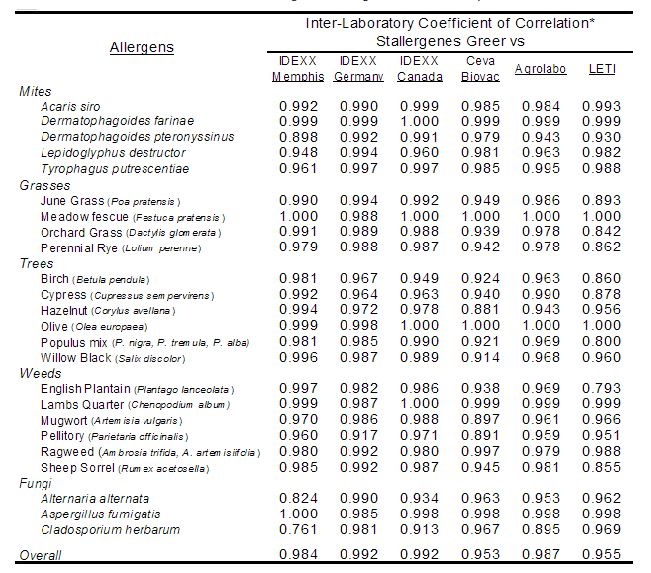
*Pearson Correlation Coefficient (r); Good Correlation (r > 0.8, p<0.001).
Table 3: Inter-laboratory correlation of macELISA results observed among individual affiliate laboratories.
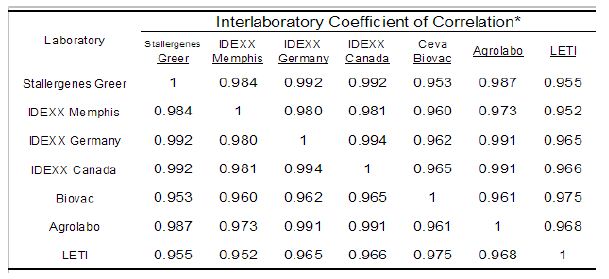
*Pearson Correlation Coefficient (r); Good Correlation (r > 0.8, p<0.001).
For an evaluation of the dose response in this ELISA, a five tube three-fold serial dilution a reactive dog sera pool was prepared using a negative sera pool as diluent. Each of the dilutions was then evaluated by all of the participating laboratories as unknown independent samples. Similar responses were yielded by all of the laboratories and the results observed within the various laboratories are encompassed by the acceptable variance limits [1-3] (±20%) established for macELISA. Further, the magnitude of responses observed in each laboratory was reduced in direct proportion to dilution. Consequently, the dose responses for the individual allergens are presented as aggregate responses. The results presented in Figure 1 confirm the sera pool was highly reactive to grass, weed, and tree pollen allergens, but it was not reactive to mites and fungi. To be expected, the magnitude of responses observed in each laboratory was reduced in direct proportion to dilution. Results from the final tube in the dilution scheme yielded results that were indistinguishable from negative responses, indicating a dilution extinction of detectable response.
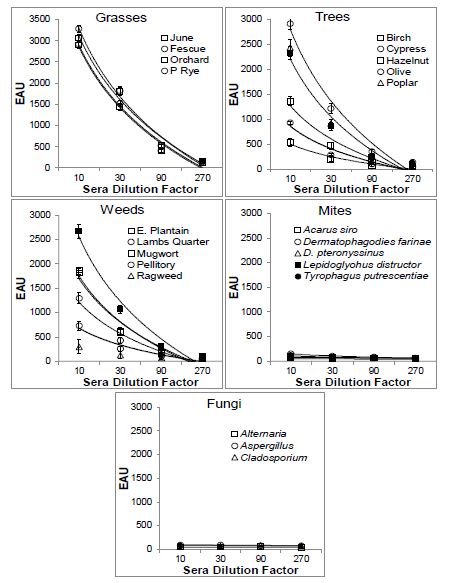
Figure 1: Dose response evident in macELISA with a pollen reactive serum pool.
The current evaluations were the second proficiency determination that was completed using a sample diluent that incorporated an inhibitor of cross reactive carbohydrate determinant (CCD) reactivity that might be evident in the serum sample. Further, the serum samples evaluated in this proficiency evaluation were replicate samples of the proficiency evaluation completed in 2019 [6] that had been stored frozen for the interim between evaluations. The correlation (Pearson) of results yielded in each of the participating laboratories with the individual allergens in the 2019 proficiency evaluation and those yielded in the current study is presented in Table 4. Overall, a very strong correlation (r > 0.90; p < 0.001) of the magnitude of responses was demonstrable for all allergens evaluated and all laboratories that participated in the evaluation.
Discussion
Consistent with previous proficiency evaluations of laboratories that routinely run the monoclonal antibody cocktail based enzyme linked immunoassay (macELISA) manufactured by Stallergenes Greer [1-6] the results of the present study demonstrate that the intra-assay variance observed with the positive calibrators evident among the various runs within each of the laboratories remains relatively low and indistinguishable among the various laboratories. Likewise, the inter-assay variance within each laboratory remained relatively constant and the results from all laboratories are demonstrably similar and the CV of the positive responses was relatively constant across the entire range of reactivity tested. The results demonstrate that the variability between and among the affiliate laboratories and technicians are indistinguishable from the results evident within and between runs completed in the laboratory of Stallergenes Greer. Thus, any and all laboratories and technicians included in the study are equally proficient in providing consistent results for all allergens tested and the results are well within the acceptable variance limits (±20%) established for this assay and reflects the robustness of the assay [1].
For more than a decade we have documented the reproducibility and robust character of the macELISA and demonstrated that comparable reproducibility of results can be achieved for a panel of identical sera samples when evaluated across multiple years [1-6]. However, it has recently been shown that incorporation of a CCD inhibitor is critical for reduction of false positive reactions that occur due to the binding of certain IgE to these carbohydrate groups that are common among pollen allergens [7-13]. To address these potential increases in signal due to CCD specific IgE antibodies evident in some sera samples, an inhibitor of the IgE antibodies has been incorporated as an essential component in macELISA [7]. In the 2019 proficiency evaluation we documented that inclusion of BROM-CCD inhibitor in our serum diluent [6] does not affect the intra-assay or inter-assay variance of the test and the results present herein confirm this observation. Further, the results presented in Table 4 demonstrate that responses of similar magnitude to the individual allergens in the panel were yielded in both of the 2019 and 2020 proficiency evaluations. These results document an excellent overall correlation (r > 0.90; p < 0.001) of results that were observed in the participating laboratories in each of the two proficiency evaluation periods; the correlation of responses to the individual allergens included in panel was also very strong. Inherently, the results of this comparative evaluation not only demonstrate excellent reproducibility of the assay in multiple laboratories over time, the data also document the stability of allergen specific IgE in serum samples stored frozen for at least one year.
Table 4: Correlation of macELISA results among individual affiliate laboratories observed during 2019 and 2020 proficiency evaluations.
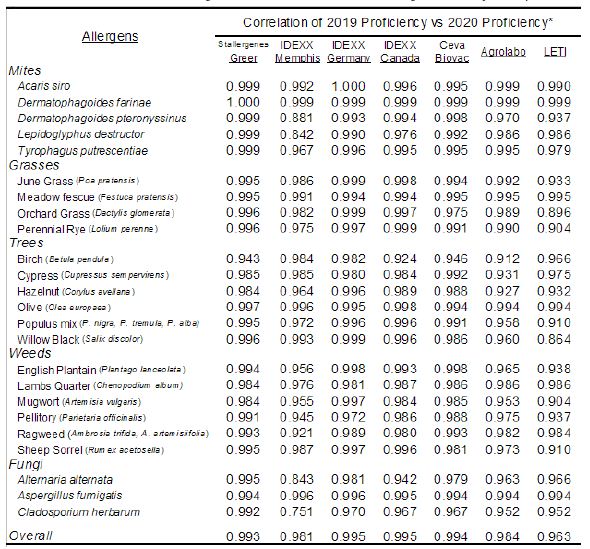
*Pearson Correlation Coefficient (r); Good Correlation (r > 0.8, p<0.001).
There is no compelling evidence that the level of allergen specific IgE correlates with severity of clinical disease [14-17]. However, an evaluation that purports to measure allergen specific IgE should have a reduction in signal that is directly proportional to the dilution factor of the test ligand [18]. Similar responses were yielded by all of the laboratories for the samples that comprised the dose response and the results observed within the various laboratories are encompassed by the acceptable variance limits (±20%) established for macELISA [1-3]. Further, the magnitude of responses observed in each laboratory was reduced in direct proportion to dilution. Consequently, the dose responses for the individual allergens are presented as aggregate responses (Figure 1). The responses of greatest magnitude were evident with the grass pollen allergens, and these responses were reduced in direct proportion to dilution; the magnitude of responses ranged from near maximum to those that were indistinguishable from background responses. The reaction profiles for grass allergens also appear to be parallel and quite similar in magnitude of response. Whether or not these like responses result because of a similar level of co-sensitization or allergen epitope similarity combined with cross-reaction remains to be determined. Although the responses evident to differing tree and weed allergens are more variable in magnitude of response, the observed response in each laboratory was reduced in direct proportion to dilution. The positive response profiles evident with these allergens also appear to be parallel and, it becomes evident that the detectability of allergen specific IgE within this assay spans at least a 150-fold dilution range. Responses to mite and fungal allergens were lacking in the original sample.
We have demonstrated a continued reliability and reproducibility of our macELISA with the open publication of our proficiency testing procedures and results [1-6]. We encourage other groups to determine and document similar findings; however, we emphasize the importance of identifying results below the cutoff of 150 EAU merely as non-reactive and consequently negative responses. The reproducibility of the assay for these responses need to be defined only as negative and their numerical values become meaningless; comparison of EAU values are meaningful for reactive samples only (EAU > 150). Because the magnitude of specific responses is dependent on the concentration of allergen-specific IgE that can span a wide range, a better means of comparison of repeat results for individual samples in an assay of this sort is to evaluate the correlation (perhaps Pearson statistic) of results that might exist.
The lack of a regulatory mandated quality assurance program for serum allergen specific IgE testing in companion animals, that independently monitors performance of all laboratories and assay formats, prompts Stallergenes Greer to accept the responsibility for continued evaluation of laboratories that routinely use the company’s assays. Information presented herein documents the continued commitment of Stallergenes Greer and its affiliate laboratories to providing a stream of information relating these results to the veterinary community.
Funding
Funding for this study was provided by Stallergenes Greer.
References
- Lee KW, Blankenship KD, McCurry ZM, Esch RE, Douglas J DeBoer, et al. (2009) Performance characteristics of a monoclonal antibody cocktail-based ELISA for detection of allergen-specific IgE in dogs and comparison with a high affinity IgE receptor-based ELISA. Vet Dermatol 20: 157-164. [crossref]
- Lee KW, Blankenship KD, McCurry ZM, Kern G, Rick Ruffner, et al. (2012) Reproducibility of a Monoclonal Antibody Cocktail Based ELISA for Detection of Allergen Specific IgE in Dogs: Proficiency Monitoring of macELISA in Six US and European Laboratories. Vet Immunol Immunopathol 148: 267-275. [crossref]
- Lee KW, Blankenship K, Kinney Mc B, Kern G, Jesse Buch, et al. (2015) Proficiency monitoring of monoclonal antibody cocktail–based enzyme-linked immunosorbent assay for detection of allergen-specific immunoglobulin E in dogs. Journal of Veterinary Diagnostic Investigation. 27: 461-469. [crossref]
- Lee K, Blankenship K, Kinney Mc B, Kern G, et al. (2017) Continued Proficiency Monitoring of Monoclonal Antibody Cocktail-Based Enzyme-Linked Immunosorbent Assay for Detection of Allergen Specific Immunoglobulin E in Dogs – 2016. Integr J Vet Biosci 1: 1-10.
- Lee K, Blankenship K, Kinney Mc B, Kern G, et al. (2018) Proficiency Monitoring of Allergen Specific IgE macELISA ̶ 2018. Integr J Vet Biosci 2: 1-6.
- Enck K, Lee K, Blankenship K, McKinney B, et al. (2019) Proficiency Monitoring of Allergen-Specific IgE macELISA – 2019. Integr J Vet Biosci 3: 1-6.
- Lee KW, Blankenship KD, McKinney BH, Morris DO (2020) Detection and Inhibition of IgE for cross-reactive carbohydrate determinants evident in an enzyme linked immunosorbent assay for detection of allergen specific IgE in the serum of dogs and cats. Vet Dermatol.
- Altmann F (2016) Coping with cross-reactive carbohydrate determinants in allergy diagnosis. Allergo J Int 25: 98-105.
- Holzweber F, Svehla E, Fellner W, Dali T, Stubler S, et al. (2013) Inhibition of IgE binding to cross-reactive carbohydrate determinants enhances diagnostic selectivity. Allergy 68: 1269-1277. [crossref]
- Yokoi H, Yoshitake H, Matsumoto Y, Kawada M, et al. (2017) Involvement of cross-reactive carbohydrate determinants-specific IgE in pollen allergy testing. Asia Pac Allergy 7: 29-36.
- Kaulfürst-Soboll H, Mertens M, Brehler R, von Schaewen A (2011) Reduction of cross-reactive carbohydrate determinants in plant foodstuff: elucidation of clinical relevance and implications for allergy diagnosis. PLoS One 6: 17800. [crossref]
- Ito K, Morishita M, Ohshima M, Sakamoto T, et al. 2005 Cross-reactive carbohydrate determinant contributes to the false positive IgE antibody to peanut. Allergol Int 54: 387-392.
- Mari A, Iacovacci P, Afferni C, Barletta B, et al. (1999) Specific IgE to cross-reactive carbohydrate determinants strongly affect the in vitro diagnosis of allergic diseases. J Allergy Clin Immunol 103: 1005-1011. [crossref]
- DeBoer DJ, Hillier A (2001) The ACVD task force on canine atopic dermatitis (XVI): laboratory evaluation of dogs with atopic dermatitis with serum-based “allergy” tests. Vet Immunol Immunopathol 81: 277-287. [crossref]
- Gorman NT, Halliwell, REW (1989) Atopic Diseases. In: Halliwell REW, Gorman NT. Veterinary Clinical Immunology 232-252.
- Griffin CE, DeBoer DJ (2001) The ACVD task force on canine atopic dermatitis (XIV): clinical manifestation of canine atopic dermatitis. Vet Immunol Immunopathology 81: 255-269. [crossref]
- Griffin CE, Hillier A (2001) The ACVD task force on canine atopic dermatitis (XXIV): allergen-specific immunotherapy. Vet Immunol Immunopathol 81: 363-383. [crossref]
- Tijssen P. (1993) Processing of data and reporting of results of enzyme immunoassays. In: Burdon, RH, van Knippenberg PH, editors. Practice and Theory of Enzyme Immunoassays 385-421.