Monthly Archives: September 2019

New Directions in Cancer Therapy – Peptide Targeting Therapy

DOI: 10.31038/CST.2019444

Mini Review

About 10% of the world’s population each year is dying of cancer; if appropriate treatment is improved, it may delay and reduce this situation. From 60 to 70 years ago, the way to treat cancer, chemotherapy, is chemotherapy using a strong toxic drug, such as Endoxan (or doxorubicin) or other chemotherapy drugs to treat cancer patients. Due to the strong side effects of these anticancer drugs, after a few weeks of treatment, the patient is often subjected to great pain and even needs to stop taking the drug immediately.

Although many people have come up with alternative treatments such as interferon or interleukin-2 (IL-2) to treat a small number of tumors, such treatments also have strong side effects. Later, there was a so-called “cancer immunotherapy”, which is only 20 to 30% efficient, not only expensive, but also often accompanied by lethal side effects. In order to avoid side effects, the author team proposed another type of cancer therapy, which hopes to inhibit and kill cancer cells without causing damage to normal cells. In the process, the team designed a peptide length consisting of 12 amino acids, using a peptide library presented by phage to screen out specific peptides; this peptide can be used without binding to normal cell membranes. It binds to the cancer cell membrane. According to this method, the team first identified a peptide sequence, L-peptide, whose C-terminus binds to more than 8 cancer cells, but does not bind to normal cells [1, 2].

Not only that, but the team also covalently bonded the N-terminus of the L-peptide to the liposome containing the chemotherapeutic drug, and the other end of the L-peptide was still able to adhere to the cancer cell membrane. Through this action, chemotherapy drugs can be brought into cancer cells to kill cancer cells. Immediately afterwards, the team continued to use the phage to displayed random peptide library, and successively identified “SP94 peptide” and “PC5-59 peptide”, which can bind to the cancer cell membrane and the microvascular cell membrane in the tumor. After confirming its ability to bind to various cancer cell lines, the team has further experimented with peptide-targeted therapy, which has been shown to inhibit tumor growth and reduce the side effects of chemotherapy drugs [3].

Dr. Wu Hang-chung, Dr. LeeTong-Yound and Dr. Zhang Dekuan continued their efforts in the laboratory of the author team and several other graduates who graduated from the laboratory. The peptide biomarker research has achieved 13 international patents. With a very high evaluation; from the beginning of the research, the laboratory has accepted more than 35 cancer associations and research institutes from all over the world to give a speech. Only time is limited, and finally only choose Soviet Russia, Japan, China, Taiwan Pathology Medical Association, Singapore, Italy, the Czech Republic and the United States to communicate. Among them, 60% of the invited units arranged for the author to be the keynote speaker of the seminar.

Currently, Dr. Wu Hang-chung, a researcher at the Academia Sinica, is dedicated to the research of cancer and infectious diseases. In the research of dengue virus, he has successfully developed four in vitro detection kits that identify four dengue virus antibodies and have high sensitivity and specificity. The reagent is more effective than the currently available fast screening reagents; and its immunotarget anticancer drug delivery system research has great clinical potential, not only breaks through the bottleneck currently facing cancer treatment, but its innovation research has also led internationally. Among the research results, there are 13 technical licenses (including 36 patents) for the biotechnology industry, and the total transfer amount of technology transfer exceeds NT$250 million, which is expected to become one of the important future research and development achievements of the country.

References

  1. Lee TY, Wu HC, Tseng YL, Lin CT (2004) A novel peptide specifically binding to nasopharyngeal carcinoma for targeted drug delivery. Cancer Res 64: 8002–8008.
  2. Chang DK, Lin CT, Wu CH, Wu HC (2009) A Novel Peptide Enhances Therapeutic Efficacy of Liposomal Anti-Cancer Drugs in Mice Models of Human Lung Cancer. PLOS ONE.
  3. Jon-Kai Hsial, Hang-Chung Wu, Hon-Man Liu, Alice Yu, Chin-Tarng Lin (2015) A multifunctional peptide for targeted imaging and chemotherapy for nasopharyngeal and breast cancers. Nanomedicine: Nanotechnology, Biology, and Medicine 11: 1425–1434.

Different Interactions and Different Selves: A Mind Genomics Exploration of Social Theory

DOI: 10.31038/ASMHS.2019333

Abstract

The study presents a cartography of the ‘self’ from the point of view of experimental psychology, applied to social theory. We explore how people describe themselves in their interactions with others, using experimentally designed vignettes of descriptive statements, constructed according to the prescriptions of Mind Genomics. The pattern of deconstructed responses to the vignettes and the weighting factors of the descriptive statement suggest that people divide into three mind-sets one group focusing on people, one group focusing on games, and one group hard to define. The study presents a tool, the six-question PVI, personal viewpoint identifier, which allows the researcher to assign a new person to one of the three mind-sets based upon the pattern of response to the six questions. The study failed to find a strong co-variation of age with membership in the mind-set, but does suggest that response time to the different descriptive statements may show the hypothesized relation of personality to age.

Introduction

Philosopher George Herbert Mead wrote that the self emerges from the internalized interactions with others. Of course, heredity is a kind of base from which to build the self, but it is not the ongoing architect of the self. Rather, beginning with internalized interactions with parents, the self can be said to be formed over time. Following this idea, one can think of a person’s self as a kind of congeries of internalized others, thinking and action are a result of a sort of internal discussion among those “others.”

The theoretical thinking behind this study can be summarized in these nine points:

  1. The human personality is not fixed.  It is a kind of ongoing internal conversation, sometimes placid, and directed, sometimes excited and divergent.
  2. Personality is constructed on a base of face to face interactions when very young, usually primarily with parents, somewhat later with other meaningful others [1].
  3. These interactions are internalized into a kind of picture of the world with which the person acts.  Mead called this the “generalized other” [2].
  4. As the person ages, he or she integrates others, bits and pieces of the meanings and attitudes of peers, teachers, buddies, enemies.  That means that the person is always changing, although the evolving personality builds on that early base [3].
  5. Even though the person does change over time those changes slow as the person ages.
  6. Interaction with these others is most effective and meaningful when they are directly made, not mediated by such things as telephones, the internet, or writing.
  7. Other important inputs come from the worlds of advertising, marketing, the media, education, video games, and word of mouth. DeCerteau [4] called these “fragments.”  These fragments are less ordered and, as they are integrated, lead to less organized and connected personae.
  8. In addition, the media (and the new social media) have become more salient in people’s lives. A middle-class white person may spend up to seven hours a day immersed in commercial media or the new social media.  A French commentator [5] even believed that the action, color, and fury of the commercial media can become “hyperreality”, displacing the dull, often degrading, everyday reality. If true, then man of us live at least in part in dream worlds,
  9. Assuming all this is true, we can expect that the forms of connection among different people will reflect in their behavior.  That is, that people will internalize their interactions with “others”. These internalized “others” form a “self.  Thought in that “self” is a kind of internal discussion. What those “others” are like may vary dramatically across people [6].

Mead could not envision the complex communications world today.  Beginning in early childhood, other kinds of communications have augmented and replaced face-to-face interactions.  The telephone, texting, Facebook exemplify of mediated interactions.   Television is an example of one-way interaction mediated by images on a screen. Games and AI (artificial intelligence) are examples of two-way interactions with non-humans, even interactions with those who/which are sometimes wiser and more correct than mere humans.

What kinds of selves result from this change in the life-worlds of people now? A core hypothesis is that people formed in the world of mediated communication are less likely, less able to immerse themselves in direct interpersonal communication.  Why be bound by time and space when one can text?  Why argue with someone else when you can cut him (or her) off on Facebook?

The ideal way to answer this and other questions is to do a massive longitudinal study.  Some preliminary answer can be uncovered in a survey using these assumptions:

  1. People can identify their own behavior adequately without delving into precise measures of time spent of that activity.
  2. Age can serve as an adequate substitute for longitudinal research.  Older people internalize the effects of less mediated interpersonal relations; younger people will have internalized the effect of more mediated, less-interpersonal relations.

Subjecting Mead’s conjecture to empirical analysis using a Mind Genomics experiment

One of the key tools of sociology is the survey, wherein the respondent is asked a variety of relevant questions about a topic, responds, and then the answers are tabulated, and, in some cases, compared to exogenous behavior, so-called ‘real world’ behavior.  This approach is the sociological approach, working with large numbers, and seeking covariations between and among variables, covariations which should be relevant and strong, so that the relations emerge out of the background ‘noise.’ From this emergence, the results, usually from noisy cross-sectional analysis, show significant relations, occasionally sufficient to falsify the hypothesis, but not necessarily strong enough to force acceptance of the hypothesis.

Mind Genomics provides sociological theory with a different way to think of the problem, one which works with systematically varied stimuli, phrases, obtains responses, reveals strong relations where they exist, and thus more rapidly drives to accepting or falsifying the conjecture.

In the study reported here, people were instructed to judge the extent to which a series of combinations of forms of communication (vignette) described them. These vignettes comprised statements about the actual communication as well as statements about their own wishes and desires with respect to others. The responses to these combinations were deconstructed to see what messages within the vignettes truly defined the respondent. The rationale for using vignettes comprising combinations, rather than the more common ‘isolated, single idea’ that ‘mixtures’ of messages provide a more ‘natural’ type of stimulus, a compound description of the type one typically encounters, Furthermore, the systematized mixing of different descriptions into vignettes, make it impossible for the respondent to ‘game’ the system, to be politically correct, and in doing allow one’s an internal mental editor to skew the results.

Method

The study used Mind Genomics, a newly emerging branch of psychological science with roots in mathematical psychology, marketing, and statistics [7–11]. Mind Genomics focuses on the experimental analysis of the everyday, the quotidian aspects of our lives. The ingoing principle of Mind Genomics, the world-view it presents, the methods it uses, the conclusions it draws, can be likened to the exploration of new worlds, telescopes when these new worlds are galaxies, cartography when these new worlds are lands, and the microscope and MRI (Magnetic Resonance Imagery) when the new worlds are biological tissue. In other Mind Genomics can be likened to mapping a world in terms of its granular specifics, without obeisance to the twin standard scientific efforts of ‘minimizing noise, and ‘falsifying an ingoing hypothesis. Mind Genomics looks for patterns and stops there.

Mind Genomics proceeds in a series of steps. We follow these steps with the data presented here.

Step 1 – Define the topic:  The topic here is the nature of social interaction, in a world of pervasive electronics which compete for people’s time and which allow a person to interact with others in many ways, or not interact at all with people. The person may even to choose to interact with the increasingly realistic ‘world’ generated by the electronic device.  The topic here is the ‘nature of one’s response to different forms of communication in an era of enhanced electronics’

Step 2 – Create the ‘raw material’ using the Socratic approach of question and answer(s):  The raw material comprises a set of statements about the topic, statements which paint a ‘word picture.’ The research requirement is that the investigator work within the scope of the topic, asking four questions which ‘tell a story’ and then for each question, provide four ‘answers.’ The answers are simple stand-alone phrases. Table 1 presents these questions and answers.

Table 1. The ‘raw material’ for the study, comprising four questions, and four answers to each question.

Question A: How do I communicate with people?

A1

Talk directly with people a lot

A2

Talk on the phone a lot

A3

Use Skype What’s App even dating chats a lot

A4

Text and email a lot

Question B: How do I communicate with non-people?

B1

Often work alone on computer

B2

Often play games on smartphone or computer

B3

Research look up facts, e.g., Google or Siri

B4

Read a lot on the screen. e-books or blogs

Question C: How do I care for others?

C1

I want to be mainly with my friends

C2

I want to be mainly with my co workers

C3

I want to be mainly with my family

C4

I want to enjoy meeting new people A LOT

Question D: What do I want ?

D1

I would feel great when Ieft alone

D2

I would feel great when I’m known as a friendly person

D3

I would feel great when I’m known as successful and well off

D4

I would feel great when I’m respected

The Socratic method of questions and answers becomes a simple way of organizing different types of ideas. The questions will never be used in the actual respondent-facing experiment. Rather, the questions (also known as silos or categories) are simply there to drive the production of the different answers (also known as elements.)  It is far easier to break the preparation into the two parts of developing questions which ‘tell a story’ (often considered the harder step), and then answering those questions with four alternative answers to each question (often considered the easier step.)

Step 3 – Use an Underlying Experimental Design to Specify the Combinations of Answers:  Mind Genomics works by mixing/matching answers from the different questions. The underlying experimental design ensures that the effort to create the combinations is successful, in a manner which is both not onerous to the respondent and enables the data to be analyzed using OLS (ordinary least-squares) regression [12].

The underlying design has been presented previously [13], the design is a single structure, which, for this study calls for 24 different combinations or vignettes. Each combination comprises at most one answer from a question, but in many of the vignettes one or two questions do not contribute answers. These are incomplete combinations but tested alongside the complete combinations comprising exactly one answer from each question.

The experimental design ensures that each of the answers appears equally often across the set of 24 vignettes, and that the 16 answers are statistically independent. Furthermore, the incompleteness of some vignettes in the design prevents multi-collinearity. Furthermore, the incompleteness of the vignettes ensures that coefficients emerging from the OLS regression will have absolute properties, not relative ones. If the vignettes were all to have exactly one answer from each question, a practice of most individuals using ‘conjoint measurement’ and experimental design, then the regression coefficients would be relative, not absolute, and the exercise would have very little value for an archival science where the values of the coefficients are to have meaning as the science grows.

The actual creation of the experiment is done by transferring these questions and answers to a computer app. Figure 1 shows and example of what the researcher does to set up this Mind Genomics experiments. The entire process is ‘templated’ turning the ‘thinking’ part into the most effortful part of the project. The researcher need only ‘fill in the blanks,’ but must think strenuously about framing the topic as questions and answers.

Mind Genomics-024 - ASMHS Journal_F1

Figure 1. Example of the templated approach to doing the study. The figure shows the screens requiring the researcher to select four questions, and then provide four answers to the first of the four questions.

Mind Genomics-024 - ASMHS Journal_F2

Figure 2. The five-point rating scale, incorporating two smaller scales within.

Step 4 – Create the Respondent Orientation Page:  Social research with questionnaires is often done using simple scales, such as degree of feeling, from no feeling to strong feeling, or degree of agreement from disagree to agree. The first, degree of feeling, is an assessment of the attitude or behavior as it stands by itself, such as the strength of one’s belief in the attitude. The second is the degree to which the attitude or behavior ‘fits’ or ‘describes’ a person or a situation. The second, therefore, calls into play both one’s perception of the attitude or behavior, first as it exists, and then as it describes something or someone. There are two judgments in the second, albeit combined into one.

A good analogy of this division of questions comes from the world of food, specifically the area of sensory evaluation of a product, such as a pickle. One can rate the sourness of the pickle, a presumably ‘objective rating’, albeit one mediated by the sensory system. Or, in contrast, one can rate the degree of liking of that sourness, requiring the respondent to do two things when evaluating. The first is perceive the sourness, an action which is never observed. The second is judge the perception, an action which is observed.

The foregoing, evaluation of liking, was the motivator for the use of a modified scale, shown in Figure 2. The scale comprises five points. The scale really comprises two scales, a scale of approval (do not approve, approve) and a scale of reference (not like me, like me, exactly like me). In statistics the scale is known as a nominal scale. We will not use the numerical values of the scale, which are simply placeholders. Rather, in the analysis of the scale data we will look at the scale from three different points of view:

4a. Define the person – exactly me (select 5) versus not exactly me (select 1,2, 3 or 4).  When we look at defining the person, a rating of 5 will be converted to 100 (plus a very small random number to ensure that the regression doesn’t crash.) A rating of 1,2,3 or 4, respectively, will be converted to 0 (plus a very small random number

4b. Define Like ME. Remove all vignettes with a rating of 5. For the remaining vignettes,  assign a value of ‘100’ when the rating is 2 or 4, and assign a rating of ‘0’ when the rating is 1 or 3. This strategy creates a new variable which becomes ‘100’ when the rating is ‘like me’

4c. Define APPROVAL. Remove all vignettes with a rating of 5. For the remaining variables, assign a value of ‘100’ for ratings of 2 or 3, respectively. These were ratings of approval. Assign a value of ‘0’ for ratings of 1 or 4, which signaled disapproval.

Step 5 – Execute the study in the field:  The Mind Genomics studies have been ‘templated’ so that they are easy to create, and to deploy. The traditional methods of market research have been to ask people to participate, encouraging participation by such anodynes as ‘your opinion counts.’ Waiting for the respondents to participate without any coercion such as membership in a panel has, in the past decades, become increasingly an exercise in futility. The Mind Genomics APP is equipped with a module allowing the researcher to select the target group and pay for the respondents who participate from that group. The payment fee, nominal at $2.60/respondent for a four-minute interview, virtually guarantees that the study of 50 respondents as shown here will be entirely completed, and rapidly, automatically summarized with an accompanying report approximately one-two hours after the study has been launched to the public.

Step 6 – Prepare the Data for Analysis: The data are recoded and prepared for regression analysis. The scale ratings are converted to a binary scale, 0/100. The response time remains as measured, the number of seconds (to the nearest tenth of a second) between the time the vignette appears on the screen and the time that the respondent keys in a rating.

The nature of the rating scale and the analysis required that the data be recoded, and then analyzed by OLS (ordinary least-squares) regression. The five-point scale shown in Figure 2 was deconstructed into the following sets of variables:

  1. Each of the five rating points became its own attribute (R1, R2, R3, R4, R5). For vignette only one of the five newly created attributes corresponded to a rating that had been chosen. For example, when the respondent selected R5, the newly created variable of R5 was converted to 100, and the other four newly created variables were converted to 0.
  2.  A new variable ‘NET ME’ was created. NET ME had the following structure: Ratings ‘2’ and ‘4’ were converted to 100; Ratings ‘1,’ ‘3,’ were converted to 0.
  3. A new variable ‘NET APPROVE’ was created. Ratings ‘2’ and ‘3’ were converted to 100. Ratings ‘1’ and ‘4’ were converted to 0
  4. For analysis of the relation between the presence/absence of the 16 elements and both ME and APPROVE, all vignettes assigned a rating ‘5’ were removed from the database

Step 7 – Build the model for EXACTLY ME: Our data comprised 50 respondents x 24 responses to the 24 systematically created vignettes for each respondent. Every respondent evaluated a unique set of 24 such vignettes, so we cannot average the ratings of the vignettes to get a sense of what ideas or messages work, and what do not work. The more appropriate way is to create a model, either for the total panel, or for the relevant subgroup (e.g., a specific age group). The model is expressed by the simple linear equation: EXACTLY ME = k0 + k1(A1) + k2(A2) … k16(D4).  The coefficients show the contribution of each element to the likelihood that the vignette will be rated ‘5’, i.e., EXACTLY ME.’ The additive constant, k0, is a purely estimated parameter, showing the expected probability of a vignette will be rated ‘5’, EXACTLY ME in the absence of elements. The additive constant, purely theoretical, serving a purpose, but not necessary to the understanding of the comparative performance of the elements.

Step 8 – Lay out the data in a matrix form and identify patterns in terms of which particular elements ‘drive’ the response EXACTLY ME: Table 2 shows us the results from the analysis of EXACTLY ME.  Each column of data represents the coefficients for the model estimated by putting ALL relevant respondents in the subgroup into a single pool of data, and then running ONE OLS regression on all the data of the group of relevant respondents. Thus, for Age 15–24, we compute only one OLS regression, incorporating all the relevant data.

Table 2. How the 16 answers ‘drive’ the selection of EXACTLY ME (Rating of 5 transformed to 100; Ratings 1,2,3,4 transformed to 0.

Total

Age

Mind-Set


Model based on relating the binary scale from R5 (Exactly ME) to the 16 answers or elements

Total

A15–24

A25–39

A40+

3C- Games

3D – Other

3E – People

Base size

50

14

17

19

17

17

16

Additive constant

27

24

24

28

26

33

26

B2

Often play games on smartphone or computer

5

5

0

11

10

1

3

C3

I want to be mainly with my family

3

-1

4

5

4

0

6

D2

I would feel great when I’m known as a friendly person

1

1

2

4

4

-11

10

D4

I would feel great when I’m respected

0

8

-4

0

-2

1

1

B1

Often work alone on computer

-1

4

-6

1

-2

2

-5

B4

Read a lot on the screen… E-books or blogs

-1

-3

-5

4

-4

2

-2

C1

I want to be mainly with my friends

-1

4

0

-3

-1

0

0

C4

I want to enjoy meeting new people A LOT

-1

2

4

-6

1

0

-2

B3

Research look up facts e.g. Google or Siri

-2

-6

-8

8

-2

-6

1

D1

I would feel great when Ieft alone

-2

10

-8

-3

-2

-2

-2

A1

Talk directly with people a lot

-3

-13

5

-1

-15

0

3

A4

Text and email a lot

-3

-8

10

-9

-9

-9

7

D3

I would feel great when I’m known as successful and well off

-3

4

-5

-3

-1

-6

-1

A2

Talk on the phone a lot

-5

-4

1

-11

-11

-2

-7

C2

I want to be mainly with my co workers

-5

6

-6

-10

1

-8

-8

A3

Use Skype What’s App even dating chats a lot

-10

-8

-2

-16

-11

-17

-7

The respondents from the different age groups and different mind-sets show similar additive constants (24–33). The low additive constant suggests that, in the absence of elements, a purely hypothetical situation, we might expect a quarter to a third of the responses to be ‘Describes EXACTLY ME. The additive coefficient is a good baseline. It will the task of the individual elements to drive the perception of ‘EXACTLY ME’

There are no strong performing elements for Total Panel. This failure for any single element to drive a strong rating of EXACTLY ME may result either from the fact that no elements describe the respondent, or more likely, from the fact that there are countervailing forces which cancel each other.   In contrast, key subgroups show dramatic differences

Total Panel

No strongly performing element

Age 15–24

I would feel great when Ieft alone
I would feel great when I’m respected
I want to be mainly with my co workers

Age 25–39

Text and email a lot

Age 40+

Often play games on smartphone or computer
Research look up facts e.g. Google or Siri

Step 9 – Uncover Mind-Set segments from the total population, based on EXACTLY ME: One of the key objectives of Mind Genomics is to uncover new-to-the-world groups of ideas or people, which provide a unique and identifiable focus. We introduce mind-sets here, as part of the way we classify the respondents. We create these mind-set segments by clustering coefficients. We begin by creating the EXACTLY ME model for each respondent, so that we create 50 individual models. This is made possible by the way we set up the study, which was to create the vignettes from each respondent using an underlying experimental design. The benefit is that now we create a model for each respondent separately. We store the 16 coefficients, not the additive constant, and then cluster the 50 respondents using the pattern of their 16 coefficients.

We generated two and then three clusters, so-called mind-set segments.  The two-cluster solution did not make sense, and was difficult to interpret, so we discarded it. The three-cluster solution made sense in terms of interpretation, and so it becomes the basis for the subsequent analysis of ‘what these data suggest about personality.’  Clustering is a well-established approach [14]. The final three data columns one the right side of Table 2 shows the coefficients for the three emergent mind-sets.

From the response patterns based on the linkage between the 16 answers and the rating of EXACTLY ME we can also assign names to the mind-sets

Mind-Set 3C – Focuses on games

Often play games on smartphone or computer

Mind-Set 3D

Nothing

Mind-Set 3E – Focuses on people

I would feel great when I’m known as a friendly person
Text and email a lot
I want to be mainly with my family

Finding these mind-sets in the general population

Traditional research has often assumed, whether explicitly or implicitly, that people who are similar to each other should be the basis of groups to be studied. The corollary to that is that people who are similar should think in similar ways. That is, we think of groups of people in terms of who they ARE and assume that how they THINK will be the same. Table 2 shows clearly that there are different patterns of thinking and different criteria for the same topic. Table 3 shows that these three groups of people, mind-sets, distribute in similar ways across the population. If we were to expand this study to be a thousand times larger, with 50,000 respondents rather than 50 respondents, it is quite likely that we would still be faced with a flat distribution of mind-sets cross the traditional groupings in the populations.

Table 3. Distribution of the three mind-sets across age, gender and the choice of what is most important (from the self-profiling classification at the start of the Mind Genomics experiment).


MS 3C Games

MS 3D Other

MS 3E People

Total

Total

17

17

16

50

Gender

Male

9

7

9

25

Female

8

10

7

25

Age

A15–24

6

4

4

14

A25–39

4

8

5

17

A40–82

7

5

7

19

What is most important

Being with other people

11

4

8

23

Where I live

3

2

2

7

What I own

0

2

1

3

Work I do now

2

5

3

10

No answer

1

4

2

7

In order to assign a new person to the appropriate mind-set we engage the new person in a short interaction, with a set of questions, designed to predict membership. The approach is known as the PVI, the personal viewpoint identifier. The six questions are those which best differentiate among the three mind-sets. The questions are taken for the set of 16 answers or elements, recast as questions, and given to possible answers. The 64 different patterns that could be created from the set of six questions are mapped to the three mind-sets, so that each response pattern assigns the person who produces that pattern to one of the three mind-sets.

Figure 3 shows the six-question PVI for this study. Figure 4 shows the feedback for the three different patterns. The feedback can be given to the new individuals or stored in a database for further research or for application in later deployment, such as sales or voter communication.

Mind Genomics-024 - ASMHS Journal_F3

Figure 3. Example of the personal viewpoint identifier, showing the six questions, and the two-point rating scale. The pattern of responses assigns the person to one of the three mind=-sets.

Mind Genomics-024 - ASMHS Journal_F4

Figure 4. Three feedback pages, showing the mind-set to which the new person belongs, as what to say and what not to say to the respondent.

Beyond EXACTLY ME to LIKE ME, and I APPROVE, respectively

The rating scale was set up to represent a graded scale in two dimensions, with two levels. These two dimensions have been captured in the four remaining scale values. It becomes straightforward to relate the presence/absence of the 16 answers to either ME or APPROVE by eliminating all vignettes with rating 5, and then creating two new dependent variables. The two new dependent variables are ME (defined 100 when the rating is either 2 or 4; defined as 0 when the rating is either 1 or 3) and APPROVE (defined as 100 when the rating is either 2 or 3; defined as 0 when the rating is either 1 or 4).

The foregoing recoding allows us to create two equations for any subgroup. The two dependent variables capture different types of judgments (WHO vs JUDGE).  Table 4 shows the coefficients for the two models.  In general, respondents say that they can be described as people-oriented (I want to be mainly with my family; I want to enjoy new people A LOT), and most approve of talking on the phone.  In other words, people see themselves as social, at least in general.

Table 4. Coefficients of the equations relating the presence/absence of the 16 answers/elements to judgments of ‘Like ME’ and ‘Approve’

Total Panel

ME

APPROVE

Additive constant

43

61

C3

I want to be mainly with my family

10

-4

C4

I want to enjoy meeting new people A LOT

6

-1

A2

Talk on the phone a lot

-3

9

A1

Talk directly with people a lot

-1

1

A3

Use Skype What’s App even dating chats a lot

-8

0

A4

Text and email a lot

0

-2

B1

Often work alone on computer

-4

-4

B2

Often play games on smartphone or computer

2

-1

B3

Research look up facts, e.g. Google or Siri

1

-5

B4

Read a lot on the screen. e-books or blogs

1

-7

C1

I want to be mainly with my friends

1

-1

C2

I want to be mainly with my co workers

4

1

D1

I would feel great when Ieft alone

-2

-1

D2

I would feel great when I’m known as a friendly person

4

-7

D3

I would feel great when I’m known as successful and well off

3

0

D4

I would feel great when I’m respected

0

-4

Response patterns by Age Groups

When we break down the respondents to the three age groups three patterns emerge:

  1. The youngest respondents (age 15–24) do not find much which resembles them. They approve of being sociable yet also approve of playing games and being left alone. They talk in two different ways, social and alone.
  2. The middle group of respondents (age 25–39) strongly feel that they are social, talking with people. They give blanket approval to what they read (additive constant 78).  They are agreeable.
  3. The oldest group (age 40+) also describe themselves as both social yet play a lot of games on the computer. They very strongly approve of direct contact with people, either in person or on the phone.

Response patterns by the previously uncovered group of three mind-sets

  1. Mind-Set 3C (gamers) feel that they are social and like to meet people. They strongly approve of talking on the phone, but that is all.
  2. Mind-Set 3D (other) feel that they are family oriented. They strongly approve of being social, being considered successful, yet also approve of being alone. They do not use the computer for information.
  3. Mind-Set 3E (people-oriented) say that they are people-oriented but also say that they like to play games on the computer. They primarily approve of talking on the phone a lot.
  4. The division of respondents into mind-sets generates mind-sets which overlap. That is, people divide into different groups, but these groups have much in common. This is not surprising, since people are more alike than different, so we are dealing with nuances of difference. In contrast, when we apply the Mind Genomics methods to issues outside personality, such as preferences for the products, such as a line of pasta sauces, we see radical differences, with some people liking spicy products, others liking chunky products, and so forth.

Step 10 – Link Response time to the elements: In the history of experimental psychology, the measurement of response time (also known as reaction time) occupies a venerable place. First suggested by the pioneering experimental psychologist, Wilhelm Wundt [15], response time was thought to signal something about the underlying psychological processes. Long response times were believed to be associated with unknown internal mechanisms, such as consideration of the message, efforts to block the message, and so forth.  Often, however, the specific internal mechanisms were not elaborated.

Mind Genomics incorporates the measure of response time in order to assess the degree to which the message ‘engages attention,’ resulting increased processing time, and thus increasing the response time. Once again, the benefit of experimental design at the level of the individual respondent becomes apparent. One can measure the response time to a set of vignettes.  Knowing exactly how the vignettes were structured enables one to relate the presence/absence of the individual elements to the response time. The outcome is the estimated number of seconds of response time that can be traced to the presence of the answer or element in the vignette.

The model for response time is the same as that used to relate the binary value of EXACTLY ME to the presence/absence of the 16 answers. The only differences are that the response time now becomes the dependent variable, and there is no additive constant in the equation. The rationale for abandoning the additive constant is that in the absence of answers (elements in the vignette) there is no response, and therefore the dependent variable is always 0.

Table 5. How age groups differ. Coefficients of the equations relating the presence/absence of the 16 answers/elements to judgments of ‘Like ME’ and ‘Approve’.

A15–24

A25–39

A40+

A15–24

A25–39

A40+


ME

APPROVE

Base Size

14

17

19

14

17

19

Additive Constant

58

42

31

48

78

57

B4

Read a lot on the screen. e-books or blogs

13

-11

1

-9

-9

-5

C4

I want to enjoy meeting new people A LOT

-10

24

6

14

-13

-6

C3

I want to be mainly with my family

-7

23

11

16

-13

-10

C1

I want to be mainly with my friends

-15

17

2

16

-3

-12

A4

Text and email a lot

0

12

-6

-15

-6

9

C2

I want to be mainly with my co workers

-2

12

6

9

0

-10

D2

I would feel great when I’m known as a friendly person

-5

8

9

-6

-8

-6

A2

Talk on the phone a lot

0

7

-12

2

0

23

D3

I would feel great when I’m known as successful and well off

-3

-9

17

-2

-2

5

B2

Often play games on smartphone or computer

-3

-7

11

9

-1

-9

B3

Research look up facts; e.g. Google or Siri

-5

-5

8

-9

-17

6

D4

I would feel great when I’m respected

-3

0

5

-3

-6

-6

D1

I would feel great when Ieft alone

-4

-10

4

8

4

-9

B1

Often work alone on computer

-16

-2

1

3

-11

-3

A1

Talk directly with people a lot

-1

-1

-3

-13

2

13

A3

Use Skype What’s App even dating chats a lot

-3

-5

-12

2

0

0

Table 6. How mind-sets different in the pattern of coefficients of the equations relating the presence/absence of the 16 answers/elements to judgments of ‘Like ME’ and ‘Approve’


ME

APPROVE

MS 3C

MS 3D

MS 3E

MS 3C

MS 3D

MS 3E

Games

Other

People

Games

Other

People

Additive constant

51

45

33

59

57

64

D2

I would feel great when I’m known as a friendly person

10

-2

4

-7

3

-16

D3

I would feel great when I’m known as successful and well off

8

-7

8

-2

6

-3

A1

Talk directly with people a lot

6

-10

-2

-5

6

4

C4

I want to enjoy meeting new people A LOT

6

-7

18

4

6

-16

C3

I want to be mainly with my family

4

11

14

3

-7

-7

C2

I want to be mainly with my co workers

5

-7

14

4

6

-10

B2

Often play games on smartphone or computer

-1

2

7

-6

6

0

C1

I want to be mainly with my friends

-4

1

6

4

-4

-7

D4

I would feel great when I’m respected

-2

2

5

-10

2

-5

B4

Read a lot on the screen. e-books or blogs

1

-1

5

-12

-3

-4

B3

Research look up facts e.g. Google or Siri

5

-7

4

-7

-3

-4

D1

I would feel great when Ieft alone

-5

-2

2

-8

8

2

B1

Often work alone on computer

-13

1

1

-1

-1

-6

A4

Text and email a lot

-5

3

0

-2

-2

0

A2

Talk on the phone a lot

-10

4

-4

9

5

17

A3

Use Skype What’s App even dating chats a lot

-7

-9

-10

5

2

-5

Table 7 presents the coefficients for the response time model. We look at all 1200 vignettes in the analysis, the 24 vignettes for each of the 50 respondents. The longer the response time, the more the message ‘engages.’ By ‘engages’ we mean the respondent appears to spend MORE TIME reading the answer when the answer is part of the vignette.   Engage is not the same as EXACTLY ME, and in fact the two variables do not correlate with each other.

Table 7. Response Time of elements by Total Panel and key subgroups. Response times of 1.5 seconds or longer are shown as cells which are shaded and the response time in bold numbers.


Response Time (seconds) based upon relating the response time of the vignette to the presence/absence of the answers/elements contained in the vignette

Tot

A1524

A2539

A40+

MS3C – Games

MS3D – Other

MS3E – People

A1

Talk directly with people a lot

1.1

0.5

1.4

1.2

1.3

0.3

1.6

A2

Talk on the phone a lot

1.0

1.2

0.7

1.0

0.9

0.7

1.3

A3

Use Skype What’s App even dating chats a lot

0.7

0.8

0.5

0.7

0.5

0.5

1.0

A4

Text and email a lot

1.1

1.0

0.8

1.4

1.4

0.3

1.6

B1

Often work alone on computer

1.0

0.5

0.9

1.3

1.3

0.7

1.0

B2

Often play games on smartphone or computer

1.1

0.8

0.8

1.6

1.6

1.1

0.6

B3

Research look up facts, e.g. Google or Siri

1.2

1.1

0.8

1.5

1.7

1.0

0.7

B4

Read a lot on the screen. e-books or blogs

0.9

0.5

1.0

1.2

1.3

0.6

0.9

C1

I want to be mainly with my friends

1.2

0.5

1.1

1.7

1.6

0.5

1.4

C2

I want to be mainly with my co workers

1.3

0.7

1.1

1.8

1.5

1.0

1.3

C3

I want to be mainly with my family

1.1

0.1

1.1

1.7

1.4

0.5

1.2

C4

I want to enjoy meeting new people A LOT

1.0

0.1

0.6

1.8

1.7

0.1

1.1

D1

I would feel great when Ieft alone

1.2

0.9

0.9

1.6

1.0

1.5

1.1

D2

I would feel great when I’m known as a friendly person

0.9

0.3

1.0

1.5

1.1

0.5

1.4

D3

I would feel great when I’m known as successful and well off

1.2

0.3

1.5

1.6

1.2

1.1

1.3

D4

I would feel great when I’m respected

1.0

0.2

1.0

1.6

0.6

1.1

1.4

To make it easier to understand the relation between answer/element and response time, we have shaded all cells with response times of 1.5 seconds or longer. There are no norms to guide us in the definition of what is a meaningful ‘engagement response time’ and so we arbitrarily choose a value for a long response time, based upon previous studies.  We note here that in many studies of the same sort, but with commercial products rather than personality descriptions, we find response times to be very short. The response times there are often a few tenths of a second for individual answers/messages embedded in the vignette.

The data suggest that there are differences in response time, especially by age, with the older respondents taking longer times to read and make their decisions. It may be that older respondents take a long time to react to the messages, whereas the younger respondents react quite quickly. That is not the only story to emerge, however. What is remarkable about the response time is that the older respondents appear to pay more attention to phrases which talk about their own aspirations as persons. It may well be that some of the conjectures about personality put forward by Mead might be supportable from the behavior of the older people, focusing on interpersonal reactions through their response times.

Here are the key groups, and the elements which ‘engage,’ i.e., which generate long response times.

Total Panel:

Nothing engages

Age 15–24:

Nothing engages

Age 25–39

I would feel great when I’m known as successful and well off

Age 40+

I want to enjoy meeting new people A LOT
I want to be mainly with my co workers
I want to be mainly with my friends
I want to be mainly with my family
Often play games on smartphone or computer
I would feel great when I’m known as successful and well off
I would feel great when Ieft alone
I would feel great when I’m respected
Research look up facts e.g. Google or Siri
I would feel great when I’m known as a friendly person

Mind-Set 3C – Focuses on games

I want to enjoy meeting new people A LOT
Research look up facts, e.g., Google or Siri
I want to be mainly with my friends
Often play games on smartphone or computer
I want to be mainly with my co workers

Mind-Set 3D – Other

I would feel great when Ieft alone

Mind-Set 3E – Focuses on people

Text and email a lot
Talk directly with people a lot

Discussion and Conclusion

The origins of this study come from an attempt to merge a theory of personality (G.H. Mead) with an empirical analysis of how people think of themselves (Mind Genomics.)  The ingoing hypothesis was that there would be an age-related change in personality, coming in part from the process of socialization and the way people interact with each other in a world of emerging electronic intermediations.  The Mind Genomics data suggest that there are differences in the way people describe themselves, but there does not appear to be a simple age-relation.

Mead’s conjecture about age might, however, play a role in the pattern of response times, the ‘engagement’ time that it takes for a respondent to make a decision. The older respondents appear to pay more attention than do the younger respondents, a pattern that might at first be construed as a simple age difference. There is a deeper aspect to the difference. The gap in the response time differs by the nature of the phrase. The longest response times for those ages 40+ come from phrases which talk about the person and who the person is.  Response time, a measure of engagement or time to process the information, may constitute a fertile new area for the understanding of issues of personality. The focus changes from insights based on ratings to insights based on active ‘mental processing.’ The insight is worthy of more investigation to understand how much may be gleaned by a deeper understanding of the dynamics of response time in Mind Genomics when the latter is applied to issues of personality.

Acknowledgement

Attila Gere thanks the support of Premium Postdoctoral Research Program of the Hungarian Academy of Sciences.

References

  1. Strauss A (1956) “Introduction” in The Social Psychology of George Herbert Mead. Pp. iv-xvi. Chicago: University of Chicago Press.
  2. Mead GH (2013) [1934]. Mind, Self & Society. Berlin: Heptagon.  Kindle Edition
  3. Carreira da Silva F (2007) G.H. Mead A Critical Introduction. Cambridge, UK: Polity.
  4. deCerteau M (1984) The Practice of Everyday Life. Berkeley: University of California Press.
  5. Baudrillard J (1994) Simulacra and Simulation. Ann Arbor: University of Michigan Press
  6. Cook GA (1993) George Herbert Mead: The Making of a Social Pragmatist. Urbana, IL: University of Illinois Press.
  7. Green PE, Rao VR (1971) Conjoint measurement for quantifying judgmental data. Journal of marketing research 8: 355–363.
  8. Green, P.E. & Srinivasan, V., 1990. Conjoint analysis in marketing: new developments with implications for research and practice. The journal of marketing, 54, 3–19.
  9. Luce, R.D. & Tukey, J.W., 1964. Simultaneous conjoint measurement: A new type of fundamental measurement. Journal of mathematical psychology, 1, 1–27.
  10. Moskowitz, H.R., Gofman, A., Beckley, J. and Ashman, H., 2006. Founding a new science: Mind genomics. Journal of sensory studies, 21, 266–307.
  11. Moskowitz, H.R. and Gofman, A., 2007. Selling blue elephants: How to make great products that people want before they even know they want them. Pearson Education.
  12. Box GE, Hunter WG, Hunter JS (1978) Statistics for experimenters, New York, John Wiley
  13. Gofman A, Moskowitz H (2010) Isomorphic permuted experimental designs and their application in conjoint analysis. Journal of Sensory Studies 25: 127–145.
  14. Dubes R, Jain AK (1980) Clustering methodologies in exploratory data analysis. Advances in Computers 19: 113–238.
  15. Boring EG (1929) A History of Experimental Psychology. The Century Company, NY

Hair Coloring: Mind Genomics Cartography of the World of Beauty

DOI: 10.31038/AWHC.2019245

Abstract

The study investigated consumer responses to message about hair coloring, as one of the ongoing cartographies by Mind Genomics of the world of consumer beauty. Respondents evaluated short, systematically designed combinations of messages about hair coloring (vignettes), these vignettes talking about the rationale for coloring one’s hair, the feelings about changing one’s color, beliefs about the ‘downside’ of hair coloring, and a comparison of different methods for beautifying one’s hair (e.g., coloring versus cutting), respectively. The deconstruction of the vignettes into their components suggests an underlying core of at least three emergent mind-sets (Follow the prescription of others; Coloring is a personal expression; Focus on self-care). The paper presents the PVI, personal viewpoint identifier, to assign new people to one of these three mind-sets, for subsequent use in research or sales.

Introduction

Little of the published literature in ‘experimenting science; is devoted to questions of a ‘more broad nature.’ Most experiments deal with questions about a small sliver of human daily life. A search of the literature of beauty, especially the quotidian use of products and services for daily and ordinary purposes, quickly reveals that there is little in the way of archival scientific literature on study of beauty as a topic, except perhaps in the world of sociology and social ethnography.  There is some data on beauty products and services, but not the plethora of information that would be expected, given the important role that beauty plays. The reality of ‘beauty’ as a topic is that it plays a major role in civilizations which have moved beyond the subsistence stage.

If one were to comment on today’s information about consumers and beauty, it would be almost impossible to assemble a world of scientific papers on beauty, and indeed nothing in comparison to the massive wealth of written material about beauty from the point of view of people and situations. The information, often purporting to be from scientific laboratories but presented in a high style, ‘glitzy’ fashion, would have us believe that we can be the masters of beauty, controlling it for our own uses.

A search through the literature of beauty suggests very little serious information regarding the way people think about beauty products and beauty services, especially hair, except for the most superficial information. We deal here with one topic, the psychological consideration of hair coloring, a topic which suffers a death of information, other than the insistent packages of home hair color, and occupying a lot of ‘trade real estate’ to feature the different colors. The reason for such dearth of information may lie in the fact that coloring one’s hair is not considered to be a topic of major scientific interest, nor in fact is it, when presented in such sterile terms. The reality is that the entire spectrum of behavior with respect to hair is typically considered from one of two rather distinct areas, neither of which deals with the deep psychology of cosmetics as one would have thought from the popular press:

  1. Hair specifically, then skin, as a substrate for the science of the product, usually studied by chemists.  Hair products in general and hair coloring in particular, enjoy a reasonable number of papers in the world of chemistry, noticeably cosmetic chemistry, some of which appear in journals dealing with cosmetics from the point of view of science. The articles in this world deal with the science of the physical product, the performance, and the interaction with the substrate, namely the human body. The topics in journals dealing with these aspects of cosmetic chemistry can scarcely be distinguished in their manner of presentation from topics of in other chemistry journals; namely chemistry first, cosmetics second, and the human experience scarcely considered, if at all e.g., Trueb 2005 [1].
  2. Beauty as a subject of behavior, primarily social behavior. The objective of such study is ethnographic, looking at behaviors of normal people in society, as a reflection of the society and its mores. In other words, cosmetics as a topic in anthropology, namely the person’s search for (Bloch, 1993; Cash 1987; Graham & Jouhar, 1981) [2,3,4].

The World of Hair Coloring

Hair coloring in the salon has excited the interest of researchers, not just because of its fundamental behavior in the world of beauty but rather it is an aspect of behavior upon which people spend a fair amount of money. Talking care of one’s hair eventuates in psychological rewards. People receive certain things in return, certain values from the experience, which reveals a great deal about the respondent’s values as an individual, and society’s values [5,6]. In a period suffused with various ways to spend money on oneself, and demonstrate one’s values, the world of beauty represents one of the key areas wherein deep investigation is likely to deliver far more than one expects [7]. The value of cosmetics and cosmetic behavior as a lens’ into a person’s emotions and social mind has been a topic having a history of decades, far earlier than the emerging third decade of this century [4,8].

Hair coloring comprises aspects of self-preservation and health, focusing on oneself, and the pursuit of ‘wow,’ the influencing of other, and so forth.  The topic of beauty in general, and hair care, including hair coloring, provides an extraordinary opportunity to understand the human mind, in an area where the outer world and the inner world collide, compensate for each other or simply endlessly dance around as the consumer, the individual, the outer-focused and the inner focused halves  emerge and recede (Datamonitor, 2005; Euromonitor, 2005, 2013a, 2013b, 2014) [9–13].

The inner experience of beauty has been explored, but not as much as it should be, Any prolonged time exploring the internet will reveal that that the really ‘interesting, meaty stuff’ about one’s experience with beauty may have already been pre-empted those using such personal stories and accounts of experience to gain readers, provide excitement, and sell products, ‘hope in a jar’ [14].

The Emerging Science of Mind Genomics and Its Cartography of the Mind for the Experience of Beauty

Mind Genomics can be considered cartography of everyday experience, exploring and understanding the dimensions, the aspects of experience. In the case of beauty, and specifically hair coloring, Mind Genomics would explore the different topics in the experience. These are the category of questions to be answered, studies best answered by cosmetic science or sociology, or even studies of communication. But then there is the human element, the response of people to these systematically arranged ideas, the use of ‘experiment’ to identify how these elements of beauty ‘function.’ This study of function is done by taking the ‘what’, the questions and answers about the search for beauty, specifically about hair coloring, and asking the respondent to evaluate these different answers using a predefined criterion

As an aside, it is instructive to trace the antecedents of Mind Genomics back to two early ‘schools’ of experimental psychology. The early science of experimental psychology embodied two competing approaches, Structuralism versus Functionalism. Structuralists were interested in the basic dimensions of the mind, classifying perceptions, behaviors, and so forth into different groups. From that classification scheme they believed that the structures would show the nature of what they were studying. The logic was Aristotelian. Classify, organize, and one will learn. The other science of psychology, Functionalism, posited that is that it is the way things operate which inform us about what we are studied. Just knowing the different classifications of perceptions does not tell us how we perceive something (Boring, 1929) [15].

The beginnings of Mind Genomics come both from the experimental psychology of a century ago and  from today’s unique confluence of experimental design, internet communication, need for speed, and the incessant push for faster, better, cheaper, and ultimately the push for ‘utterly effective.’  In other words, from the world of business, pushed back to the world of the scientist.

Mind Genomics began with the efforts of statisticians to understand the complexities of the world, but not from the hallowed methods of isolation and study, that gift of the enlightenment, and of the empirical Francis Bacon before the enlightenment.  Isolation and study of single phenomena is fine, but in the world of beauty we deal with many variables interacting, swirling about, and creating patterns to be understood, but understood only in a general way.  Experimental design simplifies that swirling complex cloud, showing relations between variables which interact to drive a response [16]. The development of Mind Genomics, continued with the pioneering work of Luce & Tukey [17], seeking to put their approach, conjoint measurement on a firm theoretic footing. The late Professor Paul Green of the Wharton School, University of Pennsylvania, and his associates over four decades, brought conjoint measurement into the world of business [18], which in the next evolution spawned Mind Genomics [19–22].

The ‘project’ of Mind Genomics, as explicated here, begins with an aspect of everyday life, proceeds to dissect that aspect into four questions which ‘tell a story,’ generate four answers to each question, and the present combinations of these answers in short, easy-to-read vignettes. Each vignette or combination comprises as many as four answers, or as few as two answers. No question ever contributes more than one answer to a single vignette.  Over the course of 24 vignettes, each respondent is exposed to the same answer or message 5x, albeit in the context of other answers. The respondent rates the vignette on an attribute provides. The subsequent statistical analysis ensures that one can read the vignette, the respondent will see combinations of the element, albeit different combinations [23].

The Raw Materials

The raw material for the Mind Genomics study comprises a set of four questions, with each question generating four answers. Both the questions and the answers come from the researcher. There is no ‘fixed set of questions and answers.’ Rather, the questions are guides which tell a story. The answers are the communications, the messages.

The four questions in Table 1 focus on the externals of the coloring process, on what the respondent can be told by a professional. This Mind Genomics study deals with the process, and what is important about the process. It does NOT deal with feelings, except feelings affected by technology.

Table 1. The raw material, comprising the four questions, and the four answers to each question.

Question A: Why do you color your hair?

A1

Coloring hair hides the gray

A2

Coloring hair gives a person a chance to ‘change’ the look – for fun, temporarily

A3

Coloring hair is trendy today

A4

Coloring hair lets the person ‘show off’

Question B: How do you feel when you change the color?

B1

Coloring hair instills confidence

B2

It takes a little time to get accustomed to a new hair color

B3

To prevent a feeling of insecurity, the coloring has to be ‘just right’

B4

Coloring makes hair beautiful

Question C: Do you think the color damages your health, your scalp, or your hair?

C1

Hair dye can affect health

C2

Hair dye can damage hair

C3

Hair dye can damage scalp

C4

Hair dye damages nothing

Question D: What do you find more beneficial coloring, treatment or cutting?

D1

Treatment on hair should be done regularly

D2

Coloring hair should only be done every other haircut

D3

It’s important to get hair cut properly

D4

Hair should be natural… cut when needed, nothing else

Finally, the four questions in Table 1 and the 16 answers are set up in a Socratic fashion. That is, the questions are real questions, and the four answers are couched in sentences. The answers or elements suffice to stand by them, and can be mixed and matched in the vignettes, as we will see below.  Researchers who do these Mind Genomics studies often volunteer their observation that the method forces them to think in a new way, one which is structured and defined by the question and answer structure. Furthermore, participation in many dozens of these studies over the past years suggests that the hardest part of the exercise comes when the researcher must formulate the four questions so that they ‘make sense’ and present the questions in the proper order to ‘tell a story’. In contrast the answers to the questions, the phrases which will become the building blocks of the vignettes, are far simpler to create. The answers are simple phrases that will be put together in a format, one atop the other, without the effort to make sense. That effort was already expended in the creation of the questions.

Combining the Answers or Elements into Easy-To-Read Vignettes or Test Concepts

If we were to stop at this point with the 16 answers to the four questions, we could subject the 16 answers to a set of rating scales, and feel that we have done adequate research, namely testing the raw materials. There might not be any thought of an experimental design in which we embed combinations of vignettes.  The foregoing ‘one-at-a-time’ approach characterizes most of science. That process produces the image of the scientist focusing on one isolated aspect of reality, then studying it with sufficient passion and concentration until the aspect of reality yields ‘its secrets.’

The reality of experience is quite different, especially when we deal with the topic of beauty. Human experience comprises combinations of features, of ideas, of stimuli, as well as expectations, the individual’s history, and the specific nature of the combination. The traditional methods relying upon ‘isolation to understand’ simply cannot work. The researcher must deal with combinations of variables, and from the reaction to these combinations identify what works, and what doesn’t work

Mind Genomics works by using the technique of experimental design, prescribing the systematic combinations of the variables [16]. The combinations are set up so that we begin with a topic, ask four questions, and for each question provide four answers. This was already presented in Table 1. The experimental design specifies 24 combinations, with the property that each unique experimental design is a permutation of a basic, underlying ‘kernel’ design.  This property is known as a permuted design [23].  The design ensures that the 16 answers are statistically independent of each other, allowing for regression analysis. The permutation means that no two respondents ever see the same combinations.

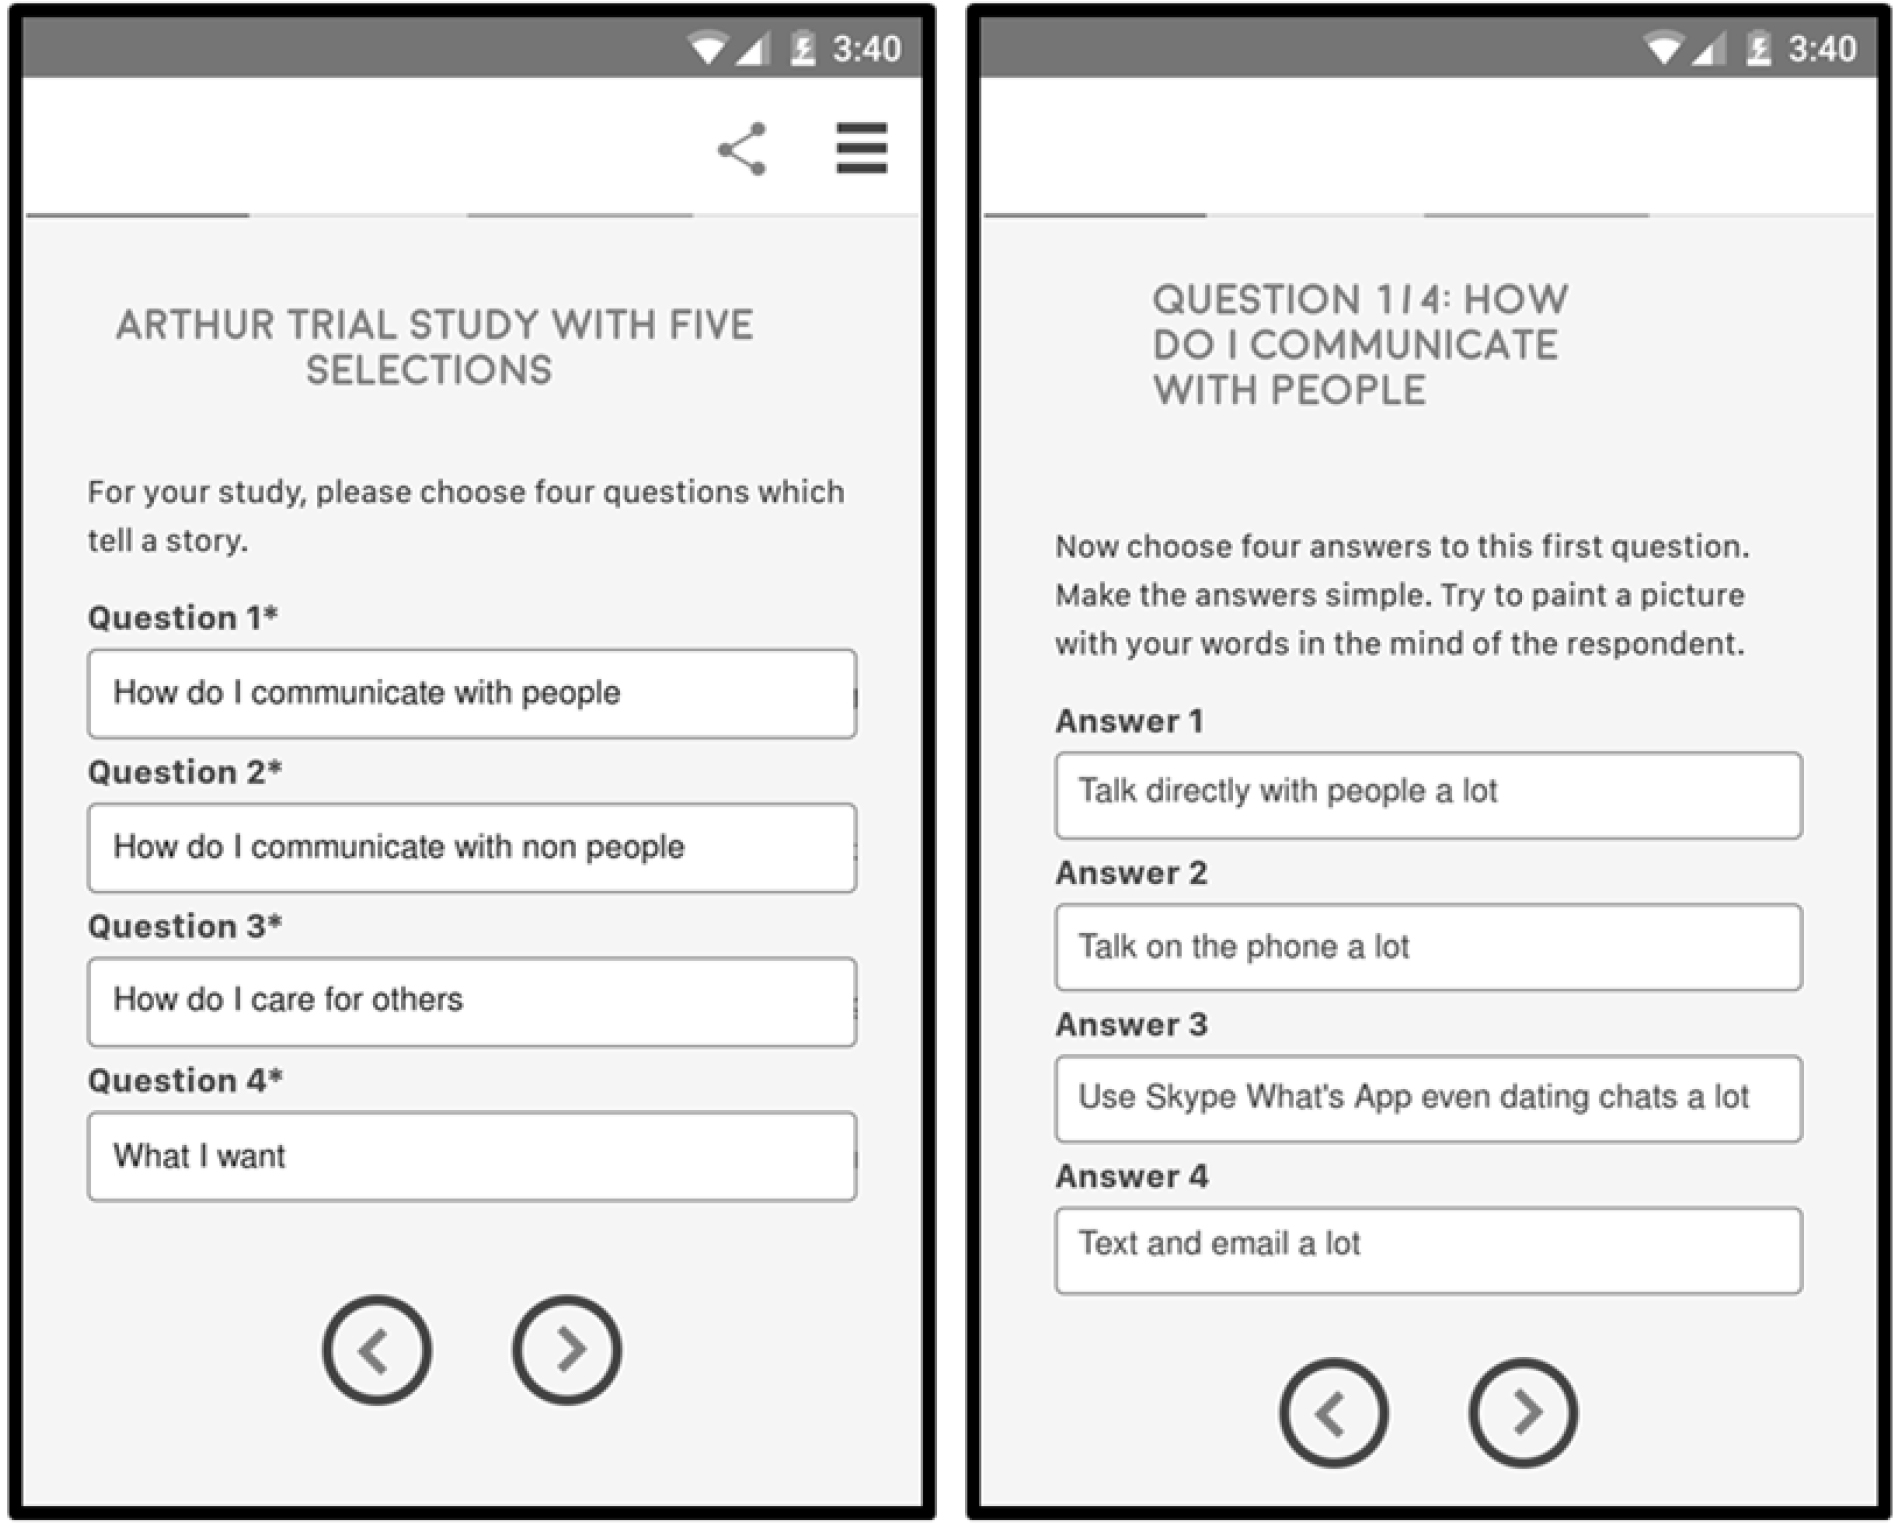
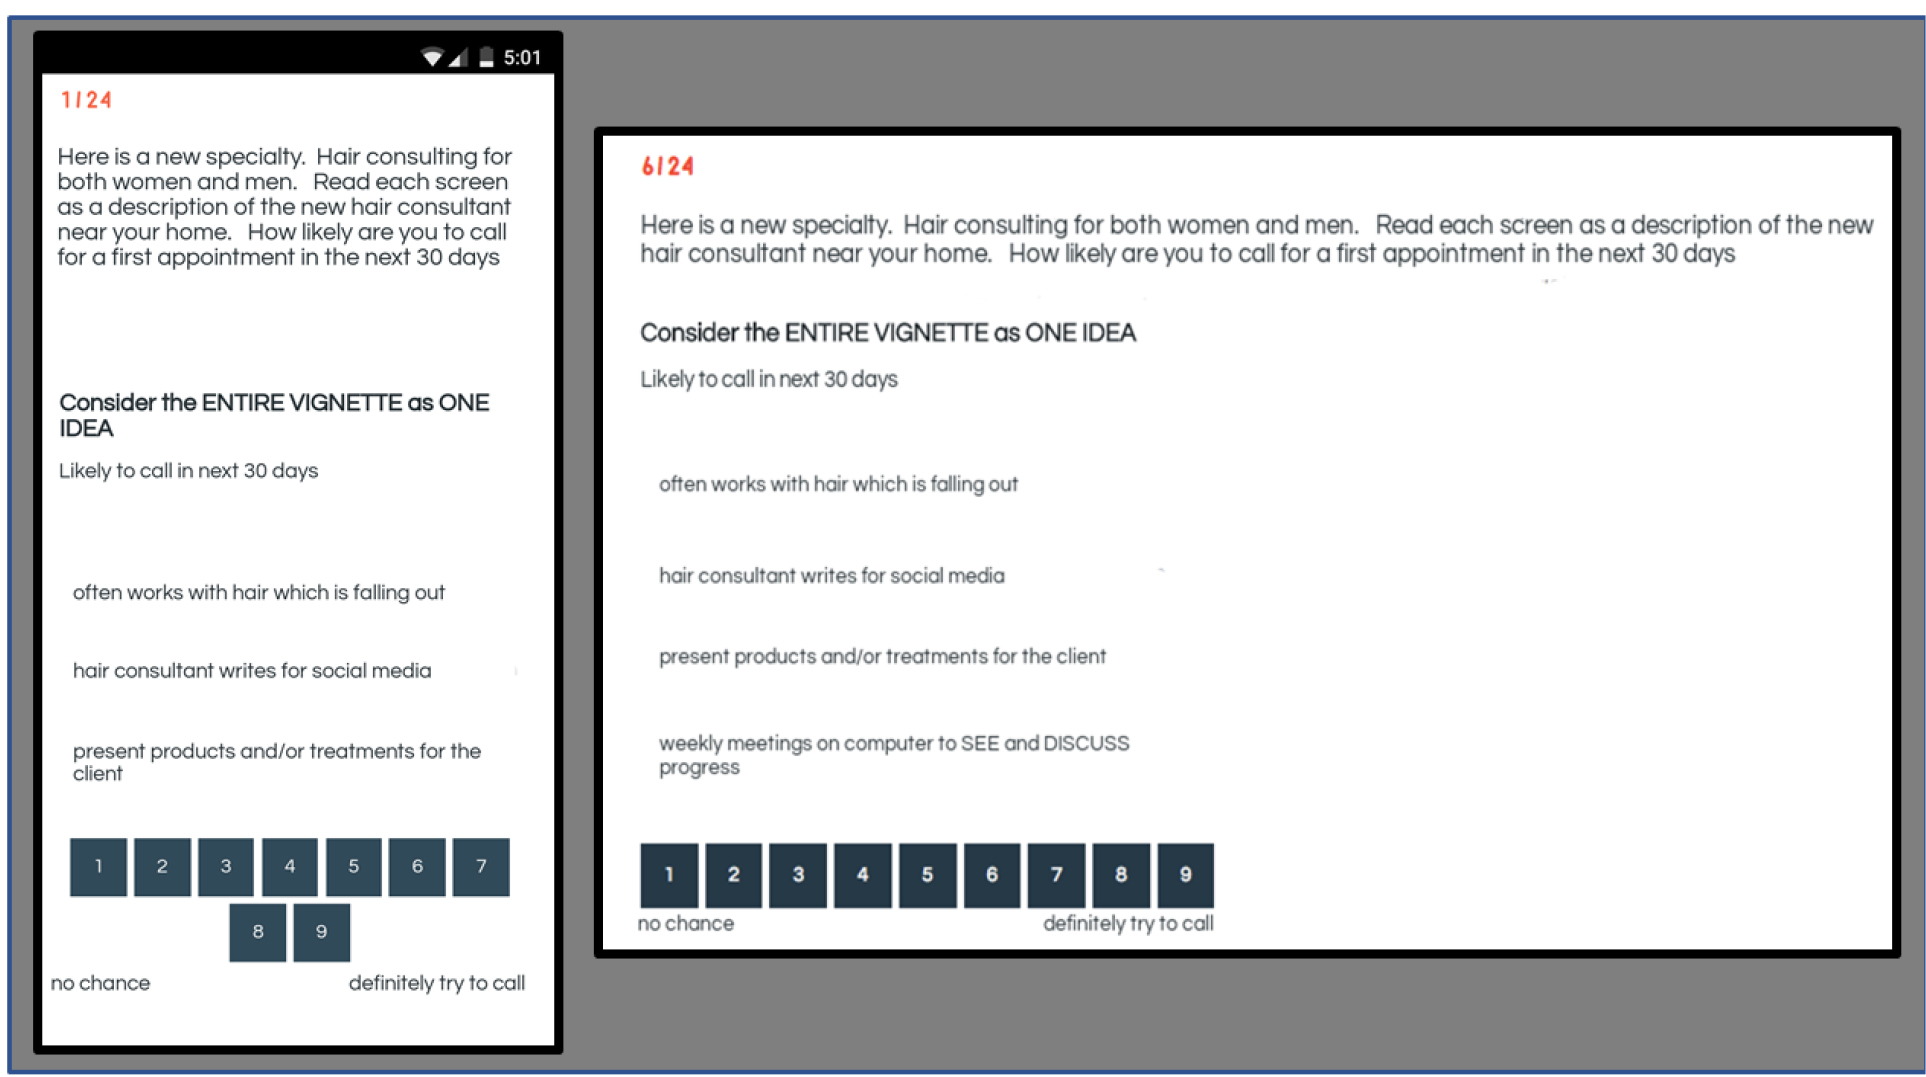
The combinations are generated, and put into a vignette, such as the vignette shown in Figure 1. The respondent who evaluates the 24 systematically generated combinations has no idea about an underlying design. The respondent may begin by trying to be ‘consistent,’ but the combinations end up putting a stop to that effort, and in turn the respondent simply assigns an answer in an intuitive way, following what Nobel Economist Daniel Kahneman called System 1 [24].

Mind Genomics-023 - AWHC Journal_F1

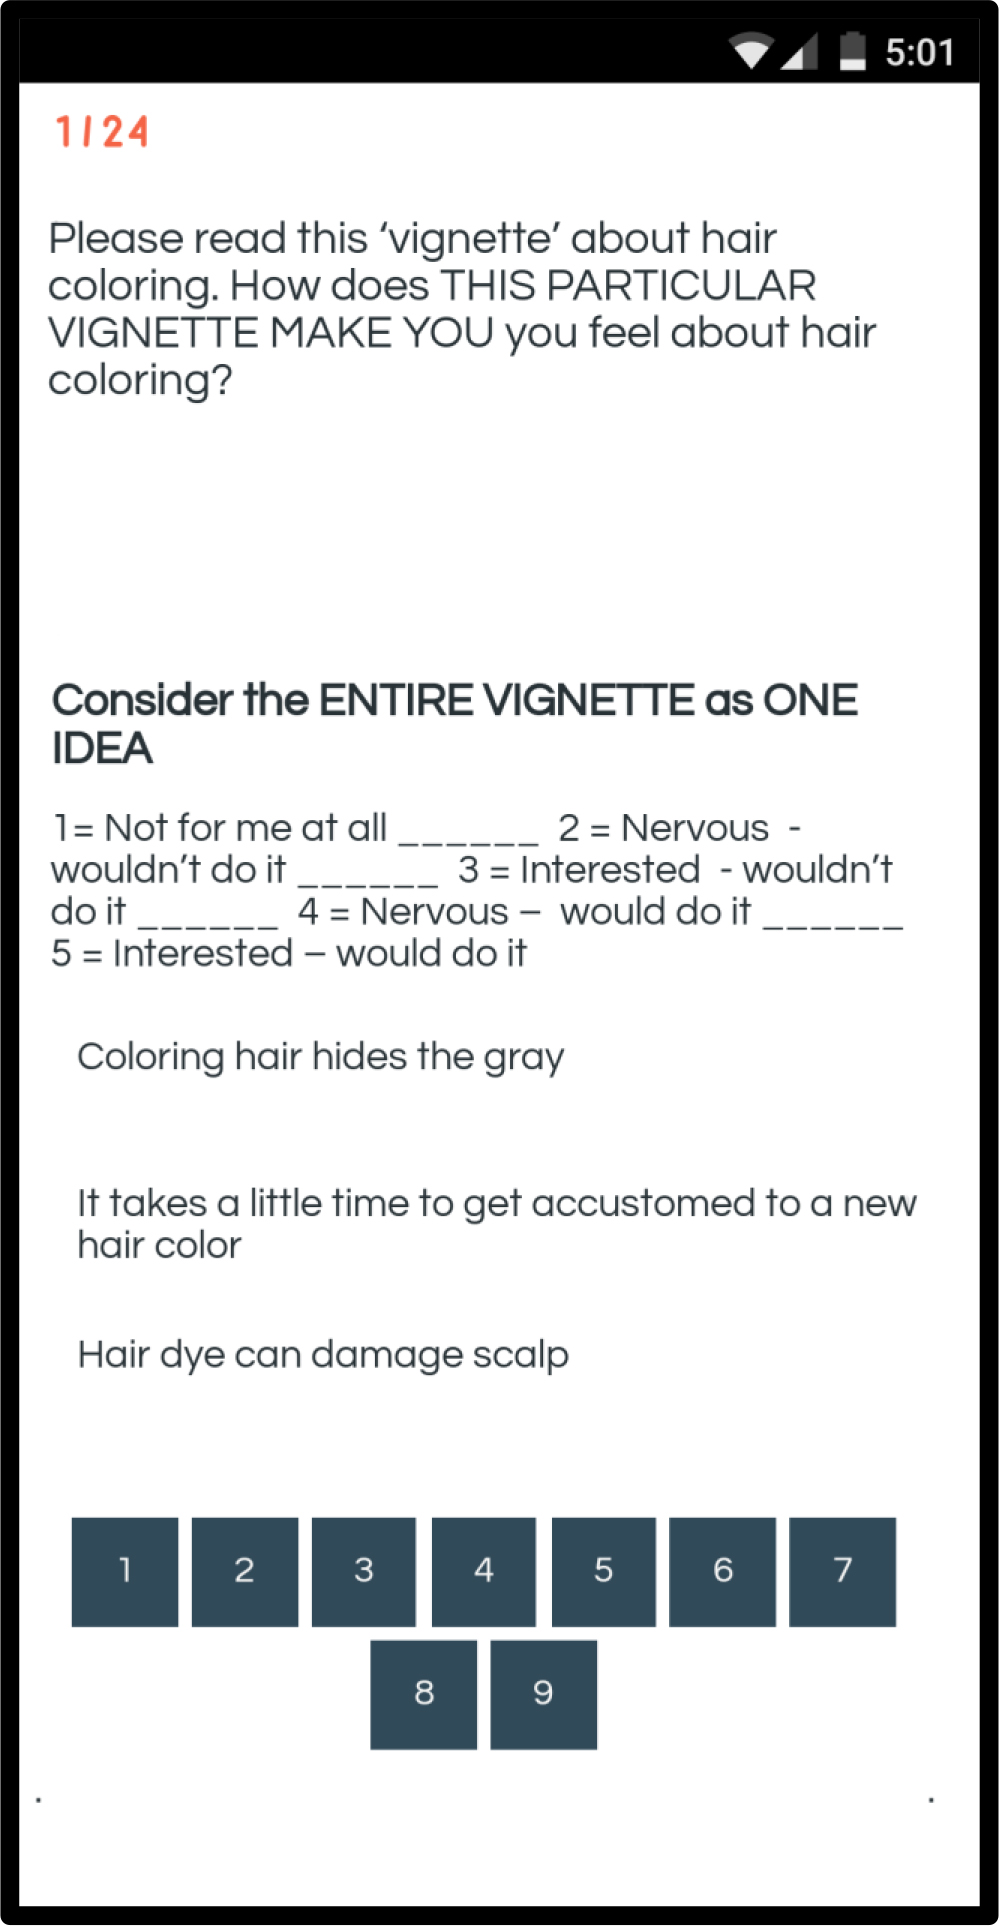
Figure 1. Example of a vignette prescribed by the experimental design and put into a test combination shown on either the screen of a smartphone (shown in Figure 1) or shown on the face of a tablet or PC.

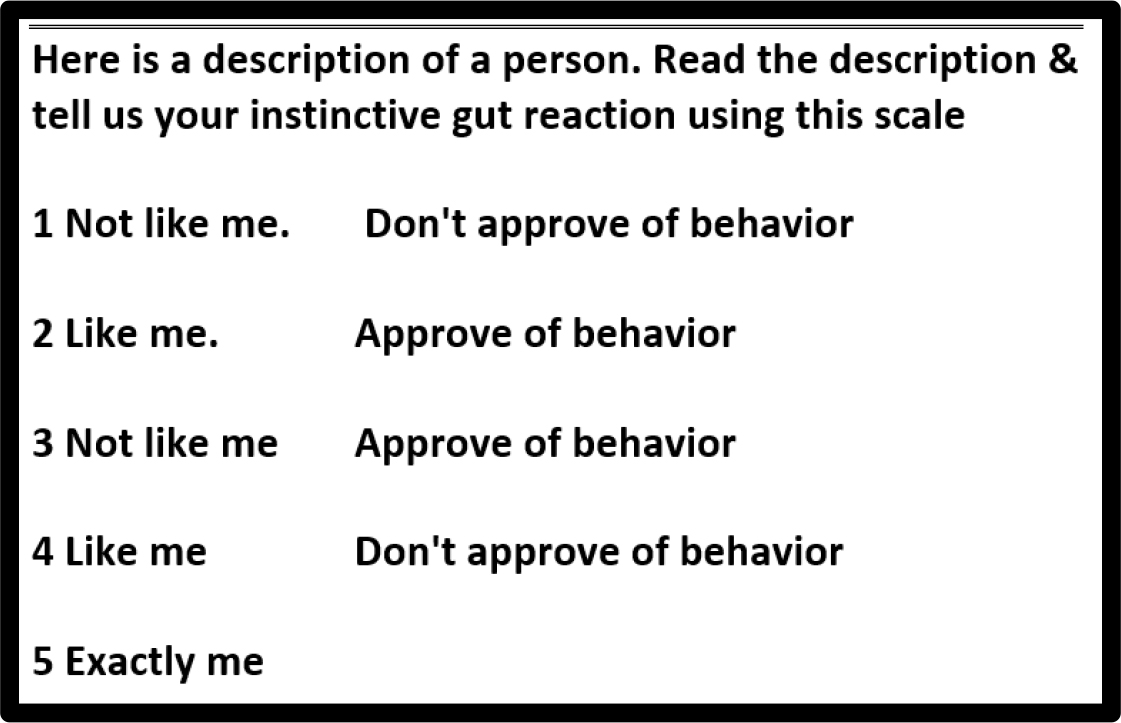
The respondent evaluated each of the 24 vignettes on a single scale, shown in the middle of Figure 1 and in Figure 2.  The five scale points deal with two aspects, first an emotional one (nervous versus interested) and second an action one (wouldn’t do it versus would do it). The two questions deal with hair coloring.

Mind Genomics-023 - AWHC Journal_F2

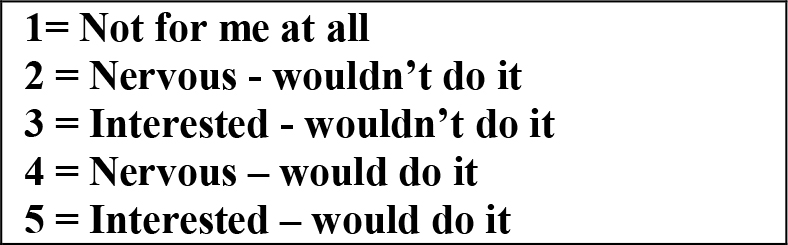
Figure 2. The labelled five-point scale, covering two aspects of the hair coloring experience, emotion and action, respectively.

Creating Binary Variables from the Five Scale Points in the Rating Scale

Mind Genomics studies provide a plethora of data. Each respondent evaluates 24 vignettes, doing so on a five-point scale. The single scale provides two measures; degree of feeling (nervous versus interested) and degree of intent (will not do versus will do.), respectively The Mind Genomics system also records the response time, defined as the number of seconds between the time that the vignette appears on the screen and the selection of the rating

We are fortunate to work with an underlying, ‘permuted’ experimental design, creating a unique set of 24 vignettes for each respondent, and in turn allowing us to discover the linkage between each element and both the 5-point rating and the response time. The algorithm [23] ensures the ability to understand the patterns in in a deep way.

Even before the application of modeling, we do a ‘surface analysis,’ looking at the average rating assigned by the respondents, for the 5-point scale, as well as for transformed aspects of the scale, such as ‘netting’ ‘nervous’ versus ‘enthusiastic.’ The logic of these derived variables will be presented below in the discussion of what the different variables are.

  1. Rating = Average rating of the labelled 5-point scale. The scale comprises two different underlying scale (feeling, action): 1= Not at all; 2=Nervous/Not Do; 3=Interested/Not Do; 4=Nervous/Do; 5=Interested/Do
  2. RTseconds – Response time in seconds, or in other words, how quickly the respondent makes his or her decision.
  3. R1NotAtAll, R2NervousNotDo, R3InterestedNotDo, R4 NervousDo, R5InterestedDo – the five rating scale points converted to binary.  That is, when the rating is R1, for example, then the newly created variable, R1NotAtAll, is converted to 100, and the remaining four binary variables (e.g., R2NervousNotDo) are all converted to 0.  In effect, only one of the five binary variables created from the one five-point scale can ever have the value 100. The remaining four binary variables created from that one five-point scale must have the value 0, at least for that vignette.
  4. Net Nervous = sum of both the two binary variables, R2NervousNotDo and R4NervousDo. This is a ‘netted’ variable. We look at the two responses which incorporated ‘nervous’ when either one is selected, we say that the respondent feels nervous We are not interested in whether the respondent will color hair, but only whether the respondent feels nervous.
  5. Net Do = the sum of two binary variables, R4NervousDo and R5NotNervousDo. The same logic applies. This time the newly created Net Do picks up the response of ‘Do’, whether the respondent feels nervous or not nervous.

Surface Analysis (Average Ratings) Comparing Groups

Table 2 presents the averages of these variables, by Total Panel, Gender, Age Group, Self-defined stage of hair coloring (from the third classification question), and finally the averages when the set of 24 vignettes was divided into four mutually exclusive, complementary groups of six vignettes each.

Table 2. Average ratings by groups of respondents, for the vignettes that they evaluated. The 5-point rating scale was divided into five distinct scale values (R1-R5). Four new variables were also created beyond those five, variables combining scale values of Nervous, of Interested, of No Do, and of Do, respectively. All averages of 40 or more are shown in shaded cells.

 Averages

5-Point RATING

RT SECONDS

R1 NOT AT ALL

R2 NERVOUS NOT DO

R3 INTERES NOT DO

R4 NERVOUS DO

R5 INTERESTED DO

NERVOUS (NET)

INTERESTED (NET)

NOT DO (NET)

DO (NET)

Total

3.3

3.8

16

11

22

28

23

39

45

33

51

Female

3.6

4.0

6

12

21

32

29

44

50

33

61

Male

3.0

3.6

26

9

24

24

16

33

40

33

41

A16–24

3.1

3.3

19

15

21

30

15

44

37

36

45

A25–44

3.6

3.5

6

10

26

32

25

43

51

37

57

A45–60

3.5

3.8

10

11

22

29

28

41

50

33

57

A61+

2.4

4.7

45

9

17

18

12

27

29

26

30

Coloring Now

3.9

4.1

3

9

19

34

36

43

54

28

69

Thinking of it

3.7

3.7

3

10

28

35

24

45

52

38

59

Not Interested

2.3

3.7

44

13

20

15

8

28

28

33

24

Vignettes 01–06

3.3

5.8

19

9

20

29

23

38

43

29

52

Vignettes 07–12

3.3

3.6

16

12

23

28

22

40

45

35

50

Vignettes 13–18

3.3

3.1

16

11

23

30

20

41

43

34

50

Vignettes 19–24

3.4

2.8

15

11

24

26

25

36

49

34

51

Arrays of data such as those in Table 2 five a sense of the overall feelings of the respondent groups, as well as uncovering any specific issues or patterns with repeating the study, such as the faster response times for vignettes beyond the first six, or increased level of interest (e.g., the net variable “INTERESTED” is low among the younger respondents (age 16–24), but also low, and surprisingly so, among the older respondents (age 61+.)

We see general patterns from the averages in Table 2, such as the surprisingly resilience of the average rating across the four sets of six vignettes. We also see averages which make sense, such as the lower value for the rating for those respondents not thinking of coloring their hair (average rating = 2.3) versus those respondents already coloring their hair (average rating = 3.9.)

Within Table 2 lie a great deal of so-called ‘insights,’ data organized in such a way as to provide an idea of how people respond to the idea of hair coloring. These data reflect the ‘bread and butter’ information provided by conventional market research. There is a sense of knowing something about people, the notion of ‘insight.’ The reality, however, remains that we know far less than we could know about the respondents than we could know. We know their average responses but cannot yet ‘get into their mind.’  It is that ‘getting into the mind’ to which we now turn in the next sections.

Recoding: Structuring the Mind Genomics Data for Subsequent Analyses

The essence of Mind Genomics is the relation between the response and the specific messages or ‘answers’ to the questions. Mind Genomics system forces decision, but at the same time mirrors reality, by embedding the necessary information in vignettes, wherein the features or answers ‘fight’ with each other. The second aspects of Mind Genomics is the recognition that, for the most part, people are often unaware of ‘why’ they do certain things of an everyday nature. That is, people react quickly, and do not think about what they are doing for much of their behavior. This ‘System 1’ according to Nobel Laureate Daniel Kahneman, is intuitive, ‘at the gut level.’ The research must mirror this quickness [24]. When asked ‘WHY,’ most people can give a reason, but in everyday life the judgments are so rapid that the person is operating on ‘automatic.’

The vignettes were constructed according to an underlying experimental design, complete for each person, but different from person to person in the specific combinations. Mind Genomics then works at the level of the individual respondent, who evaluates the precise but unique set of combinations need to build a model or equation for that person. The metaphor is the MRI, magnetic resonance image, used in medicine to take various snapshots of the individual’s tissue, such as brain, combine these by computer, and create the full 3-dimensional picture of the brain, from which one can detect abnormalities, and so forth.

Each respondent evaluated 24 unique vignettes, created by the design.  The result is a database comprising 24 vignette structures x 100 people (our respondents) or a rectangular matrix of 2400 rows, one row per respondent per vignette. In turn, the data begins with 18 columns, the first 16 columns corresponding to one column for each of the ‘elements’ or ‘answers’, our test stimuli, the 17th column for the rating and the 18th column for response time, RT.  An additional set of nine columns was then created, five columns for the five responses, RT1 to RT6, and four columns for the newly created “NET” variables (Net Nervous, Net Interested, Net Not Do, Net Do), respectively

The matrix is designed for regression analysis. The independent variables, A1 to D4, are coded to tell the regression program about the status of the elements. When the variable has the value ‘1’ the value denotes the fact that the vignette contained that element or answer. The remaining four independent variables cells in that row will have the value 0 to denote the fact that the vignette did not feature answer or element.

Moving over to the 17th column we see the actual assigned rating which is 1, 2, 3, 4 or 5, depending upon the value chosen. The 18th column shows the response time to one decimal point.

Moving beyond the 18th column we see nine newly created variables. The first five correspond to R1-R5, respectively. When a variable is selected by the respondent, e.g., R2, that newly created variable is assigned the value 100, and the remaining newly created variables (R1, R3, R4, and R5) are assigned the value 0. Finally, the four ‘NET” variables are created by the appropriate addition.

As a matter of course, we add a very small random number to each cell, so that the cell is not 0 or 100, but sum small number a bit larger than 0 or a bit large than 100, respectively. The rationale for adding the small random number is that it prevents the underlying regression program from crashing, were the respondent to never have used 5 or always to have used 5. In the latter situations, there would be no variation in the dependent variable, and in turn the regression analysis could not work. Adding the very small random number barely affects the parameters emerging from OLS (ordinary least-squares) regression model, but avoids the possible crash were the ratings to be all 0 or 100 at the start of the regression.

The data matrix has now been put into a format that the statistical analysis program can ‘process.’ It is an inconvenient but exceptionally widespread, virtually universal reality that much of the effort in the analysis of data to discover patterns is not so much the actual statistical processing, but rather the thinking about how to represent the data in a way that make the data amenable. The restructuring of the data for the regression analysis is as much part of the analysis as are the computations. Indeed, we may say that the up-front thinking IS the analysis, the rest, the computations, simply being the drone work, the busy work. By the time we conceptualize the system as a set of 1’s and 0’s we can be said to have analyzed the data, although not yet to have computed the parameters.

Relating the Key Evaluative Criterion (R5 Interested/Do) To the 16 Answers

We apply OLS (ordinary least-squares) regression to our data. There are research purists who will aver that OLS Regression is not the best approach with data which is ‘binary’ both in the independent variables (the 0/1 representation of the 16 answers as predictors), and dependent variable (0 if the rating is not 5, and 100 if the rating is 5.)  Author HRM has consistently use the OLS regression to make the results easy to understand as we see below.

For each dependent variable, and each group of respondents, the OLS regression makes one ‘pass’ through the data. Table 3 shows the results. The table begins with the title of the dependent variable, and the binary expansion.  The dependent variable is 5. The data come from the 2400 vignettes evaluated by the total panel. As noted above, the rating of 5 was converted to 100. The complementary ratings of 1–4 were converted to 0.

Table 3. Results from modeling the contribution of the 16 answers to the binary transformed rating of ‘Rating 5’ (Interested and will do.)

Dependent variable = binary expansion focusing on R5; INTERESTED and WILL DO

Total


Additive constant

25

A2

Coloring hair gives a person a chance to ‘change’ the look – for fun, temporarily

6

A1

Coloring hair hides the gray

5

D1

Treatment on hair should be done regularly

5

B4

Coloring makes hair beautiful

4

D3

It’s important to get hair cut properly

4

B2

It takes a little time to get accustomed to a new hair color

3

D4

Hair should be natural… cut when needed, nothing else

2

D2

Coloring hair should only be done every other haircut

1

A3

Coloring hair is trendy today

0

A4

Coloring hair lets the person ‘show off’

-1

B1

Coloring hair instills confidence

-1

B3

To prevent a feeling of insecurity, the coloring has to be ‘just right’

-2

C4

Hair dye damages nothing

-2

C2

Hair dye can damage hair

-11

C1

Hair dye can affect health

-12

C3

Hair dye can damage scalp

-13

The regression was done on the entire set of 2400 observations, the so-called ‘Total Panel.’ We proceed to the Additive Constant, which is the estimated percent of responses of exactly ‘5’ in the absence of any elements.  The additive constant is a purely estimated parameter, since all vignettes by design comprised 2–4 answers or elements.  Nonetheless, we compute the regression with the additive constant.

We treat the additive constant as a baseline, the measure of tendency to be interested in hair coloring and ready to color one’s hair without any additional information. In other words, we assume an underlying tendency to respond ‘Interested and Will Do’ for a given topic, just based upon the name of the topic, but without any other specifics. The OLS regression takes this tendency into account, showing it as the ‘additive constant.’  The additive constant for our study of 100 respondents and hair coloring achieves a value of  25 when the dependent variable is ‘R5,’ after R5 is converted into a binary value which takes on the value 0 (R5<>5) or takes on the value 100 (R5=5).

The low additive constant of 25 means in ‘technical talk’ that in only 25% of the time may we expect to see a rating of 5 in a vignette without elements. Respondents are simply not interested in the notion of hair coloring as a topic. They do color their hair, but they would not say ‘interested and will do’ as a basic matter of course. It is the elements, the answers, which must drive the response.

Table 3 also shows us that for the most part the coefficients are low, the highest coefficients achieved by A2 and A2 (changing the look; hiding the gray.)  These low coefficients should alert us to the possibility that either people are not particularly interested in the notion of hair coloring, even at the level of specifics, or more likely, there are different mind-sets which cancel each other.

The negatives push people away from the positive of interested/will do. We don’t know whether these are truly negative. They are simply non-positive. We simply know from our recoding that they are not positive, not 5. The negatives are the answers which talk about the issues and problems. We should not be surprised; the problems are the issues of dye, injuring hair, health, scalp, respectively.  Even saying that there is no damage is a negative, perhaps because no damage, no untoward accident, is not a positive.

Respondent Data Are Reliable – Evidence From Looking At The Starting Versus The Ending Test Vignettes

The criticism is often raised that respondents cannot actually do the task. Despite the emergence of clear patterns, there are purists who believe that the five-minute experiment with 24 vignettes is simply too fatiguing, and that what one sees is the analysis of rather meaningless data, assigned by respondents who are tired, bored, and angry.

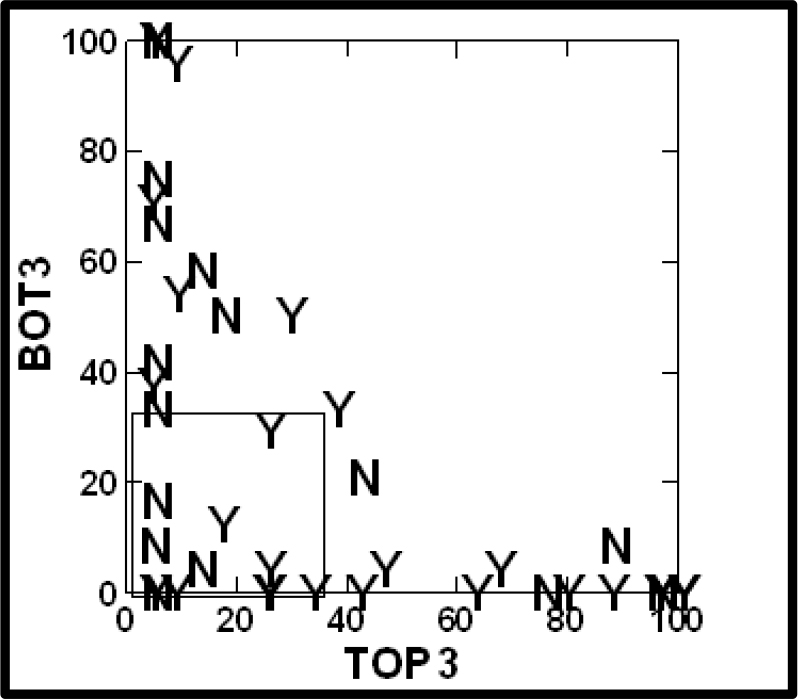
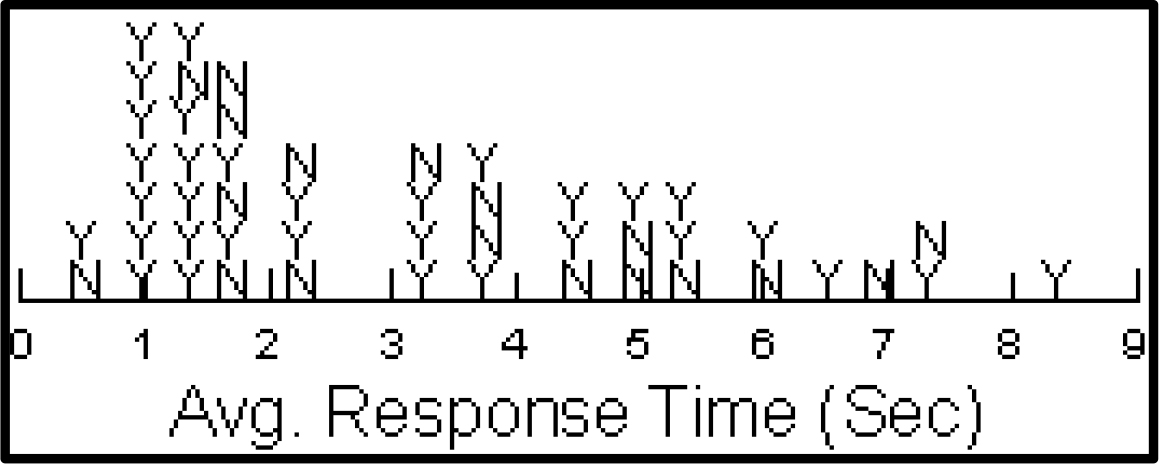
To assess reliability, we divide the vignettes into those appearing in positions 1–6, 7–12, 13–18 and 19–24. We do not look at the respondents, but simply create four databases, and do the regression modeling for each of the four sets of position. We do so by OLS, ordinary least-squares regression, and force the equation through the origin by not having an additive constant, a slight departure from the OLS regression for the ratings, but one which allows us the ability to compare coefficients without the interference of the additive constant. OLS returns with estimates of the 16 coefficients. Figure 3 shows the scatterplot, the ordinate showing the coefficients emerging when we look only at the set of ratings obtained from responses to vignettes 19–24, the last six vignettes tested. The abscissa shows the coefficients emerging when we look only at the set of ratings obtained from responses to vignettes 01–06, the first six vignettes tested. They are quite similar, overall, albeit with some natural noise to destroy the otherwise very high correlation.

Mind Genomics-023 - AWHC Journal_F3

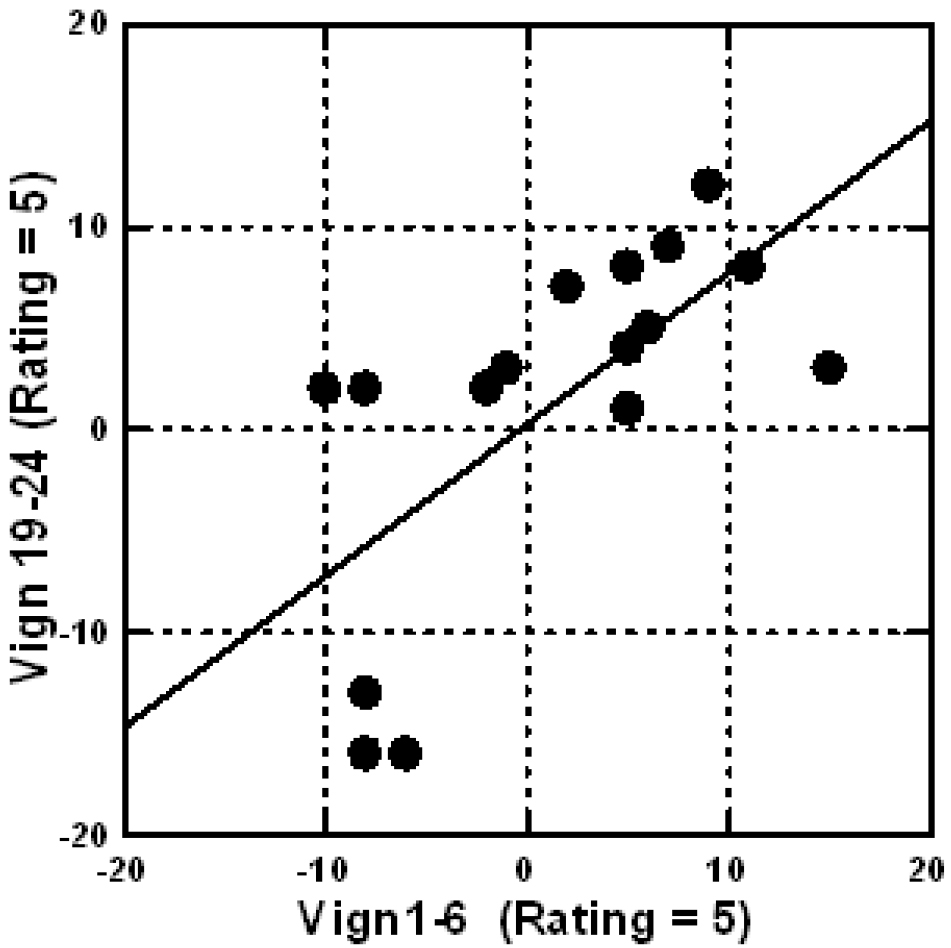
Figure 3. Scatterplot showing the 16 coefficients estimated from vignettes at the first part of the experiment (vignettes 01–06) versus the vignettes from the last part of the experiments (vignettes 19–24),  The 16 coefficients were estimated after the binary transformation of Rating 5 (interested/will do).

A parenthetical note is appropriate here: The negative reactions to the Mind Genomics effort is most often heard from professionals who participate in a study, only to return with a host of negatives ranging from ‘I didn’t know what I was doing, I just guessed’ to ‘The graphics are so 20th century, and fail to make the experience engaging, in turn failing to make the experience even valid.  The pattern of coefficients presented here refutes the accusations, almost always from professionals, almost never from ‘real people.’

Differences in the Performance of Elements among Complementary Subgroups

The poor showing of most elements or answers in Table 3, presenting the Total Panel’ may surprise the reader, since hair coloring is a very popular topic. The surprise only comes when we realize that for virtually everything, there are at least two or more points of view, stances when ‘human judge.’ Our quotidian existence is replete with aphorism driving home the individuality of judgment, the tacit recognition that people differ.  It’s not only the recognition that they exist but accepting and enshrining those differences as a mainstay of an enlightened point of view.

The dramatic nature of the group difference can be seen in Table 4. The table shows many more elements performing better, at least at the level of statistical significance. The elements show those elements which perform well in at least one group. The operational definition of ‘perform well’ is a coefficient greater than 7.51, which is both statistically significant and corresponds to elements which have been observed to represent ‘effective’ in the outside world of daily experience.  Table 4 suggests that looking at key subgroups increases the likelihood of at least one element performing strongly.

Table 4. Coefficients from the model for complementary subgroups. The dependent variable is the binary transformation of Rating5 (Interested / Will Do).

Gender

Age

Current status re hair coloring

Dependent variable = binary transformation of Rating R5
 (Interested, Will Do).

Male

Female

A16–24x

A25–44x

A45–60x

A61Plus

Coloring   Now

Thinking about it

Not Interested


CONSTANT

22

28

12

31

28

13

38

24

15

A1

Coloring hair hides the gray

3

8

4

3

7

7

7

8

1

A2

Coloring hair gives a person a chance to ‘change’ the look – for fun, temporarily

7

6

16

8

3

3

3

12

4

A3

Coloring hair is trendy today

0

1

10

3

-1

-5

-1

1

0

B2

It takes a little time to get accustomed to a new hair color

-1

7

-12

8

3

-2

3

5

1

C4

Hair dye damages nothing

-2

-3

8

-7

-2

1

-3

4

-8

D1

Treatment on hair should be done regularly

4

6

4

1

9

6

9

5

1

D2

Coloring hair should only be done every other haircut

1

2

9

1

1

0

3

-1

1

D3

It’s important to get hair cut properly

5

4

0

5

4

8

5

3

3

D4

Hair should be natural… cut when needed, nothing else

3

1

2

0

0

9

1

2

2

The data in Table 4 suggest that many of the elements simply ‘do not work.’ They only show a slight- increase in the coefficients. Two elements, however, performed well, with coefficients about 10 in at least one subgroup.

Coloring hair gives a person a chance to ‘change’ the look – for fun, temporarily

Coloring hair is trendy today

Creating Mind-Sets as a Way to Dive Deeply Into the Cosmetic Mind

Mind Genomics provides a tool by which one can create divisions, groups, among respondents based on how the people think, not who they are, not what they believe.  Traditional research with customers often labels this approach psychographic segmentation, in which one divides people by what they think (general attitudes; Wells, 2011 [25]) versus dividing people by WHO THEY ARE OR WHAT THEY DO.  The technique used is clustering, a well-established approach in statistics to explore data with the hope of finding groups of similar ‘objects’, similarity based upon the pattern of properties of those objects [26].

Mind Genomics carries psychographic segmentation one step further, beyond attitudes and beliefs, and into the response pattern to messages crafted to be specific for a topic, and thus precisely appropriate for that topic. A typical psychographic segmentation involving hair coloring would incorporate the entire gamut of cosmetics, and beauty-seeking behavior. The goal in Mind Genomics is to work at the very ‘micro-level,’ with language most closely associated with the topic. Thus, the data emerging from the clustering or segmentation may be said to be laser-focused on the topic of hair coloring, and perhaps even more focused on the reasons for coloring hair versus not coloring hair.  Discoveries from the clustering and segmentation are thus both limited but often extremely novel, often ready to turn into both scientific insights and business actions.

The clustering performed on the data for this study looked at the respondents based upon the coefficients emerging from the regression analysis, wherein the dependent variable is R5 (Interested / Will Do). Each respondent generated an individual model. The 16 coefficients were used as the basis for clustering the respondents twice, first into two mind-sets or clusters, second into three mind-sets or clusters.  The two-segment solution could not be interpreted. A cluster or mind-set comprised different elements which could not be the basis of a simple ‘description.’  In contrast, dividing the respondents into three clusters or segments made it simple to assign names. We simply looked at the elements which scored the highest in each cluster. Table 5 presents the three mind-sets.

Table 5. Three segments for hair coloring emerging from segmenting the respondents by the pattern of coefficients for R5, Interested/Do.

MS1

MS2

MS3

Dependent variable = binary transformation of Rating R5 (Interested, Will Do).

Follow prescription

Coloring is a  personal expression

Focus on self-care


Additive constant

27

21

25

Mind-Set 1 – Follow the prescriptions of others

D1

Treatment on hair should be done regularly

8

4

4

D4

Hair should be natural… cut when needed, nothing else

7

-3

2

Mind-Set 2 – Coloring is self-expression

A2

Coloring hair gives a person a chance to ‘change’ the look – for fun, temporarily

6

13

-1

A1

Coloring hair hides the gray

4

10

2

A3

Coloring hair is trendy today

-1

7

-6

Mind-Set 3 – Self Care

D3

It’s important to get hair cut properly

4

1

8

Does not strongly appeal to any mind-set

B4

Coloring makes hair beautiful

4

3

4

D2

Coloring hair should only be done every other haircut

2

0

3

B2

It takes a little time to get accustomed to a new hair color

6

2

1

A4

Coloring hair lets the person ‘show off’

-4

3

-3

C4

Hair dye damages nothing

-4

2

-3

B1

Coloring hair instills confidence

1

3

-5

B3

To prevent a feeling of insecurity, the coloring has to be ‘just right’

0

0

-6

C2

Hair dye can damage hair

-16

-5

-11

C1

Hair dye can affect health

-17

-5

-12

C3

Hair dye can damage scalp

-16

-4

-18

Finding Respondents in the Population – the PVI (Personal Viewpoint Identifier)

The premise of Mind Genomics is that the mind-sets exist but need not be correlated with WHO the respondents are, or even what, in general, the respondents BELIEVE. (see Table 6). Yet, these mind-sets have a very important role to play, both for knowledge and for application. When one works with these mind-sets, it becomes possible to explore more deeply the roots and foundations, if any, undergirding one’s membership in a mind-set.

Table 6. Cross tabulation of mind-set membership by self-profiled group membership. Numbers in the body of the table represent numbers of respondents out of the total group of 100 respondents.


MS1 – Follow prescription

MS2   – Coloring a personal expression

MS3 – Focus on self-care

Total

Total

37

33

30

100

Mind-Sets by Gender

Male

16

14

20

50

Female

21

19

10

50

Mind-Sets by Age

A16–24

4

2

4

10

A25–39

15

10

8

33

A40–55

9

11

11

31

A56+

9

10

7

26

Mind-Sets by Hair coloring behavior

Coloring Now

10

15

7

32

Thinking About It

14

9

12

35

Not Interested

5

7

11

23

No Answer

8

2

0

10

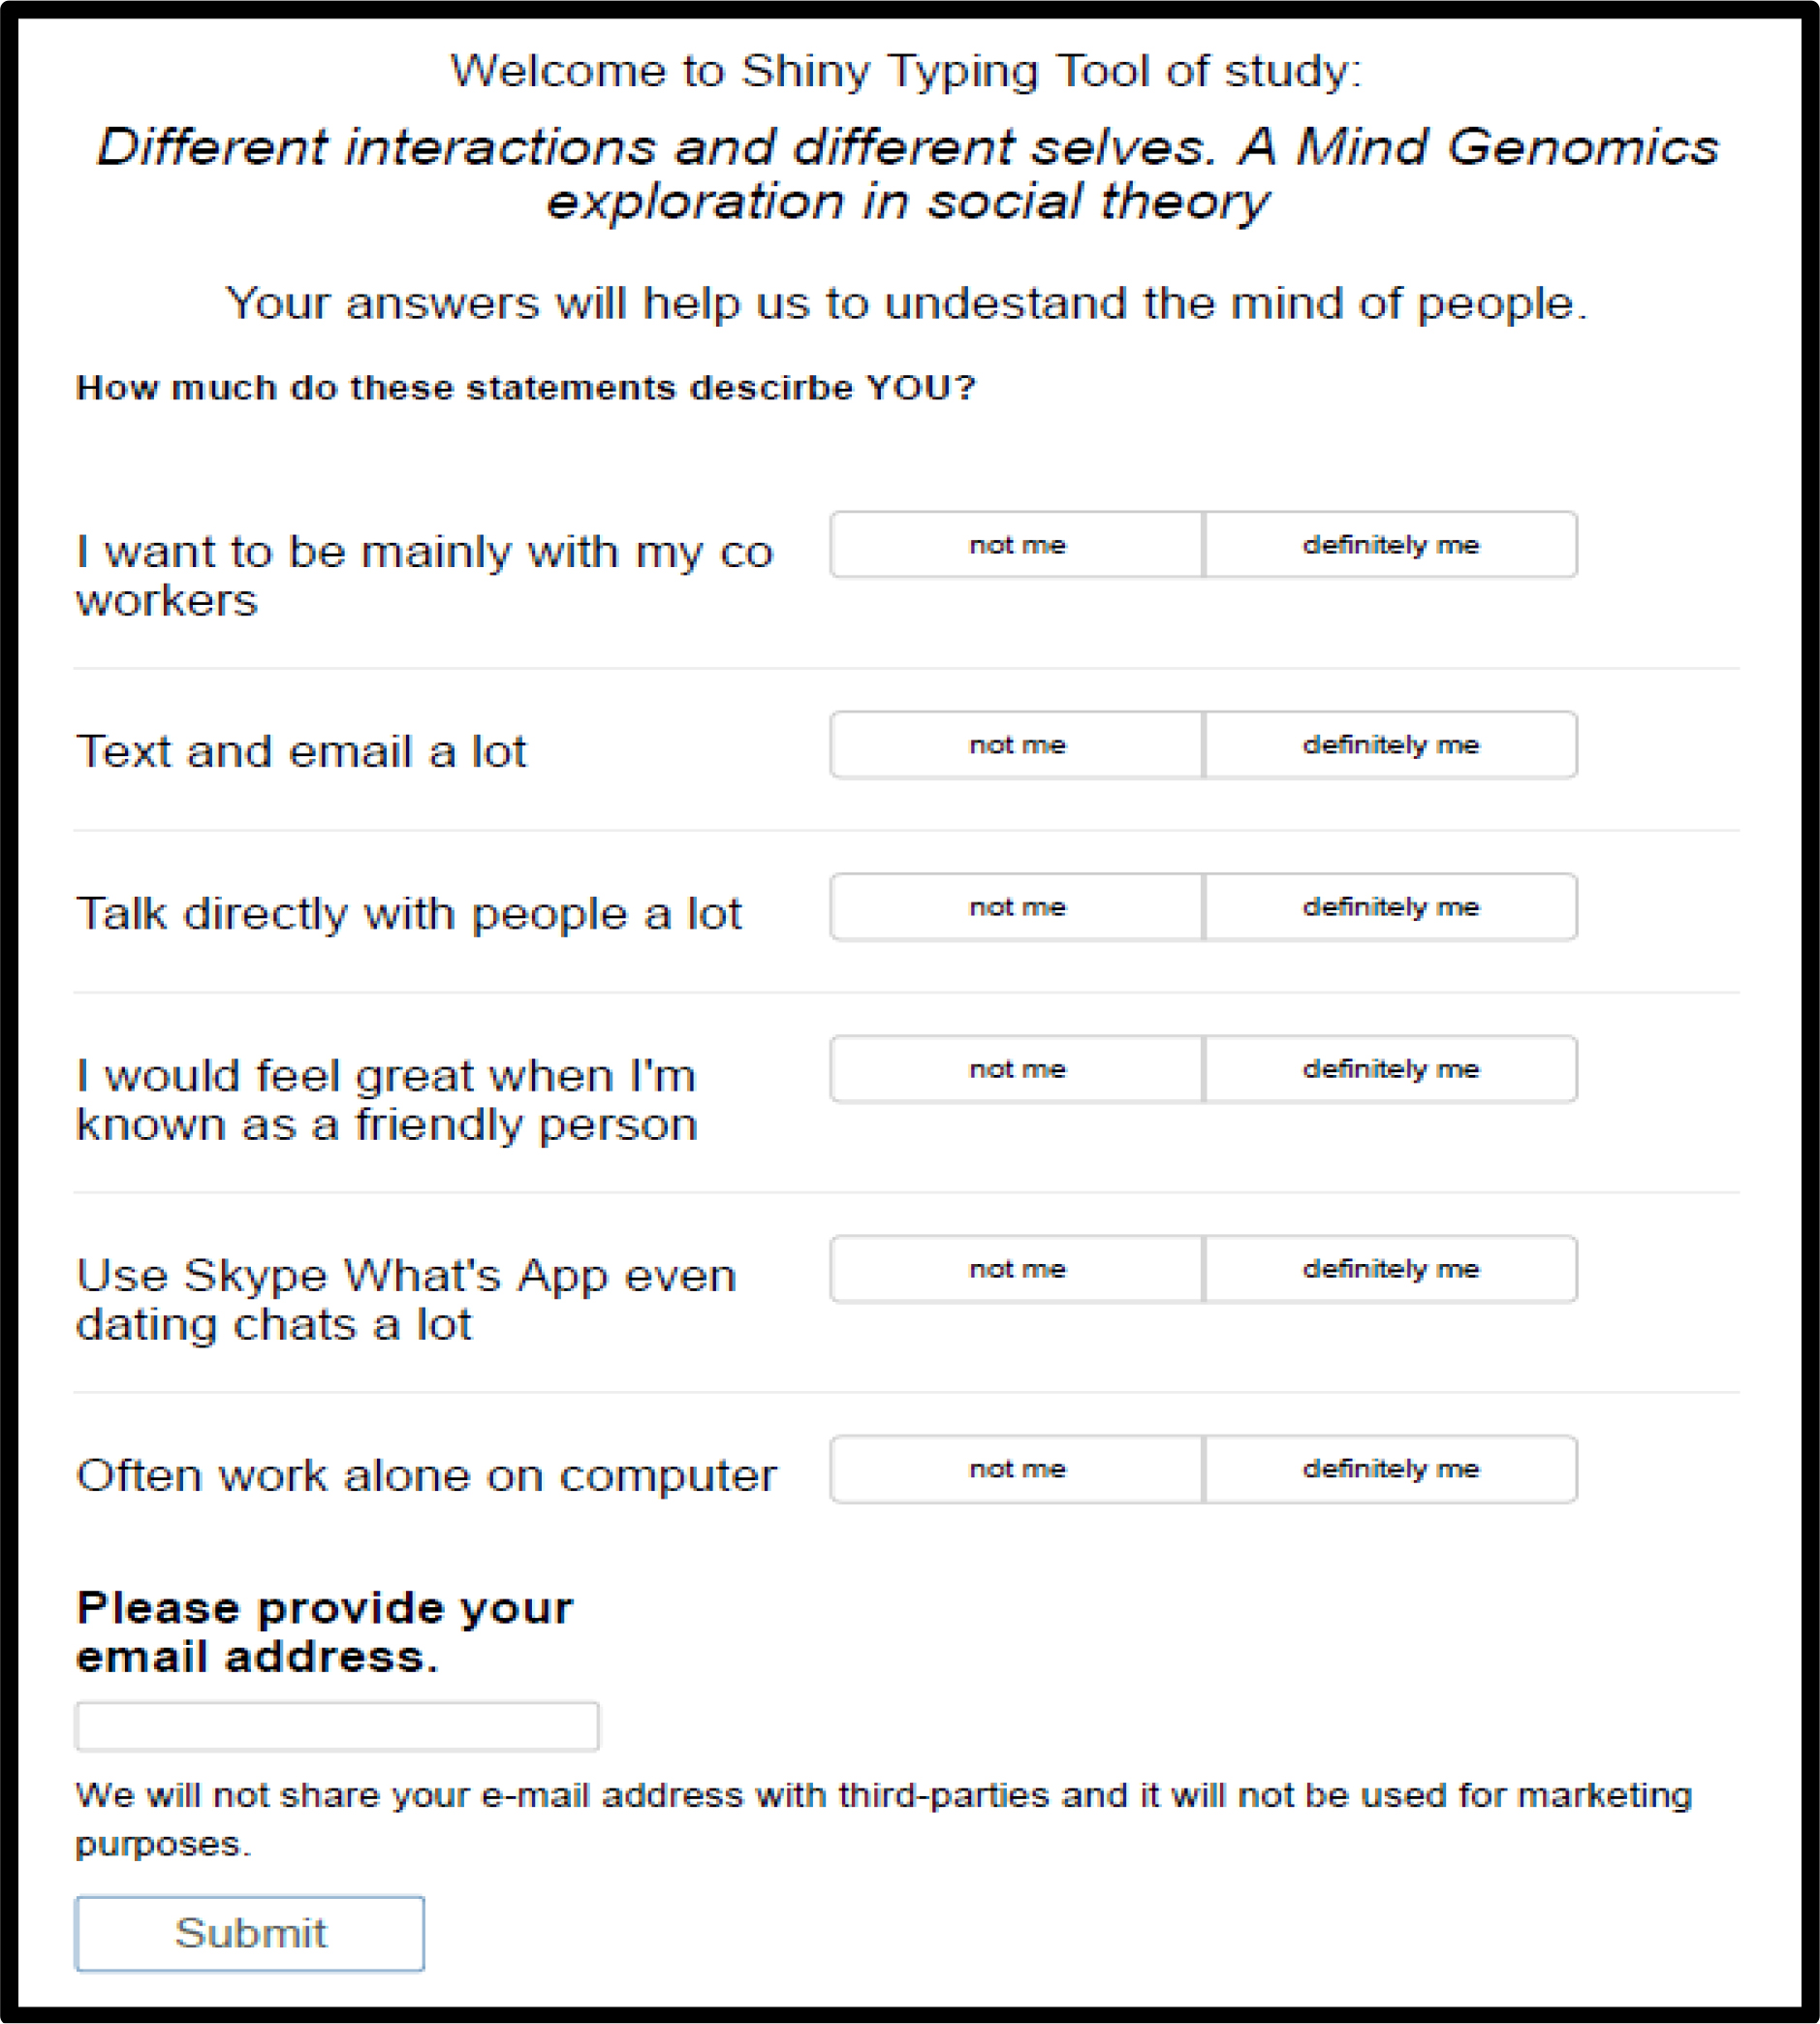
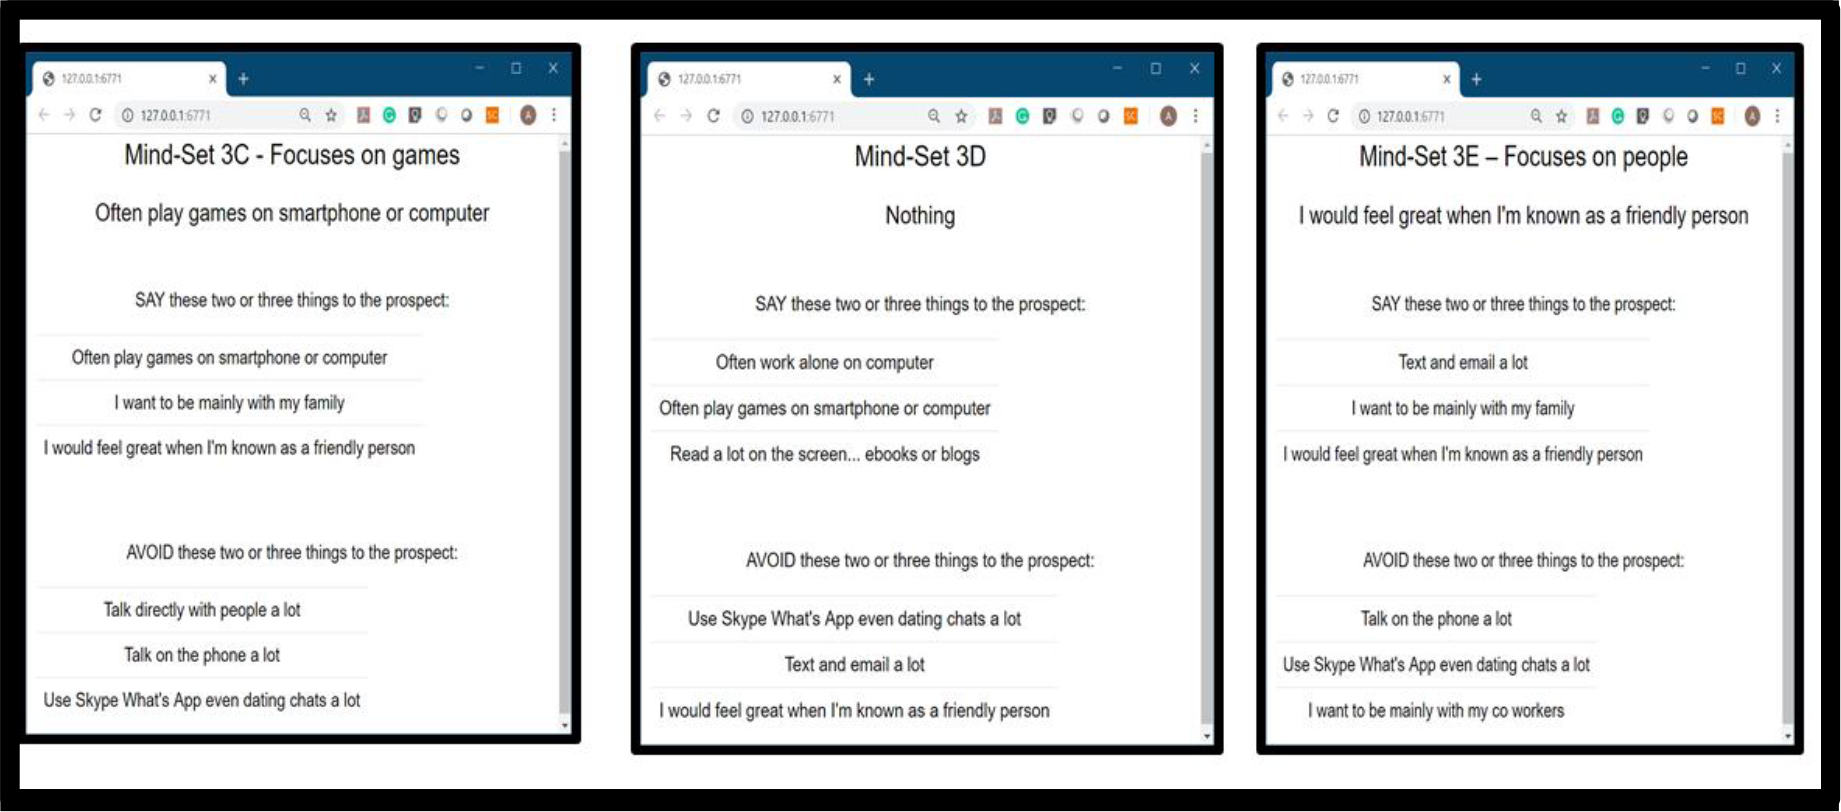
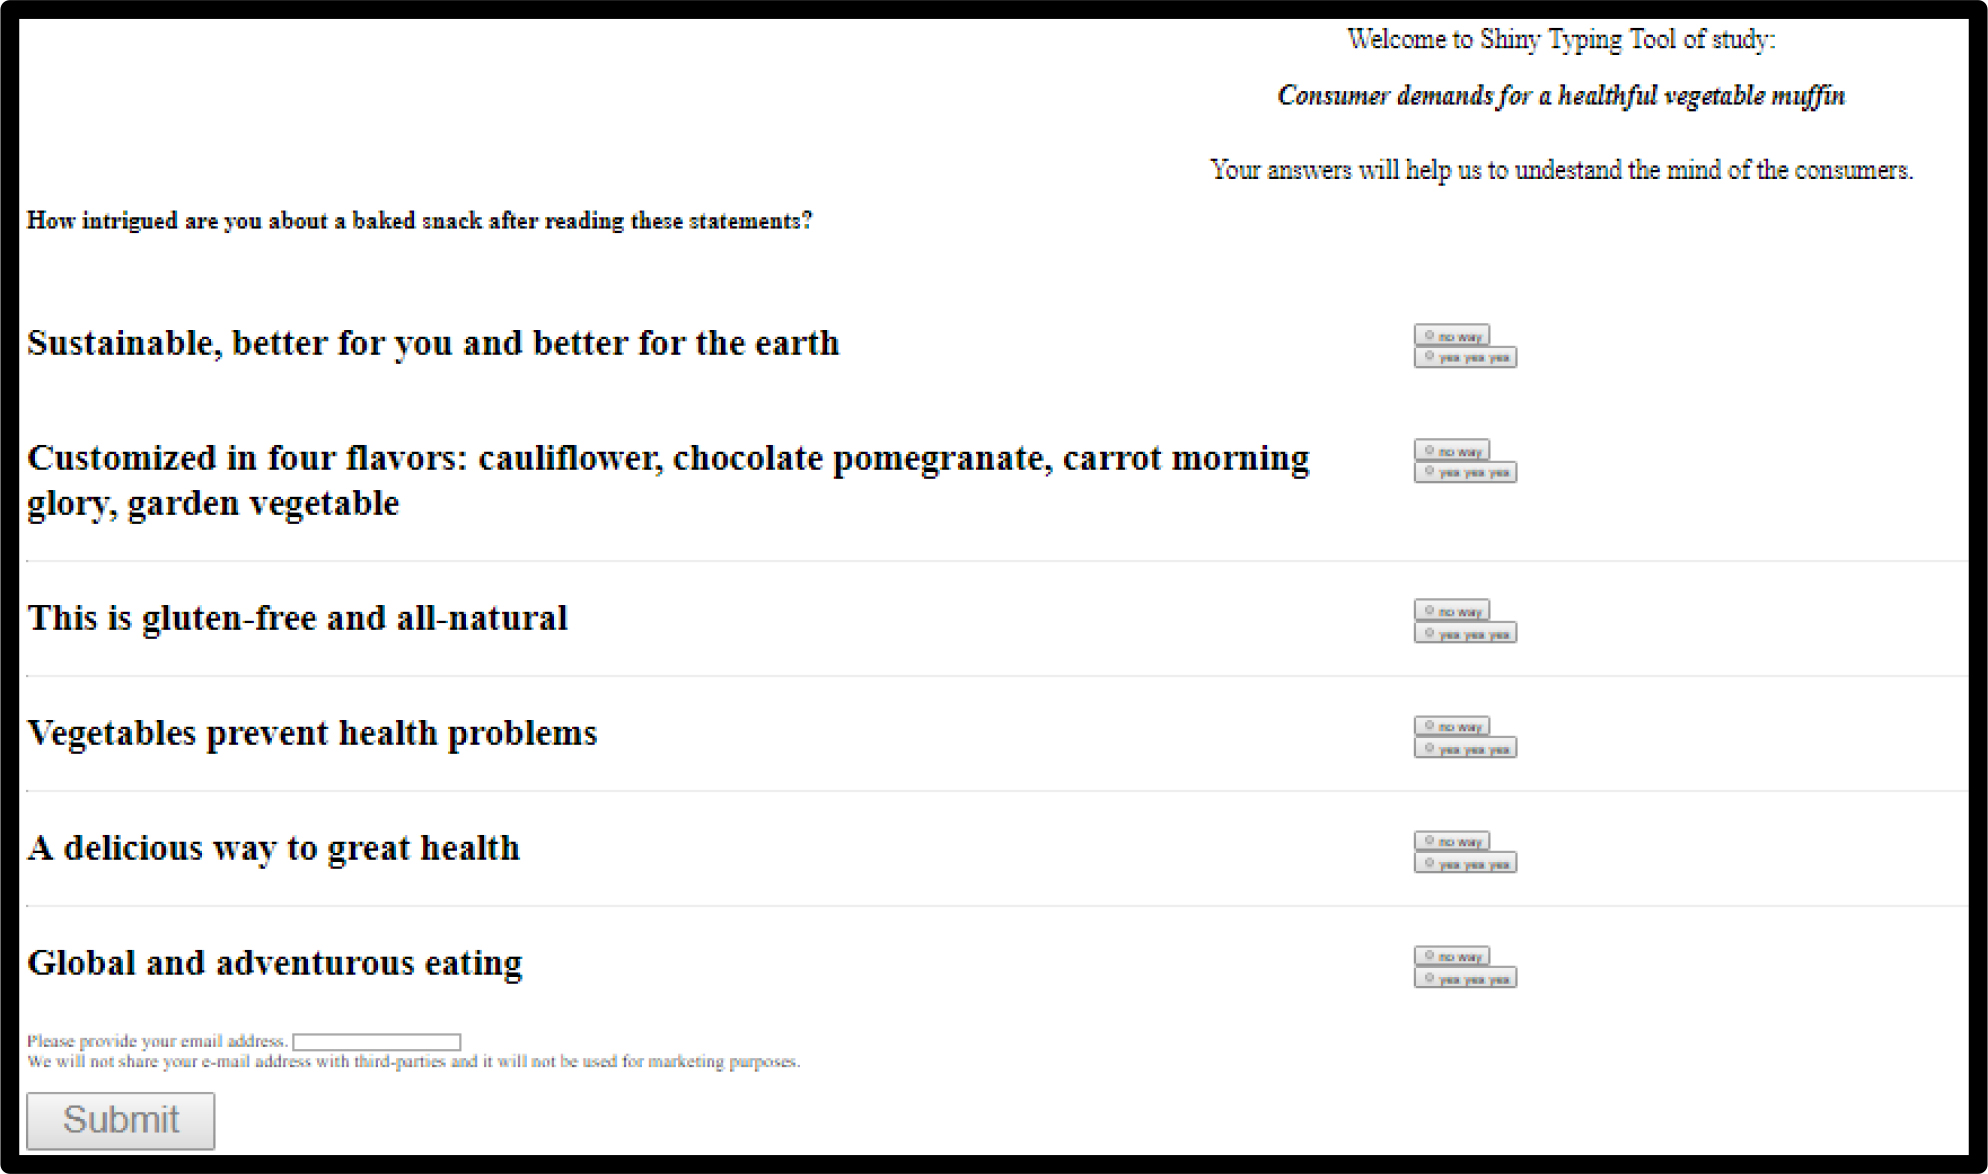
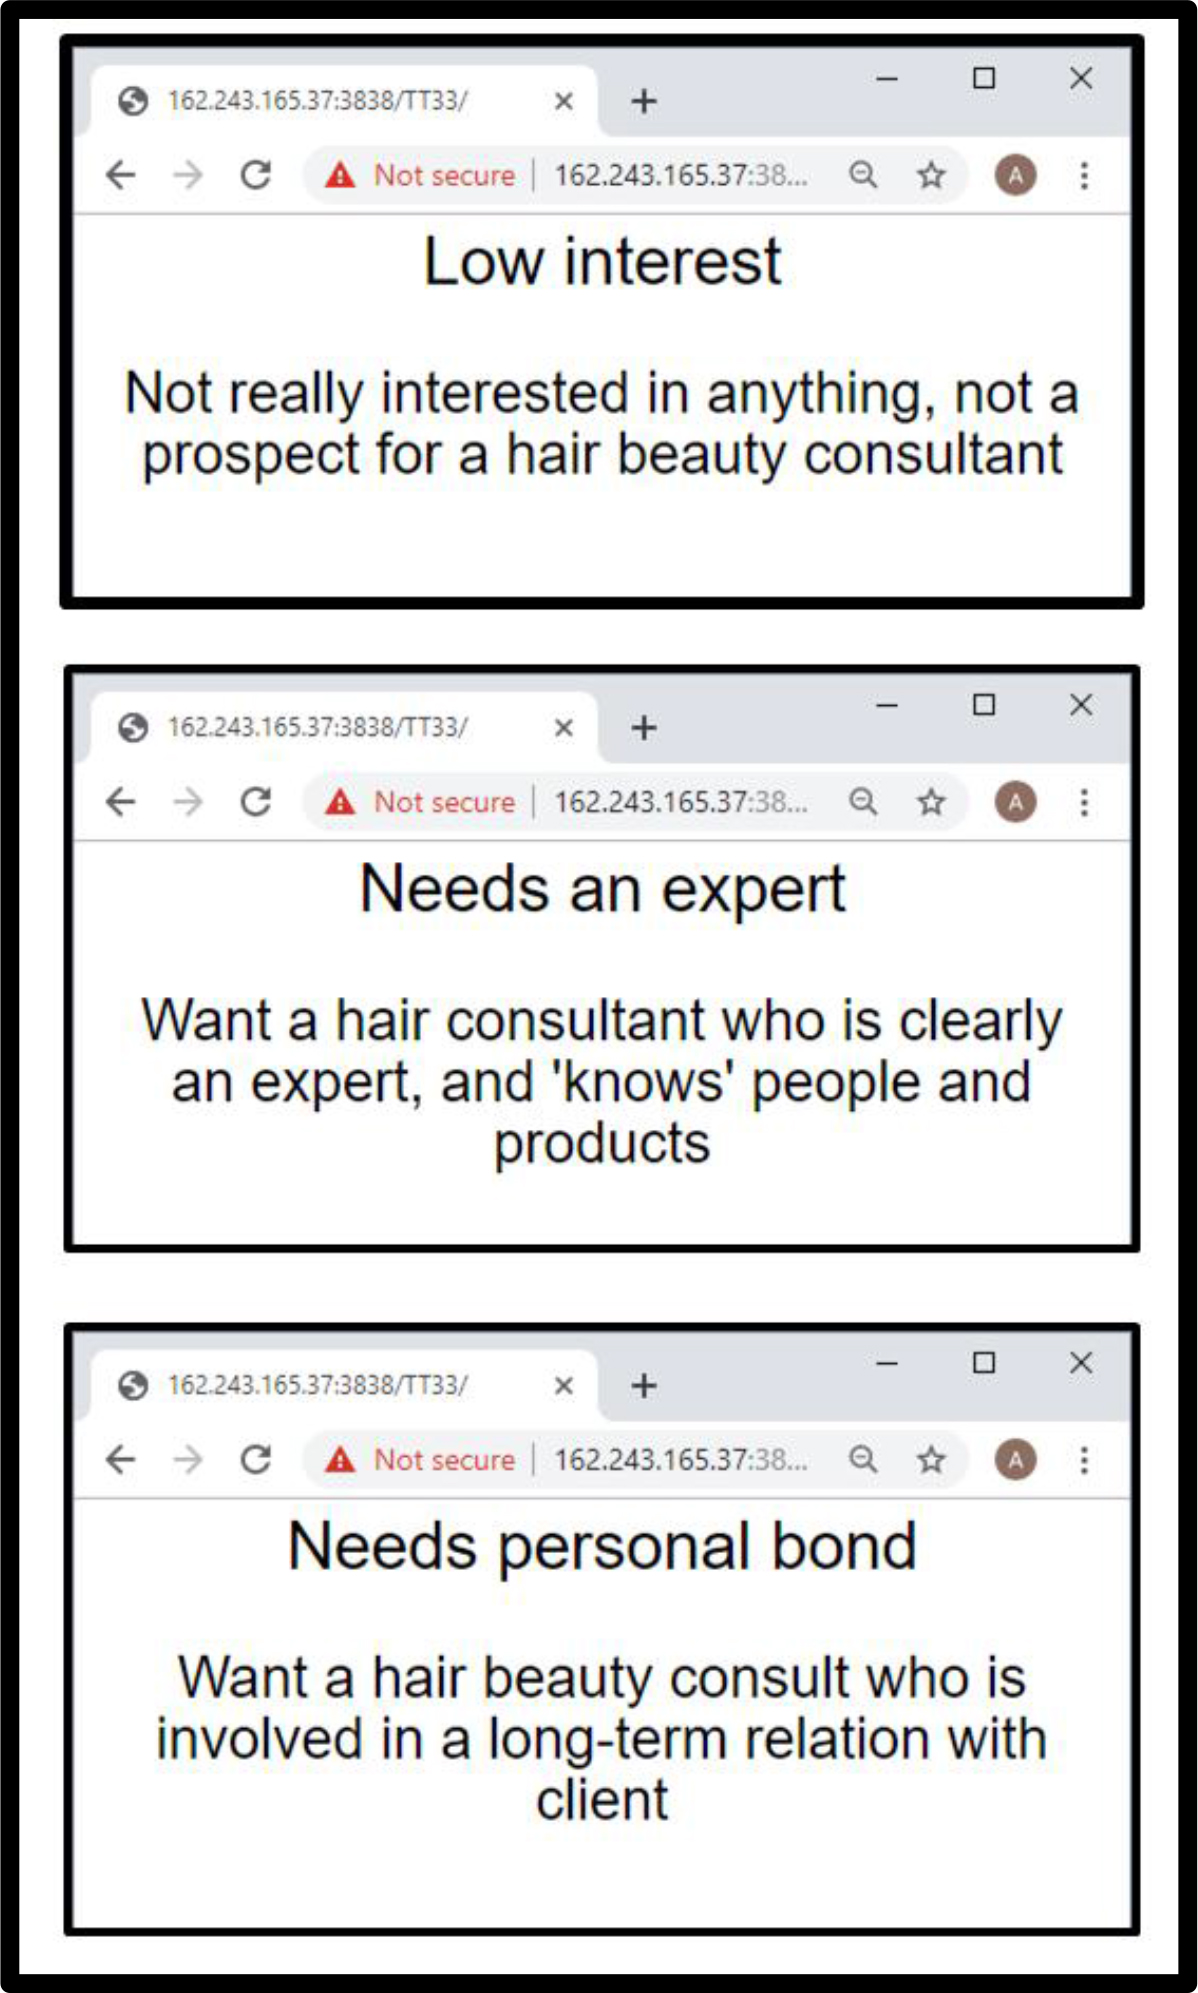
If, as continuing research suggests, there are no general co-variations of membership in a mind-set, especially age and gender, as well perhaps in one’s behavior in the category (question 3), then the next thing is to create a tool by which to assign new people to one of three mind-sets. Author Gere has created the PVI, the personal viewpoint identifier, using as a base the pattern of responses to different and jet differentiating   questions.  Figure 4 shows the six questions constituting the PVI. The pattern of answers to the six questions are used to assign a new person to one of the three mindsets, with the feedback shown in Figure 5.

Mind Genomics-023 - AWHC Journal_F4

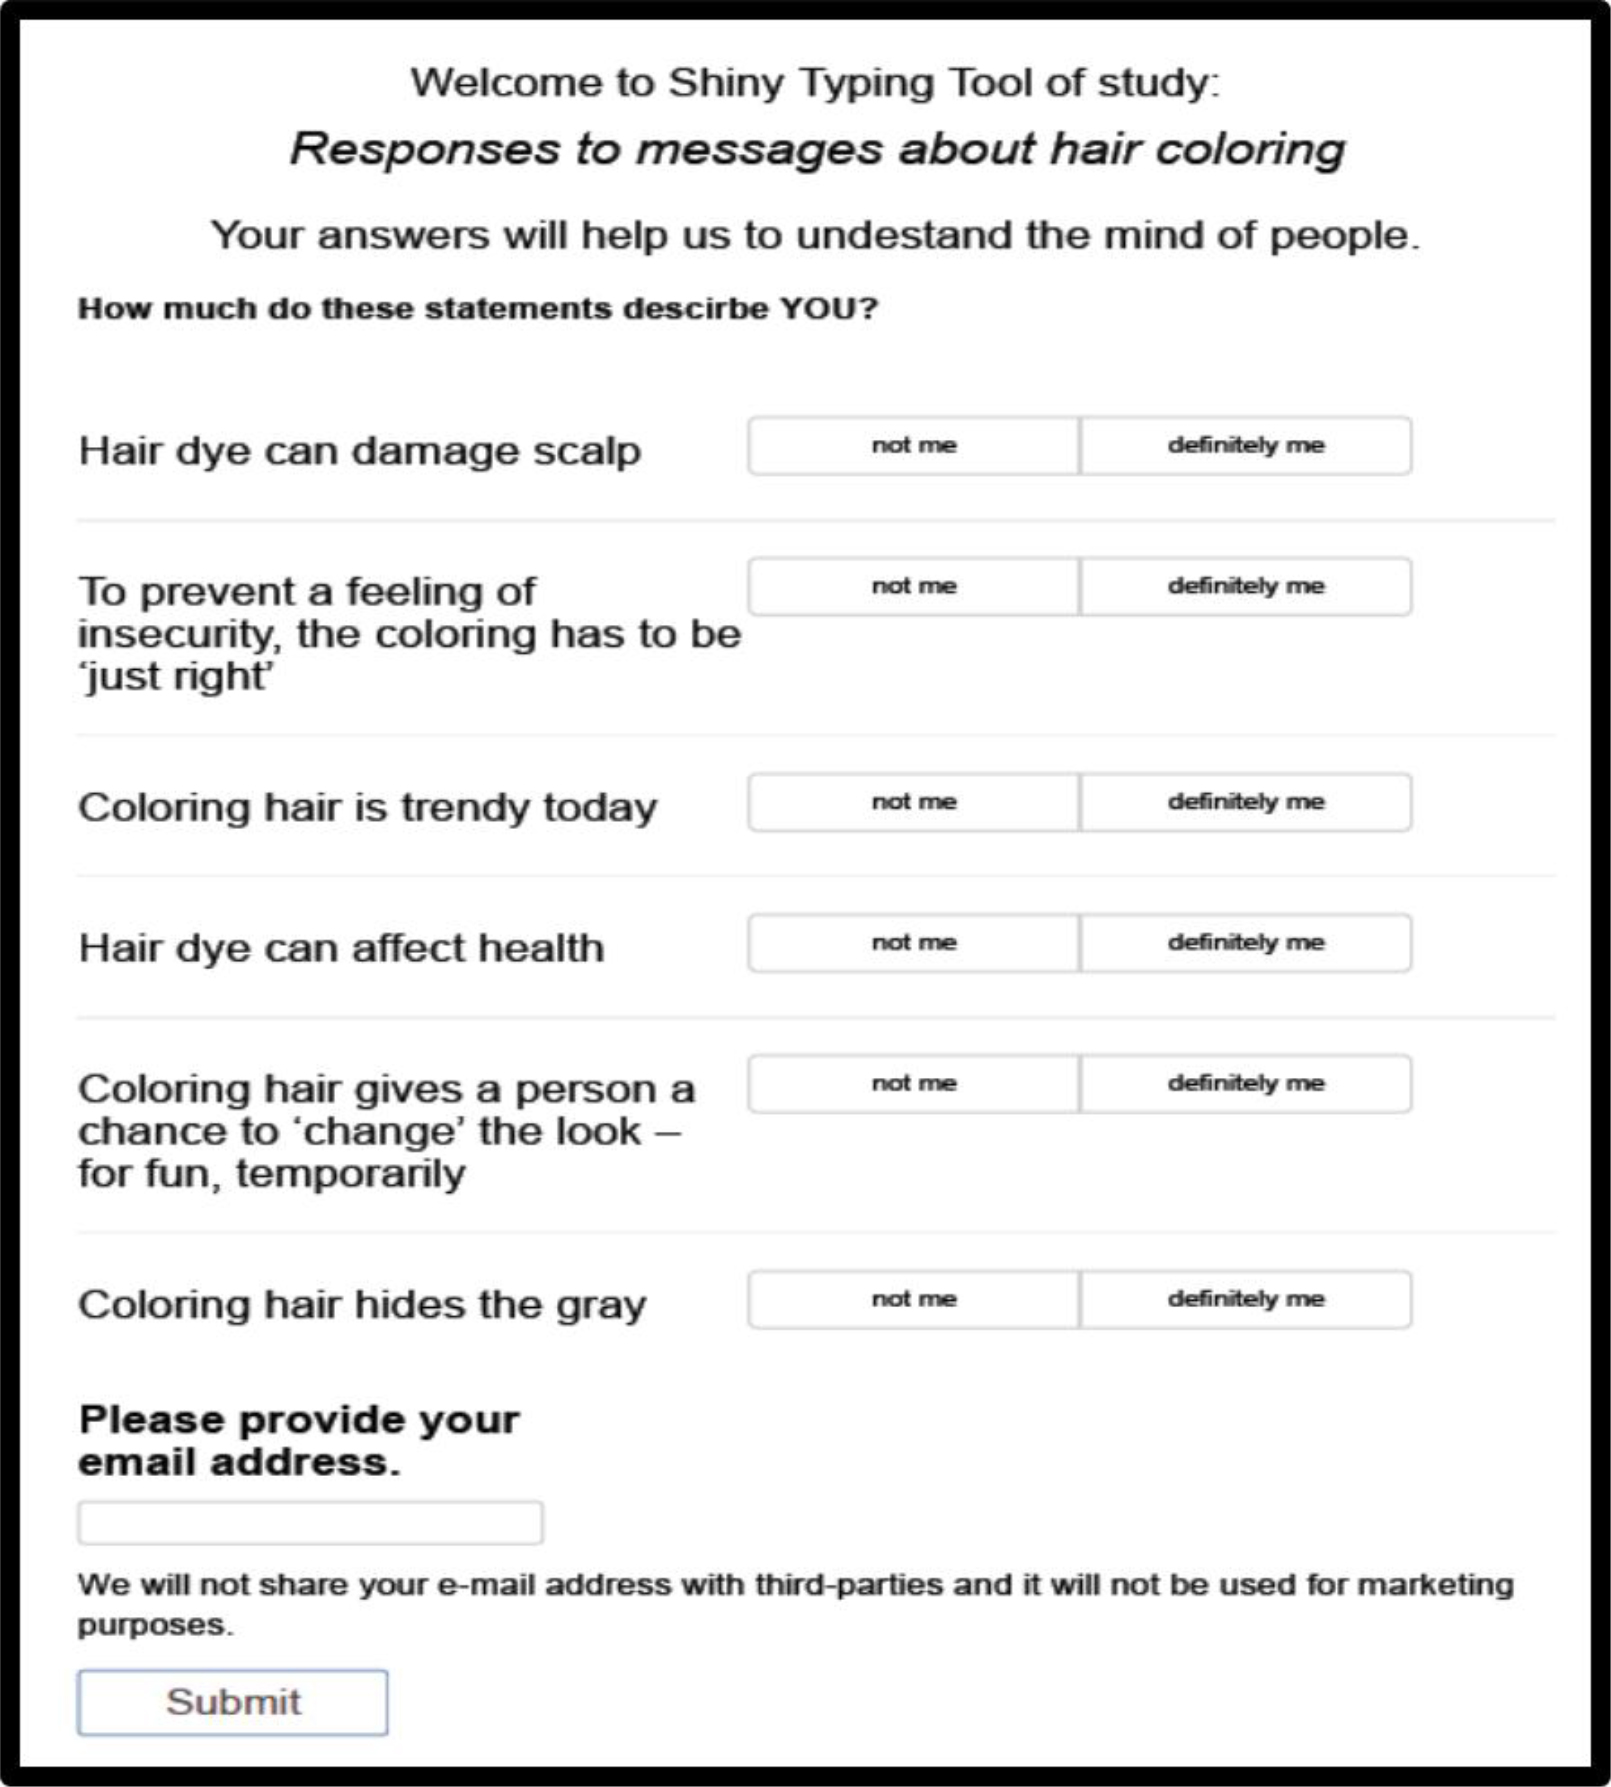
Figure 4. The PVI (personal viewpoint identifier) created from the hair coloring study to assign new people to one of the three mind-sets.

Mind Genomics-023 - AWHC Journal_F5

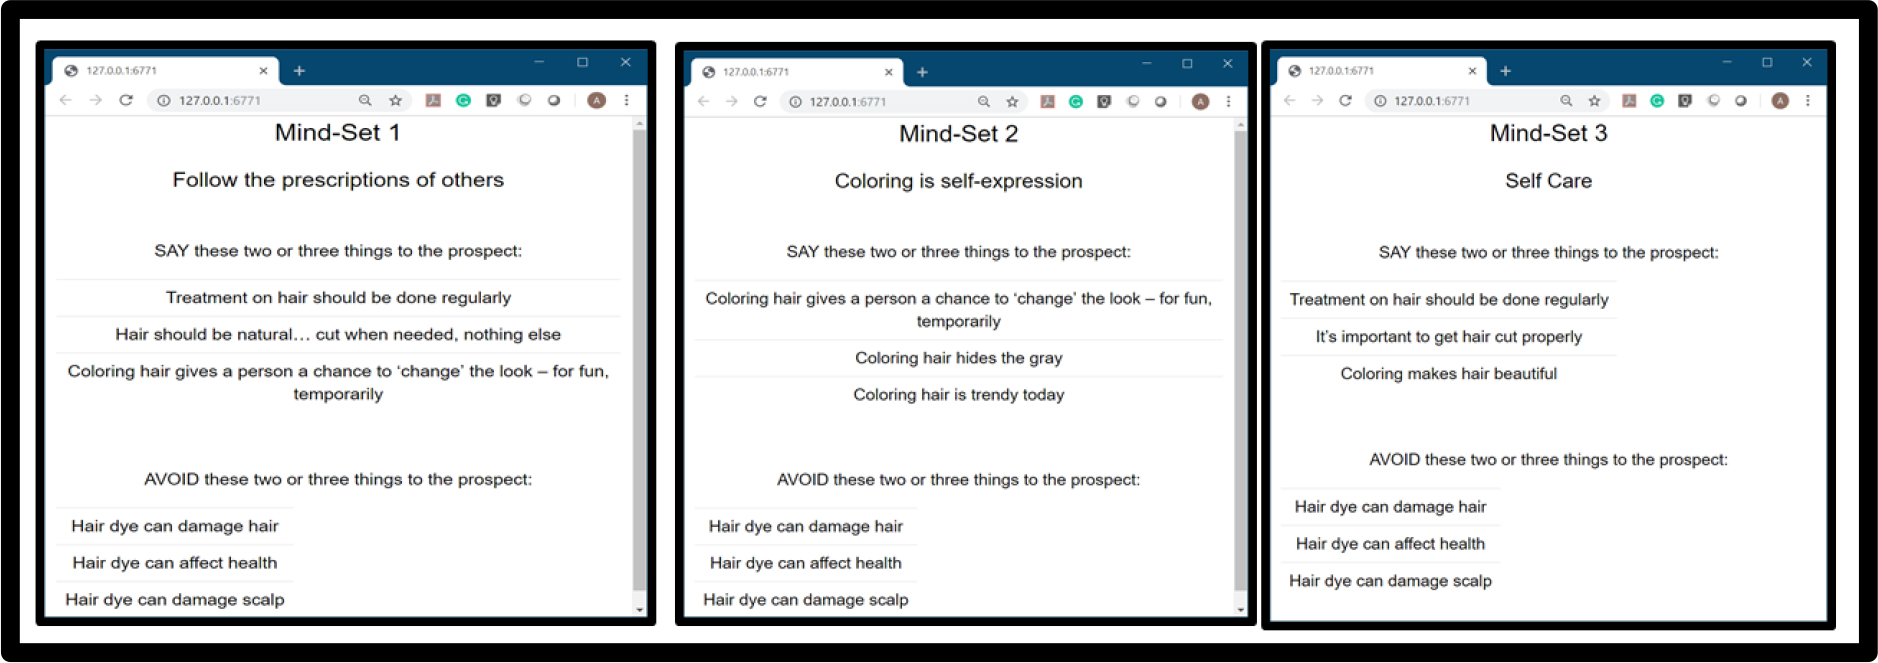
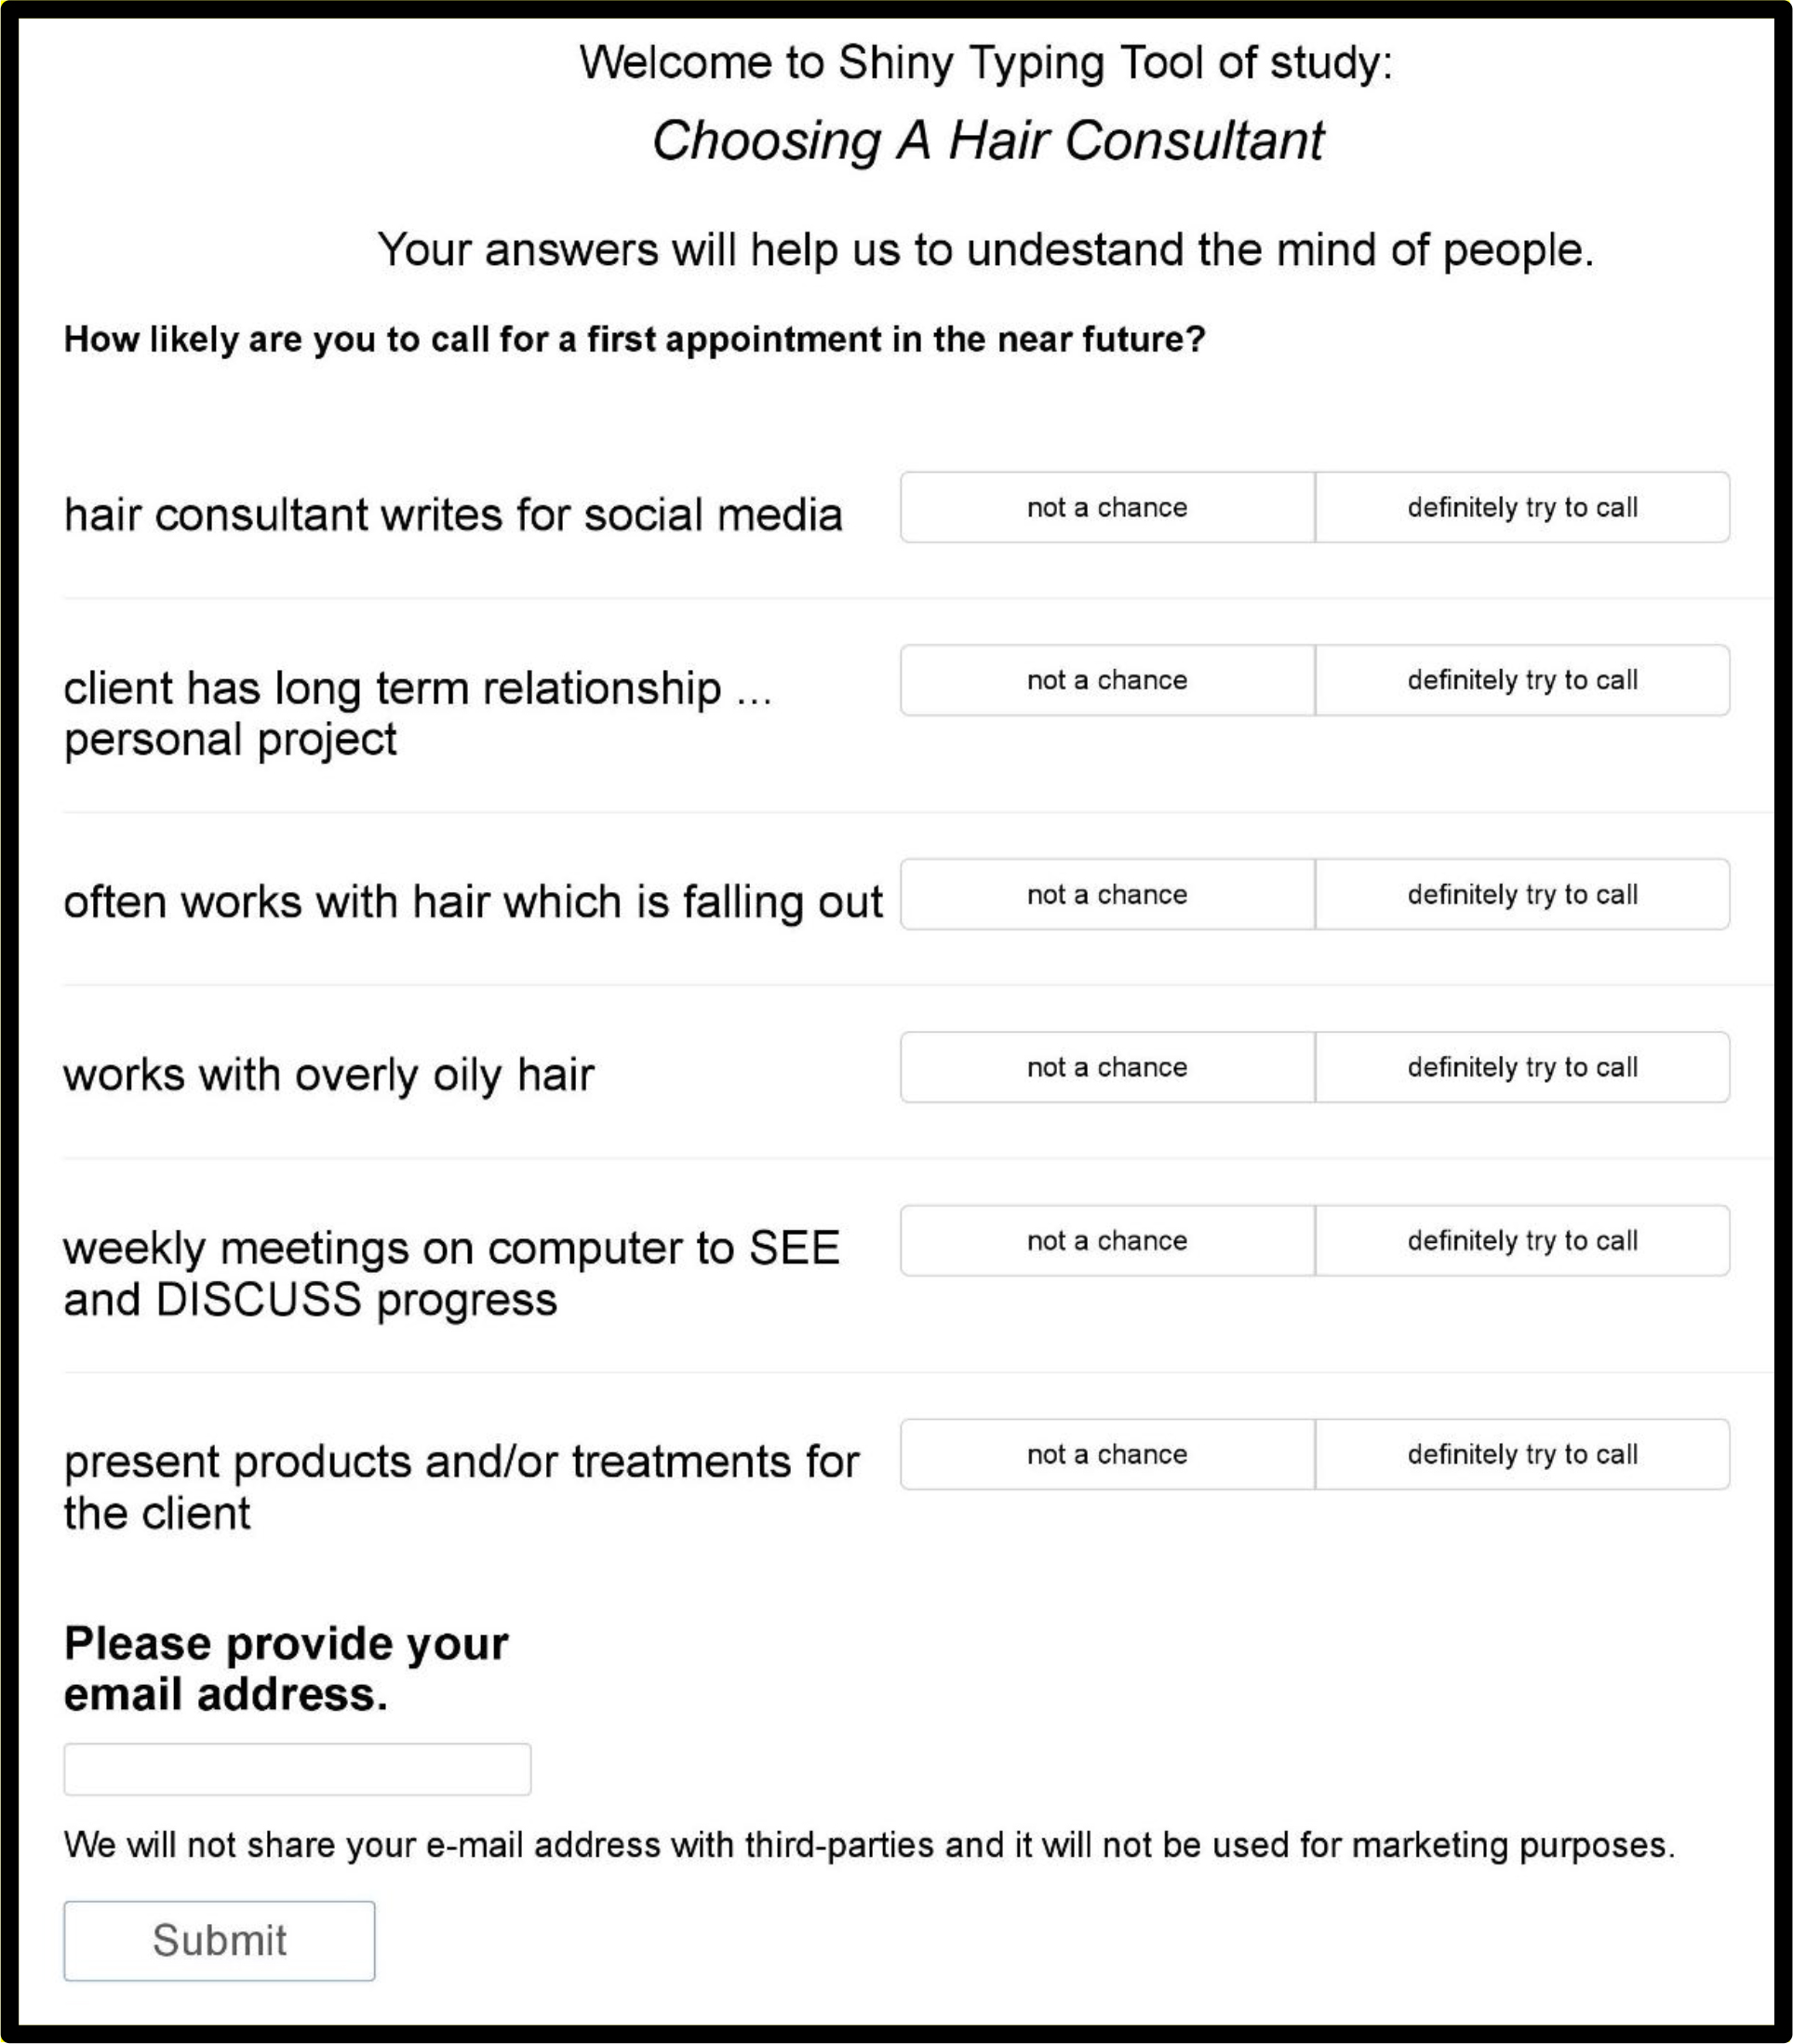
Figure 5. Feedback screens from the PVI. The feedback can go to the respondent, the hair salon, or to guide the messaging by merchants who advertise, either at point of sale in stores or on the Internet in e-commerce.

The PVI as shown in Figures 4 and 5 enable the use of the knowledge for either business applications or for continuing social research. One need only deploy the PVI at a salon or on the web, in order to understand the mind of the person, and relate mind-set membership for hair coloring to different forms of knowledge such as WHO and WHAT the person is an does, in the three mind-sets. Or the researcher can move more deeply into understanding how mind-set covaries with shopping behaviors.

At the level of application, one need only realize the business power of knowing the mind-set of a person with respect to hair coloring. Such knowledge, perhaps obtained quickly on the internet or in person, can be used to drive marketing efforts.  The PVI enables the sales messages to be those which are similar in content and tonality to the messages which would appeal to the mind-set to which the prospective customer appears to belong.

Response Time

Our final topic concerns the deconstruction of the messages into those which engage, based upon long response times, versus those messages which do not appear to engage, based upon short response time.  It is important to note that response time IS NOT ACCEPTANCE. Rather, response time is an empirical measure of the expected number of seconds (to the nearest tenth) that one appears to ‘read’ and thus process the element.

It is impossible to measure the response time to the individual answers, but it is very straightforward to measure the response time to the vignette and then use OLS regression to deconstruct the response time into the contribution of the individual elements or answers. The regression model is simple, similar to the model used for R5, except that the dependent variable is the response time, and the model has no additive constant. That is, the ingoing assumption is that in the absence of phrases, no one reads, and therefore there is no processing time.

Tables 7A and 7B show the estimated response times to the different elements or answers, this time by total panel, by gender, age, thoughts about coloring hair, mind-sets, and finally starting versus ending vignettes. To make the table easier to read, those response times of 1.5 seconds or longer are shown in shade and in bold face.   One can look across the table or downward, looking across a person, to discover what engages the respondent.

Mind Genomics works with ‘cognitively meaningful’ stimuli. That is, the elements have real meaning in the world, and thus our analysis to find a strong performer and interpret why, is made much easier. We are struck with a few observations, mainly qualitative ones when we look at the patterns of shaded cells, the intersection of an element or answer (row) and a subgroup (column),

  1. We begin with the fact that the nature of the information is the same, messages about hair color. The information differs both in the morphology (length of the answer in words and letters), and in meaning (what the answer conveys.)
  2. There appears to be a greater similarity of response times within a column (same group), rather than within a row (same answer or message.)  This is a qualitative observation only.  The implication for subsequent research is that the response time may be hinting at differences in the way people process nature.
  3. Some questions, such as Question A ‘Why do you color your hair?’ show relatively short response times associated with their answers.  In contrast, other questions, such as Question D ‘What do you find more beneficial; coloring, treatment or cutting?’ show long response times associated with their answers. The differences, again, are qualitative, and should be considered against the background of dramatic variation both in the response times of different groups, and the response times to different answers.

Discussion and Conclusion

Relevance of Mind Genomics Knowledge to Understanding People in Society:  The experiment on attitudes or mind-sets about hair coloring suggests that science need not be relegated to large-scale studies, the norm today in the hard sciences, but increasingly so in the psychological and social sciences. Today’s attitudes towards science stress the deadly combination of doing research in an acceptable way to the academic community, often picking topics to validate or disprove small points in a larger theory,  while working with surveys which fail to give a sense of the immediacy of the experience.

By couching the test stimuli in the language of the everyday, by making studies possible with as few as 50 respondents, and by allowing a research project to take perhaps no more than a few hours, Mind Genomics presents the scientific and business community with a new tool, one to understand people in society. One may think of Mind Genomics as a combination of quantitative ethnography (albeit ethnography of the mind’s interaction with the world), and a Technical Aid to Creative Thought, a term coined by Harvard computer professor, Anthony Gervin Oettinger, more than 55 years ago,

Applications of the Mind-Sets: Once the mind-sets are revealed, the reactions are quite predictable. The first reaction is a delighted wonderment. The reaction cannot be controlled nor suppressed, at least for long. There is an innate, almost child-like delight in the discovery of something new.  The second reaction, however, is perplexity. The individual or group of individuals encountering the mind-sets for the first time begins to wonder ‘what do we do with this information.’ The mind-sets are too compelling to be ignored in the way many other ‘factoids’ emerging from an experiment are ignored.

Table 7A. Response time as a function of element, showing complementary subgroups of WHO respondents ARE.

Gender

Age

Response Time – Total panel and ages

Total

Male

Female

A16–24

A25–44x

A55–60x

A61+

Question A: Why do you color your hair?

A1

Coloring hair hides the gray

0.6

0.8

0.4

0.7

0.3

0.6

1.3

A2

Coloring hair gives a person a chance to ‘change’ the look – for fun, temporarily

0.8

0.7

0.9

0.3

0.6

1.1

1.0

A3

Coloring hair is trendy today

0.7

0.7

0.6

-0.2

0.4

0.8

1.1

A4

Coloring hair lets the person ‘show off’

1.2

1.2

1.1

1.3

1.1

1.2

1.4

Question B: How do you feel when you change the color?

B1

Coloring hair instills confidence

1.1

1.0

1.2

2.0

1.1

1.1

0.8

B2

It takes a little time to get accustomed to a new hair color

1.4

1.4

1.3

1.2

1.2

1.6

1.2

B3

To prevent a feeling of insecurity, the coloring has to be ‘just right’

1.5

1.4

1.6

1.7

1.1

1.7

1.9

B4

Coloring makes hair beautiful

1.2

1.3

1.1

2.1

1.0

1.4

1.2

Question C: Do you think the color damages your health, your scalp, or your hair?

C1

Hair dye can affect health

1.1

1.0

1.3

1.7

1.1

0.9

1.2

C2

Hair dye can damage hair

1.2

0.9

1.5

1.5

1.4

0.9

1.3

C3

Hair dye can damage scalp

1.1

0.9

1.3

1.5

1.0

1.0

1.3

C4

Hair dye damages nothing

1.1

1.0

1.2

1.4

0.9

1.1

1.3

Question D: What do you find more beneficial:  coloring, treatment or cutting?

D1

Treatment on hair should be done regularly

1.0

1.0

1.0

-0.1

1.1

1.0

1.4

D2

Coloring hair should only be done every other haircut

1.1

1.0

1.3

-0.7

1.1

1.4

1.5

D3

It’s important to get hair cut properly

1.2

1.1

1.4

0.7

1.3

1.1

1.6

D4

Hair should be natural… cut when needed, nothing else

1.5

1.4

1.6

0.4

1.9

1.0

2.2

The applications of the mind-sets range from understanding to sales, from science to application. The key to application is recognizing that people are different in the way they think about the same topic, knowing the specific ways that they think for a topic (the mind-set segmentation), and then having a tool to assign a new person to a mind-sets (the above-mentioned PVI, personal viewpoint identifier.)

The applications abound:

  1. Specific knowledge:  create an entire science of a topic of the everyday (e.g., the science of the beauty experience),
  2. Co-variation of mind-sets with external behaviors: understand the nature of how people in different mind-sets of the same topic behave in their actual choices,
  3. Persuade: Assign a new person (sales prospect) to a mind-type in a short interaction, and presenting that person with the appropriate sales material

Prospects for databases and understanding interactions between WHO, WHAT, and the Mind

The ability to create a database about a specific topic with as few as 50–100 respondents, and then create the PVI (personal viewpoint identifier) means that it becomes possible to profoundly understand a small and clearly defined topic of experience, and then expand that topic through the PVI. The analogy is inexpensively created color science, and a colorimeter to measure the color for millions upon millions of objects.

The same thinking can be applied to Mind Genomics. We can take the topic of beauty care, divide it into 20 or even more topics, dimensionalize each topic (four questions, four answers per question), and run the study with 100 people. The emergent mind-sets can then be captured for new people using the PVI. With 20 studies, we have a grand PVI of 20 topics, each topic comprising 6 questions. It is only a matter of motivating a respondent to participate, answering the 120-question PVI, perhaps over a period of two or three sessions. The data, along with the respondents’ age, gender, and other details of a standard self-profiling questionnaire, provides the necessary information to ‘mind-type’ the world.

The analysis then proceeds in a very simple fashion. The PVI exercise has generated the profile of a person’s mind with respect to beauty care. We need only relate the ‘sequenced profile’ of a person’s 20 mind-sets in beauty care to other measures of the person, whether these be WHO the person is, or WHAT the person does.

Table 7B. Response time as a function of element, showing complementary subgroups what the respondents think about hair coloring, different mind-sets, and a comparison response time at the start of the experiment (vignettes 1–6) and at the end of the experiment (vignettes 19–24).

Q3: Coloring hair behavior

Mind-Sets

Order of testing

Coloring my hair now

Thinking about it

Not interested

 Follow the prescriptions
of others

Coloring –
 A personal expression

Focus on self-care

 Vignettes 01–06

Vignettes 19–24

Question A: Why do you color your hair?

A1

Coloring hair hides the gray

0.2

0.7

0.9

0.5

0.7

0.7

1.0

0.3

A2

Coloring hair gives a person a chance to ‘change’ the look – for fun, temporarily

1.2

0.9

0.5

1.1

0.8

0.6

1.3

0.6

A3

Coloring hair is trendy today

0.8

0.6

0.5

0.6

0.7

0.7

1.4

0.4

A4

Coloring hair lets the person ‘show off’

1.4

1.3

0.9

1.1

1.3

1.2

2.3

0.9

Question B: How do you feel when you change the color?

B1

Coloring hair instills confidence

1.1

1.2

0.9

1.3

1.0

1.0

1.5

1.0

B2

It takes a little time to get accustomed to a new hair color

1.4

1.1

1.6

1.6

1.3

1.1

2.3

1.2

B3

To prevent a feeling of insecurity, the coloring has to be ‘just right’

1.8

1.1

1.6

1.6

1.5

1.3

2.0

1.2

B4

Coloring makes hair beautiful

1.2

1.0

1.4

1.4

1.2

1.0

1.9

1.0

Question C: Do you think the color damages your health, your scalp, or your hair?

C1

Hair dye can affect health

1.4

1.0

1.0

1.4

1.0

1.0

1.8

0.8

C2

Hair dye can damage hair

1.3

1.3

1.0

1.4

1.3

0.9

2.0

0.6

C3

Hair dye can damage scalp

1.2

1.2

0.9

1.2

1.3

0.7

1.8

0.0

C4

Hair dye damages nothing

1.3

0.8

1.1

1.2

1.1

1.0

1.5

1.1

Question D: What do you find more beneficial coloring, treatment or cutting?

D1

Treatment on hair should be done regularly

1.0

0.9

1.1

0.9

0.9

1.2

0.8

1.2

D2

Coloring hair should only be done every other haircut

1.3

1.1

1.0

1.2

0.8

1.3

1.4

0.9

D3

It’s important to get hair cut properly

1.3

1.2

1.3

1.1

1.1

1.6

1.6

1.0

D4

Hair should be natural… cut when needed, nothing else

1.3

1.8

1.3

1.9

0.7

1.8

2.1

1.0

Acknowledgement

Attila Gere thanks the support of Premium Postdoctoral Research Program of the Hungarian Academy of Sciences.

References

  1. Trueb RM (2005) Understanding Hair Biology European Hair Research Society, 11th Meeting, Zurich, July 2005: Abstracts and Selected Reviews.
  2. Bloch PH (1993) Involvement with adornment as leisure behavior: an exploratory study. Journal of Leisure Research 25: 245–262.
  3. Cash TF (1987) The psychology of cosmetics: A review of the scientific literature.  Social and Behavioral Sciences Documents 17: MS No2800.
  4. Graham JA, Jouhar AJ (1981) The effects of cosmetics on person perception. International Journal of Cosmetic Science 3: 199–210.
  5. Moore L (2005) The Personal Beauty Care Market Outlook: NPD and Consumer Trends in Haircare and Skincare. Business Insights.
  6. Zhao X (2014) Salon hair coloring in the United States: A consumer perceived value analysis of Gen Y consumers. International Journal of Arts and Commerce 3: 105–115.
  7. Mitchell VW (2003) Generation Y female consumer decision-making styles. International Journal of Retail & Distribution Management 31: 95–106.
  8. Souiden N, Diagne M (2009) Canadian and French men’s consumption of cosmetics: a comparison of their attitudes and motivations. Journal of Consumer Marketing 26: 97 – 109.
  9. Datamonitor (2004) Haircare in the United States. Datamonitor USA, Reference Code: 0072–2242 Retrieved September 2, 2005 from http://www.datamonitor.com
  10. Euromonitor (2014) The Divergent Worlds of Hair Care: Global Strategies for Growth Euromonitor. Passport February, Retrieved April 16, 2014 from http://www.euromonitor.com
  11. Euromonitor (2005) The World Market for Cosmetics and Toiletries. Euromonitor International Retrieved October 1, 2005 from http://libproxy.uncg.edu:2798/Reports.aspx Euromonitor
  12. Euromonitor (2013a) Rethinking Beauty: Exploring New Growth Models Euromonitor Passport October, Retrieved May 12th, 2014 from http://www.euromonitor.com
  13. Euromonitor (2013b) Hair Care in China. Euromonitor Passport April, Retrieved May 12th, 2014 from http://www.euromonitor.com Euromonitor (2013c) Hair Care in the US Euromonitor Retrieved May 12th, 2014 from http://www.euromonitor.com
  14. Bloch PH, Richins ML (1992) You look “Marvelous”: the pursuit of beauty and the marketing concept Psychology and Marketing 9: 3–15.
  15. Boring EG (1929) A history of experimental psychology Prentice-Hall.
  16. Box GE, Hunter WG, Hunter JS (1978) Statistics for experimenters, New York, John Wiley
  17. Luce RD, Tukey JW (1964) Simultaneous conjoint measurement: A new type of fundamental measurement. Journal of mathematical psychology 1: 1–27.
  18. Green PE, Srinivasan V (1990) Conjoint analysis in marketing: new developments with implications for research and practice. The journal of marketing 54: 3–19.
  19. Moskowitz HR (2012) ‘Mind genomics’: The experimental inductive science of the ordinary, and its application to aspects of food and feeding. Physiology & Behavior 107: 606–613.
  20. Moskowitz HR and Gofman A (2007) Selling blue elephants: How to make great products that people want before they even know they want them. Pearson Education.
  21. Moskowitz HR, Gofman A, Beckley J and Ashman H (2006) Founding a new science: Mind genomics. Journal of sensory studies 21: 266–307.
  22. Moskowitz HR, Gofman A, Itty B, Katz R, Manchaiah M, Ma Z (2001) Rapid, inexpensive, actionable concept generation and optimization: the use and promise of self-authoring conjoint analysis for the food service industry. Food Service Technology 1: 149–167.
  23. Gofman A, Moskowitz H (2010) Isomorphic permuted experimental designs and their application in conjoint analysis. Journal of Sensory Studies 25: 127–145.
  24. Kahneman D, Egan P (2011) Thinking, fast and slow. New York: Farrar, Straus and Giroux.
  25. Wells WD (2011) Life style and Psychographics, Chapter 13: Life Style and Psychographics: Definitions, Uses, and Problems. Marketing Classics Press.
  26. Dubes R, Jain AK (1980) Clustering methodologies in exploratory data analysis. Advances in Computers 19: 113–238.

Consumer Requirement for a Healthful Vegetable Muffin: Agile Knowledge-Development through Mind Genomics

DOI: 10.31038/NRFSJ.2019213

Abstract

We provide a rapid approach to the evaluation of new product ideas and opportunities through the science of Mind Genomics. The approach requires the specification of a product or opportunity, the creation of four questions which ‘tell a story,’ each with four answers (total of 16 answers), and the evaluation of combinations of the answers by a small, affordable group of 25 respondents. We look at the ratings for ‘most interested’ (top of the scale), identify mind-sets, and discover what ideas both interest people (opportunities), and engage people when thinking about them. We uncover new-to-the-world groups (high acceptor mind-sets) to identify which ideas about the new product are most compelling, and search for these high-acceptor mind-sets using a simple, 6-question personal viewpoint identifier. The approach is designed for rapid use, requiring a day or two at most, thus targeting the newly emerging cadre of food entrepreneurs who are not hampered by the traditional processes designed to reduce risk rather than capture opportunities.

Introduction

There is a continuing search for healthful snacks. The increasing and massively competitive focus on good-for-you, along with the knowledge that it is good tasting to ensure repeat purchase, means that the food company must develop efficient ways to screen new ideas. Over the decades, solution-providers in the food industry, particularly, but consumer package goods generally, have explored various ways to create new product ideas, ranging from the evaluation of different ideas (promise testing) to the assessment of concepts, with and without the presence of a product. The results of the effort have not been successful, perhaps because the researcher does not understand in depth the features of the product concept which make it attractive. Even focus groups, specifically called to ferret out the features which the product should have often do not identify what the product should be.

Part of the reason for failure or at least for the failure to succeed, is the tendency of researchers to create combinations with which they are comfortable, and to avoid creating product ideas or prototypes that they think will ‘fail.’ That is, there is an insidious drive for rationality in people, especially brand managers, but also market researchers and product developers. In the face of market failure, it is hard to accept that one’s ideas of what is a good product must have been wrong. Blame is cast upon sales, distribution, advertising, not upon the fact that the research approach simply came up with the wrong idea, an idea that ended up getting adopted and losing money when the manufacturer puts the product to the real test, the jury of public opinion. This desire not to be embarrassed by offering ‘bad test stimuli’ in the name of progressing the project can derail even the best of teams, as individuals think of themselves first, and only later of the project success.

Testing ideas for new and healthful products might take a lesson from the great American inventor, Thomas Edison, who used failure as a springboard to success. Each failure, in the mind of Edison, was something from which a lesson could emerge. What would happen to the creation of new and healthful ideas about food if we were to systematize the invention process, not so much in the systematic, lock-step way that systems current do (e.g., Stage Gate, Cooper, 1979; 1990) [1,2], but rather as a system to create combinations, see how they work, and move on? The creation of combinations should not be done by a person who is doing the thinking, but rather through experimental design, the systematic, statistics-driven method of making combinations of variables.

The food industry is plagued by a continuing spate of failures, often failures of a single unusual flavor in an otherwise successful line, but occasionally a massive ‘flame out,’ a major line of brands simply crashing. Professionals and the trade in the food industry accept this failure, assuming it is now part of the reality of the food business. High failure rates may be the result of the structure of the business, but they are also the result of desires to get products into the market for the gratification and resumes of brand manager, as well as the need to announce ongoing ‘innovation’ to the investors and to those in the stock market.

It may well be that part of the problem of today is the perfect storm of risk-aversion, ossified process of new product development, and a knowledge-acquisition system (market research insights, sensory testing) which itself is stultifying, substituting statistical rigor for intellectual acuity and competence. In other words, the system is ‘broken,’ aged, simply not working today because it was designed for yesterday’s slower, less competitive reality.

If one is to believe experts in other areas, such as perfume, and even the new crop of entrepreneurs in the food industry, one might walk away with the belief that the cause of failure is an over-reliance on so-called mindless or ‘insight-less’ consumer research. The expert perfumer, so-called ‘golden nose’ has the reputation of averring that her or his nose, ‘knows what the consumer wants. In the same way, many entrepreneurs ‘know’ what their prospective customers want. They may not have data, but they are swept up in the excitement, the abandon, and the oft-hidden hubris of their own efforts.

The Need for Data but the Complementary Need for Agility

Data are required for new products, especially for ideas, but how does one get these data in a rigorous, rapid, cost-effective manner. There are some who believe that a series of focus groups are the cost-effective way. Others belief that following the market and looking at trends will be the answer. Most believe that agility is key and talk about the need for a better process [3–6]. It is fine to talk about the need for agility, for data, for better decision processes, for more successes, but simply what does one do at a local, operational level, in the day to day world of product design?

The Mind Genomics Approach

The answer may lie in systematic, inexpensive research, in experimental design of combinations of test stimuli. The ratings of these stimuli, properly collected and analyzed, may give us part of the answer. This paper presents a short case history of the approach. It is based upon decades of work, which have led to products such as the Oral B Electric Toothbrush (1992), the Discover Card Cash Back Credit Card (1993), successful jewelry promotions by Kay Jewelers (1997), MasterCard (1007–2006), and ongoing efforts since then in the reduction of hospital readmissions in the case of congestive heart failure (Moskowitz & Gofman, 2018; Moskowitz, 2016, unpublished.)

Mind Genomics is an emerging science, focusing on the science of the everyday. The foundation of Mind Genomics comes from the fields of experimental psychology, consumer research, and conjoint measurement [7–9] Experimental psychology provides the world view, namely explore and define the relation between stimulus and response, rather than using statistical methods to understand large-scale, cross-sectional data. Through experimentation one understands how one variable affects another. Consumer research focuses on the everyday, the quotidian aspects of life, how we make decisions about things that we do, choose, purchase, and so forth. Consumer research provides the general focus, dealing with the normal, not the unusual, and not the strained ‘normalcy’ that must be done by experimental psychologists when they study behavior. Finally, conjoint measurement [10] brings in the use of experimental design, systematic combinations of variables, to understand choice, as these variables compete with each other, and add to each other to drive responses [11–13].

Mind Genomics as it is currently constituted approaches the problem of new product design in a straightforward manner. The governing notion is that one should pose a general topic (e.g., what are the features of a new, vegetable-based muffin for the health market, the topic studied here.) The researcher should then deconstruct the topic into four questions which ‘tell a story.’ This step can be hard or easy, depending upon the topic, the experience of the researcher. Finally, each question should generate four simple answers, phrased in declarative format. This third step is quite easy. It is the formulation of the four questions which is difficult. The approach is decades old, beginning in industrial applications in the early 1980’s by author Moskowitz, and evolving to a so-called DIY (Do It Yourself) technology in early 2000 [14,15].

Method

The mechanics of Mind Genomics are, by now, well-choreographed. The steps below fit very well into the innovation process, as should become obvious.

  1. Identify the Topic, Ask the Questions, and Present Four Answers: Table 1 presents the four questions, and the four answers to each question. Note that the question is only a heuristic to guide the creation of answers. Sometimes the answers are ‘off target,’ but that is irrelevant. It is important to keep in mind that the respondent will never see the questions. The respondent will only see the answers.
  2. Recruit Respondents to Participate, by Email Invitation: The omnipresence of the Internet has enabled researchers to do many types of studies on the Web, without having to meet the respondents. Panel companies have emerged to service the business of recruiting and provided participants for these studies. The past 20 years, the period of massive growth in the use of the Internet, has affected researchers as well. Much research is done on the web, but it is increasingly difficult to recruit respondents to participate, when these respondents come from one’s own list of contacts. The panel providers (here strategic partner, Luc.id, Inc.) guarantee the proper respondents. This study was done with 25 respondents, enough to provide statistically powerful answers through back-end regression modeling, albeit at an affordable price, and very rapidly (1–2 hours for the entire process, from setting up the study to receiving the PowerPoint report, ready for presentation.)
  3. Orient the Respondents: Present the respondents with an orientation page, telling them what the study is about. The sentence below reflects all the information that the respondent receives. It is good practice for the respondent to receive as little information as possible. In such a case, it is the set of elements which ‘drive’ the responses, and not any predetermined set of expectations.

    How intrigued are you about trying this baked snack this coming week: 1=NO WAY … 9=Yes yes yes

    Table 1. The four questions, and the four answers to each question.

    Question A: why do we need vegetables?

    A1

    Sustainable, better for you and better for the earth

    A2

    Vegetable are delicious

    A3

    Vegetables are very healthful for you

    A4

    Vegetables prevent health problems

    Question B: How to make vegetables appetizing & delicious to you?

    B1

    Delicious to eat and good for your body

    B2

    Think healthy, think muffin

    B3

    Global and adventurous eating

    B4

    Vegetable for all ages

    Question C: what will eating vegetable do for you?

    C1

    Lovingly created vegetable baked snacks

    C2

    A delicious way to great health

    C3

    Healthy as delicious for every eating occasion

    C4

    Convenient on-the-go snack

    Question D: how to make it fun to eat vegetable?

    D1

    Real food created by mom and real baker

    D2

    Made from the ingredients found in your own kitchen

    D3

    Customized in four flavors: cauliflower, chocolate pomegranate, carrot morning glory, garden vegetable

    D4

    This is gluten free and all natural

  4. Respondent Evaluates Systematically Varied Combinations (Vignettes): Each respondent evaluates 24 vignettes, a vignette comprising 2–4 elements, at most one element or answer from each question, but sometime no elements or answers from a question. The structure of the experimental design ensures that each element appears an equal number of times, and that the set of 16 elements are statistically independent of each other. The statistical independence allows for the application of OLS (ordinary least-squares) regression to relate the presence/absence of the 16 elements to the binary transformed rating (whether Top3, Top2 or Top1, respectively.) Furthermore, each respondent evaluated a different set of 24 vignettes. The underlying design is the same for each respondent [15,16]. Only the specific combinations change. This change in the combinations, maintaining, however, the basic structure of the design, is akin metaphorically to the ‘MRI’ in medicine, which takes different pictures of the same structure, and then recombines these pictures to give a 3-dimensional rendering of the structure. Figure 1 presents an example of a vignette as it would appear on the screen of a smartphone, making it possible to do research anywhere in the world, in almost any situation.

    Mind Genomics-021 - NRFSJ Journal_F1

    Figure 1. Example of a vignette as it would appear on the screen of a smartphone.

  5. Prepare the Data for Statistical Analysis: Mind Genomics studies are set up to be analyzed using OLS (ordinary least-squares) regression. The independent variables are the presence/absence of the 16 ‘answers.’ The variables are coded 0/1 to reflect the fact that we are only interested in the effect that they have when they are present in a vignette versus absent from a vignette. They have no intrinsic numerical value. The dependent variable is a recoding of the original 9-point scale. The rationale for re-coding is that in practice, most researchers and business managers do not know how to interpret the numbers on a Likert scale. They do know how to interpret binary numbers (no/yes, bad/good). The rescaling or recoding of the ratings was done with three different criteria, to generate three new dependent variables:

    Top 3 – Ratings of 1–6 recoded as 0, ratings of 7–9 recoded as 100. This is the typical recoding, following standard practices in consumer research.

    Top 2 – Ratings of 1–7 recoded as 0, ratings of 8–9 recoded as 100. This is a more stringent characterization of ‘good’, because only two of the rating points are now ‘good.’

    Top 1 – Ratings of 1–8 recoded as 0, ratings of 9 recoded as 100. This is the most stringent characterization of ‘good,’ because only one rating point is ‘good,’ the highest rating. This will become the preferred approach here because it rapidly eliminates weaker ideas, even when the population of respondents tends to ‘uprate’ the vignettes as is often the case in other cultures, such as respondents in Latin America and in the Philippines. The uprated combinations give the research false positives.

  6. Estimate the Additive Constant and the 16 Coefficients, One for Each of the Answers: Our first analysis from OLS regression appears in Table 2, which compares the coefficients from the model when the three different dependent variables are estimated using the same 16 predictor variables.

    Table 2. Coefficients for the OLS model relating acceptance on the 9-point scale to the presence/absence of elements. Stringency of acceptance was defined at three different levels,

    TOP 1

    TOP 2

    TOP 3

    Stringency for approval – levels of the 9-point scale leading to a value of 100

    High 9

    Med 8, 9

    Low 7, 8, 9

    Additive constant

    25

    34

    58

    C4

    Convenient on-the-go snack

    6

    2

    0

    D2

    Made from the ingredients found in your own kitchen

    4

    4

    4

    A1

    Sustainable, better for you and better for the earth

    1

    1

    0

    A3

    Vegetables are very healthful for you

    1

    8

    5

    A4

    Vegetables prevent health problems

    1

    3

    1

    D1

    Real food created by mom and real baker

    1

    3

    1

    A2

    Vegetables are delicious

    0

    1

    -4

    C2

    A delicious way to great health

    0

    5

    1

    C1

    Lovingly created vegetable baked snacks

    -1

    4

    3

    C3

    Healthy as delicious for every eating occasion

    -1

    -4

    1

    B2

    Think healthy, think muffin

    -2

    -2

    -8

    D4

    This is gluten-free and all-natural

    -2

    3

    5

    D3

    Customized in four flavors: cauliflower, chocolate pomegranate, carrot morning glory, garden vegetable

    -3

    2

    7

    B3

    Global and adventurous eating

    -4

    -3

    -3

    B4

    Vegetables for all ages

    -4

    1

    -5

    B1

    Delicious to eat and good for your body

    -5

    8

    -1

The additive constant estimates the percent of times that a rating would be assigned either 9 (Top1), 8 or 9 (Top 2), or 7, 8 or 9 (Top3). The results from the OLS regression suggest a modest additive constant when the most stringent criterion is adopted (constant = 25), and a high additive constant when the most lenient, least stringent criterion is adopted (Constant = 58 for Top3). We interpret this to mean that when we use a tough criterion (only rating of 9), we get about 25% of the responses to be 9 in the absence of elements. This is a very encouraging result. It suggests that the notion of a vegetable-based muffin is, by itself, is a very good idea. When we reduce the strictness, the additive constant jumps to 58, meaning that in the absence of elements, almost 60% of the responses will be positive, even before the elements are introduced.

Thus far the data suggest strong positive feeling to the basic idea of a vegetable-based muffin. The additive constants are high. Even when we impose the greatest stringency, 9 to become 100, else 0, we find that a full 25% of the time we would we expect a positive reaction to the concept of a vegetable muffin.

When we move to the performance of the individual elements, we do not see any very strong performers, No element really stands out when we adopt the most stringent criterion. The only element which performs well is ‘convenient, on-the-go snack.’ As we look over the different columns, we see no real patterns which promise success. We may either have NO elements or answers which perform well, or more likely, we are dealing with a variety of populations with different proclivities and ideas that they prefer. These groups may cancel each other so what one group really likes, the other groups in the same population dislike. The result is a cancellation.

Looking at Self-Defined Subgroups of Respondents Using the Stringent Criterion of Acceptance

When we divide the respondents by WHO they say they are, we end up with two genders (male versus female), two ages (younger, < 30, older > 29)), and on group who says they are foodies. All groups are small. Yet, the Mind Genomics approach is sufficiently powerful with its permuted experimental designs to reveal the additive constant and the key elements for each group. We use the stringent criterion (rating of 9 recoded to 100, ratings of 1–8 recoded to 0.)

Table 3 shows that the basic acceptance of the vegetable muffin is equal among genders (additive constant is 24 for males, 21 for females), higher for the younger respondents (35 for younger versus 15 for the older respondents.) Finally, the acceptance of a vegetable muffin is higher among those respondents who label themselves ‘foodies’ (additive constant = 42, a very high level of basic interest.)

Table 3. Performance of the 16 elements by total panel, key self-defined subgroups, and by emergent mind-sets. The coefficients are taken from the Top1 model (ratings of 9 transformed to 100, other ratings transformed to 0). The development target is Mind-Set 2.


Total

Male

Female

Younger

Older

Foodie

Mind-Set 1

Mind-Set 2

Base size

25

13

12

31

12

15

10

5

Additive constant

25

24

21

35

15

42

30

22

C4

Convenient on-the-go snack

6

6

5

11

1

9

4

5

D2

Made from the ingredients found in your own kitchen

4

4

5

2

5

7

4

5

D1

Real food created by mom and real baker

1

1

4

-2

5

3

2

-1

A3

Vegetables are very healthful for you

1

0

4

0

2

2

0

2

A4

Vegetables prevent health problems

1

-2

7

-2

3

1

-4

8

A1

Sustainable, better for you and better for the earth

1

2

1

0

1

1

-3

6

A2

Vegetables are delicious

0

1

-1

-3

3

-2

0

-1

C2

A delicious way to great health

0

4

-3

0

1

0

2

-5

C3

Healthy as delicious for every eating occasion

-1

9

-11

-1

0

-2

-1

-3

C1

Lovingly created vegetable baked snacks

-1

6

-9

0

-2

-3

-2

-2

D4

This is gluten-free and all-natural

-2

-2

-1

-9

5

-2

-4

2

B2

Think healthy, think muffin

-2

0

-3

-5

1

-6

-4

-1

D3

Customized in four flavors: cauliflower, chocolate pomegranate, carrot morning glory, garden vegetable

-3

-7

2

-9

3

-2

-5

0

B4

Vegetables for all ages

-4

3

-7

-11

2

-8

-7

-3

B3

Global and adventurous eating

-4

-6

0

-7

-2

-8

-9

1

B1

Delicious to eat and good for your body

-5

0

-6

-9

-1

-8

-6

-5

Looking at the pattern of coefficients, the data suggest two messages for the product:

A convenience message, emphasizing a ‘convenient, on the go snack’. This positioning should appear to the total panel, but especially appeal to the younger respondent, and the respondent who considers him or her a ‘foodie.’

A ‘home’ and ‘health’ orientation, emphasizing that the product is ‘made from the ingredients found in your own kitchen.’ This phrasing can be elaborated for health but must be done so with care.

Dividing Respondents by Mind-Sets

One of the tenets of Mind Genomics is that in any topic where human judgment is important, there are different patterns of judgment, based upon the way individuals value the various aspects of the situation. Thus, in a product, one may focus on convenience, whereas another may focus on price, and a third may focus on nutrition, etc.) These mind-sets emerge by a statistical analysis of the results, clustering, which looks at the pattern of coefficients, and puts the respondents into a small set of mutually exclusive and exhaustive groups, mind-sets [17]. The coefficients show how the respondent weights the different pieces of information to drive a rating. Thus, clustering the individuals on the basis of the pattern of their 16 coefficients for the specific product of vegetable muffin reveal new, presumably more coherent subgroups. The individuals in a mind-set are presumed to show the same pattern, again for the specific product being developed. Mind Genomics works at the level of the very specific and does not requiring an armory of hypothetical constructs to move from general psychographic segmentation to the mind-sets pertaining to a vegetable muffin. Traditional psychographic segmentation misses the link from the general to thea particular [18].

Table 3 suggests that with our small sample of 25 respondents two clusters emerge. These are the two mind-sets. The two mind-sets show equal, moderate acceptance of the basic idea of the vegetable. Mind-Set 1 cannot be easily appealed to. Mind-Set 2, however, shows strong reactions to health and sustainability, Mind-Set 2 seems to be more coherent in what they like. They may not like the product more, but they give a sense of being more coherent, and possibly easier to reach. Thus Mind-Set 2 is the logical target to satisfy.

What Engages the Reader – Analysis of Response Times

Beyond the ratings one can get an idea of what messages engage the reader, and what messages the reader simply discards, passing over the message. Typically, the process of reading and deciding happens quickly, within a few seconds. It is virtually impossible for the respondent to ‘know’ how much time is spend engaged in reading. Yet, the systematic variation of the combinations coupled with a measure of overall response times enables the researcher to estimate how many tenths of seconds of one’s response time can be allocated to each of the elements or messages in the vignette.

The approach to understand response times follows that used to relate the presence/absence of the 16 elements to the ratings (e.g., Top 3, Top 2 or Top 1 rating.) The key differences are:

  1. The first vignette evaluated by each respondent is removed from the analysis. Other studies, as well as this, suggest that the respondents ‘learn’ what to do when rating the first vignette. Their response time may be artificially longer, but they are unaccustomed to the study. Respondents become accustomed quite quickly, so by the second vignette they are virtually ‘up to speed’ on what to do. The analysis removed this first vignette, leaving 23 vignettes evaluated by each respondent.
  2. All vignettes with response times exceed 9 seconds are removed. This precautionary action ensured that the remaining data reflected situations wherein the respondent was actually reading the vignette, whether paying attention to the messages or not.
  3. The result of the steps 1 and 2 above generated a data set comprising 534 observations, rather than the original 600.
  4. The model linking response time (seconds) to the presence/absence of the elements was estimated using OLS regression. The model is the same as the linear equation estimated for the rating of interest, except that there is no additive constant. The equation is expressed as: Response Time = k1(A1) + k2(A2)…k16(D4)
  5. The coefficients give a sense of the number of seconds spend by a typical respondent in the subgroup to ‘read’ the element in the vignette.
  6. Table 4 presents the coefficients for the different response times, for each element, by each key subgroup.

Table 4. Response times, defined as the linkage between the number of seconds estimated to be spent ‘reading’ each of the 16 different elements.

Total

Male

Female

Younger

Older

Foodie

Mind-Set 1

Mind-Set 2

Average Response Time

0.9

1.0

0.8

0.6

1.2

0.8

0.8

1.0

B3

Global and adventurous eating

1.4

1.5

1.5

0.8

1.9

1.4

0.9

2.1

C1

Lovingly created vegetable baked snacks

1.2

1.4

0.8

0.9

1.7

1.1

0.8

1.7

B2

Think healthy, think muffin

1.1

1.2

1.0

0.8

1.4

1.0

0.8

1.4

B4

Vegetables for all ages

1.1

0.9

1.5

0.6

1.6

1.1

0.7

1.6

C3

Healthy as delicious for every eating occasion

1.0

1.2

0.8

0.3

1.9

0.4

0.8

1.3

B1

Delicious to eat and good for your body

1.0

1.1

1.0

0.5

1.5

0.9

0.6

1.4

D3

Customized in four flavors: cauliflower, chocolate pomegranate, carrot morning glory, garden vegetable

1.0

0.9

1.0

0.8

1.3

0.7

0.9

1.2

D2

Made from the ingredients found in your own kitchen

0.9

0.8

0.9

1.1

0.7

1.1

0.6

1.3

C2

A delicious way to great health

0.9

0.8

0.9

0.8

1.1

0.8

1.1

0.5

C4

Convenient on-the-go snack

0.8

0.7

1.0

0.7

1.0

0.6

0.9

0.7

A4

Vegetables prevent health problems

0.8

1.0

0.4

0.7

0.7

1.0

1.1

0.3

D1

Real food created by mom and real baker

0.8

0.9

0.6

0.8

0.9

0.6

0.7

1.1

D4

This is gluten-free and all-natural

0.7

0.8

0.5

0.5

1.2

0.6

0.8

0.9

A1

Sustainable, better for you and better for the earth

0.7

0.8

0.6

0.4

1.0

0.9

0.8

0.6

A3

Vegetables are very healthful for you

0.6

0.6

0.6

0.1

0.9

0.6

0.7

0.4

A2

Vegetables are delicious

0.4

0.7

0.1

0.1

0.7

0.4

0.5

0.3

The results from this small-scale study are again enlightening.

  1. On average, the typical time for an element is 0.9 seconds
  2. Men and women spend about equal time reading the elements (1.0 seconds for males, 0.8 seconds for females.)
  3. Older respondents spend longer time, on average, than do younger respondents (1.2 seconds versus 0.6 seconds.)
  4. Foodies spend an average amount of time, overall, reading the elements as do the two mind-sets.
  5. The elements differ dramatically in their ability to engage. For example, ‘Global and adventurous eating’ takes up 1.4 seconds on average, and among older respondents takes up 1.9 seconds, and among Mind-Set2 takes up 2.1 seconds. In contrast’ ‘Vegetables are delicious’ and ‘Vegetables are healthful for you’ appear to be glossed over by every but males and older respondents.
  6. Engagement does not predict interest, however. Just because a message engages and takes longer to read does not mean that the message will drive acceptance. For example, the two messages driving strong responses among Mind-Set2 (Vegetables prevent health problems; Sustainable, better for you and better for the earth) are not engaging in terms of time spent.
  7. In the development of stronger ideas from new products, engagement, perhaps time spent in focus groups, may not be an automatic indicator that the idea will be motivating.

Finding Mind Sets

One of the key benefits of Mind Genomics is its ability to uncover new-to-the world mind-sets, groups of people with similar ways of looking at the world. Traditionally, the notion of segmentation, dividing people, has implied collecting the data from hundreds, and now thousands of respondents, based upon either questionnaires, or more frequently now, purchase behavior recorded on the web, or in a loyalty program. From that often-expensive enterprise comes a way to identify people, either by asking them a set of questions or by observing their behavior patterns and assigning them to a segment.

We deal here with 25 respondents, for a limited product, muffin, at the very early conceptual stages. Despite that, we see that there are two mind-sets, at least in this very early study. How then do we find people in Mind-Set2, our potential group? People don’t wear signs on their foreheads announcing the mind-set to which they belong, and even if they did, we can always come up with new-to-the-world products which have no history on which to create segments, clusters. Table 5 shows that the two mind-sets distribute across gender, age, and even self-defined food preferences (here ‘Foodie.’) The answer is NOT more respondents, although that might be the reflex response. Instead of 25 respondents, we could opt for 2500 respondents, but we are likely to get similar distributions. Another way of thinking about the problem is needed. Rather, the answer is a way to identify people as members of the appropriate mind-set, either in the development of the new product, sampling of the new product in stores, or mass advertising, respectively.

Table 5. Distribution of the two mind-sets in the population of 25 respondents.


Total

Mind-Set 1

Mind-Set 2

(Target)

Total

25

15

10

Male

13

8

5

Female

12

7

5

Young

13

8

5

Old

12

7

5

Foodie

15

10

5

The best way to find new mind-sets, in an efficient manner, matching the speed and cost of the basic study, creates simple PVI, personal viewpoint identifier. We know the mind-sets from the study, and we know how the different mind-sets react to the elements. We can create a set of six questions, with two possible answers to each, such that the pattern of the answers (all 64 patterns) will suggest that the person completing the PVI will be a member of Mind-Set2 (the target for development and marketing), or Mind-Set1 (not the target.)

Figure 2 shows the PVI created for this small study. As of this writing (June, 2019) the PVI resides at http://162.243.165.37:3838/TT36/

Mind Genomics-021 - NRFSJ Journal_F2

Figure 2. The Personal Viewpoint Identifier (PVI) for the vegetable muffin, showing the six questions. The pattern of answers assigns the respondent to Mind-Set1 or Mind-Set 2.

It is worth reiterating that the spirit of the project is to identify a potential product opportunity. This paper shows the possibility of using powerful techniques to understand product opportunities and people, not at the end of development where the decisions have been made and the costs of failure are high, but rather at the very beginning of the development project, where the structured approach provides the beginning of a roadmap. One could imagine using the PVI to identify those likely to be in Mind-Set2, and then working with to define the appropriate product features, and most effective advertising messages.

Discussion and Conclusion

The origin of this study was from a discussion about the best way to create a new idea in a product category.

Traditional methods included ideation (e.g., brainstorming), promise testing, concept testing, concept optimization, along with very expensive product/concept tests, and even predictions of market share such as BASES [19,20].

The foregoing methods are long, cumbersome, expensive, and ultimately oriented to the clerical and purchasing function. What started out as a method to create ideas for new products has ended up being a choke on ideas, such as the vaunted methods of Stage Gate [2], and the standardized practices of past and current giants such as General Foods, Kraft Foods, Procter & Gamble, and so forth. These steps have been codified into best practices, with appropriate activities, norms, and so forth, until s create a climate of fear and risk aversion, preventing the corporation from actually coming up with new products. The ‘process becomes the product, the product itself almost forgotten as the process takes over, perhaps analogous to the way the parasite subvert the biological processes of its host.’

In recent years, beginning about 20years ago, there has been a movement away from these large-scale, risk reduction processes, towards so-called agile development [21–23].

There is still the ever-present fear of failure in corporations, counterbalanced by the often totally ‘seat of the pants’ efforts by entrepreneurs who have abandoned or who cannot afford such best practices in the formulation of that idea. The method here, fast, inexpensive, powerful, based on an APP, and done in 2–4 hours at low cost, scalable, and iterative if necessary, presents a new vision of what could be accomplished when thinking, rather than process, is given a ‘technical tool for creative thought’ (personal communication from Anthony Oettinger, March, 1965, to Howard Moskowitz.) The approach relies upon what Kahneman [24] has called ‘System 1,’ the intuitive, rapid, almost automatic system by which we make most of our daily decisions. As a historical aside, it is worth noting that the approach, developed originally by author Moskowitz, comes from some thoughts in originating in the 1960’s, when influenced by Oettinger’s vision, and Kahneman’s through the latter’s research partner, the late Amos Tversky.

Acknowledgment

Attila Gere thanks the support of the Premium Postdoctoral Researcher Program of the Hungarian Academy of Sciences.

References

  1. Cooper RG (1979) the dimensions of industrial new product success and failure. Journal of marketing 43: 93–103.
  2. Cooper RG (1990) Stage-gate systems: a new tool for managing new products. Business horizons 33: 44–54.
  3. Cooper, Robert G (2016) Agile–Stage-Gate Hybrids: The Next Stage for Product Development Blending Agile and Stage-Gate methods can provide flexibility, speed, and improved communication in new-product development. Research-Technology Management 59: 21–29.
  4. Dora M, Van Goubergen D, Kumar M, Molnar A, Gellynck X (2014) Application of lean practices in small and medium-sized food enterprises. British Food Journal 116: 125–141.
  5. Herstatt C and Von Hippel E (1992) From experience: Developing new product concepts via the lead user method: A case study in a “low-tech” field. Journal of product innovation management 9: 213–221.
  6. Thomke S, Reinertsen D (1998) Agile product development: Managing development flexibility in uncertain environments. California management review 41: 8–30.
  7. Moskowitz HR (2012) ‘Mind genomics’: The experimental inductive science of the ordinary, and its application to aspects of food and feeding. Physiology & Behavior 107: 606–613.
  8. Moskowitz HR, Gofman A (2007) Selling blue elephants: How to make great products that people want before they even know they want them. Pearson Education.
  9. Moskowitz HR, Gofman A, Beckley J and Ashman H (2006) Founding a new science: Mind genomics. Journal of sensory studies 21: 266–307.
  10. Luce RD, Tukey, JW (1964) Simultaneous conjoint measurement: A new type of fundamental measurement. Journal of mathematical psychology 1: 1–27.
  11. Box GE, Hunter WG, Hunter JS (1978) Statistics for experimenters. New York, John Wiley.
  12. Green PE and Rao VR (1971) Conjoint measurement for quantifying judgmental data. Journal of marketing research 8: 355–363.
  13. Green PE, Srinivasan V (1990) Conjoint analysis in marketing: new developments with implications for research and practice. The journal of marketing 54: 3–19.
  14. Moskowitz HR, Gofman A, Itty B, Katz R, Manchaiah M, Ma Z (2001) Rapid, inexpensive, actionable concept generation and optimization: the use and promise of self-authoring conjoint analysis for the food service industry. Food Service Technology 1: 149–167.
  15. Gofman A, Moskowitz H (2010) Isomorphic permuted experimental designs and their application in conjoint analysis. Journal of Sensory Studies 25: 127–145.
  16. Moskowitz H, Gofman A, I novation Inc (2003) System and method for content optimization. U.S. Patent 6,662,215.
  17. Dubes R, Jain AK (1980) Clustering methodologies in exploratory data analysis. Advances in Computers, 19, 113–238.
  18. Wells WD ed., 2011. Life Style and Psychographics, Chapter 13: Life Style and Psychographics: Definitions, Uses, and Problems. Marketing Classics Press.
  19. Hanssens DM (2016) what is known about the long-term impact of advertising. In Accountable Marketing (pp. 120–137). Routledge.
  20. Rawlinson JG (2017) Creative thinking and brainstorming. Routledge.
  21. Kessler EH, Chakrabarti AK (1999) Speeding up the pace of new product development.” Journal of Product Innovation Management 16: 231–247.
  22. Lehtinen U, Torkko M (2005) The lean concept in the food industry: A case study of contract a manufacturer. Journal of Food Distribution Research 36: 57.
  23. Zarei M, Fakhrzad MB, Paghaleh MJ (2011) Food supply chain leanness using a developed QFD model. Journal of food engineering 102: 25–33.
  24. Kahneman D and Egan P (2011) Thinking fast and slow. New York: Farrar, Straus and Giroux.

Choosing a Hair Consultant: A Mind Genomics Exploration in the Realm of Beauty

DOI: 10.31038/AWHC.2019244

Abstract

We present an approach to understanding how to create a consulting business for a personal service, in this case hair beauty. The approach uses experimentation, in the form of systematically varied ideas (Mind Genomics.) The strategyis to expose respondents to combinations of services, identify which particular ideas in the combination ‘drive’ positive reactions, and then focus on those ideas in communication. Rather than asking respondents, Mind Genomics works with combinations, presented rapidly, forcing the response to be intuitive, rather than considered. Mind Genomics reveals new-to-the-world groups of consumers, mind-sets, who respond to different messages in communications, and identifies individuals with these mind-sets through a PVI, personal viewpoint identifier.

Introduction

The business of beauty, ‘hope in a bottle’ as some have called it, continues to grow. The desire to be beautiful to others, seemingly built-in to our condition as human beings, continues to drive business growth as the economies of the world improve, these economies moving into the 21st century, and expanding beyond subsistence to better living, and even to living at the ‘high end,’. The rise of wealthy multi-national companies, specializing in the creation of personal ‘beauty’ in all forms, for all parts of the body, attests to ineradicable desire of people to look attractive.

Macro-economic studies of the growth of the beauty industry can go just so far, and no further. The expertise of marketing and market researchers, replete with their knowledge about the industry, the solution providers (e.g., salons, products) and the customers, provide a lot of information and indeed with the Internet a torrential, ever-increasing amount each day. Whether one reads the newspapers, listens in on social media, or works in salons and stores, one cannot escape the world of beauty, massive, dynamic, growing. The industry reports, the stock market, the newspaper and other sources of ads and promotions attest to the dynamism.

What then about the individual, however? We mean here the consumer who buys the beauty product or service. What can we learn about them, information beyond the conventional information of ‘who they are’, and ‘why they buy?’ We don’t mean the standard information available from trend studies, from so-called Big Data, or even from focus groups convened to learn how to sell a product or service. Rather, we mean here the mind of the individual, when dealing with a product in the world of beauty.

Sadly, in the world of science there is relatively little research devoted to the way people make ordinary decisions. There are, of course, studies of entire categories and verticals, but these studies tend to be cross-sectional, in the spirit of a macro-economic analysis, such as what are people in general thinking, what are people, in general, buying, and so forth. The science which emerges from these studies tends to be strongly driven by theory, by mathematical models, and replete with generalities about human behavior gleaned from the analysis. In contrast, there is very little science of ‘every day’ experience. We know that people experience daily life, and make decisions, one decision after another. But what can we learn about the structure of these decisions? Can we create a science of daily life, almost a science of the mind as the mind or the person confronts the very ordinary, quotidian situations, which make up day to day living?

There are, of course, academic studies, although far fewer than one might guess, especially in the world of beauty. Studies of beauty as they pertain to daily life tend not to be the topic of science, although when one searches hard enough, there are many papers, most about beauty in the culture rather than beauty and specifically hair as a topic of science, from the person’s point of view [1–5]. There is, of course, a literature on beauty from the point of view of science, although this information tends to be clinical, even though it deals with an emotionally important topic [6,7] The real and often riveting information about one’s experience with beauty, decision-making, and actions comes from the popular press, from news articles, and stories to interest lay readers, who find utterly fascinating these stories about beauty and its many facets [8–12].

Mind Genomics as an organizing principle

In the world of products, services, and marketing, professionals are realizing that it is increasingly impossible to make judgments about business tactics without the necessary evidence. In previous decades the beauty business as well as the perfume business were dominated by peoples who we would call ‘business titans’ when running a large corporation, or superb professionals when designing products, especially perfumes. The cosmetic industry was spared some of the cult of personality because it had to deal with product functionality as well as product image. Nonetheless, the cult of personality left a legacy of relatively little knowledge about the mind of the customer. Compared to the world of food, the world of cosmetics and beauty is lacking in depth knowledge of customers, and is still heir to some of the forces of charismatic personalities.

Author Moskowitz has developed a new approach to understanding the consumer, not so much based on conventional research such as focus groups, surveys, or tracking studies, as based on the world-view of experimental psychology. The approach is morphing into an emerging science called Mind Genomics, which is executed as a survey but in fact is an experiment to probe the mind of the customer[13–16].

A good analogy for Mind Genomics, elaborated below, is ‘the MRI of the mind.’ The intellectual history of Mind Genomics can be traced to the pioneering work of psychologists and statisticians [17], as expanded by Green and his associates at the Wharton School of Business, The University of Pennsylvania [18,19].

The fundamentals of Mind Genomics are simple, elaborated in the four steps below:

  1. EXPERIMENT: Approach the topic as an experiment, present test ideas (message) in combinations (vignettes), acquire ratings, and deconstruct the ratings to the contribution of the individual ideas. The statistics involved are subsumed under the rubric of experimental design [20].
  2. MIND-SETS: Identify different mind-sets, defined as arrays of ideas which focus on different aspects of the topic. The statistics involved are subsumed under the rubric of clustering, which places people or other objects into non-overlapping groups, based upon the pattern of features [21,22].
  3. ASSIGNMENT OF NEW PEOPLE TO MIND-SETS: Assign new people to a specific mind-set, based upon a short test. The approach is an algorithm developed by author Gere, and called the PVI, the personal viewpoint identifier
  4. SEND THE ‘RIGHT MESSAGE’ TO THE ‘RIGHT PERSON’ AT THE ‘RIGHT TIME.’ Present each person with the appropriate messages, defined as those messages which appeal to the mind-set [23].

Doing the Mind Genomics study

During the past 15 years the Mind Genomics protocol for research has become increasingly standardized in terms of the research choreography. The standardization enables the researcher to set up the study quickly, in a matter of hours, executed the study, and have results back in a matter of three-four hours, with the data analyzed. The rapid design, implementation, and analysis, has occurred because the Mind Genomics process has been ‘templated’. We present the research template here, a template that has been followed for many dozens of studies.

  1. Define the topic. For this study the topic is ‘what is important in one’s choice of a beauty hair consultant from the point of view of an ordinary individual?’ For the best results, the scope of the topic should be limited to a specific and well-defined topic, a topic which can be expressed in a single sentence. Most researchers need practice in order to define the topic in a succinct, operationally meaningful way, a way whose description can produce a word picture in the mind of an individual not familiar with the topic.
  2. Define a set of questions which tell a story. These questions (or silos) are never shown directly to the respondents in the Mind Genomics study. Rather, the questions are used to elicit answers (elements), these answers in turn shown to respondents in various combinations, as described below. It is worth noting that the most difficult part of the Mind Genomics study comes in this second step. Many researchers have a very hard time thinking in this structured, story-telling fashion. The discipline required to ask the series of related questions comes with practice, and in some ways the Mind Genomics process ‘re-wires’ the mind of the respondent. Table 1 presents the four questions, and the four answers for each question.
  3. Combine these answers into short, easy to read combinations, so that the respondent can quickly read and evaluate. Figure 1 (left panel) shows an example of a vignette as the respondent will see it, with the view being the smartphone. The same vignette can be configured for a tablet or a personal computer, as shown in Figure 1 (right panel.)

Table 1. The raw material for the Mind Genomics study, comprising four questions which ‘tell a story’ and four answers to each question. HBC = Hair Beauty Consultant

Question 1 –What does the HBC do?

A1

often works with hair which is falling out

A2

works with overly oily hair

A3

gives real professional advice

A4

works with people who are not able solve their hair problem

Question 2 – Why would you want THIS particular HBC

B1

hair consultant is known by friends

B2

hair consultant writes for social media

B3

beauty salons often recommend

B4

hair consultant gives courses for new hair professionals

Question 3 –What does the HBC deliver?

C1

thorough discussion after examination

C2

present alternative best 2 or 3 solutions

C3

present products and/or treatments for the client

C4

present products for the clients

Question 4 –How do the client and HBC interact

D1

client has long term relationship … personal project

D2

client has project and monthly visits

D3

client gets reduced salon prices as part of treatment

D4

weekly meetings on computer to SEE and DISCUSS progress

Mind Genomics-020 - Choosing A Hair Consultant A Mind Genomics Exploration in the Realm of Beauty - AWHC Journal_F1

Figure 1. Examples of a vignette, as it appears on the screen of a smartphone (left), and the same vignette as it appears on the screen of a tablet or personal computer (right)

The vignette shown in Figure 1 contains no connectives. Rather, the elements are placed on the page, left-justified, one element following another, the elements on separate lins Often, those who will use the research findings feel that it is impossible for the consumer respondent to rate the combination because the elements seem to have been thrown together haphazardly. Most of the experience of researchers working in the evaluation of combinations of ideas has been focused on getting the stimulus, the vignette, ‘just right,’ connectives and all, with the vignette appearing as a paragraph. That paragraph format, so rational and acceptable to many, becomes, in fact, quite onerous to read after the respondent has read and rated 3–4 of these paragraphs.

Mind Genomics works within a different world view, focusing on presenting messages as they are presented in the real world, unconnected, almost ‘thrown’ at the respondent. It is the job of the respondent to make a judgment as in real life. The structure is difficult to discern, so that in the end, most of the respondents simply ‘give up,’ and assign ratings according to their intuition, System 1 in the words of Nobel Laureate Daniel Kahneman [24].

Despite the apparent randomness of the combinations, nothing could be further from the truth. The reality is that the vignettes, the test combinations, are crafted through an underlying experimental design which prescribes the precise set of 24 combinations to make, so that each element appears equally often, all 16 elements appear in a statistically independent fashion, each vignette comprises 2–4 elements and at most one answer from each question (i.e, at most one element from each silo). A permutation scheme ensures that each respondent evaluates different combinations. That is, the combinations tested by one respondent are different from the combinations tested by any other respondent. The permutation scheme is discussed by Gofman&Moskowitz [25], based upon a patent [26].

Table 2 presents data from the first eight vignettes from a respondent, along with the preparation of the design and data for analysis by OLS (ordinary least-squares) regression. The respondent’s ID number is 7. The Mind Genomics system does not record WHO the respondent IS, but records the date of birth and the gender. Thus, it is possible to use age and gender as stratifying variables. The respondent in this study was also asked about the concern with their hair. Two of the four responses were either not concerned or only mildly concerned with their hair. Respondents choosing one of these two answers were put into the group stating that there was little or no concern. The remaining respondents chose answers reflecting modest or strong concern, and were put into the second group, who are concerned with their hair.

Table 2. Experimental design underlying the vignettes

Panelist

7

Gender

Female

Age

65

Hair Conc

Yes

Mind Set#

3

Vig1

Vig2

Vig3

Vig4

Vig5

Vig6

Vig7

Vig8

Design

Question A

3

4

4

4

2

0

1

3

Question B

0

2

3

4

2

2

3

4

Question C

3

4

1

2

0

0

2

1

Question D

2

4

2

0

3

1

1

1

Binary Recode

A1

0

0

0

0

0

0

1

0

A2

0

0

0

0

1

0

0

0

A3

1

0

0

0

0

0

0

1

A4

0

1

1

1

0

0

0

0

B1

0

0

0

0

0

0

0

0

B2

0

1

0

0

1

1

0

0

B3

0

0

1

0

0

0

1

0

B4

0

0

0

1

0

0

0

1

C1

0

0

1

0

0

0

0

1

C2

0

0

0

1

0

0

1

0

C3

1

0

0

0

0

0

0

0

C4

0

1

0

0

0

0

0

0

D1

0

0

0

0

0

1

1

1

D2

1

0

1

0

0

0

0

0

D3

0

0

0

0

1

0

0

0

D4

0

1

0

0

0

0

0

0

Response Data

Rating

7

6

6

6

6

5

7

6

Top 3 (6–9 → 100; rest → 0)

100

0

0

0

0

0

100

0

Bot 3 (1–3 → 100; rest → 0)

0

0

0

0

0

0

0

0

Response Time (Seconds)

5.4

7.2

9

6.2

3.9

6.8

8.6

5.9

The basic information we have about the respondent is that she is a 65-year-old female who states that she is concerned with her hair. Furthermore, as we will see later in the paper, the respondent falls into Mind-Set #3, based upon the pattern of her responses. The assignment of respondents to one of a set of complementary, mutually-exclusive and exhaustive mind-sets for this particular topic of hair care consulting provides yet a fourth way to define WHO the respondent is, this time based upon how the respondent thinks about hair beauty consultants.

Below the respondent specifications are listed the identification code for the test elements which appeared in vignettes 1–8, respectively. Each vignette has at most one element from each silo, or one answer from each question, but in reality there are vignettes entirely lackingan answer to one question (e.g., vignette 1 lacks an answer to Question B), and vignettes entirely lacking an answer to two questions (e.g., vignette 6 lacks an answer to both Question A and Question C, respectively.) Respondents have no problem evaluating vignettes which are incomplete, since respondents ‘graze’ for information, rather than slavishly read the vignette word by word.

As the experimental design is laid out, most computer programs have a difficult time analyzing the data. The experimental design is not intrinsically numeric, but rather descriptive. It is important to transform the data to a form that the statistics program can use. One very straightforward way to prepare the data for analysis recodes the experimental design to 0’s (when an element is absent from a vignette), or 1’s (when an element is present.)

Table 2 further shows the recoding of the design from four rows to 16 rows. Each row corresponds to one of the 16 elements. There are 16 rows, labelled A1 to D4, to represent each of the 16 answers or elements in a vignette. Each column, in turn, corresponds to one of the eight vignettes. The cells show the coding of a specific vignette and a specific element. When the cell has a ‘1’, the vignette contains that element. When the cell has a ‘0,’ the vignette lacks that element. Looking down at the composition of one vignette, we see at most four ‘1’s and the rest ‘0’s, which tells the computer program and the researcher that the vignette has no more than four elements, and tells the program which specific four (or three or two) elements are present in the vignette.

Below the binary recording are the response data, comprising the actual rating (1–9), the binary transform for positive responses (7–9 → 100, 1–6 → 0), the binary transform for negative responses (1–3 → 100; 4–9 → 0), and the response time in sections. The binary transform is used in the spirit of consumer research, which continues to present data to the end-user as binary, NO vs YES. The specific division of the 9-point scale into the two asymmetric halves, 1–6 versus 7–9 was done following the standard research protocol used in Mind Genomics studies since the late 1980’s, 30+ years ago.

The arrangement of the data in the form shown in Table 2 allows the computer program to process the data in a numeric form, creating a ‘model’ or equation. The model or equation shows how the presence/absence of the elements in a vignette ‘drive’ the response. The creation of these models, the interpretation of their meaning, and the application of the results to practical issues will be the topic of the rest of this paper.

Results

How do individual respondents rate the vignettes?

Each respondent rated 24 different vignettes. We have two transformation or recodings of the same data, a positive recoding for liking, and a negative recoding for disliking. The transformation of the vignettes tells us whether, for the particular vignette the respondent ‘likes’ the vignette (positive recoding: ratings 7–9 → 100), whether the respondent dislikes the vignette (negative recoding: ratings 1–3 → 100) or whether respondent is indifferent (neither like nor dislike).

The average transformed rating for each respondent shows the proportions of positive versus negative average responses. A respondent who liked every one of the 24 vignettes would have a value of 100 across the 24 vignettes for the transformation of ‘like’. That respondent would have all 0’s for the recoding for dislike. Thus the average of the positive recodes for an individual tells us the degree to which the individual ‘likes’ everything. The average of the negative recodes for the same individual tells us the degree to which the individual ‘dislike’ everything.

When we plot the average likes (abscissa, X axis) versus the average dislikes (ordinate, Y axis), with one point for each respondent,
Figure 2 shows us that most of the respondents cluster either at the bottom of the graph (like most of the vignettes, dislike none or a few), or cluster at the left side of the graph (*dislike most of the vignettes, like none or a few). Respondents are polarized. They either like or dislike what they read. There are only a few respondents who show indifferent responses. These would be in the middle of the graph.

Mind Genomics-020 - Choosing A Hair Consultant A Mind Genomics Exploration in the Realm of Beauty - AWHC Journal_F2

Figure 2. Scatterplot, showing the distribution of positive and negative averages regarding the rating of the 24 vignettes, after the binary transform. Each letter corresponds to a respondent. Y = respondent says concerned with hair; N = respondent says not concerned with hair.

When we classify the respondents by their self-stated concern with hair, we can represent them by N (not interested) or Y (interested). Figure 2 suggests that those who say that they are concerned with their hair tend to be more positive, on average, and those who say that they are not concerned with their hair tend to be more negative, both with respect to rating the vignettes.

Creating a model by OLS, ordinary least-square regression

The essence of Mind Genomics is to understand the specific ‘drivers’ of responses, which in our case becomes the specific messages driving a respondent to say: ‘I am interested in a beauty consultant.’ The rating scale conveys that interest, doing so for the different vignettes that were created. The notion of exposing respondents to different combinations comes from the world of human experience, where the most typical situation confronting a person is a set of features or items in an environment, and the reaction of the person to that combination. It is often impossible for a person to identify the particular features of the combination confronting the person responsible for the subsequent action taken by the person.

When the researcher combines the different elements or messages into a combination using experimental, the above-mentioned vignette, the issue identifying the ‘driving’ element is made simpler. Various statistical techniques falling into the general statistical system called ‘regression’ relate the independent variables, those features driving the response, to the dependent variable, the nature of the response itself. There is simply a need to ensure that the predictor variables of interest are ‘statistically independent,’ and not strongly linked with each other. Regression disentangles the response to the mixture into the contributions of the components of the mixtures, in our cases the messages

We use OLS (ordinary least-squares) regression to relate the presence/absence of the 16 elements to the rating, in our case defined as the 0/100 after binary transformation. Table 2 showed us the way the data are formatted. We know the combination, and we measure the response. For then regression analysis whose results are shown in Table 3, we combined the data from all respondents who are members of the class, ‘class’ or ‘group’ defined as total, as gender, as age, or as self-defined concern with one’s hair.

Table 3. Performance of the elements by total panel and key self-defined subgroups

Coefficients of the model relating the presence/absence of elements to ‘Interested’ (Top2 (4 and 5 on 5-point scale of interested))

Total

Male

Female

Age 18–29x

Age 30–49x

Age 50+x

Concern YES

Concern NO

Base size

Additive constant

25

21

28

-19

25

50

17

39

B2

hair consultant writes for social media

6

10

2

15

4

5

0

16

B4

hair consultant gives courses for new hair professionals

3

4

1

6

-1

8

-2

10

D1

client has long term relationship … personal project

3

0

7

12

1

1

3

3

A2

works with overly oily hair

2

-3

8

5

-2

9

6

-4

D4

weekly meetings on computer to SEE and DISCUSS progress

1

-5

7

12

-1

-2

1

-1

D2

client has project and monthly visits

1

0

2

9

2

-3

3

-3

C2

present alternative best 2 or 3 solutions

0

3

-3

22

-3

-2

-3

6

C3

present products and/or treatments for the client

0

4

-4

13

-5

2

-3

5

B1

hair consultant is known by friends

0

-1

2

7

-4

3

-3

4

A1

often works with hair which is falling out

0

-3

3

2

-1

1

5

-6

C1

thorough discussion after examination

-1

-2

-1

22

-5

-5

1

-3

B3

beauty salons often recommend

-2

-1

-2

11

-4

-3

-5

3

C4

present products for the clients

-2

0

-5

13

-6

-4

-4

2

D3

client gets reduced salon prices as part of treatment

-2

-3

1

9

-4

0

-2

-1

A3

gives real professional advice

-3

-4

-2

6

-5

-4

-2

-4

A4

works with people who are not able solve their hair problem

-3

-5

0

7

-7

-1

-1

-6

Table 3 shows the key information emerging from the regression analyses. We interpret the data in the following way:

  1. The additive constant. This value is the estimated percent of responses to the vignette that would be 100 (viz., originally 4–5) in the absence of elements. The reader will at once realize that all vignettes comprised as many as four elements, as few as two elements, and never one or no elements, respectively. Thus, the additive constant is a baseline value, purely an estimated parameter.
  2. The additive constant can be interpreted as a baseline of acceptance, when we look at the binary transformed data. It is the estimated percent of responses that would be 4–5 on a 5-point scale in the absence of elements. When our goal is to achieve a high total score, beginning with a high additive constant means that the basic feeling towards the product or the service is strong, and the element do not have to do much work. With a low additive constant, the opposite is the case, and the elements must do ‘all the work.’ The additive constant need not be a positive number. The mathematics behind the additive constant and the individual element-linked coefficients, regression analysis, does not set limits on the additive constant
  3. The additive constants range dramatically, from a high of 50 for respondents ages 50+ (older respondents are basically interested in a hair consultant), to a low of -19, virtually 0 for respondents ages 18–29 (younger respondents are basically uninterested in a hair consultant.)
  4. Surprisingly, those who say that they are concerned about their hair are less interested in the hair beauty consultant (additive constant = 17), versus those who say that they not concerned about their hair (additive constant = 39).
  5. The data suggest that it will be the elements which make the difference.
  6. To make reading the data easier, we have shaded all elements which achieve a coefficient of 8 or higher in any subgroup. Studies using Mind Genomics suggest that the statistical value significance is around 8 or so, using the principles of inferential statistics. Observations by author Moskowitz using these data in many studies further suggest that when the coefficient is 8 or higher, the element performs well in other applications, such as advertising.
  7. The total panel shows no elements which drive interest. Although this finding may be disconcerting to many, since research is presumed to show opportunities, the reality is that most of the messages studied by Mind Genomics simply do not persuade, do not drive people to try the product, use the service. Even though a message may have been used for years does not make the message by definition ‘sacred,’ and an accepted part of one’s marketing and sales portfolio.
  8. Dividing respondents by ender shows similar additive constants, but only one strong element, that element appealing to males: B2 – hair consultant writes for social media
  9. Dividing respondents by age shows an exceptional number of messages appealing to the younger respondent, age 18–29

present alternative best 2 or 3 solutions
thorough discussion after examination
hair consultant writes for social media
present products and/or treatments for the client
present products for the clients
client has long term relationship … personal project
weekly meetings on computer to SEE and DISCUSS progress
beauty salons often recommend
client has project and monthly visits
client gets reduced salon prices as part of treatment

The older respondents (age 50+) show only two very strong elements
works with overly oily hair
hair consultant gives courses for new hair professionals

Those who say that they are not concerned with their hair
hair consultant writes for social media
hair consultant gives courses for new hair professionals

Difference mind-sets searching for hair care

The premise of Mind Genomics is that in any topic area where human decisions are made on the basis of exterior information, there exist different groups of ideas which ‘travel together.’ These ideas are called mind-sets. They are embodied in an individual who is said to ‘hold’ a specific mind-set, but they are not the individual. They are cohesive sets of ideas. We only discover these ideas, however, through experimentation. We need people to help us reveal these mind-sets.

The mind-sets are discovered by a simple statistical method called ‘clustering,’ which puts together different things (e.g. ideas) based upon the similarity of their patterns. Clustering does not necessarily reveal fundamental, basic ideas, although it may. Rather, clustering is a heuristic, designed to create smaller, non-overlapping groups from a large, perhaps inchoate group of items a group without seeming commonalities.

Clustering comes in many variations. With each variation of the clustering method emerges a different set of clusters, or in our case, mind-sets. The fact that there is not a perfect set of fundamental groups should not be a cause for upset. All clustering attempts to do is to find approximately different groups, so that these groups can be treated in a more appropriate way for themselves. Rather than assuming all people to be identical in what they want, or to assume that each person is totally unique, making personalization almost unachievable, clustering finds approximations to different grounds, which can be then studied separately to see the messages to which they respond.

Mind-set segmentation in Mind Genomics enjoys the benefit of segmenting a population on the basis of the precise words that will be used to send them offers. That is, instead of segmenting or clustering the population on the basis of some factors which clearly divide them, and then looking for the messages appropriate for each segment, Mind Genomics segments the people on the messages that are relevant to the topic. The segmentation is more crystallized by Mind Genomics because the segments are created on precisely the topic which is being explored.

The mechanics of clustering for these data follow the now-standard process for Mind Genomics studies. We begin by computing a ‘distance’ between every pair of respondents, that distance computed by a simple formula: D = (1 – Pearson Correlation). The Pearson Correlation coefficient tells us the degree of linear relation between two variables. When two variables are perfectly related to each other in a positive sense, the Pearson Correlation is +1 so the variable D becomes 0. This makes intuitive sense. The two variables behave identically. When two variables are perfectly correlated, but moving in opposite directions, the Pearson Correlation is –1, so the variable D becomes 2.

The clustering algorithm works with these distances, to put the different respondents into either two or three non-overlapping clusters or mind-sets. The process attempts to make the set of distances D values, have as great a value for the distances between clusters or mind-sets, and at the same time have a small value for the distances between members within a cluster.

Table 4 shows the coefficients for the total panel, for the two complementary Mind-Sets when we extract two clusters, and the three complementary Mind-Sets when we extract three clusters. We do not know which group of Mind-Sets to choose. Thus far, the process has been strictly mathematical, working with the values of the abovementioned variable ‘D’ or distance between upon the Pearson Correlation.

Table 4. Performance of the elements by total panel, two emergent mind-sets and three emergent mind-sets.


Total

Mind-Set 2A

Mind-Set 2B

Mind-Set 3C

Mind-Set 3D

Mind-Set 3E


Additive constant

25

15

35

27

33

15

Mind-Set C1 – Not really interested in anything, not a prospect for a hair beauty consultant

Mind-Set C2 – Want a hair consultant who is clearly an expert, and ‘knows’ people and products

B2

hair consultant writes for social media

6

2

10

3

11

3

C3

present products and/or treatments for the client

0

-1

1

-5

7

-6

B4

hair consultant gives courses for new hair professionals

3

0

6

-1

6

3

Mind-Set C3 – Want a hair beauty consult who is involved in a long-term relation with client

D1

client has long term relationship … personal project

3

6

0

-1

-2

11

A2

works with overly oily hair

2

6

-2

-7

2

10

D4

weekly meetings on computer to SEE and DISCUSS progress

1

6

-5

-6

-4

10

D2

client has project and monthly visits

1

4

-3

0

-2

6

B1

hair consultant is known by friends

0

-1

1

-3

0

3

A1

often works with hair which is falling out

0

5

-4

4

-5

3

D3

client gets reduced salon prices as part of treatment

-2

0

-3

-3

-5

3

C1

thorough discussion after examination

-1

5

-7

-2

-3

1

C2

present alternative best 2 or 3 solutions

0

1

0

-1

3

-2

B3

beauty salons often recommend

-2

-2

-2

-1

-1

-2

A4

works with people who are not able solve their hair problem

-3

-1

-3

-6

1

-3

A3

gives real professional advice

-3

-2

-3

-7

0

-3

C4

present products for the clients

-2

0

-4

-5

1

-4

We employ two criteria to add judgment to the process:

  1. Parsimony. When clustering, the better solution should be the smaller solution, but still one that can be interpreted immediately, because it makes sense. In our study we have extracted both two and three Mind-Sets. We do not know which of these two we will select. Both are parsimonious.
  2. Interpretability. The clusters or Mind-Sets should ‘tell a story,’ and an obvious one. When we look at Table 4, we see that there are few strong performing elements when we extract two Mind-Sets by clustering. In contrast, when we extract three Mind-Sets, we find three interpretable groups:

Mind-Set C1 – Not really interested in anything, not a prospect for a hair beauty consultant

Mind-Set C2 – Want a hair consultant who is clearly an expert, and ‘knows’ people and products

Mind-Set C3 – Want a hair beauty consult who is involved in a long-term relation with client

Finding these respondents in the population

How one finds these Mind-Sets in the population has challenged researchers for a number of years, ever since the issue of applying the data to commercial and social uses has arisen. Decades ago, the market researcher William Wells introduced the idea of psychographic segmentation [23], suggesting that people could be divided by their minds and values. This led to lifestyle segmentation, based upon the way a person lives, and afterwards to behavioral segmentation, especially when shopping on the web. All of these segmentations work, dividing the people, but not identifying what to say for the specific situations of one’s life, the daily micro-worlds in which we live. Mind Genomics does so, but faces the same problem as all other segmentations based upon how people think.

An analysis of who the respondents are by age, gender, and interest in caring for one’s hair suggests that these Mind-Sets are spread through the population in a way that cannot be predicted easily from knowing WHO the respondent is, or CONCERN that the respondent has about her or his hair. Thus, we are left with a powerful finding about the mind of the prospective client for hair beauty consulting, yet the frustration of knowing that although these prospects exist, they cannot easily be identified. In fact, they not even know that they are prospective clients.

Author Gere has developed the PVI, the personal viewpoint identifier, which allows a respondent to answer six questions based upon the 16 answers shown in Table 1. Figure 3 shows the six questions, and the two possible answers from each question. The pattern of answers from a single is used in conjunction with the table of coefficients (Table 4). There are 64 possible patterns of responses, when the question has two possible answers. The 64 patterns are mapped to membership in one of the three Mind-Sets. Once the person has completed the PVI, in 30 seconds or faster, the person’s mind-set can be discovered, least with less guessing than before. Figure 4 shows the feedback for each mind-set. This feedback can either be given to the respondent and/or stored by the researcher/consultant for future efforts with this particular individual. The actual link to the PVI for this study as of this writing (June, 2019) can be found at: http: //162.243.165.37: 3838/TT33/

Mind Genomics-020 - Choosing A Hair Consultant A Mind Genomics Exploration in the Realm of Beauty - AWHC Journal_F3

Figure 3. The PVI for the Hair Beauty Consultant

Mind Genomics-020 - Choosing A Hair Consultant A Mind Genomics Exploration in the Realm of Beauty - AWHC Journal_F4

Figure 4. The feedback from the VPI. Each mind-set has its own feedback, sent either to the beauty consultant and/or the client.

Beyond what interests to what engages – Response time

The foregoing sections reveal the dramatic differences among respondents in the degree to which specific messaging appeals to them. Another dimension of important is engagement, the degree to which a specific message engages attention by being read.

The Mind Genomics system measures the response time for each vignette, doing so to the nearest tenth of a second. Since the experiment is conducted on the Web, without any supervision, occasionally (about 10% of the time) the response time is exceedingly long, last 10 seconds or longer, a time that other studies have shown to be exceptionally long. For all response times exceeding 9.0 seconds, we truncated the response time to 9.0 seconds.

Figure 5 shows the average response times across the 24 vignettes for each respondent. The respondent either one who defines herself/himself as concerned about hair (Y) or not concerned about hair (N). Our ingoing hypothesis was that those respondents who say that they are concerned about hair would spend, on average a longer time reading the vignette. We reject the hypothesis. The response times are similarly distributed, so any difference in average across all respondents would be minor at best.

Mind Genomics-020 - Choosing A Hair Consultant A Mind Genomics Exploration in the Realm of Beauty - AWHC Journal_F5

Figure 5. Average response times across the 24 vignettes. Each letter corresponds to a respondent, who self-defines as either concerned about their hair (Y) or not concerned about their hair (N).

The degree to which the individual elements can engage may also be estimated using regression analysis. The ingoing experimental design is known for each respondent, as is the response time in seconds. We can create a simple model relating the presence/absence of the 16 elements to the response time. The model is written without an additive constant, under the assumption that in the absence of elements the response time would be 0 seconds. The equation is expressed asResponse Time = k1(A1) + k2(A2) … K16(D4)

Table 5 shows the coefficients for the response time models. The models were estimated from all the data relevant for the key subgroup. That is, the only data used to estimate the model for males are the data from males. Similarly, the only data used to estimate the model for Mind-Set 3E are respondents in Mind-Set 3E.

Table 5. Engagement – The estimated response times attributed to each message or element.


Total

Male

Female

Age 16 to 29

Age 30 to 49

Age 50 Plus

Concern YES

Concern NO

Mind-Set 3C Not Interested

Mind-Set 3D An expert

Mind-Set 3E Personally involved

C2

present alternative best 2 or 3 solutions

1.3

1.3

1.2

-0.1

1.5

1.6

1.5

0.8

1.0

1.6

1.2

D3

client gets reduced salon prices as part of treatment

1.2

1.1

1.4

0.9

0.8

2.1

0.9

1.6

1.0

1.4

1.2

B4

hair consultant gives courses for new hair professionals

1.1

0.8

1.5

1.3

0.9

1.5

1.2

1.1

1.3

0.7

1.4

D4

weekly meetings on computer to SEE and DISCUSS progress

1.1

1.2

1.1

0.6

0.8

2.1

1.1

1.0

1.1

1.3

1.1

A4

works with people who are not able solve their hair problem

1.1

0.9

1.3

-0.1

1.2

1.8

0.9

1.5

1.2

0.9

1.1

C1

thorough discussion after examination

1.1

0.5

1.6

0.1

0.8

2.2

1.1

0.9

1.0

1.1

1.1

B3

beauty salons often recommend

1.1

1.1

1.0

1.6

0.9

1.1

1.0

1.2

0.6

1.3

1.1

B2

hair consultant writes for social media

1.0

1.0

1.2

0.7

0.9

1.5

1.2

0.9

0.9

0.8

1.4

B1

hair consultant is known by friends

1.0

1.0

1.1

0.7

1.0

1.5

1.2

0.8

0.6

0.9

1.4

C3

present products and/or treatments for the client

1.0

1.1

0.9

-0.4

1.1

1.7

1.0

1.1

1.2

1.1

0.8

C4

present products for the clients

1.0

1.0

0.9

0.3

1.2

1.0

1.0

1.0

1.1

0.7

1.2

D2

client has project and monthly visits

0.9

0.9

0.9

0.6

0.5

1.7

0.7

1.2

0.5

0.9

1.2

D1

client has long term relationship – personal project

0.8

0.8

1.0

0.1

0.6

1.6

0.7

1.0

0.8

0.8

0.9

A3

gives real professional advice

0.6

0.6

0.6

-0.1

0.4

1.1

0.4

0.9

0.4

0.6

0.6

A1

often works with hair which is falling out

0.4

0.3

0.6

-0.1

0.4

0.6

0.1

1.0

0.3

0.5

0.5

A2

works with overly oily hair

0.3

0.4

0.1

0.3

0.2

0.4

-0.1

1.0

0.1

0.6

0.0

Table 5 suggests some two simple rules of thumb:

Rule 1 – To engage (although not necessarily to persuade) talk about the process, painting a word-picture of what the client gets as an individual

present alternative best 2 or 3 solutions
client gets reduced salon prices as part of treatment
hair consultant gives courses for new hair professionals

Rule 2 – To not engage, be general, and talk about the problem being solved

gives real professional advice
often works with hair which is falling out
works with overly oily hair

Discussion

The results of this study give a sense of the complexities of daily life. Rather than attempting to introduce a new ‘theory’ of consumer behavior (top down thinking) using a mundane issue such as choosing a hair beauty consultant to confirm or falsify the tenets of such a ‘theory,’ Mind Genomics moves in an orthogonal direction, to ‘map’ the mind. There is no theory, for which the topic of beauty consultant can affirm or falsify. Rather, there is the important effort to be a ‘cartographer’ of the mind, to understand the nature of what confronts people in the every-day, and then construct a science of this ‘ordinariness.’ As these data suggest, the ‘ordinary’ is quite far from simple. There are different mind-sets to be uncovered, different messages which engage versus which are skipped over, and so forth. Indeed, the every-day is far from mundane, but rather presents an entirely new world for science to explore, a world where the discipline of science can fruitfully inform the daily rhythm of life.

Three directions using these results

Our efforts to understand the mind of the consumer when choosing a hair beauty consultant move us in three different directions.

  1. The decision criteria of everyday. The study revealed two major segments with diverse interests. One is interested in the topic, in the expertise, and probably in the facts. The other is interested in a personal relation. We might move beyond the specifics of hair care consulting, and ask whether this type of division, expertise-respecting vs relationship-seeking, characterize other types of subjects, beyond hair care. Could the experiment with Mind Genomics have uncovered a general division of the mind? And, following the proposition that there are these two main mind-sets, does a person ALWAYS fall into one mind-set or the other, or is the membership labile, a function of the topic, and who the person IS at the moment of the study.
  2. Applying science for practical benefit. In many disciplines, the mere thought that the data could be used for practical decision-making means that the data are not appropriate for science. Mind Genomics in general, and the results from this study in particular, enable the user to conduct business and daily life in a more efficient manner. Knowing what specific messages to give to a person based upon the person’s mind-set, AND having a way to assign a person to a mind-set, are extremely important for today’s world, for commerce. Increasingly, people are feeling that they don’t want commercial organizations to ‘track their behavior,’ because they feel that such tracking violates the ingredient. Indeed, recent developments in privacy have led to the adoption of a major privacy initiative [27], designed to avoid gathering and using too much data about a person. Fortunately, the only information one needs of a private nature comes from the momentary interaction of a person (identity masked) and the attitudinal questions from the PVI. That data need not even be stored, but simply used at the instant of transaction in order to give a sense of the mind of the prospect to a company
  3. Creating a data warehouse for knowledge of beauty. The metaphor of Mind Genomics is that for each aspect of experience there are different ways to respond to that aspects, different features about the aspect, and of course, different messages. The objective of a Mind Genomics study is to ‘map’ these ways, to reveal the science of every-day. In recent years author Moskowitz and colleagues have suggested that another opportunity may be to create large-scale databases, of many studies within the same topic, here beauty. The studies are straightforward to design and to execute. The world of beauty itself may comprise dozens of different topics, each of which generates its own Mind Genomics study, and in turn each Mind Genomics study uncovers the mind-sets, and is finished off by the PVI, personal viewpoint identifier, for that topic. What might be the arc of knowledge if instead of one PVI completed by a person, 20 or more PVI’s were to be completed, for the wide arc of beauty. Each person would, in fact, generate a vector of some 20 different mind-sets to which a person might belong, based on the patterns of the individual’s separate PVI’s. Such a vector of PVI’s could form the basis of a deep understanding of the mind of people in a life-relevant area (beauty), with the membership patterns of hundreds of thousands of individuals established through a set of PVI’s correlated with biological factors, social factors, and one’s own intellectual/personality factors. Such is the promise of a Mind Genomics, the science of the everyday, with a simple demonstration here in this paper for a simple, but relevant topic to daily life, one’s hair.

Acknowledgment

Attila Gere thanks the support of the Premium Postdoctoral Researcher Program of the Hungarian Academy of Sciences.

References

  1. Chrisler JC (2007) Body image issues of women over 50. In Women Over 50: 6–25. Springer, Boston, MA.
  2. Chrisler JC and Ghiz L (1993) Body image issues of older women. Women & Therapy 14: 67–75.
  3. Gillen MM and Dunaev J (2017) Body appreciation, interest in cosmetic enhancements, and need for uniqueness among US college students. Body image 22: 136–143.
  4. Kasardo, Ashley E, Maureen C. McHugh (2015) “From fat shaming to size acceptance: Challenging the medical management of fat women.” The wrong prescription for women: How medicine and media create a “need” for treatments, drugs, and surgery, 179–201.
  5. Rhode DL ( 2009) The Injustice of Appearance. Stanford Law Review 1033–1101.
  6. Saltzberg E, Chrisler J, Disch E (2006) Beauty is the beast: Psychological effects of the pursuit of the perfect female body. Moral Issues in Global Perspective: Volume 2: Human Diversity and Equality 2: 142.
  7. Trüeb RM, Tobin D. eds. (2010) Aging hair. Springer Science & Business Media.
  8. Gillespie CH (2013) Down to the roots: A qualitative analysis of the psychological impacts of messages black women receive regarding their hair. Southern Illinois University at Carbondale.
  9. Linnan LA, Ferguson YO (2007) Beauty salons: a promising health promotion setting for reaching and promoting health among African American women. Health Education & Behavior 34: 517–530.
  10. Xu G, Feiner S (2007) Meinü Jingji/ China’s beauty economy: Buying looks, shifting value, and changing place. Feminist Economics 13: 307–323.
  11. Yan Y, Bissell K (2014) The globalization of beauty: How is ideal beauty influenced by globally published fashion and beauty magazines?. Journal of Intercultural Communication Research 43: 194–214.
  12. Yang J (2011) Nennu and shunu: Gender, body politics, and the beauty economy in China. Signs: Journal of Women in Culture and Society 36: 333–357.
  13. Moskowitz HR, Gofman A, Itty B, Katz R, Manchaiah M et al (2001) Rapid, inexpensive, actionable concept generation and optimization: the use and promise of self-authoring conjoint analysis for the food service industry. Food Service Technology 1: 149–167.
  14. Moskowitz HR (2012) ‘Mind genomics’: The experimental inductive science of the ordinary, and its application to aspects of food and feeding. Physiology & Behavior 107: 606–613.
  15. Moskowitz HR, Gofman A, Beckley J, Ashman H (2006) Founding a new science: Mind genomics. Journal of sensory studies 21: 266–307.
  16. Moskowitz HR, Gofman A, (2007) Selling blue elephants: How to make great products that people want before they even know they want them. Pearson Education.
  17. Luce RD, Tukey JW (1964) Simultaneous conjoint measurement: A new type of fundamental measurement. Journal of mathematical psychology 1: 1–27.
  18. Green PE, Rao VR (1971) Conjoint measurement for quantifying judgmental data. Journal of marketing research 8: 355–363.
  19. Green PE, Srinivasan V (1990) Conjoint analysis in marketing: new developments with implications for research and practice. The journal of marketing 54: 3–19.
  20. Box GE, Hunter WG, Hunter JS (1978) Statistics for experimenters, New York, John Wiley
  21. Dubes R, Jain AK (1980) Clustering methodologies in exploratory data analysis. Advances in Computers 19: 113–238.
  22. Zemel R, Gere A, Papajorgji P, Zemel G, Moskowitz H (2018) Uncovering consumer mindsets regarding raw beverages. In Food and Nutrition Sciences 9: 259–267.
  23. Wells WD ed. (2011) Life Style and Psychographics, Chapter 13: Life Style and Psychographics: Definitions, Uses, and Problems. Marketing Classics Press.
  24. Kahneman D, Egan P (2011) Thinking, fast and slow. New York: Farrar, Straus and Giroux.
  25. Gofman A, Moskowitz H (2010) Isomorphic permuted experimental designs and their application in conjoint analysis. Journal of Sensory Studies 25: 127–145.
  26. Moskowitz H, Gofman A, I novation Inc (2003) System and method for content optimization. U.S. Patent 6: 215,662.
  27. GDPR (General Data Protection Regulation), 2018, Wikipedia: https://en.wikipedia.org/wiki/General_Data_Protection_Regulation
  28. Moskowitz HR (2014) 14 Mind genomics→ and texture: the experimental science of everyday life. In” Food Texture Design and Optimization (Dar, Y.L. and Light, J.M. eds.,) John Wiley.
  29. Moskowitz HR, Porretta, Sebastiano, Silcher, Matthias (2005) Concept Research in Food Product Design and Development. Hoboken, New Jersey: Wiley-Blackwell Publishing. 612pp
  30. Van Kleef E, Van Trijp HC, Luning P (2005) Consumer research in the early stages of new product development: a critical review of methods and techniques. Food quality and preference 16: 181–201.