Monthly Archives: December 2018

Evaluation of use of a 0.9% sodium chloride nasal spray immediately after septoplasty and turbinectomy postoperative and its impact on patients’ quality of life

DOI: 10.31038/SRR.2018115

Abstract

Introduction: septoplasty and turbinectomy are one of the most frequently performed surgical procedures in otolaryngology, with reduced morbidity and mortality. It is known that the use of nasal saline solution increases the nasal mucociliary clearance, reducing the accumulation of secretion. However, despite being widely used, studies evaluating its efficacy in septoplasty and lower turbinectomy postoperative are still lacking.

Objective: To prove the benefit of Maresis (0.9% isotonic solution spray) in septoplasty and lower turbinectomy postoperative.

Method: Randomized, parallel, controlled, single-blind, single-center study, held at the IPO (Instituto Paranaense de Otorrinolaringologia), in which 106 patients underwent septoplasty and bilateral lower turbinectomy, divided into 2 groups (with and without application of Maresis) and compared objectively regarding the improvement in breathing, degree of mucosal edema, crusting and ease of crusts removal in the third and tenth day after surgery. Subjective evaluation regarding the obstruction, crusting and difficulty to sleep was also performed.

Results: The product shows a statistically significant result regarding the parameter ease of crusts removal and improved quality of sleep. Statistically significant differences for mucosal edema reduction and crusting were not observed between the two groups.

Conclusion: the use of Maresis® as an adjuvant in the treatment of immediate septoplasty and bilateral lower turbinectomy postoperative assists in the process of crusts removal and improving the quality of sleep in postoperative.

Key words

nasal spray. septoplasty. turbinectomy. post – operative. Nasal isotonic solution.

Introduction

Septoplasty and turbinectomy are one of the most frequently performed surgical procedures in otorhinolaryngology practice, with reduced morbidity and mortality [1].

The use of buffering in nasal surgeries used to be indicated for the prevention of the onset of bleeding, septal hematoma or synechia in postoperative, ensuring the coaptation of mucoperichondrium retail and cartilage stabilization2. However, it is known that its use presents possible complications, among the most common pain and discomfort in postoperative. In addition, the nasal buffering may cause hypoxia, oropharyngeal irritation, headache, crusting, synechia and secondary infection and is associated with a higher retention rate in the hospital and pain in postoperative. The nasal buffering is being less indicated routinely in postoperative for septoplasty and lower turbinectomy, since it has no proven benefit and increases the morbidity [2]. An alternative to this practice is the use of the transseptal suture, which presents a lower risk of complications [3–5].

It is expected that the patient’s recovery is as short and comfortable as possible, and any method that reduces surgical time and bring more comfort to the patient must be encouraged [5,6].

The most commonly post-operative treatments used include a combination of oral and local antibiotics, oral or local antihistamines with or without decongestants, oral and intranasal corticosteroids, and nasal rinsing with saline, isotonic or hypertonic solutions, as well as mucolytics and sympathomimetics. Adjuvant therapy aims to normalize the permeability of ostiomeatal complex by reducing the mucosal edema and promoting improved mucociliary system function [7].

Intranasal saline solutions have been used for clinical treatment of chronic rhinitis, sinusitis and post-operative care. Benefits include cleaning of nasal mucus, purulent secretions, cellular debris and crusts as well as the possibility of reducing the risk of synechia by cleaning the postoperative clots. Nasal wash cleans the upper airways and is a more conservative treatment as it has no adverse effects, it is the simplest of all, being cost-effective. In addition to removing the secretions, increases aeration of the nasal mucosa, leading to decreased local inflammation [8–11].

Maresis is a continuous jet nasal spray with a sterile sodium chloride isotonic solution, without vasoconstrictor and preservative-free. It does not alter the physiology of nasal mucosa cells and sinuses. It acts fluidizing the secretion of the nasal mucosa, favoring its removal, assisting in the treatment of nasal symptoms common to colds and flu and other respiratory disorders such as rhinitis, sinusitis and postoperative nasal surgery.

It is known that the use of nasal saline solution increases the nasal mucociliary clearance, reducing the accumulation of secretion. However, despite being widely used in clinical practice, the number of studies evaluating its efficacy in septoplasty and lower turbinectomy postoperative is still limited.

Objective

To assess the benefit and safety of Maresis® use in septoplasty and bilateral lower turbinectomy postoperative.

Methods

A phase IV, single-center, randomized, parallel, single-blind and controlled clinical trial held in IPO hospital between July 2014 and May 2015. Approved by the institution´s ethics and research committee.

It was based on the choice of patients referred for septoplasty and turbinectomy by nasal obstruction, operated under local anesthesia for the same surgical technique by three different surgeons belonging to the same team. Patients were randomized in two groups, with Maresis® (test group) or without (control group) and were evaluated in the postoperative period.

All patients met the inclusion and exclusion criteria and signed the Informed Consent Form before entering the study.

Inclusion criteria included age between 18 and 65 years; indication for septoplasty and bilateral lower turbinectomy with turbinate luxation; agreement to meet the requirements of the trial and attend the institute in the day(s) and time(s) defined for evaluations.

Exclusion criteria were the use of other nasal decongestant; use of analgesic and corticosteroid not described in the protocol; hypersensitivity to components of the formula; use of nasal topical medications; pregnant and lactating women; alcohol intake during treatment; associated surgery; use of Gelfoan; buffering and splint; patients who underwent surgery under general anesthesia and occurrence of post-operative complications (septal hematoma, heavy bleeding requiring buffering or return to the operating room or infection).

The withdrawal criteria were loss of follow up; loss, damage and/or misdirection of the sample causing discontinuation of use by the volunteer, adverse event preventing the continued use of the product being studied.

At the time of hospital discharge, subjects were randomized in two groups, with name, age and sex registries. In the test group, the patients used Maresis® six times a day, associated with the oral drugs, which included the use of acetaminophen 500 mg and pseudoephedrine hydrochloride 30 mg – every 8 hours for 3 days and prednisone 40 mg/day for 5 days. In the control group, only the oral drugs were administered.

The first return occurred after three days (ranging from two to four days). Patients were asked about the improvement of breathing until the third day and underwent a clinical evaluation performed by a blinded researcher physician, with analysis of the degree of mucosal edema (absent or mild, and medium or severe), crusting (absent or present, only at the incision, in up to 50% of the septum or more than 50% of the septum) and ease of removal of crusts (very easy, easy, difficult, or indifferent). The patients answered a questionnaire grading nasal obstruction, crusting and difficulty to sleep.

The second return occurred ten days after (ranging from nine to eleven). The initial evaluation was repeated and patients again answered to the initial questionnaire and about the use of the study product .

It proceeded to statistical analysis. Quantitative variables were summarized by the number of valid observations, mean, standard deviation, median, quartile range, minimum and maximum. Qualitative variables were described using frequency tables, including absolute (n) and relative (%) frequencies.

Superiority of Maresis ® associated with acetaminophen 500 mg and pseudoephedrine hydrochloride 30 mg + Prednisolone 40 mg compared to acetaminophen 500 mg associated to pseudoephedrine hydrochloride 30 mg + Prednisolone 40 mg was assumed if the 95% confidence interval lower limit calculated for the mean difference in clinical scale for improvement of obstruction and nasal crusting between the two treatments exceed the superiority margin δ =0,10.

The secondary endpoint, the difference in adverse events rate after 10 days of treatment was summarized by treatment group using data descriptive analysis. Expected treatment effect was provided together with confidence intervals, if applicable. If applicable, the descriptive p values for comparisons of the treatment groups were computed.

Other comparative analysis between Maresis® associated with acetaminophen 500 mg and pseudoephedrine hydrochloride 30 mg + Prednisolone 40 mg and acetaminophen 500 mg associated with pseudoephedrine hydrochloride 30 mg + Prednisolone 40 mg were made. Quantitative variables were compared using the T test for independent samples, or alternatively, the Mann-Whitney test, if not taken the assumption of distribution normality. Comparisons of qualitative variables were made using Chi-square test or Fisher’s exact test.

All hypothesis tests were performed bilaterally, considering a significance level of 5%, i.e., statistical significance was set at p <0.05.

Results

All of the 106 selected patients were randomized (53 in each treatment arm), but only 79 had their data validated for efficacy statistical analysis, totaling 45 patients in the test group and 34 in the control group.

The average age of study subjects was 31.04 ± 9.70 years in the test group and 33.44 ± 10.17 in the control group. No statistical differences were noted in gender, age and physical exams distribution (weight, height and BMI) between the two groups in the pre-treatment
(p > 0.05).

No statistical differences were observed between the clinical indications for the surgery in both groups. In both groups, all subjects had nasal obstruction as clinical indication for surgery; furthermore, 6.67% of the subjects in the test group had recurrent sinusitis and 4.4% had rhinogenic headache. The same symptoms were observed in 14.71% and 5.9% in the control group, respectively.

The efficacy of adding continuous jet nasal spray in postoperative was clinically evaluated according to three parameters: decreased mucosal edema, decreased crusting and ease of crusts removal. The results indicate that the product exhibits a statistically significant result on the parameter ease of crusts removal. No statistically significant differences were observed for reduced mucosal edema and crusting between the two groups (Table 1).

Table 1. Variables assessed by physicians for all patients in the study between visit 1 and visit 2.

 Intervention

N

Mean of difference

Standard deviation

Differences 95% confidence interval

Regarding mucosal edema

Maresis

45

0.58

1.033

–0.404; 0.442

Control

34

0.56

0.786

Regarding crusting, in which degree do you assess the current state of the patient?

Maresis

45

0.31

0.763

–0.547; 0.169

Control

34

0.50

0.826

Regarding ease of crust removal, how do you assess the current state of the patient?

Maresis

45

0.78

1.259

0.291; 1.500

Control

34

-0.12

1.387

* 95% Confidence Interval for mean differences of independent samples.

Three days after surgery, 37% of subjects in the test group did not present any difficulty to sleep versus 8.8% in the control group; furthermore, 20.6% of subjects in the control group reported great difficulty to sleep, while only 8.9% of those in the test group reported the same. These figures show that the test use in postoperative for septoplasty and turbinectomy improves ease into sleep (p <0.005). For the remaining parameters assessed by patients no statistically significant differences were observed. This perceived improvement was not maintained after 10 days of treatment (Tables 2 and 3). Ten days after surgery the evaluations were homogeneous between the groups (Table 2 and 3).

Table 2. Clinical variables of interest assessed by patients for all patients in the study in visit 1 (3 days after surgery).

Intervention

N

p value

How quickly could you breathe better after surgery?

Maresis

45

0.054

Control

34

How do you rate nose obstruction (blockage)?

Maresis

45

0.453

Control

34

How do you rate crusting in the nose?

Maresis

45

0.109

Control

34

Did you have difficulty to sleep?

Maresis

45

0.039

Control

* Chi-Square Test, Yates correction and Fisher’s test for comparison of independent samples proportions.

Table 3. Clinical variables of interest assessed by patients for all patients in the study in visit 2 (10 days after surgery).

Intervention

N

p value

How quickly could you breathe better after surgery?

Maresis

45

0.936

Control

34

How do you rate nose obstruction (blockage)?

Maresis

45

0.839

Control

34

How do you rate crusting in the nose?

Maresis

45

0.213

Control

34

Did you have difficulty to sleep?

Maresis

45

0.129

Control

34

* Chi-Square Test, Yates correction and Fisher’s test for comparison of independent samples proportions.

After 10 days of treatment, subjects in the test group assessed the degree of satisfaction with the product. Ninety-one percent of subjects were satisfied or very satisfied with the use of Maresis®; 100% of subjects considered the product as easy or very easy to apply and 93.3% would indicate the product.

To evaluate the safety of Maresis® use, information from the 106 randomized volunteers were considered. No serious adverse events were reported during the study. Ten adverse events were reported in the study, none of them related to Maresis®. According to the results, the addition of Maresis® to postoperative therapy did not lead to increased adverse events (p = 1.00).

Discussion

The positive results found in this study may be related to the amount of volume dispensed by Maresis®, as well as the technology of its nasal applicators, promoting adequate washing in patients’ nasal cavities.

The use of nasal isotonic saline solution is a simple and low cost procedure, which has been used for years to treat sinonasal tract diseases. Its use causes relief in signs and symptoms of these conditions, reduces the use of drugs and may help to minimize antimicrobial resistance [12].

Its use has proved to be well tolerated in patients with allergic rhinitis, leading to improvement of symptoms and must even be considered as adjuvant therapy to maintain the efficacy of nasal corticosteroid therapy at reduced doses, thus reducing the occurrence of possible side effects and the cost [13].

Pynnomen14 assessed the use of saline solution nasal spray and irrigation with higher amounts of saline solution with slight positive pressure in 127 patients with sinonasal symptoms, demonstrating that there is a greater improvement in symptoms with the use of nasal irrigation.

Frequently, topical saline solution has been prescribed, empirically, to lessen patients’ discomfort in nasal surgery postoperative. It is hypothesized that these sprays may perform such benefits by reducing mucus, clots, mucosal edema, and reduction in inflammatory mediators. Many studies refer to the importance of nasal rinsing with saline solution in improving the permeability and mucociliary clearance in clinical diseases [9–11]. However, despite the widespread use, there are still few studies demonstrating which solution works best and the advantages in the postoperative period, and, therefore, there is no conduct standardization.

Pinto15 analyzed the use of nasal spray on symptoms of nasal obstruction, secretion, headache and difficulty to sleep in postoperative endoscopic surgery. There was no evidence of benefit from the use of nasal sprays. This study differs from ours in which the ease in the removal of crusts and improvement in quality of sleep were statistically significant with the use of continuous jet spray.

Besides removing the secretions and crusts, nasal irrigation increases aeration of nasal mucosa, leading to reduction of local inflammation. Therefore, it improves the quality of life, as it reduces the accumulation of secretions resulting in symptoms of anterior and posterior rhinorrhea, and increases the air flow which was reduced due to these secretions [8,9,11]. Thus, it has preventive function of humidification and cleaning of airways from bacteria, allergens and irritants, favoring mucociliary clearance, providing comfort to the patient.

Conclusion

The results of the study indicate that the use of Maresis® as an adjunct in the treatment of immediate postoperative for septoplasty and bilateral lower turbinectomy assists in crusts removal process and improves patients’ quality of sleep. The addition of Maresis® to standard postoperative therapy is safe.

References

  1. Haroon Y; Saleh HA; Abou-Issa AH. (2013) Nasal soft tissue obstruction improvement after septoplasty without turbinectomy. Eur Arch Otorhinolaryngol. 270(10): 2649–55. [Crossref]
  2. Bernardo MT; Alves S; Lima NB; Helena D; Condé A. (2013) Septoplasty with or without postoperative nasal packing? Prospective study. Braz J Otorhinolaryngol. 79(4): 471–4. [Crossref]
  3. Thapa N; Pradhan B. (2011) Postoperative complications of septal quilting and BIPP packing following septoplasty. J Nepal Health Res Counc. 9(2): 186–8. [Crossref]
  4. Ghimire A; Limbu TR; Bhandari R. (2012) Trans-septal suturing following septoplasty: an alternative for nasal packing. Nepal Med Coll J. 14(3): 165–8. [Crossref]
  5. Yildirim G; Cingi C; Kaya E. (2013) Septal stapler use during septum surgery. Eur Arch Otorhinolaryngol. 270(3): 939–43. [Crossref]
  6. Quinn JG; Bonaparte JP; Kilty SJ. (2013) Postoperative management in the prevention of complications after septoplasty: a systematic review. Laryngoscope. 123(6): 1328–33. [Crossref]
  7. Aukema AAC, Fokkens WJ. (2004) Chronic rhinosinusitis: management for optimal outcomes. Treat Respir Med. 3(2): 97–105. [Crossref]
  8. Olson DE, Rasgon BM, Hilsinger RL. (2002) Radiographic comparison of three methods for nasal saline irrigation. Laryngoscope. 112: 1394–8. [Crossref]
  9. Hauptman G; Ryan M.W. (2007) The effect of saline solutions on nasal patency and mucociliary clearance in rhinosinusitis patients. Otolaryngol Head Neck Surg 137(5): 815–21. [Crossref]
  10. Ural, A; Oktemer, T.K; Kizil, Y; Ileri, F; Uslu, S.J. (2009) Impact of isotonic and hypertonic saline solutions on mucociliary activity in various nasal pathologies: clinical study. Laryngol Otol. 123(5): 517–21. [Crossref]
  11. Jurkiewicz, D; Rapiejko, P. (2011) Use of isotonic NaCl solution in patients with acute rhinosinusitis. Otolaryngol Pol. 65(1): 47–53. [Crossref]
  12. Papsin B, McTavish A. (2003) Saline Nasal Irrigation. Can Fam Physician. 48: 168–73.
  13. Chen JR, Jin L, Li X. (2014) The effectiveness of nasal saline irrigation (seawater) in treatment of allergic rhinitis in children. Int J Ped Otolaryngol. 78: 115–8. [Crossref]
  14. Pynnomen MA; Mukerji SS, Kim M, Adams E, Terrel JE. (2007) Nasal Saline for Chronic Sinonasal Symptoms. Arch Otolaryngol Head Neck Surg. 133(11): 1115–20. [Crossref]
  15. Pinto, J.M.;Elwany, S;Baroody, F.M.;Naclerio, R. (2006) Effects of saline sprays on symptoms after endoscopic sinus surgery. American Journal of Rhinology. 20(2): 191–196. [Crossref]
  16. Süslü, N; Bajin, M.D; Süslü, A.E; Oğretmenoğlu, O. (2009) Effects of buffered 2.3%, buffered 0.9%, and non-buffered 0.9% irrigation solutions on nasal mucosa after septoplasty. Eur Arch Otorhinolaryngol . 266(5): 685–9. [Crossref]
Laser Ablation of Hard-Tissues: a Review

DOI: 10.31038/SRR.2018114

Abstract

Introduction: septoplasty and turbinectomy are one of the most frequently performed surgical procedures in otolaryngology, with reduced morbidity and mortality. It is known that the use of nasal saline solution increases the nasal mucociliary clearance, reducing the accumulation of secretion. However, despite being widely used, studies evaluating its efficacy in septoplasty and lower turbinectomy postoperative are still lacking.

Objective: To prove the benefit of Maresis (0.9% isotonic solution spray) in septoplasty and lower turbinectomy postoperative.

Method: Randomized, parallel, controlled, single-blind, single-center study, held at the IPO (Instituto Paranaense de Otorrinolaringologia), in which 106 patients underwent septoplasty and bilateral lower turbinectomy, divided into 2 groups (with and without application of Maresis) and compared objectively regarding the improvement in breathing, degree of mucosal edema, crusting and ease of crusts removal in the third and tenth day after surgery. Subjective evaluation regarding the obstruction, crusting and difficulty to sleep was also performed.

Results: The product shows a statistically significant result regarding the parameter ease of crusts removal and improved quality of sleep. Statistically significant differences for mucosal edema reduction and crusting were not observed between the two groups.

Conclusion: the use of Maresis® as an adjuvant in the treatment of immediate septoplasty and bilateral lower turbinectomy postoperative assists in the process of crusts removal and improving the quality of sleep in postoperative.

Key words

nasal spray. septoplasty. turbinectomy. post – operative. Nasal isotonic solution.

Introduction

Septoplasty and turbinectomy are one of the most frequently performed surgical procedures in otorhinolaryngology practice, with reduced morbidity and mortality [1].

The use of buffering in nasal surgeries used to be indicated for the prevention of the onset of bleeding, septal hematoma or synechia in postoperative, ensuring the coaptation of mucoperichondrium retail and cartilage stabilization2. However, it is known that its use presents possible complications, among the most common pain and discomfort in postoperative. In addition, the nasal buffering may cause hypoxia, oropharyngeal irritation, headache, crusting, synechia and secondary infection and is associated with a higher retention rate in the hospital and pain in postoperative. The nasal buffering is being less indicated routinely in postoperative for septoplasty and lower turbinectomy, since it has no proven benefit and increases the morbidity [2]. An alternative to this practice is the use of the transseptal suture, which presents a lower risk of complications [3–5].

It is expected that the patient’s recovery is as short and comfortable as possible, and any method that reduces surgical time and bring more comfort to the patient must be encouraged [5,6].

The most commonly post-operative treatments used include a combination of oral and local antibiotics, oral or local antihistamines with or without decongestants, oral and intranasal corticosteroids, and nasal rinsing with saline, isotonic or hypertonic solutions, as well as mucolytics and sympathomimetics. Adjuvant therapy aims to normalize the permeability of ostiomeatal complex by reducing the mucosal edema and promoting improved mucociliary system function [7].

Intranasal saline solutions have been used for clinical treatment of chronic rhinitis, sinusitis and post-operative care. Benefits include cleaning of nasal mucus, purulent secretions, cellular debris and crusts as well as the possibility of reducing the risk of synechia by cleaning the postoperative clots. Nasal wash cleans the upper airways and is a more conservative treatment as it has no adverse effects, it is the simplest of all, being cost-effective. In addition to removing the secretions, increases aeration of the nasal mucosa, leading to decreased local inflammation [8–11].

Maresis is a continuous jet nasal spray with a sterile sodium chloride isotonic solution, without vasoconstrictor and preservative-free. It does not alter the physiology of nasal mucosa cells and sinuses. It acts fluidizing the secretion of the nasal mucosa, favoring its removal, assisting in the treatment of nasal symptoms common to colds and flu and other respiratory disorders such as rhinitis, sinusitis and postoperative nasal surgery.

It is known that the use of nasal saline solution increases the nasal mucociliary clearance, reducing the accumulation of secretion. However, despite being widely used in clinical practice, the number of studies evaluating its efficacy in septoplasty and lower turbinectomy postoperative is still limited.

Objective

To assess the benefit and safety of Maresis® use in septoplasty and bilateral lower turbinectomy postoperative.

Methods

A phase IV, single-center, randomized, parallel, single-blind and controlled clinical trial held in IPO hospital between July 2014 and May 2015. Approved by the institution´s ethics and research committee.

It was based on the choice of patients referred for septoplasty and turbinectomy by nasal obstruction, operated under local anesthesia for the same surgical technique by three different surgeons belonging to the same team. Patients were randomized in two groups, with Maresis® (test group) or without (control group) and were evaluated in the postoperative period.

All patients met the inclusion and exclusion criteria and signed the Informed Consent Form before entering the study.

Inclusion criteria included age between 18 and 65 years; indication for septoplasty and bilateral lower turbinectomy with turbinate luxation; agreement to meet the requirements of the trial and attend the institute in the day(s) and time(s) defined for evaluations.

Exclusion criteria were the use of other nasal decongestant; use of analgesic and corticosteroid not described in the protocol; hypersensitivity to components of the formula; use of nasal topical medications; pregnant and lactating women; alcohol intake during treatment; associated surgery; use of Gelfoan; buffering and splint; patients who underwent surgery under general anesthesia and occurrence of post-operative complications (septal hematoma, heavy bleeding requiring buffering or return to the operating room or infection).

The withdrawal criteria were loss of follow up; loss, damage and/or misdirection of the sample causing discontinuation of use by the volunteer, adverse event preventing the continued use of the product being studied.

At the time of hospital discharge, subjects were randomized in two groups, with name, age and sex registries. In the test group, the patients used Maresis® six times a day, associated with the oral drugs, which included the use of acetaminophen 500 mg and pseudoephedrine hydrochloride 30 mg – every 8 hours for 3 days and prednisone 40 mg/day for 5 days. In the control group, only the oral drugs were administered.

The first return occurred after three days (ranging from two to four days). Patients were asked about the improvement of breathing until the third day and underwent a clinical evaluation performed by a blinded researcher physician, with analysis of the degree of mucosal edema (absent or mild, and medium or severe), crusting (absent or present, only at the incision, in up to 50% of the septum or more than 50% of the septum) and ease of removal of crusts (very easy, easy, difficult, or indifferent). The patients answered a questionnaire grading nasal obstruction, crusting and difficulty to sleep.

The second return occurred ten days after (ranging from nine to eleven). The initial evaluation was repeated and patients again answered to the initial questionnaire and about the use of the study product .

It proceeded to statistical analysis. Quantitative variables were summarized by the number of valid observations, mean, standard deviation, median, quartile range, minimum and maximum. Qualitative variables were described using frequency tables, including absolute (n) and relative (%) frequencies.

Superiority of Maresis ® associated with acetaminophen 500 mg and pseudoephedrine hydrochloride 30 mg + Prednisolone 40 mg compared to acetaminophen 500 mg associated to pseudoephedrine hydrochloride 30 mg + Prednisolone 40 mg was assumed if the 95% confidence interval lower limit calculated for the mean difference in clinical scale for improvement of obstruction and nasal crusting between the two treatments exceed the superiority margin δ =0,10.

The secondary endpoint, the difference in adverse events rate after 10 days of treatment was summarized by treatment group using data descriptive analysis. Expected treatment effect was provided together with confidence intervals, if applicable. If applicable, the descriptive p values for comparisons of the treatment groups were computed.

Other comparative analysis between Maresis® associated with acetaminophen 500 mg and pseudoephedrine hydrochloride 30 mg + Prednisolone 40 mg and acetaminophen 500 mg associated with pseudoephedrine hydrochloride 30 mg + Prednisolone 40 mg were made. Quantitative variables were compared using the T test for independent samples, or alternatively, the Mann-Whitney test, if not taken the assumption of distribution normality. Comparisons of qualitative variables were made using Chi-square test or Fisher’s exact test.

All hypothesis tests were performed bilaterally, considering a significance level of 5%, i.e., statistical significance was set at p <0.05.

Results

All of the 106 selected patients were randomized (53 in each treatment arm), but only 79 had their data validated for efficacy statistical analysis, totaling 45 patients in the test group and 34 in the control group.

The average age of study subjects was 31.04 ± 9.70 years in the test group and 33.44 ± 10.17 in the control group. No statistical differences were noted in gender, age and physical exams distribution (weight, height and BMI) between the two groups in the pre-treatment
(p > 0.05).

No statistical differences were observed between the clinical indications for the surgery in both groups. In both groups, all subjects had nasal obstruction as clinical indication for surgery; furthermore, 6.67% of the subjects in the test group had recurrent sinusitis and 4.4% had rhinogenic headache. The same symptoms were observed in 14.71% and 5.9% in the control group, respectively.

The efficacy of adding continuous jet nasal spray in postoperative was clinically evaluated according to three parameters: decreased mucosal edema, decreased crusting and ease of crusts removal. The results indicate that the product exhibits a statistically significant result on the parameter ease of crusts removal. No statistically significant differences were observed for reduced mucosal edema and crusting between the two groups (Table 1).

Table 1. Variables assessed by physicians for all patients in the study between visit 1 and visit 2.

 Intervention

N

Mean of difference

Standard deviation

Differences 95% confidence interval

Regarding mucosal edema

Maresis

45

0.58

1.033

–0.404; 0.442

Control

34

0.56

0.786

Regarding crusting, in which degree do you assess the current state of the patient?

Maresis

45

0.31

0.763

–0.547; 0.169

Control

34

0.50

0.826

Regarding ease of crust removal, how do you assess the current state of the patient?

Maresis

45

0.78

1.259

0.291; 1.500

Control

34

-0.12

1.387

* 95% Confidence Interval for mean differences of independent samples.

Three days after surgery, 37% of subjects in the test group did not present any difficulty to sleep versus 8.8% in the control group; furthermore, 20.6% of subjects in the control group reported great difficulty to sleep, while only 8.9% of those in the test group reported the same. These figures show that the test use in postoperative for septoplasty and turbinectomy improves ease into sleep (p <0.005). For the remaining parameters assessed by patients no statistically significant differences were observed. This perceived improvement was not maintained after 10 days of treatment (Tables 2 and 3). Ten days after surgery the evaluations were homogeneous between the groups (Table 2 and 3).

Table 2. Clinical variables of interest assessed by patients for all patients in the study in visit 1 (3 days after surgery).

Intervention

N

p value

How quickly could you breathe better after surgery?

Maresis

45

0.054

Control

34

How do you rate nose obstruction (blockage)?

Maresis

45

0.453

Control

34

How do you rate crusting in the nose?

Maresis

45

0.109

Control

34

Did you have difficulty to sleep?

Maresis

45

0.039

Control

* Chi-Square Test, Yates correction and Fisher’s test for comparison of independent samples proportions.

Table 3. Clinical variables of interest assessed by patients for all patients in the study in visit 2 (10 days after surgery).

Intervention

N

p value

How quickly could you breathe better after surgery?

Maresis

45

0.936

Control

34

How do you rate nose obstruction (blockage)?

Maresis

45

0.839

Control

34

How do you rate crusting in the nose?

Maresis

45

0.213

Control

34

Did you have difficulty to sleep?

Maresis

45

0.129

Control

34

* Chi-Square Test, Yates correction and Fisher’s test for comparison of independent samples proportions.

After 10 days of treatment, subjects in the test group assessed the degree of satisfaction with the product. Ninety-one percent of subjects were satisfied or very satisfied with the use of Maresis®; 100% of subjects considered the product as easy or very easy to apply and 93.3% would indicate the product.

To evaluate the safety of Maresis® use, information from the 106 randomized volunteers were considered. No serious adverse events were reported during the study. Ten adverse events were reported in the study, none of them related to Maresis®. According to the results, the addition of Maresis® to postoperative therapy did not lead to increased adverse events (p = 1.00).

Discussion

The positive results found in this study may be related to the amount of volume dispensed by Maresis®, as well as the technology of its nasal applicators, promoting adequate washing in patients’ nasal cavities.

The use of nasal isotonic saline solution is a simple and low cost procedure, which has been used for years to treat sinonasal tract diseases. Its use causes relief in signs and symptoms of these conditions, reduces the use of drugs and may help to minimize antimicrobial resistance [12].

Its use has proved to be well tolerated in patients with allergic rhinitis, leading to improvement of symptoms and must even be considered as adjuvant therapy to maintain the efficacy of nasal corticosteroid therapy at reduced doses, thus reducing the occurrence of possible side effects and the cost [13].

Pynnomen14 assessed the use of saline solution nasal spray and irrigation with higher amounts of saline solution with slight positive pressure in 127 patients with sinonasal symptoms, demonstrating that there is a greater improvement in symptoms with the use of nasal irrigation.

Frequently, topical saline solution has been prescribed, empirically, to lessen patients’ discomfort in nasal surgery postoperative. It is hypothesized that these sprays may perform such benefits by reducing mucus, clots, mucosal edema, and reduction in inflammatory mediators. Many studies refer to the importance of nasal rinsing with saline solution in improving the permeability and mucociliary clearance in clinical diseases [9–11]. However, despite the widespread use, there are still few studies demonstrating which solution works best and the advantages in the postoperative period, and, therefore, there is no conduct standardization.

Pinto15 analyzed the use of nasal spray on symptoms of nasal obstruction, secretion, headache and difficulty to sleep in postoperative endoscopic surgery. There was no evidence of benefit from the use of nasal sprays. This study differs from ours in which the ease in the removal of crusts and improvement in quality of sleep were statistically significant with the use of continuous jet spray.

Besides removing the secretions and crusts, nasal irrigation increases aeration of nasal mucosa, leading to reduction of local inflammation. Therefore, it improves the quality of life, as it reduces the accumulation of secretions resulting in symptoms of anterior and posterior rhinorrhea, and increases the air flow which was reduced due to these secretions [8,9,11]. Thus, it has preventive function of humidification and cleaning of airways from bacteria, allergens and irritants, favoring mucociliary clearance, providing comfort to the patient.

Conclusion

The results of the study indicate that the use of Maresis® as an adjunct in the treatment of immediate postoperative for septoplasty and bilateral lower turbinectomy assists in crusts removal process and improves patients’ quality of sleep. The addition of Maresis® to standard postoperative therapy is safe.

References

  1. Haroon Y; Saleh HA; Abou-Issa AH. (2013) Nasal soft tissue obstruction improvement after septoplasty without turbinectomy. Eur Arch Otorhinolaryngol. 270(10): 2649–55. [Crossref]
  2. Bernardo MT; Alves S; Lima NB; Helena D; Condé A. (2013) Septoplasty with or without postoperative nasal packing? Prospective study. Braz J Otorhinolaryngol. 79(4): 471–4. [Crossref]
  3. Thapa N; Pradhan B. (2011) Postoperative complications of septal quilting and BIPP packing following septoplasty. J Nepal Health Res Counc. 9(2): 186–8. [Crossref]
  4. Ghimire A; Limbu TR; Bhandari R. (2012) Trans-septal suturing following septoplasty: an alternative for nasal packing. Nepal Med Coll J. 14(3): 165–8. [Crossref]
  5. Yildirim G; Cingi C; Kaya E. (2013) Septal stapler use during septum surgery. Eur Arch Otorhinolaryngol. 270(3): 939–43. [Crossref]
  6. Quinn JG; Bonaparte JP; Kilty SJ. (2013) Postoperative management in the prevention of complications after septoplasty: a systematic review. Laryngoscope. 123(6): 1328–33. [Crossref]
  7. Aukema AAC, Fokkens WJ. (2004) Chronic rhinosinusitis: management for optimal outcomes. Treat Respir Med. 3(2): 97–105. [Crossref]
  8. Olson DE, Rasgon BM, Hilsinger RL. (2002) Radiographic comparison of three methods for nasal saline irrigation. Laryngoscope. 112: 1394–8. [Crossref]
  9. Hauptman G; Ryan M.W. (2007) The effect of saline solutions on nasal patency and mucociliary clearance in rhinosinusitis patients. Otolaryngol Head Neck Surg 137(5): 815–21. [Crossref]
  10. Ural, A; Oktemer, T.K; Kizil, Y; Ileri, F; Uslu, S.J. (2009) Impact of isotonic and hypertonic saline solutions on mucociliary activity in various nasal pathologies: clinical study. Laryngol Otol. 123(5): 517–21. [Crossref]
  11. Jurkiewicz, D; Rapiejko, P. (2011) Use of isotonic NaCl solution in patients with acute rhinosinusitis. Otolaryngol Pol. 65(1): 47–53. [Crossref]
  12. Papsin B, McTavish A. (2003) Saline Nasal Irrigation. Can Fam Physician. 48: 168–73.
  13. Chen JR, Jin L, Li X. (2014) The effectiveness of nasal saline irrigation (seawater) in treatment of allergic rhinitis in children. Int J Ped Otolaryngol. 78: 115–8. [Crossref]
  14. Pynnomen MA; Mukerji SS, Kim M, Adams E, Terrel JE. (2007) Nasal Saline for Chronic Sinonasal Symptoms. Arch Otolaryngol Head Neck Surg. 133(11): 1115–20. [Crossref]
  15. Pinto, J.M.;Elwany, S;Baroody, F.M.;Naclerio, R. (2006) Effects of saline sprays on symptoms after endoscopic sinus surgery. American Journal of Rhinology. 20(2): 191–196. [Crossref]
  16. Süslü, N; Bajin, M.D; Süslü, A.E; Oğretmenoğlu, O. (2009) Effects of buffered 2.3%, buffered 0.9%, and non-buffered 0.9% irrigation solutions on nasal mucosa after septoplasty. Eur Arch Otorhinolaryngol . 266(5): 685–9. [Crossref]
Diagnostic and Prognostic Value of Serum Cyfra 21–1 Levels in Patients with Pancreatic Cancer

DOI: 10.31038/IMROJ.2018342

Abstract

Background: This study was conducted to evaluate serum cytokeratin 19-fragments (CYFRA 21–1), in addition to serum carbohydrate antigen 19–9 (CA 19–9), as a novel biomarker for the diagnosis and prognosis of pancreatic cancer.

Methods: We performed a retrospective review of medical records of the patients whose serum CYFRA 21–1 and CA 19–9 levels were estimated in a single institute from March 2011 to February 2014. The sensitivity and specificity of CYFRA 21–1 and CA 19–9 for pancreatic cancer were assessed, and the overall survival of the patients was evaluated with respect to elevation of the CYFRA 21–1 levels.

Results: Records of 57 patients diagnosed with pancreatic cancer and 110 healthy individuals (control group) were collected. CYFRA 21–1 had a sensitivity of 80.7%, specificity of 80%, positive predictive value of 67.6%, and negative predictive value of 88.9%, at a cut-off value of 1.93 ng/ml determined by a receiver operating characteristics (ROC) analysis. The area under ROC (AUC-ROC) curves of CYFRA 21–1 and CA 19–9 were 0.83 [95% confidence interval (CI), 0.764–0.884) and 0.874 (95% CI, 0.814–0.921), respectively without any statistically significant difference (p = 0.333). No correlation was observed between the CYFRA 21–1 levels and the serum total bilirubin levels. For overall survival, a CYFRA 21–1 level of ≥ 5 ng/ml indicated a poor prognosis among patients with pancreatic cancers (median survival, 4.4 vs. 9.5 months, p = 0.000). CYFRA 21–1 level was also found to be an independent prognostic factor in the multivariate analysis [hazard ratio, 2.277 (95% CI, 1.137–4.559), p = 0.020].

Conclusion: CYFRA 21–1 can be a valuable biomarker for the diagnosis and prognostic prediction of pancreatic cancer.

Keywords

Cyfra 21–1, Diagnostic Performance, Pancreatic Cancer, Prognosis

Introduction

Pancreatic cancer is a fatal disease with poor response to treatment and dismal prognosis. It is a commonly occurring cancer in men and women (ranked ninth and tenth respectively) and is the fifth and the sixth leading cause of mortality, respectively, globally. It is the sole type of cancer in which the five-year relative survival rate has not shown any significant improvement in Korea from 1999 to 2015 (5.4% to 5.7%) [1]. Only 15–20% of patients have a resectable disease at presentation, and the initial resectability rate has also not increased in the past decades despite recent advances in the diagnostic technologies and health screening programs [2]. Therefore, there remains a huge need for an improvement in the diagnosis of pancreatic cancer in this present era.

Estimation of biomarkers from blood is an adjunctive diagnostic method for pancreatic cancer. The most commonly used and valuable biomarker for the diagnosis and monitoring of this cancer, in practice, is serum carbohydrate antigen 19–9 (CA 19–9). It is a sialylated Lewis antigen expressed in normal epithelium of pancreas, bile ducts, gallbladder, and stomach. However, because 10–15% of the total population lacks the Lewis antigen, a small proportion of patients with pancreatic cancer may not show an increase in the levels of serum CA 19–9 regardless of the tumor burden. Benign inflammation of the pancreas or biliary tract can also increase the CA 19–9 levels, leading to diagnostic inaccuracy [3]. Thus, no biomarker, superior to CA 19–9, has been yet accepted.

CYFRA 21–1 is a circulating fragment of cytokeratin 19 (CK19), which is a constituent of the intermediate filament protein necessary for the structural stability of epithelial cells. CK19 is expressed in various kinds of epithelial cells but is rarely detected in the blood of healthy individuals [4]. Accordingly, serum CYFRA 21–1 levels have been widely evaluated as a potential biomarker for a variety of cancers, such as colorectal cancer [5,6], breast cancer [7], cervical cancer [8], cholangiocarcinoma [9–11], and urothelial carcinoma [12]. Presently, it is most commonly used as a tumor marker for non-small cell lung carcinoma [4,13–15]. Nakata et al. have reported that CYFRA 21–1 was effective in monitoring treatment response and detection of disease relapse in patients with breast cancer [7]. Washino et al. have shown that CYFRA 21–1 could be an indicator of advanced and high-grade urothelial carcinoma, and can be useful to monitor the disease and predict its prognosis [12].

However, there are very sparse data on the role of CYFRA 21–1 as a biomarker for pancreatic cancer. Boeck et al. have reported that serum CYFRA 21–1 was valuable in monitoring response to systemic chemotherapy and predict overall survival (OS) in patients with advanced pancreatic cancer [16]. Recently, Nolen et al. have evaluated the efficacy of a variety of serum biomarkers for pancreatic ductal adenocarcinoma in a large prospective cohort study of cancer screening. Their study revealed that the combination of CA 19–9, carcinoembryonic antigen (CEA), and CYFRA 21–1 could provide the highest efficacy for the detection of pancreatic ductal adenocarcinoma [17]. In the present study, we have retrospectively analyzed the diagnostic potential of serum CYFRA 21–1 for pancreatic cancer.

Materials and methods

Data collection and analysis

The medical records of the patients diagnosed with pancreatic cancer, whose serum CYFRA 21–1 and CA 19–9 were estimated at the Incheon St. Mary’s Hospital, the Catholic University of Korea, College of Medicine from March 2011 to February 2014 were retrospectively collected. The patients who were diagnosed with cancer, except pancreatic cancer, were excluded. Demographic characteristics, histologic type, cancer stage, distant metastatic organs, serum CYFRA 21–1, CA 19–9, total bilirubin level, treatment modality, and clinical outcomes were analyzed by a retrospective chart review. The cancer staging was determined based on the American Joint Committee on Cancer staging system, 8th edition. During the study period, the serum CYFRA 21–1 was uniformly measured by a two-step sandwich chemiluminescent microparticle immunoassay (Architect i2000SR, Abbott Laboratories, Ltd., Il, USA).

Statistical analysis

The comparison of groups was performed by the Kruskal-Wallis and chi-squared tests. For continuous variables, the Mann-Whitney U test was performed. The correlations among the CA 19–9, CYFRA 21–1, and serum total bilirubin levels were assessed using the Spearman correlation test. All statistical analysis was performed with SPSS version 12.0 for Windows (IBM, NY, USA), except for plotting the receiver operating characteristics (ROC) curves. The area under the ROC (AUC-ROC) curves and comparison of the ROC curves for CYFRA 21–1 and CA 19–9 were computed with MedCalc version 17.4 (MedCalc Software, Ostend, Belgium).

Results

Clinicopathological characteristics of patients

In the present study, 57 patients were diagnosed with pancreatic cancer. The median age was 63 years (range 42−84 years), and 35 (61.4%) patients were males. For the 110 healthy individuals (control group), the median age was 55 years (range 28−82) and 58 patients (52.7%) were males.

Of the 57 patients with pancreatic cancer, 48 (84.2%) were histologically confirmed for ductal adenocarcinoma or adenocarcinoma otherwise. Three (5.3%), five (8.8%), and one (1.8%) patients were diagnosed with intraductal papillary mucinous neoplasm-associated carcinoma, unspecified carcinoma, and acinar cell carcinoma, respectively. At presentation, 22 patients (38.6%) were diagnosed with pancreatic cancer without evidence of any distant metastases, while 35 patients (61.4%) were proven to have distant metastases. The total serum bilirubin was > 2 mg/dl in 11 (19.3%) patients with pancreatic cancer at the time of CYFRA 21–1 and CA 19–9 estimation. The baseline patient characteristics are enlisted in (Table 1 & Figure 1).

Table 1. Baseline characteristics of the study population

Variables

Pancreatic cancer
(n = 57)

Control
(n = 110)

Age (years)

Median (range)

64 (42−84)

55 (28−82)

Mean (SD)

63.7 (9.3)

54.6 (12.3)

Gender (%)

Male

35 (61.4)

58 (52.7)

Female

22 (38.6)

52 (47.3)

Histopathology (%)

Ductal adenocarcinoma

19 (33.3)

Adenocarcinoma

29 (50.9)

Acinar cell carcinoma

1 (1.8)

Poorly differentiated carcinoma

1 (1.8)

Undifferentiated carcinoma

2 (3.5)

IPMN-associated carcinoma

3 (5.3)

Carcinoma, unspecified

2 (3.5)

AJCC stage (%)

IA

1 (1.8)

IIA

3 (5.3)

IIB

9 (15.8)

III

9 (15.8)

IV

35 (61.4)

Disease extent (%)

Non-metastatic

22 (38.6)

Metastatic

35 (61.4)

Serum total bilirubin (mg/dl)

≤ 2

46 (80.7)

> 2

11 (19.3)

SD, standard deviation; IPMN, intraductal papillary mucinous neoplasm

IMROJ 2018-109 - Jung Hoon Kim Korea_F1

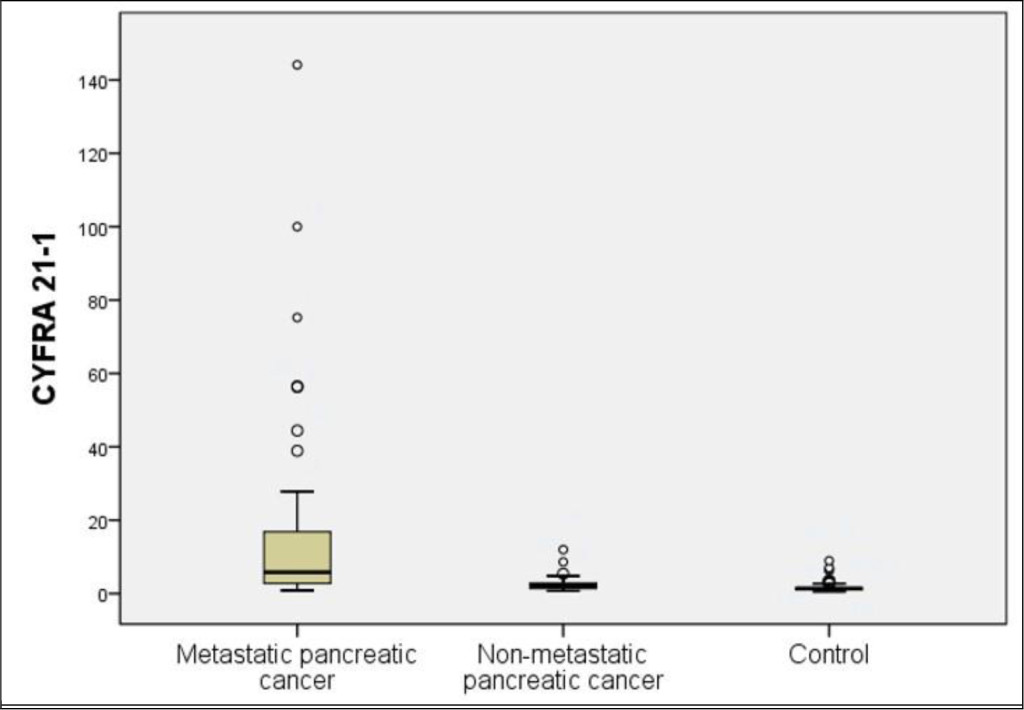
Figure 1. Distribution of serum CYFRA 21–1 levels in the patients with advanced pancreatic cancer, localized pancreatic cancer, and the control group

CYFRA 21–1 and CA 19–9 levels

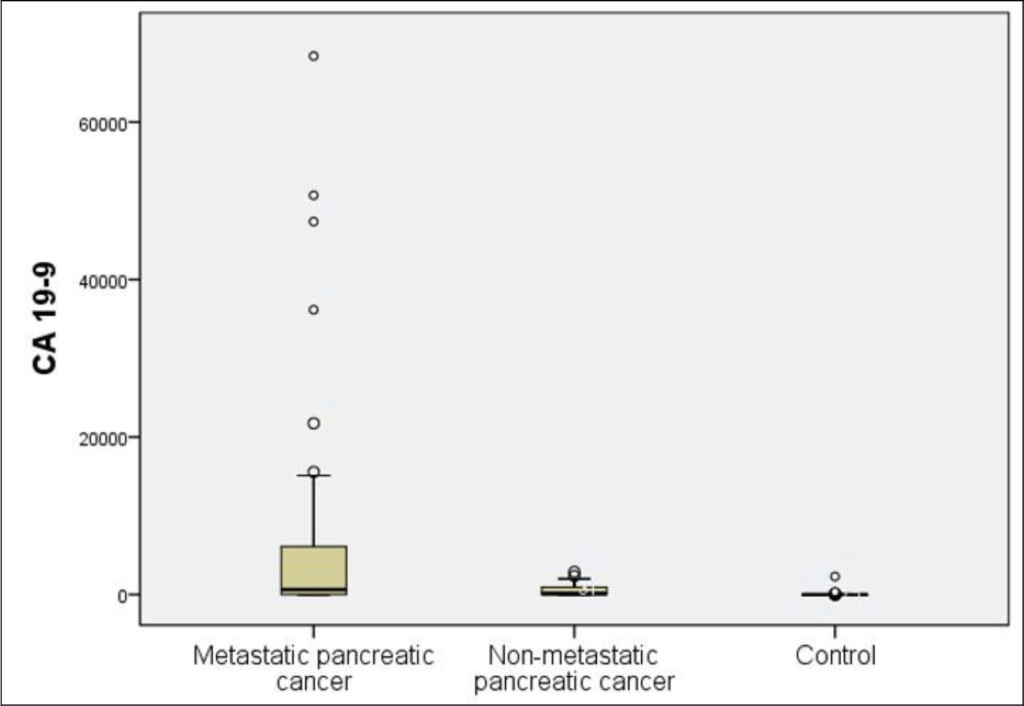
The mean levels of serum CYFRA 21–1 were 13.11 ± 26.33 ng/ml and 1.64 ± 1.27 in the patients with pancreatic cancer and control group, respectively, showing a significant difference between the two groups (p < 0.001). The mean levels of serum CA 19–9 were 5355.35 ± 13625.22 ng/ml and 40.39 ± 219.96 in the patients with pancreatic cancer and control group, respectively, showing a significant difference between the two groups (p < 0.001). In 22 patients with non-metastatic pancreatic cancer, the mean CYFRA 21–1 and CA 19–9 levels were 2.87 ± 2.71 ng/ml and 582.19 ± 854.49 U/ml, respectively. Both the markers were significantly higher in the patients with non-metastatic pancreatic cancer than in the control group (p = 0.002 and p < 0.001, respectively) (Table 2 and Figure 2 & 3).

Table 2. Serum CYFRA 21–1 and CA 19–9 levels

Biomarker (n)

Metastatic pancreatic cancer (n = 35)

Non-metastatic Pancreatic cancer (n = 22)

Control
(n = 110
)

CYFRA 21–1 (ng/ml)

(mean ± SD)

19.35 ± 32.05

2.87 ± 2.71

1.64 ± 1.27

CA 19–9 (U/ml)

(mean ± SD)

8355.63 ± 16772.34

582.19 ± 854.49

40.39 ± 219.96

SD, standard deviation

IMROJ 2018-109 - Jung Hoon Kim Korea_F2

Figure 2. Distribution of serum CA 19–9 levels in the patients with advanced pancreatic cancer, localized pancreatic cancer, and the control group

IMROJ 2018-109 - Jung Hoon Kim Korea_F3

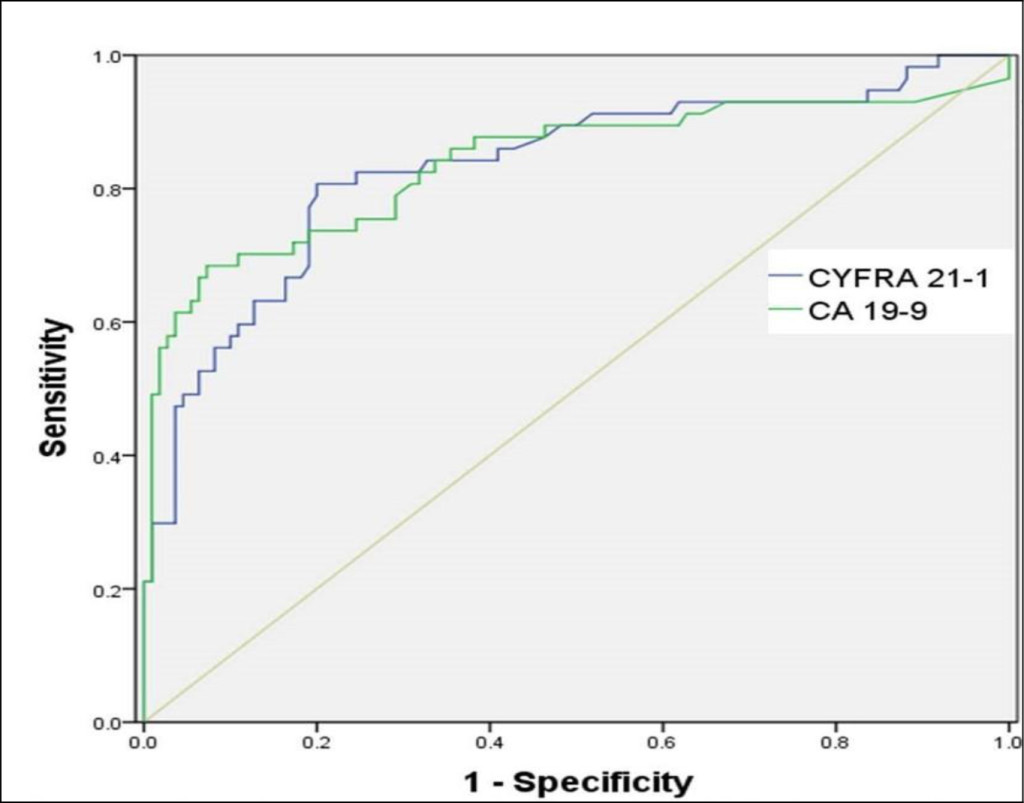
Figure 3. Receiver operating characteristic (ROC) curves for CYFRA 21–1 and CA 19–9

Determination of the cut-off value, sensitivity, specificity, and predictive value of CYFRA 21–1 using ROC curve analysis

CYFRA 21–1 was elevated in 46 patients with pancreatic cancer, and 22 patients without malignancy, with a cut-off value of 1.93 ng/ml. The sensitivity, specificity, positive predictive value, and negative predictive value were 80.7%, 80%, 67.6%, and 88.9%, respectively. The sensitivity, specificity, positive predictive value, and negative predictive value of CA 19–9 were 75.4%, 84.5%, 71.7%, and 84.5%, respectively, with a cut-off value of 35 U/ml. No significant difference was observed in the sensitivity and specificity between CYFRA 21–1 and CA 19–9.

Comparison of ROC curves between CYFRA 21–1 and CA 19–9

The AUC-ROC curves of CYFRA 21–1 and CA 19–9 were 0.83 [95% CI, 0.764–0.884] and 0.874 (95% CI, 0.814–0.921), respectively (Figure 3). The comparison of AUC-ROC curves between CYFRA 21–1 and CA 19–9 revealed no statistically significant difference (p = 0.333).

Spearman correlation coefficients among CYFRA 21–1, CA 19–9, and serum total bilirubin in patients with pancreatic cancers

There was a significant positive correlation between the CYFRA 21–1 and the CA 19–9 levels (r = 0.607, p < 0.001). The CYFRA 21–1 levels, however, did not correlate well with the serum total bilirubin levels (r = 0.057, p = 0.676). A weak correlation between the CA 19–9 levels and the total serum bilirubin levels (r = 0.257) was observed, which was not statistically significant (p = 0.054).

Prognostic value of CYFRA 21–1 and CA 19–9 for patients with pancreatic cancer

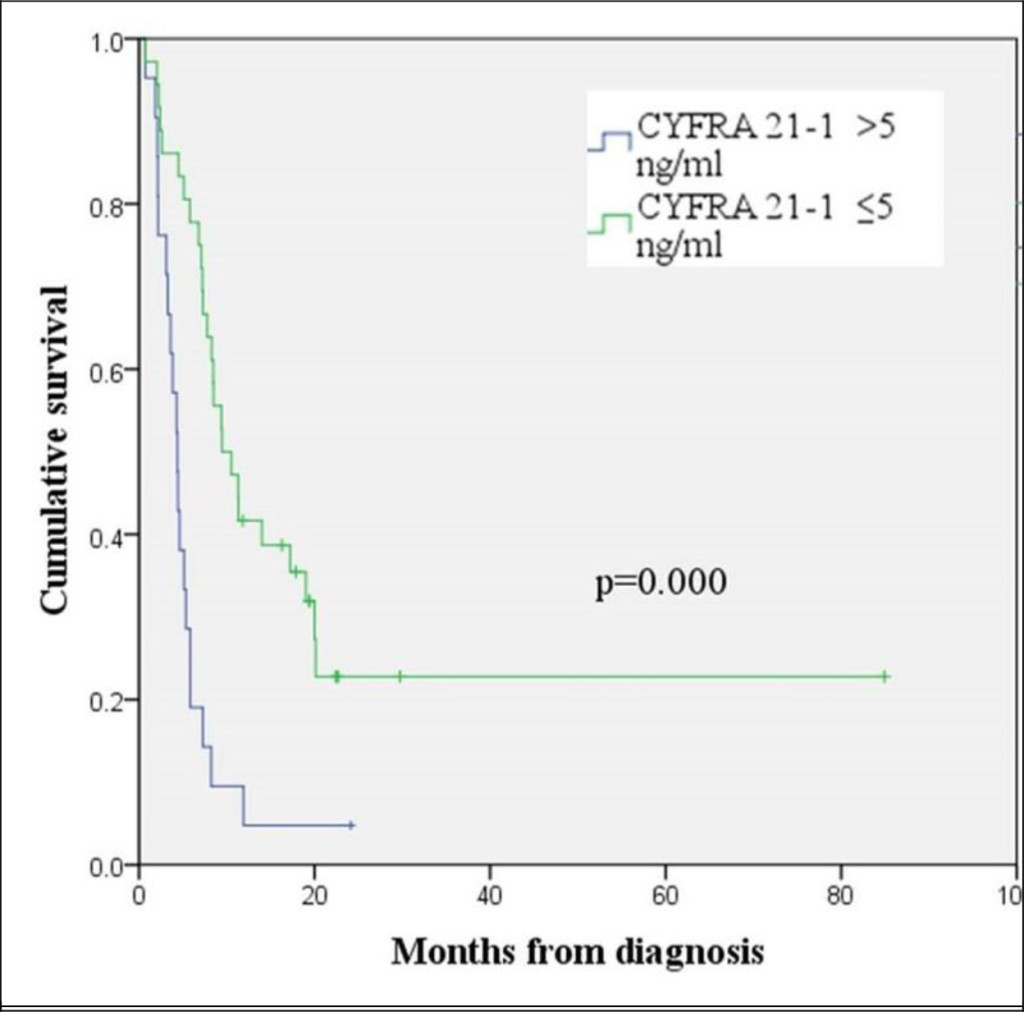
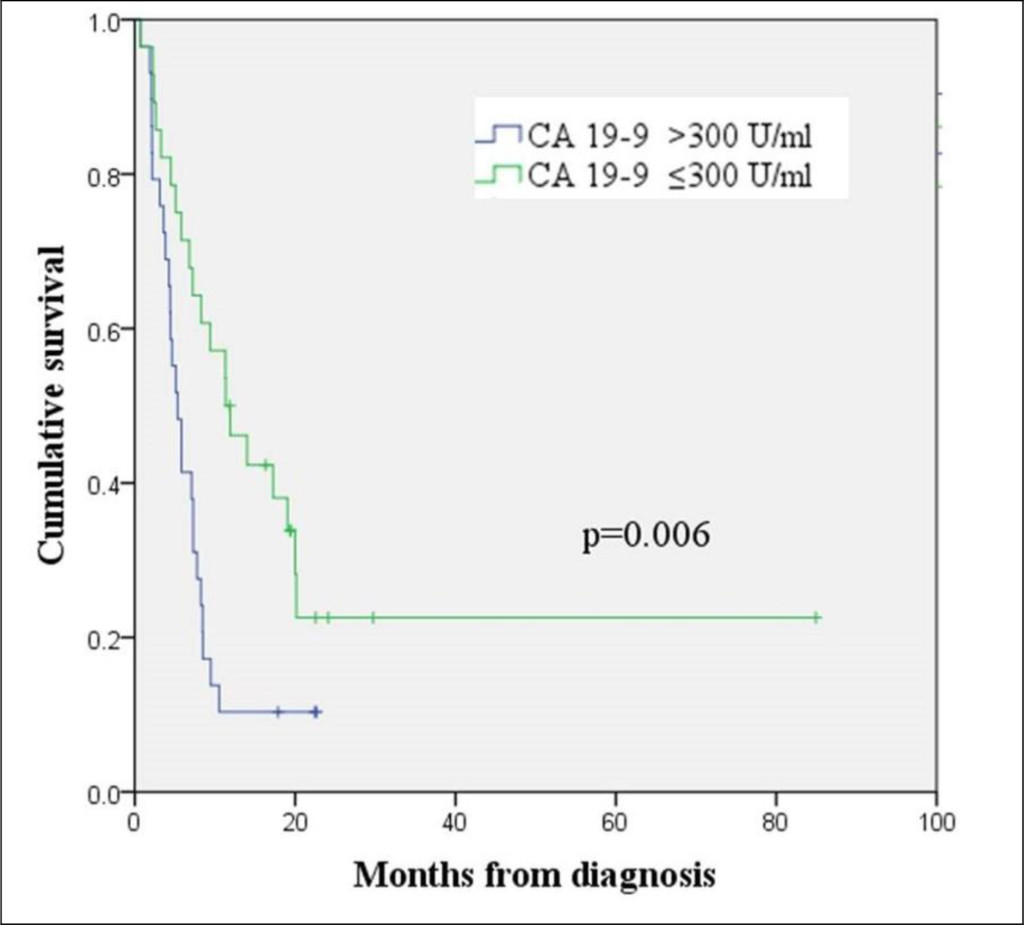
The patients with pancreatic cancers with CYFRA 21–1 levels >5 ng/ml showed shorter overall survival than those with CYFRA 21–1 levels ≤ 5 ng/ml (median OS 4.4 months and 9.5 months, respectively, log rank p = 0.000) (Figure 4). A CA 19–9 level of > 300 U/ml was also an indicator of poor prognosis and corresponded to a median OS of 5.3 months. A median OS of 11.3 months was observed in patients with pancreatic cancers with CA 19-9 levels ≤300 U/ml (log rank p = 0.006) (Figure 5). A multivariate analysis using Cox’s regression model showed that CYFRA 21-1 was a single independent prognostic factor predicting inferior overall survival (hazard ratio 2.277, 95% CI, 1.137−4.559, p = 0.020).

IMROJ 2018-109 - Jung Hoon Kim Korea_F4

Figure 4. Kaplan-Meier curve for overall survival according to the CYFRA 21-1 level

IMROJ 2018-109 - Jung Hoon Kim Korea_F5

Figure 5. Kaplan-Meier curve for overall survival according to the CA 19-9 level

Discussion

The present study investigated the diagnostic and prognostic value of CYFRA 21-1 as compared to CA 19-9. Boeck et al. described the clinical utility of CYFRA 21-1 as a marker in pancreatic cancer. However, they have evaluated the response predictability to chemotherapy at a palliative setting, and its prognostic value in advanced disease [16]. Nolen et al. reported that a triple combination of CA 19-9, CEA, and CYFRA 21-1 provided the highest efficacy for screening pancreatic cancer in a prospective cohort study, and to the best of our knowledge, it is the sole study that suggested the diagnostic value of CYFRA 21-1 [17]. But their study did not explicitly provide the sensitivity, specificity, positive predictive value, and negative predictive value of CYFRA 21-1. During the course of our study, another study establishing the pre-chemotherapy CYFRA 21-1 as an independent prognostic factor in patients with advanced pancreatic cancer was published. This study, however, also did not investigate the diagnostic value of CYFRA 21-1 [18].

The median value of CYFRA 21-1 in the current study was higher than the value measured by Boeck et al. across all population subtypes (7.5, 2.6, and 1.5 ng/ml in metastatic, recurrent, and locally advanced cancer, respectively), keeping in consideration that our study was performed in a single hospital setting [16]. The sensitivity and specificity of CYFRA 21-1 were comparable to that of CA 19-9, although it failed to prove a statistically significant superiority. The comparison of diagnostic value, as assessed by AUC-ROC curves showed no significant difference between CYFRA 21-1 and CA 19-9. Thus, we can hypothesize that the patients with pancreatic cancers lacking sialylated Lewis antigens may benefit from the use of CYFRA 21-1 as a potential biomarker.

Currently, the most commonly used serum biomarker for pancreatic cancer is CA 19-9. According to the results of numerous studies, the sensitivity and specificity of CA 19-9 for pancreatic cancer vary in the range of 67-92% and 68-92%, respectively [3]. Postoperative CA 19-9 is considered to be a more reliable biomarker than preoperative CA 19-9 [19-22], which is attributed to the fact that obstructive biliary stasis can also cause elevation of CA 19-9 levels [23, 24]. Therefore, it is worthwhile to investigate another adjunctive biomarker which is not usually affected by biliary obstruction.

A variety of proteins, DNAs, and RNAs extracted from blood were assessed in various studies as additional diagnostic markers for pancreatic cancer. However, their reported diagnostic values were inconsistent to be applied in clinical practice [25-28]. Genetic molecules such as DNAs and RNAs still have low utility as biomarkers due to their reliability, practicality, and cost-effectiveness issues. CYFRA 21-1 measurement involves the detection of serum cytokeratin-19 fragment by two monoclonal antibodies. Thus, it is a relatively simple method, which can be easily utilized in routine clinical practice. Cytokeratins are known to express various subtypes in a variety of epithelial cells, and retain their molecular structures when epithelial cells are transformed during malignancy [29, 30]. Cytokeratin-19 is expressed positively in most pancreatic cancer tissues, as confirmed by immunohistochemistry [31].

This study revealed a strong positive correlation between CYFRA 21-1 and CA 19-9 levels. No correlation, however, was observed between CYFRA 21-1 and total bilirubin levels, and a weak non-significant correlation was observed between CA 19-9 and total bilirubin levels. This raises the possibility of the clinical usefulness of CYFRA 21-1 as a biomarker in pancreatic cancer.

We can hypothesize that CYFRA 21-1 may be helpful when the elevation of CA 19-9 is suspected to be confounded by obstructive biliary stasis, which is frequently present in the patients with pancreatic cancers. We, therefore, hypothesize that CYFRA 21-1 can be useful in diagnosing pancreatic cancer in patients with no elevation of CA 19-9, nevertheless, this hypothesis needs to be tested in a larger sample. Additionally, CYFRA 21-1 and CA 19-9 were found to be good prognostic indicators for pancreatic cancer. A multivariate analysis revealed that CYFRA 21-1, contrary to CA 19-9, is an independent prognostic factor for the OS in pancreatic cancer. This result is supported by previous studies by Boeck et al. [16] and Haas et al. [18].

Our study has some limitations. It is a retrospective analysis that reviewed medical records from a single institute and has heterogeneity in the study population because patients in all stages of pancreatic cancers were included. However, to the best of our knowledge, more robust results on this subject have not been published till date. In conclusion, CYFRA 21-1 can be considered as a valuable diagnostic and prognostic biomarker compared to CA 19-9 in pancreatic cancer. Larger prospective studies to verify the prognostic value of CYFRA 21-1 and CA 19-9 in pancreatic cancer are warranted.

References

  1. Jung KW, Won YJ, Kong HJ, Lee ES. (2018) Cancer Statistics in Korea: Incidence, Mortality, Survival, and Prevalence in 2015. Cancer Res Treat 50: 303–316.
  2. Luo J, Xiao L, Wu C, Zheng Y, et al. (2013) The incidence and survival rate of population-based patients with pancreatic cancers: Shanghai Cancer Registry 2004–2009. PLoS One. 8: 76052. [crossref]
  3. Lee JK (2008) Screening and diagnosis for pancreatic cancer. Korean J Gastroenterol 51: 84–88. [crossref]
  4. Pujol JL, Grenier J, Daurès JP, Daver A, Pujol H, et al. (1993) Serum fragment of cytokeratin subunit 19 measured by CYFRA 21–1 immunoradiometric assay as a marker of lung cancer. Cancer Res 53: 61–66. [crossref]
  5. Thomas DS, Fourkala EO, Apostolidou S, Gunu R, A Ryan, et al. (2015) Evaluation of serum CEA, CYFRA21–1, and CA125 for the early detection of colorectal cancer using longitudinal preclinical samples. Br J Cancer. 113: 268–274.
  6. Lee JH (2013) Clinical Usefulness of Serum CYFRA 21–1 in Patients with Colorectal Cancer. Nucl Med Mol Imaging 47: 181–187. [crossref]
  7. Nakata B, Takashima T, Ogawa Y, Ishikawa T, Hirakawa K (2004) Serum CYFRA 21–1 (cytokeratin-19 fragments) is a useful tumour marker for detecting disease relapse and assessing treatment efficacy in breast cancer. Br J Cancer 91: 873–878. [crossref]
  8. Chang KH, Ryu HS, Chang SJ, Byun YJ, Lee JP (2005) Relationship between pre-treatment serum SCC (squamous cell carcinoma) antigen, Cyfra 21–1 levels, and survival in squamous cell carcinoma of the uterine cervix. Cancer Res Treat. 37: 302–306. [crossref]
  9. Chapman MH, Sandanayake NS, Andreola F, Dhar DK, Webster GJ, et al. (2011) Circulating CYFRA 21–1 is a Specific Diagnostic and Prognostic Biomarker in Biliary Tract Cancer. J Clin Exp Hepatol 1: 6–12. [crossref]
  10. Uenishi T, Kubo S, Hirohashi K, Tanaka H, Shuto T, et al. (2003) Cytokeratin-19 fragments in serum (CYFRA 21–1) as a marker in primary liver cancer. Br J Cancer 88: 1894–1899. [crossref]
  11. Uenishi T, Yamazaki O, Tanaka H, Takemura S, Yamamoto T, et al. Serum cytokeratin 19 fragment (CYFRA21–1) as a prognostic factor in intrahepatic cholangiocarcinoma. Ann Surg Oncol 15: 583–589. [crossref]
  12. Washino S, Hirai M, Matsuzaki A, Kobayashi Y (2011) Clinical usefulness of CEA, CA19–9, and CYFRA 21–1 as tumor markers for urothelial bladder carcinoma. Urol Int 87: 420–428. [crossref]
  13. Okamura K, Takayama K, Izumi M, Harada T, Furuyama K, et al. (2013) Diagnostic value of CEA and CYFRA 21–1 tumor markers in primary lung cancer. Lung Cancer 80: 45–49. [crossref]
  14. Park SY, Lee JG, Kim J, Park Y, et al. (2013) Preoperative serum CYFRA 21–1 level as a prognostic factor in surgically treated adenocarcinoma of lung. Lung Cancer. 79: 156–160. [crossref]
  15. Park HD, Jeong HS, Park JS, Lim SH (2002) Usefulness of cyfra 21–1 as a tumor marker of lung cancer. Korean J Med
  16. Boeck S, Wittwer C, Heinemann V, Haas M, Kern C, et al. (2013) Cytokeratin 19-fragments (CYFRA 21–1) as a novel serum biomarker for response and survival in patients with advanced pancreatic cancer. Br J Cancer 108: 1684–1694. [crossref]
  17. Nolen BM, Brand RE, Prosser D, Velikokhatnaya L, Allen PJ, et al. (2014) Prediagnostic serum biomarkers as early detection tools for pancreatic cancer in a large prospective cohort study. PLoS One 9: 94928. [crossref]
  18. Haas M, Kern C, Kruger S, Michl M, Modest DP, et al. Assessing novel prognostic serum biomarkers in advanced pancreatic cancer: the role of CYFRA 21–1, serum amyloid A, haptoglobin, and 25-OH vitamin D3. Tumour Biol 36: 2631–2640. [crossref]
  19. Ferrone CR, Finkelstein DM, Thayer SP, Muzikansky A, Fernandez-delCastillo C, et al. (2006) Perioperative CA19–9 levels can predict stage and survival in patients with resectable pancreatic adenocarcinoma. J Clin Oncol 24: 2897–2902. [crossref]
  20. Kondo N, Murakami Y, Uemura K, Hayashidani Y, Sudo T, et al. (2010) Prognostic impact of perioperative serum CA 19–9 levels in patients with resectable pancreatic cancer. Ann Surg Oncol. 17: 2321–2329. [crossref]
  21. Hata S, Sakamoto Y, Yamamoto Y, Nara S, Esaki M, et al. (2012) Prognostic impact of postoperative serum CA 19–9 levels in patients with resectable pancreatic cancer. Ann Surg Oncol 19: 636–641. [crossref]
  22. Kinsella TJ, Seo Y, Willis J, Stellato TA, Siegel CT, et al. (2008) The impact of resection margin status and postoperative CA19–9 levels on survival and patterns of recurrence after postoperative high-dose radiotherapy with 5-FU-based concurrent chemotherapy for resectable pancreatic cancer. Am J Clin Oncol 31: 446–453. [crossref]
  23. La Greca G, Sofia M, Lombardo R, Latteri S, Ricotta A, et al. Adjusting CA19–9 values to predict malignancy in obstructive jaundice: influence of bilirubin and C-reactive protein. World J Gastroenterol 18: 4150–4155.
  24. Ong SL, Sachdeva A, Garcea G, Gravante G, Metcalfe MS, et al. (2008) Elevation of carbohydrate antigen 19.9 in benign hepatobiliary conditions and its correlation with serum bilirubin concentration. Dig Dis Sci 53: 3213–3217. [[crossref]
  25. Park YM, Jung HG, Son HY, Kim YS, et al. (2000) Clinical Significance of Serum p53 Protein in Patients with Pancreatic Carcinoma. Korean J Gastroenterol
  26. Lee KH, Yoon WJ, Lee JK, Ryu JK, Kim YT, et al. (2005) Quantification of plasma DNA as a tumor marker in patients with pancreatic cancer]. Korean J Gastroenterol 46: 226–232. [crossref]
  27. Rogosnitzky M, Danks R (2010) Validation of blood testing for K-ras mutations in colorectal and pancreatic cancer. Anticancer Res 30: 2943–2947. [crossref]
  28. Fukushima N, Walter KM, Uek T, Sato N, Matsubayashi H, et al. (2003) Diagnosing pancreatic cancer using methylation specific PCR analysis of pancreatic juice. Cancer Biol Ther 2: 78–83. [crossref]
  29. Barak V, Goike H, Panaretakis KW, Einarsson R (2004) Clinical utility of cytokeratins as tumor markers. Clin Biochem 37: 529–540. [crossref]
  30. Linder S (2007) Cytokeratin markers come of age. Tumour Biol 28: 189–195. [crossref]
  31. Jain R, Fischer S, Serra S, Chetty R (2010) The use of Cytokeratin 19 (CK19) immunohistochemistry in lesions of the pancreas, gastrointestinal tract, and liver. Appl Immunohistochem Mol Morphol 18: 9–15. [crossref]

The Impact of Type 2 Diabetes on Periodontal Health in Elderly Subjects: Princeps Study

DOI: 10.31038/EDMJ.2018247

Abstract

Very few studies have been done on oral health in the elderly and in particular the impact of type 2 diabetes on the dental appliance in the elderly. This is a feasibility study, with the use of a questionnaire, conducted in consultation with geriatric physicians, diabetologists and dentists.

Keywords

Periodontal Health, Type 2 diabetes, Elderly, Nursing Homes

Letter to the Editor

In 2014, an international project entitled “Factors Influencing the Oral Health of Elderly Diabetics 65 Years of Age and Older” was born. It is the fruit of collaboration between the University Hospital of Rouen in France and the University of Fortaleza in Brazil. The goal of the project was to deepen and broaden our current understanding of Type 2 Diabetes, and to evaluate the factors influencing the oral condition of elderly diabetics over 65 years of age.

It was an epidemiological study, prospective and non-interventional, carried out over a period of 9 months, between March 2014 and November 2015 at the Saint-Julien site at the University Hospital of Rouen, France.

The subjects were 78 patients with type 2 diabetes, predominantly males (43 subjects, 55.1%), with an average age of 80.8 +/- 8.0 years (80.7 +/- 8.1 for the females, 80.9 +/- for the men), with the extremes in age being 65 and 98, and a median age of 81. There are no significant differences between the control of diabetes and variables like age, gender, BMI, tobacco use and prosthetic parameters. A trend is apparent between inclusion links and poor glycemic control (p=0.07) variables: 80% of patients in nursing homes are poorly controlled versus only 46.2% of home patients. 62% of patients presenting an HbA1c<=7.5% have more than 4 Functional Units (FUs), versus 47% of patients with poor glycemic control. We observe that a higher percentage of poorly controlled patients do not present a functional pair (32% versus 17% of controlled subjects). Out of 59 patients with teeth, we have 16 patients with a partial set of teeth whose HbA1c is unknown, 24 with teeth and an HbA1c<=7.5%, and 19 with teeth and an HbA1c>7.5%. We observe that sextant scores 3, X and 2 occur primarily among those patients with an HbA1c <=7.5%, representing respectively 31.25%, 27.08% and 24.31% of total sextants. These correspond to testing <3 mm (score 2); from 3.5 to 5.5 mm
(score 3) or sextants with either 0 teeth or 1 tooth. Diabetic patients with poorly controlled diabetes (>7.5%) predominantly present a score of X (44.74%), followed by scores of 3 (21.93%) and 2 (18.42%). A score of 4, representing the most advanced conditions of poor periodontal health, is found in 6.25% of controlled patients, versus 9.65% of poorly controlled patients. Out of 42 diabetic patients with teeth, only 9 patients present a plaque index <25%. The average plaque index for those patients presenting an HbA1c<=7.5% is 58.12%, versus 69.10% for those patients with an HbA1c>7.5%.

This indicates that the majority of sextants examined that present a score of 0 or 1 occur in controlled diabetic patients (11.1% versus 5.2%). A score of 4, representing the most advanced periodontal disease, is primarily found in poorly controlled diabetic patients (9.5% versus 6.2%). However, there is a wider gap between the two controlled versus poorly controlled groups in the number of edentulous sextants (score X), which consequently influences the number of functional units and the Masticatory Coefficient (MC) (p=0.0011). Many studies have reported high numbers of missing teeth among diabetic patients, but in most cases the accounts show that the difference observed is not significant [1].

In the case of Functional Units (FU) number <=4, with a majority of sextants edentulous (non rehabilitated) is discernable (60%), while in more balanced dental situations (FU>4) the sextants with teeth presenting scores of 2 and 3 are more common (26.2% and 40.4% respectively). Similarly, situations in which CM>40 are primarily present in edentulous sextants (46.2%), versus sextants presenting scores of 2 and 3 (27.7% and 51.1% respectively) for situations in which CM>=40.

Conservation of a minimum of 20 teeth is necessary in order to maintain proper masticatory function. However, in our group, over ¾ of patients have fewer than 20 teeth in their mouths [2]. We observe a weak masticatory coefficient among our type 2 diabetic patients with teeth. 89% of patients have a masticatory coefficient under 60, and it is exacerbated among the poorly controlled patients. However the lower masticatory coefficient and low number of remaining teeth could be related to undernourishment or malnutrition [3–4]. Evaluation of the group of patients with teeth shows a clear prosthetic need among elderly diabetics. 50.8% of these patients need maxillary and/or mandibular rehabilitation, either due to a complete lack of rehabilitation or to an inadequate prosthesis or prostheses.

This is an ongoing study.

Reference

  1. Taylor  Gw,  Manz  MC,  Borgnakke  WS (2004)  Diabetes,  periodontal  diseases,  dental  caries,  and  tooth  loss :  a  review  of  the  literature. Comprend Contin Educ Dent 25: 179–184, 186–188, 190 [crossref]
  2. Krall E, Hayes C, Garcia R (1998) How dentition status and masticatory function affect nutrient intake. J Am Dent Assoc 129: 1261–1269 [crossref]
  3. Ervin  RB,  Dye  BA (2012) Number  of natural  and  prosthetic  teeth  impact  nutrient  intakes  of  older  adults  in  the  United  States. Gerodontology 29:  693–702 [crossref]
  4. Savoca  MR,  Arcury  TA,  Leng  X,  Chen  H,  Bell  RA, et al (2010)  Severe  tooth  loss  in  older  adults  as  a  key  indicator  of compromised dietary quality. Public Health Nutr 13: 466–474 [crossref]

Maternal Obesity and Risk of Stillbirth: A Population-Based Case Control Study and Investigation of Temporal Trends

DOI: 10.31038/EDMJ.2018246

Abstract

Objective

Obesity rates are increasing in women of child bearing age but it is unclear if the recognised risk of stillbirth from obesity is increasing over time. This study aimed to describe the association between stillbirth and maternal obesity and explore temporal trends.

Study design

Singleton stillbirth cases (1995–2012) in Fife, Scotland were used in a case control study matching for maternal age, parity and prematurity. Maternal height, weight at booking and relevant maternal and infant confounders were obtained for 271 stillbirths and 976 controls. Analysis included conditional logistic regression analyses using WHO categories on body mass index (BMI). Data were subdivided into 3 epochs to investigate temporal trends. The main outcome measures were multivariate odds ratio (OR) and confidence interval (CI) for stillbirth associated with BMI categories and change between epochs in OR for a stillbirth associated with maternal obesity.

Results

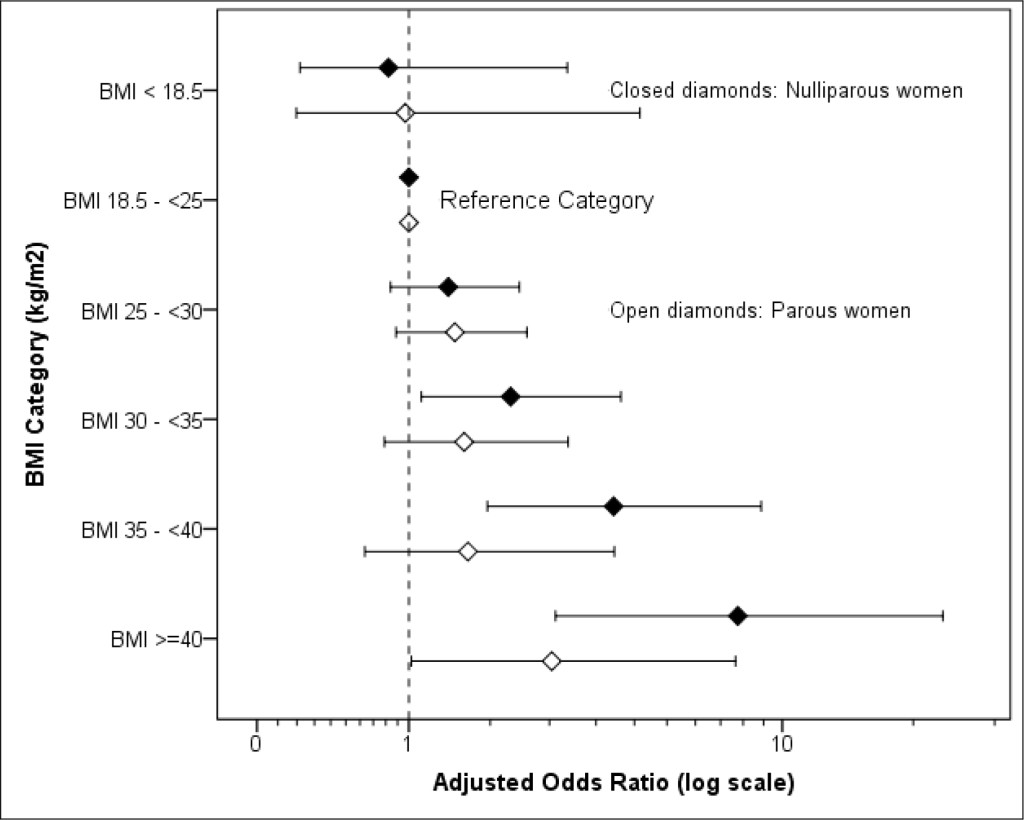
Risk of stillbirth was positively related to BMI category even after adjusting for known confounders. The relationship was particularly marked in nulliparous women where the adjusted OR of stillbirth was 4.1 (95% CI 1.9 – 9.0) when BMI was 35-<40 and 8.0 (95% CI 2.9 – 21.9) if BMI was > = 40. The proportion of stillbirth cases with a maternal BMI > = 35 increased from 5.6% in 1995 – 2000 to 18.9% in 2001–2006 and to 23.1% in 2007 – 2012 (P = 0.001, test for trend). There were no equivalent trends in the controls. The difference in mean BMI between cases and controls increased from 1 kg/m2 (SE 0.6) in 1995–2000 to 3 kg/m2 (SE 0.8) in 2007–2012. The OR of a stillbirth associated with a BMI above the 90th percentile of the population distribution increased between epochs from 1.21 (P = 0.60) in 1995–2000 to 3.30 (P<0.001) in 2007–2012.

Conclusions

Maternal obesity is associated with an increased risk of stillbirth, particularly marked in nulliparous women with a BMI >35. The relative importance of maternal obesity as a risk factor for stillbirth may be increasing with time which has implications for future clinical practice and when interpreting the impact of the various interventions being developed to reduce stillbirth rates.

Keywords

Stillbirth, Maternal Obesity, Body Mass Index, Pregnancy, Temporal Trend.

Introduction

The prevalence of obesity amongst women of child-bearing age in the UK has shown a rising trend over the past 3 decades, in keeping with trends in other developed countries [1]. Studies of pregnant women at booking in England [2] and Scotland [3,4] have reported a doubling in the prevalence of obesity (defined as a body mass index, BMI of > = 30 kg/m2) between 1990 and the mid-2000s. Maternal obesity is associated with adverse pregnancy outcomes of which one is stillbirth [5–10]. Previous studies have suggested a strong link between pre-pregnancy obesity and the risk of stillbirth [11–13]. Furthermore, one study has suggested that stillbirths in obese women (compared with those in women of ideal body mass) more often occur at term or post-term, and are more likely to be classified as ‘unexplained’ [13]. It has been suggested that maternal obesity may be one of the most important modifiable risk factors associated with stillbirth [12] having a large population attributable risk relative to other features [8–10]. In Scotland the rate of stillbirths has remained stubbornly high [14] despite efforts to reduce it and the increasing prevalence of obesity in Scotland [15] and, in particular amongst pregnant women in the UK [2–4], may be a contributory factor. The purpose of the present study was to determine the magnitude of the association between maternal obesity and stillbirth in Scotland and to assess if its relative importance as a feature in stillbirths is increasing with time.

Materials and Methods

We used data from Fife (a county in east central Scotland with a stable population of about 360,000 and about 3,800 births per year) because BMI has been routinely measured at booking since the early 1990s. Stillbirths between 1995 and 2008 inclusive were identified from the Fife Birth Register. A stillbirth was defined as a baby delivered with no signs of life after 24 completed weeks of gestation [5]. An initial analysis of these data proved insufficient to meet the study’s required statistical power so we identified further cases from 2009 to March 31st 2012 from a list of all Fife births from the Information Services Division (ISD) of the NHS National Services Scotland maternity inpatient and day case records (SMR02) [16]. The obstetric records of stillbirths were reviewed (TM, AL) to exclude multiple pregnancies, women from ethnic minorities (<1% of total births) and cases with a listed cause of the stillbirth (for example, fetal anomaly, maternal medical disorders, maternal infection). For the remaining cases we used the respective registers to identify two control pregnancies on either side of the date of birth (+/- 7 days) of the stillborn infant. Women with multiple pregnancies and those from ethnic minorities were excluded from the control group. Pregnancies were matched for:

  1. Maternal age (+/- 5 years), [but for teenage mothers we sought controls aged as close as possible]
  2. Prematurity (term or preterm) where term was defined as 37+ weeks gestation. For preterm infants matching was done +/- 28 days of the date of birth.
  3. Parity (nulliparous or parous, where nulliparous was defined as a woman who had never given birth to an infant capable of survival).

Power calculations suggested we needed 260 cases, each matched to 4 controls to have an 80% chance of detecting an odds ratio of 1.5 (at 5% two-tailed significance) for a stillbirth associated with a BMI of > 30 kg/m2, assuming the prevalence of a BMI >30 in the control sample was 30% [17]. The number of stillbirths recorded on the two registers (1995–2012) was 335 cases, of which at least 300 (about 90%) were expected to be singletons. Data for the cases between 1995 and 2008 were collected from obstetric notes at booking and at delivery. Data for cases between 2009 and 2012 were taken from the SMR02 records that had been recorded from data submitted by the Fife Health Board from information held in the women’s obstetric notes.

We recorded the following maternal factors: age, height, weight (at booking), smoking history, details of past obstetric history (including history of previous stillbirth) and postcode, from which we derived the Scottish Multiple Index of Deprivation quintile [18]. Height and weight were used to calculate Body Mass Index (BMI = weight / (height2), kg / m2) which was categorised according to the World Health Organisation’s definitions (<18.5 underweight, 18.5–24.9 ideal range, 25–29.9 overweight or pre-obese, 30–34.9 obese class 1, 35–39.9 obese class 2, 40 or more obese class 3) [19].

The infant factors recorded were gestational age, mode of delivery, gender, birth weight and its percentile for gestational age based on population birth records from Scotland adjusted for infant gender and maternal parity [20]. Small for Gestational Age (SGA) was defined as a birth weight below the 10th percentile (<-1.282 Z-score) of the normal distribution and Large for Gestational Age (LGA) was defined as a birth weight above the 90th percentile (>1.282 Z-score).

Data were analysed with SPSS (version 20) using t-tests, comparison of proportions (Chi-square), analysis of variance and conditional logistic regression analyses. The 5% level was accepted as indicating statistical significance. The association between maternal BMI at booking and stillbirth was assessed in a univariate analysis and in multivariate analyses stratified by parity after adjusting for known confounders. Odds Ratios (OR) and their 95% Confidence Intervals (CI) were calculated for categorical variables, including BMI categorised into subgroups.

Results

Three hundred and thirty five stillbirths were identified, of which 33 were excluded (23 multiple pregnancies or births to women of ethnic minority, 6 with missing case notes and 4 with case notes but a missing BMI). Of the 302 remaining cases a further 31 were excluded (30 where there was a fetal abnormality or maternal infection listed as the cause and 1 for which the stillbirth was a consequence of a road traffic accident). Hence there were 271 stillbirths. For each of these cases we obtained 4 controls for 199 cases, 3 controls for 37 cases, 2 controls for 34 cases and 1 control for 1 case (976 controls in total).

Characteristics of cases and controls are given in Table 1. Matching of cases and controls for maternal age, parity and prematurity was satisfactory. In univariate analyses significant terms associated with an increased risk of stillbirth were maternal weight, BMI, birth weight and Small for Gestational Age (SGA). For SGA the unadjusted Odds Ratio (OR) for a stillbirth was 3.8 (95% CI 2.7 to 5.3). For BMI categories the linear test for trend was significant at P < 0.001, (ANOVA, F = 15.57).

Table 1. Characteristics of stillbirth cases and controls. Values are numbers (percentages) unless otherwise specified. Matching variables are in bold.

Characteristic

Cases (n=271)

Controls (n=976)

P-value *

Age (y): mean (SD)

28.4 (6.4)

28.3 (5.8)

0.70

Height (cm)

162.5 (6.7)

162.9 (6.3)

0.34

Body mass (kg)

73.9 (20.7)

68.3 (15.7)

<0.001

Body Mass Index (kg/m2)

27.9 (7.2)

25.7 (5.4)

<0.001

Body Mass Index:

<0.001

BMI < 18.5: n (%)

6 (2.2)

30 (3.1)

BMI 18.5-<25: n (%)

107 (39.5)

510 (52.3)

BMI 25-<30: n (%)

77 (28.4)

259 (26.5)

BMI 30-<35: n (%)

37 (13.7)

103 (10.6)

BMI 35-<40: n (%)

25 (9.2)

51 (5.2)

BMI >=40: n (%)

19 (7.0)

23 (2.4)

Smoking status:

0.57

Non- or former smoker: n (%)

173 (63.8)

639 (65.7)

Current smoker: n (%)

98 (36.2)

334 (34.3)

Gestational age, booking (wks): mean (SD)

12.0 (3.8) **

12.3 (4.1) **

0.34

Late Booking (> 20 weeks) (%)

4.4 **

5.6 **

0.49

Nulliparous: n (%)

143 (52.8)

510 (52.3)

0.88

Primigravida

108 (39.9)

374 (38.3)

0.64

History of previous stillbirth: n (%)

7 (2.6)

17 (1.7)

0.37

History of previous miscarriage(s)

55 (20.3)

225 (23.1)

0.34

History of previous termination(s)

37 (13.7)

139 (14.2)

0.80

Deprivation quintiles:

0.22

1 (most deprived)

68 (25.2)

281 (28.8)

2

82 (30.4)

230 (23.6)

3

54 (20.0)

196 (20.1)

4

32 (11.9)

137 (14.0)

5 (least deprived)

34 (12.6)

132 (13.5)

Male Gender: n (%)

140 (51.7)

521 (53.4)

0.62

Preterm birth n (%)

171 (63.1)

582 (59.6)

0.30

Birth weight (g): mean (SD)

1988 (1109)

2758 (856)

<0.001

Z-score birth weight: mean (SD)

-0.66 (1.33)

-0.003 (1.02)

<0.001

Small for gestational age †: n (%)

82 (30.3)

100 (10.3)

<0.001

Large for gestational age: ‡ n (%)

21 (7.7)

99 (10.2)

0.24

* Chi-square test (proportions) or unmatched t-test (continuous data).
** n=206 cases, 717 controls
† SGA below 10th percentile (< -1.282 Z-score birth weight)
‡ LGA above 90th percentile (> 1.282 Z-score birth weight)

A conditional logistic regression analysis including the maternal and fetal terms identified increased maternal BMI categories and an SGA infant as associated with stillbirth. The risk of stillbirth from a raised BMI was apparently greater in nulliparous than in parous women (Table 2, Figure 1) though the difference between them in odds ratios per BMI category was not statistically significant.

EDMJ 2018-115 - Ian W Campbell Scotland_F1

Figure 1. Adjusted odds ratio for stillbirth and BMI in Parous and Nulliparous women (adjusted, where relevant, for smoking status, primigravida, deprivation, fetal sex, SGA, LGA and history of previous stillbirth, previous spontaneous miscarriages and previous therapeutic terminations. For details see Table 2)

Table 2. Conditional logistic regression analysis of maternal and fetal factors and their association with stillbirth.

Characteristic

Reference category

Nulliparous Women

(n=646, 143 cases)

Parous Women

(n=584, 127 cases)

aOR

95% CI

P-value

aOR

95% CI

P-value

Body Mass Index (kg/m2):

< 0.001

0.33

BMI <18.5

18.5–<25

0.82

0.22–3.12

0.77

0.97

0.20–4.74

0.97

BMI 18.5–<25

BMI 25–<30

18.5–<25

1.39

0.84–2.31

0.20

1.47

0.89–2.43

0.14

BMI 30–<35

18.5–<25

2.18

1.12–4.27

0.022

1.57

0.79–3.14

0.20

BMI 35–<40

18.5–<25

4.09

1.86–8.99

< 0.001

1.62

0.64–4.11

0.31

BMI >=40

18.5–<25

7.98

2.91–21.89

< 0.001

2.84

1.02–7.88

0.045

Smoking status:

Current smoker

Non– or former smoker

1.54

0.96–2.48

0.07

0.73

0.44–1.18

0.20

Primigravida

Not first pregnancy

0.94

0.14–6.27

0.95

History of previous stillbirth

No previous SB

1.84

0.64–5.28

0.25

History of previous miscarriage(s)

No previous miscarriages

0.89

0.14–5.26

0.89

0.81

0.50–1.31

0.40

History of previous termination(s)

No previous terminations

0.74

0.12–4.42

0.74

0.97

0.52–1.80

0.93

Deprivation quintiles:

0.41

0.50

1 (most deprived)

Least deprived

0.72

0.32–1.64

0.44

0.87

0.41–1.82

0.71

2

Least deprived

1.20

0.56–2.59

0.64

1.27

0.60–2.67

0.53

3

Least deprived

1.23

0.57–2.66

0.59

0.74

0.34–1.61

0.46

4

Least deprived

0.93

0.40–2.18

0.87

0.83

0.37–1.89

0.66

5 (least deprived)

Sex of baby: Male

Female

0.82

0.54–1.24

0.34

0.96

0.62–1.48

0.84

SGA †

>=10th percentile

3.78

2.32–6.16

<0.001

3.76

2.17–6.52

<0.001

LGA ††

<=10th percentile

0.62

0.28–1.37

0.23

1.14

0.55–2.34

0.73

aOR adjusted odds ratio
† SGA below 10th percentile (< –1.282 Z–score birth weight)
†† LGA above 10th percentile (> +1.282 Z-score birth weight)

Data were split into three epochs (1995–2000, 2001–2006 and 2007–2012). The percentage of stillbirths with a maternal BMI of 30 or more did not differ significantly between periods but that where BMI was 35 or more, and where BMI was 40 or more did show a significant trend over time (P = 0.001 and P = 0.007, respectively). These patterns were not apparent in the controls (Table 3). The difference in mean BMI between stillbirth and controls also increased with time (Table 4). The Standard Deviation (SD) in BMI increased over time, particularly amongst the stillbirth cases (Table 4). To adjust for this change we pooled the cases and controls in each epoch and expressed each woman’s BMI as a Z-score. We then used logistic regression to calculate the odds ratio per unit Z-score (i.e. per SD) in BMI for each epoch and calculated the OR of a stillbirth for a woman with a BMI above the 90th percentile of the distribution (+ 1.282 SD). The OR of a stillbirth for a woman in this category increased over time from 1.21 in 1995–2000 (P = 0.60) to 3.30 in 2007–2012 (P < 0.001, Table 5). These ORs were little affected by also allowing for parity and SGA in a logistic regression.

Table 3. Percentage of stillbirth and controls with an increased maternal BMI (kg/m2) by time periods (1995 – 2012)

Time period

N of cases

BMI >=30 (%)

BMI >=35 (%)

BMI >=40 (%)

 Stillbirths

1995–2000

89

28.1

5.6

1.1

2001–2006

74

28.4

18.9

8.1

2007–2012

108

32.4

23.1

11.1

P-value x2

0.76

0.003

0.022

Test for trend (F),

P-value

(0.45)

0.50

(11.1)

0.001

(7.4)

0.007

 Controls

1995–2000

298

16.8

7.0

3.4

2001–2006

271

15.9

7.0

1.8

2007–2012

407

20.6

8.4

2.0

P-value x2

0.22

0.74

0.39

Test for trend (F),

P-value

(1.97)

0.16

(0.46)

0.49

(1.31)

0.25

Table 4. Difference in mean BMI (kg/m2) between stillbirth and controls by time period

Time period

Cases Mean BMI

(SD) (n)

Controls Mean BMI

(SD) (n)

Difference Mean (SE)

P-value
(t-test)

1995–2000

26.24

(5.31) (89)

25.25

(5.42) (298)

0.99 (0.65)

0.132

2001–2006

27.87

(7.20) (74)

25.23

(5.28) (271)

2.64 (0.90)

0.004

2007–2012

29.24

(8.26) (108)

26.26

(5.63) (407)

2.98 (0.84)

0.001

SD: standard deviation, SE: standard error

Table 5. Difference in odds ratio per standard deviation in BMI (kg/m2) by time period.

Time period

Mean BMI

(SD) (n)

OR / SD
BMI

95% CI

OR of a stillbirth if BMI above 90th percentile*

Chi-square

OR

95% CI

P-value

1995–2000

25.48

(5.41) (387)

1.19

0.94–1.50

0.28

1.21

0.60–2.45

0.60

2001–2006

25.80

(5.83) (345)

1.50

1.18–1.91

6.33

2.40

1.19–4.81

0.012

2007–2012

26.89

(6.38) (515)

1.52

1.25–1.86

18.42

3.30

1.87–5.83

<0.001

* Chi-square test

Discussion

We posed two questions. The first was to determine the magnitude of the association between maternal obesity and stillbirths. Our study confirmed the work of many others that maternal obesity is an important, independent risk factor associated with stillbirth [8–13]. The trend in increased risk of stillbirth was positively related to BMI category with an apparent stronger association in nulliparous than parous women, which also confirms the work of others [12]. The second question concerned the change in maternal BMI and apparent risk of stillbirth with time. The proportion of stillbirth cases with a maternal BMI > = 35 increased from 5.6% in 1995 – 2000 to 18.9% in 2001–2006 and to 23.1% in 2007 – 2012 (P = 0.001, test for trend). A similar, significant trend was noted for BMI > = 40 (P = 0.007). In comparison, there were no apparent equivalent trends in the controls. The mean and variance of maternal BMI of stillbirth cases also increased over time with the mean difference in BMI between stillbirth cases and their matched controls also increasing. An analysis adjusting for the increase in population variance revealed an apparent increase over time in the risk of a stillbirth from a raised BMI. The relative increase in maternal BMI may partly explain the apparent stubborn stability in the rate of stillbirths in Scotland over the past 2 decades which has remained at about 4–5 / 1000 total births [21].

This study used the WHO classification of obesity and benefited from a population-based source of BMI data that had been routinely collected from measured height and weight at booking since the early 1990s. This enabled us to look at trends over time using data of sufficient statistical power to detect change. Practice in recording BMI has varied in other health boards in Scotland and maternal BMI was not routinely available from the SMR02 records (ISD) before about 2003. We had sought 4 controls per case but were only able to achieve this with 73% (199/271) of stillbirths, though, despite this, our cases were appropriately matched. In addition, we excluded stillbirths with congenital abnormalities as these have been related to maternal obesity in a meta-analysis of 18 studies [22]. We did have history of diabetes and gestational diabetes for the 1995–2008 dataset but not for the SMR02 source (ISD data). However, a preliminary analysis of the 1995–2008 data did not reveal a trend in risk of stillbirth associated with diabetes though the overall prevalence was low (results not shown). Women with a raised BMI are at greater risk of gestational diabetes and hypertensive disorders of pregnancy [23] though, in a large, case-control study the association of maternal obesity and risk of stillbirth was not explained by diabetes or hypertension [9].

In estimating birth weight for gestational age we used population-based data from Scotland (1998–2003) that provided estimates adjusted for fetal sex and parity [20]. The mean Z-score and standard deviation of the 976 control pregnancies was -0.003 and 1.02, respectively, which were appropriate for a reference population where the expected mean and standard deviation would be 0 and 1, respectively. Our findings with respect to stillbirth risk, SGA and raised BMI may have differed had we used fully customised percentile charts for fetal size [24], particularly as 60% of pregnancies were preterm (<37 weeks) when the apparent differences between population based and customised percentiles in determining stillbirth risk in a fetus classified as SGA are larger [25].

Two studies in Scotland have reported an increase in mean maternal BMI of about 1–2 kg/m2 per decade [3,4]. The percentage of pregnant women in Glasgow with a BMI > = 30 at booking increased from 9.4% in 1990 to 18.9% in 2002/04 [3]. This reflects trends in other parts of the UK where the percentage of pregnant women with a BMI > = 30 was 7.6% in 1989 and 15.6% in 2007 [2]. A recent UK study of adverse pregnancy outcomes associated with obesity in nulliparous women reported an increased risk of stillbirth with raised maternal BMI whereby the occurrence of stillbirth in 3102 women with a BMI 20-<25 equated to 1 stillbirth in 443 pregnancies and in 105 women with a BMI >40 to 1 stillbirth in 26 pregnancies [26]. These findings, and our data, raise concerns over future stillbirth rates in the face of a growing epidemic in population obesity in Scotland [15] particularly amongst teenage girls.

Recommendations on the management of obese pregnant women have been made for the UK [27] and, more recently, by the European Board and College of Obstetrics and Gynaecology (EBCOG) which has published standards of care for obstetric and neonatal services to be adopted across Europe [28]. It is recommended that women of child-bearing age with a BMI >30 should have access to services offering advice on weight management pre-conception and be warned of the obstetric risks associated with a raised BMI. Such advice should also be given during antenatal care. However, evidence suggests compliance with providing advice in both circumstances is poor [29]. The EBCOG report recommends all units use multidisciplinary input to develop clear policies and protocols for the care of women with a BMI>30 who should be risk assessed at each antenatal visit. The UK guidelines recommend additional scans in the third trimester for evidence of, amongst other conditions, growth restriction that is associated with about half of all stillbirths [30, 31]. However, sonographic visualisation can be compromised as a result of obesity [32], which in itself could reduce the potential for detection of growth restriction and congenital abnormalities [33]. Finally, it has been suggested that obese women may be less perceptive of reduced fetal movement than women of a healthy weight [12].

In Fife, pregnant women are offered advice and guidance on healthy lifestyle choices. Those overweight or obese are invited to join classes on weight management and offered one-to-one advice from a dietician though anecdotal evidence suggests uptake is inconsistent. Information is given regarding the maximum recommended weight gain throughout pregnancy depending on their BMI. However, the increased risk of stillbirth is apparently related to BMI during early pregnancy rather than to weight gain during it [11, 34] which reinforces the need for greater pre-conception weight management.

What of studies seeking the views of women? In a recent survey of 428 overweight and obese pregnant women in Fife 81% were concerned about their current weight but 39% were unconcerned about potential weight gain during their pregnancy [35]. Of 252 women who were in their second or subsequent pregnancy 47% had failed to return to the pre-pregnancy weight associated with their previous pregnancy. Inter-pregnancy weight gain can increase the risk of stillbirth in a subsequent pregnancy [36, 37]. In a recent qualitative study in the UK 40 women (32 currently pregnant) were asked about public health messages on the risks of stillbirth [38]. In general, they were resistant to the increased weight message, which they considered was not modifiable as ‘all pregnant women are overweight’.

In conclusion, this study has confirmed the association between maternal obesity and an increased risk of stillbirth with a particularly high risk in nulliparous women with a BMI > = 35. The relationship follows a ‘dose-response’ that adds to the body of evidence suggesting a causal link between stillbirth and excess weight in pregnancy per se [39]. The relative importance of maternal obesity as a risk factor, and putative cause of stillbirth (and other adverse pregnancy outcomes) may be increasing with time. This needs to be acknowledged when designing interventions to reduce the incidence of stillbirths. Our findings may be relevant for other populations given the recently published global estimates of obesity in women of child-bearing age [1]. Concerted efforts raising public awareness of the pregnancy-related consequences of obesity are urgently needed though presenting the message represents a challenge.

Contribution to authorship

TM and lC conceived the study with advice from HC. IC obtained the funding. TM, AL reviewed the obstetric notes and contributed to the literature review. AL collected and prepared the data for analysis. DJC advised on the study design, analysed and interpreted the data, contributed to the literature review and wrote the initial draft of the manuscript. All authors contributed to the manuscript and approved the final draft.

Ethics Approval

This was a secondary analysis of data currently available to NHS Fife (SMR02 and obstetric case records). Caldicott approval was obtained to access the obstetric records.

Funding

The study was funded from an NHS Fife research fund.

Acknowledgements

We are grateful to Mr Bryan Archibald of the Public Health Department, NHS Fife for extracting the data for 2009–2012 from the SMR02 data provided routinely from the Information Services Division, NHS Scotland.

References

  1. Ng M, Fleming T, Robinson M, Thomson B, Graetz N, et al. (2014) Global, regional, and national prevalence of overweight and obesity in children and adults during 1980–2013: a systematic analysis for the Global Burden of Disease Study 2013. Lancet 384: 766–781
  2. Heslehurst N, Rankin J, Wilkinson JR, Summerbell CD (2010) A nationally representative study of maternal obesity in England, UK: trends in incidence and demographic inequalities in 619 323 births, 1989–2007. Int J Obes 34: 420–428.
  3. Kanagalingam MG, Forouhi NG, Greer JA, Sattar N (2005) Changes in booking body mass index over a decade: retrospective analysis from a Glasgow Maternity Hospital. BJOG: Int J Obstet Gynaecol 112: 1431–1433.
  4. Bhattacharya S, Campbell DM, Liston WA, Bhattacharya S (2007) Effect of body mass index on pregnancy outcomes in nulliparous women delivering singleton babies. BMC Public Health 7: 168.
  5. Confidential Enquiry into Maternal and Child Health (CEMACH) (2008) Perinatal Mortality 2006: England, Wales and Northern Ireland. CEMACH.
  6. Fretts RC (2005) Etiology and prevention of stillbirth. Am J Obstet Gynecol 193: 1923–1935. [crossref]
  7. Smith GC, Fretts RC (2007) Stillbirth. Lancet 370: 1715–1725. [crossref]
  8. Flenady V, Koopmans L, Middleton P, Frøen JF, Smith GC, et al. (2011) Major risk factors for stillbirth in high-income countries: a systematic review and meta-analysis. Lancet 377: 1331–1340. [crossref]
  9. Stillbirth Collaborative Research Network Writing Group (2011) Association between stillbirth and risk factors known at pregnancy confirmation. JAMA 306: 2469–2479.
  10. Gardosi J, Madurasinghe V, Williams M, Malik A, Francis A (2013) Maternal and fetal risk factors for stillbirth: population based study. BMJ 346: 108. [crossref]
  11. Nohr EA, Bech BH, Davies MJ, Frydenberg M, Henriksen TB (2005) Prepregnancy obesity and fetal death: a study within the Danish National Birth Cohort. Obstet Gynecol 106: 250–259.
  12. Cnattingius S, Bergström R, Lipworth L, Kramer MS (1998) Prepregnancy weight and the risk of adverse pregnancy outcomes. N Engl J Med 338: 147–152. [crossref]
  13. Kristensen J, Vestergaard M, Wisborg K, Kesmodel U, Secher NJ (2005) Pre-pregnancy weight and the risk of stillbirth and neonatal death. BJOG 112: 403–408. [crossref]
  14. Information Services Division, NHS Scotland (2009) Trends in perinatal mortality in Scotland: a review over 30 years. Edinburgh, 2009.
  15. Obesity in Scotland. An epidemiological briefing. Public Health Observatory, Scotland. NHS National Health Services Scotland, 2007 (www.scotpho.org.uk)
  16. Information Services Division of the NHS National Services Scotland maternity inpatient and day case records (SMR02).
  17. Kirkwood BR (1988) Essentials of Medical Statistics. Blackwell Scientific Publications. London.
  18. Scottish Index of Multiple Deprivation (2012) www.scotland.gov.uk/Topics/Statistics/SIMD/.
  19. World Health Organisation (1997) Obesity: preventing and managing the global epidemic. Report of a WHO consultation on obesity, 1997. WHO, Geneva, 1998.
  20. Bonellie S, Chalmers J, Gray R, Greer I, Jarvis S, Williams C (2008) Centile charts for birthweight for gestational age for Scottish singleton births. BMC Pregnancy and Childbirth 8: 5.
  21. Healthcare Improvement Scotland. Scottish Perinatal and Infant Mortality and Morbidity Report 2012. Edinburgh, March 2014.
  22. Stothard KJ, Tennant PW, Bell R, Rankin J (2009) Maternal overweight and obesity and the risk of congenital anomalies: a systematic review and meta-analysis. JAMA 301: 636–650. [crossref]
  23. Scott-Pillai R, Spence D, Cardwell CR, Hunter A, Holmes VA (2013) The impact of body mass index on maternal and neonatal outcomes: a retrospective study in a UK obstetric population, Ȁ4–2011. BJOG 120: 932–939.
  24. Gardosi J, Clausson B, Francis A (2009) The value of customised centiles in assessing perinatal mortality risk associated with parity and maternal size. BJOG 116: 1356–1363. [crossref]
  25. Hutcheon JA, Zhang X, Cnattingius S, Kramer MS, Platt RW (2008) Customised birth weight percentiles: does adjusting for maternal characteristics matter? BJOG 115: 1397–1404.
  26. Mantakas A, Farrell T (2010) The influence of increasing BMI in nulliparous women on pregnancy outcome. Eur J Obstet Gynecol Reprod Biol 153: 43–46. [crossref]
  27. Centre for Maternal and Child Enquiries & Royal College of Obstetricians and Gynaecologists. CMACE & RCOG Joint Guideline. Management of women with obesity in pregnancy. London, 2010.
  28. European Board and College of Obstetrics and Gynaecology (2014) Standards of Care for Women’s Health in Europe: Obstetric and Neonatal Services 2014.
  29. Centre for Maternal and Child Enquiries (2010) Maternal obesity in the UK: findings from a national project. London, 2010
  30. Reddy UM1 (2007) Prediction and prevention of recurrent stillbirth. Obstet Gynecol 110: 1151–1164. [crossref]
  31. Vais A, Kean L (2012) Stillbirth-is it a preventable public health problem in the 21st century? Obstet Gynaecol Reprod Med 22: 129–134
  32. Hendler I, Blackwell SC, Bujold E, Treadwell MC, Wolfe HM, et al. (2004) The impact of maternal obesity on midtrimester sonographic visualisation of fetal cardia and craniospinal structures. Int J Obesity 28: 1607–1611
  33. Best KE, Tennant PW, Bell R, Rankin J (2012) Impact of maternal body mass index on the antenatal detection of congenital anomalies. BJOG 119: 1503–1511. [crossref]
  34. Stephansson O, Dickman PW, Johansson A, Cnattingius S (2001) Maternal weight, pregnancy weight gain, and risk of antepartum stillbirth. Am J Obstet Gynecol; 184: 463–469.
  35. Leslie WS, Gibson A, Hankey CR (2013) Prevention and management of excessive gestational weight gain: a survey of overweight and obese pregnant women. BMC Pregnancy Childbirth 13: 10. [crossref]
  36. Villamor E, Gnattingius S (2006) Interpregnancy weight change and risk of adverse pregnancy outcomes: a population-based study. Lancet 368: 1164–1170.
  37. Whiteman VE, Crisan L, McIntosh C, Alio AP, Duan J, et al. (2011) Interpregnancy body mass index changes and risk of stillbirth. Gynecol Obstet Invest 72: 192–195. [crossref]
  38. Stillbirth and Neonatal Death Charity (SANDS). Research Report: Stillbirth Public Health Messages, November 2013.
  39. Salihu HM (2011) Maternal obesity and stillbirth. Semin Perinatol 35: 340–344. [crossref]

Per oral vitamin B12 replacement therapy after gastrectomy and its optimal dose; retrospective study

DOI: 10.31038/JCRM.2018141

Abstract

Background: Postgastrectomy vitamin B12 deficiency is common metabolic sequel and worsens the quality of life of gastric cancer survivors. We usually selected intramuscular injection of vitamin B12 for vitamin B12 deficiency after gastrectomy. Recently, oral vitamin B12 replacement is reported. Therefore, we investigated retrospectively the efficacy of oral vitamin B12 replacement for gastric cancer patients with vitamin B12 deficiencyafter total gastrectomy.

Methods: We reviewed 73 patients with gastric cancer who underwent total gastrectomy and were treated vitamin B12 replacement. Patients were consisted of 56 males and 17 females and median age was 70 y/o. We investigated time to vitamin B12 deficiency after total gastrectomy, initial treatment of vitamin B12 replacement, and improvement of vitamin B12 deficiency.

Results: The median time to vitamin B12 deficiency was about 9 months. Initial treatment of vitamin B12 replacements were intramuscular injection for 42 patients, per oral replacement for 28 patients and intravenous injection for 3 patients. Finally, all patients were treated with per oral replacement and the serum vitamin B12 levels became within normal range. Final vitamin B12 doses of replacement therapy were 500 µg of 20 out of 73 pts, respectively.

Conclusions: After total gastrectomy, vitamin B12 deficiency is occurred in 100% patients and within 1 year after TG frequently. Vitamin B12 replacement therapy should be necessary and continued. According to our results, one vitamin B12 tablet a day is enough. The vitamin B12 deficiency symptoms could be prevented. 500 micrograms vitamin B12 replacement orally is maybe effective and necessary.

Keywords

vitamin B12, replacement therapy, total gastrectomy, gastric cancer, oral vitamin B12 replacement

Background

A variety of factors affects some patients after gastrectomy for gastric cancer. Some nutrition deficiencies result from disturbance of the normal anatomic and physiologic mechanism that control gastric function. Gastrectomised patients commonly lose weight. The degree of weight loss tends to parallel the magnitude of the operation. The cause of weight loss after gastric surgery generally are altered dietary intake or malabsorption. Vitamin B12 deficiency as malnutrition after gastrectomy is common complication [1, 2].

Normally, there is a vast excess of intrinsic factor. But after gastrectomy, there is little intrinsic factor. Especially, after total gastrectomy (TG), there is no intrinsic factor. Because of this, vitamin B12 deficiency is an inevitable complication after TG. Cumulative vitamin B12 deficiency rates were 100% for TG and 15.7% for distal gastrectomy (DG) 4 years after surgery. The median time to vitamin B12 deficiency was 15 months after TG, whereas the median time was not reached after DG [3].

In spite of vitamin B12 administration orally is not a reliable route after TG, Kim et al previously reported that serum vitamin B12 increased after oral and intramuscular administration of vitamin B12 in TG patients. In this report, for the oral vitamin B12 replacement, mecobalamin was administrated. The dosage comprised three 500 µg tablets of mecobalamin for a total of 1500 µg daily. For the intramuscular vitamin B12 replacement, cyanocobalamin was administered. The dosage was 1000 µg weekly for 5 weeks and monthly thereafter [4].

Even if an oral vitamin B12 replacement is effective, a question whether is necessary for three tablets a day, 1500 µg daily, or not is left. Are one or two tablets, 500 or 1000 µg daily, not an effective dose? Thus, we evaluated retrospectively the efficacy and safety of oral vitamin B12 replacement for vitamin B12 deficiency after TG in gastric cancer patients.

Materials and Methods

The study was a single-center retrospective assessment and was conducted at Yokohama City University Hospital, Department of Surgery, Yokohama, Japan.

Patients

Serum vitamin B12 was measured after the surgery that is total gastrectomy for gastric cancer. All the patients whose serum vitamin B12 levels were below 180 pg/ml were treated with the intramuscular or intravenous or oral vitamin B12 replacement. Inclusion criteria were a history of TG for gastric cancer irrespective of receiving neoadjuvant chemotherapy or postoperative adjuvant chemotherapy and level of vitamin B12 below 180 pg/ml regardless of vitamin B12 deficiency related symptoms. The exclusion criteria were as a history of receiving any vitamin B12 supplementation such as multivitamins or nutritive supplement food. We reviewed 73 patients (pts) who underwent TG for gastric cancer between July 2004 and April 2016. These pts were diagnosed vitamin B12 deficiency and treated vitamin B12 replacement. Pts were consisted of 56 males and 17 females and median age was 70 y/o (range: 39–85) (Fig. 1). We investigated time to vitamin B12 deficiency after TG, initial treatment of vitamin B12 replacement, and improvement of vitamin B12 deficiency.

JCRM 2018-120 - Yasushi Rino Japan_F1

Figure 1. Patients

Pts were consisted of 56 males and 17 females and median age was 70 y/o (range: 39–85).

pts; patients

Replacement therapy

For the intra-muscular vitamin B12 replacement (IM), cyanocobalamin was administered. The dosage was 500 µg every 1–3 month.

For the oral vitamin B12 replacement (PO), mecobalamin was administrated. The dosage comprised 500 µg tablet of mecobalamin for a total of 500–1500 µg daily.

For the intra-venous vitamin B12 replacement (IV), cyanocobalamin was administered. The dosage was 500 µg every 1–3 month.

Measurement of Vitamin B12

Before the start of treatment and every 1 to 6 months after vitamin B12 replacement, serum specimens were obtained. Serum vitamin B12 were measured with the chemiluminescent enzyme immunoassay in a UniCel DxH 800 analyzer (Beckman Coulter, USA).

Results

The median time to vitamin B12 deficiency was 273.5 days (about 9 months, range: 66–953 days) after TG (Fig. 2). Initial treatment of vitamin B12 replacements were IM (dosage: 500 µg cyanocobalamin) for 42 pts, PO (dosage: 1,000–1,500 µg mecobalamin a day) for 28 pts and IV (dosage: 500 µg cyanocobalamin) for 3 pts. Serum vitamin B12 levels were not normalized in 10 (23.8%) out of 42 pts of IM, 4 (14.3%) out of 28 pts of PO, 1 (33.3%) out of 3 pts of IV, respectively. There is no significant difference between IM, IV and PO. Finally, all pts were treated with PO. But serum vitamin B12 levels decreased in 4 (5.5%) out of 73 pts of PO. These 4 pts were not continuously administered vitamin B12. After explaining it not to discontinue vitamin B12 replacement therapy to these 4 pts, the serum vitamin B12 levels became within normal range (Fig. 3). Final vitamin B12 doses of replacement therapy were 500 µg of 20, 1,000 µg of 17, and 1,500 µg of 36 out of 73 pts, respectively (Fig. 4).

JCRM 2018-120 - Yasushi Rino Japan_F2

Figure 2. Median time of vitamin B12 deficiency

The median time to vitamin B12 deficiency was 273.5 days (about 9 months, range: 66–953 days) after TG.

TG; total gastrectomy

JCRM 2018-120 - Yasushi Rino Japan_F3

Figure 3. Vitamin B12 replacement therapy

Initial treatment of vitamin B12 replacements were IM (dosage: 500 µg cyanocobalamin) for 42 pts, PO (dosage: 1,000–1,500 µg mecobalamin a day) for 28 pts and IV (dosage: 500 µg cyanocobalamin) for 3 pts. “No” means that serum vitamin B12 levels were not normalized. “Yes” means that serum vitamin B12 levels were normalized. “No” was 10 (23.8%) out of 42 pts of IM, 4 (14.3%) out of 28 pts of PO, 1 (33.3%) out of 3 pts of IV, respectively. There is no significant difference between IM, IV and PO. Finally, all pts were treated with PO. But serum vitamin B12 levels decreased in 4 (5.5%) out of 73 pts of PO. These 4 pts were not continuously administered vitamin B12. After explaining it not to discontinue vitamin B12 replacement therapy to these 4 pts, the serum vitamin B12 levels became within normal range.

IM; intra-muscular vitamin B12 replacement, PO; oral vitamin B12 replacement, IV; intra-venous vitamin B12 replacement, pts; patients

JCRM 2018-120 - Yasushi Rino Japan_F4

Figure 4. Final dose of vitamin B12 PO

Final vitamin B12 doses of replacement therapy were 500 µg of 20, 1,000 µg of 17, and 1,500 µg of 36 out of 73 pts, respectively.

Discussion

Normally, there is a vast excess of intrinsic factor. But after gastrectomy, there is little intrinsic factor. Especially, after TG, there is no intrinsic factor. Because of this, vitamin B12 deficiency is an inevitable complication after TG. Cumulative vitamin B12 deficiency rates were 100% for TG and 15.7% for DG 4 years after surgery. The median time to vitamin B12 deficiency was 15 months after TG, whereas the median time was not reached after DG [3]. In this report, the median time to vitamin B12 deficiency was about 9 months after TG. Our result was shorter than previous report from Korea [3]. The difference between Japan and Korean dietary habits may be the cause of this result. It is described in the textbook as follows [5], body stores are of the order of 2–3mg, sufficient for 3–4 years if supplies are completely cut off. May TG progress a daily choler excretion or a consumption of the vitamin B12? Gastric atrophy is background of gastric cancer. Most gastric cancer patients are complicated with atrophic gastritis. A severe lack of intrinsic factor due to gastric atrophy [5]. Vitamin B12 storage before TG would be decreased in gastric cancer patients with gastric atrophy. This small storage of vitamin B12 may be the cause of the shorter median time to vitamin B12 deficiency after TG.

Vitamin B12 absorption has two mechanisms. One is passive, occurring equally through buccal, duodenal, and ileal mucosa; it is rapid but extremely inefficient, with < 1% of an oral dose being absorbed by this process. The normal physiologic mechanism is active; it occurs through the ileum and is efficient for small oral dose of vitamin B12, and it is mediated be gastric intrinsic factor. Dietary vitamin B12 is released from protein complex by enzymes in the stomach, duodenum, and jejunum; it combines rapidly with a salivary glycoprotein that belongs to the family of cobalamin-binding proteins known as haptocorrins. In the intestine, the haptocorrin is digested by pancreatic tripsin and the cobalamin is transferred to intrinsic factor. Intrinsic factor is produced in the gastric parietal cells of the fundus and body of the stomach. The intrinsic factor-cobalamin complex passed to the ileum, where intrinsic factor attaches to specific receptor (cubilin) on the microvillus membrane of the enterocytes. The intrinsic factor-cobalamin complex enters the ileal cells, where intrinsic factor is destroyed. After a delay of about 6 hours, the cobalamin appears in portal blood attached to transcobalamin II. Between 0.5–5 µg of cobalamin enter the bile each day. This binds to intrinsic factor, and a major portion of biliary cobalamin normally is reabsorbed together with cobalamin derived from sloughed intestinal cells. Because of the appreciable amount of cobalamin undergoing enterohaptic circulation, cobalamin deficiency develops more rapidly in individuals who malabsorb cobalamin that it does in vegans, in whom reabsorption of biliary cobalamin is intact [5, 6].

There is an absorption disorder by lack of intrinsic factor and daily choler excretion of vitamin B12. And altered dietary intake and malabsorption caused body weight loss. Because of these variety of factors after TG, vitamin B12 deficiency would be occurred within one year after total gastrectomy, frequently.

Recently, body weight loss after gastrectomy was independent risk factor for continuation of adjuvant chemotherapy and survival [7, 8].

Pts who was undergone TG have only passive absorption of vitamin B12. In this reason, intramuscular injection of vitamin B12 is recommended as a parenteral chronic treatment for pts with vitamin B12 deficiency after TG [1, 2]. Previous reports indicated that oral vitamin B12 successfully treats patients with pernicious anemia who have defects in the main vitamin B12 absorption mechanisms as a result of the presence of autoantibodies specific for intrinsic factor or a history of surgical resection of the ileum [9–11].

In spite of vitamin B12 administration orally is not a reliable route after TG, Kim et al previously reported that serum vitamin B12 increased after oral and intramuscular administration of vitamin B12 in TG patients. In this report, for the oral vitamin B12 replacement, mecobalamin was administrated. The dosage comprised three 500 µg tablets of mecobalamin for a total of 1500 µg daily. For the intramuscular vitamin B12 replacement, cyanocobalamin was administered. The dosage was 1000 µg weekly for 5 weeks and monthly thereafter [4]. After TG, vitamin B12 absorption has only one mechanism that is passive absorption with <1 % of an oral dose being absorbed by this process. When three 500 µg tablets of mecobalamin for a total of 1500 µg daily are administered, total amount of vitamin B12 absorption is about <15µg. On the other hand, between 0.5–5 µg of cobalamin excreted choler each day [5, 6]. Because of passive absorption and choler excretion, three 500 µg tablets of mecobalamin administration is reasonable replacement therapy for vitamin B12 deficiency after TG. But mecobalamin tablet has high concentration of vitamin B12. We presume that passive absorption rate would be higher than 1% when mecobalamin tablet is administered orally. Because our results showed that 500 µg tablets of mecobalamin oral administration maintained normal serum vitamin B12 levels in 20 out of 73 pts. We guessed it in this way. When only 500 µg of mecobalamin were administered orally, total amount of vitamin B12 absorption should be over 5 µg. Otherwise there is more quantity of passive absorption than the quantity of choler excretion, and it is impossible that serum vitamin B12 maintains within normal levels.

Vitamin B12 deficiency worsen quality of life after TG. Because pernicious anemia, bilateral peripheral neuropathy or degeneration(demyelination) of the posterior and pyramidal tracts of the spinal cord, and optic atrophy, cerebral symptoms or dementia would be occurred [12,13]. Hwang et al. [14] reported a patient who developed ataxic gait 9 years after TG for gastric cancer. Spinal cord degeneration due to vitamin B12 deficiency should be suspected in patients with neurological disorders, including gait disturbance, after gastrectomy, even as a long-term complication. Like this case, vitamin V12 deficiency symptoms are long-term complications. Vitamin B12 replacement therapy should be necessary and continued.

In conclusion, after TG, vitamin B12 deficiency is occurred in 100% pts and within 1 year after TG frequently. Vitamin B12 replacement therapy should be necessary and continued routinely. IM is a reliable therapy. But IM needs to go to clinic a month and is painful. According to our results, one tablet PO a day is enough. The vitamin B12 deficiency symptoms could be prevented and number of the going to clinic on pts could be reduced using this replacement therapy.

Conflict of interest statement:  The authors declare no conflicts of interest in association with the present study.

Acknowledgments: None

Abbreviations

TG: total gastrectomy

DG: distal gastrectomy

pts: patients

IM: intra-muscular vitamin B12 replacement

PO: oral vitamin B12 replacement

IV: intra-venous vitamin B12 replacement

References

  1. Brunicardi CF, Andersen DK, Billiar TR, Dunn DL, Hunter JG, Pollock RE. (2005) Schwartz’s Principles of Surgery, In: Dempsy DT, editor. Stomach. 8th ed. New York, McGraw-Hill: pp. 933–95.
  2. Townsent CM, Beauchamp RD, Evers BM, Mattox KL. (2012) Sabiston Textbook of Surgery, In: Mahvi DM, Krantz SK, editor. Stomach. 19th ed. Philadelphia: Elsevier Saunders; pp.1182–1226.
  3. Hu Y, Kim HI, Hyung WJ, Song KJ, Lee JH, Kim YM, et al. (2013) Vitamin B(12) Deficiency after gastrectomy for gastric cancer: an analysis of clinical patterns and risk factors. Ann Surg. 258(6): 970–5. doi: 10.1097/SLA.0000000000000214. [Crossref]
  4. Kim HI, Hyung WJ, Song KJ, Choi SH, Kim CB, Noh SH. (2011) Oral vitamin B12 replacement: an effective treatment for vitamin B12 deficiency after total gastrectomy in gastric cancer patients. Ann Surg Oncol. 18(13): 3711–7. doi: 10.1245/s10434-011-1764-6. [Crossref]
  5. Kasper DL, Fauci AS, Hauser SL, Longo DL, Jameson JL, Loscalzo J. (2015) Harrison’s Principles of Internal Medicine vol. 2, In: Hoffbrand AV, editor. Megaloblastic anemias. 19th ed. New York; McGraw-Hill; pp.640–9.
  6. Brunicardi CF, Andersen DK, Billiar TR, Dunn DL, Hunter JG, Pollock RE. (2005) Schwartz’s Principles of Surgery, In: Whang EE, Ashley SW, Zinner MJ, editor. Small intestine. 8th ed. New York: McGraw-Hill; pp.1017–5.
  7. Aoyama T, Sato T, Maezawa Y, Kano K, Hayashi T, Yamada T, et al. (2017) Postoperative weight loss leads to poor survival through poor S-1 efficacy in patients with stage II/III gastric cancer. Int J Clin Oncol. Feb 7. doi: 10.1007/s10147-017-1089-y. [Crossref]
  8. Aoyama T, Yoshikawa T, Shirai J, Hayashi T, Yamada T, Tsuchida K, et al. (2013) Body weight loss after surgery is an independent risk factor for continuation of S-1 adjuvant chemotherapy for gastric cancer. Ann Surg Oncol. 20(6): 2000–6. doi: 10.1245/s10434-012-2776-6. [Crossref]
  9. Berlin H, Berlin R, Brante G. (1968) Oral treatment of pernicious anemia with high doses of vitamin B12 without intrinsic factor. Acta Med cand. 184: 247–58 [Crossref]
  10. Kuzminski AM, Del Giacco EJ, Allen RH, Stabler SP, Lindenbaum J.(1998) Effective treatment of cobalamin deficiency with oral cobalamin. Blood. 92: 1191–8. [Crossref]
  11. Berlin R, Berlin H, Brante G, Pilbrant A. (1978) Vitamin B12 body stores during oral and parenteral treatment of pernicious anemia. Acta Med Scand. 204: 81–4. ) [Crossref]
  12. Kasper DL, Fauci AS, Hauser SL, Longo DL, Jameson JL, Loscalzo J. (2015) Harrison’s Principles of Internal Medicine vol. 2, In: Seeley WW,Miller BL, editor. Alzheimer’s disease and other dementias. 19th ed. New York; McGraw-Hill; pp. 2598–608.
  13. Kasper DL, Fauci AS, Hauser SL, Longo DL, Jameson JL, Loscalzo J. (2015) Harrison’s Principles of Internal Medicine vol. 2, In: Amato AA, Barohn RJ, editor. Peripheral neuropathy. 19th ed. New York; McGraw-Hill; pp. 2674–94.
  14. Hwang CH, Park DJ, Kim GY. (2016) Ataxic gait following total gastrectomy for gastric cancer. World J Gastroenterol. Oct 7; 22(37): 8435–8438. DOI: 10.3748/wjg.v22.i37.8435. [Crossref]

Burroughs Wellcome: The Seminal Link between Academia and the Pharmaceutical Industry

DOI: 10.31038/IMROJ.2018341

Abstract

This article reviews the research carried out by outstanding scientists to underscore the significant role played by Burroughs Wellcome Research Laboratories in erasing the differences in the objectives of scientists in academia and those in industry. These enlightened policies not only markedly advanced our fund of scientific knowledge in the biomedical sciences but led to the production of drugs that were of major benefit to mankind.

Introduction

Henry S. Wellcome (1853–1936) was an American-British entrepreneur who established the Burroughs Wellcome pharmaceutical conglomerate in London with his partner Silas Burroughs in the late 1880’s. Four years later, Wellcome formed a research component, which he named The Wellcome Physiological Research Laboratories. The creation of laboratories to conduct research was quite unusual in the late 1800’s, especially in association with a pharmaceutical enterprise [1–3]. When Henry Wellcome passed away in 1936, he left two legacies, his pharmaceutical company, The Wellcome Foundation and The Wellcome Trust, which distributed the financial resources for biomedical research [4].

This article will convey the company’s long time commitment to research by the fact that the staff scientists highlighted herein won a share of five Nobel Prizes (see below). At the same time, as a result of its long term involvement in basic research, Burroughs Wellcome became a major factor in bridging the gap that existed between academia and the pharmaceutical industry.

Sir Henry Hallett Dale (1875–1968)

Henry Dale (Figure 1), the renowned pioneer and leader in the discipline of Physiology/ Pharmacology, was the first major recruit to join Henry Wellcome’s new research initiative when he reluctantly accepted a research position at The Wellcome Research Laboratories in 1904 [5]. In those days it was unusual for a researcher at a university to give up his academic freedom to work in industry, and several colleagues advised him to decline the offer. However, Wellcome convinced Dale that he would be able to conduct basic research without concern for the business side of the organization.

Although Dale was free to select his own topics of research to investigate, Wellcome requested that Dale undertake the problem of ergot, which was marketed by the company as an abortifacient. Wellcome’s interest in ergot was in part commercially driven by the fact that Parke Davis was also marketing an ergot preparation for use in obstetrics. This competition prompted Henry Wellcome to also recruit a chemist, George Barger, whom he also encouraged to investigate ergot. Dale did not plan on ergot studies occupying a major portion of his time; however, his initial investigations into ergot properties proved to be unexpected and exciting and led him on a path that would ultimately provide the foundation for understanding the pharmacology of autonomic drugs and culminate in the awarding of the Nobel Prize.

IMROJ 2018-108 - Ronald Rubin USA_F1

Figure 1. Sir Henry Hallett Dale (1875–1968)

In 1906, Dale provided the first example of an adrenergic blocking agent by demonstrating that a substance obtained from ergot called ergotoxine reversed the hypertensive effect of sympathetic nerve stimulation and epinephrine (adrenaline) [6]. The sympatholytic action of ergotoxine prompted Dale to interpret his own studies in the light of recent work by Thomas Elliott, who in 1905 observed that the action of exogenous epinephrine mimicked the effects of sympathetic nerve stimulation [7]. Thus, ergotoxine became important in medical history because Dale’s observation that it inhibited sympathetic activity eventually led to the discovery of chemical synaptic transmission. In 1910, Dale also published a detailed account of the sympathomimetic actions of a number of biogenic amines synthesized by George Barger [8]. Unfortunately, Dale chose to exclude the epinephrine (adrenaline) series of sympathomimetics and overlooked the most physiologically relevant derivative – norepinephrine (noradrenaline) – and thus delayed for several more decades the discovery of norepinephrine as a physiological neurotransmitter.

Ergot yielded additional constituents, including histamine in 1907 and acetylcholine in 1913, although neither provided any results that could be marketed for sale. A few years later, an accidental observation made with a particular extract of ergot prompted Dale’s interest in the possible existence of chemical transmission across neuronal synapses. A conventional dose of this extract caused a profound inhibition of heart rate, and was later identified as the labile substance, acetylcholine. In a paper published in 1914, Dale identified a nicotinic and muscarine-like substance in ergot as acetylcholine [9]. In this article, Dale summarizes his work by noting that “acetylcholine occurs occasionally in ergot, but its instability renders it improbable that its occurrence has any therapeutic significance [10].” Nevertheless, such findings set the stage for the classical experiments of Otto Loewi in 1921 and beyond, which provided direct evidence in favor of the theory of chemical synaptic transmission.

Thus, because of Dale’s commitment to deciphering the puzzling effects of ergot, much of our knowledge of the action of autonomic drugs on the physiological components of the autonomic nervous system stems directly from the work of Henry Dale carried out at Burroughs Wellcome Research Laboratories. The quality of Dale’s work was recognized by his academic peers and had much to do with reducing the prevailing negative opinion of the scientific mission of pharmaceutical companies. Dale was subsequently elected to the Royal Society and later served as President of the Royal Society of Medicine. He was knighted in 1932, and shared the Nobel Prize with Otto Loewi for a discovery of fundamental physiological significance that had its origins in a drug company interested in the pharmacological properties of ergot.

Dale spent 10 years at the Burroughs Wellcome Research Laboratories at Brockwell Park, where a great deal of his most productive work was carried out. Although Dale was appointed the first Director of the Medical Research Council at the National Institute for Medical Research in 1928, his link to Burroughs Wellcome was not at an end. In 1936, he became associated with the Trust which had been created by the will of Henry Wellcome. He first served as a Trustee, then as Chairman from 1938 to 1960. He spent the last eight years of his life as its scientific advisor [11]. In addition, a special Henry Dale Fellowship sponsored by the Wellcome Trust provides funds for biomedical research. The basic research fostered by Henry Wellcome and implemented by Henry Dale was not only profoundly significant in its day, but it led Burroughs Wellcome to become a dominant force in biomedical research. And, it was Sir Henry Dale who set the landscape for those who were to follow.

Sir John Robert Vane (1927–2004)

John Vane (Figure 2) was considered one of Britain’s most eminent pharmacologists [12]. He began working with Joshua Harold Burn at Oxford in 1946, where he learned to utilize bioassays. At the time, chemical methods were generally unavailable and bioassays, which detected and measured sensitivity of tissue strips to biologically active substances, required laborious procedures. As a graduate student, I myself toiled at a bath containing aortic strips to measure catecholamines by bioassay, and my task was made much easier when I learned the fluorometric method of assaying adrenomedullary catecholamines at Burroughs Wellcome.

IMROJ 2018-108 - Ronald Rubin USA_F2

Figure 2. Sir John Vane

After graduating in Pharmacology and obtaining additional experience in the United States at Yale University, Vane returned to the United Kingdom where he was offered a position in The Department of Pharmacology at the University of London, which was headed by Sir William Paton. During those years, Vane, striving to move beyond outdated methodologies and antiquated concepts, further developed the blood-bathed organ bioassay system. By slowly perfusing mammalian blood over a series of isolated tissues in a cascade, Vane was able to measure the release of biologically active substances in a manner that simulated release in vivo. One of the first major biochemical processes to be discovered using the blood-bathed organ system was the conversion of angiotensin I to angiotensin II in the pulmonary vasculature. This finding led to the development of Angiotensin Converting Enzyme Inhibitors, which at the time revolutionized the treatment of hypertension. But, it was at the College of Surgeons that John Vane made an indelible mark on the scientific world by elucidating the mechanism of action of aspirin [13].

Vane left the Chair at the Royal College of Physicians in 1973, and followed the example of Henry Dale by joining The Wellcome Research Laboratories in the UK [14]. Vane, like Henry Dale, found that friends and colleagues were dubious about his accepting the offer to enter the industrial realm. Nevertheless, Vane was impressed by the fact that some seventy years before, Henry Dale had accepted a position at Burroughs Wellcome after experiencing academic life. Understanding that good science was not limited to academia, Vane undertook his new role as Director of Research and Development for a major pharmaceutical company.

The fact that he was able to take a number of his research team with him was a major factor in his final decision, and Vane never expressed any regrets about this move. The colleagues he recruited from the Royal College of Surgeons, included Salvador Moncada, Richard Gryglewski, and Rod Flower [15].This research group composed of very talented individuals of diverse ethnic origins, backgrounds, and traditions worked together in a highly competitive research environment. Vane’s laboratory became known as the Prostaglandin Research Group and served as a venue where basic pharmacological research could be carried out without being limited by outdated and narrow approaches to biomedical research. An example of the rewards that could be achieved by this philosophy was the other watershed in Vane’s storied history, the discovery of prostacyclin.

The years spent at Burroughs Wellcome was a challenging period for John Vane since he assumed a new set of managerial responsibilities, as well as research goals. Imbuing colleagues with the concept that it was possible to carry out quality science in an industrial setting, Vane advised them to follow their instincts with regard to drug discovery. This concept soon reaped rewards when in 1976 the Prostaglandin Research Group under the leadership of Salvador Moncada discovered prostacyclin and elucidated its pharmacological properties by utilizing the bioassay of extracts from platelets and vascular tissues [16]. Capitalizing on the versatility of the bioassay cascade, prostacyclin was found to be the main product of arachidonic acid metabolism in arteries and veins and its major effect was to inhibit platelet aggregation by stimulating adenylate cyclase.

John Vane presided over an environment in which there was a strong interaction with academia and the pharmaceutical industry. He, like Henry Dale, clearly demonstrated how it was possible to conduct quality scientific research in an industrial setting. During those years, Vane was awarded several honors, including Fellowship in the Royal Society, The Lasker Prize, and in 1982 the Nobel Prize for Medicine [17]. Salvador Moncada, who was also involved in the discovery of nitric oxide, was considered by some as deserving of a share of the Nobel Prize [18].

The work carried out by John Vane and his associates at the Wellcome Foundation spawned important research around the world that provided additional insights into the key factors that regulate blood circulation. In 1993, after much more information was accumulated about prostacyclin, Vane eventually reached the conclusion that the endothelium occupied a key role in regulating blood circulation and that prostacyclin, as well as nitric oxide, was responsible for defending against atherosclerotic angiopathies [19].

One of Vane’s other major contributions was to promote the link between scientists at academic institutions with those in the pharmaceutical industry, and he did a great deal to blur the boundaries that had separated these two groups of research scientists. In 1985, Vane returned to academia by establishing the William Harvey Research Institute at the Medical College of St. Bartholomew’s Hospital, where his research group focused its attention on cyclooxygenase-2 inhibitors and the interplay between nitric oxide and endothelin in the regulation of vascular function [20].

Sir James Whyte Black (1924- 2010)

The Nobelist, James Black (Figure 3), was one of the first scientists who utilized “rational design” for discovering new drugs [21,22]. Much of Black’s early work was carried out at the now defunct Imperial Chemical Industries (ICI Pharmaceuticals) in the United Kingdom from 1958–1964. Becoming aware of the importance of a balance between experimental research and drug development, Black and coworkers developed propranolol, the first clinically effective beta-adrenergic antagonist. The development of this drug not only represented a marked advance in the pharmacotherapy of hypertension, angina pectoris, and arrhythmias, but it also initiated further studies on the physiological role of beta adrenergic receptors by subsequently dividing them into beta-1 and beta-2 subtypes. At Black’s next position at Smith Kline and French (now GlaxoSmithKline), he introduced a new concept in the treatment of gastric ulcers by producing a drug that blocks histamine (H2) receptors.

IMROJ 2018-108 - Ronald Rubin USA_F3

Figure 3. Sir James Black (left), Gertrude Elion (middle), and George Hitchings (right)

Black wanted to escape from commercial constraints in order to have the freedom to pursue his research interests, so he returned to academia by accepting a Chair in Pharmacology at University College London. But, it was not long before John Vane invited Black to join him at Burroughs Wellcome in the United Kingdom in 1977. Black accepted the offer to serve as Director of Therapeutic Research in order to implement ideas he held about the reasons for the success and failure of industrial projects.

During the next six years at Burroughs Wellcome, Black failed to make much progress in his managerial role, but his research, now involving analytical pharmacology, produced a major advance in the description of the functional effects of drugs and their therapeutic potential. A collaboration with Paul Leff, which compared pharmacological data to quantitative models, developed a new framework for categorizing and analyzing drug actions. The most significant tool employed was the operational model, in which the quantitation of agonist activity in one test system enabled the prediction of activity in another system [23]. The principles of this analytical approach have since been employed in drug classification and the mechanisms of drug action [24].

However, despite the fact that Burroughs Wellcome enjoyed an impeccable reputation with regard to its research activity, Black spent seven years dealing with what he felt were traditional and conservative attitudes. For Black, the interplay between corporate commercial needs and personal scientific aspirations provided an ongoing dilemma. The perceived counterproductive policies were resolved when a small independent research unit in King’s College, London was established for him in 1984 and financially supported by Burroughs Wellcome. It had modern facilities, and together with talented researchers and doctoral students, Black was able to carry out non-profit research with complete independence. Black received his Nobel Prize there in 1988, together with George Hitchings and Gertrude Elion (Figure 3), and remained at Kings College as Professor of Analytical Pharmacology until 1993 when he became Professor Emeritus. In 1988, Black also established the James Black Foundation in the United Kingdom to promote his own vision of pharmacological research [25].

As a fulltime employee of pharmaceutical companies, including Burroughs Wellcome, Black was provided with the independence and resources to be successful. In this way, he was able to offer benefit to both his company and for the good of mankind. Although he derived little personal gain from his discoveries, his strong sense of independence, combined with his dislike for large institutions, caused him to frequently abandon positions whenever he felt the short-sightedness of corporations was obstructing progress in his research. Black’s outstanding quality as a researcher can best be described as being able to discover drugs by meticulous structural design based upon known agonists, rather than by random screening.

George Herbert Hitchings (1905–1998) and Gertrude Belle Elion (1918–1999)

George Hitchings and Gertrude Elion (Figure 3) were the only Nobel Laureates who spent their entire careers at Burroughs Wellcome, even when the company moved from Tuckahoe, New York to North Carolina during a period of sustained research activity. Their investigations covered a span of nearly 40 years and were previously chronicled in some detail [26].

Hitchings received his doctoral degree in Biochemistry from Harvard in 1933, where he studied analytical methods used in physiological studies of purines at a time when little was known about nucleic acid metabolism. After working at several colleges for ten years, Hitchings was hired in 1942 as the only scientist in the Biochemistry Department at Burroughs Wellcome at the Tuckahoe New York facility. Two years later, he recruited Gertrude Elion, a chemist by training, to join his small research group. Elion was then able to leave a rather tedious job of food analyst to join Hitchings when World War II made research positions available for women.

Although up to that time women had difficulty finding jobs in scientific research, Hitchings had no trouble working with women or men from different ethnic backgrounds or religious beliefs, and he encouraged Elion to learn as rapidly and as much as she could. Because she never felt constrained to restrict herself to the subject of chemistry, Elion, who possessed only a Bachelor’s and a Master’s degree, greatly expanded her scope of knowledge in biochemistry, pharmacology, immunology and virology. As a result, Elion began to take on more and more responsibility by concentrating almost exclusively on purines. Because of residency requirements at Brooklyn Polytechnic University, which would take her away from Burroughs Wellcome, Elion never obtained a formal doctorate. However, she was later awarded an honorary PhD degree from Polytechnic University in 1989 and an honorary SD degree from Harvard in 1998.

As previously noted, drug development had historically been a consequence of random trial and error, as in the case of sulfa drugs for example [27]. Because of the legacy provided by the vision of Henry Wellcome, Hitchings and Elion, like James Black, were free to diverge from this approach by using what then was called “rational drug design [28].” It was based upon the supposition that the understanding of basic biochemical and physiological processes formed the basis for the design and development of drugs. Because their research was based upon the premise that drugs could be designed which were based upon differences in nucleic acid metabolism in normal and abnormal cells, Elion and Hitchings employed specifically designed chemicals to form atypical DNA in abnormal cells which did not affect normal cells. By blocking nucleic acid synthesis, the growth of the abnormal cells would be inhibited. Thus, for example, Hitchings postulated that folic acid deficiency would lead to alterations in the synthesis of purines and pyrimidines and thus DNA.

By 1950, this line of research reaped major dividends when Hitchings and Elion synthesized two antimetabolites, diaminopurine and thioguanine. These substances proved to be effective in the treatment of leukemia. In 1957, further alterations in chemical structure led to the production of azathioprine (AZT). This immunosupressant is now used to prevent the rejection of transplanted organs and to treat rheumatoid arthritis and other autoimmune disorders. However, in the 1980’s, because AZT was the primary treatment for AIDS, the United States government allowed Burroughs Wellcome to apply for full patent rights to the drug. As a result, Burroughs Wellcome was able to charge an exorbitant price for AZT to patients with AIDS, despite the fact that the majority of the company was owned by a charitable Foundation, the Wellcome Trust [29,30]. Thus, there was an aspect of the policies of Burroughs Wellcome that dimmed the luster of its legacy.

In 1967 Hitchings became Vice President in charge of research at Burroughs Wellcome, which virtually terminated his involvement in research and redirected his attention to philanthropy. Elion took over his position as Head of the Department of Experimental Therapy. In 1970, the group headed by Hitchings and Elion moved to Research Triangle Park, North Carolina, where they developed the first antiviral drug acyclovir, as well as allopurinol, which is used in the treatment of gout.

Although Henry Wellcome had always been resolute in his commitment to unencumbered biomedical research, Hitchings and Elion did not always find that their efforts were totally supported by management. Hitchings and Elion were subjected to interference by the Head of the Tuckahoe laboratories, William Creasy, who tried to persuade the chemists to work on projects that he favored. Eventually, Creasy relented, realizing that the successes achieved by Hitchings and Elion made it unwise to interfere with their work [31]. In marked contrast, Hitchings and his elite group had key collaboration from the Sloan-Kettering Institute to examine whether purines/pyrimidines possessed anti-neoplastic activity. Moreover, the financial support afforded by Sloan- Kettering enabled Burroughs Wellcome to expand and eventually become self-sustaining [32]. Thus, the ability of Hitchings and Elion to test their theories without interference by commercial considerations led to discoveries of important principles for drug treatment resulting in the development of new approaches to pharmacotherapy.

Hitchings and Elion were initially overlooked by the Nobel Committee. One reason perhaps had to do with the fact that the Nobel Prize Committee rarely honors the work of scientists who develop new drugs. However, in 1988 they were awarded the Nobel Prize, some 30 years after most of their major discoveries. Gertrude Elion underscored the profound significance of her work in a review published in Science in 1989, “…chemotherapeutic agents are not only ends in themselves but also serve as tools for unlocking doors and probing Nature’s mysteries [33].” When Hitchings retired in 1975, and Elion followed eight years later, another memorable chapter in the history of Burroughs Wellcome came to an end.

John J. Burns (1920–2007) and Allan H. Conney (1930–2013)

During the same period that Hitchings and Elion were making their invaluable drug discoveries in the Biochemistry Department, John Burns (Figure 4) joined Burroughs Wellcome as Vice-President and Director of Research in 1960. Prior to his arrival at the Tuckahoe New York facility, Burns had worked at the NIH and had provided valuable information about the biosynthesis and metabolism of Vitamin C (ascorbic acid) and the etiology of scurvy [34]. At Burroughs Wellcome, his seminal investigations demonstrated the clinical importance of microsomal enzyme induction. In particular, Burns demonstrated that phenylbutazone is converted in man to two major metabolites, one with anti-rheumatic activity, the other possessing uricosuric actions [35]. The importance of this basic research was underscored by the fact that during the 1960’s, the NIH provided financial support for the research being conducted at the Tuckahoe facility.

IMROJ 2018-108 - Ronald Rubin USA_F4

Figure 4. John J. Burns. Courtesy of ASPET)

Coincident with the advent of John Burns, a talented research group was formed in the Department of Biochemistry that included Allan Conney, Ronald Kuntzman, and Richard Welch. Providing fundamental knowledge concerning drug metabolism and its clinical implications, this group was the first to demonstrate the clinical significance of microsomal enzyme induction by showing that chronic administration of several drugs to animals stimulated their metabolism and decreased their toxicity [36]. Also by employing selective inhibitors, they were able to determine whether a drug possessed intrinsic pharmacological activity or owed its activity to a metabolite. This work was of considerable significance in the field of drug metabolism and led to early studies on individual differences in the metabolism of drugs in humans.

John Burns wore many hats as a scientist. While at Burroughs Wellcome, he was also an advisor to a number of biotech companies, a member and officer in a large number of national and international scientific committees, and served as a Visiting Professor of Pharmacology at Albert Einstein College of Medicine. In his capacity as an adjunct faculty member, Burns became thesis advisor to a graduate student, Louis Lemberger. Alfred Gilman, the Chairman of the Pharmacology Department was not enamored of the fact that Lemberger had graduated from a Pharmacy School. Nevertheless, Gilman allowed Lemberger to carry out his doctoral thesis with John Burns. At the time, I was a graduate student at Albert Einstein, and because of the prevailing views I was surprised that one of my fellow students had been allowed to carry out his research at an industrial setting.

Despite the vestiges of prejudice that still existed in academia about drug companies at the time, the legacy generated by Henry Wellcome endured. Subsequently, John Burns encouraged Lemberger to obtain his MD degree and gain further clinical training; and so, Lemberger went on to an outstanding career as Director of Clinical Pharmacology at Eli Lilly in Indianapolis Indiana and as Professor of Pharmacology Medicine and Psychiatry at the Indiana School of Medicine [37]. He was involved in the development of several centrally acting drugs, including Prozac, a commonly prescribed anti-depressant.

John Burns subsequently left Burroughs Wellcome in 1968 to serve as Vice President of Research & Development at Hoffmann LaRoche, where he helped to develop the famed Roche Institute of Molecular Biology. Adhering to the view that basic research would lead to practical results, Burns supported basic research as much as any pharmaceutical executive. The extensive research conducted by Burns and his colleagues on the metabolic fate and the mechanism of action of drugs provided a fundamental basis for discovering new drugs and improving their therapeutic use. After Dr. Burns retired from Hoffman LaRoche, he served as Adjunct Professor of Pharmacology at Weill Medical College and was scientific advisor to many biotech companies and a member of the National Academy of Sciences. However, his work at Burroughs Wellcome proved to be seminal.

The Biochemistry group led by Allan Conney (Figure 5) was also involved in investigating other areas of drug metabolism, including cytochrome P-450, a family of enzymes responsible for the biotransformation of many medications, toxic substances, and environmental chemicals [38,39]. Conney’s work provided the molecular basis for understanding how drugs induce tolerance and environmental chemicals produce mutagenesis and carcinogenesis.

Much of Conney’s career was spent in the pharmaceutical industry, first at Burroughs Wellcome and then at Hoffman-LaRoche, where he rejoined John Burns. Further recognition of Conney’s work came from a prestigious faculty appointment at Rutgers University in 1987, where he established the Department of Chemical Biology and founded the Laboratory for Cancer Research. At Rutgers University, Conney continued to carry out research mainly on cancer prevention [40]. His contributions were recognized by his election to the National Academy of Sciences in 1982, and as President of the American Society for Pharmacology and Experimental Therapeutics (ASPET) (1983–1984). During the years 1965–1978, Dr. Conney was among the 40 most cited scientists in the field of pharmacology.

IMROJ 2018-108 - Ronald Rubin USA_F5

Figure 5. Allan Conney

It was fitting that we end this article by recounting the work of Allan Conney, because it defines a gifted scientist who readily bridged the gap between industry and academia. The now entrenched alliances between academia and industry provided another important advance in mankind’s search for more effective medications. Once again, it took some time, but the overall lesson learned by scientists is that forward thinking and cooperation will always trump unfounded biases.

Epilogue

The research laboratories that Henry Wellcome set up first in the United Kingdom in 1880 and then throughout the world employed elite researchers who performed rational and outstanding biomedical research. As a result, the company set the stage for the advent of Pharmacology as an established biomedical discipline. Although the Burroughs Wellcome Research Institute is no longer a functional entity, having been assimilated by Smith/Kline/Glaxo in the 1980’s, the research arm of the company provided the path for academicians to join forces with industrial companies to produce medications that have extended human life and reduced human suffering.

References

  1. Church R, Tansey EM (2007) Burroughs Wellcome and Company: Knowledge, Trust, Profit and the Transformation of the British Pharmaceutical Industry  Crucible Books, Lancaster UK, Pg No :1880–1940
  2. Bailey P (2008) The birth and growth of Burroughs-Wellcome & Co. The Wellcome Trust, 2008.
  3. James RR. Henry Wellcome (1994) Hodder & Stoughton, London, United Kingdom.
  4. Bailey P (2008) Henry Wellcome’s Physiological and Chemical Research Laboratories. Wellcome Trust. 2008. http//www.wellcome.ac.uk./About-us/History/WTX052313.htm.
  5. Dale HH (1938) An autobiographical sketch. Perspec. Biol. Med. 1938; 1: 128–130. See also Dale HH. Introduction; In: Adventures in Physiology. London. Pergamon Press. pp x-xvi.
  6. Dale HH (1906) On some physiological actions of ergot. J Physiol 34: 163–206. [crossref]
  7. Elliott TR (1905) The action of adrenalin. J Physiol 32: 401–467. [crossref]
  8. Barger G, Dale HH (1910) Chemical structure and sympathomimetic action of amines. J Physiol 41: 19–59. [crossref]
  9. Dale HH (1914) The action of certain esters and ethers of choline, and their relation to muscarine. J. Pharmacol. Exp. Ther. 6: 147–190.
  10. Dale HH. (op cit. Ref 7). pg. 189.
  11. Sánchez García P (2010) [The neurotransmision from the other side]. An R Acad Nac Med (Madr) 127: 257–268. [crossref]
  12. Moncada S (2006) Sir John Robert Vane: 29 March 1927 – 19 November 2004. Biogr Mem Fellows R Soc 52: 401–411. [crossref]
  13. Vane JR (1971) Inhibition of prostaglandin synthesis as a mechanism of action for aspirin-like drugs. Nat New Biol 231: 232–235. [crossref]
  14. John R. Vane- Biographical. Nobelprize.org. Nobel Media AB 2014. Web. 7 Apr 2016.
  15. Flower R (2006) John Vane. A Biographical Sketch. In Memory of Sir John Vane. (Nistico, G. McGiff J & Born G. Editors); 2006; Roma; Exorma. pp. 53–55.
  16. Moncada S (1982) Eighth Gaddum Memorial Lecture. Biological importance of prostacyclin. Br. J. Pharmacol. 76: 3–31.
  17. Obituary (2004) Sir John Vane. The Telegraph.
  18. Howlett R (1998) Nobel award stirs up debate on nitric oxide breakthrough. Nature 395: 625–626. [crossref]
  19. Vane JR (1994) The Croonian Lecture, 1993. The endothelium: maestro of the blood circulation. Philos Trans R Soc Lond B Biol Sci 343: 225–246. [crossref]
  20. Moncada S (2006) Sir John Robert Vane: 29 March 1927 – 19 November 2004. Biogr Mem Fellows R Soc 52: 401–411. [crossref]
  21. Braunwald E (2010) Sir James W. Black MD, FRS. In Memoriam. Circ. Res. 107: 3–5.
  22. Black’s autobiographical sketch can be found in: Les Prix Nobel. The Nobel Prizes 1988; Editor Tore Frangsmyr. (Nobel Foundation) 1989. Stockholm.
  23. Black JW, Leff P (1983) Operational models of pharmacological agonism. Proc R Soc Lond B Biol Sci 220: 141–162. [crossref]
  24. Kenakin T, Christopoulos A (2011) Analytical pharmacology: the impact of numbers on pharmacology. Trends Pharmacol Sci 32: 189–196. [crossref]
  25. Wright P (2010) Sir James Black obituary: Nobel prizewinning pharmacologist who invented new drugs such as beta-blockers. The Guardian.
  26. Rubin RP. A brief history of great discoveries in pharmacology. Pharmacol. Rev. 2007; 59: pp. 311–314.
  27. Rubin RP (op. cit. Ref. 23). pp. 315–318.
  28. Turney J (2009) Rational drug design: Gertrude Elion and George Hitchings. Wellcome Trust. London, England.
  29. http://www.nytimes.com/1989/08/28/opinion/azt-s-inhuman-cost.html
  30. Emmons WM (1991) Burroughs Wellcome and AZT. (A): Faculty & Research. Harvard Business School Case 792–004.
  31. Turney J. (op. cit. Ref. 25).
  32. George H. Hitchings- Biographical. The Nobel Prize in Physiology or Medicine 1988. From Les Prix Nobel; The Nobel Prize 1988. Editor Tore Frangsmyr [Nobel Foundation]. Stockholm.1988.
  33. Elion G The purine path to chemotherapy. Science. 1989; 244: pg. 46.
  34. Kuntzman R and Conney A (2008) Dr. John J. Burns. 1920–2007. Obituary. Neuropsychopharmacology. 33: 458–459.
  35. Kuntzman R and Conney A. (op. cit. Ref. 34). pg. 458.
  36. Burns JJ (1964) Editorial. Implications of enzyme induction for drug therapy. Amer. J. Med. 37: 327–331.
  37. Albert Einstein College of Medicine (1989) Alumni. Louis Lemberger M.D, PH.D. Distinguished Alumnus.
  38. Conney AH (1967) Pharmacological implications of microsomal enzyme induction. Pharmacol. Rev. 19: 317–366.
  39. Conney AH (2003) Induction of drug-metabolizing enzymes: a path to the discovery of multiple cytochromes P450. Annu Rev Pharmacol Toxicol 43: 1–30. [crossref]
  40. Yang CS Suh N Stoner G, Dong, Z and Surh Y-J. Allan H (2013) Conney: In Memoriam (1930–2013). Cancer Prev. Res. 6: 1376–1377.

Effect of a Traditional Chinese Medicine combined therapy on Spleen-Qi deficiency HIV/AIDS patients: a randomized controlled trial

DOI: 10.31038/JCRM.2018135

Abstract

Objective: In order to observe the clinical therapeutic effects of the immune reconstitution (IR) granule on treating HIV/AIDS patients with Spleen-Qi deficiency.

Methods: One hundred Spleen-Qi deficiency HIV/AIDS patients were randomly divided into a TCM treatment group (TCMG) and a placebo-controlled group (PCG). TCMG patients were given oral administration of IR granule, in combination with Highly Active Anti-Retroviral Therapy (HAART). PCG patients were given oral administration of placebo granule in combination with HARRT therapy. Spleen-Qi deficiency symptoms of HIV/AIDS patients was determined after 6 months treatment , and patient’s CD4+ and CD8+ T lymphocyte absolute count was measured after treatment. The D values ratio, average polymorphism and discreteness among TCR- receptor gene in the surface γδ-T cells was measured after 6 months of treatment.

Results: a 6-month cohort study of 80 outpatients with Spleen-Qi deficiency HIV/AIDS was performed. In the treated group, the results showed that the Spleen-Qi deficiency symptoms, such as weakness and fatigue, diarrhea and abnormal defecation, had been significantly improved compared to control group, the CD4+ T lymphocyte absolute count of Spleen-Qi deficiency HIV/AIDS patients present improvement, Although it showed no significant difference (P > 0.05). It was found that in HIV/AIDS patients of Spleen-Qi deficiency, the average D value was significantly ameliorated after TCM treatment, and it suggested that the PCR products of γδ-T cell receptors (TCR-γ chain) had less variation and they were closer to normal distribution through treatment.

Conclusion: In this study, we proposed the pathogenesis of Spleen-Qi deficiency in HIV/AIDS patients, revealed some of the cellular immune pathogenesis, such as attenuation of the polymorphism of γδ-T cell receptor genes and enhancement mucosal immune activation profile in HIV / AIDS patients of Spleen-Qi deficiency. Through the exploration, we provided a new way to evaluate the effects of TCM dialectical Therapy on the HIV / AIDS patients of Spleen-Qi deficiency, which can guide clinical treatment of Traditional Chinese Medicine to improve treatment efficacy in HIV/AIDS.

Keywords

HIV/AIDS; Spleen-Qi deficiency; T lymphocyte; γδ-T cell receptor genes.

Introduction

AIDS is a chronic wasting disease, accompanied by the deficiency of the body’s immunity and resistance to disease [1]. In Chinese HIV/AIDS patients, the Spleen (Pi)-Qi deficiency symptom is the most proportion of Symptoms, up to 80% [2]. Usually, in theory of Traditional Chinese medicine (TCM) Spleen Qi is closely related to the immunity and body’s resistance to disease, especially linked to the integrity of mucosal immunity [3]. Recent studies showed that the mucosal immune system played important roles in HIV infection and pathological progress of AIDS. Most HIV infections are transmitted through mucosa, and it was observed that HIV / AIDS carriers have defects on the mucosal immune system during the pathogenesis of HIV infection [4]. Many researches indicated that the mucosal immune system of HIV carriers were activated by destroyed gastrointestinal mucosa, inflammatory cytokines and long-term consumption of highly active antiretroviral therapy (HAART) medications [5].

Therefore in this study, With randomized double-blinded placebo-controlled method adopted, clinical observation on 80 HIV/AIDS patients of Spleen-Qi deficiency symptom treated with the immune reconstitution (IR) granule combined  HARRT had been conducted. We compared the polymorphism of γδ-T cell receptors (TCR-γ chain) in HIV/AIDS patients of Spleen-Qi deficiency with them after treatment, which revealed their cellular pathogenesis of mucosal immunity in Spleen-Qi deficiency HIV/AIDS patients, and provide theoretical evidence for HIV /AIDS prevention and dialectical therapy by Traditional Chinese Medicine.

Materials and Methods

Research subjects

  • Case Collection and Grouping:  From September 2013 to January 2016, this study included HIV/AIDS patients from the Capital Medical University affiliated Beijing Ditan Hospital, Guangzhou Eighth People’s Hospital, Yunnan traditional Chinese Medicine Research Institute. Diagnostic criteria of HIV/AIDS patients was made according to the Ministry of health “AIDS and HIV infection diagnosis standard” (WS293-2008) and “AIDS diagnosis and treatment guide (2011 Edition)” Spleen-qi Deficiency Syndrome Diagnostic Criteria in TCM diagnostic criteria: According to “clinical technology solutions to treatment of AIDS using Chinese Traditional Medicine.” described previously [6]. TCM diagnostic criteria: According to “clinical technology solutions to treatment of AIDS using Chinese traditional medicine.” issued by the State Administration of traditional Chinese medicine of the P.R.C. in 2005. The TCM diagnostic criteria for deficiency of Spleen Qi syndrome include the primary symptoms. The primary symptoms were weakness and fatigue, food less anorexia, diarrhea and abnormal Defecation. Patients with 3 items of the primary symptoms could be determined by the Rome III diagnostic criteria.
  • Inclusion Criteria: The HIV/AIDS patients were recognized as an HIV antibody positive by western blot test. The absolute count of CD4+ T cell in HIV/AIDS patients was more than 50 cells/ul, and HIV RNA below the detection value. The HIV/AIDS patients who received HAART from more than 12 months to less than 24 months was less than 200 cells/ul, and who received HAART for more than 24 months was less than 350 cells/ul. All HIV/AIDS patients voluntarily participated in this study and signed the informed consent form. Standards of syndrome differentiation were based on “Clinical Technology Solutions of National Free TCM HIV/AIDS Treatment.
  • Exclusion criteria: Before entering the group, patients with serious opportunistic infection which not been controlled; Patients who are participating in clinical trials of other drugs; Patients with autoimmune diseases; Pregnant or lactating women, or ready to pregnant women; Any patient with renal insufficiency; patients with mental or language barriers, cannot fully understand the content of the test or to give good cooperation.

Randomization, double-blind method

  • This trial was adopted randomized double blinded placebo parallel controlled method, and was registered in the Chinese clinical trial registry, the registration number: ChiCTR-TRC-13003716. One hundred HIV/AIDS cases enrolled in this study were randomized into two groups. The whole observation course was 6 months. Statistical professionals using SAS software to generate random number table, a random process was achieved by clinical evaluation center of China Academy of Traditional Chinese Medicine. After determining the inclusion and exclusion criteria of the subjects, the researcher obtained the “subjects number” and “drug number” through the central randomization system.

Therapy

  • One hundred HIV/AIDS cases enrolled in the study were randomized into two groups, The treatment group with 50 cases received IR granule +HAART (d4T +ddI +NVP), while the placebo group with 50 cases received placebo +HAART (d4T+ddI +NVP);the treatment last for 6 months in either groups.
  • The IR granule were provided by Jiangyin Tian Jiang Pharmaceutical Co., Ltd. Specification: 5.5g/bag; Lot number: 1311327; The recipe consisted of Huangqi (Astragalus membranaceus), Dangshen (Codonopsis Pilosula), Lingzhi (Ganoderma Lucidum), Gouqizi (Fruit of Chinese wolfberry), Bajitian (Morinda Officinalis). The placebo is designed and manufactured by the above manufacturers. It was taken orally twice a day.
  • In the course of the study, 80 subjects completed the trial, in which include the treatment group 40 cases and the placebo group 40 cases. The treatment group: (43.64 + 11.2) years old, Height (165.87 + 7.52) cm, weight (58.56 + 8.41) kg; the placebo group: (43.92 ± 10.54) years old, Height (166.77 ± 7.12) cm, and weight (59.89 ± 9.35) kg. Immune indicators (The absolute count of CD4+ and CD8+ T cell), body temperature, heart rate, respiration, blood pressure, the baseline of symptoms and signs had no significant difference between the two groups.

Research methods

  • 2ml peripheral venous blood was collected in the morning, Mix the blood samples well in the blood collection tubes. Take 300ul anti-coagulated whole blood. DNA samples from whole blood cell were extracted with Promega Maxwell 16 Blood DNA Purification Kit. Protein concentrations in all samples were confirmed to meet the requirementsof fluorescentPCR (OD 260/280 values between 1.8and 2.0). CD4+an CD8+ T lymphocyte absolute count in patients and other relevant information were described previously [7].
  • Fluorescent PCR The primers were synthesized by Shanghai Shenggong bioengineer company. PCR amplifications were carried out in two tubes. Primersets for TCR-γchain and PCR program were described previously [8]. After PCR amplification, fluorescent PCR products were analyzed with ABI -3100 gene fragment analyzer and GeneMarker V1.95 scan analysis software. The area of Mean values, standard deviations, and Distances to mean (D value) of TCR-γchain distribution in samples and controls were recorded.

Medical ethics

In accordance with the Helsinki declaration, all patients signed informed consent, And a comprehensive understanding of the purpose, procedures, possible risks and benefits of this study before participating in the trial approved by China Academy of Traditional Chinese Medicine ethics committee.

Statistical analysis

All analyses were performed using SPSS software version 17.0. Data are shown with mean ± standard deviation. An independent sample t-test was used for quantitative data fitting a normal distribution. A paired sample t-test was used to compare the data from the two groups before and after treatment. P < 0.05 was considered as a statistically significant difference.

Results and Discussion

After 6 months of treatment, in the treated group, the results showed that the Spleen-Qi deficiency symptoms, such as weakness and fatigue, food less anorexia, diarrhea and abnormal Defecation, had been significantly improved, which compared to that of the control (Table 1).

Table 1. The score of Spleen-Qi deficiency symptoms before and after treatment

Treatment group

Control group

Before

After

Before

After

weakness and fatigue

2.08 ± 0.27

0.86 ± 0.58ab

2.06 ± 0.38

1.25 ± 0.35a

food less anorexia

2.13 ± 0.45

1.31 ± 0.38a

2.11 ± 0.41

1.35 ± 0.35a

diarrhea

2.15 ± 0.46

0.89 ± 0.39ab

1.96 ± 0.45

1.33 ± 0.50a

Data were shown as mean ± SD (n = 40). Statistical comparisons were made by the paired sample t-test.a indicates P < 0.05, compared to that of before; b indicates P < 0.05, compared to that of control.

In the treated group, CD4+ count increased on average, while in the control group it decreased on Average. Although it showed no significant difference as compared with before treatment, while CD8+ count in the IR granule group and control group presented an elevating rather than a decreasing trend (Table 2).

Table 2. Comparison of CD4+ and CD8+ Count between the two groups after 6 months of treatment

Treatment group

Control group

Before

After

Before

After

CD4+

209.12 ± 72.09

225.45 ± 76.23

212.78 ± 79.01

211.11 ± 80.45

CD8+

658.09 ± 251.12

632.65 ± 263.17

787.64 ± 441.98

736.52 ± 350.64

Data were shown as mean ± SD (n = 40). Statistical comparisons were made by the paired sample t-test

Compared to control group, the average D value of γδ-T cell receptor genes (TCR-γ f2 chain) in Spleen-Qi deficiency HIV/AIDS patients was significantly ameliorated after treatment. The discreteness of TCR-γ f1 chain did not show significant difference, yet indicating greater polymorphism after treatment (figure 1). And it suggested that the PCR products of γδ-T cell receptors (TCR-γ chain) in Spleen-Qi deficiency HIV/AIDS patients had less variation and they were closer to normal distribution through TCM dialectical therapy.

Defensing, one major function of spleen as stated in Miraculous Pivot (Lingshu), is closely associated with its immune function in Western Medicine. A famous saying, quoted from Master Zhang Zhongjing, that a healthy spleen can keep one from evils of the four seasons, explicitly points out the significance of spleen in human defensing function. Qi and blood transformation and production insufficiency due to the spleen deficiency could lead to weakening of human defensing strength. The rules of distribution and development of Traditional Chinese Medicine syndromes of HIV/AIDS cases was reported by Our research Team, the disease location of HIV infector is spleen, main syndrome is deficiency of Spleen Qi [9]. Therefore, strengthening Spleen Qi is a fundamental TCM treatment therapy. For example, our research Team reported that one randomized, doubleblinded, placebo-controlled clinical trial tested Aining granule plus HAART on 100 HIV/AIDS cases [10]. Aining granule consists of Astragali mongolici, Fructus lycii, Panax notoginseng, Poria cocos, and Radixet Rhizoma glycyrrhizae, which can tonify qi and invigorate the spleen. Although there was no significant difference between the two groups in viral load after treatment, CD4 + T counts declined less in the Aining group than in the control group. The treatment group showed significant improvement of symptoms such as fatigue, anorexia, and diarrhea. Meanwhile, Yi Ai Kang capsule, as a Chinese hospital herbal preparation, has been used to treat HIV/AIDS in Henan Province, and more than 4,500 infectors take this preparation every day [11]. Its main ingredients include Astragalus membranaceus, ginseng, Ligusticum chuanxiong, which can strengthens the Spleen Qi, invigorates vital energy. The treatment was effective in improving Spleen-Qi deficiency symptoms, such as reducing fatigue and spontaneous perspiration.

The purpose of TCM is to maintain the Spleen Qi and body resistance so as to arrest the progressing of the disease. If someone has enough strong Spleen Qi and body immunity through TCM, even if infected with HIV, he can live with it, being a long term HIV carrier, so as to postpone onset and death [12].

Current idea of Western Medicine to cure HIV/AIDS patients is firstly against for HIV virus (such as HAART therapy can suppress HIV replication), though HAART therapy can significantly reduce plasma viral load and reduce the morbidity and mortality of AIDS, but it is difficult to remove virus lurking in the cell, and long-term HAART therapy of HIV infection in asymptomatic people will directly impair the infector’s gastrointestinal mucosa, led to digestive discomfort (including diarrhea, abdominal distension) [13]. While Traditional Chinese Medicine (TCM) attaches great importance to regulate Spleen Qi and enhance the body’s resistance to disease. It was found that a lot of Chinese medicine could improve the gastrointestinal mucosa, strong Spleen-Qi and body immunity [14]. For example, it was reported Wendan granule can reduce the incidence of adverse symptoms caused by HARRT, especially gastrointestinal adverse symptoms [15]. In this study, the IR immune granule consists of Huangqi (Astragalus membranaceus), Dangshen (Codonopsis Pilosula), Lingzhi (Ganoderma Lucidum), Gouqizi (Fruit of Chinese wolfberry), Bajitian (Morinda Officinalis). It tonifies Spleen Qi, nourishes yin-yang, clears detoxifies. It was demonstrated that the IR granule plus HAART can improve the Spleen-Qi deficiency symptoms, such as weakness, diarrhea and abnormal Defecation, compared to the control group.

Now the research of immune reconstitution (IR) of HIV/AIDS patients is gradually paid more attention, but the indicators of clinical evaluation of Traditional Chinese Medicine (TCM) treatment’s efficacy focus more on HIV/AIDS patients’ clinical complaints, such as abnormal symptoms and their immune system function are still mainly based on CD4+ T lymphocyte count and viral load, which become the key problems to be concerned as soon as possible [16]. Although CD4 + T cell counts and HIV loads are gold standard evaluation criteria for AIDS therapy as recommended by the World Health Organization (WHO), CD4+ T lymphocyte count cannot fully reflect the functions of the immune system, such as the integrity of mucosal immunity; on the other hand, viral load measurement is not suitable for evaluation of TCM treatment’s efficacy on HIV/AIDS patients [17]. Studies have shown that the pathogenesis of AIDS that HIV virus directly killing CD4+ T cells in the body caused the decline in CD4+ T cells and thus triggered AIDS remains to be questionable, the degree of immune activation in HIV/AIDS patients can predict the progression of the disease better than viral load in plasma [18]. Recent studies showed that the mucosal immune system played important roles in HIV infection and pathological progress of AIDS [19]. Most HIV infections are transmitted through mucosa, and it was observed that HIV / AIDS carriers have defects on the mucosal immune system during the pathogenesis of HIV infection. Many researches indicated that the mucosal immune system of HIV carriers were activated by destroyed gastrointestinal mucosa, inflammatory cytokines and long-term consumption of highly active antiretroviral therapy (HAART) medications [20].

JCRM 2018-119 - Liuying China_F1

Figure 1. Comparison of gene polymorphism among γδ-T cell receptors (TCR-γ chain) between the two groups after 6 months of treatment.

D values of TCR-γ f1 chain in Treatment group (A1) and Control group (A2). D values of TCR-γ f2 chain in Treatment group (B1) and Control group (B2). *indicates P < 0.05, compared to that of before.

Recently, more and more reports have uncovered the associations between mucosal immune function and Spleen-Qi deficiency [21, 22]. It was summarized that immune activation mediators involved in the animal models of Spleen-Qi deficiency and found out that cytokines, inflammation in gastrointestinal mucosa were all closely related to the syndrome of Spleen-Qi deficiency, which directly certified the tight connection between mucosal immune function and Spleen-Qi deficiency [23]. In this research, a 6-month cohort study of 80 outpatients with Spleen-Qi deficiency HIV/AIDS tested the IR granule’s effects on regulation of immune activation molecules γδ-T cell receptors related to mucosal immune activation. The results suggested that one potential mechanism of action for the IR granule may lie in its ability to up-regulate polymorphism levels on γδ-T cell receptors, thereby modulating immune activation of γδ-T cell. Although γδ-T cells do not have CD4 receptors and HIV virus does not infect and damage them directly, they are critical in regulating mucosal immune system. Since they mainly exist on mucosal membranes, they are considered as the first line of defense when attacked by pathogens [24]. For example, γδ-T cell impairment in early stage of HIV-1 infection gets more and more attention, in the early stage of infection, the count of γδ-T cells decreased dramatically [25]. It has been reported that γδ-T cells could be marker cells during HIV infection and AIDS progress [26].

Theoretically, without specific stimulation of foreign antigens, TCR-γchain gene fragments of γδ-T receptors recombinate randomly. Correspondingly, the TCR-γchain gene fragment scans presented a typical bell-shaped Gaussian distribution in healthy individuale. Undamaged polymorphism of healthy γδ-T cell receptors ensures their potentials of recognizing various foreign antigens. In cases of activated immune system, such as in virus infected and lymphocytoma patients, TCR genes of γδ-T cell receptors may exhibit specific single combination and expression. Once the polymorphism of the surface receptor genes is damaged, the probability of being infected by other pathogens increases correspondingly. Recently, the changes of γδ-T cells in HIV-infected peripheral blood have been reported. Our post study revealed that TCR-γchain genes of γδ-T cell receptors in HIV/AIDS patients exhibited single recombination, impaired polymorphism, lowered complexity and increased system entropy [8]. The numbers and functions of γδ-T cells remain normal in HIV-1 infected patients without long-term non-progressor HAART therapy (natural viral suppressors, NVSs), while those of other HIV infected individuals couldn’t restore to the normal level even after HARRT treatment [27, 28].

From this point of view, it is worth knowing whether certain Chinese herbs, which directly regulate the functions of digestive mucosa and improve the Spleen-Qi deficiency symptoms, could help to recover γδ-T cell functions in HIV/AIDS patients of Spleen-Qi defiency. In this study, to some extent our results verified the immune activation state of γδ-T cell was improved in the Spleen-Qi deficiency HIV/AIDS patients through the treatment of the IR granule.

Conclusion

Currently, the research on the mechanism on TCM dialectical therapy among HIV/AIDS patients of Spleen-Qi deficiency is absent. In this study, with randomized, double-blind, controlled method and multiple-primer fluorescence PCR fragment analysis, gene recombination of γδ-T cell receptors (TCR-γ chain) following treatment of the IR granule was detected. Compared with control group, the study showed that the polymorphism of γδ-T cell receptor genes appeared recovered, and the mucosal immune activation modulated by γδ-T cell receptor genes in HIV / AIDS patients of of Spleen-Qi deficiency presented obviously improvement. This study provides a new way to evaluate the effects of TCM dialectical Therapy on the HIV / AIDS patients of Spleen-Qi deficiency.

Acknowledgments

This work was supported by the National Major Science and Technology Specific Project of China (No.2013zx10005001) and National Natural Science Foundation of China (No. 81573816) and National Natural Science Foundation of China (No. 81403271)

References

  1. Killian MS, Levy JA (2011) HIV/AIDS: 30 years of progress and future challenges. Eur J Immunol 12(41): 3401–11. [Crossref]
  2. Liu Y,  Zou W,. Xian QF, et al. (2013) Four hundred and eighty five cases of HIV/AIDS patients based on expert interpretation of characteristics of syndromes. Zhongguo Zhong Yao Za Zhi 38(15): 2468–71. [Crossref]
  3. Wang CF, Li Z, Xu LR. (2012) Discuss the spleen deficiency of AIDS pathogenesis from the point of view intestinal mucosal immune system damage. CJTCMP, 27(1): 72–74.
  4. Cao W, Mehraj V, Vyboh K, Li T, Routy JP. (2015) Antiretroviral therapy in primary HIV-1 Infection: Influences on Immune Activation and Gut Mucosal Barrier Dysfunction. AIDS Rev. 17(3): 135–46. [Crossref]
  5. George MD, Asmuth DM. (2014) Mucosal immunity in HIV infection: what can be done to restore gastrointestinal-associated lymphoid tissue function? Curr Opin Infect Dis.  27(3): 275–81. [Crossref]
  6. Jiang FL, Fu C, Ma JP, et al. (2011)Traditional Chinese medicine syndrome factors of patients with HIV infection or AIDS in China. Zhong Xi Yi Jie He Xue Bao 9(9): 955–64.  [Crossref]
  7. Xu JQ, Wang JJ, Han LF, et al. (2006) Epidemiology, clinical and laboratory characteristics of currently alive HIV-1 infected former blood donors naive to antiretroviral therapy in Anhui Province, China.Chinese medical journal 119(23): 1941–8. [Crossref]
  8. Sun M, Liu Y, Wang KL, et al. (2014) Characteristics study on the diversity of γδ-T lymphocyte receptor gene in the HIV/AIDS patients. Chinese Journal of Basic Medicine in Traditional Chinese Medicine. 20(12): 1661–1664.
  9. Liu Y, Wang Y, Zou W, Wang J. (2010) Chinese Medical clinical research Analysis of HIV /AIDS, Chinese Journal of Basic Medicine in Traditional Chinese Medicine. 161(1): 80–81.
  10. Wang J, Liu Y, Zou W, He YL, Yan SY, Yuan YH. (2008) Clinical observations on 100 HIV/AIDS cases treated with Chinese herb Aining Granule plus HAART. Chin J AIDS STD (Chin). 14(2): 101–7.
  11. Xu LR, Guo HJ, Liu ZB, Li Q, Yang JP, He Y. (2015) Unified-Planning, gradedadministration, and centralized controlling: a management modality for treating acquired immune deficiency syndrome with Chinese Medicine in Henan Province of China. Chin J Integr Med. 21: 243–8. [Crossref]
  12. Yang FZ, Yan JH, Wang J. (2005) The research on the pathogenesis of AIDS in Spleen-Qi deficiency in TCM. Chinese Journal of Basic Medicine in Traditional Chinese Medicine. 11(2): 147–148.
  13. Cai J, Xiao J, Zhang Q et al. (2014) Side effects and tolerability of post-exposure prophylaxis with zidovudine, lamivudine, and lopinavir/ritonavir: a comparative study with HIV/AIDS patients. Chinese medical journal (Engl) 127(14): 2632–6. [Crossref]
  14. Liu ZB, Yang JP and Xu LR. (2015) Effectiveness and safety of traditional Chinese medicine in treating acquired immune deficiency syndrome: 2004–2014. Infectious Diseases of Poverty. 4: 59. [Crossref]
  15. Zhang XW, Guo HJ, Jiang F, Chen XM. (2012) Study on Wendan granule in treatment of gastrointestinal adverse caused by antiretroviral therapy. Chin J Exp Tradit Med Form (Chin). 18(7): 252–4.
  16. Wang J,  Zou W,  Liu Y. (2013) Analysis on efficacy action points of HIV/AIDS treatment with traditional Chinese medicine and antiretroviral drugs. Zhongguo Zhong Yao Za Zhi 38(15): 2504–6. [Crossref]
  17. Wang K L. (2006) The sense of reduction of AIDS mortality in China by early intervention. Journal of Public Health and Preventive Medicine 17(5): 118.
  18. Brenchley JM, Price DA, Schacker TW, et al. (2006) Microbial transloction is a cause of systemic immune activation in chronic HIV infection. Nat Med 12: 1365–1371. [Crossref]
  19. Mudd JC, Brenchley JM. (2016) Gut Mucosal Barrier Dysfunction, Microbial Dysbiosis, and Their Role in HIV-1 Disease Progression. J Infect Dis. 214 Suppl 2: S58–66. [Crossref]
  20. Torres RA, Lewis W. (2014) Aging and HIV/AIDS: pathogenetic role of therapeutic side effects. Lab Invest 94(2): 120–8. [Crossref]
  21. Wang FY, Su M, Zheng YQ, et al. (2015) Herbal prescription Chang’an II repairs intestinal mucosal barrier in rats with post-inflammation irritable bowel syndrome. Acta Pharmacol Sin. 36(6): 708–15. [Crossref]
  22. Liu F, Liu Y, Tian C. (2015) Effect of Rhizoma Atractylodis extract in protecting gastric mucosa and modulating gastrointestinalimmune function in a rat model of spleen deficiency. Nan Fang Yi Ke Da Xue Xue Bao. 35(3): 343–7, 354 [Crossref]
  23. Yu B, Zhou C, Zhang J, Ling Y, Hu Q, Wang Y, Bai K. (2014) Latest Study on the Relationship between Pathological Process of Inflammatory Injury and the Syndrome of Spleen Deficiency and Fluid Retention in Alzheimer’s Disease. Evid Based Complement Alternat Med.   2014: 743541. [Crossref]
  24. Cimini E, Agrati C, D’Offizi G, et al. (2015) Primary and Chronic HIV Infection Differently Modulates Mucosal Vδ1 and Vδ2 T-Cells Differentiation Profile and Effector Functions. PLoS One. 10(6): e0129771.
  25. Espíndola MS, Soares LS, Galvão-Lima LJ, et al. (2016) HIV infection: focus on the innate immune cells. Immunol Res. 64(5–6): 1118–1132 [Crossref]
  26. Pauza CD, Poonia B, Li H, Cairo C, Chaudhry S. (2015) γδ T Cells in HIV Disease: Past, Present, and Future. Front Immunol. 30 (5): 687. [Crossref]
  27. David J. Riedel DJ, Sajadi MM, et al. (2009) Natural viral suppressors of HIV-1 have a unique capacity to maintain γδ T cells. AIDS, 23(15): 1955–1964. [Crossref]
  28. Andrew M. Hebbeler AM, Propp N, Cairo C, et al. (2008) Failure to Restore the Vγ2-Jγ 1.2 Repertoire in HIV-infected Men Receiving Highly Active Antiretroviral Therapy ( HAART). Clin Immunol, 128(3): 349–357. [Crossref]

Impact of Chronic Disease State Management by Clinical Pharmacists on Diabetes Outcomes: Interim Results of a Prospective Pilot Study

DOI: 10.31038/EDMJ.2018245

Abstract

Objective: To provide program methodology and outcomes data identifying the impact of clinical pharmacy services provided to patients with diabetes mellitus.

Design: Prospective pilot study.

Patients: Adult patients with diabetes mellitus identified by a member of the primary care team were referred to the pharmacist-led disease state management program, a patient-centered medication therapy management (MTM) program developed through university collaboration with a local Federally Qualified Health Center.

Interventions: Pharmacist-delivered disease state management and medication therapy management across three or more face-to-face encounters over the course of six months.

Main outcome measures: Clinical outcomes were followed for 6 months from the time of referral and enrollment into the program. The primary diabetes endpoint, glycosylated hemoglobin, and patient-reported experience with care were collected at baseline and the end of the study. Clinical pharmacists documented the content of clinical visits, including the number of visits per patient, duration of encounters, number and proportion of identified medication therapy problems, and the number and proportion of associated interventions to optimize pharmacotherapy.

Results: Glycosylated hemoglobin was significantly reduced versus baseline at the 6-month assessment in both the intent-to-treat (−2.7%; P < 0.0001) and the per-protocol groups (−3.0%; P < 0.0001). Patient-reported satisfaction with care was higher for the pharmacists as compared to the primary care providers with significantly more patients rating the care received from the pharmacist as excellent (P = 0.001). The pharmacists completed 158 visits, identifying and resolving an average of 7.7 medication therapy problems for each subject included in the analysis.

Conclusion: In this model of MTM, the clinical pharmacists were able to identify and resolve interventions which subsequently resulted in statistically significant reductions observed in the primary diabetes endpoint and high levels of satisfaction with care.

Background

The pharmacist’s role in direct patient care is ever evolving. Traditionally, the pharmacist’s ability to provide care to patients has been associated with the provision of a medication product. However, the past several decades have witnessed a significant expansion in how pharmacists may provide care. Unlike other healthcare providers, pharmacists are unique in their extensive training in performing medication therapy management (MTM) as part of their clinical service, whereby MTM is defined by the American Pharmacists Association (APhA) [1] as “a distinct service or group of services that optimize therapeutic outcomes for individual patients.” The goal of MTM is to promote safe and effective medication use via collaboration among pharmacists and other healthcare professionals in order to achieve optimal patient outcomes. As described by the joint framework developed by the APhA and the National Association of Chain Drug Stores Foundation, [2] MTM services incorporate five core elements:

  1. A medication therapy review
  2. A personal medical record
  3. A medication-related action plan
  4. Intervention and/or referral, and
  5. Documentation and follow up.

There are a large number of publications in the literature that support the role of a pharmacist in disease state management via MTM services. However, there is a relative scarcity of structured studies evaluating the potential impact of MTM in the primary care medical home. In a review of randomized-controlled trials evaluating MTM services in this setting, it was determined that the most appropriate delivery methods were those that resulted in efficient implementation of recommended interventions [3]. In those studies that demonstrated positive impact, the practice settings were associated with an educational institution and promoted pharmacist autonomy, such as through the use of collaborative practice agreements authorizing pharmacists to directly adjust medications without need to consult the primary care provider (PCP) first. Study authors concluded that in order for MTM to be successful in the primary care medical home and to benefit patient care, it should be delivered discriminately to patients with a specific therapeutic problem as determined by the PCP. Also, MTM services should involve timely communication with PCPs to discuss therapeutic problems and routine patient follow up should be incorporated into the model to support adherence to changes in therapy.

In order to add to the evidence supporting the role of clinical pharmacists in delivering MTM in the primary care collaborative practice setting and to expand our current knowledge of the role of the pharmacist in the indigent population, a descriptive report of MTM was conducted at the FOCUS Clinic in Newark, New Jersey [4]. Over the course of 8 months, there were 313 documented patient-centered pharmacist interventions (PCPIs) affecting 69 unique patients across a range of chronic illnesses, such as hypertension, diabetes mellitus, dyslipidemia, and asthma.

While this report provides preliminary evidence supporting the role of a pharmacist in the management of a variety of disease states, it does not consider clinical outcome measures. Therefore, in 2017 we began a prospective pilot study to assess the impact of adding a pharmacist to the healthcare team in a Federally Qualified Health Center (FQHC). Through this study, pharmacists provide MTM services as suggested by Kucukarslan et al [3]. in the context of a structured study protocol that quantifies MTPs and interventions while also documenting impact on clinical outcome measures. This report presents interim data demonstrating the impact of chronic disease state management by clinical pharmacists on patients with diabetes mellitus at Henry J. Austin Health Center (HJAHC) in Trenton, New Jersey.

Methods

Between March 21, 2017 and March 21, 2018, 50 patients were referred to and enrolled into the study for management of diabetes mellitus by a clinical pharmacist. To be included in the study, patients may be referred to the pharmacist by any member of the healthcare team. In instances when the patient is referred by someone other than the PCP, the PCP is contacted to ensure that the PCP agrees with and supports the referral. If the PCP does not agree with the referral, the patient is not enrolled. Patients may be enrolled if they are 18 years old or older with at least one chronic medical condition in which pharmacotherapy is indicated and the total duration of pharmacotherapy is expected to continue for at least 6 months after referral. The disease state may be newly diagnosed or pre-existing. Patients are excluded from participation if they are less than 18 years old, pregnant, or referred for a disease state that is managed by an outside provider, is not chronic, or is one in which pharmacotherapy is not indicated and/or the total duration of pharmacotherapy is not expected to continue for at least 6 months after referral. Patients are administratively withdrawn from the study under the following circumstances:

  • The patient is no longer being managed by a HJAHC PCP for the referred medical condition;
  • The patient misses three appointments during the study period;
  • The pharmacist is unable to schedule an appointment within 30 days of a missed appointment;
  • The patient does not complete a minimum of three visits within the 6 month study period or the third appointment does not occur at least 30 days prior to the ideal study close out date; or
  • The patient becomes pregnant at any point during the course of the study.

Patients who are seen by an outside provider for management of the referred disease state are excluded as the pharmacists cannot work directly with that provider and will not be able to make interventions within a team-based setting. As the purpose of this study is to assess the impact a pharmacist can make on chronic disease states over a 6 month period of time through MTM, patients who do not have at least one chronic medical condition that is expected to last for at least six months and requires pharmacotherapy are excluded. Any patient who fails to adhere to the study protocol is withdrawn to allow the pharmacists to enroll additional patients who may benefit from the intervention. Pediatric patients and/or pregnant patients are excluded due to variable disease course throughout the six month period of time and potential to create a non-homogenous sample. Upon enrollment, the pharmacists collect demographic information, clinical information, including the primary outcome measure, the patient’s self-rated health, which is reported on a 5-point Likert scale, healthcare utilization over the 6 months prior to enrollment, including visits to the PCP, emergency departments visits, and hospital admissions, and the patient’s satisfaction with care as it relates to his or her PCP measured by a seven question patient-reported survey.

Patients meet with clinical pharmacists for a minimum of three study visits over the course of 6 months. Visits include a comprehensive medication review and MTM, with a specific focus on improving clinical outcomes for the referred disease state. Clinical pharmacists document all clinical measures, vital signs, and contents of the encounters in HJAHC’s Electronic Medical Record (EMR) system to make this information available to all HJAHC team members. Recommendations are also communicated to PCPs verbally or via electronic notifications within the EMR. Patients complete routine blood work as it relates to their medical conditions. Meetings with the clinical pharmacists are conducted independently or in conjunction with the PCP or other healthcare professional visits. The following data is collected at each visit:

  1. Date of study visit,
  2. Duration of study visit,
  3. Number and type of MTPs identified by the pharmacist, and
  4. Number and type of PCPIs.

Upon completion of the study, patients undergo a final study evaluation. In addition to collection of the patient’s self-rated health and healthcare utilization, the patient completes a satisfaction survey regarding care received from the pharmacist.

Outcomes

The primary outcome of this interim report is to evaluate the change in glycosylated hemoglobin (A1C) from baseline to end of study for those patients referred to the pharmacist for chronic disease state management of diabetes mellitus.

Secondarily, this report evaluates the content of the interaction between clinical pharmacists and ambulatory care patients by reporting on the frequency and duration of clinical pharmacy appointments, total number and type of MTPs identified and associated disease states, and total number and type of pharmacist-initiated interventions. Additionally, patient satisfaction with care is compared between care received from the PCP and care received from the pharmacist.

Statistical Analysis

The intention-to-treat (ITT) analysis for the primary outcome includes all the participants who had at least one additional A1C measurement after the baseline assessment and within six months of enrollment. The per-protocol (PP) population includes all participants who adhered adequately to the study protocol, which is defined as follows. The patients completed at least three visits with the clinical pharmacist with the third visit conducted no later than 30 days prior to the ideal end of study date. The patients continued to receive treatment for diabetes from a HJAHC PCP throughout the duration of the study. Patients did not miss three or more scheduled appointments with the pharmacists, and in the event that the patient did miss an appointment, that appointment was rescheduled within 30 days of the missed appointment. Patients did not become pregnant at any time during the trial.

Change in A1C is compared from baseline to end of study using two-sample T-test assuming unequal variances for the ITT analysis and a paired T-test for the PP analysis. Differences in patient satisfaction with care between care received from the PCP and the pharmacist are compared using a chi-square test. Only patients who completed both baseline and final provider satisfaction surveys are included in the analysis of patients’ satisfaction with care. Statistical analysis is performed in Microsoft Excel. Descriptive statistics are reported for the MTM analysis.

The point of care (POC) A1C machine used to measure the A1C is unable to detect the exact value for any A1C that is greater than 15%. Therefore, the A1C value is reported as 15% for any patient who experienced an undetectable A1C greater than 15% at baseline.

Results

Participant Population

Fifty patients were referred and enrolled into the study between March 21, 2017 and March 21, 2018 for management of diabetes mellitus. Of those patients, 47 were referred for type 2 diabetes mellitus (T2DM), one was referred for type 1 diabetes mellitus, one was referred for gestational diabetes, and one was referred for pre-diabetes. Thirty-one patients were referred by a nurse practitioner, 18 by a physician, and one by a registered dietician. Of the 50 patients referred and enrolled into the study, 27 patients were included in the ITT population and 15 were included in the PP analysis. All patients included in either analysis were referred for T2DM. Demographic information for the patients included in the ITT analysis is summarized in (Table 1).

Table 1. Demographic Data

Age (mean ± SD years)

53 ± 11.9

Sex, n (%)

Female

16 (59.3)

Male

11 (40.7)

Race, n (%)

Back or African American

18 (66.7)

White

9 (33.3)

Highest Level of Education, n (%)

None

1 (3.7)

Elementary/Middle School

5 (18.5)

Some High School

3 (11.1)

High School Degree

8 (29.6)

Some College

2 (7.4)

Associate Degree

5 (18.5)

Declined to Answer

3 (11.1)

Employment Status, n (%)

None

17 (63.0)

Part Time

3 (11.1)

Full Time

5 (18.5)

Declined to Answer

2 (7.4)

Annual Income, n (%)

$0 to $4999

9 (33.3)

$5000 to $9999

2 (7.4)

$10000 to $14999

1 (3.7)

$20000 to $25000

4 (14.8)

Greater than $25000

2 (7.4)

Declined to Answer

9 (33.3)

Housing Status, n (%)

Renting

12 (44.4)

Living with Others

5 (18.5)

Living in Own Home

4 (14.8)

Living in Public Housing

2 (7.4)

Declined to Answer

4 (14.8)

Number of Comorbidities (mean ± SD)

3.2 ± 1.8

Years with Diabetes (mean ± SD)

12.1 ± 9.9 (n = 26)

Of the 27 patients with at least one additional A1C result prior to the end of the study period, twelve patients were not included in the PP analysis. Three patients were lost to follow up, three patients did not reschedule a missed appointment within 30 days, two patients did not complete three visits with the pharmacists within the study period, two patients transferred care to an outside facility, one patient missed three appointments within the study period, and one patient was inappropriately enrolled into the study for diabetes management as the patient was referred for medication reconciliation. Four of the 27 patients included in the ITT analysis were newly diagnosed with T2DM at the time of referral.

Impact on A1C

Impact on A1C for the ITT and PP groups are summarized in Figures 1a and 1b. For the 27 subjects included in the ITT analysis, the mean baseline and final A1C results were 11.1% and 8.4%, respectively, resulting in a mean reduction in A1C of 2.7% (P=0.00003). For the 15 subjects included in the PP analysis, the mean baseline A1C was 10.9% and the mean final A1C was 7.9% to provide a mean reduction of 3% (P = 0.00007). (Figure 1a, 1b).

EDMJ 2018-114 - C. McCarthy USA_F1

Figure 1a. Impact of Pharmacist Management of Diabetes on A1C for Intent-To-Treat Population

EDMJ 2018-114 - C. McCarthy USA_F2

Figure 1b. Impact of Pharmacist Management of Diabetes on A1C for Per Protocol Population

Medication Therapy Management

Overall, the pharmacists conducted 158 visits with those patients included in the ITT analysis. During these visits, the pharmacists identified a total of 209 MTPs and associated PCPIs (Table 2).

Table 2. Summary of Medication Therapy Management Visits

Number of Patients Included in Analysis (n)

27

Number of Visits with the Pharmacist (n)

158

Average Duration of Visits with the Pharmacist (minutes)

26.2

Total Number of Medication Therapy Problems Identified (n)

209

Average Number of Interventions Per Visit (n)

1.3

Average Number of Interventions Per Patient (n)

7.7

The most common disease states requiring pharmacist intervention were T2DM (61.2%), hypertension (11.5%), dyslipidemia (5.3%), and vitamin D deficiency (3.3%). The most common MTPs identified by the pharmacists included an indication for additional medication therapy (29.7%), medication nonadherence (26.8%), sub-therapeutic medication dosage (20.5%), and presence of an adverse drug reaction (10.0%). Common associated PCPIs included counseling the patient or caregiver (35.4%), initiating therapy (30.1%), increasing dosage (20.6%), and discontinuing therapy (7.2%).

(Table 3) provides a summary of the number of patients for whom diabetic medication therapy required adjustment and the types of interventions made.

Table 3. Patients Requiring Adjustment of Diabetes Medication Therapy

Type of Intervention

Number of Patients [n (%)]

Any Intervention to Adjust Therapy

23

85.2

Dose Adjustment

17

63.0

Initiation of Therapy

16

59.3

Discontinuation of Therapy

5

18.5

Change in Formulation

3

11.1

Change in Frequency of Administration

1

3.7

(Table 4) highlights the number of patients for whom other interventions were recommended by the pharmacy team with relative frequency.

Table 4. Patients Requiring Other Interventions

Type of Intervention

Number of Patients [n(%)]

Identification and Management of Nonadherence to Any Medication

18

66.7

Identification and Management of Adverse Drug Reaction to Any Medication

17

63.0

Initiation or Adjustment of Antihypertensive for Uncontrolled Blood Pressure

10

37.0

Initiation of Vitamin D Therapy

6

22.2

Initiation of Vaccination

6

22.2

Initiation or Adjustment of Statin Therapy Based on ASCVD Risk

5

18.5

Initiation of Antiplatelet Therapy Based on ASCVD Risk

4

14.8

ASCVD = Atherosclerotic Cardiovascular Disease

Patient Satisfaction with Care

Eleven patients finished the study and successfully completed both pre-study and post-study provider satisfaction surveys. Two of the 11 patients (18.2%) reported an excellent experience with the PCP whereas 10 of the 11 patients (90.9%) reported an excellent experience with the pharmacist (P = 0.001). A comprehensive listing of all evaluated satisfaction criteria is listed in (Table 5).

Table 5. Patient Experience with Medical Provider Survey

Satisfaction Criterion

Provider

n (%)

Pharmacist

n (%)

P-value

The provider always explains things in a way that is easy to understand

4 (36.3)

11 (100)

0.001*

The provider always listens carefully to the patient

11 (100)

11 (100)

The provider always asks the patient to describe how the patient follows the provider’s instructions

7 (63.6)

11 (100)

0.027*

The provider has talked with the patient about, or helped the patient to make, specific goals for the patient’s health

9 (81.8)

11 (100)

0.138

The provider has asked the patient if there was a period of time when the patient felt sad, empty, or depressed

6 (54.5)

11 (100)

0.011*

The provider has talked with the patient about, or offered to talk to the patient about, a personal or family problem, alcohol or drug use, or mental and emotional illness

4 (36.3)

10 (90.9)

0.008*

The patient’s experience with the provider was rated as excellent

2 (18.2)

10 (90.9)

0.001*

*Statistically significant P-values

Discussion

It is estimated that approximately 30.3 million people of all ages have diabetes in the United States, with higher prevalence noted among Asians, non-Hispanic blacks, and Hispanics as compared to their non-Hispanic white counterparts. Prevalence of diabetes also varies significantly by education level, a marker for socioeconomic status, with higher rates among those of lower academic achievement. Uncontrolled diabetes is associated with a number of significant complications, including cardiovascular disease, extremity amputation, and diabetic ketoacidosis. As such, diabetes is a leading cause of death in the United States, ranking seventh in 2015, and results in significant healthcare costs. Total healthcare costs associated with diabetes in 2012 was 245 billion US dollars, and after adjusting for age group and sex, average medical expenditures among patients with diabetes were about 2.3 times higher than expenditures for those without diabetes [5].

Given the significant morbidity and mortality associated with diabetes, it is of paramount importance to explore novel methods of delivering healthcare services to this vulnerable population. One of the challenges facing the nation’s ability to adequately manage diabetes is the projected physician shortage over the next decade. It is estimated that due to population growth, an increase in the number of aging Americans, and retirement of practicing physicians, the United States could experience a shortage of up to 120,000 physicians by the year 2030. More specifically, the United States may experience a deficit of between 14,800 and 49,800 primary care physicians by the same year [6].

When considering this looming barrier, it is necessary to reflect upon how other members of the healthcare team may complement the physician and increase access to care. One of the methods of addressing this need is via disease state management by clinical pharmacists. This study adds to the growing body of literature to support the role of pharmacist-provided disease state management in the primary care setting, particularly as it relates to the management and control of T2DM.

Because patients included in the analysis were referred from PCPs, baseline A1C results are representative of level of disease state control when managed by the PCP alone, with the exception of four patients who were newly diagnosed with diabetes at the time of referral. Final study results are representative of the care provided by the clinical pharmacist via direct collaboration with the PCP. Mean reductions in A1C of 2.7% and 3% in the ITT and PP analyses, respectively, show that clinical outcomes can be improved when patients receive additional care from the clinical pharmacist in an FQHC. It is possible that the impact on A1C was even larger than reported as the baseline A1C values for two of the patients was not precise. For these two patients, the POC result was > 15% and the baseline result with labeled as 15% per protocol. By listing this number as 15%, the baseline A1C value is underestimated. Additionally, provider satisfaction survey results show that patients report receiving a high level of care from clinical pharmacists. With the exception of goal-setting and listening carefully to the patient, results of which were high for both PCPs and pharmacists, results for the pharmacists were statistically significantly higher than for the PCP regarding all other criteria. Though the focus of this interim analysis is management of diabetes mellitus, results from the MTM analysis indicate that pharmacists are able to manage a number of interrelated disease states. This demonstrates the comprehensive nature of disease state management.

Limitations

While results are compelling, one key limitation of this study is the lack of an active control arm. Without such, it may be argued that the improvement in outcomes is not solely due to the study intervention. This is particularly true for those patients who were newly diagnosed. While the baseline A1C may serve as a historic control for those patients with preexisting diabetes, this is not the case for patients who are new to treatment. To confirm that the results are truly due to pharmacist-delivered disease state management, a more robust study including an active control arm is advised.

Fortunately, similar studies have been conducted in patients with T2DM in which a control arm was included. For example, Brummel AR, et al [6]. published a study in which patients were invited to receive MTM services from pharmacists across a large healthcare organization. In this evaluation, patients who had diabetes and received MTM services were compared to a random sample of patients with diabetes who did not receive the service but were eligible to do so. While the magnitude of A1C reduction was not as large as what was seen in our study, when considering difference-in-differences, the results remained statistically significant. Results from this study indicate that even when a control arm is included, disease state management impacts clinical outcome measures.

Another limitation of our study was the lack of an economical evaluation. A key challenge when implementing pharmacy within the primary care medical home is the questionable cost-effectiveness of such an intervention. Considering that pharmacists are not recognized as medical providers in all states, reimbursement from third party payers for clinical pharmacy services is limited. However, a number of studies have been conducted that indicate pharmacist-led pharmacotherapy management of T2DM can improve clinical outcomes and result in a reduction in overall costs associated with the disease [7–10].

Finally, the number of patients included in our study was relatively small. As nearly 50% of patients were lost to follow up, this could have self-selected for the more adherent patients to be included in the analysis. Nonetheless, our results indicate statistically significant improvement in A1C. A larger sample size would be advised in order to determine if there is impact on healthcare utilization, which may offer additional insight into potential cost-savings. As this is an interim analysis, it is anticipated that the sample size will continue to grow, allowing for a more robust evaluation regarding cost-effectiveness. In addition, as the study progresses, a comparison arm may be included to control for potential confounders.

Conclusion

In summary, our analyses demonstrate that clinical pharmacists can improve clinical outcomes in patients with diabetes in an FQHC and that patients report high levels of satisfaction in the care that they receive. Therefore, primary care settings should consider methods of incorporating clinical pharmacist services into the healthcare model to increase patient access to MTM.

Acknowledgments

The authors would like to thank the following individuals for providing valuable assistance with data collection:

Dana Chippi, PharmD Candidate, 2019

Jinsu Im, PharmD Candidate, 2019

Young Kim, PharmD Candidate, 2019

Affan Aamir, PharmD Candidate, 2021

Nandini Patel, PharmD Candidate, 2020

Author Disclosure Statement

Drs. McCarthy and Bateman are employees of the Ernest Mario School of Pharmacy at Rutgers, the State University of New Jersey and practice clinical pharmacy at HJAHC. Drs. McCarthy and Bateman disclose no conflicts of interest in the research, authorship, and/or publication of this article.

References

  1. Medication Therapy Management (MTM) (2018) American Pharmacists Association Foundation website. https://www.aphafoundation.org/medication-therapy-management. Accessed September 30, 2018.
  2. American Pharmacists Association; National Association of Chain Drug Stores Foundation (2008) Medication therapy management in pharmacy practice: core elements of an MTM service model (version 2.0). J Am Pharm Assoc (2003) 48: 341–353.
  3. Kucukarslan SN, Hagan AM, Shimp LA, Gaither CA, Lewis NJ (2011) Integrating medication therapy management in the primary care medical home: A review of randomized controlled trials. Am J Health Syst Pharm 68: 335–345.
  4. McCarthy C, Gunkel K, Willard S, Findley PA, Wagner M (2014) Impact of neuropsychiatric pharmacists on an urban interdisciplinary primary care collaborative practice [abstract]. Journal of Pharmacy Practice 27: 318.
  5. Centers for Disease Control and Prevention (2017) National Diabetes Statistics Report, 2017. Atlanta, GA: Centers for Disease Control and Prevention, U.S. Dept of Health and Human Services; 2017.
  6. Association of American Medical Colleges (2018) New Research Shows Increasing Physician Shortages in Both Primary and Specialty Care. Published April 11, 2018. Accessed September 30, 2018.
  7. Monte SV, Slazak EM, Albanese NP, Adelman M, Rao G, et al. (2009) Clinical and economic impact of a diabetes clinical pharmacy service program in a university and primary care-based collaboration model. J Am Pharm Assoc (2003) 49: 200–208.
  8. Fera T, Bluml BM, Ellis WM (2009) Diabetes Ten City Challenge: final economic and clinical results. J Am Pharm Assoc (2003) 49: 383–391. [crossref]
  9. Brummel A, Lustig A, Westrich K, Evans MA, Plank GS, et al. (2014) Best practices: improving patient outcomes and costs in an ACO through comprehensive medication therapy management. J Manag Care Spec Pharm. 20: 1152–1158.
  10. Jameson JP, Baty PJ (2010) Pharmacist collaborative management of poorly controlled diabetes mellitus: a randomized controlled trial. Am J Manag Care 16: 250–255.

Imperative for Action and Advocacy: Relevance of Sexually Transmitted Infection (STI) Education for adolescents

DOI: 10.31038/AWHC.2018131


In the United States, prevalence rates of many sexually acquired infections are highest among adolescents and young adults [1]. While sexually transmitted diseases (STIs) affect individuals of all ages, STIs have a high incidence among young people. The Centers for Disease Control (CDC) estimates that youth ages 15–24 make up just over one quarter of the sexually active population, but account for half of the 20 million new sexually transmitted infections that occur in the United States each year[2]. In the United States, prevalence rates of many sexually acquired infections are highest among adolescents and young adults [2].

The reported rates of chlamydia and gonorrhea are highest among females during their adolescent and young adult years, and many persons acquire HPV infection at this time. Persons who initiate sex early in adolescence are at higher risk for STIs, along with adolescents residing in detention facilities, those who use injection drugs, adolescents attending STD clinics, and young men who have sex with men [1]. Factors contributing to this increased risk during adolescence include having multiple sexual partners concurrently, having sequential sexual partnerships of limited duration, failing to use barrier protection consistently and correctly, having increased biologic susceptibility to infection, and facing multiple obstacles to accessing health care [3]. The CDC recommends initiatives to effectively prevent and control the spread of STIs that include health services sexual risk assessment, chlamydia screening for sexually active women aged ≤ 25 years, and risk-based testing for other STIs [3].

STI prevention education should be integrated into the traditional educational systems to help combat this growing problem before it becomes an epidemic. Primary prevention and anticipatory guidance to recognize symptoms and behaviors associated with STIs are strategies that can be incorporated into any or all types of health-care visits for adolescents and young adults. Advocacy for education that is age relevant and realistic has to be integrated in equational strategies aimed at adolescents about risky behaviors that can predispose adolescents to an STI.

The identification and examination of influences on the rising number of STIs among youth and adolescents is needed. Health care providers should work with youth advocates, teachers and community agencies to seek to identify what factors are contributing to the increasing rate of STIs among adolescents; what types of education in the areas of STI prevention are utilized that have demonstrated efficacy.

Initiatives aimed at community outreach, preventative education and peer educator trainings have proven to be effective modalities are proven to be effective practices to help decrease rates of STIs in any given population [4]. Engagement will provide an effective strategy to help minimize the incidence of STIs. Advocacy for the mobilization of community resources and community engagement is advocated as a strategy to communicate effectively with adolescents about risky behaviors and STI risk factors and approaches to decrease the incidence of STIs among adolescents. Health care providers must work diligently to identify and implement strategies that include education, screenings for STIs, per counseling to mobilize resources to address the problem of STIs in adolescents. STI prevention initiatives should focus on behaviors that are relevant and focus on adolescents that consider social, psychological, and structural barriers that may impede health seeking for screening and treatment of STIs. Healthcare providers must consider influences on the incidence of STIs and provide information in the form of education, screening, and treatment modalities that are effective in providing health care and education to the adolescent population.

References

  1. Centers for Disease Control (2014) Sexually transmitted disease surveillance 2013. Atlanta: US Department of Health and Human Services.
  2. Leichliter JS, Copen C, Dittus PJ (2017) Confidentiality Issues and Use of Sexually Transmitted Disease Services Among Sexually Experienced Persons Aged 15–25 Years United States, 2013–2015. MMWR Morb Mortal Wkly Rep 66: 237–241.
  3. Centers for Disease Control (2015) Sexually Transmitted Diseases Treatment Guidelines, 2015. Recommendations and Reports. June 5, 2015 / 64(RR3/
  4. LaChausse RG (2006) Evaluation of the Positive Prevention HIV/STD Curriculum. American Journal of Health Education 37: 203–209.