Monthly Archives: October 2018

The Past, Present, and Future of Pancreas Transplantation for Diabetes Mellitus

DOI: 10.31038/EDMJ.2018235

Introduction

Pancreas transplantation was initially developed as a means to re-establish endogenous insulin secretion responsive to normal feedback controls and has evolved over time to a form of auto-regulating total pancreatic endocrine replacement therapy that can reliably achieve a durable euglycemic state without the need for either exogenous insulin therapy or close glucose monitoring. Pancreas transplantation is performed in patients who require administration of insulin because of type 1 or, less commonly, insulin-requiring type 2 diabetes, or following total pancreatectomy for benign disease [1]. Pancreas transplantation entails a major surgical procedure and the necessity for long-term immunosuppression so it is not offered universally to all patients with insulin-requiring diabetes but is usually directed to those that will already be committed to chronic immunosuppression [most commonly for kidney transplantation secondary to end stage diabetic nephropathy) [1]. In addition, candidates with potentially life-threatening metabolic complications from diabetes such as hypoglycemia unawareness or those who are failures of exogenous insulin therapy may benefit from pancreas transplantation in the absence of a kidney transplant [2]. A successful pancreas transplant is currently the only definitive long-term treatment that restores normal glucose homeostasis in patients with complicated diabetes without the risk of either severe hypo/hyperglycemia and may prevent, stabilize, or reverse progressive diabetic complications [1–3].

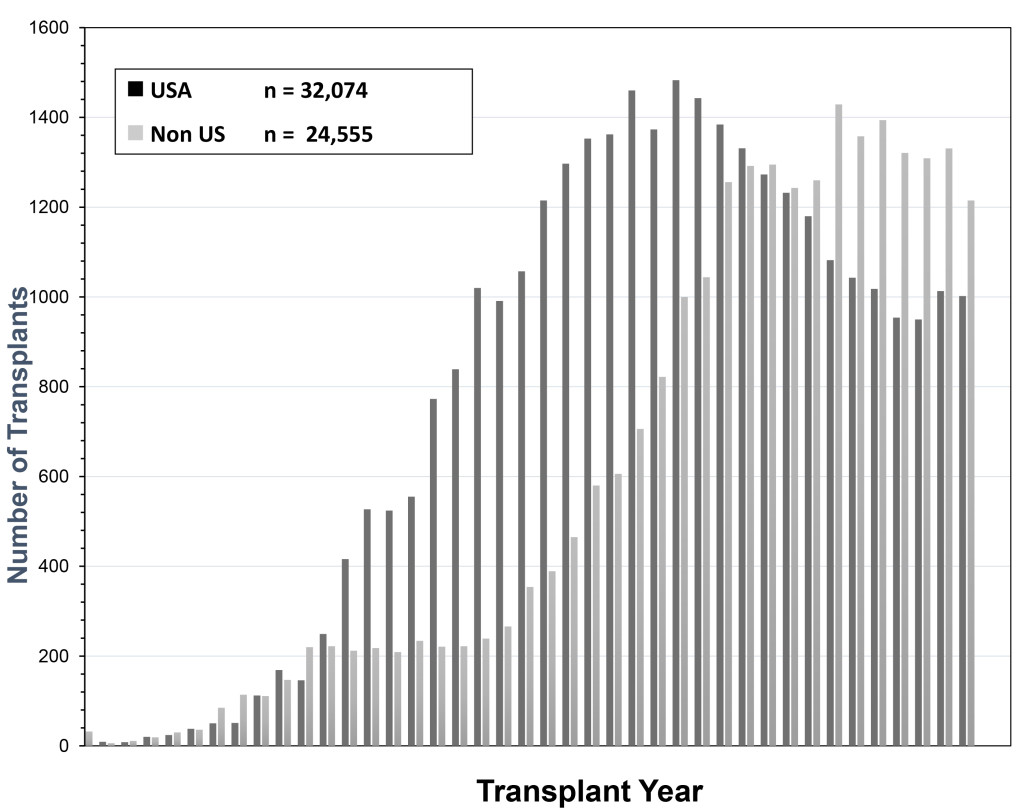
The history of pancreas transplantation largely parallels advances in clinical immunosuppression and surgical techniques. As of December 2017, more than 56,000 pancreas transplants were reported to the International Pancreas Transplant Registry [IPTR) including >32,000 from the United States [US) and >24,000 from outside of the US [FIGURE 1). [3–6) Pancreas transplantation in diabetic patients is divided into 3 major categories; those performed simultaneously with a kidney [SPK) transplant, usually from a deceased donor; those performed after a successful kidney [PAK) transplant in which the kidney transplant was performed from either a living [most commonly) or deceased donor; and pancreas transplantation alone [PTA) in the complete absence of the need for a kidney transplant. The latter two [PAK and PTA) categories are usually combined together as solitary pancreas transplants because the transplant is performed in the absence of uremia. Historically, solitary [PAK and PTA) transplants have had similar albeit inferior outcomes compared to SPK transplantation. In the US, the majority [84%) of pancreas transplants are currently performed as SPK transplants whereas approximately 16% are performed as either PAK or PTA cases [FIGURE 2) [3–6].
PowerPoint Presentation

Figure 1. Total number of pancreas transplants performed in the US and outside of the US between 1966 and 2017 as reported by UNOS and the IPTR (at the time of analysis the reporting for non-US cases was not complete for the year 2017)

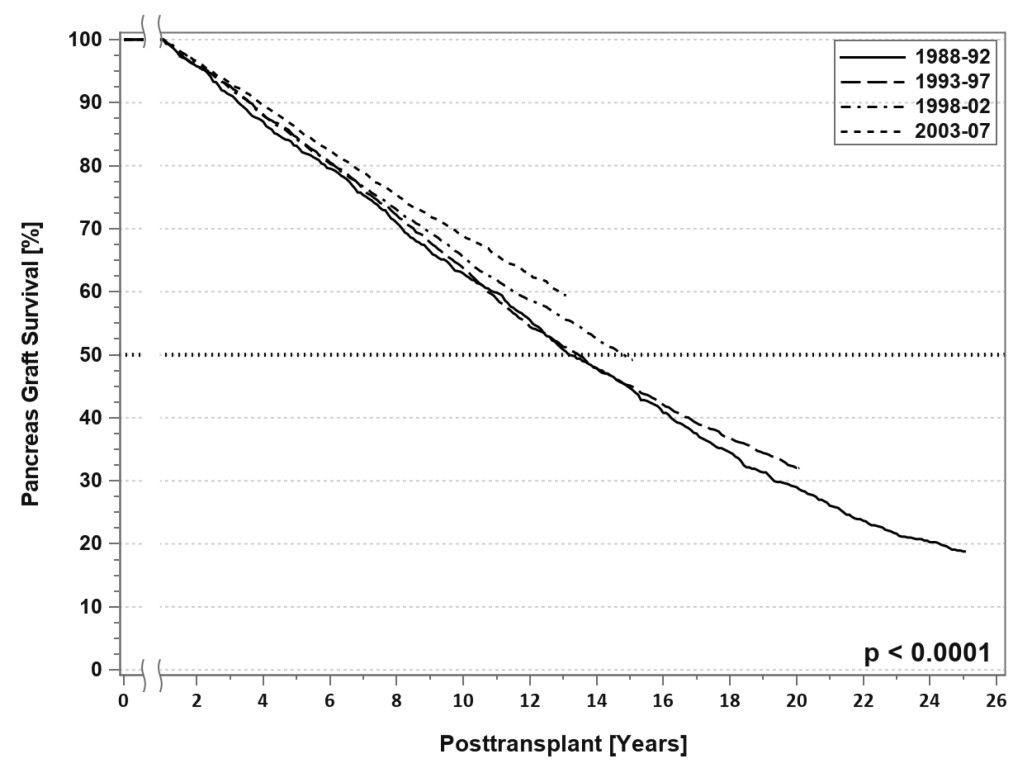
SPK transplantation has become a generally accepted treatment for uremic type 1 diabetes [1]. The evolution in surgical techniques, current patient management strategies, and advances in immunosuppression have resulted in excellent outcomes, even in populations previously considered high risk, such as patients older than 50 years, African-American recipients, patients with a “type 2 diabetes” phenotype, and solitary pancreas transplants recipients[1–11]. Insulin independence is sustained at 5 years in 77% of SPK and 60% of solitary pancreas transplant recipients [3–6]. For SPK transplant recipients with dual allograft function at one year, the conditional half-life of the pancreas graft currently averages 12–15 years, which is amongst the longest for extra-renal grafts
[FIGURE 3). [3–6, 12] Nearly all pancreas transplants are currently performed by one of three standardized techniques[1, 13–15]. Both technical and immunologic graft failure rates have decreased over time [3–6]. One of the most recent and exciting innovations in pancreas transplantation is the description of laparoscopic pancreas transplantation under robotic assistance [16, 17].
PowerPoint Presentation

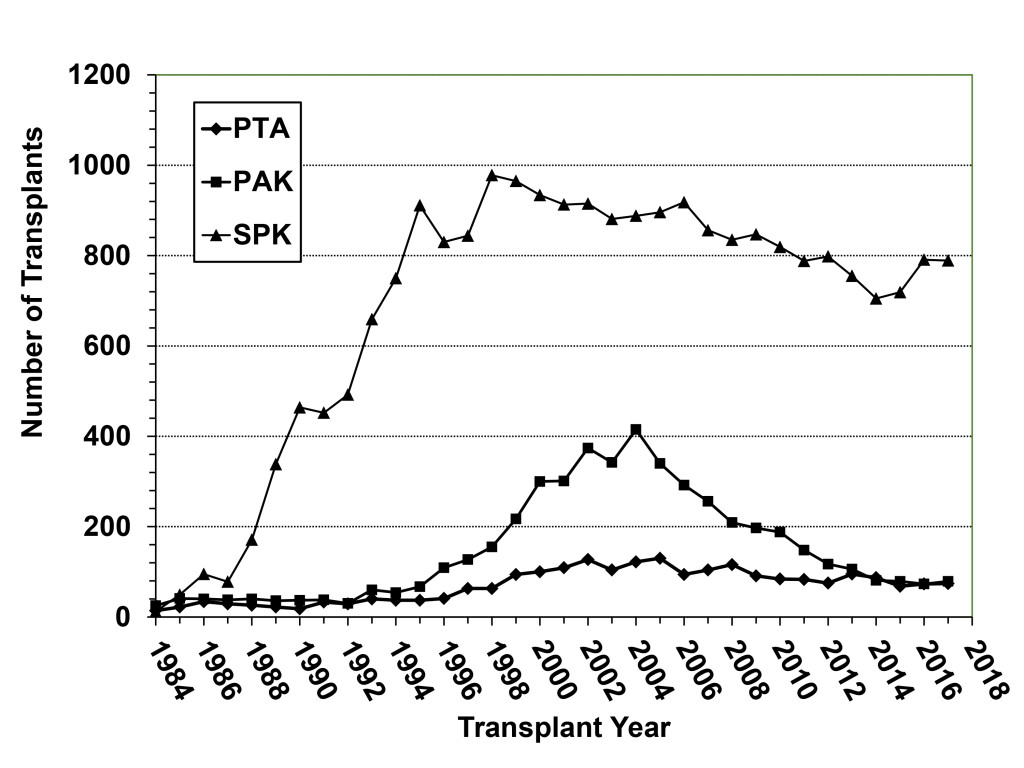
Figure 2. Annual number of pancreas transplant procedures in diabetic patients performed by transplant category in the US; the decline in SPK transplants began in 1999 whereas the number of solitary pancreas transplants (both PAK and PTA) started decreasing after 2004.
PowerPoint Presentation

Figure 3. SPK conditional primary deceased donor pancreas graft survival for transplants performed between 1988 and 2007.

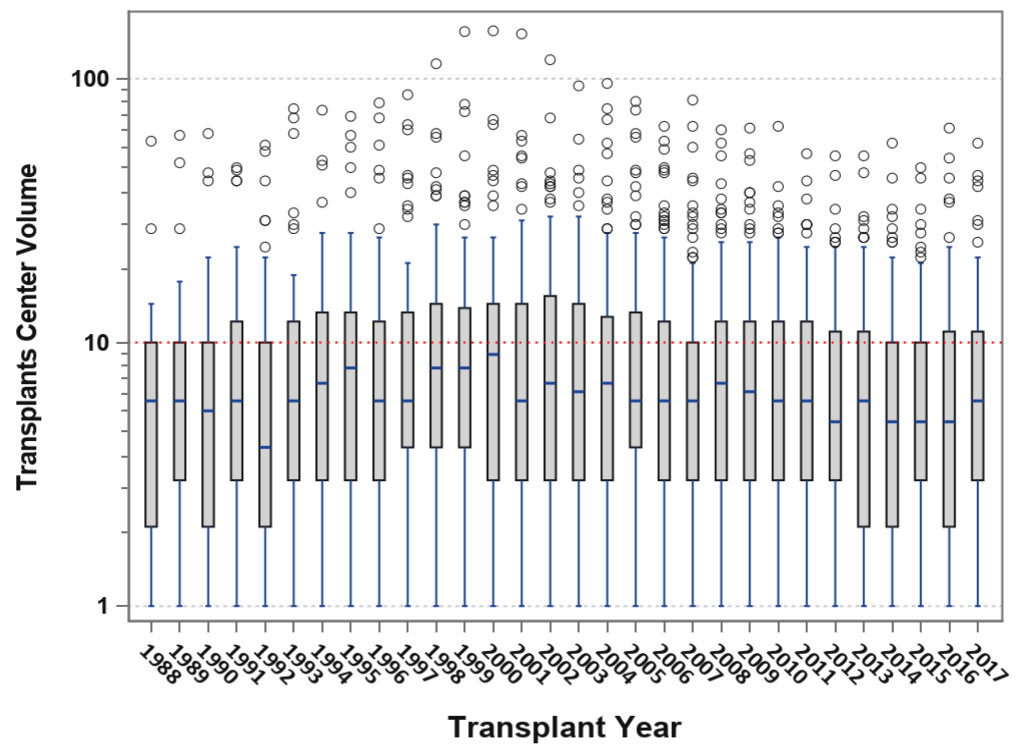
Pancreas transplantation in 2018 can be characterized by the “rule of 90s”; worldwide, 90% are SPK transplants, 90% are from conventional [young and low Body Mass Index [BMI] <30 kg/m2) donors, 90% are performed with enteric drainage, 90% have systemic venous drainage, 90% are managed with antibody induction, 90% receive initial tacrolimus or mycophenolate maintenance therapy, 90% of recipients are Caucasian, 90% have type 1 diabetes, 90% of recipients have a BMI <30 kg/m2, 90% have a panel reactive antibody level ≤20%, the 1-year graft survival rate for SPK transplants is 90%, and 5-year patient survival rates are 90% in all three recipient categories. [3–6] At the other end of the spectrum, there is the “rule of 30s”; 30% of patients are ≥ age 50 years , 30% undergo relaparotomy, 30% experience acute rejection, 30% of dual organ biopsies are discordant, 30% develop donor specific antibody, 30% remain steroid-free long-term, 30% of centers perform PTAs, 30% of centers performed more transplants in the most recent era [2010–2014) compared to the previous era [2005–2009), 30% of centers are very low volume centers [≤10 pancreas transplants in 5 years; Figure 4), 30% of SPK transplants in the US are performed by 12 large volume centers, and a 30% overall reduction in total pancreas transplants performed annually in the US occurred in the decade from 2005 to 2015 [Figure 1) [3–6].
PowerPoint Presentation

Figure 4. Box-plot analysis showing transplant center volume over time; the median center volume has decreased from 9 to 6 pancreas transplants annually and the current lower and upper quartile values are 3–12 pancreas transplants per year.

Improving Outcomes in the Setting of Fewer Transplants Being Performed

According to data from the IPTR and the United Network for Organ Sharing [UNOS), the total annual number of pancreas transplants steadily increased in the US until 2004 [peaking at 1484) but then declined annually for the next 11 consecutive years [reaching a low of 943 in 2015, which was the lowest total since 1994). Fortunately, the number of pancreas transplants has rebounded to above 1000 per year in 2016 and 2017 [Figure 1) [3–6, 18]. This trend downward has been more dramatic for solitary pancreas transplants, particularly in the PAK category [415 performed in 2004, 79 performed in 2017, Figure 2). From 2004–2015, the annual number of SPK transplants in the US declined by 20% overall whereas the annual overall decreases in PAKs and PTAs were 81% and 42%, respectively [Figure 2) [3–6, 18]. In the last decade, era analyses of national data have demonstrated that deceased donor recovery rates and additions to the waiting list have decreased while donor organ discard rates and recipient waiting times have increased. At present, pancreas transplantation is one of the few solid organ transplants in the US that is experiencing an overall decline in activity [3–6, 18]. Unexpectedly, this has occurred in spite of significant improvements in graft and patient survival outcomes, even in higher risk patients, as shown below [Table 1) – an alarming trend because the history of solid organ transplantation has been characterized by an increase in volume mirroring improved results in most circumstances [18, 19].

Table 1. Recent outcomes of primary deceased donor pancreas and pancreas/kidney transplants performed between 1998 and 2017 with a potential follow-up time of at least 6 months.

1998–02

2003–07

2008–12

2013–17

P-value

Patient Survival
[%]

SPK

1 Year

94.7

95.4

96.9

97.4

<0.0001

3 Year

90.1

91.5

94.0

95.1

5 Year

85.2

87.2

89.6

PAK

1 Year

95.3

96.3

97.1

95.7

0.13

3 Year

89.9

91.4

93.5

91.3

5 Year

82.1

85.1

88.8

PTA

1 Year

98.2

96.3

96.6

98.4

0.36

3 Year

93.1

91.6

93.6

94.9

5 Year

88.8

87.8

86.8

Graft
Function
[%]

SPK

Pancreas

1 Year

83.4

85.0

88.8

90.3

<0.0001

3 Year

76.6

78.8

82.9

84.7

5 Year

69.8

72.6

77.1

Kidney

1 Year

91.8

92.6

94.8

95.8

<0.0001

3 Year

84.5

86.2

88.8

90.8

5 Year

77.0

79.7

82.2

PAK

1 Year

78.3

78.9

84.7

85.1

<0.0001

3 Year

66.6

65.5

73.7

75.3

5 Year

57.0

56.3

67.1

PTA

1 Year

80.2

77.8

82.2

84.0

0.03

3 Year

63.4

60.0

67.8

72.2

5 Year

55.2

53.0

58.2

Coincident with the decrease in pancreas transplant activity in the US, there has been a steady increase in the number of pancreas transplants performed outside of the US such that more annual pancreas transplants are now being performed outside of the US since 2008 [3–6]. In 2017, 1002 pancreas transplants were performed in the US [including multivisceral transplants) whereas nearly 1400 pancreas transplants were performed outside of the US and reported to the IPTR [Figure 1) [3–6]. Because reporting of pancreas transplants performed in the US is mandatory and reporting of non-US cases is voluntary, the actual number of pancreas transplants performed outside of the US may be even higher. However, recent data from the Eurotransplant [a collective of all transplant centers in eight European countries) and United Kingdom [UK) transplant registries suggest that a reduction in annual pancreas transplant activity has occurred in these regions as well [20]. Between 2004 and 2016, the average annual decline in pancreas transplant rates was 2.9% in the US and 1.8% in Eurotransplant member countries. In the UK, from 2009 to 2016, a 0.5% annual decline in pancreas transplant activity occurred. The overall increase of non-US transplant numbers was due to the increased transplant activities of South American transplant centers where new pancreas transplant programs were started. Paradoxically, this decrease in annual pancreas transplant activity occurred commensurate with a burgeoning increase in incident rates for type 1 diabetes in children. Corresponding to the >30% decline in the total annual number of pancreas transplants being performed in the US in the past decade, fewer patients are being added to the waiting list, waiting times have increased, and wait list mortality for SPK transplant candidates has risen to 10% [3–6].

Only about 7 in 10,000 Type 1 and 4 in 1 million Type 2 patients with diabetes will ever receive a pancreas transplant in the US. Concurrent with the above trends, the overall number of active pancreas transplant centers are declining; only 10 centers in the US performed ≥20 pancreas transplants in 2017 and half of all centers perform <6 pancreas transplants in 2017 [Figure 4); many do not perform solitary pancreas transplants [3–6, 21]. For example, <50% of pancreas transplant centers perform PAKs and <25% actually perform PTAs in a given year. Only 12 centers in North America are certified by the American Society of Transplant Surgeons [ASTS) for pancreas transplant fellowship training [which previously required performing a minimum of 20 pancreas transplants per year). With the steady decline in volumes, many pancreas transplant programs are losing their ASTS fellowship training accreditation. Consequently, the ASTS recently lowered the annual threshold to 15 pancreas transplants per annum in order to permit centers to gain or maintain certification for fellowship training. Pancreas transplant programs comprise the vast majority of organ-specific transplant programs in the US that are most commonly cited by the UNOS Membership and Professional Standards Committee for not meeting minimum activity requirements. Low center volume is a problem in the Eurotransplant consortium as well. As a result, fewer surgeons are adequately trained in pancreas transplantation and many abdominal organ recovery surgeons are not experienced in pancreas organ recovery, which may influence pancreas procurement [18, 22]. Parenthetically, previous data have suggested that pancreas transplant outcomes are favorably influenced by increasing center volume [21].

This unintentional de-emphasis on pancreas transplantation represents a “crisis in confidence” and has the potential to threaten the existence of the procedure as a viable and effective therapeutic option. The national trend in decreasing numbers of pancreas transplants is disturbing and related to a number of factors. For example, the lack of a primary referral source from either diabetologists, endocrinologists or family medicine practitioners has hindered the growth of pancreas transplantation. Most pancreas transplant referrals are from nephrologists who refer patients with diabetes and chronic kidney disease to a transplant center for kidney rather than pancreas transplant evaluation. Ideally, a kidney transplant program with an active pancreas transplant component will identify potential candidates and appropriately offer them either SPK or PAK transplantation. However, this may not occur in programs that do not perform pancreas transplantation but would like to retain the patient for renal transplantation alone. The situation for PTA candidates is even worse as many diabetic patients actually have to circumvent the conventional diabetes care model in order to gain access to PTA.

Improvements in diabetes management, education and awareness; better insulin analogues and glucose sensors; sophisticated and more patient-friendly insulin pumps; and the promise of the artificial or bionic pancreas have all contributed to the diversion of interest away from pancreas transplantation [23]. For most patients with diabetes, the above advances are obvious improvements in therapy because they frequently result in a delay in the progression of diabetic complications. Consequently, lower rates of chronic kidney disease and delayed progression to other end-organ complications may result in fewer or later referrals for transplantation. This may be preferred for patients with diabetes that are able to avoid the need for transplantation. However, for those who might benefit from pancreas transplantation, late referral usually means that patients are older, may have a higher BMI, and may have additional co-morbidities that preclude successful pancreas transplantation. Additionally, most patients with diabetes have non-type 1 diabetes, which is generally, but incorrectly, regarded as a contraindication to pancreas transplantation.

SPK and PAK transplantation became Medicare-approved procedures on July 1st, 1999, after which time the American Diabetes Association included these treatment options within their evidence-based standards of care [24]. PTA became approved by Medicare on April 26, 2006, and despite coverage by Medicare and most primary insurers, subsequent validation by the American Diabetes Association has not occurred even though data on PTA spans several decades, thousands of transplants and chronicles steadily improving outcomes [2, 23, 24]. Because PTA is one of many treatment options available for diabetes mellitus, it stands in direct competition with conventional medical therapies and islet transplantation [23, 25, 26]. Many diabetes care professionals consider PTA to be a “radical”, aggressive, or overzealous therapy [requiring major surgery and lifelong immunosuppression) for a “benign” [yet life-shortening) disease. Other available treatment options are less invasive and, for that reason alone, more appealing to patients, diabetologists, endocrinologists, and primary care physicians. However, the long-term survival advantage in all three recipient categories of pancreas transplantation is not widely known or accepted. Even today, pancreas transplantation is often considered only as a life enhancing rather than a life-extending procedure.

For instance, the University of Wisconsin published their experience with 1000 SPK transplants with 22 year follow-up [27]. In this report, patient survival following SPK transplantation was superior to all other transplant options for type 1 diabetic patients with uremia. Patient survival following SPK transplant was even superior to uremic patients with Type 1 diabetes who underwent living donor kidney transplantation alone. This remarkable finding supports the contention that freedom from diabetes provides a survival advantage in the setting of kidney transplantation. Another study from the University of Minnesota evaluated outcomes in patients following living donor kidney transplantation who either underwent subsequent PAK transplant or were eligible for but did not undergo PAK because of financial or personal [but not medical) reasons. Patients who were ineligible for PAK because of comorbidity were excluded from analysis [28]. Although patient and kidney graft survival rates were not influenced [positively or negatively) by PAK transplant, 4-year renal function was significantly improved following PAK transplant in the setting of improved glycemic control. In a UNOS registry analysis from 1995–2010 of all adult patients registered either for an SPK or PAK transplant, the major findings were: 1. Patient survival for all transplanted patients was far superior to remaining on the waiting list; 2. Five-year patient survival was similar but 10-year patient survival was higher for SPK compared to PAK transplant recipients; 3. Receiving a PAK following either living or deceased donor kidney transplantation markedly improved long-term kidney graft survival rates compared to not receiving a pancreas graft; 4. Ten-year kidney graft survival rates were similar [61%) for recipients of either an SPK or living donor kidney alone transplants; and 5. Ten-year pancreas graft survival rates were 58.7% for SPK, 44.4% for pancreas after living donor kidney transplant, and 41.7% for pancreas after deceased donor kidney transplant [29]. However, the kidney graft survival rate was highest at 10 years [69.7%) for those surviving patients who received a living donor kidney followed by a sequential PAK transplant. Other studies have documented steadily improving outcomes following PAK transplant [29]. Based on these findings, it is logical to infer that both patient and renal graft longevity is maximized by achieving an insulin and dialysis-free state, whether this is accomplished either by an SPK transplant or a PAK transplant following [preferably) a living donor kidney transplant. Adding a pancreas to a kidney transplant [either simultaneously or sequentially) provides a survival advantage beyond kidney transplantation alone compared to all other treatments available to the uremia diabetic individual.

To further corroborate this viewpoint, recently published data have documented that since the inception of UNOS in 1987, 79, 198 life-years have been “saved” by SPK transplantation [4.6 life-years per recipient) and 14, 903 life-years by solitary pancreas transplants [2.4 life-years per recipient) in the US [30]. The perception that PTA is merely an invasive insulin replacement therapy is contrary to existing literature because this option confers a median survival time of 13.6 years compared to 8.0 years for patients who remain on the waiting list. The target patient population is also at significantly increased risk for multiple other morbidities attributed to diabetes that are not captured by data that address survival exclusively. Considering all of the data, the lack of wider application of pancreas transplantation to appropriately selected patients with complicated diabetes remains enigmatic and a missed opportunity.

It has been virtually overlooked that pancreas transplantation is now associated with an extremely low mortality rate, ranging from 3% at 1 year to 5–8% at 3 years in all 3 pancreas transplant categories [Table 1) [3–6]. At 3 years follow-up, pancreas graft survival [insulin-independence) rates are 85% for SPK transplant, 75% for PAK, and 72% for PTA recipients nationally. Following SPK transplantation, the national 3-year kidney graft survival rate is 91%. Many pancreas transplant recipients have been insulin-independent for >10 years and some for >20 years [12]. In every update of the IPTR spanning 30 years, patient and graft survival rates in all 3 categories of pancreas transplantation have continued to improve whereas early technical and immunological graft losses have continued to decline. However, the transplant community has become victimized by success; improving survival rates in all solid organ transplants have translated into higher thresholds that are implemented as metrics of acceptable performance. With fewer pancreas transplants being performed and fewer patients on the waiting list, the margin for error is much smaller and not all transplant centers remain actively involved in or committed to the practice of pancreas transplantation. Because of increased regulatory oversight, even large centers have responded by adopting a more risk adverse approach to transplantation in general and pancreas transplantation specifically. In addition, the marked decline in PAK transplants may be explained in part by overall improvements in outcomes and quality of life for patients receiving a kidney alone transplant, after which time they feel “well enough” to forego another transplant. Unfortunately, this is very shortsighted as these patients still face major issues despite a functioning kidney transplant; low quality of life and shortened lifespan because of their unchanged or even worsened diabetic state; and the potential for earlier kidney graft failure secondary to recurrent diabetic nephropathy [28, 29, 31].

Donor, Recovery and Preservation Issues

At present, pancreata are currently recovered for the intent to transplant in only 17% of deceased donors in the US [32]. Of these recovered organs, 25% are discarded so only 13% of deceased donors provide a pancreas that is actually transplanted. Some of these pancreata are sent for islet recovery, which in most cases does not result in islet transplantation. In other cases, aberrant hepatic artery anatomy or intestinal recovery may preclude pancreas recovery, although both of these conditions may be compatible with safe pancreas transplantation [22, 32]. Rates of pancreas utilization among Donor Service Areas vary from 0 to 50+% of donors. Pancreas utilization is influenced by limitations in acceptable warm and cold ischemia, which largely prevents widespread organ sharing and routine acceptance of donation after cardiocirculatory death [DCD) donors. However, recent reports have suggested that pancreas utilization in DCD donors is underutilized and a missed opportunity [32–34]. Moreover, because of logistical constraints, having a back-up patient at another center is problematic if the primary center chooses not to use the pancreas graft. In addition to donor quantity, donor quality has changed because donor age, BMI and proportion of donors who sustain brain death secondary to a cerebrovascular or cardiovascular etiology have all increased over time. The ideal pancreas donor ranges from 10–40 years of age, weighs 60–180 lbs., and sustains head trauma as a cause of brain death [32]. With the addition of cold ischemia <12 hours, these 4 core factors primarily determine the likelihood of success [and utilization) in pancreas transplantation. Having more than one of these factors outside the ideal range may have a significant detrimental effect on outcomes [35]. However, the recent surge in organ donation from young donors who sustain brain death secondary to anoxic encephalopathy following a drug overdose is rapidly becoming another source of “ideal” pancreas donors. Another viable alternative for pancreas recovery is the use of pediatric donors [below the age of 10 years or less than 30 kg in size) [36].

An additional aspect of donor pancreas under-utilization is the decline in experienced recovery teams that are able to adequately manage the donor, define and preserve the anatomy, and safely remove the pancreas intact without compromising any of the abdominal organs [22, 32]. The UNOS Pancreas Transplant Committee noted in a June 2014 Report to the Board of Directors that many pancreas discards were for reasons such as surgical error, surgical damage, and poor allograft description, with some of the discards attributed to the experience level of the recovery surgeon. The number of transplant surgeons actively involved in pancreas transplantation and donation is substantially lower than the number of kidney and/or liver transplant surgeons [18]. In addition, liver and kidney recovery usually take precedence over pancreas recovery among the abdominal organs, and the “liver” team is usually directing the recovery of abdominal organs. The lack of a “pancreas organ advocate” during the retrieval process may limit recovery and placement. In addition, having fewer patients on the waiting list may translate into greater selectivity with respect to donor organ offers. Finally, because of the constraints of cold ischemia coupled with Medicare regulations, pancreas recovery is rarely performed unless a specific recipient or receiving center has been identified preemptively.

Pancreas Allocation and Donor Risk Indices

The new Pancreas Transplant allocation policy [initiated on 10/31/2014) introduced recipient qualifying criteria for eligibility to accrue waiting time for SPK transplant, which limits the body mass index [BMI) cut-off for patients with diabetes mellitus and a C-peptide level >2.0 ng/ml. However, these new criteria are not supported by outcome or utilization data and have the potential to reduce overall pancreas transplant activity [3, 18]. Consequently, these qualifying criteria may be removed from the waiting list process. The overall decline in pancreas transplant activity is also temporally associated with the development and introduction of the Pancreas Donor Risk Index as a screening tool into clinical practice, in which multiple risk factors such as donor age, BMI, and cold ischemia time are integrated into a composite score to objectify donor assessment [37]. The Pancreas Donor Risk Index was designed using UNOS data to provide a predictive model to estimate post-transplant graft survival using pretransplant variables. While the Pancreas Donor Risk Index may accurately discriminate optimal versus marginal donor pancreas utilization at the extremes, there are insufficient data to validate its ability to stratify the average risk or suboptimal donor. Therefore, it has not been generally accepted into practice and is rarely used in making decisions about organ offers.

Surgical Techniques

Prior to the mid-1980s, a number of different techniques of exocrine drainage were investigated and many pancreas transplants were performed as segmental grafts [13–15]. During this developmental phase, exocrine drainage techniques were considered to be the “Achilles’ heel” of pancreas transplantation. From the late-1980s to 1995, the majority of pancreas transplants were performed as whole organ pancreatic grafts with systemic venous and bladder exocrine drainage [systemic-bladder technique). The advent of bladder drainage of the exocrine secretions revolutionized the safety and improved the success of pancreas transplantation. However, starting in 1995, a seismic shift from bladder to enteric exocrine drainage occurred coincident with improvements in immunosuppression, preservation techniques, diagnostic monitoring, general medical care, and the success of enteric conversion [13–15]. In the new millennium, most pancreas transplants have been performed as whole organ pancreatico-duodenal grafts with systemic venous delivery of insulin and enteric exocrine drainage [systemic-enteric technique) [1, 3, 5].

Enteric drainage usually refers to jejunal or ileal diversion of the exocrine secretions either with or without a diverting Roux limb[13–15]. Pancreas transplantation with primary enteric exocrine drainage accounted for 91% of SPK, 89% of PAK, and 89% of PTA cases in the US from 2010–2014 [3]. However, during this time, the systemic-bladder technique remained a viable option in selected cases and a preferred option at specific centers [1]. Of the cases performed with enteric drainage in the US, the proportions performed with a diverting Roux-en-y limb were 21% in SPK, 15% in PAK, and 15% in PTA cases [3, 5, 6]. To improve the physiology of pancreas transplantation, an innovative technique of portal venous delivery of insulin and enteric drainage of the exocrine secretions [portal-enteric technique) was developed in the early 1990s and refined over the past 20+ years [14, 15]. Currently, the proportions of enteric-drained cases performed with portal venous delivery of insulin are 22% in SPK, 11% in PAK, and 13% in PTA cases [3]. While the potential of the portal-enteric technique has not been fully realized, it has spawned a number of newer techniques of enteric exocrine drainage including duodenal or gastric diversion [14, 15]. A number of studies have demonstrated no major or consistent differences in outcomes for bladder-drained or enteric-drained pancreas transplants with either portal or systemic venous drainage [13–15]. The surgical complication rate also does not vary according to the type of transplant [SPK versus solitary pancreas transplantation). The incidence of duodenal segment leaks has been reported to be 5–20% in bladder-drained and 5–8% in enteric-drained pancreas transplants [13–15, 27, 38]. Increasing experience with enteric exocrine drainage is likewise associated with a decreased incidence of surgical complications. Although nearly all pancreas transplants are currently performed with one of the three above techniques, current philosophy dictates that the most appropriate technique to be performed is defined by both donor and recipient anatomy as well as the individual surgeon’s comfort level and experience.

Recipient Selection and Waiting List Considerations

The number of additions to the kidney-pancreas waiting list in the US steadily decreased from a high of 1935 in 2000 to 1228 in 2017 [5, 6]. In addition, the number of prevalent candidates [active and inactive) on either the kidney-pancreas or the pancreas waiting lists steadily decreased from 3499 in 2002 to 2518 in 2018. The number of active candidates has decreased by more than 50%, from 2776 in 2002 to 1039 in 2018. In spite of fewer patients on the active waiting list, median waiting times for kidney-pancreas transplantation have continued to increase and range from 1.2 to 4 years depending on blood type. In the past decade, the proportion of recipients who are older, African American, have a higher BMI, or are characterized as having type 2 diabetes have all increased [1, 3, 5, 6]. Recent studies have reported that pancreas transplantation can be successfully performed in selected patients with non-type 1 diabetes [7–10, 39]. In 2013, 25.7% of candidates on the waiting list were ≥ age 50 years, 19.7% were African American [11.4% were Hispanic), 19.1% had a BMI ≥ 30 kg/m2, and 8.9% were classified as having type 2 diabetes. This positive trend in successfully transplanting higher risk patients that were excluded from receiving a pancreas transplant in the past has become possible secondary to significant advances in surgical techniques, immunosuppression and post-transplant medical management strategies. Unfortunately, guidelines for liberalizing recipient criteria have not been widely promulgated or accepted by the medical and surgical communities.

Immunosuppression and Immunological Outcomes

The history of pancreas transplantation is a remarkable success story of the last 50 years that is closely linked to advances in biological and immunosuppressive drug therapies [1–3]. Progress in surgical techniques and clinical immunosuppression have led to improving results in vascularized pancreas transplantation that are attributed to reductions in technical failures and immunologic graft losses over time, respectively [1–6, 40]. The use of biologic agents for induction and “cocktails” of multiple agents with varying mechanisms of action for maintenance therapy have become the standard of immunosuppression following pancreas transplantation [1–8, 40–43]. Immunosuppressive strategies in pancreas transplantation have evolved from experience extrapolated in kidney transplantation because the majority are performed as SPK transplants. Unlike other types of solid other transplants, pancreas transplantation provides an excellent paradigm to study acute rejection because insulin-requiring diabetic patients represent a relatively homogeneous patient population who historically had a high rate of acute rejection possibly because of variable drug absorption [from impaired gastric emptying] or heightened immune responsiveness from the presumed auto-immune etiology of diabetes. In addition, adding a pancreas to a kidney allograft appears to increase the risk of acute rejection, which may be related to the inherent immunogenicity of the pancreas graft or perhaps because of increased antigen load or altered antigen presentation in the recipient. [43–46] Consequently, SPK transplantation has been associated with a higher rate of acute rejection compared to other transplanted organs whereas solitary pancreas transplantation may have even a higher rate of acute rejection secondary in part to limitations in monitoring the pancreas graft. [2, 23, 47]

At present, 90% of SPKT recipients receive antibody induction, with nearly 80% receiving a depleting antibody agent. [3–6, 43] Depleting antibody induction using a biological agent has become a cornerstone of contemporary immunosuppression in pancreas transplantation. The rationale for the evolving trend in depleting antibody induction is to provide a more potent immunosuppressive umbrella of protection for maintenance therapies that incorporate minimization strategies such as corticosteroid elimination or avoidance, calcineurin inhibitor reduction or withdrawal, or even calcineurin inhibitor monotherapy. According to International Pancreas Transplant Registry data, rabbit anti-thymocyte globulin and alemtuzumab are currently the two most commonly used antibody induction agents in SPK transplantation. One-year rates of acute rejection have steadily decreased and are currently in the 5–20% range depending on pancreas transplant category, case mix and immunosuppressive regimen. [3, 4, 6] Historically, these regimens were based primarily on efficacy in the prevention of acute rejection. However, the amount, frequency, and duration of various agents must be tailored according to individualized risk factors. Although nearly all possible combinations of maintenance immunosuppressive protocols have been used, nearly 80% of patients in the recent past have received maintenance therapy with the tacrolimus/mycophenolate combination, and 30–50% have undergone either early or delayed corticosteroid withdrawal without adverse consequences. [3–5, 40–43] The current one-year rate of immunological pancreas graft loss is 1.8% in SPK transplant recipients. [3, 4, 6] Although depleting antibody induction strategies are associated with lower rates of acute rejection compared to either no induction or non-depleting antibody induction, somewhat surprisingly no major differences in mid-term patient or graft survival rates or graft function have been noted according to method of antibody induction. As early graft survival rates have improved because of lower rates of both acute rejection and immunological graft loss, the consequences of chronic rejection have become more important. [45] Ultimately, the development of a non-nephrotoxic, non-diabetogenic, and non-gastrointestinal toxic maintenance immunosuppressive regimen is highly desirable to improve outcomes and quality of life in pancreas transplant recipients. Immunosuppressive strategies will continue to evolve to safer, less toxic, and more targeted therapies with similar or improved efficacy long-term compared to currently available regimens.

Pancreas Versus Islet Transplantation

PTA and islet transplantation are usually linked together as equivalent beta-cell replacement strategies for patients with diabetes in the absence of chronic kidney disease, both of which are then considered as investigational therapies rather than as standards of care. [24–26] Unfortunately, this characterization is not accurate and confusing to patients who might benefit from PTA. In 2000, Shapiro, et al, published their landmark paper on successful islet transplantation in seven patients using the “Edmonton” protocol. [48] Although islet transplant outcomes have continued to improve, overall graft function and durability have not matched those achieved for PTA. [2, 23, 30, 49] In fact, complete and stable long-term insulin independence is uncommon and, in current studies, is not even a primary endpoint following islet transplantation. In addition, “successful” islet transplantation frequently requires more than one donor pancreas. Unlike PTA, islet transplantation remains in a developmental phase with slightly improved success rates only reported in the new millennium in a few hundred cases. At present, islet transplantation is not approved by the Center for Medicare and Medicaid Services in the US, but is paid for by public health systems in some other countries. Similar to islet transplantation, other novel diabetes management options such as the “bionic pancreas”, immunotherapy, gene therapy and stem cell therapy remain innovative yet unrealized investigational ventures that have overshadowed enthusiasm for PTA. Moreover, none of these promising therapies have the current established successful track record of PTA but are being touted as potential “cures” for diabetes. Yet, the mere prospect of potential effectiveness with non- or less-invasive treatment options has subjugated the proven success of PTA.

Summary and Conclusion

In spite of the increasing success of pancreas transplantation, it seemingly has been relegated to a secondary or even tertiary role in the management of diabetes. Overall advances in diabetes management, education and awareness; newer insulin analogues and glucose sensors; state of the art, portable, and more patient-friendly insulin pumps; and the potential of the artificial or bionic pancreas have all contributed to the diversion of interest away from pancreas transplantation as a viable treatment option in the absence of uremia. Pancreas transplantation has been performed with a high and increasing level of success for 30 years. Consequently, it is logical to assume that the diabetes care community will not change their perception of pancreas transplant as a “last resort” form of therapy. However, in spite of recent trials and tribulations, pancreas transplantation remains an important therapeutic alternative for selected patients with hyperlabile or “complicated” diabetes who cannot be managed optimally with conventional insulin therapy. Ultimately, a more reliable source of high quality organs, less diabetogenic [and less toxic] immunosuppression, and lower surgical morbidity are needed in order to propel pancreas transplantation into the forefront of widely accepted management strategies for patients with insulin-requiring diabetes.

Because the healthcare landscape is a moving target, new and innovative ways to educate the public and medical community are needed to correct misperceptions about pancreas transplantation. In addition to conducting outreach sessions with endocrinologists and diabetologists, the pancreas transplant community needs to reach the vast number of family practice physicians who manage the majority of patients with diabetes. Regarding “promotion” of pancreas transplantation, recent data and new evidence needs to be disseminated using not only conventional publications but also social networking, medical websites, media campaigns and through re-engaging the American Diabetes Association. Ultimately, the most important factor for more widespread application of pancreas transplantation remains education, including ongoing engagement of patients with diabetes and health care professionals. Various types of media and social networks could and should function as ideal platforms for recipients of successful pancreas transplants to spread the message that complete and durable insulin-independence is an attainable goal in the majority of cases.

From a transplant community perspective, greater emphasis needs to be placed on improving pancreas recovery rates including removing financial disincentives, facilitating broader sharing with charter aircraft to minimize cold ischemia, implementing pancreas donor advocates, expanding acceptable donor criteria to include selected donation after circulatory death donors and pediatric donors, and assuring that abdominal organ recovery surgeons are experienced in pancreas recovery. In addition, liberalizing recipient selection to include older patients as well as non-type 1 diabetics with uremia and expanding indications for solitary pancreas transplantation (PAK and PTA) will increase the size of the waiting list, which ultimately drives pancreas utilization. Recent studies have suggested that even at active pancreas transplant centers, there are a number of patients who are either on the kidney waiting list or whom have received successful kidney alone transplantation who may benefit from either SPK or PAK transplantation. Having a multidisciplinary team in place to specifically evaluate uremic diabetic individuals for pancreas transplantation can facilitate the “pipeline” by effectively triaging more potential candidates, increase “internal conversions” from the kidney to the SPK transplant waiting list, and identifying patients who may benefit from PAK transplantation. [50] Rather than relying on the diabetes care and nephrology communities for access to potential pancreas transplant candidates, kidney transplant centers must become accountable for providing the opportunity for pancreas transplantation. For SPK transplant recipients with potential living donors, one might consider having the living donor donate their kidney to someone else on the kidney waiting list in exchange for priorization on the SPK waiting list. Alternatively, a more assertive approach to PAK transplantation may be warranted. In spite of recent challenges, pancreas transplantation remains an important therapeutic option for selected patients with hyperlabile or “complicated” diabetes who cannot be managed optimally with conventional insulin therapy.

Abbreviations

ASTS: American Society of Transplant Surgeons

BMI: Body Mass Index

DCD: Donation after Cardiocirculatory Death

IPTR: International Pancreas Transplant Registry

PAK: Pancreas after Kidney

PTA: Pancreas Transplant Alone

SPK: Simultaneous Pancreas-Kidney

UK: United Kingdom

UNOS: United Network for Organ Sharing

US: United States

References

  1. Gruessner RW, Gruessner AC (2013) The current state of pancreas transplantation. Nat Rev Endocrinol 9: 555–562. [crossref]
  2. Gruessner RW, Gruessner AC (2013) Pancreas transplant alone: a procedure coming of age. Diabetes Care 36: 2440–2447. [crossref]
  3. Gruessner AC, Gruessner RW (2016) Pancreas Transplantation of US and Non-US Cases from 2005 to 2014 as Reported to the United Network for Organ Sharing (UNOS) and the International Pancreas Transplant Registry (IPTR). Review of Diabetic Studies 13: 35–58.
  4. Updated International Pancreas Transplant Registry (IPTR) data, Angelika Gruessner (personal communication); United Network for Organ Sharing (UNOS).
  5. Kandaswamy R, Stock PG, Gustafson SK, Skeans MA, et al. (2018) OPTN/SRTR 2016 Annual Data Report: Pancreas. Am J Transplant 18: 114–171. [crossref]
  6. Gruessner AC, Gruessner RWG (2018) Pancreas Transplantation for Patients with Type 1 and Type 2 Diabetes Mellitus in the US – A Registry Report. Gastroenterol. Clin N Am 47: 417–441.
  7. Orlando G, Stratta RJ, Light J (2011) Pancreas transplantation for type 2 diabetes mellitus. Curr Opin Organ Transplant 16: 110–115. [crossref]
  8. Stratta RJ, Rogers J, Farney AC, et al. (2015) Pancreas transplantation in C-peptide positive patients: Does “type” of diabetes really matter? J Am Coll Surg 220: 716–727.
  9. Gruessner AC, Laftavi MR, Pankewycs O, Gruessner RWG (2017) Simultaneous Pancreas and Kidney Transplantation – Is it a Treatment Option for Patients with Type 2 Diabetes Mellitus? An Analysis of the International Pancreas Transplant Registry. Current Diabetes Reports 17: 44 (1–9).
  10. Rogers J, Farney AC, Orlando G, Iskandar SS, Doares W, et al. (2014) Pancreas transplantation: The Wake Forest experience in the new millennium. World J Diabetes 5: 951–961. [crossref]
  11. Redfield RR, Scalea JR, Odorico JS (2015) Simultaneous pancreas and kidney transplantation: current trends and future directions. Curr Opin Organ Transplant 20: 94–102.
  12. Gruessner AC, Gruessner RWG (2016) Long-term Outcome after Pancreas Transplantation – A Registry Analysis. Curr Opin Organ Transplant 21: 377–385.
  13. Boggi U, Amorese G, Marchetti P (2010) Surgical techniques for pancreas transplantation. Curr Opin Organ Transplant 15: 102–111. [crossref]
  14. Rogers J, Farney AC, Orlando G, Farooq U, Al-Shraideh Y, et al. (2014) Pancreas transplantation with portal venous drainage with an emphasis on technical aspects. Clin Transplant 28: 16–26.
  15. El Hennawy H, Stratta RJ, Smith F (2016) Exocrine Drainage in Vascularized Pancreas Transplantation in the New Millennium. World J Transplant 6 (2): 255–71. doi: 10.5500/wjt.v6.i2.255.
  16. Boggi U, Signori S, Vistoli F, et al. (2012) Laparoscopic robot-assisted pancreas transplantation: First world experience. Transplantation 93: 201–206.
  17. Cantrell LA, Oberholzer J (2018) Robotic pancreas transplantation: the state of the art. Curr Opin Organ Transplant 23: 423–427. [crossref]
  18. Stratta RJ, Gruessner AC, Odorico JS, Fridell JA, Gruessner RW (2016) Pancreas Transplantation: An Alarming Crisis in Confidence. Am J Transplant 16: 2556–2562. [crossref]
  19. Gruessner AC, Gruessner RW (2014) Declining Numbers of Pancreas Transplants but Significant Improvements in Outcome. Transplant Proc 46: 1936–1937.
  20. Kopp W, van Meel M, Putter H, Samuel U, Arbogast H, et al. (2017) Center Volume is Associated with Outcome after Pancreas Transplantation within the Eurotransplant Region. Transplantation 101: 1247–1253.
  21. Alhamad T, Malone AF, Brennan DC, Stratta RJ, Chang SH, et al. (2017) Transplant Center Volume and the Risk of Pancreas Allograft Failure. Transplantation 101: 2757–2764. [crossref]
  22. Ausania F, Drage M, Manas D, Callaghan CJ (2015) A registry analysis of damage to the deceased donor pancreas during procurement. Am J Transplant 15: 2955–2962. [crossref]
  23. Niederhaus SV (2015) Pancreas transplant alone. Curr Opin Organ Transplant 20: 115–120. [crossref]
  24. Robertson RP, Davis C, Larsen J, Stratta R, Sutherland DE (2000) ADA Position Statement: Pancreas and islet transplantation for patients with diabetes. Diabetes Care 23: 112–116.
  25. Niclauss N, Morel P, Berney T. (2014) Has the Gap Between Pancreas and Islet Transplantation Closed? Transplantation 98: 593–599.
  26. Moassesfar S, Masharani U, Frassetto LA, et al. (2016) A Comparative Analysis of the Safety, Efficacy, and Cost of Islet Versus Pancreas Transplantation in Nonuremic Patients with Type 1 Diabetes. Am J Transplant 16: 518–526.
  27. Sollinger HW, Odorico JS, Becker YT, D’Alessandro AM, Pirsch JD (2009) One thousand simultaneous pancreas-kidney transplants at a single center with 22-year follow-up. Ann Surg 250: 618–630.
  28. Kleinclauss F, Fauda M, Sutherland DER, Kleinclauss C, Gruessner RW, et al. (2009) Pancreas after living donor kidney transplants in diabetic patients: Impact on long-term kidney function. Clin Transplant 23: 437–446.
  29. Fridell JA, Niederhaus S, Curry M, Fox A: Odorico J (2018). The Survival Advantage of Pancreas after Kidney Transplantation. Am J Transplant 18: in press
  30. Rana A, Gruessner A, Agopian VG, Khalpey Z, Riaz IB, et al. (2015) Survival benefit of solid-organ transplant in the United States. JAMA Surg 150: 252–259. [crossref]
  31. Weiss AS, Smits G, Wiseman AC (2009) Twelve-Month Pancreas Graft Function Significantly Influences Survival Following Simultaneous Pancreas-Kidney Transplantation. Clin J Am Soc Nephrol 4: 988–995.
  32. Fridell J, Rogers J, Stratta RJ (2010) The pancreas allograft donor: Current status, controversies, and challenges for the future. Clin Transplantation 24: 433–449.
  33. Muthusamy AS, Mumford L, Hudson A, Fuggle SV, Friend PJ (2012) Pancreas Transplantation from Donors after Circulatory Death from the United Kingdom. Am J Transplant 12: 2150–2156.
  34. Kopp WH, Lam HD, Schaapherder AFM, et al. (2018) Pancreas Transplantation with Grafts from Donors Deceased after Circulatory Death: 5 years Single-Center Experience. Transplantation 102: 333–339.
  35. Finger EB, Radosevich DM, Dunn TB, Chinnakotla S, Sutherland DE, et al. (2013) A composite risk model for predicting technical failure in pancreas transplantation. Am J Transplant 13: 1840–1849. [crossref]
  36. Fernandez L, Turgeon NA, Odorico JS, et al. (2004) Superior Long-Term Results of Simultaneous Pancreas-Kidney Transplantation from Pediatric Donors. Am J Transplant 4: 2093–2101.
  37. Axelrod DA, Sung RS, Meyer KH, et al. (2010) Systematic Evaluation of Pancreas Allograft Quality, Outcomes, and Geographic Variation in Utilization. Am J Transplant 10: 837–845.
  38. Sutherland DE, Gruessner RW, Dunn DL, Matas AJ, Humar A, et al. (2001) Lessons learned from more than 1,000 pancreas transplants at a single institution. Ann Surg 233: 463–501. [crossref]
  39. Wiseman AC, Gralla J (2012) Simultaneous Pancreas Kidney Transplant Versus Other Kidney Transplant Options in Patients with Type 2 Diabetes. Clin J Am Soc Nephrol 7: 656–664.
  40. Odorico JS, Sollinger HW (2002) Technical and immunosuppressive advances in transplantation for insulin-dependent diabetes mellitus. World J Surg 26: 194–211.
  41. Singh RP, Stratta RJ (2008) Advances in immunosuppression for pancreas transplantation. Curr Opin Organ Transplant 13: 79–84. [crossref]
  42. Heilman RL, Mazur MJ, Reddy KS (2010) Immunosuppression in simultaneous pancreas-kidney transplantation: progress to date. Drugs 70: 793–804. [crossref]
  43. Stratta RJ, Farney AC, Rogers J, Orlando G (2014) Immunosuppression for Pancreas Transplantation with an Emphasis on Antibody Induction Strategies: Review and Perspective. Expert Rev Clin Immunol 10: 117–132.
  44. Reddy KS, Davies D, Ormond D, Tuteja S, Lucas BA, et al. (2003) Impact of acute rejection episodes on long-term graft survival following simultaneous kidney-pancreas transplantation. Am J Transplant 3: 439–444. [crossref]
  45. Humar A, Khwaja K, Ramcharan T, Asolati M, Kandaswamy R, et al. (2003) Chronic rejection: the next major challenge for pancreas transplant recipients. Transplantation 76: 918–923. [crossref]
  46. Troxell ML, Koslin DB, Norman D, et al. (2010) Pancreas allograft rejection: analysis of concurrent renal allograft biopsies and posttherapy follow-up biopsies. Transplantation 90: 75–84.
  47. Gruessner RWG, Sutherland D, Kandaswamy R, et al. (2008) Over 500 solitary pancreas transplants in nonuremic patients with brittle diabetes mellitus. Transplantation 85: 42–47.
  48. Shapiro AM, Lakey JR, Ryan EA, et al. (2000) Islet transplantation in seven patients with type 1 diabetes mellitus using a glucocorticoid-free immunosuppressive regimen. N Engl J Med 343: 230–38.
  49. Schuetz C, Anazawa T, Cross SE, Labriola L, Meier RPH, et al. (2018) β Cell Replacement Therapy: The Next 10 Years. Transplantation 102: 215–229. [crossref]
  50. Scalea JR, Sultan S, Lamos EM, Bartlett ST, Barth RN (2018) Improvement in Pancreas Transplant Evaluation and Surgical Volume Using a Multidisciplinary Approach. Am J Transplant 18: 1295–1296.
Plasma Visfatin is reduced in Subjects with the Metabolic Syndrome and Pre-Diabetes

DOI: 10.31038/EDMJ.2018234

Abstract

The adipocytokine Visfatin (VF) has been linked with visceral adiposity, insulin resistance and Metabolic Syndrome (MS), however, studies have been inconsistent regarding its relationship with these metabolic enteties. The aim of this study was to explore the relationships between plasma VF, High Molecular Weight (HMW) Adiponectin and the MS.

We measured fasting plasma VF and HMW Adiponectin in 29 males with the MS and 29 age-matched male controls. Plasma VF was significantly reduced in MS subjetcs compared to controls (98.2 ± 29.7 Vs.141.4 ± 39.1 ng/ml, respectively, P=0.04). One Way ANOVA showed that subjects with MS and pre-diabetes had extremely lower concentrations of plasma VF (60.8 ± 35.9 Vs141.4 ± 39.1 ng/ml ), for MS and controls, respectively, P < 0.009. HMW Adiponectin concentrations were similar in both groups and negatively correlated with HOMA-IR(r = -0.40, P= 0.03). Using Stepwise regression, WC was independently associated with plasma VF concentrations. There was no correlation between plasma VF and insulin sensitivty or beta cell function measured with HOMA-IR and HOMA % B, respectively.

In conclusion: Reduced plasma VF concentrations may play a role in the pathophysiology of pre-diabetes and cardiometabolic risk, however, this will require further study.

Keywords

Metabolic Syndrome, Visfatin, HMW adiponectin

Introduction

Visceral adipose tissue produces a number of adipocytokines such as adiponectin, tumour necrosis factor-alpha, and interlukin (IL)-6, which modulate insulin sensitivity and appear to play an important role in the pathogenesis of insulin resistance, diabetes, inflammation and atherosclerosis [1–3]. Visfatin (VF) is a recently discovered adipocytokine that was first described by Fukuhara and colleagues in 2005 as being exclusively secreted by visceral fat and had insulin-mimetic properties [4]. VF corresponds to a 52 kilodalton cytokine known as Pre-B- Cell Colony-Enhancing Factor or (PBEF) responsible for maturation of B cell precursors [5]. VF/PBEF has also been shown to be an enzyme that catalyses the rate-limiting step in the Nicotinamide Adenine Dinucleotide (NAD) biosynthetic pathway and is known as nicotinamide phosphoribosyltransferase or ‘Nampt’ [6]. Nampt exists in two forms: intracellularly as ‘iNampt’ and extracellularly as ‘eNampt’; the latter corresponds to VF/PBEF [7]. Administration of exogenous VF to animal models of acute myocardial infarction was shown to be cardioprotective [8]. Moreover, Revollo and colleagues showed that Nampt is essential for normal beta cell function when they demonstrated that Nampt (+/-) heterozygous mice had defects in both NAD biosynthesis and Glucose-Stimulated Insulin Secretion (GSIS) [9]. Interestingly, Nampt(+/-) heterozygous mice developed impaired glucose tolerance and the administration of NMN(the product of Nampt reaction) corrected the defects in GSIS and restored normal glucose tolerance [9]. However, in human beings, the relationship between VF/PBEF/eNampt and the metabolic syndrome (MS), insulin resistance, obesity, and cardiovasular disease has been controversal, as evidenced by the conflicting results from published work [10–12] . It is well established that higher concentartions of plasma adiponectin have been shown to be cardioprotective while reduced concentrations of plasma adiponectin have been linked to cardiovascualr disease insulin resistance, obesity and the MS [13–15]. We hypothesed that subjects with the MS, who are at increased risk of developing type 2 diabetes and cardiovascular disease, would have reduced concentrations of circulating plasma VF. We also measured HMW Adiponectin, the active form among adiponectin multimers.

Research Design, Subjects and Methods

This was a cross-sectional study. Construction workers were screened for diabetes, pre-diabetes and cardiometabolic risk factors as part of a pilot health screening programme conducted by the Construction Workers’ Health Trust (CWHT). Data including demographics, anthropometric measurments, FindRisk diabetes questionnaire, and laboratory results were prospectively entered into a central database. The study population was predominantly male (99 %). A random sample of exclusively male subjects was taken from the central database for the purpose of this study . The full details of the study can be found in the Construction Workers Health Trust screening study [16]. The study protocol was approved by the Joint Research Ethics Committee of the Federated Dublin Voluntary Hospitals and St James’ Hospital. All participants signed written informed consent.

Measurement of Biomarkers

Body weight and height were measured in participants wearing light clothing without shoes. BMI was calculated as weight in kilograms divided by height in meters square. Waist circumference was measured at the level of the umbilicus. Hip circumference was measured at the level of the anterior superior iliac spine. Blood pressure was measured in the sitting position after a 10-min rest period in the left arm. Blood samples were taken in the morning after a 12-hour overnight fast. All measurements and samples were obtained at the healthcare centres provided at construction work sites.

Laboratory Analysis

Fasting bloods were obtained after 12 hours fast and included the following: plasma glucose, lipid profile, insulin, plasma visfatin, and plasma HMW adiponectin. Plasma glucose was measured using a glucose oxidase method [bio Merieux kit/ Hitachi Modular]. Plasma total cholesterol and triglycerides were measured using enzymatic methods (Human Liquicolor kits/ Hitachi Modular). Plasma high-density lipoprotein [HDL] cholesterol and Low-Density Lipoprotein (LDL) cholesterol were measured directly with enzymatic methods (Randox direct Kits/ Hitachi Modular).

Visfatin and HMW Adiponectin Assays

VF was measured in fasting EDTA plasma samples by a specific Enzyme-Linked Immunosorbent Assay (ELISA) [linear range, 0.1–1000 ng/mL; specificity, 100% human) [17], obtained from Phoenix Pharmaceuticals Inc. (Karlsruhe, Germany). The intra-assay coefficient of variation was 5.6% and 5.8% for low and high VF concentrations, respectively. Data were expressed as absolute concentrations.

HMW Adiponectin was determined from fasting EDTA plasma sample by ELISA detection [Millipore]. For measurement of high molecular weight adiponectin plasma samples were extracted with protease treatment following manufacturer’s instructions. Sensitivity of the assay is 0.5ng/ml and the coefficients of intra-assay variations were 0.97–3.41%.

Insulin Sensitivity and Beta Cell Function

Insulin sensitivity was estimated using the homeostasis model assessment for insulin resistance index (HOMA-IR); beta cell function was assessed by HOMA-B. Both HOMA-IR and HOMA-B was quantified using a HOMA calculator as previously described [18].

Glucose Metabolism

All subjects had fasting plasma glucose as screening test and those who had impaired fasting glucose (IFG) of ≥ 5.6 mmol/l underwent a 2- hour oral glucose tolerance test (OGTT) . Subjects were further sub-classified as having impaired glucose tolerance (IGT) if the 2-hours postprandial glucose value was between 7.8 – 11.0 mmol/l or diabetes if the fasting plasma glucose value was ≥ 7.0 mmol/l and/or 2-hours postprandial glucose value ≥ 11.1 mmol/l.

Definition of the Metabolic Syndrome

The Metabolic Syndrome (MS) was defined according to the International Diabetes Federation (IDF) criteria [19] Subjects with the MS were further divided according to the results of oral glucose tolerence and fasting plasma glucose results: subjects with MS and Normal Glucose Tolerance (NGT) were referred to as (NGT-MS); subjects with MS and (IFG) as IFG-MS, and subjects with MS and IGT as (IGT-MS). We excluded subjects with previously diagnosed diabetes, as they have established cardiovascular risk and their inclusion as MS is controversial.

Statistical Analysis

The demographic characteristics of study participants are presented as mean +/- SEM. Since VF, HMW Adiponectin and the other biomarkers were not normally distributed; Mann-Whitney test was used to test the differences between subjects with the MS and controls. Spearman’s correlations were used to examine correlations between VF, HMW Adiponectin and the other biomarkers. Logarithmic transformations of the biomarkers were used in One Way ANOVA to compare the differences in VF and HMW adiponectin levels between the subgroups of the MS and the controls. Also, logarithmic transformations of the biomarkers were used in stepwise multiple regression analyses to identify the independent predictors of VF and HMW Adiponectin. All statistical analyses were performed using SPSS (SAS, Version 13). Statistical significance was set at P<0.05

Results

The baseline characteristics of the study subjects are shown in Table 1. As expected, subjects with MS had significantly higher BMI, Waist Circumference (WC), Fasting Plasma Glucose (FPG), Triglycerides (TGs) and Waist Hip Ratio (WHR). MS subjects were more insulin resistant compared to controls (Table 1). Systolic BP was marginally higher in MS subjects; LDL-cholesterol, total cholesterol and beta cell function (HOMA-B) were not different between the two groups. MS subjects had significantly higher FINDRISC score, indicating increased lifetime risk for developing type 2 diabetes [20].

Table 1. Baseline characteristics of the study subjects.

Biomarker

MS Subjects
(N=29)

Controls
(N=29)

P value

Age, Years

43.5 ± 2.0

39.1 ± 1.8

0.133

BMI, kg/m2

30.7 ± 0.8

27.2 ± 0.8

0.002

Waist Circumference(WC), cm

108 ± 2.

96 ± 2

<0.0001

Waist: Hip Ratio(WHR)

1.01 ± 0.1

0.97 ± 0.01

0.004

Systolic BP, mmHg

137 ± 2

132 ± 3

0.08

Diastolic BP, mmHg

85 ± 2

82 ± 2

0.17

Fasting plasma glucose, mmol/l

5.4 ± 0.1

4.9 ± 0.1

0.012

HDL-Cholesterol , mmol/l

1.06 ± 0.03

1.24 ± 0.1

0.005

Triglycerides, mmol/l

1.8 ± 0.1

1.1 ± 0.1

<0.0001

Total Cholestrol, mmol/l

5.13 ± 0.13

5.06 ± .016

0.56

Fasting Insulin, pmol/l

60.6 ± 4.5

51.9 ± 11

0.004

HOMA-IR

1.15 ± 0.08

0.96 ± 0.1

0.004

HOMA % B

90.1 ± 5

88.5 ± 8.2

0.29

HOMA % S

101.6 ± 8

160.9 ± 16.6

0.003

FindRisk Score

10

6

0.002

Visfatin (VF), ng/ml

98.2 ± 29.7

141.4 ± 39.1

0.041

HMW Adiponectin, ng/ml

4103 ± 610

4074 ± 434

0.36

Data presented as mean ± SEM. SEM=Standard error of the mean. P value obtained from Mann Whitney test.

Plasma Visfatin and HMW Adiponectin

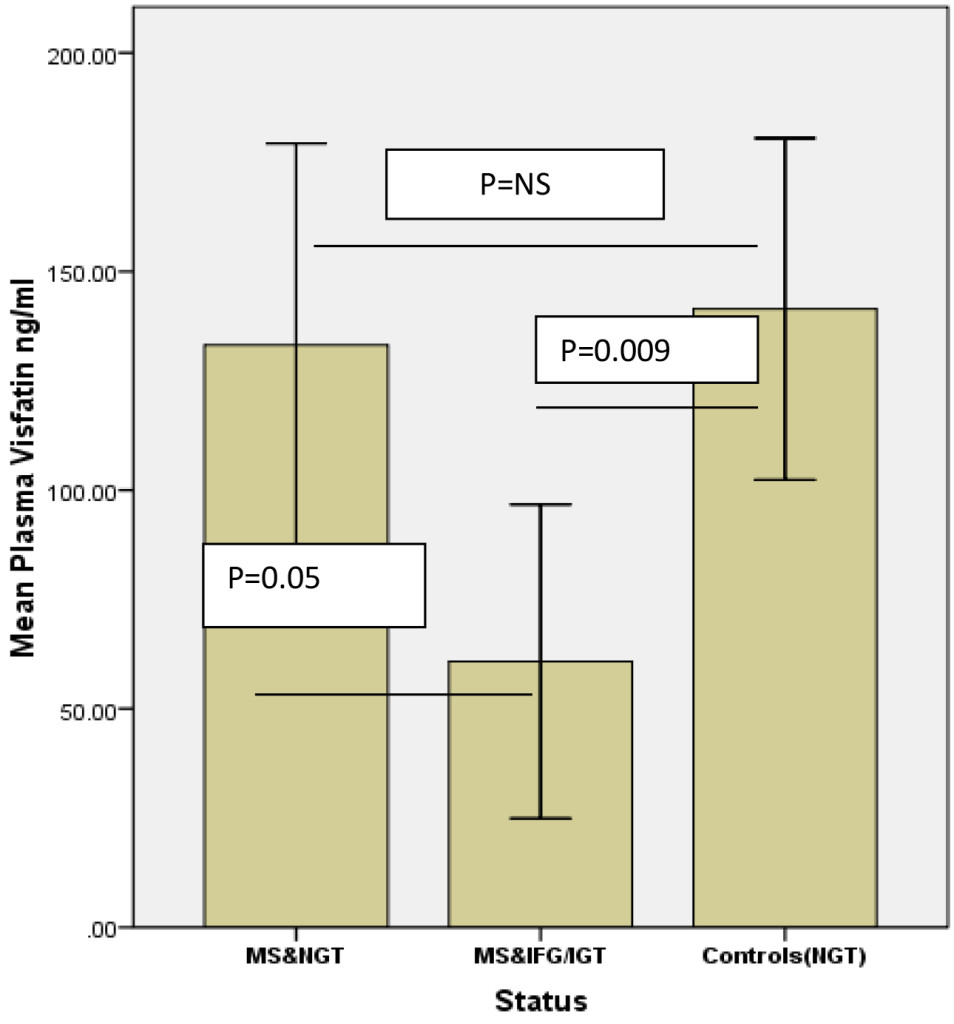
Subjects with the MS had significantly reduced circulating concentrations of plasma VF compared to controls (98.2 ± 29.7 vs.141.4 ± 39.1 ng/ml, P=0.041), as shown in Table 1. One Way ANOVA showed that subjects with the MS and pre-diabetes (IFG/IGT) had significantly lower VF concentrations 60.8 ± 35.9 ng/ml when compared to controls(141 ± 39.1 ng/ml), P =0.009), and marginally lower VF concentrations when compared with subjects with the MS and normal glucose metabolism(133.2 ± 46 ng/ml), P=0.05, as shown in Figure 1. Likewise, Mean HMW adiponectin levels were similar between the two groups(4103 ± 610 ng/ml in MS subjects vs. 4074 ± 434 ng/ml in controls, P=0.36). One-Way ANOVA showed that subjects with MS and pre-diabetes had slightly lower concentrations of HMW adiponectin compared to both subjects with MS and normal glucose tolerance and controls, however, it did not reach statistical significance (Table 3).

Table 2. Spearman’s correlations between plasma VF, HMW Adiponectin and the different biomarkers in the whole group.

Biomarker

Visfatin
N=58

HMW adiponectin
N=58

Weight

r = -0.316, P=0.016

r = -0.13, P=0.43

BMI

r= -0.30, P=0.02

r = -0.05, P=0.68

WC

r= -0.33, P=0.012

r = -0.07, P=0.60

Age

r= -.26, P=0.053

r = 0.10, P=0.43

SBP

r = -0.15, P= 0.26

r = -0.09, P=0.46

DBP

r = -0.23, P=0.07

r = 0.08, P=0.53

TGs

r = – 0.08, P =0.52

r = -0.19, P= 0.15

FPG

r = -0.32, P = 0.015

r= -0.04, P=0.70

Fasting insulin

r= 0.15, P=0.28

r = 0.16, P=0.22

HOMA-IR

r = 0.15, P=0.27

r= -0.17, P=0.20

HOMA % B

r =0.09, P=0.48

r = 0.48, P=0.22

HDL-C

r = -0.10, P=0.41

r = 0.46, P=0.0001

FINDRISC score

r = -0.26, P=0.052

r =0.09, P=0.51

Table 3. One Way ANOVA. Plasma Visfatin and HMW Adiponectin levels according to metabolic syndrome status and glucose metabolism.

Biomarker

Controls

N=(29)

NGT+ MS

N=(15)

IFG/IGT+MS

(N=14)

P value

Mean plasma Visfatin, ng/ml

141.4 ± 43

133.2 ± 46

60.8 ± 35.9 ¥

Mean plasma HMW Adiponectin, ng/ml

4074.4 ± 433.6

4592.8 ± 920

3613.6 ± 812

 NS

HOMA-IR

0.96 ± 0.2

0.97 ± 0.1

1.3 ± 0.1

HOMA % S

160.9 ± 16.7

118 ± 11.7

82.8 ± 8.5

HOMA % B

88.5 ± 8

100.7 ± 7

77.8 ± 5.7

NS

One way ANOVA comparing mean Visfatin and HMW Adiponectin concentrations between the groups.
NGT+MS: Normal Glucose Tolerant Subjects with Metabolic Syndrome.
IGT+MS: Impaired Glucose Tolerant Subjects with the Metabolic Syndrome.
IFG+MS: Subjects with Metabolic Syndrome and Impaired Fasting Glucose.
¥P value < 0.009 between controls and IFG/IGT+MS.
P =0.05 between NGT+MS and IFG/IGT+MS.
NS: No Significant difference between the groups P > 0.05.
P value= 0.011 between controls and IFG/IGT+MS.
P value < 0.009 between controls and IFG/IGT+MS.

EDMJ 2018-107 - Imad Brema Saudi Arabia_F1

Figure 1. One Way ANOVA comparing mean Visfatin concentrations between the groups.

NGT MS: normal glucose tolerance metabolic syndrome; IGT: impaired glucose tolerance; IFG: impaired fasting glucose. NS: not significant. Error bars represent standard error of the mean.

Correlations between Visfatin, HMW adiponectin and other biomarkers

Spearman’s correlations between VF, HMW adiponectin and the different biomarkers are shown in Table 2.

In the whole group, VF negatively correlated with FPG ( r= -0.31, P=0.015), WC (r= -0.32, P=0.012), Weight (r=-.316, P=0.016) and BMI (r= -0.30, P=0.02), as shown in Table 2. There was a negative correlation between plasma VF and the FINDRISC score with marginal statistical significane (r=-.26, P=0.052). In MS subjects alone , VF negatively correlated with FPG, (r= -0.34 p=0.018).

VF did not correlate with fasting insulin, HOMA-IR or HOMA-B in either group.

HMW adiponectin levels positively correlated with HDL-Cholesterol (HDL-C) in MS subjects (r= 0.43, P=0.02), as well as in the whole group (r= -0.46, P <0.0001). In MS subjects alone, HMW adiponectin negatively correlated with fasting insulin(r=-0.40, P=0.037) and HOMA-IR (r=-0.40, P=0.038).

There was no significant correlation between VF and HMW adiponectin in the whole group or in each group seperately.

Multiple stepwise regression analysis showed that log WC was negatively and independently associated with VF, in a model that included log VF as the dependenet variable, and log WC, log FPG and log fasting TGs as independent variables. This model showed an R2 of 0.100 and P=0.016. β-coefficient was -3.522. WC explained 10 % of VF variance. Likewise, log HDL-C was positively and independently associated with log HMW Adiponectin in a model that included HMW Adiponetin as the depenent variable and log HOMA-IR, log HDL-C and log WC as independent variables. β-coefficient: 1.42, P=0.001. log HDL-C explained 19.7 % of the variation in log HMW adiponectin.

Discussion

In the present study, we showed that male subjects with increased cardiometabolic risk profile and insulin resistance had significantly reduced concentrations of plasma VF, which negatively correlated with FPG, WC, weight and BMI . Moreover, we showed that subjetcs with the MS and pre diabetes had very low concentrations of plasma VF not only when compared to controls, but also when compared to subjects the MS and normal glucose tolerance, although with marginal statistical significnace. In addition, we showed a non-significnat trent of a negative correlation between plasma VF and the FindRisk score, which suggests that lower concentations of plasma VF may be associated with increased lifetime risk of developing type 2 diabetes but this oservation requires further clarification in a larger study. The inverse and independant association between plasma VF and WC in the stepwise regression may indicate an indirect relationship between reduced plasma VF concentrations and the risk of developing type 2 diabetes and cardiovascular disease, however, again this requires further exploration in future studies as causality could not be assumed from our cross-sectional study. Several studies have explored the relationship between VF and the MS in the past few years with conflicting results. In agreement with our study, plasma Visfatin/Nampt levels has been shown to be reduced in patients with MS and type 2 diabetes in one study [21]. Most studies repored increased plasma VF concentration was shown to be increased in subjects with MS in two previous studies [11, 22–24]. Three more studies found no association between plasma VF and the MS [12, 25, 26]. It is worthwhile mentioning that the patient characteristics and/or the criteria for defining the MS were different in all the three studies mentioned above and this may have affected the results. The mechanisms underlying the association between low plasma VF concentrations and the MS in our study are not fully understood, however, a possible mechanism may be through the modification of the activity of the downstream target, SIRT1 which may be supported by the findings of De Kreutzenberg and colleagues, who showed that subjects with the MS and increased insulin resistance had reduced SIRT1 gene and protein expression [27]. Moreover, the same authors showed that high glucose and palmitate concentrations resulted in downregulation of Nampt (Visfatin expression, a reduction in intracellular NAD (+) levels and a reduction in SIRT1 activity in mononuclear cells from subjects with MS [27]. A more recent study by Yoshino and colleagues reported that Nampt-mediated NAD+ biosynthesis is severely compromised in both diet and age-induced models of diabetes in mice [28] . Interestingly, the authors showed that Nicotine Mononucleotide ( NMN), the product of Nampt reaction, was effective to treat the two different animal models of diabetes [28]. Moreover, Revollo and colleagues showed that Nampt is essential for normal beta cell function when they demonstrated that Nampt (+/-) heterozygous mice had defects in both NAD biosynthesis and glucose-stimulated insulin secretion (GSIS) [9]. Interestingly, Nampt (+/-) heterozygous mice developed impaired glucose tolerance and the administration of NMN (the product of Nampt reaction) corrected the defects in GSIS and restored normal glucose tolerance. In our study, we did not find any correlation between fasting plasma VF and insulin sensitivity measured by HOMA-IR, which is in agreement with several other studies which showed lack of association between Plasma VF and insulin resistance [29–31]. We found no correlation between Plasma VF and beta cell function measured by HOMA-B neither in the controls nor in subjects with the MS. The relationship between VF and beta cell function is being explored by some authors since VF is important for glucose-stimulated-insulin secretion from beta cells. One study in animals showed that VF reduced the degree of apoptosis of beta cells due to exposure of cell lines to interferon Gamma [32]. However, in human beings serum VF has been shown to increase with progressive beta cell failure in healthy males in a previous study, again adding to inconsistency of evidence regarding this molecule [33]. Several studies described significant increase in plasma VF concentrations after different types of bariatric surgery in morbidly obese subjects [34–36]. Moreover, Haider and colleagues showed that treatment with the insulin sensitizer rosiglitazone increased both plasma VF and adiponectin in HIV-positive, insulin resistant subjects [37]. However, opposite results have also been reported where plasma VF has been shown to decrease after bariatric surgery as well [38] . Therefore, it is difficult to draw any conclusions about whether is beneficial or reduced levels of plasma VF are useful or harmful, unlike the case with adiponectin, where low levels have been consistently shown to be associated with type 2 diabetes, insulin resistance, and the risk for cardiovascular disease in may studies [39–41] . We may speculate that previously described increased concentrations of plasma VF in some studies in subjects with type 2 diabetes, MS and obesity may represent a compensatory mechanism to increase GSIS and improve glucose tolerance. Another explanation for the inconsistencies in published work on VF could be due to differences in immunoassays used by different research groups, as previously reported by Korner and colleagues [42]. A Third explanation for the inconsistency in VF work may be due to the presence of two iso-forms for eNampt (monomeric and diameric forms) and it has been shown that serum monomeric eNAMPT levels were elevated in HFD-fed mouse models of diabetes, whilst eNAMPT-dimer levels were unchanged. Very interestingly, eNAMPT-monomer neutralisation in HFD-fed mice with anti-monomeric eNampt antibodies resulted in lower blood glucose levels, amelioration of impaired glucose tolerance and whole-body insulin resistance, improved pancreatic islet function, and reduced inflammation [43]. Therefore, investigators should cleary indicate in future studies what iso-form of VF/Nampt was measured . We expected to see lower concentrations of plasma HMW adiponectin in subjects with the MS however, this may be due to the small sample size, however, HMW adiponectin was negatively correlated with HOMA-IR in subjects with the MS in our study, which is in agreement with previous studies that described association of reduced HMW adiponectin isoforms with the risk of insulin resistance and type 2 diabetes. There was no correlation between VF and HMW Adiponectin in this study but a previous study described a negative correlation between plasma Adiponectin and VF in patients with Rheumatoid Arthritis [44].

We acknowledge that this study has some limitations including the small sample size, the cross-sectional design and the use of HOMA-IR and HOMA-B as crude measures for assessing of insulin sensitivity and beta cell function, respectively. Also lack of simultaneous measurement of VF and HMW Adiponectin mRNA expressions in visceral and subcutaneous fat depots and their correlation with serum levels is yet another limitation.

In conclusion, we report reduced circulating concentrations of plasma VF in subjects with the MS compared to age and gender-matched controls, with extremely low concentrations of plasma VF in subjects with the MS and pre-diabetes. The findings of this study point towards a possible relationship between reduced concentrations of plasma VF and increased cardiometabolic risk and pre-diabetes , however, it is not clear from this study whether low plasma VF concentrations acts as a mediator or a marker of cardio metabolic risk and pre-diabetes. Further mechanistic studies are needed to explore this important relationship.

Acknowledgement

We would like to thank the Construction Workers’ Health Trust and all the study volunteers for their participation in this study. Many thanks to the staff nurses in the metabolic research unit

Funding

This study was funded by the Diabetes Education and Research Fund and the CWHT.

Authors’ contribution

Imad Brema: Study design and conception, data collection, statistical analysis, manuscript writing

Hood Thabit: Data collection, manuscript writing

Shabahat Shah: Data collection, manuscript writing

Nicole Burns: Data collection, manuscript writing

Declan Gasparro: Laboratory analysis of plasma samples for glucose, lipids, insulin

Vivion Crowley: Laboratory analysis,

Angela Storka: Visfatin and HMW Adiponectin assays

Michael Wolzt: Visfatin and HMW Adiponectin assays, manuscript writing

John J Nolan: Study design, data analysis, manuscript writing.

Abbreviations

CWHT: Construction Workers’ Health Trust

GSIS: Glucose-Stimulated-Insulin Secretion

HFD: High Fat Diet

HOMA-B: Homeostasis Model Assessment for Beta Cell Function

HOMA-IR: Homeostasis Model Assessment for Insulin Resistance Index

IDF: International Diabetes Federation

IFG-MS: Impaired Fasting Glucose Subject with Metabolic Syndrome

IFG: Impaired Fasting Glucose

IGT-MS: Impaired Glucose Tolerant Subject with Metabolic Syndrome

IGT: Impaired Glucose Tolerance

IL-6: Interlukin-6

MS: Metabolic Syndrome

Nampt: Nicotinamide Phosphoribosyl transferase

NAD: Nicotinamide Adenine Dinucleotide

NGT: Normal Glucose Tolerance

NGT-MS: Normal Glucose Tolerant Subject With Metabolic Syndrome

NMN: Nicotinamide Mononucleotide

OGTT: Oral Glucose Tolerance Test

PBEF: Pre-B- Colony Enhancing Factor

Sir1: Silent Information Regulator 1

VF : Visfatin

References

  1. Kershaw EE, Flier JS (2004) Adipose tissue as an endocrine organ. J Clin Endocrinol Metab 89: 2548–2556. [crossref]
  2. Arner P (2005) Insulin resistance in type 2 diabetes — role of the adipokines. Curr Mol Med 5: 333–339. [crossref]
  3. Fantuzzi G (2005) Adipose tissue, adipokines, and inflammation. J Allergy Clin Immunol 115: 911–919. [crossref]
  4. Fukuhara A, Matsuda M, Nishizawa M, Segawa K, Tanaka M, et al. (2005) Visfatin: a protein secreted by visceral fat that mimics the effects of insulin. Science 307: 426–430. [crossref]
  5. Samal B, Sun Y, Stearns G, Xie C, Suggs S, et al. (1994) Cloning and characterization of the cDNA encoding a novel human pre-B-cell colony-enhancing factor. Mol Cell Biol 14: 1431–1437. [crossref]
  6. Revollo JR, Grimm AA, Imai S (2004) The NAD biosynthesis pathway mediated by nicotinamide phosphoribosyl transferase regulates Sir2 activity in mammalian cells. J Biol Chem 279: 50754–50763.
  7. Wang T, Zhang X, Bheda P, Revollo JR, Imai S, et al. (2006) Structure of Nampt/PBEF/visfatin, a mammalian NAD+ biosynthetic enzyme. Nat Struct Mol Biol 13: 661–662. [crossref]
  8. Lim SY, Davidson SM, Paramanathan AJ, Smith CC, Yellon DM, et al. (2008) The novel adipocytokine visfatin exerts direct cardioprotective effects. J Cell Mol Med 12: 1395–403.
  9. Revollo JR, Korner A, Mills KF, Satoh A, Wang T, et al. (2007) Nampt/PBEF/Visfatin regulates insulin secretion in beta cells as a systemic NAD biosynthetic enzyme. Cell Metab 6: 363–375.
  10. Filippatos TD, Derdemezis CS, Kiortsis DN, Tselepis AD, Elisaf MS (2007) Increased plasma levels of visfatin/pre-B cell colony-enhancing factor in obese and overweight patients with metabolic syndrome. J Endocrinol Invest 30: 323–326.
  11. Zhong M, Tan HW, Gong HP, Wang SF, Zhang Y, et al. (2008) Increased serum visfatin in patients with metabolic syndrome and carotid atherosclerosis. Clin Endocrinol (Oxf) 69: 878–884.
  12. Lin CC, Lai MM, Li TC, Li CI, Liu CS, et al. (2009) Relationship between serum retinol-binding protein 4 and visfatin and the metabolic syndrome. Diabetes Res Clin Pract 85: 24–29.
  13. Ntzouvani A, Fragopoulou E, Panagiotakos D, Pitsavos C, Antonopoulou S (2016) Reduced circulating adiponectin levels are associated with the metabolic syndrome independently of obesity, lipid indices and serum insulin levels: a cross-sectional study. Lipids Health Dis 15: 140.
  14. Wang W, Xing W, Zhang H, Ding M, Shang L, et al. (2013) Reduced high-molecular-weight adiponectin is an independent risk factor for cardiovascular lesions in hypercholesterolaemic patients. Clin Endocrinol (Oxf) 78: 539–544.
  15. Hojlund K, Frystyk J, Levin K, Flyvbjerg A, Wojtaszewski JF, et al. (2006) Reduced plasma adiponectin concentrations may contribute to impaired insulin activation of glycogen synthase in skeletal muscle of patients with type 2 diabetes. Diabetologia 49: 1283–1291.
  16. Thabit H, Burns N, Shah S, Brema I, Crowley V, et al. (2013) Prevalence and predictors of diabetes and cardiometabolic risk among construction workers in Ireland: the Construction Workers Health Trust screening study. Diab Vasc Dis Res 10: 337–345.
  17. Chen MP, Chung FM, Chang DM, Tsai JC, Huang HF, et al. (2006) Elevated plasma level of visfatin/pre-B cell colony-enhancing factor in patients with type 2 diabetes mellitus. J Clin Endocrinol Metab 91: 295–299.
  18. Levy JC, Matthews DR, Hermans MP (1998) Correct homeostasis model assessment (HOMA) evaluation uses the computer program. Diabetes Care 21: 2191–2192.
  19. Alberti KG, Zimmet P, Shaw J; IDF Epidemiology Task Force Consensus Group (2005) The metabolic syndrome–a new worldwide definition. Lancet 366: 1059–1062. [crossref]
  20. Lindström J, Tuomilehto J (2003) The diabetes risk score: a practical tool to predict type 2 diabetes risk. Diabetes Care 26: 725–731. [crossref]
  21. Schindler K, Vila G, Hoppichler F, Lechleitner M, Luger A, et al. (2012) The impact of type 2 diabetes on circulating adipokines in patients with metabolic syndrome. Obes Facts 5: 270–276. [crossref]
  22. Filippatos TD, Derdemezis CS, Gazi IF, Lagos K, Kiortsis DN, et al. (2008) Increased plasma visfatin levels in subjects with the metabolic syndrome. Eur J Clin Invest 38: 71–72. [crossref]
  23. de Luis DA, Aller R, Gonzalez Sagrado M, Conde R, Izaola O, et al. (2013) Serum visfatin levels and metabolic syndrome criteria in obese female subjects. Diabetes Metab Res Rev 29: 576–581.
  24. Kocelak P, Olszanecka-Glinianowicz M, Owczarek AJ, Krupa W, Obirek P, et al. (2015) Plasma visfatin/nicotinamide phosphoribosyltransferase (visfatin/NAMPT) concentration in elderly subjects with metabolic syndrome. Polskie Archiwum Medycyny Wewnetrznej 125: 402–413.
  25. Guducu N, Isci H, Gormus U, Yigiter AB, Dunder I. (2013) Serum visfatin levels do not increase in post-menopausal women with metabolic syndrome. J Endocrinol Invest 36: 157–161.
  26. Jialal I, Devaraj S, Kaur H, Adams-Huet B, Bremer AA (2013) Increased chemerin and decreased omentin-1 in both adipose tissue and plasma in nascent metabolic syndrome. J Clin Endocrinol Metab 98: 514–517.
  27. de Kreutzenberg SV, Ceolotto G, Papparella I, Bortoluzzi A, Semplicini A, et al. (2010) Downregulation of the longevity-associated protein sirtuin 1 in insulin resistance and metabolic syndrome: potential biochemical mechanisms. Diabetes 59: 1006–1015.
  28. Yoshino J, Mills KF, Yoon MJ, Imai S (2011) Nicotinamide mononucleotide, a key NAD(+) intermediate, treats the pathophysiology of diet- and age-induced diabetes in mice. Cell Metab 14: 528–536. [crossref]
  29. Pagano C, Pilon C, Olivieri M, Mason P, Fabris R, et al. (2006) Reduced plasma visfatin/pre-B cell colony-enhancing factor in obesity is not related to insulin resistance in humans. J Clin Endocrinol Metab. 91: 3165–3170.
  30. Brema I, Hatunic M, Finucane F, Burns N, Nolan JJ, Haider D, et al. (2008) Plasma visfatin is reduced after aerobic exercise in early onset type 2 diabetes mellitus. Diabetes, obesity & metabolism 10: 600–602.
  31. Dogru T, Sonmez A, Tasci I, Bozoglu E, Yilmaz MI, et al. (2007) Plasma visfatin levels in patients with newly diagnosed and untreated type 2 diabetes mellitus and impaired glucose tolerance. Diabetes Res Clin Pract 76: 24–29.
  32. Xiang RL, Mei M, Su YC, Li L, Wang JY, et al. (2015) Visfatin Protects Rat Pancreatic beta-cells against IFN-gamma-Induced Apoptosis through AMPK and ERK1/2 Signaling Pathways. Biomed Environ Sci 28: 169–177.
  33. Lopez-Bermejo A, Chico-Julia B, Fernandez-Balsells M, Recasens M, et al. (2006) Serum visfatin increases with progressive beta-cell deterioration. Diabetes 55: 2871–2875.
  34. Krzyzanowska K, Mittermayer F, Krugluger W, Kopp HP, Schernthaner G (2006) Increase in visfatin after weight loss induced by gastroplastic surgery. Obesity (Silver Spring) 14: 1886–1889.
  35. Garcia-Fuentes E, Garcia-Almeida JM, Garcia-Arnes J, Garcia-Serrano S, Rivas-Marin J, et al. (2007) Plasma visfatin concentrations in severely obese subjects are increased after intestinal bypass. Obesity (Silver Spring) 15: 2391–2395.
  36. Botella-Carretero JI, Luque-Ramirez M, Alvarez-Blasco F, Peromingo R, San Millan JL, et al. (2008) The increase in serum visfatin after bariatric surgery in morbidly obese women is modulated by weight loss, waist circumference, and presence or absence of diabetes before surgery. Obes Surg 18: 1000–1006.
  37. Haider DG, Schindler K, Mittermayer F, Müller M, Nowotny P, et al. (2007) Effect of rosiglitazone on visfatin and retinol-binding protein-4 plasma concentrations in HIV-positive patients. Clin Pharmacol Ther 81: 580–585. [crossref]
  38. Haider DG, Schindler K, Schaller G, Prager G, Wolzt M, et al. (2006) Increased plasma visfatin concentrations in morbidly obese subjects are reduced after gastric banding. J Clin Endocrinol Metab 91: 1578–1581.
  39. Hara K, Yamauchi T, Imai Y, Manabe I, Nagai R, et al. (2007) Reduced adiponectin level is associated with severity of coronary artery disease. Int Heart J 48: 149–153.
  40. Linscheid P, Christ-Crain M, Stoeckli R, Reusch CE, Lutz TA, et al. (2008) Increase in high molecular weight adiponectin by bariatric surgery-induced weight loss. Diabetes Obes Metab 10: 1266–1270.
  41. Otto C, Otto B, Goke B, Pfeiffer AF, Lehrke M, Vogeser M, et al. (2006) Increase in adiponectin levels during pioglitazone therapy in relation to glucose control, insulin resistance as well as ghrelin and resistin levels. J Endocrinol Invest 29: 231–236.
  42. Körner A, Garten A, Blüher M, Tauscher R, Kratzsch J, et al. (2007) Molecular characteristics of serum visfatin and differential detection by immunoassays. J Clin Endocrinol Metab 92: 4783–4791. [crossref]
  43. Kieswich J, Sayers SR, Silvestre MF, Harwood SM, Yaqoob MM, et al. (2016) Monomeric eNAMPT in the development of experimental diabetes in mice: a potential target for type 2 diabetes treatment. Diabetologia
  44. El-Hini SH, Mohamed FI, Hassan AA, Ali F, Mahmoud A, et al. (2013) Visfatin and adiponectin as novel markers for evaluation of metabolic disturbance in recently diagnosed rheumatoid arthritis patients. Rheumatol Int 33: 2283–2289.

Extracorporeal Shockwave Therapy (ESWT) and Peripheral Magnetic Stimulation (Super Inductive System) Promotes Healing of Tibial Fracture Non-Union Unresponsive to Conventional Therapy: A Case Report

DOI: 10.31038/IJOT.2018113

Introduction

Delayed and nonunion of the tibia are not uncommon in medical practice and are associated with a significant impact on patients’ quality of life and health care cost. Extracorporeal shockwave therapy (ESWT) has been shown to improve osseous healing in vitro and in vivo. In this case we are presenting the impact of ESWT in combination with peripheral pulsed magnetic stimulation (Super Inductive System) in a 60 years old male patient who suffered for 7 months with a nonunion spiral right tibial fracture during skiing. In the initial evaluation patient was walking using a tall ankle foot support (walking boot) and two maxillary crutches.

Material and Method

ESWT coupled with high intensity pulsed peripheral pulsed magnetic stimulation and post treatment mobilization. ESWT parameters consisted of frequency 20Hz, 4000 shocks per session and pressure of 4 bars, energy flux density of 0.5 J/mm2. Super Inductive System parameters consisted of frequency 5Hz,10 minutes duration per session and intensity 40% of 3 Tesla. Patient received one session per week and 8 sessions in total.

Results

Outcome measures included verbal pain rating scale (VAS: 1/10 versus Vas: 6/10), radiographing imaging improvement, obvious after first 4 sessions already (see photos) and a return to activities of daily living (ADLs) with normal gait pattern without using the ankle foot support (walking boot) and the maxillary crutches 1 month post treatment.

Discussion

This case demonstrates the successful boosting of bone regenerative healing process in management of tibia non union. The procedure is well tolerated, time-saving, lacking side effects, with potential to significantly decrease of health care costs and improvement of patient’s Quality of life.

Conclusion

A combination of ESWT and peripheral pulsed magnetic stimulation is a feasible treatment combination which seems to accelerate tibia nonunion fracture.

X-ray of Tibia1 month post treatment

IJOT2018-103-F1

References

  1. d’Agostino MC, Craig K, Tibalt E, Respizzi S (2015) Shock wave as biological therapeutic tool: From mechanical stimulation to recovery and healing, through mechanotransduction. Int J Surg 24: 147–153. [Crossref]
  2. Elster EA, Stojadinovic A, Forsberg J, Shawen S, Andersen RC, et al (2010) Extracorporeal shock wave therapy for nonunion of the tibia. J Orthop Trauma 24: 133–141 [Crossref]
  3. Naomi M. Shupak, Frank S. Prato, Alex W. Thomas (2003) Therapeutic uses of pulsed magnetic-field exposure: A review. URSI Radio Science Bulletin 307: 09–32

Long-Term Outcomes in Patients after Discontinuation of Immune Checkpoint Inhibitors

DOI: 10.31038/JCRM.2018132

Abstract

Introduction: Programmed death protein/ligand 1 (PD1/PDL1) inhibitors are approved for several advanced or metastatic malignancies with improvement in both progression free and overall survival. However, there is a paucity of data on optimal treatment duration. Both KEYNOTE-001 and KEYNOTE-006 studies showed durable antitumor activity in approximately 90% of melanoma patients after discontinuation of two-year pembrolizumab treatment, with a median follow up duration of 32 and 33.9 months respectively. To our knowledge, there has been no study that provides similar information for other types of solid cancers. Hence, we report a retrospective single institute experience of the durable response after discontinuation of PD1/PDL1 inhibitors.

Materials & Methods: Data on patients treated with immunotherapy between 2010 and 2017 were collected retrospectively. Patients with all types of cancers who achieved disease control (including stable disease, partial and complete response) and were no longer treated with the immunotherapy for any reason were included. We analyzed the outcomes of these patients after discontinuation of immunotherapy.

Results: We evaluated a total 282 patients with a variety of solid tumor types who were treated with PD1/PDL1 inhibitors; 20 patients met our criteria. Cases were divided into two groups; melanoma (total 8), and non-melanoma (total 12; 3 renal cell, 3 bladder, 1 hepatocellular, 1 colon, and 4 non-small cell lung). As of Jan 2018, 7 out of 8 (88%) in the melanoma group had disease control after a median follow-up of 9 months post-treatment, whereas 8 out of 12 (67%) in non-melanoma group had disease control after a median follow-up of 10 months. The median treatment cycle in the melanoma group was 11.5 cycles (range: 3–20) versus 11 cycles (range: 3–15) in non-melanoma group. The main reason for stopping treatment was patient preference.

Conclusion: Our study shows similar efficacy of durable response in melanoma patients after stopping immunotherapy compared to KEYNOTE studies. Despite limited sample size and short duration of follow-up, our study was the first showing sustained disease control in several non-melanoma cancers after discontinuation of approximately one-year PD1/PDL1 inhibitor treatment. Future prospective malignancy specific trials for optimal duration are warranted.

Keywords

Immunotherapy, long term outcomes, melanoma, non-melanoma

Introduction

Immune checkpoint inhibitors have transformed the field of oncology. This treatment modality has been approved for several solid tumors with improvement in both progression free and overall survival. Yet, there is a paucity of data with respect to the optimal treatment duration and availability of a biomarker to predict treatment response. Both KEYNOTE-001 and 006 studies showed that 24-month disease free survival rate from time of complete remission was 90% vs. 55% after discontinuation of two-year pembrolizumab treatment. To our knowledge, there is no study that reports similar information for other types of solid cancers. As a retrospective single-center experience, we evaluated durable antitumor activity in both melanoma and non-melanoma patients who achieved treatment response (complete, partial or stable) after discontinuation of immunotherapy for any reason.

Materials & Methods

Data on patients treated with immunotherapy from Jan 2010 to Dec 2017 were collected retrospectively. Patients with any type of cancer that achieved a treatment response (complete, partial or stable) and had completed immunotherapy for any reason were included. Patient demographic information including age, sex, primary cancer, prior therapy, total number of doses, and duration of treatment response after discontinuation of therapy and types of response (complete, partial, stable or progression) were obtained. The study approved by local Institutional Review Board (IRB) and the IRB protocol number is 43216.

Results

We evaluated a total 282 patients with a variety of stage IV solid cancers who were treated with immune checkpoint inhibitors. Of that group, 157 patients were treated with nivolumab and 125 patients were treated with pembrolizumab. In this single-center, retrospective study, 20 patients met our eligibility criteria. This cohort was divided into two groups: a melanoma group (total 8), and a non-melanoma group (total of 12; 3 renal cell, 3 bladder, 1 hepatocellular, 1 colon, and 4 non-small cell lung). Patient baseline characteristics are detailed in Table 1.

Table 1. Baseline Characteristics and Outcomes.

Case

Age

Sex

Cancer

Previous Therapy

Total # Treatments (doses)

Reason to Discontinue

Immune-related AEs

Duration of Response (mos)

Outcome

1

60

F

Melanoma

Ipi × 4

Pem × 10

Organizing pneumonia

Organizing pneumonia

28

CR

2

89

F

Melanoma

None

Pem × 17

Patient Request

None

9

CR

3

77

M

Melanoma

None

Pem × 10

Patient Request

None

2.3

CR

4

67

M

Melanoma

Interferon; BRAF

Nivo × 20

RA Exacerbation

RA Exacerbation

9.1

CR

5

90

F

Melanoma

None

Pem × 13

Patient Request

None

5

CR

6

53

F

Melanoma

BRAF

Pem × 8

RA

Hypothyroid & RA

4.6

CR

7

60

M

Melanoma

No

Niv × 8

Pancreatitis

Pancreatitis

4.8

SD

8

87

M

Melanoma

Ipi × 4

Niv × 3

Patient Request

None

16.7

CR

9

67

M

RCC

Pazopanib

Niv × 25

Patient Request

None

6

P

10

40

M

RCC

Sunitinib

Niv × 30

Patient Request

None

11.3

SD

11

74

F

RCC

Pazopanib

Niv × 20

Sjogren

Sjogren

4.2

SD

12

87

M

Bladder

Cis/Gem

Pem x11

Patient Request

None

11

SD

13

58

M

Bladder

Carbo/Gem

Pem × 13

Patient Request

None

10.6

PR

14

70

M

Bladder

Carbo/Gem

Pemx 12

HLH

HLH

12

P

15

58

M

HCC

Embolization

Nivx6

Patient Request

None

11

P

16

79

F

NSCLC

Carbo/pem

Niv x8

Hepatitis

Hepatitis

7

PR

17

78

M

NSCLC

Carbo/Gem

Nivx 18

Patient Request

None

6

P

18

76

F

NSCLC

Unknown

Niv × 24

Patient Request

None

14

SD

19

66

F

NSCLC

None

Pemx 15

Patient Request

None

22.6

CR

20

55

F

Colon

FOLFOX

Pemx9

Peripheral neuropathy

Peripheral neuropathy

8.8

PR

Ipi = ipilimumab; Pem = pembrolizumab; Niv = nivoluamb; Cis/Gem = cisplatin/gemcitabine; Carbo/Gem = carboplatin/gemcitabine; carbo/pem =carboplatin/pemetrexed; FOLFOX = Folinic acid+Fluorouracil+Oxaliplatin; mos= months; AEs = adverse responses; CR = complete response; P = progression; SD = stable disease; PR = partial response; BLE = bilateral lower extremities; RA = Rheumatic arthritis; HLH = Hemophagocytic lymphohistiocytosis.

In melanoma group, the median age was 73 years (range: 44–90), with male and female equally represented. Performance status (Eastern Cooperative Oncology Group, ECOG) for all patients was 0 to 1. Four of the 8 melanoma patients had prior therapies; two patients received four doses of adjuvant ipilimumab and two patients were treated with BRAF inhibitors. Three of the 8 patients had the BRAFV600E mutation. Five of the eight melanoma patients were treated with pembrolizumab and the remaining three patients were treated with nivolumab. The median duration of the first radiographic response was 5 months (range: 3–8). The median number of immunotherapy treatment doses was 12 (range: 3–20). The median duration of durable treatment response after discontinuation of immunotherapy was 9.7 months (range: 2–27). Four patients discontinued treatment due to immune-related adverse events: 1 developed organizing pneumonia; 2 acquired Rheumatoid arthritis; and 1 developed pancreatitis. The remaining four patients requested to stop treatment. (Tables 1, 2)

In non-melanoma group of 12 patients, three were diagnosed with renal cell cancer (RCC), three with bladder cancer, there was one hepatocellular cancer (HCC), one colon cancer, and four patients with non-small cell lung cancer (NSCLC). The median age was 67 years (range: 40–87). Eight of the twelve were male and 4 were female. Ten of 12 patients had prior therapies. Three patients were treated with tyrosine kinase inhibitors (two with pazopanib and one with sunitinib) for RCC. Three bladder cancer patients received platinum with gemcitabine. One HCC had localized therapy by embolization. Two of the 4 NSCLC had chemotherapy (1 with carboplatin/gemcitabine for squamous cell, 1 with carboplatin/pemetrexed for adenocarcinoma). One colon cancer patient was treated with FOLFOX. Three of the 8 patients were positive for the BRAFV600E mutation. Seven patients were treated with nivolumab, and four patients were treated with pembrolizumab. The median duration of the first radiographic response was 3.2 months (range: 2–5). The median number of immunotherapy treatment doses was 15 (range: 6–30). The median duration of durable treatment response after discontinuation of immunotherapy was 10.4 months (range: 4–23). Four patients discontinued treatment due to immune related adverse events: 1 developed Sjogren syndrome; 1 developed hemophagocytic lymphohistiocytosis; 1 acquired hepatitis, and 1 had peripheral neuropathy. The remaining patients requested a break from treatment. Four patients had disease progression after discontinuation of immunotherapies with the median duration of 8.7 months. (Tables 1, 2)

Table 2. Outcome Comparisons for the Melanoma and Non- Melanoma groups.

Characteristics

Melanoma

N= 8

Non-melanoma

N = 12

Median age in years (range)

73 (44–90)

67 (40–87)

Men, N (%)

4 (50%)

8(66%)

ECOG 0–1, N (%)

8 (100%)

12(100%)

Previous therapy, N (%)

4 (50%)

10 (83%)

BRAF mutant positive

3 (38%)

0

PD-L1 positive (>50%)

Unknown

0

Median duration of first radiographic response in months (range)

5 (3–8)

3.2 (2–5)

Median number of immunotherapy cycles, (range)

12 (3–20)

15 (6–30)

Median duration in months of treatment response after discontinuation of therapy, (range)

9.7 (2–27)

10.4 (4–23)

Disease response (CR, PR, stable, progression)

7 (88%) CR

1(12%) stable

3 (25%) PR

4 (33%) stable

4 (33%) progression

1 (8%) CR

Immune related side effects, N (%)

4 (50%)

4 (33%)

ECOG = Eastern Cooperative Oncology Group; CR = complete response; PR = partial response; N = number.

Seven out of 8 patients (88%) from the melanoma group had disease free progression after a median follow-up of 9 months. Eight out of 12 patients (67%) from the non-melanoma group had disease free progression after a median follow-up of 10 months.

Discussion

Immune checkpoint inhibitors have transformed oncologic therapeutics. Immunotherapy provides improved overall survival and progression free survival for several solid tumors including melanoma, NSCLC, bladder cancer and RCC. However, there is no good biomarker that predicts which patient will benefit with immunotherapy. It was thought that programmed death ligand 1 (PDL1) expression would predict a good prognostic biomarker, however, there are multiple limitations related to this new type of therapeutic [1–3]. The optimal duration for therapy is ambiguous, however the current practice is to continue immunotherapy until disease progression or intolerable adverse events (AEs) occur. Immunotherapy is associated with immune-related AEs, some that can cause toxicities of grade 3 or higher. Thus, a shorter duration of therapy could spare patients from unnecessary toxicities and health expenditures.

Most patients in our study were treated with immunotherapy as a second-line therapy. Approximately 50% of patients from the melanoma group and 33% from the non-melanoma group experienced immune-related AEs, which led to discontinued treatment. The remaining 50% (melanoma) and 67% (non-melanoma) of the patients requested a therapy break secondary to a variety of issues. A common issue was financial, related to limitations imposed by insurance companies. Another issue related to transportation difficulties, especially when bi-weekly commutes were required. Finally, some patients questioned why they would need to continue treatment if they had already achieved a complete response. The median duration of treatment in both groups was approximately one-year, and 88% of the melanoma group, 67% from non-melanoma group achieved disease control with a median follow-up of 9–10 months.

Schadendorf et al. hypothesized that the immune-related AEs could be a hint for durability in the response, secondary to activation of immune system [4]. The KEYNOTE-006 phase III trial prospectively investigated for a two-year treatment of pembrolizumab in advanced melanoma. The study demonstrated that 55% of patients on pembrolizumab had a 24-months overall survival benefit after discontinuation of the treatment [5]. Conclusions from the KEYNOTE-001 phase III trial supported those reported in the KEYNOTE-006 trial, that patients who achieved a complete response could consider a discontinuation of the treatment. In fact, 90.9% of those patients who discontinued treatment were in disease-free-remission after a median follow up of two years [6].

These two KEYNOTE studies provide convincing evidence that a two-year immunotherapy treatment period improves overall survival benefit. When compared to the KEYNOTE studies, our study provided similar efficacy in terms of a durable response in melanoma patients in the post immune-treatment period. Interestingly, our patient cohort received treatment for approximately one year. A limitation of our study is that it is a retrospective study.

Cancer cells become resistance to chemotherapy and targeted therapies. An understanding of this concept is important in the sequencing of therapeutics for our patients. Well-performed studies established that mutations develop during ontogenesis that can be driver or passenger mutations, and give rise to non-epitopes that the immune system recognizes as neo-antigens. The immune checkpoint inhibitors act on specific tumor mutant proteins to reactivate the T-cell response. Hence, cases with a high tumor mutation burden (TMB) have a high treatment response rate [7, 8]. Studies have suggested that a high TMB predicts a favorable treatment response and also durable clinical benefit. For example, a high TMB in NSCLC predicted a higher response rate 59% vs 12% in low TMB patients and longer progression free survival (14.5 months in high TMB patients vs. 4.1 months in low TMB) in patients receiving a PD-1 inhibitor [9]. For bladder cancer, a high TMB did predict a favorable response [10]. Treated tumors exposed to genotoxic chemotherapy or radiotherapy are known to have a higher mutational rate compared to the TMB at diagnosis or prior to treatment [11, 12]. Therefore, TMB is an emerging biomarker of positive response to immune checkpoint inhibitors. However, efforts should be made to develop a molecular profile of prognostic variables or predictive biomarkers to customize prognosis at the baseline, and thereby guide an optimal duration for the immunotherapy.

Conclusion

Our study showed a sustained durable response in a variety of solid tumors after discontinuation of immunotherapy with a median 9–10 months of disease free progression post-therapy after median 11 cycles of treatment. Additional prospective trials are warranted.

Declaration Statement

Ethics Approval and Consent to Participate: The study approved by local Institutional Review Board (IRB) and the IRB protocol number is 43216.

Consent for Publication: Not applicable.

Availability of Data and Material: Data sharing is not applicable to this article as no datasets were generated or analyzed during the current study.

Author Contributions: Conception and design: All authors; Administrative support: PW; Provision of materials: All authors; Collection and assembly of data: All authors; Data interpretation: All authors; Manuscript writing and final approval: All authors

Compliance with Ethical Standards: Not Applicable

Conflict of Interest: The authors declare that they have no conflict of interest.

Funding: Not Applicable

Consent for Publication: Not Applicable. The study approved by local institution review board.

Acknowledgements: The authors thank Catherine Anthony, Ph.D. and the Markey Cancer Center Research Communications Office for assistance with manuscript preparation.

References

  1. Rimm DL, Han G, Taube JM, Yi ES, Bridge JA, et al. (2017) A Prospective, Multi-institutional, Pathologist-Based Assessment of 4 Immunohistochemistry Assays for PD-L1 Expression in Non-Small Cell Lung Cancer. JAMA Oncol. 3: 1051–8.[Crossref]
  2. McLaughlin J, Han G, Schalper KA, Carvajal-Hausdorf D, Pelekanou V, et al. (2016) Quantitative Assessment of the Heterogeneity of PD-L1 Expression in Non-Small-Cell Lung Cancer. JAMA Oncol. 2: 46–54. [Crossref]
  3. Grigg C,Rizvi NA. (2016) PD-L1 biomarker testing for non-small cell lung cancer: truth or fiction? J Immunother Cancer. 4: 48.
  4. Schadendorf D, Wolchok JD, Hodi FS, Chiarion-Sileni V, Gonzalez R, et al. (2017) Efficacy and Safety Outcomes in Patients With Advanced Melanoma Who Discontinued Treatment With Nivolumab and Ipilimumab Because of Adverse Events: A Pooled Analysis of Randomized Phase II and III Trials. J Clin Oncol. 35: 3807–14. [Crossref]
  5. Schachter J, Ribas A, Long GV, Arance A, Grob JJ, et al. (2017) Pembrolizumab versus ipilimumab for advanced melanoma: final overall survival results of a multicentre, randomised, open-label phase 3 study (KEYNOTE-006). Lancet. 390: 1853–62. [Crossref]
  6. Robert C, Ribas A, Hamid O, Daud A, Wolchok JD, et al. (2017) Durable Complete Response After Discontinuation of Pembrolizumab in Patients With Metastatic Melanoma. J Clin Oncol. Jco2017756270. [Crossref]
  7. Schumacher TN,Schreiber RD. (2015) Neoantigens in cancer immunotherapy. Science. 348: 69–74.
  8. Van Allen EM, Miao D, Schilling B, Shukla SA, Blank C, et al. (2015) Genomic correlates of response to CTLA-4 blockade in metastatic melanoma. Science. 350: 207–11. [Crossref]
  9. Rizvi NA, Hellmann MD, Snyder A, Kvistborg P, Makarov V, et al. (2015) Cancer immunology. Mutational landscape determines sensitivity to PD-1 blockade in non-small cell lung cancer. Science. 348: 124–8. [Crossref]
  10. Powles T, Eder JP, Fine GD, Braiteh FS, Loriot Y, et al. (2014) MPDL3280A (anti-PD-L1) treatment leads to clinical activity in metastatic bladder cancer. Nature. 515: 558–62. [Crossref]
  11. Johnson BE, Mazor T, Hong C, Barnes M, Aihara K, et al. (2014) Mutational analysis reveals the origin and therapy-driven evolution of recurrent glioma. Science. 343: 189–93. [Crossref]
  12. Padovan-Merhar OM, Raman P, Ostrovnaya I, Kalletla K, Rubnitz KR, et al. (2016) Enrichment of Targetable Mutations in the Relapsed Neuroblastoma Genome. PLoS Genet. 12: e1006501. [Crossref]

Proseal™ LMA Insertion: Comparison of the Nasogastric Catheter Guided Technique with the Conventional Digital Technique

DOI: 10.31038/JCRM.2018131

Abstract

Several techniques have been introduced to improve the success rate and efficiency of the ProsealTM laryngeal mask airway (PLMA) placement along with decreasing complication. The aim of this study is to compare the success rate of the nasogastric catheter guided technique to the conventional digital technique.

Methods

In this randomized-controlled clinical trial, 200 patients, age between 18 and 65 years old, underwent inhalation technique anesthesia were enrolled. Participants were randomized by computer to Nasogastric catheter guided group (NG) and Digital technique group (DT). Anesthesia was induced with propofol (3 mg/kg) and fentanyl (2 mcg/kg). In DT group, the PLMA was inserted by using the index finger insertion technique. In NG group, PLMA with nasogastric catheter protruding for 5 cm from the PLMA drain tube distal aperture was inserted with the same method. Successful insertion was evaluated by the chest movement and the persistent rising of end-tidal carbon dioxide. The quality of placement was also recorded after the patient regained spontaneous breathing. Complications were evaluated at the end of the surgery and at the PACU discharge time.

Result

Patient characteristics were similar in both groups. The overall insertion success rates were similar; 89.3% in NG and 81.5% in DT group (P=0.22). There was no difference in insertion attempt (success rate in the first attempt = 86.7% and 84.0% in NG group and DT group respectively, P = 1.00). The time to the success of insertion was not significantly different; 30 seconds in NG group vs 35 seconds in DT group (P=0.185). There were no differences in the complications such as airway bleeding, sore throat, dysphagia, and hoarseness.

Conclusion

Insertion of Proseal LMA using nasogastric catheter guided technique did not provide an advantage over digital technique. The complications from both insertion techniques were also similar.

Keywords

Proseal LMA, Nasogastric catheter, Airway device

Background

Laryngeal mask airway (LMA) is an alternative airway device widely used during elective surgical procedures. ProsealTM LMA (PLMA) is another advanced form of this supraglottic airway device. PLMA may be inserted by the standard index finger or by using the introducer. Several techniques have also been introduced to improve the success rate and efficiency of the PLMA placement along with decreasing the complications [1,2] [4–8] [10].

The previous studies comparing the success rate of PLMA insertion showed that the use of suction catheter guided insertion had the higher success rate than the insertion without the guide [1,2]. Gum elastic bougie (GEB) guided insertion was not different in comparison to the metallic introducer in the point of success rate but it showed the improvement of the position of PLMA placement [3]. Using laryngoscope to direct insertion of GEB into esophagus before assisting PLMA insertion further improved the success rate significantly [4–6]. However, the mucosal trauma occurrence was higher with GEB guided insertion. Flexi-slip stylet guided insertion also showed higher success rate together with decreasing trauma complications [7]. The airway stylet; Foley airway stylet (FAST), had similar outcomes but it had the higher trauma rate compared to the metallic introducer [9]. Additionally, neuromuscular blocking agents could be used to improve the laryngeal airway insertion [11]. Advancing the guide such as the suction catheter into esophagus 10 to 15 centimeters to guide PLMA had the higher success rate as well [8–10].

Methods

This randomized controlled clinical trial was approved by the Ethics Committee of the Faculty of Medicine, Prince of Songkla University (ethical number: 59-192-08-1). Data were collected from October 2016 to October 2017. We recruited 200 patients, with the age between 18 – 65 years old, the American Society Anesthesiologists physical status I – III, who underwent inhalation technique of anesthesia. Patients who had body weight lower than 30 kilograms or heavier than 70 kilograms or body mass index more than 35 kilograms per square centimeters, history or suspicion of difficulty in airway management, the risk of aspiration, respiratory diseases and change of anesthetic technique were excluded from the study. Computerized randomization was performed to divide participants into nasogastric catheter guided technique group (NG) and Digital technique group (DT) equally. The opaque envelopes containing group assignment were opened prior to the start of the induction of anesthesia.

The patients were not given sedative agents for premedication. The patient position was supine without the pillow. After applying the standard monitoring and preoxygenation for 3 minutes with 100% oxygen, anesthesia was induced with propofol (3 mg/kg) and fentanyl (2 mcg/kg) intravenously. Additional boluses of propofol 0.5 mg/kg intravenously were given as required to achieve the adequate depth of anesthesia, apnea, and adequate jaw relaxation. The PLMA insertion was performed by the first or second-year anesthetic residents or in-training anesthetic nurses who had experience more than 5 success of LMA insertion. In DT group, the PLMA was inserted by using index finger insertion technique according to the manufacturer’s instruction manual. In NG group, PLMA with nasogastric catheter protruding for 5 cm from the PLMA drain tube distal aperture was inserted with the same method. The PLMA size 3 or 4 selection was based on anesthesiologists’ consideration. Neuromuscular blocking agents were not allowed to be used. The duration for insertion started as the opening of the patient’s mouth and ended after successful insertion proved by chest movement along with the ventilation and the persistent rising of end-tidal carbon dioxide for at least 5 waves. If unsuccessful insertion occurred, PLMA would be removed, then preoxygenation and additional propofol bolus doses were provided. PLMA insertions were allowed for only 2 attempts, after that, it was considered as failed insertion then the airway management was followed by the discretion of anesthetic staff. In both groups, the PLMA cuff was inflated with air to the pressure of 40 centimeters of water. Patient’s ventilation was assisted until regaining of the spontaneous breathing. Anesthesia was maintained with volatile anesthetic agent and 50% of oxygen in air. Five minutes later, the secondary outcomes were assessed by following; the position of the nasogastric catheter placement confirmed with the audible sound at epigastrium by 10 milliliters of air push, hypercapnia (End tidal Carbon dioxide more than 60 mmHg), hypoxia (Oxygen saturation less than 95%) and the leakage of ventilation (leakage sound through the patient’s mouth). The awake technique for PLMA removal was used at the end of anesthesia.

The complications were assessed after removal of PLMA. Any visible blood stain or blood in the early oropharyngeal secretion suction was noted. Patients were asked for the sore throat, hoarseness or dysphagia before discharging from PACU by PACU nurses who were blinded to the insertion technique.

Statistical analysis

The sample size was calculated from the difference of the success rates in the previous study [1]. The number of population required for this study was 90 patients for each group. With the 10% drop-out rate, therefore, the definite number of the population was 100 patients in each group. This estimation would give a power of 80% to detect the difference at the significance level of 0.05.

Statistical analysis was performed using R software. Continuous variables were presented as median and interquartile range (IQR) or mean. Categorical variables were presented as number of patients and percentages. Continuous variables were analyzed by Student t-test or Wilcoxon Rank Sum test. Categorical variables were analyzed by Fisher’s exact test, or Chi-square test. P value less than 0.05 was considered as statistical significance.

Result

Two hundred participants were enrolled into the study, eight patients in DT group and sixteen patients in NG group were excluded (Figure 1). Patient characteristics were not significantly different (Table 1).

JCRM 2018-111 - Wirat WasinWong Thailand_F1

Figure 1. Consort flow diagram

Table 1. Demographic data of the patients.

NG (n=84)

DT (n=92)

P-value

Age (year)*

Gender+

 – Male

 – Female

45 (32–51)

16 (19)

68 (81)

46 (35–54)

24 (26)

68 (74)

0.20

0.35

Weight (kg)*

58 (49–65)

60 (52–63)

0.56

Height (cm)*

157 (154–160)

158 (154–165)

0.41

BMI

22.8 (3.0)

22.8 (3.5)

0.89

ASA+

 – I

 – II

 – III

Mallampati score+

 – I

 – II

 – III

Proseal size

 – 3

 – 4

Performer

 – In-training anesthetic nurse

 – 1st year resident

 – 2nd year resident

20 (23.8)

64 (76.2)

0 (0)

36 (42.9)

44 (52.4)

4 (4.8)

36 (42.9)

48 (57.1)

39 (46.4)

29 (34.5)

16 (19)

22 (23.9)

68 (73.9)

2 (2.2)

48 (52.2)

42 (45.7)

3 (2.2)

32 (34.8)

60 (65.2)

51 (55.4)

29 (31.5)

12 (13)

0.60

0.38

0.35

0.40

* Data are presented as a median (IQR)
+ Data are presented as a number (%)
• Data are presented as a mean (SD)

There were no significant difference in success rates (Table 2). Success rate in NG group at first attempt was 86.7% and 13.3% in second attempt. In DT group, success rate at first attempt was 84% and 16% in second attempt. The overall success rate were 89.3% in NG group and 81.5% in DT group (P value = 0.216). By the Logistic regression analysis with the insertion success as the outcome variable, there was no significant variables (ASA status, Mallampati score, the performers, PLMA size).

Table 2. Success and quality of PLMA placement

NG
(n=84)

DT
(n=92)

P-value

Insertion success+

Insertion attempt+

 – 1

 – 2

75 (89.3)

65 (86.7)

10 (13.3)

75 (81.5)

63 (84.0)

12 (16.0)

0.22

0.82

Insertion time (second)*

30 (25–47)

35 (25–54)

0.38

Proper nasogastric catheter placement+

68 (90.7)

60 (80.0)

0.11

Hypoxemia+

2 (2.7)

3 (4.0)

1.00

Hypercapnia+

Leakage+

2 (2.7)

32 (42.7)

2 (2.7)

29 (38.7)

1.00

0.74

* Data are presented as a median (IQR)
+ Data are presented as a number (%)
• Data are presented as a mean (SD

For the success of PLMA insertion (75 cases) in both groups, there were no differences in the time to success insertion and the PLMA position. The duration of insertion were 30 seconds (IQR = 25 – 47 seconds) in NG group and 35 seconds (IQR = 25 – 54 seconds) in DT group. The nasogastric catheter placement in the proper position were not significantly different which were 68 of 75 (90.7%) patients in NG group and 60 of 75 (80%) patients in DT group. The incidences of hypoxemia, hypercapnia and air leakage were not significant difference.

The visible blood stain on PLMA or in the early suction was noted after PLMA removal. Bleeding was found similarly both in NG group (24%) and in DT group (20%) (P-value = 0.693). Sore throat was reported by 36% of patients in DT group and 26.7% of patients in NG group (P-value = 0.291). Dysphagia was the same as 4% in both groups (Table 3). Hoarseness was not significantly different between the two groups (4% and 2.7% in NG and DT groups, respectively). The symptoms of all patients improved within two days postoperatively.

Table 3. Airway complications

NG
(n=75)

DT
(n=75)

P-value

Bleeding

Sore throat

18 (24)

20 (27)

15 (20)

27 (36)

0.69

0.29

Dysphagia

Hoarseness

3 (4)

3 (4)

3 (4)

2 (3)

1.00

1.00

Data are presented as a number (%)

Discussion

The success rate of PLMA insertion by using the nasogastric catheter guiding was slightly higher, but not significantly different from the conventional digital technique. Due to the number of the patients in the NG group were withdrawn more than 10% drop-out, therefore, the sensitivity analysis was also performed and analyzed. The result still showed no significantly different in the success rates between the two groups. The numbers of insertion and the duration of PLMA placement were also similar between the two groups. The quality of PLMA position which determined by the proper position of the nasogastric catheter placement, hypercapnia, hypoxia and the leakage of ventilation also revealed the insignificant differences between the two groups. However, the rate of proper nasogastric-catheter-positioning was slightly higher in NG group.

The nasogastric catheter used as a guide for PLMA insertion in our hospital might be different from previous literatures. The nasogastric catheter from the different company might differ in the consistency of the material. Therefore, it might not be helpful to be the guide of the PLMA insertion in this study. Even though, the complications such as airway trauma were not significantly different. Five centimeters protrusion of nasogastric catheter from the distal end of PLMA drainage tube in our study was less than those in the previous reports so it could be inserted together with PLMA and the protruding nasogastric catheter would act as the guide to the proper positioning of PLMA. Unlike the previous studies, the nasogastric catheter was inserted 10 to 15 centimeters deep into the esophagus and then following by the PLMA [8,10]. With the longer length of nasogastric catheter, it was easier to be folded or kinked while passing through posterior pharyngeal wall causing the impediment of the PLMA insertion and also caused mucosal trauma and increased the time of insertion. In this study, the success rates were not different from the other reports (90%) in NG guided technique which also performed by inexperienced performers [1,2], whereas the success rate of the digital technique in this study was higher than those in the previous reports [1,2].

The experience of the anesthesiologist is another important factor for the successful insertion of PLMA. In the experienced hands, the success rate might not be different because of the ease of the LMA insertion by itself. In the other hand, the different techniques of insertion might affect the success in the learners. Thus, the first and second-year anesthetic residents and in-training anesthetic nurses were designed as the performers. However, the result showed no significant difference in the success rates between the two groups.

For the patients who failed PLMA insertion, half of them were managed by intubation with oroendotracheal tube. Three patients were successfully inserted the PLMA by anesthetic staff in the third attempt. However, it had to reduce the size 4 to size 3 of PLMA to achieve the successful PLMA insertion in three patients.

In DT group, there were some patients failed to properly advance the nasogastric catheter to the stomach. The cause probably be due to the misplacement of the tip of drainage tube of PLMA which was not properly at the esophageal opening or the minor folding of the tip of PLMA after insertion.

The Use of larygeal mask airway in an elective surgery is safe and has low incidences of the serious complications. The mild, short-lasting complications such as airway bleeding/trauma, sore throat, hoarseness are more common. The incidences of airway trauma and sore throat varied from 9 – 22% and 5.8 – 34% depending on the PLMA insertion techniques [11]. The complications of PLMA insertion in our study were not different from the previous studies [1,8,11] but the incidences were higher than those in the reports using laryngoscope and oesophageal vent to guide the PLMA insertion [4,12].

Limitation

First, fourteen patients were excluded from the study due to incomplete data. Even this did not affect to the primary outcome which tested by sensitivity analysis, but it might affect some other secondary outcomes. Secondly, the variation in the experience among the 13 anesthetic nurses and 17 anesthetic residents to perform PLMA insertion during the 1-year duration of the study. Thirdly, we did not use flexible fiberoptic laryngoscope to determine the proper position of placement. The malposition rate might be higher compared to the clinical judgement. Lastly, this study could not be blinded for the assessment of PLMA insertion.

Conclusion

Insertion of the Proseal LMA using nasogastric catheter protruding 5 cm from the drainage tube distal aperture for guiding technique did not provide an advantage over the index finger technique by the inexperienced performers. The complications from both insertion techniques were also similar.

Thai Clinical Trial Registry number: TCTR20161026001

Financial support of the work: Songklanagarind Hospital, Department of Anesthesia, Faculty of Medicine, Prince of Songkla University, Thailand

Conflict of Interest: none

Acknowledgement: none

References:

  1. Perilli V, Aceto P, Sacco T, Martella N, Cazzato MT, Sollazzi L (2014) Suction catheter guided insertion of ProSeal laryngeal mask airway: Experience by untrained physicians. Indian J Anaesth. 58(1): 25–9. [Crossref]
  2. Nagata T, Kishi Y, Tanigami H, Hiuge Y, Sonoda S, Ohashi Y, et al. (2012) Oral gastric tube-guided insertion of the ProSeal™ laryngeal mask is an easy and noninvasive method for less experienced users. J Anesth 26(4): 531–5. [Crossref]
  3. El Beheiry H, Wong J, Nair G, Chinnappa V, Arora G, Morales E, et al. (2009) Improved esophageal patency when inserting the ProSealTM laryngeal mask airway with an EschmannTM tracheal tube Introducer. Can J Anaesth 56(10): 725–32. [Crossref]
  4. Eschertzhuber S, Brimacombe J, Hohlrieder M, Stadlbauer KH, Keller C (2008) Gum Elastic Bougie-guided insertion of the ProSeal Laryngeal mask airway is superior to the digital and introducer tool techniques in patients with simulated difficult laryngoscopy using a rigid neck collar. Anesth Analg 107(4): 1253–6. [Crossref]
  5. Howath A, Brimacombe J, Keller C (2002) Gum-elastic bougie-guided insertion of the ProSeal laryngeal mask airway: a new technique. Anaesth Intensive Care 30(5): 624–7. [Crossref]
  6. Brimacombe J, Keller C. (2004) Gum elastic bougie-guided insertion of the ProSeal Laryngeal Mask Airway. Anaesth Intensive Care 32(5): 681–4. [Crossref]
  7. Chen HS, Yang SC, Chien CF, Spielberger J, Hung KC, Chung KC (2011) Insertion of the ProSealTM laryngeal mask airway is more successful with the Flexi-SlipTM stylet than with the introducer. Can J Anesth 58(7): 617–23. [Crossref]
  8. García-Aguado R, Viñoles J, Brimacombe J, Vivó M, López-Estudillo R, Ayala G (2006) Suction catheter guided insertion of the ProSealTM laryngeal mask airway is superior to the digital technique. Can J Anesth 53(4): 398–403. [Crossref]
  9. Chen MK, Hsu HT, Lu IC Shih CK, Shen YC, Tseng KY, et al. (2014) Techniques for the insertion of the proseal laryngeal mask airway: comparison of the foley airway stylet tool with the introducer tool in a prospective, randomized study. BMC Anesthesiol 14: 105. [Crossref]
  10. Gasteiger L, Brimacombe J, Perkhofer D, Kaufmann M, Keller C (2010) Comparison of guided insertion of the LMA ProSealTM vs the i-gelTM. Anaesthesia 65(9): 913–6. [Crossref]
  11. Michalek P, Donaldson W, Vobrubova E, Hakl M (2015) Complications associated with the use of supraglottic airway devices in perioperative medicine. Biomed Res Int 2015: 746560.
  12. Eschertzhuber S, Brimacombe J, Hohlrieder M, Keller C (2009) The Laryngeal Mask Airway SupremeTM – a single use laryngeal mask airway with an oesophageal vent: a randomized, cross-over study with the Laryngeal Mask Airway ProSealTM in paralysed, anesthetized patients. Anaesthesia 64(1): 79–83. [Crossref]

Rieger Syndrome: A Case with Congenital Absence of Premaxillary Area

DOI: 10.31038/JDMR.2018113

Case Study

Rieger syndrome is characterized by absent maxillary incisor teeth, malformation of the anterior chamber of the eye, and umbilical anomalies [1]. A case with congenital absent of premaxillary area is presented.

The patient, a 10 7/12 -year-old boy, was born to young (father 25, mother 16), non-consanguineous, apparently normal parents, after an uneventful, full-term pregnancy. Hydramnios and a long-lasting delivery is reported. He weighed 3000 gr. at birth and had choanal atresia, bilateral aniridia, glaucoma and inverted strabismus. His younger 7-year-old brother and 4-year-old sister are reportedly normal. No similar case among relatives is reported.

Physical and radiologic examination showed absence of premaxllary area and incisor teeth hypodontia and delayed eruption of permanent dentition, short facial height (-3.0 SD) highly arched narrow palate, (narrow free border of soft palate, with small uvula, hypertrophic tonsils), severely short palatal plane (–5.4 SD) and concave skeletal profile (–5.6 SD) posterior displacement of maxillary sinuses and projection of the periumbilical skin (dry palmar skin low posterior hairline). Intelligence was normal.

JDMR-18-103 - Bazopoulou E Greece_F1

Figure 1. Absence of premaxillary area.

JDMR-18-103 - Bazopoulou E Greece_F2

Figure 2. Lateral cephalometric radiography Short Facial Height, concave profile.

JDMR-18-103 - Bazopoulou E Greece_F3

Figure 3. Posterior-front cephalometric radiography. Absence of premaxillary area, infraorbital bony distance.

JDMR-18-103 - Bazopoulou E Greece_F4

Figure 4. Concave profile.

His karyotype was normal, 46, XY (G-bands).

Panoramic radiograph

Absent teeth

52, 51, 61, 62
18 13, 12, 11, 21, 22, 23 28
48 45, 43, 41 31 33 35 38

Cephalometrics

Patient 10.5 -year-old                 Father 35-year-old

Cranial base

S-N 71.8 mm (-2.2 SD)                           70 mm -3.5 SD
S-Ba 44 mm (-0.6 SD)                            48 mm norm
S-N-Ba 129.6 dg (0.1 SD)                       126 dg norm
SN-FH 151 dg (3.1 SD)
ANS-PNS 43 mm (-5.4 SD)                      50 mm -3.0 SD

JDMR-18-103 - Bazopoulou E Greece_F5

Figure 5. Surgically corrected congenitally absent philtrum.

Skeletal Relations

Facial Angle 90.6 dg (2.3 SD)                88 dg 3.0 SD
(PN-FH)

Lande’s Angle 81.0 dg (-1.2 SD)           91 dg 3.0 SD
(AN-FH)

Convexity -17.8 dg (-5.6 SD)
180-(NAP)

Vertical Analysis

Mandibular Plane         20.2 dg (-1.9)              23 dg
Y-Axis                        51.8 dg (-2.5)
UFH (N-ANS)              47.1 mm (-2.0)            61 mm norm
TFH (N-Me)                 106.7 mm (-3.0)          132 mm norm
UFH/TFH                     44.2%   43.93%          46.21% SNA 82 dg norm
SNB 80 dg norm
ANB 2 dg norm

Anterior Cranial Base:
Moderate Short

Severely short

Posterior Cranial Base:
Normal

  normal

Saddle Angle:
Normal

  normal

Palatal Plane:
Severely short

 Severely short

Maxilla:  Mildly retruded to forehead severely protruded to forehead well related to anterior cranial base

Mandible: Prognathic to forehead severely protruded to forehead well related to anterior cranial base

Convexity: Severely decreased; concave skeletal profile Overclosure tendency Maxilla and mandible well related to each other Bony interorbital Distance: 18 mm 23 mm

JDMR-18-103 - Bazopoulou E Greece_F6

Figure 6. Lateral MRI tomography showing posterior displacement of maxillary sinuses.

Reference

  1. Gorlin RJ, Cohen Jr, MM Hennekam RCM (2001) Syndromes of the Head and Neck, OXFORD Universal Press. Rieger syndrome (hypodontia and primary mesodermal dysgenesis of the iris). Pp: 1181–1183.