In this paper, a trans-diagnostic approach to the treatment of trauma-related mental disorders is presented. The clinical rationale for the approach is described along with several core principles of the treatment model. These include: the problem of attachment to the perpetrator; the locus of control shift; and the problem is not the problem. Rather than focusing on diagnoses, in this approach the focus is on the underlying conflicts, cognitive errors and maladaptive coping strategies. Psychiatric diagnoses are usually made within what the author calls the single disease model: in that approach there is a primary diagnosis with additional comorbid diagnoses. The assumption of that approach is that a diagnosis determines the treatment plan, and the potential treatment plans are differentiated, distinct and specific to the primary diagnosis. According to the author, however, that is not how much mental health treatment actually operates, in either psychopharmacology or psychotherapy: instead, polypharmacy is the norm, the same medications are used for a variety of different diagnoses, and psychotherapy is often multimodal and not based on any one model. For trauma-related disorders, the author advocates that the ICD-11 concept of complex PTSD should apply to the majority of cases. Rather than a diagnosis of DSM-5 PTSD with comorbid diagnoses, treatment is designed to address a poly-symptomatic trauma response that spans many DSM-5 categories. Rather than focusing on separate diagnoses, trauma-informed psychotherapy should address a set of commonly occurring underlying conflicts, cognitive errors and defenses.
Keywords
Trans-diagnostic approaches, Mental health diagnoses, Treatment planning
Introduction
The purpose of this paper is to describe a trans-diagnostic approach to the treatment of mental disorders and the rationale for it. The clinical rationale for the approach is described along with several core principles of the treatment model. These include: the problem of attachment to the perpetrator; the locus of control shift; and the problem is not the problem. Rather than focusing on diagnoses, in this approach the focus is on the underlying conflicts, cognitive errors and maladaptive coping strategies. No effort will be made to provide a literature review or to support the approach with evidence.
The Single Disease Model: Diagnosis Determines Treatment
What I call the single disease model dominates medicine and psychiatry. For example, a bacterial ear infection, a sprained ankle and pregnancy are biologically distinct, separate problems with different etiologies and treatments. It is possible for a pregnant woman to have a sprained ankle and an ear infection as well, but these are co-occurring diagnoses not variations on a single disorder or condition. For any presenting problem, the task of the physician is to set up a differential diagnosis and then, through history taking, physical examination and laboratory testing (bloodwork, X-rays, sputum or urine samples, etc.) to arrive at a single diagnosis. There are complex cases such as those seen regularly in ICUs in which a person has extensive comorbidity, but these are the exception rather than the rule.
By and large, distinct biological disorders, diseases or conditions have distinct treatments. That is why a single disease diagnosis has to be made by the doctor, either as a confirmed diagnosis or as a working hypothesis. When I finished medical school and started my psychiatry residency, it was evident that psychiatry identified itself as a branch of medicine: psychiatrists made a differential diagnosis then a single diagnosis, and the diagnosis determined the treatment plan. The American Psychiatric Association’s Diagnostic and Statistical Manual (DSM), from DSM-III (1980) [1] to DSM-IV (1984) [2] to DSM-5 (2013) [3], is divided into different sections such as psychotic disorders, eating disorders, substance use, mood disorders and so on. The terminology for the different sections has varied across editions, but the single disease model has dominated the organization of the manual throughout its history.
On the one hand, that makes sense: it is obvious that someone with bulimia is very different from someone with severe schizophrenia and they do not require the same treatment. When there is no extensive trauma history or comorbidity, the treatments of bulimia and schizophrenia are highly differentiated. In outpatient and private practice settings one encounters individuals for whom the single disease model fits fairly well.
During my residency years in Canada (1981-1985), individuals with substance abuse disorders were referred to specialty programs and were not treated within general psychiatry, in part because they did not require psychiatric medications unless they were in acute withdrawal. Then, within a few years, a new term appeared in the psychiatric literature on substance abuse: now we had to grapple with the dual diagnosis patient, which was regarded as a complex, challenging subset of substance abuse patients. In fact, individuals with extensive comorbidity are the norm in substance abuse populations, as I found in research I published in 1992 [4]: among 100 participants in treatment for substance use at an outpatient specialty clinic, 62 met criteria for major depressive disorder, 39 for a dissociative disorder and 36 for borderline personality disorder on a structured interview; 43 reported childhood physical and/or sexual abuse. The structured interview did not diagnose anxiety disorders, eating disorders or a wide range of other DSM-III disorders, so the research identified only a small portion of the comorbidity in the participants.
One of the main reasons for identifying a single or primary psychiatric diagnosis, I was taught in my residency, was to guide the selection of medications: for depression one prescribed antidepressants, for psychosis antipsychotics, for anxiety anxiolytics, for insomnia hypnotic-sedatives and for bipolar disorder mood stabilizers. The classes of medication matched the different sections in DSM-III. It all made sense in theory but not in practice. In practice, psychiatric inpatients were given a single primary diagnosis – even if additional comorbidity was acknowledged, it was viewed as secondary and not the primary focus of treatment.
A very short exposure to psychiatric inpatient units revealed that most patients were on multiple different classes of psychiatric medication for their supposed single, primary disorder. The single disease model did not in fact guide or determine treatment. Theory did not match reality. Polypharmacy was the norm, as it is today. It was, and still is, common for a psychiatric inpatient to be on an antidepressant, an antipsychotic, a mood stabilizer, and a benzodiazepine and to have been prescribed many different medications in each of those categories in the past.
The same thing is true for outpatient psychotherapy. There are distinct types of psychotherapy such as cognitive therapy, psychoanalytic psychotherapy, internal family systems therapy, EMDR and so on and some outpatients do get manualized, distinct forms of psychotherapy. However, none of those therapies are diagnostically specific – a cognitive therapist will do cognitive therapy for depression, anxiety, a personality disorder, PTSD, and numerous other disorders. Most psychotherapists and counselors practice a technically eclectic, multi-modal approach that varies a bit from client to client but is broadly the same. Treatment is not really determined by a single disease diagnosis, which is nevertheless required for insurance billing.
In the United States, the Food and Drug Administration (FDA) will not approve a new medication unless it has been shown to be better than placebo for a single DSM diagnosis such as major depressive disorder. In order to get published in a psychiatry journal, most research has to be about a single DSM disorder. Conferences, books and journals often identify a DSM category in their titles and most speakers identify themselves as experts on a DSM category. Experts on eating disorders, by and large, do not attend schizophrenia conferences, do not talk to schizophrenia experts, do not read schizophrenia journals and do not treat anyone with a primary diagnosis of schizophrenia. The mental health field is a collection of separate silos with minimal cross-talk.
The trans-diagnostic approach outlined in the present paper is based on my Trauma Model [5] and my Trauma Model Therapy [6] which rests on the foundation of the general trauma model.
Predictions of the Trauma Model
The Trauma Model [5] is designed to be scientifically testable and makes a series of testable predictions. For example, assume that the results of a large study in the general population were: women who met lifetime criteria for major depressive disorder were compared to women who did not; the female relatives of the depressed women had higher rates of major depressive disorder than the female relatives of non-depressed women; the male relatives of the depressed women had higher rates of alcohol abuse and antisocial personality disorder than the male relatives of the non-depressed women.
A common interpretation of these results within biological psychiatry would be that the primary cause of the depression in the women and the alcoholism and antisocial personality in the men was genetic: an inherited set of risk genes running in the affected families was expressed phenotypically as depression in the women and as alcoholism and antisocial personality disorder in the men. The Trauma Model makes a different interpretation: it is very depressing to be female and to grow up in an extended family of antisocial alcoholic men. These men will be perpetrators of neglect, family violence and physical and sexual abuse of their children. That’s what’s making the women depressed, not their genes.
These two interpretations of the data need not be mutually exclusive. The Trauma Model predicts that, for this example, and for mental disorders in general, there is a distribution of genetic risk from very low to very high. For the women in these families, the abuse, overall, is contributing much more to their risk for depression than are their genes. However, a few women will be at such high genetic risk that they will become clinically depressed even without severe trauma. It’s a question of the odds of depression; the degree of risk for it will increase with increasing trauma in large samples of women.
This prediction of the Trauma Model could be tested through adoption studies. The prediction is that children adopted at birth out of high-trauma families into low-trauma families will have a much-reduced risk for depression, PTSD, dissociative disorders, borderline personality disorder, anxiety disorders and a wide range of mental health problems. In the opposite direction, women adopted at birth out of non-trauma families into trauma families will have a greatly increased lifetime prevalence of all these disorders.
In a similar fashion, consider a large twin study of schizophrenia in which it was found that identical or monozygotic (MZ) twins had a much higher concordance for schizophrenia than non-identical dizygotic (DZ) twins. Let’s say that when the first MZ twin interviewed has schizophrenia, the other MZ twin has it 40% of the time; when the first DZ twin interviewed has schizophrenia, the other twin has it only 12% of the time. Within biological psychiatry this would be interpreted as evidence that schizophrenia has a strong genetic component.
The Trauma Model makes a different prediction: if severe childhood trauma was measured in a schizophrenia twin study, the results would be: twin concordance is highest in MZ twins concordant for trauma; second highest in DZ twins concordant for trauma; third highest in MZ twins discordant for trauma; and lowest in DZ twins discordant for trauma. Such results would support the hypothesis that the trauma is contributing more to the development of schizophrenia than the genes.
Overall, the model predicts, survivors of severe childhood trauma will resemble each other, and will have similar treatment needs irrespective of their primary diagnosis: the treatment of a woman with a primary diagnosis of bulimia and severe trauma will resemble that for a woman with a diagnosis of schizophrenia and severe trauma, and will be quite different from the treatment needs of a woman with bulimia and no severe trauma – the latter woman will fit the single disease model better than the trauma survivor with bulimia.
My name appears in the back of DSM-IV because I was a member of the DSM-IV dissociative disorders committee: I had an inside view of the process and spoke with a leader of the DSM process in between DSM-IV and DSM-5. The DSM leaders rejected the concept of Complex PTSD (C-PTSD) because it threatened the conceptual foundation of the DSM system, namely the single disease model. C-PTSD was incorporated into ICD-11 in 2019 [7] but does not appear in DSM-5 even though extensive research-supported submissions were made to the committees developing both DSM-IV and DSM-5 to include a category corresponding to C-PTSD, no matter what it was called.
The basic idea behind C-PTSD is that it is a trans-diagnostic disorder that includes features across many domains of symptoms, self-regulation difficulties and interpersonal conflicts. Within this framework, depression, anxiety, substance use, anger problems, personality disorders and PTSD symptoms are all elements of an inclusive trauma response, not of separate single disorders. C-PTSD dismantles the walls between the different DSM-5 silos and threatens the conceptual foundations of the DSM system.
Curiously, while resisting the inclusion of the concept of C-PTSD, no matter what its official title, the DSM criteria for PTSD have gradually drifted in the direction of C-PTSD without acknowledging it. Compared to DSM-III PTSD, DSM-5 PTSD includes a much greater emphasis on anger, negative cognition and mood, and interpersonal conflicts.
A Focus on Function, Conflicts, Coping Strategies and Symptoms
Within Trauma Model Therapy, the focus is not on DSM-5 disorders as such. Patients/clients do meet criteria for many comorbid DSM-5 disorders but the focus is on the person’s function, conflicts, coping strategies and symptoms. The DSM-5 disorders are not ignored, they just aren’t the focus. The goal is to reduce symptoms and conflicts while improving the person’s overall function and self-regulation skills. This does not mean that medications are irrelevant or disallowed: most people treated within my inpatient and outpatient programs for the last 35 years have been on multiple psychiatric medications at the time of admission and at discharge.
Trauma Model Therapy is evidence-based and supported by a series of prospective cohort studies [8-16]. There have been no randomized controlled trials because those would require millions of dollars in external funding, which has not been available.
Core Principles of Trauma Model Therapy
The core principles of Trauma Model Therapy include: the problem of attachment to the perpetrator; the locus of control shift; the problem is not the problem; just say ‘no’ to drugs; addiction is the opposite of desensitization; and the victim-rescuer-perpetrator triangle [6]. Here I will focus on the first three of these. The therapy is multi-modal and involves cognitive therapy, experiential groups, inner child work, self-regulation skill building, systems approaches and trauma education. Most recently, clients in an outpatient program I owned and ran for four years received a 91-page collection of lesson plans tagged to the group therapy sessions, which took place 20 hours per week. This program was discontinued due to low reimbursement rates by insurance companies combined with endless denials, appeals and administrative tasks.
The Problem of Attachment to the Perpetrator
The problem of attachment to the perpetrator is a core element of the treatment model. It is based on the fact that mammals are dependent for survival on adult caretakers for a period of time after birth that varies from species to species, and in humans lasts for years. Built into mammalian biology is a set of attachment mechanisms and processes: attachment to caretakers is built into mammalian biology and DNA and in humans is not due to race, culture, gender, IQ or personality. It is not optional and happens automatically. The human child loves and needs to be loved by his or her caretakers, who are usually the child’s biological parents but can be adoptive or foster parents. In a stable, healthy family this all works out – the child develops good self-esteem and secure attachment and is able to take risks in the outside world because there is a safe base to return to, home.
In a severe trauma family, there is a varying combination of emotional and physical neglect, physical, sexual and emotional abuse, absent caretakers, family violence and highly disturbed family dynamics. The child must and does attach to mom and dad, which I call mode A. However, another instinctual reaction is also operating – just like a withdrawal reflex when one touches a hot stove, the child fears, avoids and withdraws from the perpetrator(s), who are also the primary attachment figures – I call that mode B.
That is an impossible problem for the child to comprehend or solve: how to attach to people from whom you must run away. The survival imperative is to attach to an adult caretaker: the idea of the model is that there is an over-ride by the attachment systems. In order to survive, mom and dad must be OK and the child must be in mode A. For this to be true, a fundamental dissociation is required, not in order to protect the child’s feelings but to keep the attachment system up and operating. Bad mom and dad must be put out of sight and out of mind, at least enough to maintain attachment.
Sometimes mom and dad are present and not abusive. At other times they are absent, neglectful or abusive and the child activates mode B, but after a while there has to be an over-ride and a return to mode A. The child develops what is called a disorganized attachment style. From my perspective, this is actually a highly organized and tactical survival strategy: it solves the problem of attachment to the perpetrator, which is how to maintain an attachment to people who might literally kill you.
When the person comes into Trauma Model Therapy decades later they are taught about the problem of attachment to the perpetrator in group and individual therapy and in reading assignments. They then make a core realization: I loved the people who hurt me; and I was hurt by the people I loved. When this sinks in it leads to a lot of grief, mourning and loss – mourning the loss of the childhood I never actually had, which was a good, stable childhood. Addictions, acting out, rigid defenses and other survival strategies that worked in childhood but are maladaptive now must be unlearned and healthier coping strategies must be learned and practiced.
A related cognitive error is the belief that I must be weird, sick or mentally ill to love my perpetrators. The corrective cognition is telling yourself that loving your perpetrator proves only one thing: you are a mammal. It seems that no amount of abuse completely extinguishes the positive attachment, no matter how much it is disavowed, dissociated and buried.
The Locus of Control Shift
The locus of control shift is the second core principle of Trauma Model Therapy. Like attachment to the perpetrator, it is not based on race, culture, gender, IQ or personality – it is based on normal childhood cognition, which I call the mind of the magical child: I am at the center of the universe, everything revolves around me, and I cause everything that happens in my world. The child automatically shifts the locus of control – the control point – from inside the perpetrator to inside the self: I am bad, I am causing the abuse, it is my fault, and I deserve to be treated that way. These core negative self-beliefs get reinforced over and over by what the parents do (the abuse) and what they do not do (protecting the child and stopping the abuse), then by bullying at school, a sexually abusive coach, a rape at the frat house and an abusive partner or spouse.
This is the source of the self-blame, self-hatred and self-punishment that is virtually universal in survivors of severe, chronic childhood trauma. The paradox is that it is good to be bad: because the abuse is being caused by badness inside me, I can control it and stop it. All I have to do is decide to be a good little girl or boy, then mom and dad will forgive me and everything will be OK. The locus of control shift confers a developmentally protective illusion of power, control and mastery at the cost of the badness of the self. It also solves the problem of attachment to the perpetrator because it sanitizes mom and dad and creates an illusion that they are safe attachment figures. Thirty years later, the battered wife leaves the battered spouse shelter and returns home, vowing to be a better wife so that he won’t be so stressed and won’t have to hit me anymore. The domestically violent husband forgives her for leaving him temporarily and they enter a short-lived honeymoon phase until he beats her again.
When the client really gets it and it really sinks in that he or she is not bad and deserved to be loved and protected like every other child, that is good and relieves the self-blame and self-hatred. However, it also dismantles the illusion of power, control and mastery and throws the person into an underground reservoir of unresolved grief, loss, powerlessness and helplessness. I always say that no one in their right mind would want to go there, which de-stigmatizes and normalizes the avoidance so that we can look at the cost-benefit in the present of holding onto the locus of control shift.
The Problem Is Not the Problem
The problem is not the problem is adapted from general systems theory and family therapy. Rather than being psychologically meaningless symptoms of brain dysfunction, symptoms are viewed in the context of the person’s life story and are understood as maladaptive coping strategies that helped the person survive their childhood. Sometimes the model does not apply because the individual’s symptoms are endogenous, biologically driven and consistent with the disease model. However, in a substantial majority of cases, the author believes, the principles of Trauma Model Therapy can be applied and be helpful. It is important to avoid all-or-nothing thinking: for one person, psychotherapy is the primary intervention, and medications are adjunctive; for the next person, the opposite is true. Some clients want only medication, some want only psychotherapy, and some want a combination, irrespective of the clinician’s views. In all cases, the approach should be collaborative not dictatorial.
The assumption in Trauma Model Therapy is that the presenting problem – hearing voices, flashbacks, substance use – is a solution to an underlying problem. For example, a person drinks heavily to drown the sorrows arising from complex, chronic abuse and neglect and loss of loved ones. The problem is the grief, self-blame and lack of healthy self-regulation skills: alcohol solves the problem temporarily and is basically an avoidance strategy. The fact that alcohol works temporarily reinforces the addiction, as does the fact that the effect wears off and the person has to drink more.
Once the person makes a serious commitment to abstinence and to doing the work, the therapy can begin: that commitment is an ongoing process with fluctuating hard work and avoidance, often with temporary relapses. Once enough grief work, cognitive therapy and internal family systems tasks have been sufficiently completed, and healthy self-regulation strategies have been practiced and learned, it becomes much easier to say ‘no’ to alcohol. Simply removing the defense, addiction or maladaptive coping strategy does not solve the underlying problems: hence the concept of the ‘dry drunk’ who is still miserable and difficult to tolerate.
Rather than being symptoms of brain disease, voices are understood as arising from dissociated ego states, especially if they speak in sentences and paragraphs and converse with each other – they can be engaged in psychotherapy and participate in the work. They are holding thoughts, feelings and beliefs that have been disowned and disavowed by the person. They aren’t just symptoms to be gotten rid of, rather they are parts of the person and parts of an overall survival strategy that needs to be adjusted: it worked well in the emergency situation of childhood but isn’t working so well now.
Flashbacks are conceptualized in a similar fashion: rather than being symptoms of brain damage or dysfunction, flashbacks are an effort to review the tapes of the trauma. What happened leading up to the trauma? What red flags did I miss? If I can make a list of all the red flags, stay hyper-aroused and scan for danger, I can spot the red flags in the future and take evasive action. It is my own fault that I didn’t do so the first time (locus of control shift).
Conclusions
The author has reviewed some of the principles of Trauma Model Therapy, which is a trans-diagnostic approach to mental health problems and addictions. The assumption is that trauma in many forms is a major driver of symptoms and disorders across the mental health field, in a proportion that varies from case to case. The model provides a rationale for trauma therapy irrespective of diagnosis and provides an extensive set of strategies, techniques and interventions for the therapist [6]. Its effectiveness is supported by a set of prospective treatment outcome studies.
References
Diagnostic and statistical manual of mental disorders, 3rd. ed (1980) Washington, DC, USA: American Psychiatric Association.
Diagnostic and statistical manual of mental disorders, 4th. ed (1994) Washington, DC, USA: American Psychiatric Association.
Diagnostic and statistical manual of mental disorders, 5th. ed (2013) Washington, DC, USA: American Psychiatric Association.
Ross CA. Kronson J, Koensgen S, Barkman K, Clark P, Rockman G (1992) Dissociative comorbidity in 100 chemically dependent patients. Hospital and Community Psychiatry 43: 840-842. [crossref]
Ross CA (2007) The trauma model: A solution to the problem of comorbidity in psychiatry. Richardson, TX: Manitou Communications.
Ross CA, Halpern N (2009) Trauma model therapy: A treatment approach for trauma, dissociation and complex comorbidity. Richardson, TX: Manitou Communications.
World Health Organization (2019). International Classification of Diseases and Related Health Problems. Geneva: World Health Organization.
Ellason JW, Ross CA (1996) Millon Clinical Multiaxial Inventory – II follow-up of patients with dissociative identity disorder. Psychological Reports 78: 707-716. [crossref]
Ellason JW, Ross CA (1997) Two-year follow-up of inpatients with dissociative identity disorder. American Journal of Psychiatry 154: 832-839. [crossref]
Ross CA, Ellason JW (2001) Acute stabilization in a trauma program. Journal of Trauma and Dissociation 2: 83-87.
Ellason JW, Ross CA (2004) SCL-90-R norms for dissociative identity disorder. Journal of Trauma and Dissociation, 5(3).
Ross CA, Haley C (2004) Acute stabilization and three month follow-up in a trauma program. Journal of Trauma and Dissociation 5(1).
Ross CA, Burns S (2007) Acute stabilization in a trauma program: A pilot study. Journal of Psychological Trauma 6(1).
Ross CA, Goode C, Schroeder E (2018) Treatment outcomes across ten months of combined inpatient and outpatient treatment in a traumatized and dissociative inpatient group. Frontiers in the Psychotherapy of Trauma and Dissociation 1: 87-100.
Ross CA, Engle M, Baker B (2018) Reductions in symptomatology at a residential treatment center for substance use disorders. Journal of Aggression, Maltreatment & Trauma 28(10).
Ross CA, Engle M, Edmonson J, Garcia A (2020) Reductions in symptomatology from admission to discharge at a residential treatment center for substance abuse disorders: A replication study. Psychological Disorders and Research 28, Available from: https://shorturl.at/WGdDm
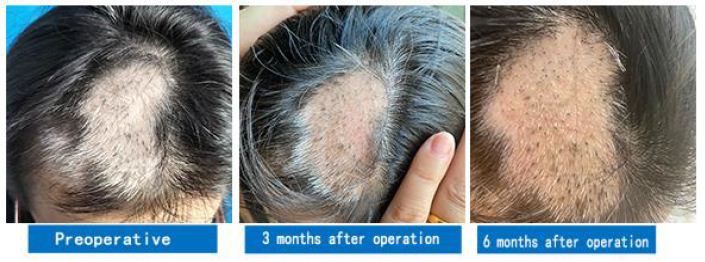
Objective: Because the current treatment technology cannot really solve the problem of the loss of melanocytes in the area of vitiligo, resulting in poor curative effect and low cure rate of vitiligo, known as the cancer of immortal people; Based on this, Liu Jingwei’s team proposed “the theory of implanting melanocyte processing plant in vitiligo affected areas” to fundamentally solve the worldwide problem of melanocyte loss in vitiligo affected areas.
Methods: 50 cases of vitiligo patients who had failed various treatments were selected by homologous pairing principle, and the complete outer hair root sheath containing hair follicle melanocyte stem cells was extracted and isolated by patented technology, and the resting hair follicle melanocyte stem cells in the outer hair root sheath were activated, and the outer hair follicle root sheath was prepared into a processing plant of melanocyte and implanted in the affected area of vitiligo.
Results: The melanocyte stem cells in the outer hair root sheath could be continuously transformed into melanocytes and enter the epidermis along the outer hair root sheath, thus inducing white spots to recolor. After 1 year, the cure rate of 50 patients with vitiligo was as high as 92%. At present, this technology has obtained 1 Chinese invention patent and 11 utility model patents, and also obtained international PCT patents, and obtained patent acceptance in the EU, the United States, Japan, South Korea and Thailand through the PCT patent way.
Conclusion: “The theory of implanting melanocyte processing plant in vitiligo affected area” were successfully transplanted to the affected area of vitiligo, which breaks through the traditional vitiligo treatment thinking, creates a new theory of vitiligo treatment, completely solves the source of melanocytes in vitiligo affected area, so that it has increased its cure rate to more than 90%. This patented technology cannot only completely cure vitiligo but also is not easy.
As a clinical refractory disease, vitiligo has a significant impact on the physical and mental health of patients, threatening the state of their marriage, social interactions, and employment. As the pathogenesis of vitiligo remains unknown, the ineffective rate of various treatments for vitiligo patients has reached 50% [1]. Therefore, vitiligo has always been regarded as a chronic disease in dermatology. The new method for treating vitiligo invented by the team of Liu JW (Nanhai Renshu International Skin Hospital) has been granted patents by the China Patent (Invention Patent) [2] (Technical Method for Treating Leucoderma Based on Hair Follicle Melanocyte Stem Cell Transplantation, Patent No.: ZL201910769979.1) and by the Patent Cooperation Treaty (PCT) [3] (Patent No.: PCT/CN2021/072340). At present, there are many surgical methods for treating vitiligo that utilize melanocyte (MC) transplantation. However, only the hair follicle MC stem cell (McSC) transplantation technology has been used effectively, becoming a massive breakthrough in the treatment of vitiligo.
General Data
A total of 50 vitiligo patients who had been treated in Nanhai Renshu International Skin Hospital using other methods for more than 1 year between June 2020 and March 2022 with unsatisfactory outcomes were selected as the research subjects for the present study. Inclusion criteria were as follows: 1) patients meeting the diagnostic criteria for vitiligo, 2) individuals over 4 years old, 3) those with no contraindications for ultraviolet radiation and no photosensitivity, 4) patients and their guardians who were able to adhere to the medical treatment, 5) patients who had not received any other treatments within 1 week and those with more than two white patches, at least one of which had received only the 308-nm excimer laser therapy as the control group, and 6) those who signed the informed consent form. Exclusion criteria included the following: 1) patients with malignant skin tumors, 2) those with mental disorders, 3) individuals with infected lesions at the white patch site, and 4) pregnant or lactating women. The present study was a key research and development project of Hainan Province in 2021, named Clinical Research and Application of the Transplantation of the Complete Outer Root Sheath of the Hair Follicle in the Treatment of Vitiligo (Project No.: ZDYF2021SHFZ048), which was approved by the Ethics Committee of the hospital on June 1, 2020 [Approval No.: 2020 (Clinical Research) RS002].
The 50 study subjects included 24 males and 26 females 4–62 years old, with an average age of (34.23±4.14) years. Vitiligo can be classified into localized type (n=29), generalized type (n=3), acrofacial type (n=5), and vulgaris type (n=14). In addition, leukoderma can be categorized into progressive (n=8) and stable (n=42) stages. In the control group, a total of 89 white patches were not surgically treated, and each patient had at least one such white patch. These white patches took up an area of 680 cm2 in total, with the largest area per patch of 89 cm2 and the smallest area per patch of 2 cm2. A total of 126 white patches were surgically treated in the treatment group, taking up a total area of 2,517 cm2, with the largest area per patch of 135 cm2 and the smallest area per patch of 1 cm2.
Instrument
The equipment used in the present study included a Peninsula 308- nm excimer laser system [model: XECL-308C; Shenzhen Peninsula Medical Co., Ltd. (Shenzhen, Guangdong, China), working medium: xenon chloride (XeCl), wavelength: 308 nm].
Therapeutic Dose
Prior to the 308-nm excimer laser therapy, the minimal erythema dose was tested in the abdomen of all patients using the instrument in the operation mode for the minimal erythema dose. The minimal erythema dose response was observed in each patient within 24–48 h after the irradiation. This dose was considered as the initial dose of the first operation.
Surgical Procedures
For the treatment group, disinfection and local anesthesia were carried out in a 10,000-level laminar flow operating room. Vitiligo was surgically treated according to the method recorded in the PCT- protected Technical Method for Treating Leucoderma Based On Hair Follicle Melanocyte Stem Cell Transplantation (hereinafter referred to as the invention patent) as follows: 1) the outer root sheath (ORS) containing hair follicle McSCs was extracted, and complete hair follicles containing McSCs were obtained using follicular unit extraction technology; 2) the complete ORS containing McSCs was obtained via the hair follicle separation method specified in the invention patent; 3) the obtained hair follicle McSCs were cultured in vitro using a special culture medium that is described in the invention patent. The stem cell activity was further generated to achieve transformation into mature MCs; 4) the obtained hair follicles containing McSCs were inactivated using the utility model patent Novel Vitiligo Hair Follicle Inactivation Needle (Patent No.: ZL201921329885.4) [4] according to the inactivation method in the invention patent, thus achieving dark pigmentation in the skin of vitiligo patients without hair growth; and 5) hair follicles containing McSCs with a complete ORS were transplanted using two utility model patents, including Planting Needle for Vitiligo Treatment (Patent No. ZL201921450324.X) [5] and A Plant Pilot Pin for Hair Follicle Transplants (Patent No.: ZL201921277579.0) [6].
In both the treatment group after the operation and control group, irradiation was conducted using a Peninsula 308-nm ultraviolet light therapy device 1–2 times/week, and the interval between the two irradiation procedures was no more than 7 days. The initial irradiation time was set up based on the minimal patient erythema dose. If erythema persisted for 12–48 h after the treatment, the irradiation dose was appropriate. Each white patch was irradiated 30 times as a course of treatment, and clinical observation of all patients lasted for more than half a year. Local patients in Hainan Province received free phototherapy once a week in the hospital. Patients outside the province underwent phototherapy using a home-use Peninsula 308- nm excimer laser therapy device as required, and the therapy status was reported at least once a week.
Evaluation Criteria
The efficacy for the vitiligo treatment was evaluated based on the efficacy evaluation criteria formulated by the Pigmentation Disorder Group of the Dermatology and Venereal Disease Committee of the Chinese Society of Integrated Traditional Chinese and Western The therapy was regarded as effective only when patients were cured. Vitiligo was deemed to be cured after patches at the treatment site completely disappeared and the skin color basically returned to normal. The cure rate was calculated according to the following formula: cure rate = number of cured cases/total number of cases × 100%. The efficacy was also compared.
Adverse reactions in all patients during the 308-nm excimer laser therapy, such as folliculitis, blisters, skin itching, burning sensation, and pain, were counted and recorded.
Efficacy satisfaction questionnaires were distributed to all patients with a total score of 100 points on the last day of the follow-up. A score lower than 90 points was considered to indicate unsatisfactory efficacy.
Results
Therapeutic Results
One patient in the whole cohort received surgery at two different sites and was recorded as two cases. In the treatment group, 46 cases (92%) were cured, while four cases (8%) were not, resulting in the total cure rate of 92%. None of the 50 cases were cured in the control group and had a cure rate of 0%. Among the uncured patients, two suffered from hypothyroidism and took Eutyrox for a long time. Two acrofacial type patients were over 50 years old.
Adverse Reactions
During the 6-month follow-up after the treatment, the incidence rate of adverse reactions was 10% in the treatment group, with one case of skin itching, four cases of folliculitis, and zero cases of other discomforts. No obvious adverse reactions were detected in the control group.
Satisfaction Degree
Efficacy satisfaction questionnaires were distributed to all patients on the last day of the follow-up. The score was 100 points in 22 patients, 95 points in 20 patients, 90 points in five patients, and below 90 points in three patients, demonstrating an efficacy satisfaction rate of 94%.
A Typical Case
A 35-year-old male patient had multiple depigmented patches on the right side of his face for the duration of 17 years. White patches the size of a small fingernail appeared on the right side of the patient’s face for no obvious reasons 17 years prior. Various drug therapies, fire acupuncture, and laser therapies were performed in this patient with unsatisfactory results. Over the course of the past year, white patches on the right side of the patient’s face expanded, gradually affecting the forehead, eyelids, eyebrows, part of the nose, lower lip, and right side of the neck, occupying large areas. Due to the patient’s lack of confidence in stem cell transplantation, white patches in some areas (marked in Figure 1) were surgically treated for the first time. Two months after stem cell transplantation combined with 308-nm excimer laser therapy, a large amount of melanin was produced in the white patch areas. White patch areas that were previously operated on were repigmented six months after the operation. In particular, the lips and eyelid mucosa where vitiligo could not be cured in the past were repigmented with no color difference. White patches on the unoperated area only received 308-nm excimer laser therapy and did not change as a result (Figure 1).
Figure 1: A case of vitiligo on the face: The first operation
The patient underwent a second operation combining stem cell transplantation with eyebrow implantation on the remaining white patch area on the face and neck six months later. Six months after the combined therapy, white patches in the operated area were completely cured, while those in the unoperated area receiving only the 308- nm excimer laser therapy remained unchanged (Figure 2). White patches on the ears and scalp of the patient have been recently treated surgically and are now recovering.
Figure 2: A case of facial vitiligo: The second operation
Discussion
Theoretical Basis and Research Progress for Hair Follicle McSCs in Vitiligo Treatment
Because mature MCs in the basal layer of the white patch area are partially or completely deficient, repigmentation of the white patch area is often achieved by the production of melanin granules by MCs migrating from outside this region. In 1959, Staricco et al. [7] have confirmed the existence of a large number of immature MCs containing no melanin in the ORS of hair follicles, which cannot synthesize melanin, are negative to dihydroxyphenylalanine (DOPA), and are thus regarded as amelanotic melanocytes (AMMCs). In 1979, Ortonne et al. [8] have found that after the psoralen plus long- wave ultraviolet therapy for vitiligo lesions, DOPA-negative and non-dendritic MCs in hair follicles migrate to the epidermis along the ORS of hair follicles and differentiate into mature MCs. On this basis, the hypothesis for the MC reservoir existence in hair follicles was put forward for the first time. In 1991, Cui et al. [9] have found that the inactivated MCs in the middle or lower part of the skin lesion hair follicle are activated and proliferate after the vitiligo treatment, changing from a non-functional to a functional state, and then migrate to the epidermis along the ORS of the hair follicle, forming pigmented spots at the hair follicular orifice. Dong et al. [10] have discovered that neural crest-derived McSCs located on the hair follicle bulge can effectively differentiate into mature MCs under the irradiation from narrow-band ultraviolet B (NB-UVB) rays and gradually migrate along the ORS to be repigmented at the hair follicular orifice of the vitiligo epidermis. Hair follicle AMMCs can serve as a reservoir for skin MCs in the treatment of vitiligo [11-13]. MCs are derived from the embryonic neural crest and begin to migrate to the epidermis and hair follicles 2–5 weeks after embryonic development. MCs migrating to hair follicles can be divided into two types: one type with melanin synthesis activity located in the hair matrix and infundibulum of the hair follicle in the anagen period, and the other type is inactivated AMMCs located in the ORS in the anagen period showing no melanin synthesis activity. In recent years, it has been shown that AMMCs can be activated by some specific factors, proliferate, migrate, and produce melanin, manifesting some characteristics of stem cells [14,15].
The McSCs and pre-MCs have been classified into AMMCs in numerous studies [16]. Hair follicle McSCs are located in the bulge area at the bottom of the hair follicle (upper 1/3), mostly in a resting state, with slow periodicity and ability to maintain self-renewal. They are typical representatives of regenerative stem cells [17]. However, as research progresses, it has been confirmed that stem cells in a transitional state, namely, pre-MCs, are present in the ORS of hair follicles. These cells do not synthesize melanin but are active in the pigment production cycle. As the direct source of MCs, pre-MCs are the earliest initiator of each pigmented hair cycle [18]. Pre-MCs are transitional cells between McSCs and MCs, which are formed by the proliferation and differentiation of McSCs in the previous hair growth cycle. They are essentially McSCs. As mature MCs in the basal layer of the white patch area are partially or completely deficient, the repigmentation of the white patch area is often achieved through the production of melanin granules by MCs migrating from outside this area. MCs migrating to the epidermis eventually settle on the basement membrane, forming mature MCs that continuously produce melanin [19]. McSCs serve as a melanocyte reservoir for the repigmentation of the affected skin in vitiligo patients. McSCs proliferate and migrate upwards to the nearby epidermis upon activation, forming pigment islands around hair follicles (Figure 3) [20].
Figure 3: A case of oral vitiligo
Clinical Research on McSC Transplantation for Vitiligo Treatment
In 2002, Nishimura et al. [21] investigated the proliferation of melanoblasts and found that stem cell factors expressed in the epidermis form a channel between the ORS and the epidermis, along which MCs migrate from the hair follicle to the epidermis. If the ORS containing McSCs is directly transplanted under the epidermis, the McSCs in the ORS can be activated by a 308-nm excimer laser, while those transported along the ORS can be processed into mature MCs.
Among all laser wavelengths, 308 nm is the laser wavelength where the absorption values of human DNA and proteins almost peak. This contributes to the production of pyrimidine dimers, purine dimers, and other substances, thus triggering the corresponding biological photoimmune response and repigmentation [22]. It has been pointed out that the 308-nm laser changed the microenvironment of hair follicles, facilitated the maturation and differentiation of McSCs, and stimulated the migration of MCs to the epidermis (Figure 4) [23].
Figure 4: A case of vitiligo at the end of the finger
The transplantation of McSCs for treating vitiligo is a technological invention in the implantation of an MC processing plant, which provides a basis for a new theory of vitiligo treatment. The PCT- protected technical method used in the present study employed the following processes: extraction of autologous hair follicles, inactivation of hair follicles, separation of complete ORS, culture and activation of McSCs in the ORS, and harvesting and transplantation of functional McSCs. The complete hair follicle ORS supplies melanoblasts for McSCs. After the ORS containing functional McSCs was transplanted to an area under the epidermis, the 308-nm excimer laser activated the McSCs in the ORS to produce MCs in vitro, thereby continuously producing mature MCs and successfully establishing an MC processing plant in the affected skin of vitiligo patients.
Clinical Research and Theoretical Innovation in McSC Transplantation for Vitiligo Treatment
Although there are presently many surgical methods for treating vitiligo, including epidermal transplantation, MC transplantation, skin tissue engineering, ORS suspension transplantation [24], and single hair follicle transplantation [25], the actual transplants are MCs, which will be inactivated or become apoptotic after completing a life cycle, leading to re-whitening of the skin in vitiligo patients. In particular, surgical methods other than single hair follicle transplantation require microdermabrasion for the transplantation of MCs, resulting in significant damage, uneven repigmentation, and proneness to scarring. Single hair follicle transplantation has been adopted to treat vitiligo more than 20 years ago, but the essence of this method is to implant hair follicles into the dermis and subcutaneous tissues, through which only MCs at the junction of the basement membrane zone and the ORS can enter the epidermis. As only a small segment of the ORS has been transplanted, it is necessary to transplant a large number of hair follicles to achieve repigmentation of whole white patches. This method requires a large number of hair follicles for the treatment of hairless white patches, after which the hair becomes unmanageable. In addition, this method utilizes punctiform repigmentation in most cases and is thus ineffective for white patches in the mucosa. Therefore, it is only suitable for the treatment of vitiligo on skin portions with hair. Hair follicle McSC transplantation method in the present study was adopted to transplant the complete ORS of hair follicles to an area between the epidermis and dermis. After the operation, new MCs were continuously generated via in vitro activation of McSCs in the ORS, thus achieving patchy repigmentation. Since hair follicles were inactivated before the operation, they fell out naturally post-operation after one hair cycle (Figure 5).
Figure 5: A case of vitiligo on the feet.
The PCT-protected Technical Method for Treating Leucoderma Based on Hair Follicle Melanocyte Stem Cell Transplantation is the first in the world to propose a technique for transplanting hair follicle McSCs to treat vitiligo based on the complete ORS. Using this method, McSCs can be directly transplanted to the epidermis of vitiligo patients, thereby treating large-area vitiligo via extraction of small quantities of hair follicles. In addition, the present invention also shows marked efficacy in hairless areas, which indicates that stem cell transplantation is also applicable for the treatment of white patches on the mucous skin membrane.
This is the first time that transplantation of the skin environment containing McSCs with complete hair follicle ORS has been proposed for treating vitiligo. Additionally, this invention patent method provides a basis for a new theory of vitiligo treatment by implanting an MC processing plant, which provides a source of MCs for the treatment of vitiligo and lays a foundation for repigmentation of white patches (Figure 6).
Figure 6: A case of vitiligo on the head
This invention patent introduces a new method of transplanting McSCs for vitiligo treatment without dermabrasion. Vitiligo patients were surgically treated without dermabrasion, and repigmentation with no color difference after the vitiligo operation was achieved via minimally invasion transplantation using the self-developed plant pilot pin for hair follicle transplants and planting a needle for vitiligo treatment.
Conclusion
Liu et al. have obtained McSCs in a functional state using a PCT- protected technical method and implanted them and melanoblasts to an area under the epidermis. Continuously activated by a 308- nm excimer laser in vitro, McSCs in the ORS were transformed into mature MCs and migrated along the ORS to multiple hair follicle orifices in the vitiligo area or sebaceous gland openings in the hairless area to achieve central-type repigmentation with no color difference. McSC transplantation addresses the issue of MC sources for patients with vitiligo and provides a new solution for its treatment. With a cure rate of 92%, this method brings new hope for recovery to 70 million patients with vitiligo worldwide.
Liu J Technical method for treating leucoderma based on hair follicle melanocyte stem cell transplantation. China. ZL201910769979.1 2021.01.12, Publication Number: CN110339214A.
LiuJing-wei. Technical method for treating vitiligo through hair follicle melanocyte stem cell transplantation. China. PCT/CN2021/072340, WO2022/151450.
Liu J W. Novel vitiligo hair follicle inactivation needle. China. ZL201921329885.4, 2020.07.14. Publication Number: CN210990699U.
Liu J W. Planting needle for vitiligo treatment. China. ZL201921450324.X, 2020.09.08. Publication Number: CN211434526U.
Liu J W. A plant pilot pin for hair follicle transplants. China. ZL201921277579.0, 09.08. Publication Number: CN211433043U.
Staricco RG. Amelanotic melanocytes in the outer sheath of the human hair follicle[J]. J Invest Dermatol 1959 [crossref]
Tobin DJ, Bystryn JC (1996) Different populations of melanocytes are present in hair follicles and epidermis [J]. Pigment Cell Res [crossref]
Cui J, Shen LY, Wang GC (1991) Role of hair follicles in the repigmentation of JInvestDermatol 97(3): 410-416. [crossref]
Dong D, Jiang M, Xu X, et al (2012) The effects of NB-UVB on the hair follicle derived neural crest stem cells differentiating into melanocyte lineage in vitro[J] J Dermatol Sci [crossref]
Yu HS (2002) Melanocyte destruction and repigmentation in vitiligo: a model for nerve cell damage and regrowth[J]. J Biomed Sci [crossref]
Slominski A, Wortsman J, Plonka P M, et Hair follicle pigmentation [J]. J Invest Dermatol 2005. [crossref]
Bernard Hair cycle dynamics: the case of the human hair follicle [J]. J Soc Biol 2003 [crossref]
Ma HJ, Zhu WY, Wang DG, et Endothelin-1 combined with extracellular matrix proteins promotes the adhesion and chemotaxis of amelanotic melanocytes from human hair follicles in vitro[J]. Cell Biol Int 2006 [crossref]
Lei TC, Vieira WD, Hearing In vitro migration of melanoblasts requires matrix metalloproteinase-2: Implications to vitiligo therapy by photochemotherapy [J]. Pigment Cell Res 2002 [crossref]
Takada, K, Sugiyama, K, Yamamoto, I, et al. Presence of amelanotic melanocytes within the outer root sheath in senile white hair[J]. J Invest Dermatol 1992 [crossref]
Nishimura EK, Granter SR, Fisher DE. Mechanisms of hair graying: Incomplete melanocyte stem cell maintenance in the niche [J]. Science, 2005. [crossref]
Hsu YC, Li L, Fuchs E. Transist amplifying cells orchestrate stem cell activity and tissue regeneration [J]. Cell. 2014 [crossref]
Slominski A, Wortsman J, Plonka PM, et (2005) Hair follicle pigmentation [J]. J Invest Dermatol 124(1): 13-21. [crossref]
Matz H, Tur Vitiligo[J] (2007) [title] CurrProblDermatol 35: 78-102.
Nishimura EK, Jordan SA, Oshima H, et al. Dominant role of the niche in melanocyte stem-cell fate determination[J]. Nature 2002 [crossref]
Jmb A, Shk B, Hjj A, et al. Suberythemic and erythemic doses of a 308-nm excimer laser treatment of stable vitiligo in combination with topical tacrolimus: A randomized controlled trial – Science Direct[J]. Journal of the American Academy of Dermatology 2020. [crossref]
Noborio R, Nomura Y, Nakamura M, et al. Efficacy of 308-nm excimer laser treatment for refractory vitiligo: A case series of treatment based on the minimal blistering dose[J]. Journal of the European Academy of Dermatology and Venereology 2020. [crossref]
Vinay K, DograS, ParsadD, et Clinical and treatment characteristics determining therapeutic outcome in patients undergoing autologous noncultured outer root sheath hair follicle ce11 suspension for treatment of stable vitiligo [J]. J Eur Acad Dermatol 2014. [crossref]
Na GY, Seo SK, Choi SK. Single hair grafting for the treatment of vitiligo[J]. J Am Aead Dermatol 1998. [crossref]
The article titled “Safety and Efficacy of Bempedoic Acid Among Patients with Statin Intolerance and Those Without” provides a comprehensive meta-analysis and systematic review of randomized controlled trials, addressing a critical gap in the management of hypercholesterolemia. Bempedoic acid emerges as a viable alternative for patients who are intolerant to statins, which have long been the cornerstone of cholesterol-lowering therapy.
The findings from this analysis reveal that bempedoic acid significantly lowers low-density lipoprotein cholesterol (LDL-C) levels compared to placebo, underscoring its efficacy in lipid management. Notably, it appears particularly beneficial for patients without statin intolerance, though results are somewhat mixed for those with such intolerance. This variability prompts further investigation into factors that could influence treatment outcomes, such as concurrent lipid-lowering therapies.
Importantly, the study highlights the safety profile of bempedoic acid. There was no significant increase in serious adverse events compared to placebo; however, certain side effects-such as gout and elevated hepatic enzymes—led to a higher discontinuation rate among users. These findings necessitate a careful assessment of the risk-benefit balance when considering bempedoic acid for cholesterol management, especially in a population known for sensitivity to medication side effects.
Moreover, the article emphasizes the potential of bempedoic acid to enhance patient adherence to therapy by alleviating muscle-related symptoms often associated with statin use. This could represent a crucial factor in improving long-term outcomes for patients struggling with high cholesterol.
Despite its strengths, the meta-analysis is not without limitations. Variations in baseline characteristics and the relatively short duration of follow-up raise questions about the long-term implications of bempedoic acid therapy. Additionally, the issue of publication bias must be taken into account, as it may skew perceptions of the drug’s overall efficacy and safety.
In conclusion, this systematic review presents bempedoic acid as a promising option for patients dealing with statin intolerance and reinforces the importance of individualized treatment strategies in managing hypercholesterolemia. As more data becomes available, healthcare professionals will be better equipped to navigate the complexities of lipid-lowering therapies, ultimately leading to improved patient care and outcomes.
The paper presents the empirical evaluation in a Mind Genomic format of five sets of 16 elements each, previously generated entirely by AI, and dealing with the issue of aspects of a police officer’s job focused in a school, in a small town in Pennsylvania. The respondents, ages 18-30, read combinations of messages (elements) about the job, these elements combined by experimental design into vignettes comprising 2-4 elements per vignette. The results from all five studies revealed the very strong performance of the elements when the respondents were divided into mind-sets. Three studies each generated three mind-sets, two studies in turn, each generated two clear mind-sets. The entire process — from the generation of the ideas to the validation with people — required approximately four days and was done in an affordable fashion with available technology, generating easy-to-understand, immediately actionable messaging. The five studies along with the rapid generation of the ideas using generative AI open up the possibilities that AI may help to better communicate with people, through the combination of LLM (large language models) and Mind Genomics empirical thinking and experimentation.
Keywords
Generative AI, Mind genomics, Police recruitment, Synthesized mind-sets
Introduction
In the companion paper, “School Crossings and Police Staffing Shortages: How Generative AI Combined with Mind Genomics Thinking Can Become “Colleague,” Collaborating on the Solution of Problems Involved in Recruiting,” we presented four strategies to approach the issue of recruiting for a police officer position in TOWNX. Strategy 3 in that paper dealt with the creation of questions and answers. The answers were to be given by four AI-synthesized mind-sets: Dedicated Public Servant, Compassionate Protector, Community-Focused, and Proactive Problem Solver. Thus, Strategy 3 generated questions about the topic of recruiting, and answers to the questions from four simulated mind-sets. There was no guidance of the process from a human being, other than the basic question of how one gets a person to consider a career in law enforcement. This paper continues that work, looking at these AI-generated, best- guess questions and answers, not with artificial intelligence alone, but with actual respondents living in the state of Pennsylvania and of the proper age, 18 to 30, with a high school diploma, who might be interested in having a career in law enforcement. That is, how well do the ideas generated by artificial intelligence end up performing when given to real respondents in the Mind Genomics platform?
Mind Genomics
Mind Genomics is an emerging science with origins in experimental psychology and statistics and consumer research. The background to Mind Genomics and the computational approaches have been well documented and presented elsewhere [1-3]. Here are some of the specifics relevant to the data presented in this paper:
The researcher identifies a topic of interest. Here, the topic is what communications are effective to get a young person (ages 18-30) to want to join the police force and be part of the effort to help at school properties, among other tasks.
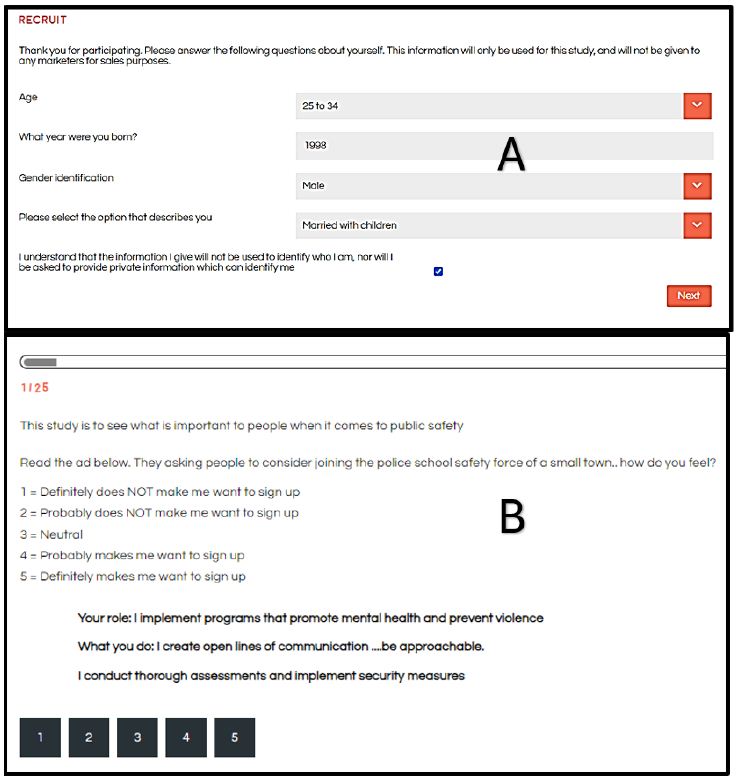
The researcher creates four questions. Figure 1 shows the requirement to fill in the four questions (Panel A) and the four questions that were filled in (Panel B).
Figure 1: The BimiLeap.com screen guiding the user to provide or create the four questions (Panel A) and then the completed screen as typed in by the user (Panel B).
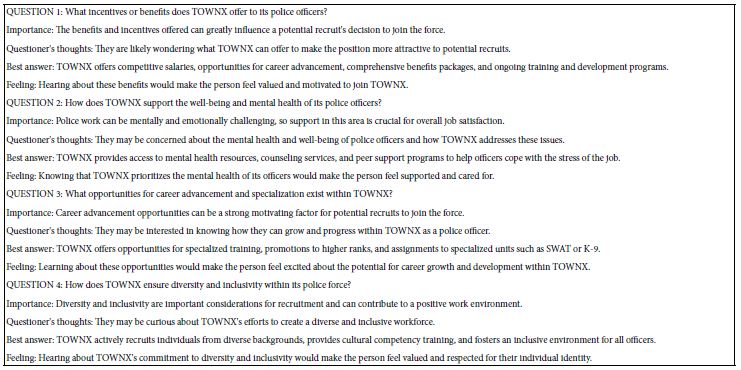
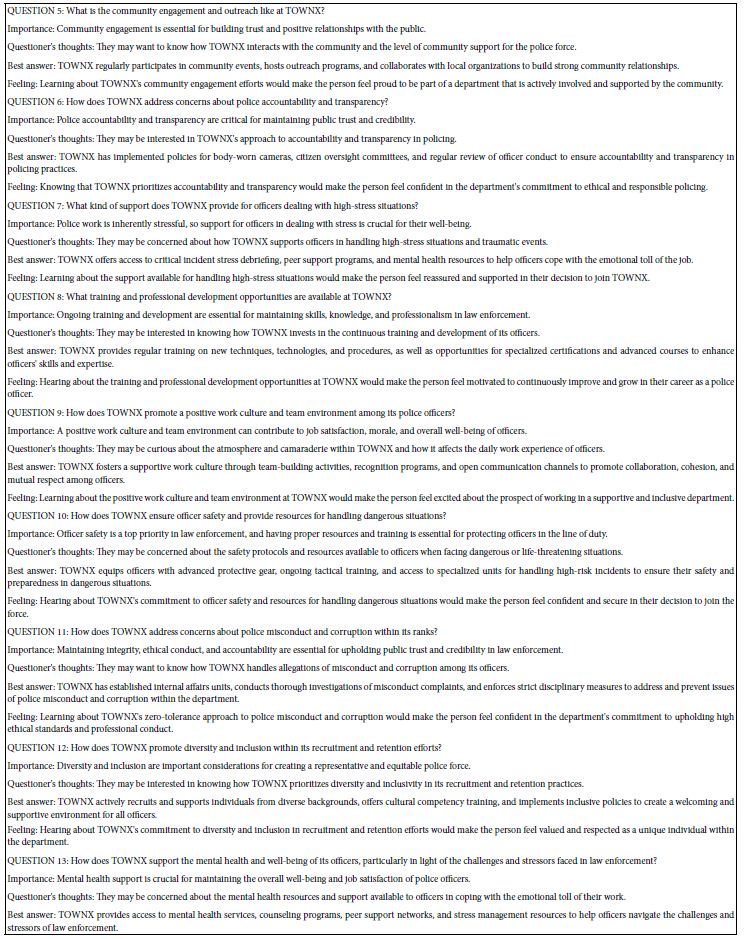
It is at this point that many prospective researchers “hit a blank wall,” feeling that they are unable to create questions. The Mind Genomics platform has been augmented with generative AI (ChatGPT 3.5) [4- 7]. The user accesses the AI through Idea Coach. Strategy 3 in the companion paper shows how AI can generate 21 questions of interest, with a simple prompt. This paper uses the 21 questions from Strategy 3 to create the questions needed for five separate experiments using the Mind Genomics platform. For each question, the researcher is instructed to provide four answers. This task is simpler, less daunting. In the companion paper, we created the questions. For each question, we generated four answers reflecting the way different types of people with different ways of thinking about the problem would answer the question. Table 1 also shows the four answers for each question. The answers were provided by AI, in the companion paper, but have been edited to be more “standalone.”
Table 1: The five questions and the four answers to each question.
Properties of the Vignettes Created by the Underlying Experimental Design
The basic unit of evaluation at the level of the individual respondents is the set of 24 vignettes, presented to and evaluated by the respondent one vignette at a time, in an interview lasting about three minutes, and done on the internet. Each respondent evaluates a different set of 24 vignettes. Rather than having to “know” the best range to test, the approach allows anyone to become an expert simply by testing many elements in this format [8]. The vignette comprises a combination of 2-4 elements, viz., message (see Figure 2, Panel B as an example of a vignette). These vignettes are created according to an experimental design. The design prescribes that there be four sets of four statements each. The statements are “elements” in the language of Mind Genomics. Each vignette comprises a minimum of two elements and a maximum of four elements. Each vignette has either one or no elements from a question. Thus, a vignette can never comprise two mutually exclusive or contradictor elements, viz., different answers or elements from the same question. The experimental design prescribes the specific composition of each vignette or combination of the 24 vignettes. For each set of 24 vignettes allocated to one respondent, each of the 16 elements appears exactly five times, once in five different vignettes, and absent from the remaining 19 vignettes. The 16 elements are statistically independent of each other, allowing the researcher to use statistical modeling (e.g., ordinary least squares regression analysis, OLS regression) to estimate the linkage between the presence of the 16 elements, and the rating that will be assigned by the respondent [9].
Figure 2: The respondent experience. Panel A on top shows the self-profiling classification in a pull-down menu. Panel B on the bottom shows one of 24 vignettes that the respondent will evaluate.
The Respondent Experience
These studies are typically run with respondents who have agreed to participate, signing an agreement with an online research panel “provider.” These research panels comprise thousands of individuals from all over the country and all over the world. The panel members are invited to participate, usually by email. They receive some remuneration for each participation, with the remuneration administered by the panel company. The user is guaranteed that these are not bots, but rather real people. The respondents are invited to participate by an email based upon the qualifications requested by the researcher. The respondents who agreed to participate press a link and are led to the interview. The interview itself is simple and the explanation of the interview is done by a series of slides at the beginning of the interview. The researcher first obtains some additional classification from the respondent using a pull-down menu (Figure 2, Panel A). Currently, the platform, BimiLeap.com, provides the user with up to 10 self-profiling questions, two of which are fixed: age and gender, respectively. That information can be extended dramatically to many more questions. The respondent then reads an orientation, and is led to the set of 24 vignettes, presented one vignette at a time. Figure 2, Panel B shows an example of the vignette that the respondent sees. The vignette itself comprises two to four elements as noted above, along with a short introduction to the project present in each vignette and of course the rating scale present in each vignette. The respondent reads the orientation, usually once, skips to the vignette, reads the vignette, and then assigns an answer. The objective is to get the respondent’s immediate impressions, almost a so-called “gut feeling,” where it is not judgment but feelings which are dominant.
The spare design of the vignette, without any connectives, may seem unpolished. The reality is that this spare profile of the vignette reduces fatigue. The respondent “grazes” for information in a comfortable manner, rather than having to wade through the thickets of text to get to the ideas. The respondent evaluates the vignette, considering the 2-4 elements as one idea, scoring the vignette on the scale. The Mind Genomics platform records the rating, and the response time (RT), defined as the number of seconds elapsing to the nearest 100th of a second from the time the vignette was presented to the time the rating was assigned.
Automated Preparation of the Data for Statistical Analysis
The Mind Genomics platform now creates a database which is set up to facilitate analysis. The database comprises of records for each vignette. Since each respondent evaluated 24 vignettes, each respondent generates 24 rows of data. The first set of columns is reserved for information about the respondent, generated from a self- profiling classification. This information includes gender, age, and up to eight additional self-profiling classification questions. The second set of columns is reserved for the information about the 16 elements. Each element has its own column. When the element is present in the vignette the value is “1” in the cell. When the element is absent, the value is “0” in the cell. Each vignette rated on the 5-point rating scale is converted to a binary scale, R54x or “JOIN.” A rating of 5 or 4 is converted to 100 to denote interest in joining. A rating of 3, 2, or 1 is converted to 0, to denote not interested in joining. Then, a vanishingly small random number (<10-5) is added to the newly created binary variable. The rationale is to ensure that even when a respondent rated all 24 vignettes high (5 or 4), or all 24 vignettes low (3, 2, or 1), there will be some minimal variation in the newly created binary variable. That minimal variation is necessary for the data from a single respondent or in fact any group of respondents to be analyzed later on using OLS (ordinary least-squares) regression.
Statistical Analysis — OLS Regression to Find Linkages Between Elements and Binary Variable R54x
The Mind Genomics process is now standardized. The experimental design ensures that all of the elements for each respondent are independent of each other. This up-front effort ends up allowing OLS (ordinary least squares) regression to relate the presence/absence of the 16 elements to the binary dependent variable R54x (viz., interested in joining).
The equation is simple: R54x = k1A1 + k2A2… + k16D4.
The foregoing equation can be estimated at the level of the individual respondent, at the level of any group of respondents, and of course at the level of the total panel. Note that the equation has no additive constant. The ingoing rationale is that in the absence of elements we should have a rating of 0. There is no reason to “join” when there are no elements to communicate the job. The coefficients show the driving power of the elements as a motivator of joining. A coefficient of 20 is twice as much driving power to join as a coefficient of 10. A coefficient of 20 is 2/3 of the driving power of a coefficient of 30, and so forth. The coefficients can be thought of as psychological measures of probability saying “I will join” when the element is in the mix of messages. We should look for coefficients around 21 or higher.
Creating Mind-Sets
A key hallmark of Mind Genomics is the search for mind-sets, defined as groups of respondents with similar patterns of coefficients, who think the same way. These individuals are not necessarily like each other in other ways, but they do think similarly for the topic. The topic here is the messages which drive the respondent to say they would like to join. The approach to find these groups, so-called mind-sets, is called clustering. Clustering uses the individual sets of 16 coefficients as inputs. Clustering tries to put the respondents into a small number of predefined groups (e.g., 2 or 3), so that the pattern of coefficients of the individuals within the cluster or group is similar. At the same time, the average profile on the 16 coefficients for the two or three groups is different. The clustering program used by Mind Genomics, k-means clustering, works entirely by mathematics. It is only afterwards that we try to interpret the meaning of these clusters [10]. The clusters are called mind-sets.
Interpreting the Data
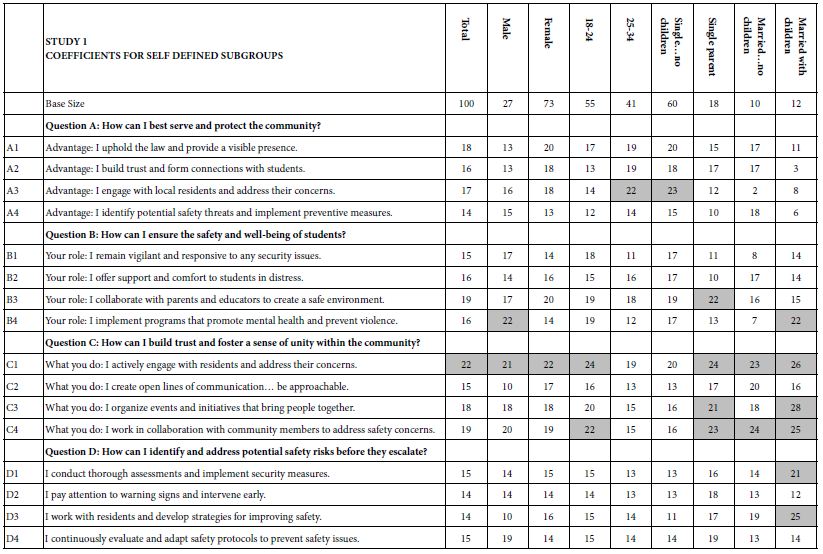
When we look at Figure 2, Panel B, viz. the sample vignette, we see that the structure of the vignette does not lend itself to “gaming the system.” There are 24 vignettes, so there is no point in expending a great deal of effort. The sheer number of vignettes militates against trying to outguess the researcher. Another aspect, namely the spare structure of the combinations, and the fact that to the untrained eye these vignettes seem to be random. Every respondent sees a different set of 24 vignettes, with the elements in the vignettes seeming to be put in or taken out by random. The respondent quickly goes into a sense of indifference and guesses, rather than focusing on being correct and pleasing the respondent and pleasing the interviewer. The respondent participating on a computer simply proceeds, going through the evaluation. As noted above, the OLS (ordinary least squares) regression analysis shows the driving power of the elements. Table 2, column labelled Total Panel, shows the 16 coefficients for the elements below. When we look at the coefficients from the total panel, we have a coefficient as high as 22, and a coefficient as low as 14. Only one element moves beyond the pre-set criterion of coefficient C1 — What you do: I actively engage with residents and address their concerns. The remaining columns show the other groups, gender and age. Respondents not appropriate for the secondary requirements (viz., age outside the allowable range) were not considered for specific analyses, but were included in the Total Population, and in the self- profiling classifications about marital status and children. Once again, we see relatively few elements which score strongly. Only Element C1 scores consistently strongly. To make interpreting easier, keep in mind that the numbers in the body of the table are coefficients from regression. They can also be interpreted as “the increment percent of people who, reading this element, will say I will join.” Also keep in mind that we would like strong performing elements. Looking now at the Total Panel, we find that C1 has a coefficient of 22. This means that when element C1 appears in a vignette (What you do: I actively engage with residents and address their concerns), we get 22% more people saying, “I would like to join.” On the other hand, when we put in A4 for whatever reason (Advantage: I identify potential safety threats and implement preventive measures), only 14% say they will join. That’s about 2/3 as many. We clearly would want to put in Element C1. Verbalize results — look for opportunities — by looking down within a group, and across groups. The numbers can all be compared to each other, and added together, at least up to four elements, no more than one element from a question. The sum provides us with a sense of the likely percent of respondents who say they will join. The consequence of this analysis is a powerful tool to understand, and to compose, all done in a matter of hours.
Table 2: Coefficients for the 16 elements for Study 1, for Total Panel, gender, age, and self-profiling status of marriage and children.
Thinking Differently at the Granular Level of Everyday Life — The Challenge of Mind-Sets
One of the hallmarks of Mind Genomics is this belief that in every area of everyday life, people differ in the way that they deal with the objectives, the goals, the messages. These are not the major differences in people, but rather everyday differences which are systematic, repeatable, and useful for things as different as medical advice and advertisements for shopping. The approach to find these so-called mind-sets, these differences in the way we approach issues, is very straightforward. Recall from above that we have regression analysis for each of our 100 respondents who saw the 24 combinations. So instead of doing the analysis at the level of all 100 people pooled together, let us do the regression analysis for each one of our 100 people, and let’s store 100 sets of the 16 coefficients in a database. When we do that analysis, we end up with 100 different models, 100 rows each with 16 columns. Each row is a respondent, one of our 100 respondents. The numbers are the coefficients estimated from the individual-level regression analysis. That difference is not based on who the people are, but rather on how the people respond to specific, relevant messages describing a small aspect of daily life. In other words, we are not interested in who people are, what they do, but how they think in a very local granular situation. There are a variety of metrics, ways to quantify the dissimilarity between respondents. We use the measure of distance between pairs of respondents, based upon the correlation of the coefficients. The distance between pairs of respondents is defined (1 – Pearson Correlation), computed on the corresponding pairs of the 16 coefficients. When the 16 coefficients of one respondent correlate perfectly with the 16 coefficients of another respondent, they are defined as having 0 distance. When the 16 coefficients of the two respondents describe opposite patterns, their distance is +2. We do not supervise the program. We simply allow the program to come up with these groups so that the patterns of the respondents within a group, within a cluster, are very similar, but the averages of the cluster on the 16 elements are very different across the three mind-sets. When we do the analysis, we find that the strongest result emerges when we ask the clustering program, the K-means clustering program, to create three groups. The bottom line is that even without intellectually thinking through the study, the regression analysis and clustering end up with radically different interpretable groups, as shown in Table 3. The important thing here is that the clusters are interpretable, the coefficients are very high, and it makes sense. What’s also important is that the coefficients are high for one group and reasonably low for the other group. We are really dealing with different mind-sets, responding to different messages as motivators. The important thing for this study is that the generation of these elements by artificial intelligence, Strategy 3 in the companion paper, with slight editing, ends up showing remarkably different types of people, suggesting the power of artificial intelligence revealed by human responses in a situation where respondents can game the system.
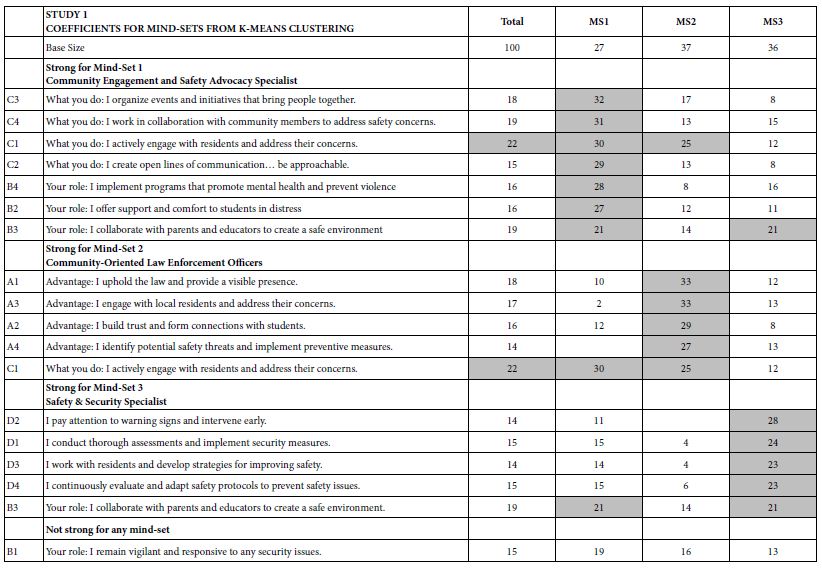
Table 3: The performance of all elements in Study 1, for Total Panel and for the three mind-sets generated by k-means clustering (MS1, MS2, MS3). Strong performing elements are shown by shaded cells.
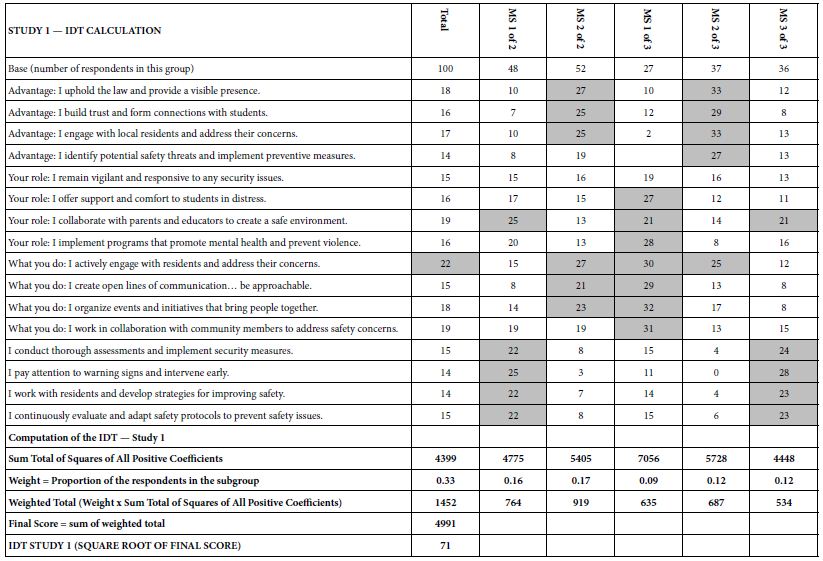
How do we know that the clustering produces real mind-sets? This is an important question. The goal in Mind Genomics is to discover truly different ways of thinking about the same topic. Two factors come into play. One fact is that the data should show elements which have high coefficients, with these elements “telling a story.” The other is that the data should show elements which have low coefficients. It is not sufficient to generate high coefficients everywhere. That would show better elements, but not show radically different mind-sets. In recent studies, the authors have introduced the index called IDT, Index of Divergent Thought. The IDT is a way to show the net effect of the two forces: high coefficients for some sets of interpretable elements, and low coefficients for the other elements. Table 4 shows the computations. Simulations of data sets showing high coefficients for elements relevant to the mind-set and low coefficients elsewhere suggest that an IDT around 70 is best. The data in Study 1 suggest an IDT of 71, almost perfect.
Table 4: The data for the IDT (Index of Divergent Thinking) and the calculations.
Using AI to Summarize the Results, Considering Only the Strong-Performing Elements
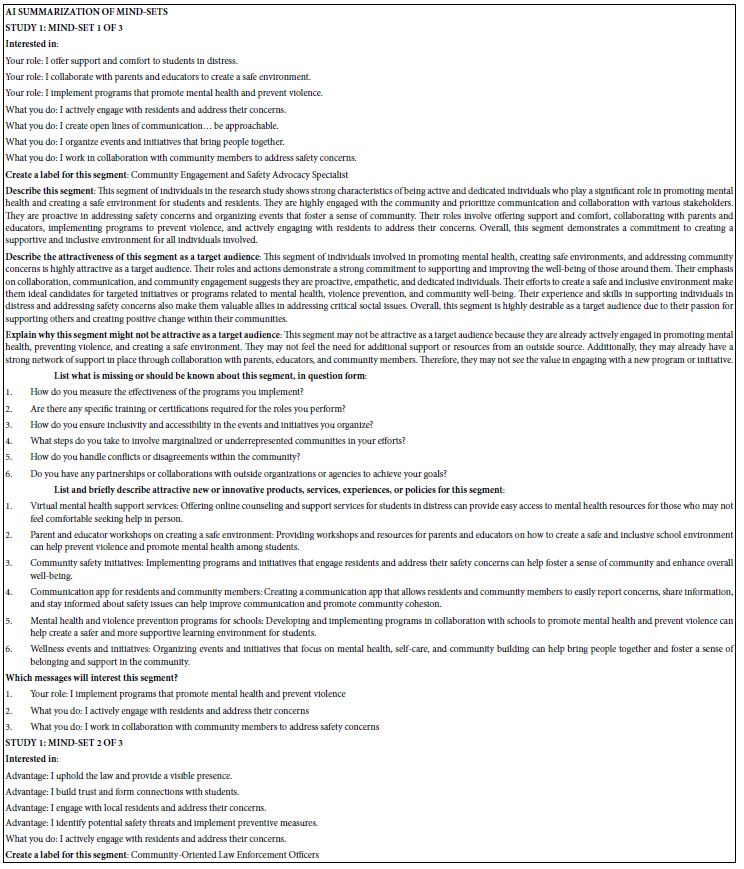
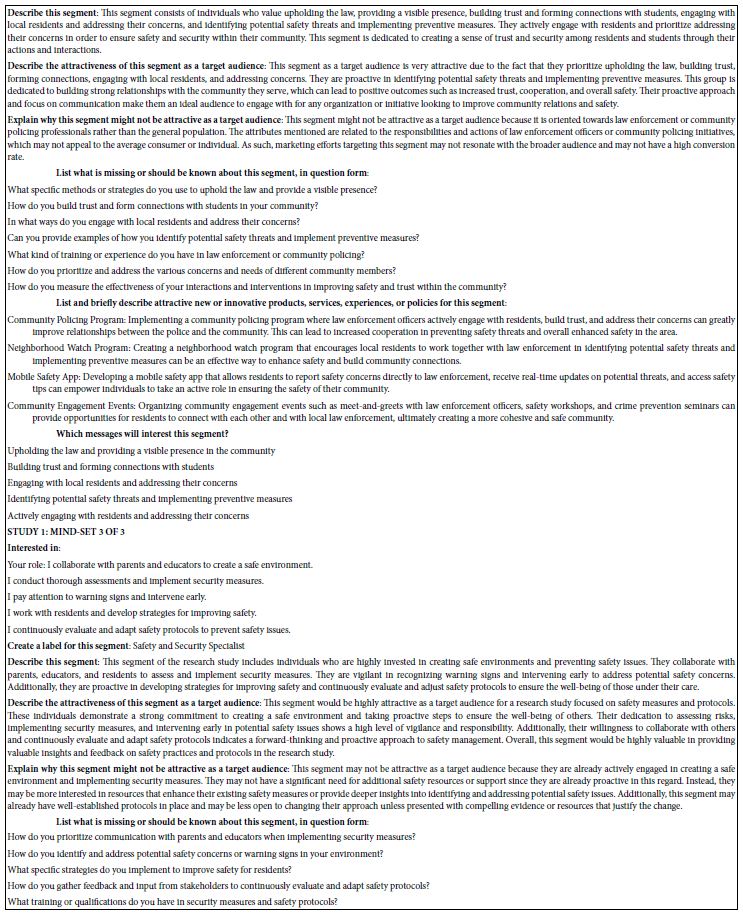
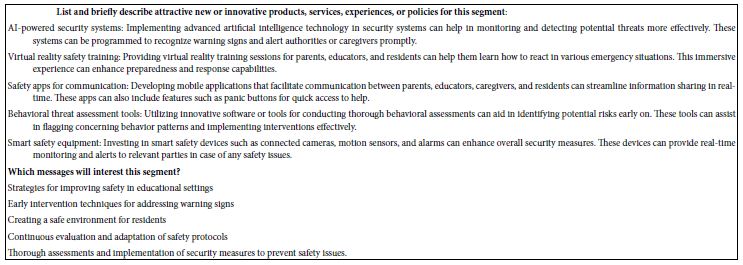
The final analysis in this study deals with how AI analyzes the results and the strong elements for each mind-set. These appear in Table 5. The notion here is that AI can act as a second pair of eyes, as a coach, as an interpreter of the results. The table is laid out in the form of a set of questions to be answered for each mind-set, based upon the pattern of elements scoring 21 or higher for that mind-set. The questions themselves range from a summarization of the mind-set, the elements which perform strongly, and then onto questions about innovations and messaging.
Table 5: AI summarization of the key findings and opportunities for each mind-set, based upon the patterns generated for strong performing elements for that mind-set.
The questions are answered automatically, once the study is completed. The results here are done automatically, provided at the end of the study, within 30 minutes. In the interest of standardizing our understanding, the questions are fixed, answered in every Mind Genomics report, for key groups, including Total Panel, Self-Profiled Groups (e.g., gender), and mind-sets such as the three mind-sets reported here. Over time, it is straightforward to update the Mind Genomics platform, BimiLeap, so that the platform becomes even more complete, recognizing only that the updated platform will be used for every report and every key subgroup within the report.
Discussion and Conclusions
The data presented in this paper, in Study 1 above, and in Studies 2-5 in the appendices, suggest that we are only beginning to see the fruits of an AI which can help us to solve practical problems about recruitment and similar issues in a way never before possible. It is important to note that the study ran here, this first study, emerged from the questions and the answers generated by AI. Mind Genomics began to incorporate AI in 2023, typically to solve the problem of researchers “freezing” at the task of developing questions and then answers to those questions (so-called elements). The early work was so successful that it led to the incorporation of AI in the form of Idea Coach. It was with the exploration of AI beyond requesting questions and answers that the power of AI would emerge even more forcefully. The companion paper demonstrated the possibility of creating questions about a topic, and then different answers to the same question, those answers provided by AI-synthesized mind-sets. Everything, therefore, was under the control of AI, which moved from a coach to “unfreeze the researcher” into a true researcher, one almost independent of the human researcher. If we were to summarize the importance of this paper and of the companion paper, we would probably come out with the idea that we have now a tool, which in a very short period of time, hours and days, can produce information both in a deep way from generative AI and from actual people responding to the relevant stimuli as AI considers them to be. The consequence is the promise of increased expertise in the field for the professional, and an increased ability to learn how to think critically for younger students. We are sitting here on a cusp now, where learning through the computer can be made targeted, fun, quick, easy, and even gamified with the results from the Mind Genomics experiment. The simple fact that all of the material presented here was done in less than one week (really 5.5 days), starting from absolute zero is witness to the fact that we are on the cusp of an intellectual revolution, where information, validated information, about issues related to people can be dealt with quickly, both in terms of quote library type research through AI, and then human experiments.
Acknowledgment
The authors would like to thank Vanessa Marie B. Arcenas and Isabelle Porat for their help in producing this manuscript.
Abbreviations
AI: Artificial Intelligence, ChatGPT: Chat Generative Pre-Trained Transformer, IDT: Index of Divergent Thought, LLM: Large Language Model, OLS regression: Ordinary Least Squares regression
References
Jahja E, Papajorgji P, Moskowitz H, Margioukla I, Nasto F, Dedej A, Pina P, Shella M, Collaku M, Kaziu E and Gjoni K (2024). Measuring the perceived wellbeing of hemodialysis patients: A Mind Genomics cartography. Plos One 19(5): e0302526. [crossref]
Porretta S, Gere A, Radványi D and Moskowitz H (2019) Mind Genomics (Conjoint Analysis): The new concept research in the analysis of consumer behaviour and choice. Trends in Food Science & Technology 84: 29-33.
Radványi D, Gere A and Moskowitz HR (2020) The mind of sustainability: a mind genomics cartography. International Journal of R&D Innovation Strategy (IJRDIS) 2(1): 22-43.
Mendoza C, Deitel J, Braun M, Rappaport S and Moskowitz HR. (2023)(a) Empowering young researchers: Exploring and understanding responses to the jobs of home aide for a young child. Pediatric Studies and Care 3(1): 1-9.
Mendoza C, Mendoza C, Deitel Y, Rappaport S, Moskowitz H (2023)(b) Empowering Young People to become Researchers: What Does It Take to become a Police Officer? Psychology Journal: Research Open 5(3): 1–12.
Mendoza C, Mendoza C, Rappaport S, Deitel J, Moskowitz HR (2023)(c) Empowering young researchers to think critically: Exploring reactions to the ‘Inspirational Charge to the Newly-Minted Physician’. Psychology Journal: Research Open 5(2): 1-9.
Mendoza C, Mendoza C, Rappaport S, Deitel Y, Moskowitz H (2023) Empowering Young Students to Become Researchers: Thinking of Today’s Gasoline Prices. Mind Genom Stud Psychol Exp 2(2): 1-14.
Gofman A and Moskowitz H (2010) Isomorphic permuted experimental designs and their application in conjoint analysis. Journal of Sensory Studies, 25(1): 127-145.
Messinger S, Cooper T, Cooper R, Moskowitz D, Gere A, et al. (2020) New Medical Technology: A Mind Genomics Cartography of How to Present Ideas to Consumers and to Investors. Psychol J Res Open 3(1): 1-13.
Dubey A and Choubey A (2017) A systematic review on k-means clustering techniques. Int J Sci Res Eng Technol (IJSRET, ISSN 2278–0882) 6(6).
Ischemic stroke (IS) is a global functional disorder, its root causes and mechanisms are still unknown. Recent research focuses on the link between gut microbes and IS. Our biometric analysis of 1015 articles (2000-2023) shows key research trends, hotspots like fecal macrobiotic transplantation, and highlights research gaps, providing insights for future IS studies.
Ischemic stroke (Ischemic Stroke, IS) is a disorder in blood circulation in the brain, causing ischemic necrosis or softening of localized brain tissue caused by ischemia and hypoxia, which leads to the functional defect of the nervous system. Stroke is the second leading cause of death in the world. It has the characteristics of high incidence, high disability rate, high mortality and high recurrence rate. Although a lot of research has been done, the cause of IS is still unclear. Studies have shown that intestinal flora plays an important role in the occurrence and development of IS. The structure of human intestinal flora is complex and plays an important role in central nervous system, endocrine system, immune system and other systems. The ‘flora-gut-brain axis’, as an information exchange network connecting the central and intestinal flora, plays a key role in the occurrence and development of IS. Imbalance of intestinal flora or abnormal metabolism can lead to neuroinflammatory and degenerative lesions, which is an important link in the occurrence and development of IS. So the study of the relationship between intestinal flora and the occurrence and development of IS may provide new ideas for the prevention and treatment of IS. Recently, the relationship between IS and gut microbiota has attracted more and more attention. Scholars have carried out a lot of research on it, but there is no comprehensive and systematic research on it. Therefore, it is necessary to conduct a comprehensive and in-depth study of the research status through visualization methods, and to explore its future development trends and hotspots in depth [1-4].
Bibliometrics takes the worldwide literature pattern and characteristics of literature as the main research objects, and uses the mathematical and statistical methods to analyze the distribution mode, quantitative relationship and variation law of literature information, so as to explore the structure, characteristics and rules of a specific field. Bibliometrics can not only make quantitative statistical analysis of papers in a specific field, but also accurately reflect the most representative papers. Furthermore, the results of bibliometric analysis can show a large amount of data in the form of knowledge maps, so that researchers can conduct a comprehensive analysis of the development of a discipline and can intuitively understand it. Therefore, this topic intends to use the method of bibliometrics to statistically analyze the literature related to IS and intestinal flora from the whole world, and use Citespace6.1.R6 software to visualize the statistical results, so as to summarize the current research progress and hot spots related to IS and intestinal flora, so as to help researchers better understand the research status and hot spots in this field, and put forward corresponding research strategies, so as to further develop IS and intestinal flora. The mechanism of action and the development of corresponding targeted drugs lay the foundation [5,6].
Methods and Materials Data Source and Search Strategy
A bibliometric literature search was conducted on the core collection database of Web of Science (WoS) from January 1, 2000 to July 31, 2023. The retrieval formula is set as follows: TS=(gastrointestinal microbiomes OR microbiome, gastrointestinal OR gut microbiome OR gut microbiomes OR microbiome, gut OR gut microbiota OR gut microbiotas OR microbiota, gut OR gastrointestinal flora OR flora, gastrointestinal OR gut flora OR flora, gut OR gastrointestinal microbiota OR gastrointestinal microbiotas OR microbiota, gastrointestinal OR gastrointestinal microbial community OR gastrointestinal microbial communities OR microbial community, gastrointestinal OR gastrointestinal microflora OR microflora, gastrointestinal OR gastric microbiome OR microbiome, gastric OR gastric microbiomes OR intestinal microbiome OR intestinal microbiomes OR microbiome, intestinal OR intestinal microbiota OR intestinal microbiotas OR intestinal microflora OR microflora, intestinal OR intestinal flora OR flora, intestinal OR enteric bacteria OR bacteria, enteric) AND TS= (cerebral arterial thrombosis OR cerebral infarction OR cerebral ischemia OR Ischemic cerebral infarction OR Ischemic stroke).
Inclusion and Exclusion Criteria
After screening the titles and abstracts, the studies related to IS and intestinal flora were selected. Only articles and comments are included. Other file types, such as letters, comments and meeting summaries are excluded. In addition, the publishing language is limited to English. Finally, 1015 records are determined for final analysis [7].
Analysis Method
CiteSpace is a visualization software for bibliometric analysis developed by Professor Chen Chaomei (University of Drakesell, USA). We used CiteSpace 6.1.R3 to analyze the final record. The main parameter settings are as follows: time slice (2000-2023), number of years per slice (1 year), selection criteria (g-index, k=25) and pruning (pathfinder and pruning the merged network). Other parameters are set according to the CiteSpace manual for different situations. The VOSviewer software is a useful tool for constructing and visualizing a bibliometric network. It was developed by the Science Center in 2007 at the University of Leiden (Netherlands) for technical research. Free to download (https://www.vosviewer.com/)). In the VOS viewer software, each node represents different parameters, such as countries/ regions, journals, institutions, keywords, etc. The size of the node is determined by the weight of the parameter, such as the number of publications, the number of references or the frequency of occurrence. The higher the weight, the larger the node [8]. Nodes and lines are colored by the cluster they belong to. Lines between nodes represent links. Link strength is evaluated by the total link strength index (TLS), which is the sum of all link strength and can be extended to reflect the link strength between institutions [9]. Additional information such as Journal Impact Factor (IF) and Journal Citation Report (JCR) was obtained directly from the Web of Science website on July 31, 2023. Analyze annual publications with Microsoft Office Excel 2019.
Interpretation of Main Parameters of Visual Map
Clustering view and burst detection: Clustering view is performed on the generated graph, and each cluster is annotated by referring to the title, keyword, and subject word in the reference summary. The role of burst detection is to detect a large change in the number of citations in a certain period of time. Therefore, it can be used to find the drop or rise of keywords [10].
Double graph overlap: Double graph overlap is a new method to display the distribution and citation trajectory of articles in various disciplines. As a result, there are original journal on the left side and cited journals on the right side. The curve is the citation line, which completely shows the context of the citation [11].
Result
Publications and Citation Analysis
It can be seen from Figure 1 that the annual number of publications and citations in the WoSCC database showed an overall upward trend from 2000 to 2023. Before 2015, the research on IS and intestinal flora was relatively slow, with no more than 80 annual publications. After 2015, the annual number of publications and citations increased gradually, and the number of publications increased step by step.
Figure 1: Number of papers published from 2000 to 2023
Country/Region Analysis
The top 10 countries/regions in the WoSCC database on IS and intestinal flora are shown in Table 1. The top three countries in this field were the United States, China and Canada, accounting for about 47.63% of the total number of publications. Among them, the United States (24.60%) is the country with the most published papers, followed by China (17.49%) and Canada (5.53%). The United States has the highest total citations and H-index, while Sweden has the highest average citations per article.
Table 1: Top 10 countries/regions that published publications
Rank
Countries/Regions
Articlecounts
Percentage(n/1772)
Total citations
Averagecitationsperarticle
H-index
TLS
1
USA
436
24.60%
39,735
90.93
81
360
2
China
310
17.49%
15,658
50.51
38
138
3
Canada
98
5.53%
8,478
86.51
33
165
4
England
70
3.95%
15,364
219.49
30
204
5
Germany
67
3.78%
13,702
204.51
32
154
6
Australia
49
2.77%
13,117
267.69
24
73
7
Japan
49
2.77%
12,476
254.61
19
29
8
Italy
45
2.54%
12,532
278.49
19
93
9
Netherlands
34
1.92%
7,924
233.06
24
129
10
Sweden
34
1.92%
11,913
350.38
19
136
Figure 2 is the map of international cooperation between countries/ regions, in which the thicker the line between the two countries, the closer the cooperation. As shown in the figure, countries such as the United States, China and Canada have closer ties with other countries. Figure 3 is the country’s citation network visualization map. Countries with total link strength (TLS) over 200 are USA (TLS=360) and England (TLS=204), indicating that these two countries are more influential internationally. In general, USA, China and Canada are the main international contributors to the study of ischemic stroke and intestinal flora, with the largest number of publications and high quality of papers.
Figure 2: International cooperation map between countries/regions
Figure 3: Citation network visualization of countries
Mechanism Analysis
Table 2 shows the top 10 institutions published in the number of articles which are the most active institutions in the field of IS and intestinal flora research are mainly from. China and USA have the largest number of published papers, and the top three institutions are Southern Medical University, University of California, SanDiego and Harvard Medical School. Harvard Medical School in the United States has the highest number of citations and H-index.
Table 2: The top 10 institutions in the number of articles published
Rank
Institutions
Countries/Regions
Articlecounts
Total citations
Averagecitationsperarticle
H-index
TLS
Centrality
1
Southern Medical University
China
36
5,162
125.9
17
13
0.03
2
University of California, SanDiego
USA
26
12,196
381.13
18
111
0.02
3
Harvard Medical School
USA
25
14860
215.36
31
56
0.03
4
China Medical University
China
24
4,056
162.24
11
38
0.01
5
University of Texas Health Science Center at Houston
USA
23
5036
162.45
18
49
0.01
6
Cleveland Clinic Foundation
USA
22
12,582
419.4
19
59
0.14
7
Baylor College of Medicine
USA
21
5,870
183.44
20
39
0.07
8
University of Toronto
Canada
19
6187
247.68
16
48
0.02
9
Albert Einstein College of Medicine
USA
18
4,066
193.62
19
93
0.15
10
Western University
Canada
18
3,987
199.35
18
11
0.01
Figure 4 is an institutional network collaboration map created using CiteSpace. Each node in the map represents a different institution. The darker the color of the node, the later the active year. Albert Einstein College of Medicine had the highest centrality (0.15), followed by Cleveland Clinic Foundation (0.14). When the centrality value is greater than or equal to 0.1, it indicates that the node is the key node of the network graph. It can be seen that these three universities play an important role in institutional cooperation. There are 789 links and 135 nodes, forming a cluster of 10 different colors. The top three institutions with the highest TLS were University of California, San Diego (TLS=111), Albert Einstein College of Medicine (TLS=93) and Cleveland Clinic Foundation (TLS=59).
Figure 4: The institution’s citation network visualization map
Analysis of Funding Agencies
The top 10 funding agencies that support IS and intestinal flora research were listed in Table 3. The top three funding agencies were the United States Department of Health and Human Services (313), National Institutes of Health (312) and National Institute of Neurological Disorders and Stroke (199). The top three funding agencies supported the field far more than any other agency. In terms of countries/regions, the United States has the most funded publications, followed by China and Canada.
Table 3: Top 10 funding agencies
Rank
FundingAgencies
NumberofPublications
Countries/Regions
1
United States Department of Health and Human Services
313
USA
2
National Institutes of Health
312
USA
3
National Institute of Neurological Disorders and Stroke
199
USA
4
National natural science foundation of China
165
China
5
National Heart, Lung, and Blood Institute
48
USA
6
Heart and Stroke Foundation of Canada
40
Canada
7
National Institute on Aging
38
USA
8
anadian Institutes of Health Research
36
Canada
9
National Institute of Diabetes, Digestive and Kidney Disease
35
USA
10
UK Research and Innovation
28
USA
Authors Analysis
The top 10 authors published 153 articles(15.07%) about IS and intestinal flora, as shown in Table 4. Among the top 10 authors, Li L, Hazen SL and Tang WHW are the most cited. The two authors with the largest number of publications are Hazen SL and Spence JD.
Table 4: Top 10 authors in research field
Rank
Author
Count
Representativearticleinthis field
Institutions
H-index
Total citations
TLS
1
Hazen, Stanley L
19
Intestinal microbiota metabolism of L-carnitine, a nutrient in red meatpromotes atherosclerosis
Nature Medicine
16
7540
88
2
Wang, Zeneng
15
Intestinal microbiota metabolism of L-carnitine, a nutrient in red meat, promotes atherosclerosis
Nature Medicine
12
7179
71
3
Yin, Jla
13
Dysbiosis of Gut Microbiota With Reduced Trimethylamine-N-Oxide Level in Patients With Large- Artery Atherosclerotic Stroke or Transient Ischemic Attack
Journal Of The American Heart Association
10
862
63
4
Tang, W H Wilson
11
Intestinal microbiota metabolism of L-carnitine, a nutrient in red meat, promotes atherosclerosis.
Nature Medicine
11
7016
61
5
He, Yan
11
Dysbiosis of Gut Microbiota With Reduced Trimethylamine-N-Oxide Level in Patients With Large- Artery Atherosclerotic Stroke or Transient Ischemic Attack
Journal Of The American Heart Association
10
871
60
6
Wang, Huidi
10
Guidelines for the use and interpretation of assays for monitoring autophagy (3rd edition)
Autophagy
9
3930
57
7
Wu, Qiheng
9
Stroke Dysbiosis Index (SDI) in Gut Microbiome Are Associated With Brain Injury and Prognosis of Stroke
Frontiers in Neurology
8
396
55
8
Li, Lin
8
Guidelines for the use and interpretation of assays for monitoring autophagy (3rd edition)
Autophagy
10
8340
54
9
Zhou, Hongwei
8
Dysbiosis of Gut Microbiota With Reduced Trimethylamine-N-Oxide Level in Patients With Large- Artery Atherosclerotic Stroke or Transient Ischemic Attack
Journal Of The American Heart Association
11
867
53
10
Gao,Xuxuan
7
Stroke Dysbiosis Index (SDI) in Gut Microbiome Are Associated With Brain Injury and Prognosis of Stroke
Frontiers in Neurology
8
488
52
Figure 5 is an author co-citation network diagram that has been cited at least 20 times. It contains a total of 14 nodes, 84 links and 2 clusters. The top three authors with the highest TLS are Hazen, Stanley l (TLS=88), Wang, Zeneng (TLS=71) and Yin, Jia (TLS=63). The co-author citation analysis visualization map contains a total of 10,879 nodes, 10,879 links and 8 clusters. The nodes in the graph represent the author, but the difference between the two is that the link between the nodes depends on the collaboration between the authors. The top three authors with the highest TLS were Hazen SL (TLS=970), Spence JD (TLS=369) and Wang Y (TLS=21729). They are at the center of a cooperative relationship. In general, the nodes of the network diagram are scattered, indicating that the cooperation between the authors in this field is not close.
Figure 5: Author co-citation network diagram with at least 20 citations
Journal Analysis
Table 5 lists the top 10 journals published from 2000 to 2023, most of which are from the United States. Frontiers in Neurology had the largest number of publications, followed by Scientific Reports and International Journal of Molecular Sciences. Stroke had the highest impact factor (IF=8.3). According to Journal Citation Reports (JCR) 2023, the impact factors of the top 10 journals ranged from 3.4 in Frontiers in Neurology to 8.3 in Stroke.
Table 5: Top 10 journals from 2000 to 2023
Rank
Journaltitle
Countries/Regions
ArticleCounts
Percentage(N/1015)
IF(2023)
Quartile in category
H-index
TLS
1
Frontiers in Neurology
USA
22
2.17%
3.4
Q2
22
163
2
Scientific Reports
England
22
2.17%
4.6
Q2
33
62
3
International Journal of Molecular Sciences
USA
21
2.07%
5.4
Q2
19
63
4
Frontiers in Immunology
Switzerland
20
1.97%
7.3
Q1
25
175
5
Stroke
USA
19
1.87%
8.3
Q1
19
178
6
Nutrients
Australia
19
1.87%
5.9
Q1
10
42
7
Frontiers in Cellular and Infection Microbiology
Switzerland
17
1.67%
5.7
Q2
19
134
8
Frontiers in Neuroscience
Switzerland
15
1.48%
4.3
Q2
13
108
9
PLOS ONE
USA
14
1.38%
3.7
Q2
10
66
10
Journal Of Cerebral Blood Flow And Metabolism
England
13
1.28%
6.3
Q1
20
107
Figure 6 shows the visualization of journal co-citation analysis. The top three journals with the highest TLS are Stroke (TLS=187), frontiers in immunology (TLS=175) and frontiers in immunology (TLS=163). Figure 7 shows the double-mapping overlay map of all academic journals. The left side of the map represents the citation journals, the right side of the map represents the cited journals, and the color line represents the citation relationship between the citation journals and the cited journals. The whole map can show the complete citation process. The number of papers published in the journal determines the length of the longitudinal axis of the ellipse, and the number of authors determines the length of the transverse axis. The orange citation path indicates that Molecular/ Biology/Immunology research is frequently cited in Molecular/ Biology/Genetics journals. The green path indicates that research on Medicine/Medical/Clinical is often cited by Medicine/Medical/ Genetics journals.
Figure 6: The visualization of journal co-citation analysis
Figure 7: The double mapping overlay of all academic journals
Analysis References
Figure 8 shows the co-citation network visualization of the literature generated by VOS viewer, and lists the top 10 most cited articles related to IS and intestinal flora research in Table 6. There are 11300 links and 172 nodes, forming four clusters of different colors. In these clusters, the total link strength with other cited references was calculated. The highest TLS was an article published by Benakis C et al. in 2016 (TLS=2976), followed by articles published by Singh V et al. (TLS=2959, 2016), Yin J et al. (TLS=2695, 2015), Wang Zn et al. (TLS=2100, 2011). Three of these 10 articles were published in nat med. The most frequently cited article in this field was an article published by Benakis C [12] on the effect of symbiotic microbiota on the outcome of ischemic stroke by regulating intestinal T cells.
Figure 8: Visualization diagram of literature co-citation network
Table 6: Top 10 most cited articles
Rank
Title
Total citations
Firstauthor
PublicationYear
Journal
TLS
1
Commensal microbiota affects ischemic stroke outcome by regulating intestinal gamma delta T cells
186
Benakis C
2016
Nature Medicine
2976
2
Microbiota Dysbiosis Controls the Neuroinflammatory Response after Stroke
184
Singh V
2016
JNeurosci
2959
3
Prognostic value of choline and betaine depends on intestinal microbiota-generated metabolite trimethylamine-N-oxide
158
Wang zn
2011
nature
2100
4
Dysbiosis of Gut Microbiota With Reduced Trimethylamine-N-Oxide Level in Patients With Large-Artery Atherosclerotic Stroke or Transient Ischemic Attack
153
Yin j
2015
Journal of the American Heart Association
2695
5
Intestinal Microbial Metabolism of Phosphatidylcholine and Cardiovascular Risk
145
Tang whw
2013
New England Journal of Medicine
1973
6
Intestinal microbiota metabolism of L-carnitine, a nutrient in red meat, promotes atherosclerosis
140
Koeth ra
2013
Nature Medicine
1849
7
Gut Microbial Metabolite TMAO Enhances Platelet Hyperreactivity and Thrombosis Risk
119
Zhu WF
2016
Cell
1868
8
Translocation and dissemination of commensal bacteria in post-stroke infection
101
Stanley d
2016
Nature Medicine
1794
9
Host microbiota constantly control maturation and function of microglia in the CNS
100
Erny d
2015
Nature Neuroscience
1743
10
Age-related changes in the gut microbiota influence systemic inflammation and stroke outcome
96
Spychala ms
2018
Annals Of Neurology
1759
We also observe from Figure 9 that the top 20 references with the strongest outbreak were cited in the study of IS and intestinal flora. The articles with the strongest explosive power are: Koeth RA [13] published in 2013: Intestinal microbiota metabolism of L-carnitine, a nutrient in red meat, promotes atherosclerosis.
Figure 9: Top 20 references with the strongest outbreak
Keywords Analysis
Keyword Co-occurrence Analysis
In bibliometrics, keywords are a very important part. Keyword co-occurrence analysis can reveal changing research topics and development trends. The density visualization map generated by co-occurrence of keywords more than 10 times is shown in Figure 10. The more frequent the keywords appear, the darker the color. In addition to the ‘ischemic stroke’ and ‘intestinal flora’ contained in the search terms, a total of 545 keywords appeared as nodes. Table 7 shows that the most common keywords are ‘risk’, ‘disease’, ‘inflammation’ and ‘chain fatty acid’.
Figure 10: Keyword visualization of co-occurrence of keywords more than 10 times
Table 7: Top 20 keywords of
Rank
Keyword
Counts
Rank
Keyword
Counts
1
risk
116
11
traditional chinese medicine
45
2
disease
99
12
atherosclerosis
42
3
inflammation
95
13
central nervous system
39
4
chain fatty acid
82
14
multiple sclerosis
31
5
metabolism
78
15
fecal microbiota transplantation
21
6
trimethylamine n oxide
62
16
bile acid
17
7
phosphatidylcholine
54
17
blood brain barrier
14
8
dysbiosis
50
18
microglia
13
9
blood pressure
47
19
microbiota-gut-brain axi
12
10
oxidative stress
47
20
ketogenic diet
11
Keyword Cluster Analysis
Cluster analysis is carried out on the basis of keyword co- occurrence graph. The more nodes the cluster contains, the smaller the cluster number is. The two indexes of module value (Q value) and average contour value (S value) are used as the evidence to judge the clustering effect of the graph. Q value > 0.3 indicates that the clustering structure is significant ; clustering average contour value S value > 0.5, clustering is generally considered to be reasonable. In this study, the LLR model was used to cluster the keywords, Q value=0.5205, S value=0.6911. It can be considered that the clustering results are within a reasonable range, as shown in Figure 11.
Figure 11: Keyword cluster visualization
Keyword Burst Analysis
This study lists the top 13 burst keywords, see Figure 12. The most intense burst keywords are ‘coronary heart disease’ (intensity=6.14), followed by ‘mediterranean diet’ (intensity=5.29) and ‘myocardial infarction’ (intensity=5.03). ‘Coronary heart disease’ is the earliest emerging keyword, and the emerging keywords from 2022 to 2023 are ‘fecal microbiota transplantation’, ‘immune’ and ‘cerebral ischemia’ The map shows that there are three keywords that are still in the current stage of the ongoing process.
Figure 12: Studies the top 13 keywords with the strongest citation burst
Discussion
Global Research Trends of Ischemic Stroke and Intestinal Flora
This study conducted a bibliometric analysis of IS and intestinal flora. The number of citations showed a continuous but unstable growth trend year by year. These results show that from the overall trend of the number of papers published in this field, more and more scholars pay attention to the role of pathogenesis in this field, especially in recent years, the number of papers published has increased significantly. Therefore, it can be inferred that in recent years, people’s understanding of this field has become more mature, relevant basic research has become more and more, and the prevention and control of this field has become a hot spot and trend all over the world.
In terms of countries/regions, the United States is the dominant contributor to the number of published articles (436), followed by China (310) and Canada (98), while the United States is far ahead of other countries in the number of citations (39735), which can be said to be in a dominant position in this field. In terms of authoritative institutions, the top 10 institutions are composed of 9 American institutions and 1 Chinese institution. According to international cooperation, the University of California System in the United States has relatively close cooperation with other institutions. Although a wide range of cooperation has been established between countries and institutions, future research involving IS and intestinal flora should focus on international cooperation and carry out multi-center, large- sample studies.
Scientific research and innovation need a lot of financial, human and material support. The United States Department Of Health Human Services is the funding agency that funds the most research projects in this field, so the support of funding agencies is one of the reasons why the United States has achieved a high academic status in this field. At the same time, it is of great significance to prove the research on IS and intestinal flora. Because more and more institutions invest a lot of money to conduct in-depth research and explore their deep cognition and prevention, there will be greater financial support to encourage high-level institutions to contribute to scientific research.
According to the survey of author information, it can be found that Hazen SL has the highest H index. In terms of authoritative journals, Frontiers in Neurology (22 articles), Scientific Reports (22 articles), and International Journal of Molecular Sciences (21 articles) contribute the most to the number of published papers. Among the top 10 journals, Q2 accounted for 60% and Q1 accounted for 40%, indicating that the quality of research on IS and intestinal flora still needs to be strengthened. PLOS ONE had the most citations (1000) and the highest average number of citations (71.43 times). The highest H index value appears in Frontiers in Neurology. In addition, four of the top 10 journals have IF values of 3-5 (Frontiers in Neurology, Scientific Reports, Frontiers in Neuroscience and PLOS ONE). The IF values of 4 journals were 5-7 (International Journal of Molecular Sciences, Nutrients, Frontiers in Cellular and Infection Microbiology, Journal Of Cerebral Blood Flow And Metabolism), and the IF values of 2 journals were 7-8 (Frontiers in Immunology, Stroke).
Research Hotspots and Frontiers of IS and Intestinal Flora
Keyword analysis can reflect the core and research points of a literature. On the basis of in-depth analysis of keyword co-occurrence, it can quickly determine the research hotspots and development trends in a field. Through the visual clustering analysis of keywords, combined with color clustering diagram and emergent graph, the current research hotspots and frontiers are analyzed [14]. From the results, it can be seen that in the occurrence and development of IS, the imbalance of intestinal flora mediated by short-chain fatty acids, trimethylamine nitrogen oxide, brain-gut axis, immunity and neuroinflammation play a key role in the occurrence and development of IS. Fecal microbiota transplantation technology is also a research hotspot in this field. We will analyze it from the perspectives of short- chain fatty acids, trimethylamine nitrogen oxide, brain-gut axis, ketogenic diet, fecal microbiota transplantation, and natural products. The analysis results are summarized as follows:
The Effect of Short Chain Fatty Acids (SCFAs) on IS
SCFAs are the ‘protectors’ of the occurrence and development of stroke. The mechanism of action is to regulate microglia, neurotrophic factors, blood-brain barrier (BBB), neuro inflammation and neuronal apoptosis [15]. SCFAs mainly cross the cell membrane in a pH- dependent manner, and are transported across the cell membrane mediated by hydrogen-coupled or sodium-coupled monocarboxylic acid transporters, which can cause apoptosis by regulating the NF- kappa B signaling pathway, thus playing a protective role in brain injury. Under physiological conditions, SCFAs, the main metabolites of intestinal flora, can affect the expression of B-cell lymphoma-2, BH3 interacting domain death agonist, Fas cell surface death receptor, Necdin and Vascular endothelial growth factor A related to neurogenesis, proliferation and apoptosis, and promote the growth of human neural progenitor cells and the differentiation of embryonic stem cells into neurons [16]. In addition, the regulation of SCFAs on brain function may be related to its regulation of neurotransmitters and NF-κB signaling pathway. Studies have confirmed that SCFAs can enter the blood-brain barrier through blood flow and act directly on the blood-brain barrier [17]. Studies have shown that sodium butyrate can not only inhibit histone deacetylase, but also increase the expression of TrkB receptor in the injured hemisphere and the phosphorylation of transcription factor cyclic adenosine monophosphate effector element binding protein, and promote the occurrence of ipsilateral hemisphere neurons through BDNF-TrkB signaling pathway, increase synaptic plasticity, and ultimately improve the neurological function of neonatal hypoxic-ischemic rats [18].
The Effect of Trimethylamine Nitrogen Oxide (TMAO) on IS
TMAO is a gut-derived microbial metabolite. When the body ingests choline, it decomposes the C-N bond in the product to form trimethylamine (TMA). TMA enters the liver through the liver and intestinal circulation system, and generates TMAO under the oxidation of flavin monooxygenase. TMAO can cause thrombosis, platelet aggregation, vascular endothelial injury, lipid metabolism, inflammation and other diseases, and the increase of TMAO concentration can lead to severe cerebrovascular disease. In addition, for patients with diabetes, first stroke and peripheral arterial disease, the risk of long-term death also has a significant correlation. TMAO may affect the recovery of neurological function after cerebral ischemia by promoting astrocyte activation and glial scar formation. In addition, there is also a certain relationship between TMAO content and stroke recurrence. Recent studies have found that the concentration of TMAO increased significantly within 72 hours after cerebral ischemia, which is an important risk factor for recurrent vascular events 3 months after cerebral ischemia-reperfusion. Although the current study has confirmed the change of TMAO level after stroke, the change of TMAO before stroke can not be determined, and the long-term effect of TMAO on stroke patients still needs further observation [19-21].
The Effect of Gut-Brain Axis on IS
Studies have found that there is a two-way communication and interaction between the intestine and the brain. The intestinal flora can exchange information with the brain through neural pathways, neurotransmitter endocrine pathways, immune pathways, cellular metabolites, and host metabolic pathways, that is, the‘gut-brain axis’ [22]. After ischemic brain injury, GBA in the brain transmits signals to the intestine, leading to intestinal inflammation, decreased intestinal motility, mucosal barrier destruction, increased permeability, and intestinal flora translocation. Studies have found that the diversity of intestinal flora is reduced, the proportion of Bacteroidetes and Firmicutes is changed, and the abundance of beneficial bacteria such as Lactobacillus and Bifidobacterium is reduced, which may further aggravate brain injury [23]. The gut-brain axis affects the immune function of the body by regulating the number of regulatory T cells and IL-17+γδT cells, leading to the occurrence of cerebral ischemia. The ‘gut-brain axis’ caused by IS can promote the migration of T lymphocytes from the intestine to the brain, increase the secretion of γδT cells and IL-17 in the brain, decrease the secretion of Treg cells and IL-10, cause systemic and central nervous system inflammation, and aggravate brain nerve injury [24,25].
Effects of Ketogenic Diet on IS
Ketogenic diet is mainly composed of low carbon, high fat and suitable protein. It has a good therapeutic effect on nervous system diseases, especially intractable epilepsy, neurodegenerative diseases, mental and psychological diseases and so on [26]. As an important source of energy, ketone bodies can be fully utilized in neurons, glial cells and other tissues, so they have been widely used in neurological diseases [27]. In addition, ketogenic diet can also affect the intestinal immune function by regulating the intestinal microbial community, thus affecting the inflammatory response of brain tissue. It has been found that ketogenic diet can significantly change the intestinal microorganisms of rats, reduce the abundance and α diversity of intestinal microorganisms in rats, and significantly increase the content of Akkermansia-muciniphila and Parabacteroides in rats. Studies have shown that ketogenic diet and β-hydroxybutyrate (BHB) have protective effects on cerebral ischemia [28,29]
Fecal Bacteria Transplantation Technology and Its Effect on IS
In recent years, with the emergence of fecal bacterial transplantation and the concept of intestinal microecology, there has been a new understanding of the interaction between flora and human body. The micro-ecological system of the human body consists of four systems: oral cavity, skin, urinary system and gastrointestinal tract. Among these four systems, the number and structure of microorganisms colonized in the intestinal microecosystem are the most complex, and they have the greatest impact on the human body. The first application of modern western medicine fecal bacteria transplantation technology originated from the University of Colorado School of Medicine in the United States. In 1958, it was first used in 4 patients with pseudomembranous colitis and successfully cured. Wang used fecal bacterial transplantation technology to confirm that different genders of intestinal flora are related to the outcome of cerebral infarction in animal models of cerebral infarction. It was also found that giving female intestinal flora could significantly improve the survival rate of mice, reduce the infarct area, improve behavioral performance, promote the secretion of beneficial metabolites, and reduce the inflammatory response. In contrast, the protective effect of male intestinal flora on mice was weaker. Studies have confirmed that fecal microbiota transplantation can significantly improve the structure of intestinal flora in patients with CI, reduce the number of pathogenic bacteria, increase the number of probiotics, reduce nerve injury, reduce cerebral edema, and reduce the volume of cerebral infarction [30-34].
Effect of Natural Products on Intestinal Flora in the Treatment of Ischemic Stroke
Traditional Chinese medicine(TCM) has attracted much attention in the field of regulating intestinal microecology and repairing intestinal barrier due to its mild bacteriostatic effect, repair effect and not easy to cause human drug resistance. TCM can enhance the immunity of the body, resist the invasion of foreign bacteria, and also adjust the level of pro-inflammatory and anti-inflammatory factors in the body, so as to achieve the purpose of inhibiting intestinal inflammation [35-37]. What’s more, TCM can regulate the number and secretory function of intestinal mucosal epithelial cells, provide a suitable growth environment for specific flora, and inhibit other flora, thereby affecting the secretion and layer components of mucus by improving the microcirculation of the intestinal mucosa, repairing the integrity of the intestinal mucosa, reducing the permeability of the intestinal mucosa to maintain the mechanical barrier function. Increasing the number of dominant microorganisms and maintaining the balance between them and the host are important ways to repair the biological barrier [38,39]. Studies have shown that the compatibility of Puerariae Lobatae Radix and Chuanxiong Rhizoma can improve the increase of intestinal mucosal permeability, brain-gut barrier injury and has a good therapeutic effect on brain injury caused by cerebral ischemia. It has also been reported that the compatibility of astragalus and saffiower can protect the integrity of the blood-brain barrier and reduce cerebral ischemic injury by regulating intestinal microecology, activating bile acid receptors, maintaining bile acid homeostasis, and reducing inflammatory reactions in the brain [40].
TCM has good intestinal mucosal barrier and intestinal microecological recovery function. However, some TCM can also cause certain damage to the intestine while achieving curative effect. It has been proved that soyasaponins can reduce intestinal mucosal folds, promote the proliferation and apoptosis of intestinal epithelial cells, increase the permeability of intestinal mucosa, break the cell connection, and damage the antioxidant function of intestinal mucosa, thus causing intestinal mucosal damage. In addition, the diameter of the active ingredients, original drugs and compound of TCM prepared by nanotechnology is not more than 100 nm. The research of nano-Chinese medicine involves a variety of techniques such as nano-carriers and solid dispersion systems. This method can not only realize the nanometer grinding of the drug, but also make the effective components or the effective components of the drug nano- treatment to have a new effect. It is expected to achieve a breakthrough in the treatment of IS [41-44].
Marine natural products have a multi-target agent effect and can synergistically regulate a variety of intestinal and intestinal-related diseases. Studies had confirmed the therapeutic effect of carotenoids, polysaccharides, phytosterols, terpenes, phenols, alkaloids and other active ingredients on neurodegenerative diseases, and explored its mechanism of action. Natural substances in the ocean can reduce the relative content of harmful transgenes, increase beneficial transgenes, and regulate inflammatory mediators, apoptosis, and oxidative stress in the intestine [46]. Because the intestine and the brain interact with each other, regulating the signal transduction pathway in the intestine can make it play a neuroprotective role in the brain. It was found that astaxanthin could inhibit the expression of MyD88, TLR4 and p-p65, and up-regulate the expression of p65. Astaxanthin has the function of simultaneously regulating the two organs of intestine and brain. It is speculated that it may be an ideal candidate for regulating intestinal- brain axial neuroprotection [45-48].
Limitation
We conducted a visual analysis on the WoSCC database and found that: (1) The data we collected is limited to the data between July 2000 and 2023, and the real data will change according to the update of the database. (2) Because the existing bibliometrics software can not identify the author’s initials, so in the author analysis of the article, there may be some incorrect results; (3) Because the search scope of this paper is limited to the SCI-E index database of WOS, the documents that are not included in the SCI-E index database are not included in the analysis scope of this paper. However, the research results of this project will help us better understand the mechanism of IS and intestinal flora, and provide new ideas and methods for further exploration of this issue in the future.
Conclusion
Based on the WoSCC database, this study conducted a bibliometric analysis of 1015 studies published from 2000 to 2023 on the relationship between intestinal flora and the incidence of IS. The results showed that the number of publications on the relationship between intestinal flora and IS in the past literature showed an increasing trend year by year. Globally, China and the United States are the leading countries in this field, and they are also the countries with the most cooperation and exchanges. Southern Medical University is the research institution that has the greatest impact on research results. Hazen and Stanley L are the authors with high publications in this field. Frontiers in Neurology may be the most popular journal in this field. At present, most of the published articles on the study of IS and intestinal flora are cited from internationally influential journals. Short-chain fatty acids, trimethylamine nitrogen oxide, brain-gut axis, ketogenic diet, and fecal microbiota transplantation are the hotspots and frontiers in the study of intestinal flora and IS. Further study on the relationship between intestinal flora and IS will promote the treatment of IS.
Acknowledgments
This study was supported by Guangxi University of Chinese Medicine (NO.2021QN010), Projects to improve the basic scientific research capacity of young and middle-aged people (NO.2022KY0301) and Guangxi first-class discipline Clinical basis of Traditional Chinese Medicine (TCM) (NO.2019XK060).
References
Campbell, B Khatri, Stroke. (2020) Lancet 396: 129-142.
Chen, Y Zhou, J Wang, L (2021) Role and Mechanism of Gut Microbiota in Human Front Cell Infect Microbiol 11: 625913. [crossref]
Agirman, G Yu, B Hsiao, E.Y. (2021) Signaling inflammation across the gut-brain axis. Science 374(6571). [crossref]
Silva, D.C.T Singh, V Mohamud, Y.A Wang, J Schultz, M.A, et al. (2022) Post- ischemic protein restriction induces sustained neuroprotection, neurological recovery, brain remodeling, and gut microbiota rebalancing. Brain Behav Immun 100: 134-144. [crossref]
Ma, W Yang, Y.B Xie, T.T Xu, Y Liu, N, et al. (2022) Cerebral Small Vessel Disease: A Bibliometric J Mol Neurosci 72(11). [crossref]
Xiu, R Sun, Q Li, B Wang, Y (2023) Mapping Research Trends and Hotspots in the Link between Alzheimer’s Disease and Gut Microbes over the Past Decade: A Bibliometric Analysis. Nutrients 15. [crossref]
Wu, W Ouyang, Y Zheng, P Xu, X He, C, et al. (2022) Research trends on the relationship between gut microbiota and colorectal cancer: A bibliometric analysis. Front Cell Infect Microbiol 12:1027448. [crossref]
Yuan, X Chang, C Chen, X Li, K (2021) Emerging trends and focus of human gastrointestinal microbiome research from 2010-2021: a visualized study. J Transl Med 19(1). [crossref]
Pei, Z Chen, S Ding, L Liu, J Cui, X, et (2022) Current perspectives and trend of nanomedicine in cancer: A review and bibliometric analysis. J Control Release 352: 211-241. [crossref]
Xu, D Wang, Y.L Wang, K.T Wang, Y Dong, X.R, et al. (2021) A Scientometrics Analysis and Visualization of Depressive Disorder. Curr Neuropharmacol 19(6). [crossref]
Ma, D Yang, B Guan, B Song, L Liu, Q, et al. (2021) A Bibliometric Analysis of Pyroptosis From 2001 to 2021. Front Immunol 12: 731933. [crossref]
Benakis, C Brea, D Caballero, S Faraco, G Moore, J, et al. (2016) Commensal microbiota affects ischemic stroke outcome by regulating intestinal γδ T cells. Nat Med 22(5). [crossref]
Koeth, A Wang, Z Levison, B.S Buffa, J.A Org, E, et al. (2013) Intestinal microbiota metabolism of L-carnitine, a nutrient in red meat, promotes atherosclerosis. Nat Med 19(5). [crossref]
Wang, J Maniruzzaman, M (2022) A global bibliometric and visualized analysis of bacteria-mediated cancer therapy. Drug Discov Today 27(10). [crossref]
Tu, R Xia, J (2024) Stroke and Vascular Cognitive Impairment: The Role of Intestinal Microbiota Metabolite CNS Neurol Disord Drug Targets 23(1)
Lee, J D’Aigle, J Atadja, L Quaicoe, V Honarpisheh, P, et (2020) Gut Microbiota- Derived Short-Chain Fatty Acids Promote Poststroke Recovery in Aged Mice. Circ Res 127(4). [crossref]
Ahmed, H Leyrolle, Q Koistinen, V Karkkainen, O Laye, S, et (2022) Microbiota- derived metabolites as drivers of gut-brain communication. Gut Microbes 14(1). [crossref]
Zhou, Z Xu, N Matei, N McBride, D.W Ding, Y, et al. (2021) Sodium butyrate attenuated neuronal apoptosis via GPR41/Gbetagamma/PI3K/Akt pathway after MCAO in J Cereb Blood Flow Metab 41(2). [crossref]
Zhu, W Romano, A Li, L Buffa, J.A Sangwan, N, et al. (2021) Gut microbes impact stroke severity via the trimethylamine N-oxide pathway.Cell Host Microbe 29(7). [crossref]
Zhao, F Wei, D.N Tang, Y. (2021) Gut Microbiota Regulate Astrocytic Functions in the Brain: Possible Therapeutic Consequences. Curr Neuropharmacol 19(8). [crossref]
Chidambaram, B Rathipriya, A.G Mahalakshmi, A.M Sharma, S Hediyal, T.A, et al. (2022) The Influence of Gut Dysbiosis in the Pathogenesis and Management of Ischemic Stroke. Cells 11(7). [crossref]
Xu, K Gao, X Xia, G Chen, M Zeng, N, et (2021) Rapid gut dysbiosis induced by stroke exacerbates brain infarction in turn. Gut 70(8).
Ma, J Xie, H Yuan, C Shen, J Chen, J, et al. (2023) The gut microbial signatures of patients with lacunar cerebral infarction, Nutr Neurosci 27(6). [crossref]
Feng, Y Zhang, D Zhao, Y Duan, T Sun, H, et (2022) Effect of intestinal microbiota transplantation on cerebral ischemia reperfusion injury in aged mice via inhibition of IL-17. Neurogastroenterol Motil 34(7). [crossref]
Papotto, H Yilmaz, B Silva-Santos, B (2021) Crosstalk between gammadelta T cells and the microbiota. Nat Microbiol 6(9). [crossref]
Dynka, D Kowalcze, K Paziewska, A (2022) The Role of Ketogenic Diet in the Treatment of Neurological Diseases. Nutrients 14(23). [crossref]
Olson, A Iniguez, A.J Yang, G.E Fang, P Pronovost, G.N, et al. (2021) Alterations in the gut microbiota contribute to cognitive impairment induced by the ketogenic diet and hypoxia. Cell Host Microbe 29(9). [crossref]
Koppel, J Pei, D Wilkins, H.M Weidling, I.W Wang, X, et al. (2021) A ketogenic diet differentially affects neuron and astrocyte transcription. JNeurochem 157(6). [crossref]
Har-Even, M Rubovitch, V Ratliff, W.A Richmond-Hacham, B Citron, B.A, et al. (2021) Pick, G. Ketogenic Diet as a potential treatment for traumatic brain injury in mice. Sci Rep 11(1). [crossref]
Fujimoto, K Kimura, Y Allegretti, J.R Yamamoto, M Zhang, Y.Z, et al. (2021) Functional Restoration of Bacteriomes and Viromes by Fecal Microbiota Gastroenterology 160(6). [crossref]
Mohajeri, H Brummer, R Rastall, R.A Weersma, R.K Harmsen, H, et al. (2018) The role of the microbiome for human health: from basic science to clinical applications. Eur J Nutr 57: 1-14. [crossref]
Eiseman, BSilen, WBascom,G.SKauvar,A.J (1958) Fecal enema as an adjunct in the treatment of pseudomembranous enterocolitis. Surgery 44(5). [crossref]
Wang, J Zhong, Y Zhu, H Mahgoub, O.K Jian, Z et.al (2022) Different gender- derived gut microbiota influence stroke outcomes by mitigating inflammation. J Neuroinflammation 19(1). [crossref]
Chen, R Xu, Y Wu, P Zhou, H Lasanajak, Y, et al. (2019) Transplantation of fecal microbiota rich in short chain fatty acids and butyric acid treat cerebral ischemic stroke by regulating gut Pharmacol Res 148: 104403. [crossref]
Li, X Wu, D Niu, J Sun, Y Wang, Q, et (2021) Intestinal Flora: A Pivotal Role in Investigation of Traditional Chinese Medicine. Am J Chin Med 49(2). [crossref]
Zhang, Y Tian, J.X Lian, F.M Li, M Liu, W.K, et al. (2021) Therapeutic mechanisms of traditional Chinese medicine to improve metabolic diseases via the gut microbiota. Biomed Pharmacother 133: 110857. [crossref]
Feng, W Ao, H Peng, C Yan, (2019) Gut microbiota, a new frontier to understand traditional Chinese medicines. Pharmacol Res 142: 176-191. [crossref]
Che, Q Luo, T Shi, J He, Y Xu, L (2022) Mechanisms by Which Traditional Chinese Medicines Influence the Intestinal Flora and Intestinal Barrier. Front Cell Infect Microbiol 12: 863779. [crossref]
Yang, S Hao, S Wang, Q Lou, Y Jia, L Chen, D (2022) The interactions between traditional Chinese medicine and gut microbiota: Global research status and trends. Front Cell Infect Microbiol 12: [crossref]
Chen, R Wu, P Cai, Z Fang, Y Zhou, H, et al. (2019) Puerariae Lobatae Radix with chuanxiong Rhizoma for treatment of cerebral ischemic stroke by remodeling gut microbiota to regulate the brain-gut barriers. J Nutr Biochem 65: 101-114. [crossref]
Gu, M Pan, S Li, Q Qi, Z Deng, W Bai, N ((2021) Protective effects of glutamine against soy saponins-induced enteritis, tight junction disruption, oxidative damage and autophagy in the intestine of Scophthalmus maximus Fish Shellfish Immunol 114: 49-57. [crossref]
Li, T Wang, P Guo, W Huang, X Tian, X, et al(2019) Natural Berberine-Based Chinese Herb Medicine Assembled Nanostructures with Modified Antibacterial ACS Nano 13(6)
Zhang, Y.L Wang, Y.L Yan, K Deng, Q.Q Li, F.Z, et al. (2023) Nanostructures in Chinese herbal medicines (CHMs) for potential therapy. Nanoscale Horiz 8(8). [crossref]
Wei, D Yang, H Zhang, Y Zhang, X Wang, J, et (2022) Nano-traditional Chinese medicine: a promising strategy and its recent advances. J Mater Chem 10(6). [crossref]
Leclerc, M Dudonne, S Calon, F (2021) Can Natural Products Exert Neuroprotection without Crossing the Blood-Brain Barrier? Int J Mol Sci 22(7). [crossref]
Fakhri, S Yarmohammadi, A Yarmohammadi, M Farzaei, H Echeverria, J. (2021) Marine Natural Products: Promising Candidates in the Modulation of Gut-Brain Axis towards Neuroprotection. Mar Drugs 19(3). [crossref]
Chen, Y Zhao, S Jiao, D Yao, B Yang, S, et (2021) Astaxanthin Alleviates Ochratoxin A-Induced Cecum Injury and Inflammation in Mice by Regulating the Diversity of Cecal Microbiota and TLR4/MyD88/NF-kappaB Signaling Pathway. Oxid Med Cell Longev 2021, 8894491. [crossref]
Liu, F Smith, A.D Solano-Aguilar, G Wang, T Pham, Q, et al. (2020) Mechanistic insights into the attenuation of intestinal inflammation and modulation of the gut microbiome by krill oil using in vitro and in vivo models. Microbiome 8(1). [crossref]
A woman’s transition through menopause is a multifaceted experience that encompasses more than just the end of reproductive capacity. It presents unique challenges and opportunities for mental health scholars and practitioners. Importantly, hormonal fluctuations that occur during menopause impact a woman’s neurological and cognitive functioning. As a result, women may experience a variety of cognitive challenges commonly collectively referred to as brain fog. To this end, brain fog is a hallmark symptom of menopause. The application of neurocounseling to menopausal mental health care presents a novel pathway for holistic, personalized treatment. This article presents current information regarding cognition during menopause and neurocounseling. The article concludes with recommendations for the application of neurocounseling as a treatment approach for brain fog within a menopausal mental health care.
Keywords
Menopause, Brain fog, Cognition, Neurocounseling, Neuroscience, Mental health
Cognition During Menopause
During menopause, many women experience noticeable changes in cognition, often referred to as brain fog . These cognitive changes are largely influenced by hormonal fluctuations, particularly the decline in estrogen, which affects brain function. Estrogen plays a key role in cognitive processes, including memory, attention, and learning. As estrogen levels drop during perimenopause, women may face several cognitive challenges. For example, many women report memory problems such as forgetfulness or difficulty recalling information, especially short-term memory issues. A decline in attention span and focus is common, making it harder to concentrate and complete tasks that require sustained attention. During this time some women notice that it takes longer to think through tasks or solve problems than before suggesting that some perimenopausal women have a lower processing speed. In addition, perimenopausal women may struggle to find the right words during conversations, leading to feelings of frustration. Overall, many women experience a general sense of mental cloudiness or difficulty thinking clearly, affecting problem-solving and decision-making during menopause, and perimenopause in particular [1-5].
These cognitive changes can affect daily life and work, contributing to emotional distress such as anxiety and frustration. This is further exacerbated by the fact that there is no universal assessment or benchmark for the onset of perimenopause [5]. Thus, brain fog is many women’s first encounter with the symptoms of menopause. As a result, many women struggle to detect their symptoms as those of menopause and not simply aging or stress [6]. While this may be inconsequential for some women, the lack of knowledge and preparedness can create significant psychological distress for others. For most women, cognitive changes are temporary and tend to improve post-menopause. Nevertheless, the impairment can last years as a women undergoes perimenopause and be quite debilitating [5]. Lifestyle interventions like exercise, healthy diet, mental stimulation, and stress management can help mitigate cognitive difficulties during this phase. Moreover, menopausal hormone therapy (MHT), such as the use of prescribed estrogen via patches, pills, vaginal creams, combined estrogen-progesterone pills, gel-based applications, and certain intrauterine devices (IUDs), can help mitigate the underlying hormonal cause of cogntitive impairment. However, these interventions do not address the neurological aspects of a woman’s hormonal fluctuations that contribute to psychological distress [1,7].
Neurocounseling
Neurocounseling is an interdisciplinary approach that integrates neuroscience with counseling practices to better understand and address mental health issues. It focuses on how brain function and neurological processes influence behavior, emotions, cognition, and overall mental health. By incorporating knowledge of the brain and nervous system, neurocounseling helps mental health practitioners design more effective interventions tailored to the biological underpinnings of a person’s mental health challenges [8,9].
The neurocounseling approach involves using tools like brain imaging studies, neurofeedback, mindfulness practices, and cognitive-behavioral strategies to promote positive changes in brain functioning and emotional regulation. The goal is to help patients and clients improve their mental health by combining traditional therapeutic methods with insights from neuroscience, fostering a deeper understanding of how the brain and nervous system respond to therapy. Neurocounseling is particularly useful in treating conditions such as anxiety, depression, trauma, ADHD, and other disorders where brain function plays a critical role. The use of neurocounseling to support menopausal women is relatively unexamined [10-12].
Implications for Menopausal Mental Health Care
Mental health practitioners can use neurocounseling to effectively treat cognitive challenges such as brain fog during menopause by incorporating neuroscience-based techniques that target both the brain and behavior. Given that cognitive changes during menopause, such as memory issues, difficulty concentrating, and brain fog, are often linked to hormonal fluctuations, neurocounseling offers a holistic and empowering approach to managing these challenges. A summary of how six aspects of neurocounseling can be used to address cognitive aspects of menopausal mental health follows.
Psychoeducation
Psychoeducation is an integral aspect of neurocounseling [11]. Mental health practitioners can educate patients and clients about the neurological basis of cognitive changes during menopause, helping them understand that these difficulties are normal and often temporary. This awareness can reduce anxiety and foster a more compassionate view of their menopausal experience.
Cognitive-behavioral Therapy (CBT)
Neurocounseling can integrate CBT techniques to help clients and patients manage negative thought patterns that may arise from cognitive struggles [10]. For example, women who feel frustrated by forgetfulness can learn strategies to reframe their experiences and reduce the emotional burden associated with menopausal cognitive challenges.
Mindfulness and Relaxation Techniques
Since stress exacerbates cognitive decline, mental health practitioners can teach mindfulness-based stress reduction (MBSR) and relaxation techniques [13]. Mindfulness has been shown to positively affect brain plasticity, promoting cognitive resilience by enhancing focus, attention, and emotional regulation. For women undergoing cognitive changes due to menopause, MBSR can be particularly useful, empowering women to assert greater control their attention and emotional regulation.
Neurofeedback
This tool allows patients and clients to monitor their brain activity in real time and learn how to regulate their brain waves. Neurofeedback can improve concentration, memory, and mental clarity, which are often impacted by menopause [10].
Memory and Attention Training
Mental health practitioners can use brain-based exercises to strengthen cognitive functions such as working memory and attention. Techniques like brain games, puzzles, and structured mental exercises can improve cognitive flexibility and processing speed [14]. As a tool within the neurocounseling framework, memory and attention training can empower women while creating an entertaining outlet. The latter may be particularly important given that many women report an increase in social isolation and a decreased participation in pleasurable activities during the menopausal transition [15].
Lifestyle Guidance
Neurocounseling emphasizes the connection between brain health and lifestyle choices. Mental health practitioners can encourage physical exercise, proper nutrition, and adequate sleep, all of which are linked to better cognitive function. They may also recommend activities that stimulate the brain, like reading, puzzles, or learning new skills, which promote neuroplasticity and cognitive improvement [13].
Conclusion
By using neurocounseling, mental health practitioners can offer women experiencing cognitive difficulties during menopause a comprehensive treatment plan that addresses both the psychological and neurological aspects of their symptoms, helping them regain confidence and mental clarity. For patients who can and are willing to take MHT, mental health practitioners using neurocounseling approach can work collaboratively with a woman’s medical healthcare provider who can prescribe MHT [1]. In this case, a combination of MHT along with neurocounseling presents a meaningful clinical pathway for the treatment of hormonal fluctuations, psychological implications, and neurological aspects of cognitive concerns among menopausal women. Women who are unable or unwilling to take MHT can also benefit from neurocounseling for symptom management and improved quality of life.
References
Maki PM, Jaff NG (2022) Brain fog in menopause: a health-care professional’s guide for decision-making and counseling on cognition. Climacteric 25(6): 570-578. [crossref]
Haver MC (2024) The new menopause: navigating your path through hormonal change with purpose, power, and facts. New York, Rodale Books.
Mosconi L, Berti V, Dyke J, Schelbaum E, Jett S, et al. (2021) Menopause impacts human brain structure, connectivity, energy metabolism, and amyloid-beta deposition. Scientific Reports;11(1): 10867. [crossref]
Mosconi L (2024) The menopause brain: new science empowers women to navigate menopause with knowledge and confidence. New York, Avery, an imprint of Penguin Random House.
Malone S (2024) Grown woman talk: your guide to getting and staying healthy. New York, Crown.
Refaei M, Mardanpour S, Masoumi SZ, Parsa P (2022) Women’s experiences in the transition to menopause: A qualitative research. BMC Women’s Health 22(1): 53-53. [crossref]
Gava G, Orsili I, Alvisi S, Mancini I, Seracchioli R, et al. (2019) Cognition, Mood and Sleep in Menopausal Transition: The Role of Menopause Hormone Therapy. Medicina 55(10): 668. [crossref]
Beeson ET, Field, TA (2017) Neurocounseling: A New Section of the Journal of Mental Health Counseling. Journal of Mental Health Counseling 39(1): 71-83. Available from: https://doi.org/10.17744/mehc.39.1.06
Goss D (2016) Integrating Neuroscience into Counseling Psychology: A Systematic Review of Current Literature. The Counseling Psychologist 44(6): 895-920.
Russell-Chapin LA (2016) Integrating Neurocounseling into the Counseling Profession: An Introduction. Journal of Mental Health Counseling 38(2): 93-102.
Lorelle S, Michel R (2017) Neurocounseling: Promoting Human Growth and Development Throughout the Life Span. Adultspan Journal 16(2): 106-119. Available From: https://doi.org/10.1002/adsp.12039
Marzbani H, Marateb HR, Mansourian M (2016) Neurofeedback: A Comprehensive Review on System Design, Methodology and Clinical Applications. Basic Clinical Neuroscience 7(2): 143-58. [crossref]
Hughes M (2023) Neuroplasticity-based multi-modal desensitization as treatment for central sensitization syndrome: A 3-phase experimental pilot group. Journal of Pain Management 16(1): 67-74.
Al-Thaqib A, Al-Sultan F, Al-Zahrani A, Al-Kahtani F, Al-Regaiey, K, et al. (2018) Brain Training Games Enhance Cognitive Function in Healthy Subjects. Medical Science Monitor. Basic Research 24: 63-69. Available From: https://doi.org/10.12659/MSMBR.909022
Currie H, Moger SJ (2019) Menopause – Understanding the impact on women and their partners. Post Reproductive Health 25(4): 183-190. [crossref]
In the pharmaceutical industry, a major challenge is ensuring consistent quality of finished products as the batch scale shifts from laboratory to pilot to commercial levels. This review article aims to provide insights into the current industry practices and understanding of scale-up calculations and factors involved in the production of oral solid dosage forms. Pharmaceutical manufacturing encompasses various unit operations for oral solid dosage forms, including blending, wet granulation, dry granulation via roller compaction, milling, compression, and coating processes such as Wurster and film coating. Each unit operation’s parameters significantly influence the final product’s quality. As batch sizes increase, it becomes crucial to control various process parameters strategically to maintain product consistency. This article discusses the application of scale-up and scale-down calculations throughout different stages of unit operations, highlights the importance of scale-up factors in technology transfer from pilot to commercial scales, and reviews the current methodologies and industry perspectives on scale-up practices.
Oral solid dosage forms are final drug products designed to be ingested orally. Once swallowed, these forms dissolve in the gastrointestinal tract and the active ingredients are absorbed into the bloodstream. Examples of oral solid dosage forms include powders, granules, tablets, capsules, soft gels, gummies, dispersible films, and pills. These dosage forms are preferred for several reasons: they are relatively easy to administer, they can be clearly distinguished from one another, and their manufacturing processes are well-established and understood. Among oral solid dosage forms, tablets and capsules are the most common. Both consist of an active pharmaceutical ingredient (API), also known as the drug substance, along with various excipients. The manufacturing process for these dosage forms involves several unit operations, including blending, wet granulation (using a rapid mixer granulator or fluid bed processor), dry granulation (via roller compaction), milling, compression, Wurster coating, and film coating [1,2].During the early stages of drug product development, formulations and processes are created using active pharmaceutical ingredients (APIs) and excipients to ensure the quality, safety, and efficacy of the final drug products at the laboratory scale [3]. Once this formulation is established, the process is scaled up from the laboratory to pilot and eventually to commercial scales [4,5]. Throughout this technology transfer, the laboratory-scale formulation is generally finalized and remains unchanged, while process parameters are adjusted. For instance, as the scale of the granulation container increases, both the powder weight and the sizes of components like the impeller and chopper, as well as operational parameters, may need adjustment. These changes can impact the quality of the finished product [6]. Successful scale-up relies on a thorough understanding of the process parameters and the ability to adjust them appropriately to maintain the same quality observed at the laboratory scale.
Successful scale-up of a manufacturing process hinges on a deep understanding of the fundamental principles and insights into each unit operation, which are derived from mechanical insights into the process. The Food and Drug Administration (FDA) has introduced the Quality by Design (QbD) approach to facilitate the efficient and timely production of high-quality pharmaceutical products [7,8]. According to the International Conference on Harmonisation (ICH) guidelines specifically ICH Q8 (Pharmaceutical Development), ICH Q9 (Quality Risk Management), and ICH Q10 (Pharmaceutical Quality System) the scale-up process should be conducted to ensure product quality in alignment with the QbD principles. To meet these regulatory requirements, it is essential to establish methods for reducing variability during scale-up through a systematic understanding of the manufacturing process and the application of the QbD approach [9]. This review examines the application of mathematical considerations in scale-up calculations and explores various methodologies used in scaling up different unit operations for oral solid dosage forms. It aims to provide a systematic strategy to ensure the quality of finished dosage forms in the pharmaceutical industry.
Methods
Scale Up Process Basic Understanding
Using scientific approaches and mathematical calculations for process scale-up or scale-down can significantly reduce the risk of failure, ensure regulatory compliance, and lower costs associated with trial batches. These calculations help to establish robust and realistic parameters for scaling up or down pharmaceutical formulations [10]. When scaling unit process parameters, key considerations include equipment size, shape, working principle, and associated parameters. According to process modeling theory, processes are deemed similar if they exhibit geometric, kinematic, or dynamic similarity.
Scale-Up Strategy for Oral Solid Dosage Forms
The manufacturing of oral solid dosage forms tablets and capsules involves several key unit operations such as blending, granulation, milling, tableting, Wurster coating and film coating. Each of these operations requires a carefully planned scale-up strategy to ensure product quality and process efficiency. Detailed overview of the scale- up strategy for each unit operation are discussed.
A) Blending/Mixing in Pharmaceutical Manufacturing
Blending is a critical unit operation in the manufacture of oral solid dosage forms (e.g., tablets and capsules). It ensures uniformity of the final product by mixing active pharmaceutical ingredients (APIs) with excipients. Equipment used in pharmaceutical blending unit operations are Double-Cone Blenders, Bin Blenders, Octagonal Blenders, V-Blenders and Cubic Blenders [11,12]. The blend should have a degree of homogeneity during blending to ensure the quality of solid dosage forms, such as tablets and capsules [13,14]. The blend homogeneity is influenced by several factors, such as material attributes (for example particle size distribution, particle shape, density, surface properties, particle cohesive strength) and process parameters (for example blender design, rotational speed, occupancy level, and blending time) [15]. These factors affect the agglomeration and segregation of the blend during the blending process, which affect the blend homogeneity. However, experiments with appropriate scale up calculations are sufficient to confirm changes in the agglomeration and segregation of the blend caused by these factors [16]. Scale up considerations and current industry practices in scale up calculations for blending unit operations are presented in Table 1a. Different types of blenders (Figure 1) such as Mass Blenders, Ribbon Blenders, V Cone Blenders, Double Cone Blender, Octagonal Blender, Drum Blender, Bin Blenders and Vertical Blenders, working principles, key factors and advantages are presented in Table 1b.
Table 1a: Process parameters, quality attributes, scale up considerations and industry practices for Blending unit operation.
Figure 1: Different types of Pilot/commercial scale model blenders used in pharmaceutical blending unit operation; 1. Mass Blenders; 2. Ribbon Blender; 3. V Cone Blenders; 4. Double Cone Blender; 5. Octagonal Blender; 6. Drum Blender; 7. Bin Blender; 8. Vertical Blender.
Table 1b: Different types of blenders in pharmaceuticals and its working principles, key factors and advantages.
B) Granulation in Pharmaceutical Manufacturing
Granulation is a crucial process in the pharmaceutical industry, particularly in the manufacture of solid dosage forms like tablets and capsules. It involves the formation of granules from a mixture of powders, which can improve the properties of the final product. Purpose of Granulation is to improve flow properties, enhance compressibility, reduce dust and improve uniformity [17,18]. Currently pharmaceutical industry adapted different types of granulation methods such as
i). Dry Granulation
Involves compressing powders into slugs or sheets and then milling them into granules. This method is used when the API is sensitive to moisture or heat. The process includes roller compaction and slugging. Typically roller compactors are used in dry granulation process.
ii). Wet Granulation
Involves adding a liquid binder to the powder mixture, which forms a wet mass that is then dried and sized into granules. This method typically includes preparation of binder solution, granulation, drying and sizing. Typically high shear rapid mixer granulators are used for wet granulation.
iii). Semi-Wet Granulation
A combination of wet and dry process involves in this granulation techniques, where a small amount of liquid binder is used, and the granules are only partially dried. Typically low shear fluid bed granulators are used in semi-wet granulation process.
i). Dry Granulation – Scale-Up Consideration and Industry Perspectives
Dry granulation is an alternative to both direct compression and wet granulation, particularly suited for active pharmaceutical ingredients (APIs) that are sensitive to moisture, have poor flow properties, or possess other physicochemical characteristics that are incompatible with direct compression or wet granulation. Unlike wet granulation, dry granulation does not involve the use of solvents or additional heating, which can introduce challenges related to physical or chemical stability, especially in formulations with amorphous solid dispersions or those prone to chemical degradation. Dry granulation offers several advantages over wet granulation, including a simpler process that is particularly beneficial for APIs that are sensitive to heat or water [19]. The two most commonly used methods for dry granulation are roller compaction and slugging.
Roller Compaction (RC) is a dry granulation technique that simultaneously densifies and agglomerates the powder blend to achieve increased packing density and granule size. In this process, the blend is compacted into ribbons using rollers, which are then milled into granules. Roller compaction reduces the risk of segregation, minimizes dust formation, and produces ribbons that can be processed into granules with improved flow properties. These granules are suitable for various subsequent processes, such as sachet filling, capsule filling, or tableting. Different scales and schematic representation of the roller compaction process is depicted in the Figure 2.
Figure 2: Different types of Roller compacters a) Lab scale model b) Pilot/Commercial Scale c) Schematic presentation of Roller Compactor.
Scaling up of roller compaction involves utilizing traditional large- scale experimental designs to optimize the dry granulation process. This approach can be time-consuming and resource-intensive. To streamline scale-up and minimize the number of experiments, it is crucial to have a deep understanding of the process parameters and the attributes of both the ribbons and granules produced [20]. Key process parameters for roller compaction include roll gap, roll pressure, feed screw speed, roll speed, and roller shape. These parameters must be carefully adjusted to achieve the desired granulation outcomes [21]. The quality of the ribbon, which is the primary product of the roller compaction process, is assessed based on several attributes like Ribbon Density (an indicator of how compacted ribbon is), Ribbon Strength (reflects the mechanical strength of the ribbon), Ribbon Thickness (Affects the granule size and uniformity), Young’s Modulus (Measures the ribbon’s elasticity and rigidity), Ribbon Shape (Impacts the subsequent granule formation), and Moisture Content (Ensures the ribbon’s stability and suitability for further processing). By focusing on these parameters and attributes, it is possible to optimize the roller compaction process effectively while reducing the need for extensive experimentation. The rolling theory for granular solids developed by Johanson describes the pressure distribution along the rolls considering the physical characteristics of the powder and the equipment geometry. The dimensionless number frequently used in roller compaction is determined based on the Johanson theory [22]. Johanson proposed a model that predicts the density of ribbons made by roller compaction using the nip area and the volume between the roll gaps. Johanson proposed distinguishing two regions between the rolls, (i) a slip region where the roll speed is faster than the powder and there is only rearrangement of the particles and (ii) a nonslip region where the powder gets trapped between the rolls and becomes increasingly compacted until the gap. The transition from slip to nonslip region is defined by the so-called nip angle. In the nonslip region, it is assumed that the powder behaves as a solid body being deformed as the distance between the rolls narrows down to the gap. It is further assumed that the deformation has only one axial component such that it can be idealized as uniaxial compression. One source of discrepancy between the predictions of Johanson’s and Reynolds’ model and the ribbon density measurements is the different compaction behaviour of the powder in the roller compactor compared to uniaxial compression tests [23,24] demonstrated that the roller compactor and a compaction simulator lead to different ribbon densities and built a model to account for that difference.
Rowe et al. extended Johanson’s model and proposed a modified Bingham number (Bm*) that represented the ratio of yield point to yield stress as follows:
Where Cs is the screw speed constant, 0 is pre consolidation factor, ρtrue is true density, is circumference of the roll circle, D is the roll diameter, W is roll width, SA roll is roll surface area, S is roll gap, NS is feed screw speed and NR is roll speed. Bm* is easy to determine because the input parameters of Bm*consist of those that can be generally measured in the compaction process. The model- predicted values and the actual test results from WP 120 Pharma and WP 200 Pharma (Alexander werk, Remscheid, Germany) models are shown. By maintaining Bm*, it was possible to obtain a consistent ribbon density between the two operating scales. It was suggested that Bm* can be effectively used for the development of roller compaction scale-up [25]. Case studies suggest that dimensionless numbers for the prediction of ribbon density in dry granulation processes can be used successfully during the Scale-up process (Table 2).
Table 2: Critical process parameters, quality attributes, scale up considerations and industry practices for Roller compaction unit operation.
ii). Wet Granulation – Scale-Up Consideration and Industry Perspectives
Wet granulation is a key process in pharmaceutical manufacturing used to produce granules from powders by incorporating a liquid binder (Figure 3).
Figure 3: Different types of wet granulation process equipments used in pharmaceutical development a) Lab model rapid mixer granulator b) Pilot/Commercial scale rapid mixer granulator.
This process is crucial for ensuring that the final granules exhibit desirable properties such as uniformity, good flowability, and compressibility [26]. The choice of equipment for wet granulation includes high-shear Rapid mixer granulators (RMG) and low shear fluid bed granulators (FBG). RMG involves mixing powders with the binder in a high-shear environment. The impeller and chopper facilitate the formation of granules by applying mechanical forces. FBG involves spraying the binder solution onto the powder bed in a fluidized state. The fluidized bed aids in the uniform distribution of the binder and granule formation. Granulation Process involves the dry powders, including the active pharmaceutical ingredient (API) and excipients (e.g., fillers, disintegrants, lubricants), are blended to ensure a uniform distribution. The blended powders are loaded into the high-shear granulator’s mixing bowl. The liquid binder (e.g., water, ethanol, or polymer solution) is sprayed onto the powder bed. This binder helps in forming granules by adhering powder particles together. The impeller rotates on a horizontal plane, creating a high-shear environment that facilitates mixing and initial granule formation. The chopper, rotating either vertically or horizontally, breaks up large lumps and ensures the uniform size of granules by cutting and mixing [27]. Granulation end point determined by the granules continue to grow as the binder is added until they reach the desired size and consistency. The process is typically monitored to ensure that granules are not over granulated or under-granulated. The process is carefully controlled by adjusting parameters such as binder addition rate, impeller speed, and chopper speed. A predefined endpoint, based on granule size or moisture content, is set to determine when the granulation is complete. Scaling up a Rapid Mixer Granulator (RMG) involves translating process parameters from a smaller, laboratory-scale unit to a larger, production-scale unit while maintaining the desired granule quality and consistency (Table 3a and 3b). This process requires careful consideration of equipment design, power requirements, and process parameters. Below tabulated are the guide to some common scale-up calculations for RMG.
Table 3a: Critical process parameters, quality attributes, scale up considerations for RMG granulation unit operation.
Table 3b: Scale up considerations and industry practices for RMG granulation unit operation.
iii). Semi-Wet Granulation – Scale-Up Consideration and Industry Perspectives
Fluid Bed Processor (FBP) for granulation operates by passing hot air at high pressure through a distribution plate located at the bottom of the container, creating a fluidized bed of solid particles. This fluidized state, where particles are suspended in the air, facilitates drying. Granulating liquid or coating solutions are sprayed onto these fluidized particles through a spray nozzle, followed by drying with hot air. The fluidized bed processor operates on the principle of fluidization, where a gas (typically air) is passed through a bed of solid particles at a velocity sufficient to suspend the particles in the gas stream. Air is introduced through a perforated plate or distributor at the bottom of the bed, and as it flows upwards, it lifts the particles, making them behave like a fluid. During fluidization, various processes can be carried out: a binder solution or melt is sprayed onto the particles, causing them to agglomerate; hot air removes moisture from the particles; and a coating solution is applied, which is then dried. The air, now carrying moisture or coating material, exits through the top of the bed. Scaling up a FBP in the pharmaceutical industry involves several calculations and considerations to ensure that the process can be effectively transitioned from a laboratory or pilot scale to full- scale production [28,29]. The process must maintain product quality, efficiency, and compliance with regulatory standards. Here’s a detailed guide on scale-up calculations and key factors for Fluidized Bed Processors. Scaling up a FBP involves maintaining similar fluidization conditions and process outcomes as in smaller scales. Key principles include maintaining the same fluidization regime, similar granulation or coating characteristics, and ensuring that drying or granulation efficiency scales proportionally (Table 4).
Table 4: Scale up considerations and industry practices for FBP granulation.
C) Compression in Pharmaceutical Manufacturing
Tablet compression is a critical process in pharmaceutical manufacturing that involves transforming powdered or granulated substances into solid tablets (Figure 4).
Figure 4: Different types of compression machines used in pharmaceutical development a) Lab model Single Punch Tablet Press and b) Pilot/commercial Scale Single Rotary Tablet Press.
Compression is a critical and challenging step in tablet manufacturing. The way a powder blend is compressed directly impacts tablet hardness and friability, which are crucial for dosage form integrity and bioavailability. While the tablet press is essential for the compression process, the preparation of the powder blend is equally important to ensure it is suitable for compression. Understanding the physics and principles of the compression process is vital for managing these operations effectively. For high-dose or poorly compressible drugs, the study of compression becomes particularly important, especially when the relationship between compression force and tablet tensile strength is non-linear. A thorough grasp of compression dynamics also helps resolve many tableting issues, which often stem from various compression-related factors [30,31].
Compression Cycle
Understanding the different stages of the compression cycle is essential for comprehending how powder materials are compacted into tablets. It also provides valuable insights into the various formulation and compression variables that impact the quality of the finished tablet. Compression cycle is divided into following 4 phases: Pre-compression, Main-compression, Decompression and Ejection.
Pre-compression
As the name implies, pre-compression is the initial stage where a small force is applied to the powder bed to create partial compacts before the main compression. This is typically achieved using a pre- compression roller that is smaller than the main compression roller. However, the size of the pre-compression roller and the level of pre- compression force can vary based on the properties of the material being compressed. For instance, powders that are prone to brittle fracture may require a higher pre-compression force compared to the main compression force to achieve increased tablet hardness. In contrast, elastic powders need a gradual application of force to minimize elastic recovery and allow for stress relaxation. Optimal tablet formation is often achieved when the sizes of the main and pre- compression rollers and the forces applied are similar.
Main Compression
During the main compression phase, inter particulate bonds are formed through particle rearrangement, which is followed by particle fragmentation and/or deformation. For powders with viscoelastic properties, special attention to compression conditions is necessary, as these conditions significantly influence the material’s compression behavior and the overall tableting process.
Decompression
After the compression phase, the tablet experiences elastic recovery, which introduces various stresses. If these stresses exceed the tablet’s ability to withstand them, structural failures can occur. For instance, high rates and degrees of elastic recovery may lead to issues such as tablet capping or lamination. Brittle fractures can also occur if the tablet undergoes brittle fracture during decompression. To alleviate stress, plastic deformation, which is time-dependent, can occur. The rate of decompression also influences the potential for structural failure. Therefore, incorporating plastically deforming agents, such as PVP or MCC, is recommended to enhance the tablet’s ability to handle these stresses.
Ejection
Ejection is the final stage of the compression cycle, involving the separation of the tablet from the die wall. During this phase, friction and shear forces between the tablet and the die wall generate heat, which can lead to further bond formation. To minimize issues such as capping or laminating, lubrication is often used, as it reduces ejection forces. Powders with smaller particle sizes typically require higher ejection forces to effectively remove the tablets from the die. Industry perspective is to overall understanding the theoretical aspects of compression helps in selecting the optimal compression conditions for a given tablet product and at the same time can avoid the potential tableting problems thus saving significant time and resources.
D) Wurster Coating in Pharmaceutical Manufacturing
The Wurster fluid bed coating technique is renowned for its versatility and efficiency in coating applications [32]. This method is distinguished by its rapid heat and mass transfer capabilities and its ability to maintain temperature uniformity. Unlike traditional fluidized bed coating, which uses a more straightforward approach, the Wurster method employs a nozzle located at the bottom of a cylindrical draft tube to spray the coating solution. Particles are circulated through this tube, periodically passing through the spraying zone where they encounter fine droplets of the coating solution. This circulation not only ensures thorough mixing but also provides precise control over particle movement and coating quality. Wurster Coating Process is extensively utilized in the pharmaceutical industry for coating powders and pellets. Wurster systems can handle batch sizes ranging from 100 grams to 800 kilograms. This process is ideal for coating particles as small as 100 µm up to tablets. The Wurster coating chamber is typically slightly conical and features a cylindrical partition about half the diameter of the chamber’s bottom. At the base of the chamber, an Air Distribution Plate (ADP), also known as an orifice plate, is installed. The ADP is divided into two areas: the open region beneath the Wurster column, which allows for greater air volume and velocity, and the more restricted areas. As air flows upward through the ADP, particles move past a spray nozzle positioned centrally within the up- bed region of the ADP. This nozzle, which is a binary type, has two ports: one for the coating liquid and one for atomized air. The nozzle creates a solid cone spray pattern with a spray angle of approximately 30-50°, which defines the coating zone. The region outside the cylindrical partition is referred to as the down-bed area. The choice of ADP is based on the size and density of the material being coated. The height of the column regulates the horizontal flow rate of the substrate into the coating zone. As the coating process progresses and the mass of the material increases, the column height is adjusted to maintain the desired pellet flow rate.
Scaling up the Wurster coating process involves increasing the equipment size to handle larger batch capacities, ranging from small lab-scale units to industrial-scale machines (Figure 5).
Figure 5: Different types of Wurster coating equipments used in pharmaceutical development a) Lab model b) Pilot/Commercial scale model.
Larger systems require careful design to maintain consistent coating quality and process efficiency. Equipment dimensions, including the height and diameter of the coating chamber and the size of the Air Distribution Plate (ADP), must be scaled proportionally to ensure effective particle fluidization and coating (Table 5).
Table 5: Scale up considerations and industry practices for Wurster coating.
As batch size increases, maintaining optimal airflow dynamics becomes crucial. The airflow rate, velocity, and distribution must be adjusted to ensure uniform coating. Larger systems may require modifications to the ADP to accommodate increased air volume and maintain desired particle circulation and spray pattern. The configuration of spray nozzles needs to be scaled to match the increased batch size. Ensuring consistent liquid atomization and spray pattern is essential to achieve uniform coating thickness. In larger systems, multiple nozzles may be used to cover the expanded coating zone. Process parameters such as temperature, airflow, and coating solution viscosity must be carefully calibrated. Industry perspectives as scale- up introduces more variables, precise control of these parameters is necessary to maintain coating uniformity and avoid issues such as over or under coating. Scaling up involves adjustments in material handling to accommodate the larger volume and ensure smooth transfer and processing of the particles. This includes considerations for feeding systems, particle flow control, and uniform distribution within the coating chamber.
E) Film Coating in Pharmaceutical Manufacturing
Film coating is a widely used technique in pharmaceutical manufacturing to apply a thin layer of coating material onto tablets, and other dosage forms (Figure 6).
Figure 6: Different types of Film coating equipment used in pharmaceutical development a) Lab model and b) Pilot/commercial Scale film coating equipment.
This coating process enhances the appearance, improves the stability, and controls the release of active ingredients in pharmaceutical products. Different film coating formulations can be used to achieve controlled or modified-release properties. This allows for the gradual release of the drug over time, improving therapeutic outcomes and patient compliance. Film coatings can improve the appearance of dosage forms, making them more appealing to patients. Additionally, they can mask the taste of unpleasant drugs, making oral administration more acceptable [33]. Choosing the wrong film coating equipment or using subpar technology can lead to significant film coating defects. These defects can greatly affect the quality, efficacy, and appearance of pharmaceutical products. It’s essential to identify and address these issues to maintain product integrity and ensure compliance. Below is an overview of common film coating defects and their potential causes, as detailed in Table 6a. Scaling up of film coating processes in pharmaceutical manufacturing involves several important considerations to ensure that the coating process remains effective and consistent as production volumes increase Table 6b.
Table 6a: Pharmaceutical film coating defects, route cause and remedial action.
Table 6b: Scale up considerations and industry practices for Film coating.
Current Industry Persepctives
Current industry perspectives on scale-up calculations emphasize a comprehensive understanding of both the scientific and operational aspects of production. By leveraging the scale up calculations, advanced methodologies such as Design of Expert (DoE) and quality by design (QbD), along with a keen focus on cost, equipment selection, and regulatory compliance, pharmaceutical companies can navigate the complexities of scaling up oral solid dosage forms effectively. Adapting to technological advancements and maintaining a proactive approach to risk management will be crucial for success in an increasingly competitive landscape.
Conclusion
The scale-up of oral solid dosage forms (OSDFs) is a critical phase in pharmaceutical development that directly influences product quality, regulatory compliance, and market success. The successful scale-up of OSDFs is a multifaceted challenge that requires strategic planning and execution. By focusing on these critical factors integrated processes, quality assurance, economic considerations, regulatory compliance, technological advancements, risk management, and continuous improvement pharmaceutical industries can enhance their chances of delivering high-quality products to the market. As the industry evolves, maintaining a forward-thinking approach will be essential for navigating complexities and ensuring sustainable success in a competitive landscape.
Conflicts of Interest
The authors declare no conflict of interest
Acknowledgement
Authors acknowledge Dr. Sudhakar Vidiyala, Managing Director, Ascent Pharmaceuticals Inc. for his support and encouragement in writing this review article.
References
Eun HJ, Yun SP, Min-Soo K, Hyung DC (2020) Model-Based Scale-up Methodologies for Pharmaceutical Granulation. Pharmaceutics 12. [crossref]
Doodipala N, Palem CR, Reddy S, Madhusudan RY (2011) Pharmaceutical development and clinical pharmacokinetic evaluation of gastroretentive floating matrix tablets of levofloxacin. Int J Pharm Sci Nanotech 4: 1461-1467.
Raval N, Tambe V, Maheshwari R, Pran KD, Rakesh KT (2018) Scale-Up Studies in Pharmaceutical Products Development. In Dosage Form Design Considerations; Academic Press: Cambridge, MA, USA.
Amirkia V, Heinrich M (2015) Natural products and drug discovery: A survey of stakeholders in industry and academia. Frontiers in Pharmacology 6. [crossref]
Morten A, Rene H, Per H (2016) Roller compaction scale-up using roll width as scale factor and laser-based determined ribbon porosity as critical material attribute. Eur J Pharm Sci 87: 69-78. [crossref]
Mazor A, Orefice L, Michrafy A, Alain DR, Khinast JG (2018) A combined DEM & FEM approach for modelling roll compaction process. Powder Technol 337: 3-16.
Vladisavljevi´c GT, Khalid N, Neves M A, Kuroiwa T, Nakajima M, et al. (2013) Industrial lab-on-a-chip: Design, applications and scale-up for drug discovery and delivery. Adv. Drug Deliv Rev 65(11-12): 1626-1663. [crossref]
U.S: Food and Drug Administration. Pharmaceutical cGMPS for the 21st Century – A Risk-Based Approach: Second Progress Report and Implementation Plan. FDA website. Drugs section 2003.
Mahdi Y, Mouhi L, Guemras N, Daoud K (2016) Coupling the image analysis and the artificial neural networks to predict a mixing time of a pharmaceutical powder. J Fundam Appl Sci 8: 655–670.
Moakher M, Shinbrot T, Muzzio FJ (2000) Experimentally validated computations of flow, mixing and segregation of non-cohesive grains in 3d tumbling blenders. PowderTechnol 109: 58-71.
Cleary PW, Sinnott MD (2008) Assessing mixing characteristics of particle-mixing and granulation devices. Particuology 6: 419-444.
Mendez ASL, Carli de G, Garcia CV (2010) Evaluation of powder mixing operation during batch production: Application to operational qualification procedure in the pharmaceutical industry. Powder Technology 198: 310–313.
Arratia P.E, Duong N h, Muzzio F.J, Godbole P, Lange A, et al. (2006) Characterizing mixing and lubrication in the bohle bin blender. Powder Technol 161: 202–208.
Adam S, Suzzi D, Radeke C, Khinast JG (2011) An integrated quality by design (QbD) approach towards design space definition of a blending unit operation by discrete element method (DEM) simulation. Eur J Pharm Sci 42: 106-115. [crossref]
Palem CR, Gannu R, Yamsani SK, Yamsani VV, Yamsani MR (2011) Development of bioadhesive buccal tablets for felodipine and pioglitazone in combined dosage form: in vitro, ex vivo, and in vivo characterization. Drug delivery 18: 344-352. [crossref]
Teng Y, Qiu Z, Wen H (2009) Systematic approach of formulation and process development using roller compaction. Eur J Pharm Biopharm 73: 219-229. [crossref]
Kleinebudde P (2004) Roll compaction/dry granulation: Pharmaceutical applications. Eur J Pharm Biopharm 58: 317-326.
Gago AP, Reynolds G, Kleinebudde P (2018) Impact of roll compactor scale on ribbon density. Powder Technol 337: 92-103.
Johanson J (1965) A rolling theory for granular solids. JApplMech 32(4): 842-848.
Reynolds G, Ingale R, Roberts R, Kothari S, Gururajan B (2010) Practical application of roller compaction process modeling. Comput Chem Eng 34: 1049–1057.
Reimer HL, Kleinebudde P (2018) Hybrid modelling of roll compaction processes with the Styl’One Evolution. Powder Technol 341: 66–74.
Rowe JM, Crison JR, Carragher TJ, Vatsaraj N, Mccann RJ, et al. (2013) Mechanistic Insights into the Scale-Up of the Roller Compaction Process: A Practical and Dimensionless Approach. J Pharm Sci 102: 3586-3595. [crossref]
Rambali B, Baert L, Massart D L (2003) Scaling up of the fluidized bed granulation process. Int J Pharm 252: 197-206. [crossref]
Victor EN, Ivonne K, Maus M, Andrea S Daniela S (2021) A linear scale-up approach to fluid bed granulation. Int J Pharm 598: 120-209. [crossref]
Patel S, Kaushal AM, Bansal AK (2006) Compression Physics in the Formulation Development of Tablets. Critical Reviews TM in Therapeutic Drug Carrier Systems 23: 1-65. [crossref]
Mohan S (2012) Compression Physics of Pharmaceutical Powders: A Review. Int J ofPharm Sci and Research 3: 1580-1592. [crossref]
Teunou E, Poncelet D (2002) Batch and continuous fluid bed coating – review and state of the art. Journal of Food Engineering.
Ahmad S (2022) Pharmaceutical Coating and Its Different Approaches, a Review. Polymers 14. [crossref]
Tobacco use remains a global health problem. It is the leading cause of preventable death. It causes and/or exacerbates many diseases, including cancer, COPD, cardiovascular disease, HIV infection and tuberculosis. All of these diseases are major public health challenges for the 21st century and require tobacco control efforts. Smoking cessation is an essential component in the treatment of smoking-related diseases. It improves patients’ quality of life and life expectancy, reduces respiratory decline, the risk of cardiovascular disease and HIV mortality, and contributes to the cure of tuberculosis. Healthcare professionals need to be involved in tobacco control and effective, evidence-based smoking cessation strategies.
Keywords
Smoking, Cancer, Cardiovascular, HIV infection, COPD, Tuberculosis
Introduction
In 2022, over 20% of the global population smoked. Despite a decline in smoking prevalence, it remains a major global health issue, responsible for over 8 million deaths including 1.3 million non-smokers, a year [1]. There is a clear link between tobacco use and a range of health problems, including cancer, COPD, maladies cardiovasculaires, HIV infection, tuberculosis (TB). Tobacco control is essential to address these issues.
Cancer, COPD, HIV Infection, Cardiovascular Disease, TB and Smoking
Cancer
The International Agency for Research on Cancer (IARC) [2] has recorded 20 million new cancer cases and 9.7 million cancer deaths in 2023. Smoking is a major risk factor for cancer, especially lung cancer (12.4% of all new cancer cases and 18.7% of all cancer deaths). The incidence of lung cancer is increasing worldwide and may increase by 47% between 2020 and 2040 [3].
Chronic Obstructive Pulmonary Disease (COPD)
It affects 10.3% of the global population, accounts for 4.7% of annual global mortality and has a significant economic burden. COPD is characterized by progressive, partially reversible airflow limitation caused by chronic inflammation of the airways. Smoking is the major risk factor for COPD [4].
Cardiovascular Disease
It is a leading cause of death, with nearly two million deaths annually attributed to smoking-related heart disease, including myocardial infarction, stroke, abdominal aortic aneurysm, and peripheral arterial disease. Smoking is a major risk factor for acute cardiovascular events, with smokers more at a younger age [5].
HIV Infection
39.9 million people worldwide are living with HIV; 630,000 die each year and 1.3 million are newly infected. The advent of antiretroviral therapy has reduced AIDS-related mortality, but the proportion of deaths from non-AIDS diseases has increased. Smoking is prevalent in this population; it causes cardiovascular and pulmonary (e.g. COPD, lung cancer) diseases and reduces life expectancy of life in patients [6-8].
Tuberculosis
In 2023, 7.5 million new cases of tuberculosis (TB) were diagnosed. TB was responsible for 1.3 million deaths, and 410,000 people developed multidrug-resistant or rifampin-resistant tuberculosis. Over 80% of TB cases and more than 90% of deaths occur in low- and middle-income countries. The main drivers of the TB epidemic remain the spread of HIV and the emergence of drug-resistant TB; however, tobacco use is estimated to account for 17.6% of TB cases and 15.2% of TB-related deaths in high-incidence countries [9,10]. Smoking (active or passive) increases the risk of tuberculosis infection, progression to TB disease, mortality and recurrence [11].
Stopping Smoking and Tobacco Control
Stopping Smoking: Component of Treatment for Smoking- related Diseases
Smoking is the leading cause of cancer, particularly lung cancer, but quitting improves the quality of life and life expectancy of cancer patients. It reduces the decline in lung function, the frequency of COPD exacerbations, the risk of death in patients with cardiovascular disease or HIV infection, but improves the prognosis of tuberculosis and adherence to anti-tuberculosis treatment [12]. Therefore, health professionals need to help smokers quit with evidence-based smoking cessation interventions [13,14].
Tobacco Control: Public Health Priority
The WHO Framework Convention on Tobacco Control (FCTC) [15], adopted by over 190 countries, aims to protect present and future generations from the health, social, environmental and economic consequences of tobacco consumption and exposure to tobacco smoke. It provides a framework for a global tobacco control strategy to reduce smoking prevalence and exposure to tobacco smoke.
Conclusion
Tobacco use is a major cause of many diseases with a significant impact on public health. Tobacco control has become a major public health issue that must mobilise governments and all healthcare providers.
Conflict of Interest
The authors have no conflict of interest to declare
References
WHO global report on trends in prevalence of tobacco use 2000–2030. Geneva: World Health Organization; 2024
Ferlay J, Ervik M, Lam F, Laversanne M, Colombet M, Mery L, Piñeros M, Znaor A, Soerjomataram I, Bray F (2024) et.al. Global Cancer Observatory: Cancer Today. Lyon, France: International Agency for Research on Cancer.
Sung H, Ferlay J, Siegel RL, Laversanne M, Soerjomataram I, Jemal A, et al. Global Cancer Statistics 2020: GLOBOCAN Estimates of Incidence and Mortality Worldwide for 36 Cancers in 185 Countries. CA Cancer J Clin. 2021 [crossref]
Global strategy for prevention, diagnosis and management of COPD (GOLD Report, 2024 update).
Benowitz NL, Liakoni E. Tobacco use disorder and cardiovascular health. Addiction. 2022 [crossref]
The path that ends AIDS: UNAIDS Global AIDS Update 2023. Geneva: Joint United Nations Programme on HIV/AIDS; 2023.
Vidrine DJ. Cigarette smoking and HIV/AIDS: health implications, smoker characteristics and cessation strategies. AIDS Educ Prev. 2009 [crossref]
Konstantinidis I, Crothers K, Kunisaki KM, Drummond MB, Benfield T, Zar HJ, Huang L, Morris A. HIV-associated lung disease. Nat Rev Dis Primers. 2023 [crossref]
Global tuberculosis report 2023. Geneva: World Health Organization; 2023.
Zellweger JP, Cattamanchi A, Sotgiu G. Tobacco and tuberculosis: could we improve tuberculosis outcomes by helping patients to stop smoking? Eur Respir J. 2015 [crossref]
Perriot J, Peiffer G, Underner M. Smoking and tuberculosis. RevPrat.2024 [crossref]
WHO Tobacco: Health benefits of smoking cessation. World Health Organization; 2020.
Nian T, Guo K, Liu W, Deng X, Hu X, Xu M, et al. Non-pharmacological interventions for smoking cessation: analysis of systematic reviews and meta-analyses. BMC Med. 2023 [crossref]
Lindson N, Theodoulou A, Ordóñez-Mena JM, Fanshawe TR, Sutton AJ, Livingstone- Banks J, et al. Pharmacological and electronic cigarette interventions for smoking cessation in adults: component network meta-analyses. Cochrane Database Syst Rev. 2023 [crossref]
WHO Framework Convention on Tobacco Control. World Health Organization, 2003; updated reprint, 2004, 2005.
The paper presents a four-step process for using generative AI to solve a problem, such as motivating young people to apply for a police job in a small town. Step 1 is a simulated town hall meeting to discuss the local population’s responses and issues with school safety. Step 2 is the simulated open house meeting, where AI simulates a meeting to encourage volunteering for a career in local law enforcement. Step 3 simulates four different mind- sets among potential recruits for police office and police-school officer roles. Step 4 presents a set of questions and synthesizes the four answers to each question based upon AI’s simulation of the response of each mind-set. The paper shows the power of AI to become a colleague and “knowledge worker.”
Keywords
Generative AI, Mind genomics, Police recruitment, Synthesized mind-sets
Introduction
The negative perception of law enforcement among young people is a significant factor in their decision to pursue careers in the police force. The perceived risks, challenges, and long hours can deter candidates who seek more stable and less stressful careers. This leads to fewer candidates and, in turn, to issues in meeting demands for salaries, benefits, and additional training. It should come as no surprise that the overall pool of qualified candidates may continue to shrink, making it difficult for police departments to fill vacant positions and maintain adequate staffing levels [1].
To address this issue, police chiefs should reassess recruitment strategies and identify potential barriers to attracting young people to law enforcement careers. This may involve reaching out to local schools and community organizations, offering internship programs, mentorships, and career development opportunities, and engaging young people about the benefits and opportunities of becoming a police officer [2].
To address the topic, this paper presents four strategies using generative AI as a coach and mentor. The generative AI, ChatGPT 3.5, enables the user to simulate and synthesize situations and solutions in a short time, develop insights, and then validate these insights using empirical research. As such, the paper constitutes a “vade mecum,” a guide to how one might approach this vexing problem, doing so with generative AI in a matter of 24 hours, at low cost, with the opportunity of developing critical insights about the topic along with testable suggestions.
As technology advances and automation replaces traditional jobs, the need for skilled and dedicated workers in critical roles like law enforcement becomes even more pronounced. To solve this problem, generative AI can be used to analyze and understand the underlying factors driving young people’s decisions to pursue or avoid careers in law enforcement. This data-driven approach will enable tailoring messaging, training programs, and support systems to better meet the needs and expectations of prospective candidates, ultimately increasing recruitment success.
The immediate and severe issues regarding staffing in law enforcement was brought home in an example of a town, called here TOWNX. The challenge was put forward to use a combination of generative AI and human research to address the problem. Could a system be created which could address some of the seemingly impossible-to-solve problems?
This paper presents the synthesized approach to ameliorating some of the problem, although the problem may be far from actually solvable in its entirety. Nonetheless, the structure generated here emerged with the help of generative AI (specifically ChatGPT 3.5), along with the emerging science of Mind Genomics. The paper is presented as a “work in progress,” but which can be used immediately.
The actual paper comprises four different strategies. The first two strategies deal with the reports of “meetings,” and are meant to simulate what happened, giving the reader a sense of what is going on. The second two strategies deal with mind-sets of individuals who are the likely candidates, and then questions given to these mind-sets, and how each mind-set answers the same question.
Strategy 1
The town hall meeting to discuss how the local population “came up” with answers. This strategy is based upon the book Looking Backward by author Edward Bellamy, where the forecast of what would happen in the future is written as a historical account of what had already happened.
Strategy 2
The open house meeting, where the focus was on the simulation of a meeting held to help drive volunteering to become a police officer. The vision here was to get AI to bring the reader below the surface, to discuss questions — what they really mean and how candidates might be thinking about these questions — and issues dealing with recruitment.
Strategy 3
Simulating mind-sets. The AI was told that there exist different mind-sets among the potential recruits for the police office and police-school officer roles. The AI synthesized four different possible mind-sets and provided relevant insights into the mind-sets.
Strategy 4
Creating questions about the job and then generating likely answers that each of the four simulated mind-sets would give to the same question. These are the four mind-sets used in Strategy 3. It will be the questions and answers in Strategy 3 that will be used for the empirical Mind Genomics project and reported as an accompanying paper.
Strategy 1 — A Simulated Town Meeting
A simulated town meeting with generative AI can foster creativity and innovation by providing a platform for brainstorming and idea generation. The AI can introduce new perspectives and ideas that human participants may not have considered, leading to novel solutions. Additionally, the AI can facilitate real-time collaboration and idea sharing, enabling participants to build upon each other’s thoughts and concepts. By stimulating creative thinking and encouraging out-of-the-box solutions, the simulated town meeting with generative AI can inspire innovative approaches to complex problems.
A simulated town meeting could involve a diverse group of people coming together to discuss various problems and brainstorm potential solutions. The goal is to encourage open communication, collaboration, and creativity to address complex issues facing the community. By creating a space where everyone’s opinions are heard and valued, there is the hope that innovative ideas will emerge, and practical solutions will be developed.
One potential strategy within a simulated town meeting could be to introduce generative AI that is programmed to simulate discussions about different problems and propose solutions as if they were already solved. This could help stimulate thought and generate new perspectives that human participants may not have considered on their own. The value of having AI generate solutions lies in its ability to generate ideas quickly and without bias. The AI can analyze vast amounts of data and information to offer potential solutions that may not have been considered by human participants.
However, the lack of human creativity and intuition could be a weakness of this approach. While the AI is capable of generating solutions based on existing data and knowledge, it may struggle to come up with truly innovative or groundbreaking ideas that require a high degree of creativity. Human intuition and gut instincts play a crucial role in problem-solving by guiding decision-making processes and identifying opportunities that may not be apparent through data analysis alone. By relying solely on AI-generated solutions, there is a risk of missing out on the unique insights and perspectives that human creativity can offer.
Despite the potential limitations, a simulated town meeting utilizing generative AI has the potential to be a powerful tool for problem-solving. By leveraging the strengths of AI technology, such as quick data analysis and innovative idea generation, participants can benefit from a more efficient and effective problem-solving process. This approach can help foster collaboration, creativity, and diverse perspectives within the community, ultimately leading to more sustainable and impactful solutions.
Table 1 shows how the AI was prompted. Table 2 shows the summary of eight interchanges at the simulated town hall meeting.
Table 1: Prompting the AI to simulate a town hall meeting to discuss the problem.
Table 2: Part of the summarization of the town hall meeting, showing 11 different suggested topic areas, suggested by AI-created individuals assumed to have participated. The essence of the idea is shown in bold letter.
Strategy 2 — The Open House to Identify Ways to Encourage People to Volunteer
This second strategy focuses directly on using AI to provide interesting ideas to attract prospect candidates. Rather than solving a problem, as done in Strategy 1 above, the open house strategy focuses directly on the problem and how to solve it. Furthermore, this second strategy uses AI to simulate questions that would be given by the attendee, the importance of the question, as well as the motivating power of the answer. Even if the AI cannot really “dive” into the mind of the prospective candidate, the exercise itself provides a way to prepare oneself with a structured way to approach the necessary “back-and-forth” which can transform an audience member into a candidate. Table 3 shows the prompt given to the AI. Table 4 shows the AI results, comprising 14 questions along with the four answers to each question.
Table 3: Prompt given to the AI to simulate an open house devoted to recruiting.
Table 4: Results from the AI, showing 14 questions, and the four answers to each question provided by AI.
Strategy 3 — Using AI to Synthesize Mind-Sets Regarding Police Offers Specializing in School Safety
Generative AI is a powerful tool that can help companies identify the mind-sets of individuals interested in a specific job and create appealing slogans. By defining the task and asking AI to specify these mind-sets, companies can gain valuable insight into the potential target demographic for a particular job opportunity. The AI has the computational power to analyze vast amounts of data and come up with unique and innovative ideas that may not have been considered otherwise. Additionally, AI may be able to synthesize more nuanced aspects of mind-sets that are not easily quantifiable or represented in data. One potential benefit of using generative AI is that it can help companies better target their recruiting efforts by tailoring messaging to appeal to these synthesized mind-sets. The result would be more effective recruiting campaigns and ultimately result in finding the right candidates for the job. However, limitations to the effectiveness of generative AI in this context may include biases in the data used to train the AI model, which can result in inaccurate or skewed insights.
Table 5 shows the prompts given to the AI to generate mind-sets of individuals interested in a career or at least a job in school safety. Table 6 shows four mind-sets synthesized by AI for the professionalization in law enforcement and school safety.
Table 5: Prompts given to AI to generate mind-sets of individuals interested in a career or job in law enforcement and school safety.
Table 6: Four minds-sets synthesized by AI, interested in a career or least a job in law enforcement and school safety.
Strategy 4 — Have AI Generate Targeted Messaging Appropriate for Synthesized Mind-Sets and Then Test These Messages in Mind Genomics Studies with Target Age Respondents
Based on scientific principles of experimental psychology (psychophysics), statistics (experimental design, regression clustering), and consumer research (conjoint analysis), Mind Genomics ends up allowing the user to gain a deep and actionable understanding of human decision behavior, most important in the world of the everyday. Its rigorous, data-driven world view and methods provide a comprehensive analysis of the subject population for a topic, appropriate in our case for identifying key factors young individuals consider when choosing a career in law enforcement. By creating a unique profile of the target audience based on their responses to survey questions, Mind Genomics can reveal hidden patterns and trends in their thinking and decision-making processes. This helps a person or even a “chat bot” better connect with them on a personal level. In turn, the connection helps to create targeted messaging and recruitment campaigns which each alone and more strongly together, resonate with the specific needs and desires of young police officer recruits in Pennsylvania. The companion paper will show how Mind Genomics is used to evaluate the ideas generated in Strategy 4.
Strategy 4 provides a set of 21 questions, each with four answers, one answer from each mind-set. The objective of Strategy 4 is to show how a simple set of prompts (Table 7) end up creating a rich set of 21 questions and four answers to each question (Table 8). Table 8 was created in a matter of two iterations of Idea Coach in the BimiLeap. com platform, requiring less than a minute in total.
Table 7: The prompts used to create the questions and for each question four answers, one answer from each mind-set created and discussed in Table 6.
Table 8: The 21 questions created by AI, and for each question four suggested answers, one answer from each of the four mind-sets presented in Table 6.
Discussion and Conclusions
Generative AI has the potential to revolutionize the way individuals navigate their professional paths by providing creative and inventive solutions to common obstacles faced during the process of finding employment. By hosting town hall events or recruitment nights, individuals can openly discuss their professional goals and challenges, fostering a team effort to find solutions. Generative AI creates fresh perspectives which push the boundaries of conventional career paths, allowing the opportunity to explore unconventional ideas and find career paths that align with their passions and talents. Engaging in stimulating conversations with different AI-generated mind-sets can provide a diverse array of perspectives and valuable insights, broadening knowledge of different career possibilities and opening up new avenues for one’s future.
Generative AI also has the potential to completely transform the way we learn and create. Imagine a world where individuals can tap into the power of AI to generate new ideas, innovate, and discover their creative talents in ways they never thought possible. This technology opens up a whole new world of possibilities, inspiring people to think outside the box and pursue unconventional career paths previously deemed impossible.
Generative AI provides personalized learning experiences tailored to individual interests and preferences, sparking curiosity and igniting a passion for lifelong learning. Collaborating with AI to generate fresh ideas and explore new possibilities empowers people to unleash their creativity and think in innovative ways that were previously unimaginable.
In a future where generative AI is integrated into every aspect of our lives, it has the power to revolutionize the way we acquire knowledge, encouraging individuals to explore their creative side and venture into unconventional career paths. With generative AI as a guiding force, people can imagine new possibilities, dream bigger dreams, and pursue their passions with a newfound sense of purpose and excitement. One can only imagine what will emerge then, in terms of the practicalities of creating critical thinkers in school, and then having this critical thinking be part of the package one uses to create one’s job, and one’s future.
Acknowledgment
The authors would like to thank Vanessa Marie B. Arcenas and Isabelle Porat for their help in producing this manuscript.
Wilson JM (2012) Articulating the dynamic police staffing challenge: An examination of Supply and Demand. Policing: An International Journal of Police Strategies & Management 35(2).
Wilson JM and Miles-Johnson T (2024) The police staffing crisis: Evidence-based approaches Wilson JM (2012) Articulating the dynamic police staffing challenge: An examination of for building, balancing, and optimizing effective workforces. Policing: A Journal of Policy and Practice, 18.
Purpose: Climate change poses a significant threat to human health, particularly affecting the endocrine system. This study aims to explore the impact of climate change on various endocrine pathways and its implications for morbidity and mortality rates.
Methods: A review of literature was conducted to investigate the relationship between climate change and the endocrine system. Relevant databases were searched for studies on the effects of temperature changes, air pollution, and vector-borne diseases on hormone levels and endocrine health. Factors influencing the degree of impact, such as climate-related stressors and individual susceptibility, were also examined.
Findings: Climate change exerts a notable influence on the endocrine system, leading to hormone imbalances and increased mortality rates. Direct and indirect effects of climate change events, including temperature changes, air pollution, and vector-borne diseases, contribute to these disruptions. Certain components of the endocrine system, such as the adrenal gland, thyroid gland, HPA axis, and reproductive organs, are particularly vulnerable to environmental changes.
Implications: Understanding the mechanisms by which climate change affects endocrine disorders is crucial for addressing this global health issue. Efforts to mitigate the impact of climate change on human health should consider the specific vulnerabilities of the endocrine system and prioritize interventions to minimize morbidity and mortality associated with endocrine-related conditions.
Climate change, primarily caused by human activities like greenhouse gas emissions from power generation, manufacturing, and deforestation, results in significant alterations in weather patterns and temperatures. This has profound implications for public health, increasing morbidity and mortality due to extreme temperature conditions [1,2]. Recent research spanning from 2000 to 2019 indicates that approximately 5 million deaths worldwide can be attributed to non-optimal temperatures, with a substantial portion occurring in East and South Asia, highlighting regional disparities in climate change impacts [3]. Furthermore, environmental factors influenced by climate change can impact the endocrine system, potentially leading to disruptions in hormonal balance and the development of disorders. This paper will explore the multifaceted impact of climate change on human health, shedding light on both direct consequences, such as mortality, and indirect consequences related to endocrine disorders. By examining these connections, the goal is to deepen our understanding of the challenges posed by climate change in the global public health landscape and contribute to discussions on mitigating its adverse effects to safeguard public health.
This literature review provides a comprehensive analysis of the effects of climate change on the endocrine system, an area that remains relatively unexplored in current knowledge. By mixing the results of different published studies, we explore new insights into how climate-related stressors such as temperature fluctuations, air pollution, and vector-borne diseases disrupt hormonal balance and contribute to increased morbidity and mortality. Our approach shows the direct and indirect pathways through which climate change produces its impacts and provides a detailed understanding of the mechanisms involved in such processes. This research not only fills a major gap in the literature but also highlights the urgent need to address endocrine health in the context of climate change.
Climate Change
Climate Change Mechanisms and Human Health
Climate change encompasses significant alterations in regional and global climate over time. These changes affect various climate parameters; average and peak temperatures, humidity, precipitation, atmospheric pressure, water salinity, and the shrinking of mountain and polar glaciers [4]. In 2020, the global average surface temperature rose by 0.94 degrees Celsius compared to the average between 1951 and 1980. Projections suggest that by 2100, this average could increase by 4 degrees Celsius above the average recorded between 1986 and 2005, significantly surpassing previous projections [5]. The primary driver of Earth’s warming is the emission of greenhouse gases resulting from human activities, particularly methane and nitrous oxide. These gases retain warmth within the lower atmosphere, leading to temperature increases which leads to both short-term and long-term threats to human health and well-being.
Extreme Events
Sub-Optimal Temperatures
Extremes in temperatures, both low and high, increase mortality rates. Deaths from suboptimal temperatures were estimated to be 9.43% of total deaths worldwide from 2000 to 2019 [6]. Being exposed to high temperatures is linked with an increased likelihood of emergency department visits and hospital admissions because of cardiovascular, respiratory, and endocrine disorders [7-9], the exact temperature thresholds for these health impacts may not be explicitly stated in the cited literature (Figure 1).
Figure 1: Annual average excess deaths due to non-optimal temperature and regional proportion for 2000-19 by continent and region.
Blauw and colleagues’ research, investigating the relationship between fluctuations in outdoor temperature and the prevalence of diabetes mellitus in the USA from 1990 to 2009, demonstrated that for every 1-degree Celsius increase in outdoor temperature, there could be an association with more than 100,000 new cases of diabetes in the country, Blauw also proposes that brown adipose tissue (BAT) metabolism correlates with temperature, where lower temperatures lead to increased fatty acid metabolism by BAT and increased insulin sensitivity, the opposite is hypothesized to be true. More data is needed to understand the direct link between the two [10]. This aligns with the interconnected nature of climate change and diabetes, knowing that individuals with diabetes are at a higher risk of dehydration and cardiovascular events during extreme heat. Evidence has also shown that high temperatures can trigger behavioural and mental disorders, leading to an increase in cases of anxiety, depression, and suicidal attempts [11,12]. Schwartz’s analysis of 160,062 deaths in Wayne County, Michigan, among individuals aged 65 or older found that patients with diabetes faced a higher risk of mortality on hot days, highlighting the vulnerability of this demographic to heat stress [13]. Associations were also observed between daily maximum temperatures and visits to the Emergency Department in Atlanta, Georgia, for cases of internal diseases including diabetes, emphasizing broader health implications related to rising temperatures[14]. An analysis of 4,474,943 general practitioner consultations in Great Britain spanning from 2012 to 2014 indicated increased odds of seeking medical consultation linked to high temperatures [15]. Furthermore, the African continent faces a heightened risk of rising temperatures, as projections suggest increasingly severe heat extremes occurring over shorter durations. Kapwata et al.’s findings suggest potential temperature increases of 4-6 degrees Celsius for the African region during the period 2071-2100, posing heightened vulnerability to heat-related illnesses, especially among young children and the elderly [16]. Overall, these findings underscore the urgent need to tackle the intricate interplay among climate change, rising temperatures, and the heightened susceptibility to diabetes and associated health complications.
Wildfires
High temperatures and low precipitation increase the risk of wildfires, which can directly lead to burns, injuries, and premature deaths [17]. Compounds released during wildfires, such as benzene and free radicals, can have far-reaching consequences on human health. In fact, the exposure to environmental pollutants from wildfires can disrupt the endocrine system, leading to imbalances in hormonal regulation. Specifically, the released compounds may impact the functioning of the digestive, hematopoietic, and reproductive systems, creating a cascade effect that elevates the susceptibility to endocrine disorders [18].
Floods and Storms
Floods, instigated by heavy rainfall and elevating sea levels, are one of the most prevalent and devastating natural disasters. They lead to injuries and drownings and exacerbate the risk of water and vector-borne diseases like dengue, malaria, yellow fever, and West Nile virus [19,20]. Diabetic patients have altered immune responses to different pathogens and are at risk of developing severe infections leading to increased morbidity and mortality.
Air Pollution
Air pollution results in decreased lung function in both children and adults, exacerbating the symptoms of asthma and chronic obstructive pulmonary disease (COPD). In addition, several studies have shown an association between air pollution and insulin resistance, leading to a heightened risk of developing diabetes (Figure 2) particulate matter smaller than 2.5 um increases the probability of developing diabetes and exacerbates the risk of diabetes-related complications [21,22].
Figure 2: Pathophysiology of air pollution and insulin resistance.
Food Insecurities
Extreme weather events may lead to decreased crop production, which can in turn lead to famines and malnutrition of populations leading to increased risk of infectious diseases [23].
Vulnerable Populations in Healthcare
Climate change may impact a particular section of a community more due to risk factors in those individuals. The vulnerable population in a community i.e. poor, elderly, disabled, children, prisoners, and substance abusers encounter heightened levels of mental and physical stress as a result of exposure to natural disasters. Reviews have shown that social factors affecting vulnerable individuals have been correlated with more or less capacity to adjust to changing environmental conditions and natural disasters [24]. In the upcoming decades, disparities may intensify, not solely due to regional variations in environmental changes such as water scarcity and soil erosion, but also due to disparities in economic status, society, human capital, and political influence [25].
Impact of Climate Change on Endocrine Disorders
Climate change exerts multifaceted effects on environmental factors, including temperature, pollution, and exposure to chemicals, which contribute to endocrine disruption. The interplay between these elements underscores the intricacy of the correlation between climate change and endocrine health. Temperature fluctuations, altered seasons, and extreme weather events induced by climate change can have significant repercussions on endocrine health [26]. Furthermore, altered seasonal patterns can disrupt circadian rhythms, affecting the production and regulation of hormones critical for various physiological processes. Extreme weather events, such as heatwaves or hurricanes, may cause stress responses in the body, potentially influencing the endocrine system and contributing to hormonal imbalances [27]. Climate-induced changes in food availability, quality, and contaminants also play a pivotal role in influencing endocrine disorders. Shifts in temperature and precipitation patterns can affect crop yields and nutritional content, impacting the availability of key nutrients essential for hormonal balance. Additionally, climate change may lead to the introduction of new contaminants into the food chain, potentially disrupting endocrine function. Pesticides, pollutants, and other environmental chemicals can mimic or interfere with hormones, contributing to the development of endocrine disorders [28].
Endocrine Disorders
Specific Endocrine Disorders and Climate Change
Thyroid Dysfunction: Research by Brent et al. (2010) reported that environmental agents influencing the thyroid may also trigger autoimmune thyroid disease, which is often the cause of functional thyroid disorders. Detecting abnormal thyroid function associated with environmental exposure is commonly attributed to direct effects of agents and toxicants triggering autoimmune thyroid problems with consideration to factors like thyroid autoantibody status, iodine intake, smoking history, family history of autoimmune thyroid disease, pregnancy, and medication use. Recognition of thyroid autoimmunity as a contributing factor to changes induced by environmental agents is crucial in these studies, illuminating the pathogenesis of autoimmune thyroid disease and exploring the possible influence of environmental factors in its development, a broad range of environmental pollutants can interfere with thyroid function; many of which have direct inhibition of thyroid hormone or induce detectable high levels of TSH consequently. Other substances such as polychlorinated biphenyls (PCBs) have a thyroid hormone agonist effect [29]. Additionally, air pollutants with levels as low as PM2.5 have been associated with hypothyroidism. There is robust evidence of increased cardiovascular morbidity and mortality associated with subclinical hypothyroidism (Figure 3) [30].
Figure 3: Overview of endocrine system.
Diabetes: Ratter-Rieck et al. (2023) reported that individuals with diabetes face heightened susceptibility to the dangers posed by elevated ambient temperatures and heatwaves due to impaired responses to heat stress. This is of particular concern as the frequency of extreme heat exposure has risen in recent decades, coinciding with the growing number of people living with diabetes, which reached 536 million in 2021 and is expected to rise to 783 million by 2045 [31]. Furthermore, evidence has linked PM concentrations to increased oxidative stress, impaired endothelial function, and it is also suggested that PM alters coagulation and inflammation cascades via epigenetic disruption [32].
A Chinese study concluded that higher PM10 levels are associated with an increase in mortality short term with a 5% overall mortality rate from diabetes with high levels of PM10 [32].
Reproductive Disorders: The “Lancet Countdown on health and climate change: code red for a healthy future report for 2021” emphasizes on the critical health risks posed by climate change [33], affecting human health through food shortages, water quality reduction, displacement, and increased disease vectors. The effects can manifest directly, such as heat stress and exposure to wildfire smoke impacting cellular processes, or indirectly, resulting in vector-borne diseases, population displacement, depression, and violence. It underscores the discrepancies in exposures among various sociodemographic groups and pregnant individuals. Vulnerable populations, including women, lower-income individuals, pregnant women, and children are disproportionately affected. The mechanisms underlying these effects involve endocrine disruption, reactive oxygen species induction, DNA damage, and disruption of normal cellular functions [33].
Regulatory Mechanisms
The endocrine system is regulated by feedback mechanisms involving the hypothalamus, pituitary gland, and target organs [34-36]. The feedback mechanism can be either positive or negative, depending on the effect of the hormone on the target organ [36]:
– A negative feedback mechanism occurs when the original effect of the stimulus is reduced by the output [36].
– A positive feedback mechanism occurs when the original effect of the stimulus is amplified by the output [35].
The hypothalamic-pituitary axis involves the production of hormones by the hypothalamus, which either stimulate or suppress the release of hormones from the pituitary gland [34]. Consequently, the pituitary gland produces hormones that stimulate or inhibit the release of hormones from other endocrine glands [34]. The target organs produce hormones that provide feedback, either positive or negative, to the hypothalamus and pituitary gland to regulate hormone production (Table 1) [34].
Table 1: EDC Drugs: Site of Action and Organ Impact.
EDC Name
Target Organ
Hormones Effects
Phthalates
Thyroid
Reduced free and serum T4 Increased TSH
Perchlorate
Thyroid
Inhibited Iodine uptake Inhibited thyroid synthesis Reduced neonate cognitive function
Diabetes mellitus is a condition defined by high blood glucose levels. Type 1 diabetes mellitus results from autoimmune destruction of pancreatic β-cells whereas, type 2 diabetes mellitus is due insulin resistance. Severe hyperglycemia symptoms include excessive urination, thirst, weight loss, and blurred vision. Chronic hyperglycemia can impair growth, increase infection susceptibility, and lead to life-threatening conditions like ketoacidosis or hyperosmolar syndrome. Long-term complications of diabetes include retinopathy, nephropathy, peripheral and autonomic neuropathy, cardiovascular diseases, hypertension, and lipid metabolism abnormalities [37].
Diabetes can be diagnosed using plasma glucose criteria, which include either the fasting plasma glucose (FPG) value, the 2-hour plasma glucose (2-h PG) value during a 75-gram oral glucose tolerance test (OGTT), or A1C criteria.
Thyroid Disorders
Hyperthyroidism
Hyperthyroidism is characterized by excess thyroid hormone production. Causes include thyroid autonomy and Graves’ disease, which affects younger women and the elderly [38]. Symptoms of hyperthyroidism include heart palpitations, tiredness, hand tremors, anxiety, poor sleep, weight loss, heat sensitivity, and excessive sweating. Common physical observations include tachycardia and tremor [39]. Diagnostic measures involve assessing thyroid hormone levels: elevated free thyroxine (T4) and triiodothyronine (T3), alongside suppressed thyroid-stimulating hormone (TSH) [40]. Treatment often starts with thionamide and radioiodine therapy, the latter is preferred, especially in the US, considering pregnancy risks for women [38].
Hypothyroidism
Hypothyroidism is a thyroid hormone deficiency. It occurs more frequently in women, older individuals (>65 years), and white populations, with a higher risk in those with autoimmune diseases [41,42]. Symptoms of hypothyroidism include fatigue, cold intolerance, weight gain, constipation, voice changes, and dry skin. However, the clinical presentation varies with age, gender, and time to diagnosis. Diagnosis relies on thyroid hormone level criteria. Primary hypothyroidism is defined by elevated TSH levels and decreased free thyroxine levels, while mild or subclinical hypothyroidism, often indicating early thyroid dysfunction, is characterized by high TSH levels and normal free thyroxine levels [43]. Early thyroid hormone therapy and supportive measures can prevent progression to myxedema coma [43-45].
Polycystic Ovary Syndrome (PCOS)
PCOS is a prevalent endocrine disorder among females, affecting 5% to 15% of the population. Diagnosis requires chronic anovulation, hyperandrogenism, and polycystic ovaries with Rotterdam’s criteria incorporating two of these three features [46]. PCOS is often underdiagnosed, leading to complications like infertility, metabolic syndrome, obesity, diabetes, cardiovascular risks, depression, sleep apnea, endometrial cancer, and liver diseases. Management involves lifestyle changes, hormonal therapies, and insulin-sensitizing agents [47].
Adrenal Disorders
Cushing’s Syndrome
Cushing syndrome, also known as hypercortisolism, is a condition resulting from high cortisol levels, often due to iatrogenic corticosteroid use or herbal therapies [48]. It causes weight gain, fatigue, mood swings, hirsutism, and immune system impairment. Treatment options include tapering exogenous steroids, surgical resection, radiotherapy, medications and bilateral adrenalectomy for unresectable ACTH tumors [49].
Addison’s Disease (Primary Adrenal Insufficiency)
Addison’s disease is a rare but life-threatening adrenal insufficiency. It primarily impacts glucocorticoid and mineralocorticoid production and can manifest acutely during illnesses. It is more common in women aged 30-50 and is often linked to autoimmune conditions. There are two main types of Addison’s disease: primary adrenal insufficiency, where the adrenal glands themselves are damaged, and secondary adrenal insufficiency, where the dysfunction is due to a lack of stimulation from the pituitary gland or hypothalamus [50]. Diagnosis is challenging due to its variable presentation, and it can lead to an acute adrenal crisis with severe dehydration and shock [51].
Pheochromocytoma
Pheochromocytomas are rare, benign tumors in the adrenal medulla or paraganglia, often causing symptoms like high blood pressure, headaches, heart palpitations, and excessive sweating [52]. These tumors are often linked to genetic mutations, and it is recommended that all patients undergo genetic testing. Symptoms are caused by overproduction of catecholamines. Radiological imaging helps locate the tumor and determine its spread and elevated levels of metanephrines or normetanephrines confirm the diagnosis. Surgery is the only effective therapy while drugs are used to address hypertension, arrhythmias, and fluid retention before surgery [53].
Adrenal Hemorrhage
Adrenal hemorrhage is a rare condition involving bleeding in the adrenal glands, causing a range of symptoms from mild abdominal pain to serious cardiovascular collapse. It is caused by various factors like traumatic abdominal trauma, sepsis, blood clotting issues, blood thinner use, pregnancy, stress, antiphospholipid syndrome, and essential thrombocytosis, it can occur unilaterally or bilaterally. Rapid diagnosis requires high clinical suspicion, and diagnostic techniques involve imaging and biochemical evaluations [54].
Primary Hyperaldosteronism
Also known as Conn syndrome, is a condition causing hypertension and low potassium levels due to excessive aldosterone release from the adrenal glands. It’s a common secondary cause of hypertension, especially in resistant cases and women. Diagnosis involves aldosterone-renin ratio assessment, confirmatory tests such as saline infusion tests or captopril challenge, and imaging studies like adrenal CT or MRI scans [55]. Treatment options include aldosterone antagonists, potassium-saving diuretics, surgery, and corticosteroids [56].
Medical Impact of Endocrine Disorders
Health Consequences
Cardiovascular Complications
Uncontrolled diabetes is associated with vessel damage due to atherosclerosis, which increases the risk of heart attacks and strokes [57-59]. Hyperglycemia also contributes to inflammation, oxidative stress, and endothelial dysfunction, further promoting the development of cardiovascular complications [52-54].
Metabolic Disturbances
Conditions with hormonal imbalances, like PCOS and hypothyroidism, cause weight gain and obesity. Obesity is a major risk factor for numerous health issues, including type 2 diabetes, heart disease, and joint problems [57-59].
Autoimmune Disorders
Autoimmune disorders are common in endocrine disorders such as Hashimoto’s thyroiditis and Graves’ disease [57-61]. These conditions can increase the risk of developing other autoimmune disorders, such as rheumatoid arthritis or lupus [57-59].
Quality of Life Implications
Physical Well-being
Many endocrine disorders, such as diabetes, are associated with physical symptoms such as fatigue, pain, weakness, and discomfort [62-64].
Emotional and Psychological Well-being
Hormonal imbalances affect neurotransmitters in the brain, leading to mood disorders such as depression, anxiety, and irritability [62-65].
Social and Relationship Impact
Individuals with endocrine disorders may experience social isolation due to their symptoms or the demands of managing their condition, limiting their social interactions [62-64].
Financial Burden
Treating and managing endocrine disorders often involves ongoing medical costs, medications, doctor visits, and surgical procedures. These expenses can create a financial burden on individuals and their families, impacting their overall financial well-being [62-64].
Self-esteem and Body Image
PCOS or hypothyroidism result in weight gain and changes in appearance, which may impact self-esteem and body image. Individuals with obesity-related endocrine conditions may experience societal stigmatization and discrimination, which can lead to emotional distress and lower self-esteem [62-64].
The Intersection: Climate Change and Endocrine Disorders
Endocrine Disruption Mechanisms
Endocrine Disrupting Chemicals (EDCs)
Endocrine disruptors, are foreign substances interfering with the endocrine system’s physiologic function, leading to detrimental effects. EDCs exposure may occur through food, water, and skin exposure in adults. Fatal exposure happens through placental transmission and breastfeeding. Direct effects are seen in the exposed population and subsequent generations. EDCs are the most well-known with more than 4000 agents polluting the environment [66]. EDCs mimic endocrine action by binding to a variety of hormone receptors and may act as either agonists or antagonists. Nuclear and membrane-bound receptors are typically the two messenger systems utilized by EDCs [67]. The most commonly recognized EDCs may be agricultural, and industrial chemicals, heavy metals, drugs, and phytoestrogens [66,67]. Human exposure mostly occurs through the act of consuming these substances that accumulate in fatty tissue due to their affinity for fat. Furthermore, endocrine-disrupting chemicals interfere with the production, function, and breakdown of sex hormones affecting the growth of the fetus and reproductive abilities. These factors are associated with developmental problems, infertility, hormone-sensitive malignancies, and disruptions in energy balance. Moreover, EDCs disrupt the functioning of the hypothalamic-pituitary-thyroid and adrenal axis. However, evaluating the complete extent of ECDs influence on physical health is difficult, because of the delayed consequences, diverse onset ages, and the susceptibility of certain demographics [67] (Table 2).
Table 2: Impact of Environmental Disruptors on Endocrine Pathways by Organ.
Organ
Environmental disruptor
Impact on endocrine pathways
Pituitary
Pesticides, PVC.
Precocious puberty. Delayed puberty. Disruption of circadian rhythm.
EDCs can interfere with hormonal homeostasis in different mechanisms such as affecting hormone synthesis, release, transport, metabolism, and action, mainly utilizing the structural similarity with thyroid hormones [68]. The impact of EDCs on the endocrine system is not fully understood. However, existing literature and medical research suggest an association between EDCs and endocrine disorders, with EDCs being implicated as potential causes of obesity, diabetes mellitus, and other diseases [28,69-72].
Phthalates, as a chemical commonly used in pharmaceuticals [73], have been described to have a negative association with free and total serum T4 and increased TSH levels [74] . Perchlorate, a significant EDC, mainly inhibits iodine uptake with doses as small as 5 mg/kg/day via reducing iodine uptake in the thyroid, with higher doses inhibiting thyroid synthesis [75]; its exposure risks reduced cognitive function in neonates [76] . In the adrenals, EDCs work by inhibiting or inducing enzymes, including steroid acute regulatory protein (StAR), aromatase, and hydroxysteroid dehydrogenases [77,78], involved in steroidogenesis with a minor role in aldosterone synthesis disruption [66] . Drugs like etomidate, ketoconazole, and cardiac glycosides may inhibit steroidogenesis by interfering with 11β-hydroxylase. The interference obstructs the process of converting 11-deoxycortisol into cortisol, which affects the production of glucocorticoids and mineralocorticoids (Figure 4).
Figure 4: Feedback regulation of hormone production: positive and negative.
Decreased cortisol levels impact the body’s reaction to stress and its metabolism, which may result in symptoms of adrenal insufficiency. Moreover, the interruption of aldosterone production might potentially lead to disturbances in electrolyte levels and the regulation of blood pressure. The many intricacies of this route emphasize the need of maintaining a precise hormonal equilibrium for optimal physiological functioning [66]. Furthermore, environmental toxins play a critical role in influencing reproductive health outcomes. Heavy metals and other environmental toxins can impair reproductive health in females by altering hormone function, leading to adverse reproductive health events. In males, these toxins could affect semen quality, altering sperm concentration, movement, and morphology [90,91] (Table 3).
Table 3: Climate change impact on different phases of reproductive life.
Phase
Impact Factors
Description
Preconception
Temperature Extremes
Affects fertility and sperm quality; heat stress can reduce conception rates.
Air Quality
Exposure to pollutants can reduce reproductive health and increase the risk of infertility.
Nutrition and Food Security
Poor nutrition can lead to decreased fertility; food insecurity affects overall health.
Water Quality and Availability
Contaminated water can lead to reproductive health issues; water scarcity impacts general health.
Pregnancy
Temperature Extremes
Higher risk of heat stress, preterm birth, and other complications.
Air Quality
Poor air quality can lead to pregnancy complications such as preeclampsia and low birth weight.
Nutrition and Food Security
Malnutrition can affect fetal development; food insecurity can lead to nutrient deficiencies.
Water Quality and Availability
Risk of waterborne diseases affecting maternal health.
Childbirth
Temperature Extremes
Increased risk during labor and delivery, particularly in hot climates.
Air Quality
Respiratory issues during childbirth due to poor air quality.
Water Quality and Availability
Clean water is essential for safe delivery; water scarcity and contamination can lead to complications.
Postpartum
Nutrition and Food Security
Impact on breastfeeding and recovery; malnutrition can affect milk production and maternal health.
Temperature Extremes
Heat stress can affect the health of both mother and infant.
Air Quality
Poor air quality can affect respiratory health of both mother and newborn.
Climate Change Factors Affecting Endocrine Health
Temperature Extremes and Hormonal Responses
Humans can survive in extreme environmental conditions and adapt to varying temperatures ranging from humid tropical forests to polar deserts [79,80]. Stress hormones and other stress-initiated systems have a major role in adaptive responses to environmental changes [81]. Mazzeo et al.’s study and Woods et al.’s investigation found that catecholamine and cortisol responses to physical exercise differ under conditions of hypoxia versus normoxia; with higher concentrations noted under hypoxic conditions [82,83]. The secretion of catecholamine (particularly adrenaline and noradrenaline) and cortisol during physical stress is influenced by the presence of either low oxygen levels (hypoxic) or normal oxygen levels (normoxic) in the body. When there is a lack of oxygen (hypoxia), the body responds by releasing more catecholamines, which increases the heart rate and respiratory rate. Moreover, the levels of cortisol are elevated, which promotes the mobilization of energy stores. Under typical oxygen conditions, exercise still stimulates the synthesis of catecholamines and cortisol, although the quantities may not reach the same levels as observed in low oxygen environments (hypoxia). The body’s physiological responses during physical activity are facilitated by these endocrine reactions, which are crucial for adapting to varying amounts of oxygen in the surroundings [84]. The endocannabinoids lipid mediators and N-acyl ethanolamines are closely linked to acclimation at various physiological levels, including central nervous, peripheral metabolic, and psychologic systems in response to environmental factors to achieve physiological homeostasis [85].
Environmental Toxins and Endocrine Dysfunction
Numerous epidemiological studies have indicated a link between exposure to environmental toxins and the risk of developing type 2 diabetes mellitus. Inflammation triggered by exposure to particulate matter (PM2.5) in air pollution is a prevalent mechanism that might interact with other proinflammatory factors related to diet and lifestyle, influencing susceptibility to cardiometabolic diseases [86]. Exposure to PM2.5 has been demonstrated to disrupt insulin receptor substrate (IRS) phosphorylation, leading to impaired PI3K-Akt signaling and inhibition of insulin-induced glucose transporter translocation [86] (Figure 5).
Figure 5: PM2.5 exposure impact
Foodborne toxins such as cereulide produced by Bacillus cereus might contribute to the increase in the prevalence of both type 1 and 2 diabetes through its uncoupling of oxidative phosphorylation by permeabilizing the mitochondrial membrane [87]. The production of mitochondrial ATP is crucial for generating insulin in response to glucose stimulation. Therefore, cereulide’s toxic effects on mitochondria could particularly harm beta-cell function and viability.
Altered Nutritional Patterns and Metabolic Health
Prudent diets including fruits, vegetables, whole grains, fish, and legumes have been associated with favorable effects on bone metabolism including lower serum bone resorption marker C-terminal telopeptide (CTX) in women; higher 25-hydroxyvitamin D (25OHD) and lower parathyroid hormone in men [9]. Also linked to favorable effects on glucose metabolism such as lower insulin and homeostatic model assessment insulin resistance (HOMA-IR) [9]. Consuming Western diets, characterized by the intake of soft drinks, potato chips, french fries, meats, and desserts, has been linked to adverse impacts on bone metabolism which include elevated levels of bone-specific alkaline phosphatase and reduced levels of 25OHD in women, as well as higher CTX levels in men [9]. They were also linked to higher glucose, insulin, and HOMA-IR [88].
Stress, Mental Health, and Endocrine Function
Climate-induced Stress and Hormone Levels
The primary responses to heat stress involve the activation of the hypothalamic-pituitary-adrenal axis, leading to a subsequent rise in plasma glucocorticoid levels. Epinephrine and norepinephrine are the main hormones elevated in prolonged exposure to environmental heat stress. Plasma thyroid hormones have been observed to decrease under heat stress as compared to thermoneutral conditions. Decreasing levels of thyroid hormones and plasma growth hormones have a synergistic effect in the reduction of heat production. Decreased growth hormone is necessary for survival during heat stress and Insulin-like growth factor-1 (IGF-1) has been found to be decreased during summer months [88].
Mental Health Implications for Endocrine Patients
Cortisol is a well-researched hormone in psycho-neuroendocrinology, crucial for stress-related and mental health disorders [92]. It’s assessed through serum, saliva, or urine for short-term levels, while hair cortisol can indicate long-term levels [93]. Stress triggers acute and chronic responses in cortisol release, affecting the HPA (hypothalamus-pituitary-adrenal) axis [88]. The HPT (hypothalamus-pituitary-thyroid) axis is also impacted by stress, showing transient activation and suppression with acute and chronic stressors [94]. Stress persistence is crucial in understanding stress reactions and their connection to cortisol levels and HPA axis dysfunction, which is linked to various mental disorders like major depressive disorder [95,96].
Empirical Evidence and Research Findings
Epidemiological Studies on Climate and Endocrine Disorders
Diabetes and Climate-Related Factors
Diabetes and climate change are interconnected global health challenges. Rising temperatures, heat waves, heavy rainfall, and extreme weather events are impacting diabetic patients [31,97]. These individuals exhibit heightened vulnerability to heat and climate-related stress due to impaired vasodilation and sweating responses, also diabetic patients’ susceptibility to complications will be increased [10]. Additionally, Mora et al., in their systematic review, showed that 58% of infectious agents were aggravated by climate change, posing a high risk of infections and their complications on diabetic patients with compromised immune systems [98].
Thyroid Function and Environmental Exposures
Recent research highlights the impact of environmental factors on thyroid function, assessed through TSH, FT4, and FT3 levels. Exposure to high levels of particulate matter (PM2.5) is associated with lower FT4 levels and a higher risk of hypothyroxinemia [99-101]. PM2.5, composed of fine particles carrying contaminants including heavy metals, is breathed and enters the circulation, causing disruption to thyroid function. Hypothyroxinaemia, caused by decreased levels of FT4, has a negative impact on fetal development throughout pregnancy. Exposure to PM2.5 also induces inflammation and oxidative stress, which further disrupts the control of the thyroid [102]. In adults, elevated TSH and decreased FT4 levels were associated with long-term exposure to nitric oxide and carbon monoxide [103]. Additionally, outdoor temperature was negatively linked to TSH and FT3 but positively correlated with free thyroxine and the FT4/FT3 ratio. A 10 μg/m3 increase in fine particulate matter (PM2.5) was linked to a 0.12 pmol/L decrease in FT4 and a 0.07 pmol/L increase in FT3, with a significantly negative association between PM2.5 levels and the FT4/FT3 ratio [104].
PCOS and Dietary Changes
Diet and lifestyle choices are pivotal in the development and management of PCOS. Key factors include addressing insulin resistance, considering weight and body composition, adopting a balanced diet, and the potential benefits of a low-glycemic Index (GI) diet. Tailored dietary plans aim to reduce chronic inflammation through increased antioxidant intake [105]. Additionally, research indicates a link between air pollutants, such as Q4, PM2.5, NOx, NO2, NO, and SO2, and a higher risk of PCOS, as shown by Lin et al in 2019 [106].
Case Studies in Climate-Impacted Regions
Vulnerable Populations and Healthcare Access
Climate change debates must consider demographic groups’ disproportionate healthcare access and vulnerability. Low-income communities, elderlies, children, disabled people and those with pre-existing endocrine disorders face unique climate change challenges. Climate gentrification harms vulnerable residents’ health. Environmental pollutants and endocrine disorders are more common in marginalized climate-vulnerable communities. Addressing vulnerable populations’ healthcare access disparities to reduce climate change’s endocrine and health effects is essential. Vulnerable populations in climate and health research should not be seen as homogenous due to age, health issues, geography, or time. Climate assessments should address health and inequality.
A systematic overview highlights the unique challenges faced by women in low- and middle-income countries (LMICs) due to climate change and natural disasters. The review suggests a wide range of harmful effects on female reproductive health, noting that the mean age of menarche has decreased due to climate change. Additionally, some research found a statistically significant relationship between rising global temperatures and adverse pregnancy outcomes. All of these effects are more pronounced in LMICs, which are more severely impacted by climate change [107].
Environmental Justice Considerations
Climate and endocrine diseases research must consider environmental justice which involves all socioeconomic groups in lawmaking, implementation, and enforcement. Climate-related harm is unequally distributed by population exposure, sensitivity, and adaptation [1]. Climate risks and environmental degradation disproportionately affect low-income and minority groups, who often face greater exposure to environmental hazards and have fewer resources to adapt or recover. This exacerbates health disparities and highlights the need for inclusive environmental justice policies. Additionally, there should be more consideration of vulnerable groups within these communities, who are at higher risk from climate-related events [107].
Mitigation and Adaptation Strategies
Climate Change Mitigation Efforts
There are two categories of mitigation efforts; reduction of further greenhouse gas emissions and creation of carbon sinks to decrease atmospheric greenhouse gas. The Intergovernmental Panel on Climate Change, held in March 2023, called for global action to limit worldwide temperature increase to less than 1.5 C when compared to the preindustrial period [108]. Per the World Health Organization, a global effort requires political collaborations with medical professionals, which has prompted medical representation at United Nations Framework Convention on Climate Change (UNFCCC) meetings and Conference of the Parties (COP) [109]. Local and national endocrinology groups have been promoting climate change-based policies including suggesting a climate change agenda in the 2022-2026 Environmental Protection Agency strategic guidelines in the United States of America [110].
In addition, practitioners can contribute to the fight against climate change by adopting environmentally friendly practices and promoting treatments that lead to decrease greenhouse emissions and improve health [111]. One method physicians can use is carbon accounting, where physicians measure the amount of disposable goods that have been discarded by their practice and take measures to decrease usage [112]. When ordering supplies for medical centers, physicians can consider environmentally preferable purchasing, such as focusing on reusables, which supports companies committed to mitigating the impacts of product production on climate change [113].
Personal and Community Health Measures
By recognizing the importance of lifestyle modifications for both endocrine disorders and climate change, individuals can take control of their health while actively contributing to environmental preservation. By choosing to use their muscles rather than motors, people can both lessen their release of greenhouse gases and increase their calorie expenditure. Engaging in regular physical activity stands as one of the pillars of maintaining good health; it can enhance brain health, facilitates weight management, lower the risk of various diseases, strengthens bones and muscles, and enhances the capacity to perform daily tasks [114]. Food consumption has a direct relationship with the global epidemics of Obesity and Diabetes Mellitus [115,116]. Improved dietary decisions can lead to enhanced health outcomes for both individuals and the environment. Diets rich in plant-based foods and lower in meat consumption (flexitarian diets) not only contribute to health advantages but also diminish greenhouse gas emissions originating from agriculture [117].
EDCs disrupt hormone biosynthesis, metabolism, or function, leading to deviations from normal homeostatic control or reproductive processes. There is growing evidence that these hazardous chemicals contribute to the increased prevalence of cancers, cardiovascular and respiratory diseases, allergies, neurodevelopmental and congenital defects, and endocrine disruption. The Ostrava Declaration, adopted by the Sixth Ministerial Conference on Environment and Health in 2017, encourages the substitution of such hazardous chemicals and improving information availability [118].
Policy and Advocacy in Medical Research
Government Initiatives and Regulations
Integrating Climate and Health Policies
Governmental and nongovernmental bodies around the world such as CDC, WMO, WHO, and BAMS are increasingly recognizing the link between climate change and public health. Integrating climate and health policies is essential to mitigate the adverse effects of climate change by implementing regulations to reduce air pollution, vector-borne disease control, and supporting research into climate-related health impacts [119].
Surveillance and Reporting
A study on adaptation efforts by 117 UNFCCC parties established a global baseline for adaptation trends. National Communications data unveiled 4,104 distinct initiatives. Despite advanced impact assessments and research, translating knowledge into actions remains limited. Infrastructure, technology, and innovation dominate reported adaptations. Common vulnerabilities include floods, droughts, food and water safety, rainfall, diseases, and ecosystem health. However, vulnerable sub-populations receive infrequent consideration in these initiatives [120]. Also, Greenhouse gases are one of the important factors for climate change so (MERV) guidelines which stand for minimum efficiency reporting value and consist of four guidelines which are needed for the greenhouses to accurately determine their net GHG, and other, benefits: [121].
Improve data reliability for estimating GHG benefits.
Enable real-time data to allow adjustments during the project.
Establish consistency and transparency in reporting across various project types and contributors.
Boost project credibility with stakeholders.
NGO Efforts in Medical Research
Advocacy for Environmental Health
NGOs act as catalysts in advocating for environmental health policies and practices, with a significant presence in international environmental governance. While they are recognized as essential contributors to environmental protection, there’s a lack of systematic evaluations of their roles, especially in relation to other governing bodies [122].
Promoting Evidence-Based Practices
NGOs contribute significantly to medical research by promoting evidence-based practices instead of data analysis only within healthcare systems. They work to ensure that medical interventions and treatments are based on rigorous scientific research, which ultimately leads to better patient outcomes. In addition, NGOs play a vital role in connecting scientific breakthroughs with clinical application, guaranteeing that the most recent research insights translate into tangible advantages for patients in everyday practice.
Challenges and Public Health Implications
Climate change can have a significant impact on the incidence, diagnosis, and management of endocrine disorders. For instance, exposure to extreme temperatures, air pollution, and other environmental factors can disrupt the endocrine system and lead to hormonal imbalances [123].
The public health implications of endocrine disorders are significant. These conditions can cause long-term disability, reduce the quality of life of affected individuals, and increase the risk of mortality. The burden of endocrine disorders is expected to increase in the coming years due to climate change and other factors [123].
To mitigate the effects of endocrine disorders in the context of climate change, several strategies can be employed. These include reducing exposure to environmental toxins, promoting healthy lifestyles, and investing in research to better understand the link between climate change and endocrine disorders [124]. Additionally, public health campaigns can be launched to raise awareness about the risks of endocrine disorders and the importance of early diagnosis and treatment [125].
Technology can play a crucial role in mitigating the effects of endocrine disorders in the context of climate change. For instance, digital technologies can monitor and address the increase of climate-sensitive infectious diseases, thereby safeguarding the well-being of communities worldwide [125,126]. Additionally, telemedicine can be used to provide remote care to patients with endocrine disorders, reducing the need for in-person visits and improving access to care [127]. However, the use of technology in healthcare also poses several challenges. For example, the use of electronic health records (EHRs) can lead to privacy concerns and data breaches. Additionally, the use of artificial intelligence (AI) in healthcare raises ethical concerns, such as the potential for bias and discrimination.
Future Research Directions in Medical Climate Science
Knowledge Gaps and Areas of Uncertainty
While extensive research, primarily derived from animal studies, has shed light on the potential hazards, there are critical gaps in our knowledge regarding EDCs exposure routes and threshold concentrations. Comprehensive assessments of drinking water supplies are essential to bridge these gaps. Additionally, questions persist about the long-term impacts of EDC exposure, especially during crucial developmental stages, highlighting the need for further studies to unravel these uncertainties [69].
Long-Term Health Projections
The sudden surge in metabolic disorders, reproductive abnormalities, endocrine dysfunction, and cancers raises concerns about long-term health projections. With the escalation of these diseases linked to global industrialization and the pervasive presence of EDCs in our environment, understanding the future health landscape is crucial [28]. Long-term health projections must consider the complex interplay of EDCs with human biology, emphasizing the importance of ongoing research to anticipate and mitigate potential health crises in the coming years.
Artificial Intelligence (AI) and Technological Advancements and Innovative Solutions
Machine learning models, such as the optimized Random Forest (RF) models, have emerged as powerful tools to address knowledge gaps. These models, utilizing simple descriptors and data from extensive projects, provide accurate predictions of EDC effects, enabling a better understanding of the risks associated with various substances [128]. Incorporating AI in prioritization and tiered testing workflows not only fills existing knowledge gaps but also propels us toward more efficient and precise screening processes. These advancements also facilitate the development of targeted interventions and policies, ensuring a healthier future for generations to come.
Future Perspective and Conclusion
Further research should focus on finding relationships between various endocrine disorders and different environmental factors such as climate change and environmental toxins. Extensive understanding of the causative factors will facilitate the development of medical treatments and public health policies. Embracing diverse perspectives can enhance our understanding and foster breakthroughs. To conclude, urgent action should be taken to challenge the effects of climate change on endocrine disorders; public health policies should be implemented to decrease overall exposure to endocrine disrupting chemicals by utilizing testing of various substances to reduce potential exposure in different environmental settings. Additionally, technology could be integrated into public health and preventive medicine for purposes of disease tracking and increasing accessibility to telemedicine regardless of the patient’s physical location. Although promising, other factors should be taken in consideration when technology is used such to maintain patient’s confidentiality, including privacy concerns and ethical dilemmas regarding patient data. Effective strategies demand community education, NGOs involvement, and continuous monitoring. Addressing challenges, including financial inconsistencies, requires implementing measures that promote resilience.
Declarations
Acknowledgement
The authors would like to acknowledge ACC Medical Student Member Community’s Cardiovascular Research Initiative for organizing this project.
Funding
Authors received no external funding for this project
Conflicts of Interest
Authors wish to declare no conflict of interest.
Authorship contributions
Conceptualization of Ideas: Abdulkader Mohammad, Adriana Mares, Aayushi Sood
Data Curation
Abdulkader Mohammad, Adriana Mares, Aayushi Sood
Visualization
Abdulkader Mohammad, Adriana C. Mares, Abd Alrazak Albasis, Mayassa Kiwan, Sara Subbanna
Writing of Initial Draft
Abdulkader Mohammad, Adriana C. Mares, Abd Alrazak Albasis, Mayassa Kiwan, Sara Subbanna, Jannel A. Lawrence, Shariq Ahmad Wani, Bashar Khater, Amir Abdi, Anu Priya, Christianah T. Ademuwagun MS, Kahan Mehta, Nagham Ramadan, Anubhav Sood
Review and Editing
Abdulkader Mohammad, Adriana C. Mares, Harsh Bala Gupta, Aayushi Sood
Declaration of Interest
None.
Disclosures
The authors have no conflicts of interest to disclose. 1) This paper is not under consideration elsewhere. 2) All authors have read and approved the manuscript. 3) All authors take responsibility for all aspects of the reliability and freedom from bias of the data presented and their discussed interpretation. 4) The authors have no conflict of interest to disclose
Abbreviations: 25OHD: 25-Hydroxyvitamin D; ACTH: Adrenocorticotropic Hormone; AHA: American Heart Association; AI: Artificial Intelligence; BAMS: Bulletin of the American Meteorological Society; BAT: Brown Adipose Tissue; CDC: Centres for Disease Control and Prevention; COP: Conference of the Parties; COPD: Chronic Obstructive Pulmonary Disease; CTX: C-terminal Telopeptide; EDCs: Endocrine Disrupting Chemicals; EHRs: Electronic Health Records; FPG: Fasting Plasma Glucose; FT3: Free Triiodothyronine; FT4: Free Thyroxine; HbA1c: Hemoglobin A1c; HOMA-IR: Homeostatic Model Assessment Insulin Resistance; HPA: Hypothalamic-Pituitary-Adrenal; HPT: Hypothalamic-Pituitary-Thyroid; IRS: Insulin Receptor Substrate; IGF-1: Insulin-like Growth Factor-1; LDL: Low-Density Lipoprotein; LMICs: Low- and middle-income countries; MRI: Magnetic Resonance Imaging; MERV: Minimum Efficiency Reporting Value; NO2: Nitrogen Dioxide; NOx: Nitrogen Oxides; OGTT: Oral Glucose Tolerance Test; PCOS: Polycystic Ovary Syndrome; PG: Plasma Glucose; PI3K-Akt: Phosphatidylinositol-3-kinase-Protein Kinase B; PM2.5: Particulate Matter 2.5; SO2: Sulfur Dioxide; T3: Triiodothyronine; T4: Thyroxine; TRH: Thyrotropin-Releasing Hormone; TSH: Thyroid-Stimulating Hormone; UNFCCC: United Nations Framework Convention on Climate Change; WHO: World Health Organization; WMO: World Meteorological Organization
References
Abbass K, Qasim MZ, Song H, Murshed M, Mahmood H, Younis I (2022) A review of the global climate change impacts, adaptation, and sustainable mitigation measures. Environmental Science and Pollution Research.[crossref]
Nations U. Causes and Effects of Climate Change | United Nations.
Zhao Q, Guo Y, Ye T, Gasparrini A, Tong S, Overcenco A, et al. (2021) Global, regional, and national burden of mortality associated with non-optimal ambient temperatures from 2000 to 2019: a three-stage modelling study. Lancet Planet Health.[crossref]
McMichael AJ. Globalization, climate change, and human health (2013) N Engl J Med.
Hansen J, Ruedy R, Sato M, Lo K (2020) World of Change: Global Temperatures. Reviews of Geophysics.
Zhao Q, Yu P, Mahendran R, Huang W, Gao Y, Yang Z, et al. (2022) Global climate change and human health: Pathways and possible solutions. Eco-Environment and Health.[crossref]
Zhao Q, Li S, Coelho MSZS, Saldiva PHN, Hu K, Huxley RR, et al. (2019) The association between heatwaves and risk of hospitalization in Brazil: A nationwide time series study between 2000 and 2015. PLoS Med.[crossref]
Ebi KL, Capon A, Berry P, Broderick C, de Dear R, Havenith G, et al. (2021) Hot weather and heat extremes: health risks. Lancet.[crossref]
Wu Y, Xu R, Wen B, De Sousa Zanotti Stagliorio Coelho M, Saldiva PH, Li S, et al. (2021) Temperature variability and asthma hospitalisation in Brazil, 2000-2015: a nationwide case-crossover study. Thorax.[crossref].
Blauw LL, Aziz NA, Tannemaat MR, Blauw CA, de Craen AJ, Pijl H, et al. (2017) Diabetes incidence and glucose intolerance prevalence increase with higher outdoor temperature. BMJ Open Diabetes Res Care.[crossref].
Kim Y, Kim H, Gasparrini A, Armstrong B, Honda Y, Chung Y, et al. (2019) Suicide and Ambient Temperature: A Multi-Country Multi-City Study. Environ Health Perspect.[crossref].
Khan AM, Finlay JM, Clarke P, Sol K, Melendez R, Judd S, et al. (2021) Association between temperature exposure and cognition: a cross-sectional analysis of 20,687 aging adults in the United States. BMC Public Health.[crossref].
Schwartz J. Who is sensitive to extremes of temperature?: A case-only analysis. Epidemiology 2005.[crossref]
Winquist A, Grundstein A, Chang HH, Hess J, Sarnat SE. Warm season temperatures and emergency department visits in Atlanta, Georgia. Environ Res 2016.
Hajat S, Haines A, Sarran C, Sharma A, Bates C, Fleming LE. The effect of ambient temperature on type-2-diabetes: case-crossover analysis of 4+ million GP consultations across England. Environ Health 2017.
Kapwata T, Gebreslasie MT, Mathee A, Wright CY. Current and Potential Future Seasonal Trends of Indoor Dwelling Temperature and Likely Health Risks in Rural Southern Africa. Int J Environ Res Public Health 2018.
Xu R, Yu P, Abramson MJ, Johnston FH, Samet JM, Bell ML, et al. Wildfires, Global Climate Change, and Human Health. N Engl J Med 2020.
Reisen F, Duran SM, Flannigan M, Elliott C, Rideout K. Wildfire smoke and public health risk. Int J Wildland Fire. 2015.
Parks RM, Anderson GB, Nethery RC, Navas-Acien A, Dominici F, Kioumourtzoglou MA. Tropical cyclone exposure is associated with increased hospitalization rates in older adults. Nat Commun. 2021.[crossref]
Gauderman WJ, Urman R, A E, Berhane K, McConnell R, Rappaport E, et al. Association of improved air quality with lung development in children. N Engl J Med 2015. [crossref]
Zhang S, Mwiberi S, Pickford R, Breitner S, Huth C, Koenig W, et al. Longitudinal associations between ambient air pollution and insulin sensitivity: results from the KORA cohort study. Lancet Planet Health 2021.[crossref]
Burkart K, Causey K, Cohen AJ, Wozniak SS, Salvi DD, Abbafati C, et al. Estimates, trends, and drivers of the global burden of type 2 diabetes attributable to PM2·5 air pollution, 1990-2019: an analysis of data from the Global Burden of Disease Study 2019. Lancet Planet Health 2022.[crossref]
Wang J, Vanga SK, Saxena R, Orsat V, Raghavan V. Effect of Climate Change on the Yield of Cereal Crops: A Review. Climate 2018.
Chen XM, Sharma A, Liu H. The Impact of Climate Change on Environmental Sustainability and Human Mortality. Environments 2023.
McMichael AJ, Friel S, Nyong A, Corvalan C. Global environmental change and health: impacts, inequalities, and the health sector. BMJ 2008.[crossref]
Kalra S, Kapoor N. Environmental Endocrinology: An Expanding Horizon. 2021.[crossref]
Darbre PD. Overview of air pollution and endocrine disorders. Int J Gen Med 2018.[crossref]
Diamanti-Kandarakis E, Bourguignon JP, Giudice LC, Hauser R, Prins GS, Soto AM, et al. Endocrine-Disrupting Chemicals: An Endocrine Society Scientific Statement. Endocr Rev 2009.[crossref]
Brent GA. Environmental Exposures and Autoimmune Thyroid Disease. Thyroid 2010.[crossref]
Wright JT, Crall JJ, Fontana M, Gillette EJ, Nový BB, Dhar V, et al. Evidence-based clinical practice guideline for the use of pit-and-fissure sealants: A report of the American Dental Association and the American Academy of Pediatric Dentistry. Journal of the American Dental Association. 2016.[crossref]
Ratter-Rieck JM, Roden M, Herder C. Diabetes and climate change: current evidence and implications for people with diabetes, clinicians and policy stakeholders. Diabetologia 2023.[crossref]
Yang J, Zhou M, Zhang F, Yin P, Wang B, Guo Y, et al. Diabetes mortality burden attributable to short-term effect of PM10 in China. Environmental Science and Pollution Research 2020.[crossref]
Romanello M, McGushin A, Di Napoli C, Drummond P, Hughes N, Jamart L, et al. The 2021 report of the Lancet Countdown on health and climate change: code red for a healthy future. Lancet. 2021.[crossref]
Hiller-Sturmhöfel S, Bartke A. The Endocrine System: An Overview. Alcohol Health Res World 1998.[crossref]
Hoermann R, Pekker MJ, Midgley JEM, Larisch R, Dietrich JW. Principles of Endocrine Regulation: Reconciling Tensions Between Robustness in Performance and Adaptation to Change. Front Endocrinol (Lausanne) 2022.[crossref]
Peters A, Conrad M, Hubold C, Schweiger U, Fischer B, Fehm HL. The principle of homeostasis in the hypothalamus-pituitary-adrenal system: new insight from positive feedback. Am J Physiol Regul Integr Comp Physiol 2007.[crossref]
Diagnosis and classification of diabetes mellitus. Diabetes Care 2009.[crossref]
Gessl A, Lemmens-Gruber R, Kautzky-Willer A. Thyroid disorders. Handb Exp Pharmacol 2012.[crossref]
De Leo S, Lee SY, Braverman LE. Hyperthyroidism. Lancet 2016
De Leo S, Lee SY, Braverman LE. Hyperthyroidism. Lancet 2016
Aoki Y, Belin RM, Clickner R, Jeffries R, Phillips L, Mahaffey KR. Serum TSH and total T4 in the United States population and their association with participant characteristics: National Health and Nutrition Examination Survey (NHANES 1999-2002) Thyroid 2007.[crossref]
McLeod DSA, Caturegli P, Cooper DS, Matos PG, Hutfless S. Variation in rates of autoimmune thyroid disease by race/ethnicity in US military personnel. JAMA 2014.[crossref]
Wiersinga WM. Myxedema and Coma (Severe Hypothyroidism) Endotext 2018
Carlé A, Bülow Pedersen I, Knudsen N, Perrild H, Ovesen L, Laurberg P. Gender differences in symptoms of hypothyroidism: a population-based DanThyr study. Clin Endocrinol (Oxf) 2015.[crossref]
Teede H, Deeks A, Moran L. Polycystic ovary syndrome: a complex condition with psychological, reproductive and metabolic manifestations that impacts on health across the lifespan. BMC Med 2010.[crossref]
Rasquin LI, Anastasopoulou C, Mayrin J V. Polycystic Ovarian Disease. Encyclopedia of Genetics, Genomics, Proteomics and Informatics 2022
Hirsch D, Shimon I, Manisterski Y, Aviran-Barak N, Amitai O, Nadler V, et al. Cushing’s syndrome: comparison between Cushing’s disease and adrenal Cushing’s. Endocrine 2018.[crossref]
Bornstein SR, Allolio B, Arlt W, Barthel A, Don-Wauchope A, Hammer GD, et al. Diagnosis and Treatment of Primary Adrenal Insufficiency: An Endocrine Society Clinical Practice Guideline. J Clin Endocrinol Metab. 2016.[crossref]
Munir S, Rodriguez BSQ, Waseem M. Addison Disease. StatPearls. 2023.[crossref]
Reisch N, Peczkowska M, Januszewicz A, Neumann HPH. Pheochromocytoma: presentation, diagnosis and treatment. J Hypertens 2006.[crossref]
Farrugia FA, charalampopoulos A. Pheochromocytoma. Endocr Regul. 2019.[crossref]
Gawande R, Castaneda R, Daldrup-Link HE. Adrenal Hemorrhage. Pearls and Pitfalls in Pediatric Imaging: Variants and Other Difficult Diagnoses 2023
Funder JW, Carey RM, Mantero F, Murad MH, Reincke M, Shibata H, et al. The Management of Primary Aldosteronism: Case Detection, Diagnosis, and Treatment: An Endocrine Society Clinical Practice Guideline. J Clin Endocrinol Metab 2016.[crossref]
Cobb A, Aeddula NR. Primary Hyperaldosteronism. StatPearls 2023.[crossref]
BM L, TM M. Diabetes and cardiovascular disease: Epidemiology, biological mechanisms, treatment recommendations and future research. World J Diabetes 2015.[crossref]
Diabetes and Your Heart | CDC.
Joseph JJ, Deedwania P, Acharya T, Aguilar D, Bhatt DL, Chyun DA, et al. Comprehensive Management of Cardiovascular Risk Factors for Adults With Type 2 Diabetes: A Scientific Statement From the American Heart Association. Circulation 2022.[crossref]
Creager MA, Lüscher TF, Cosentino F, Beckman JA. Diabetes and vascular disease: pathophysiology, clinical consequences, and medical therapy: Part I. Circulation 2003.[crossref]
Sonino N, Tomba E, Fava GA. Psychosocial approach to endocrine disease. Adv Psychosom Med 2007.[crossref]
Sonino N, Fava GA. Psychological aspects of endocrine disease. Clin Endocrinol (Oxf) 1998
Sonino N, Fava GA, Fallo F, Boscaro M. Psychological distress and quality of life in endocrine disease. Psychother Psychosom. 1990.[crossref]
Salvador J, Gutierrez G, Llavero M, Gargallo J, Escalada J, López J. Endocrine Disorders and Psychiatric Manifestations. 2019
Guarnotta V, Amodei R, Frasca F, Aversa A, Giordano C. Impact of Chemical Endocrine Disruptors and Hormone Modulators on the Endocrine System. Int J Mol Sci 2022.[crossref]
Yilmaz B, Terekeci H, Sandal S, Kelestimur F. Endocrine disrupting chemicals: exposure, effects on human health, mechanism of action, models for testing and strategies for prevention. Rev Endocr Metab Disord 2020.[crossref]
Zoeller TR. Environmental chemicals targeting thyroid. Hormones (Athens) 2010.[crossref]
Kumar M, Sarma DK, Shubham S, Kumawat M, Verma V, Prakash A, et al. Environmental Endocrine-Disrupting Chemical Exposure: Role in Non-Communicable Diseases. Front Public Health 2020.[crossref]
Magueresse-Battistoni B Le, Labaronne E, Vidal H, Naville D. Endocrine disrupting chemicals in mixture and obesity, diabetes and related metabolic disorders. World J Biol Chem 2017.[crossref]
Ahn C, Jeung EB. Endocrine-Disrupting Chemicals and Disease Endpoints. Int J Mol Sci 2023.[crossref]
Schug TT, Janesick A, Blumberg B, Heindel JJ. Endocrine disrupting chemicals and disease susceptibility. J Steroid Biochem Mol Biol 2011.[crossref]
Chung BY, Choi SM, Roh TH, Lim DS, Ahn MY, Kim YJ, et al. Risk assessment of phthalates in pharmaceuticals. J Toxicol Environ Health A 2019.[crossref]
Meeker JD, Calafat AM, Hauser R. Di(2-ethylhexyl) phthalate metabolites may alter thyroid hormone levels in men. Environ Health Perspect 2007.[crossref]
Greer MA, Goodman G, Pleus RC, Greer SE. Health effects assessment for environmental perchlorate contamination: the dose response for inhibition of thyroidal radioiodine uptake in humans. Environ Health Perspect 2002.[crossref]
Taylor PN, Okosieme OE, Murphy R, Hales C, Chiusano E, Maina A, et al. Maternal perchlorate levels in women with borderline thyroid function during pregnancy and the cognitive development of their offspring: data from the Controlled Antenatal Thyroid Study. J Clin Endocrinol Metab 2014.[crossref]
Hampl R, Kubátová J, Stárka L. Steroids and endocrine disruptors–History, recent state of art and open questions. J Steroid Biochem Mol Biol. 2016.[crossref]
Sargis RM. Metabolic disruption in context: Clinical avenues for synergistic perturbations in energy homeostasis by endocrine disrupting chemicals. Endocr Disruptors (Austin) 2015.
Bartone PT, Krueger GP, Bartone J V. Individual Differences in Adaptability to Isolated, Confined, and Extreme Environments. Aerosp Med Hum Perform 2018.[crossref]
Ilardo M, Nielsen R. Human adaptation to extreme environmental conditions. Curr Opin Genet Dev 2018.[crossref]
Dhabhar FS. The short-term stress response – Mother nature’s mechanism for enhancing protection and performance under conditions of threat, challenge, and opportunity. Front Neuroendocrinol 2018.[crossref]
Mazzeo RS, Wolfel EE, Butterfield GE, Reeves JT. Sympathetic response during 21 days at high altitude (4,300 m) as determined by urinary and arterial catecholamines. Metabolism 1994.
Woods DR, O’Hara JP, Boos CJ, Hodkinson PD, Tsakirides C, Hill NE, et al. Markers of physiological stress during exercise under conditions of normoxia, normobaric hypoxia, hypobaric hypoxia, and genuine high altitude. Eur J Appl Physiol 2017.[crossref]
Yilmaz M, Suleyman B, Mammadov R, Altuner D, Bulut S, Suleyman H. The Role of Adrenaline, Noradrenaline, and Cortisol in the Pathogenesis of the Analgesic Potency, Duration, and Neurotoxic Effect of Meperidine. Medicina (B Aires) 2023.[crossref]
Morena M, Roozendaal B, Trezza V, Ratano P, Peloso A, Hauer D, et al. Endogenous cannabinoid release within prefrontal-limbic pathways affects memory consolidation of emotional training. Proc Natl Acad Sci U S A 2014.[crossref]
Liu C, Ying Z, Harkema J, Sun Q, Rajagopalan S. Epidemiological and experimental links between air pollution and type 2 diabetes. Toxicol Pathol 2013.[crossref]
Vangoitsenhoven R, Rondas D, Crèvecoeur I, D’Hertog W, Baatsen P, Masini M, et al. Foodborne Cereulide Causes Beta-Cell Dysfunction and Apoptosis. PLoS One 2014.[crossref]
Aggarwal A, Upadhyay R. Heat stress and animal productivity. Heat Stress and Animal Productivity. 2013
Azzam A. Is the world converging to a ‘Western diet’? Public Health Nutr 2021
Mima M, Greenwald D, Ohlander S. Environmental Toxins and Male Fertility. Curr Urol Rep 2018.[crossref]
Mendola P, Messer LC, Rappazzo K. Science linking environmental contaminant exposures with fertility and reproductive health impacts in the adult female. Fertil Steril 2008.[crossref]
Russell G, Lightman S. The human stress response. Nat Rev Endocrinol 2019
Nadolnik LI. Stress and the thyroid gland. Biochem Mosc Suppl B Biomed Chem 2011
Staufenbiel SM, Penninx BWJH, Spijker AT, Elzinga BM, van Rossum EFC. Hair cortisol, stress exposure, and mental health in humans: a systematic review. Psychoneuroendocrinology. 2013.[crossref]
Kennis M, Gerritsen L, van Dalen M, Williams A, Cuijpers P, Bockting C. Prospective biomarkers of major depressive disorder: a systematic review and meta-analysis. Mol Psychiatry 2020.[crossref]
Diabetes and climate change: breaking the vicious cycle. BMC Med 2023.[crossref]
Mora C, McKenzie T, Gaw IM, Dean JM, von Hammerstein H, Knudson TA, et al. Over half of known human pathogenic diseases can be aggravated by climate change. Nat Clim Chang 2022.[crossref]
Corrales Vargas A, Peñaloza Castañeda J, Rietz Liljedahl E, Mora AM, Menezes-Filho JA, Smith DR, et al. Exposure to common-use pesticides, manganese, lead, and thyroid function among pregnant women from the Infants’ Environmental Health (ISA) study, Costa Rica. Science of The Total Environment. 2022.[crossref]
Ghassabian A, Pierotti L, Basterrechea M, Chatzi L, Estarlich M, Fernández-Somoano A, et al. Association of Exposure to Ambient Air Pollution With Thyroid Function During Pregnancy. JAMA Netw Open 2019.[crossref]
Zhao Y, Cao Z, Li H, Su X, Yang Y, Liu C, et al. Air pollution exposure in association with maternal thyroid function during early pregnancy. J Hazard Mater 2019.[crossref]
Zhou Y, Guo J, Wang Z, Zhang B, Sun Z, Yun X, et al. Levels and inhalation health risk of neonicotinoid insecticides in fine particulate matter (PM2.5) in urban and rural areas of China. Environ Int. 2020. [crossref]
Kim HJ, Kwon H, Yun JM, Cho B, Park JH. Association Between Exposure to Ambient Air Pollution and Thyroid Function in Korean Adults. J Clin Endocrinol Metab. 2020.[crossref]
Zeng Y, He H, Wang X, Zhang M, An Z. Climate and air pollution exposure are associated with thyroid function parameters: a retrospective cross-sectional study. J Endocrinol Invest 2021[crossref]
Preda C, Branisteanu D, Fica S, Parker J. Pathophysiological Effects of Contemporary Lifestyle on Evolutionary-Conserved Survival Mechanisms in Polycystic Ovary Syndrome. Life 2023.[crossref]
Lin SY, Yang YC, Chang CYY, Lin CC, Hsu WH, Ju SW, et al. Risk of Polycystic Ovary Syndrome in Women Exposed to Fine Air Pollutants and Acidic Gases: A Nationwide Cohort Analysis. International Journal of Environmental Research and Public Health 2019.[crossref]
Afzal F, Das A, Chatterjee S. Drawing the Linkage Between Women’s Reproductive Health, Climate Change, Natural Disaster, and Climate-driven Migration: Focusing on Low- and Middle-income Countries – A Systematic Overview. Indian J Community Med 2024.[crossref]
Climate and Health Program | CDC
Compendium of WHO and other UN guidance on health and environment – World | ReliefWeb.
Climate Change and Health | Endocrine Society
Bikomeye JC, Rublee CS, Beyer KMM. Positive Externalities of Climate Change Mitigation and Adaptation for Human Health: A Review and Conceptual Framework for Public Health Research. International Journal of Environmental Research and Public Health 2021, Vol 18, Page 2481. 2021.[crossref]
Kwakye G, Brat GA, Makary MA. Green surgical practices for health care. Arch Surg 2011.[crossref]
Soares AL, Buttigieg SC, Bak B, McFadden S, Hughes C, McClure P, et al. A Review of the Applicability of Current Green Practices in Healthcare Facilities. Int J Health Policy Manag 2023.[crossref]
Benefits of Physical Activity | Physical Activity | CDC.
Food and Diet | Obesity Prevention Source | Harvard T.H. Chan School of Public Health.
Sami W, Ansari T, Butt NS, Hamid MRA. Effect of diet on type 2 diabetes mellitus: A review. Int J Health Sci (Qassim) 2017.
Clark MA, Domingo NGG, Colgan K, Thakrar SK, Tilman D, Lynch J, et al. Global food system emissions could preclude achieving the 1.5° and 2°C climate change targets. Science (1979) 2020.[crossref]
Chemical safety EURO.
Fox M, Zuidema C, Bauman B, Burke T, Sheehan M. Integrating Public Health into Climate Change Policy and Planning: State of Practice Update. Int J Environ Res Public Health 2019.[crossref]
Lesnikowski AC, Ford JD, Berrang-Ford L, Barrera M, Heymann J. How are we adapting to climate change? A global assessment. Mitig Adapt Strateg Glob Chang. 2015
Vine E, Sathaye J. The monitoring, evaluation, reporting, and verification of climate change mitigation projects: Discussion of issues and methodologies and review of existing protocols and guidelines. 1997
Jasanoff S. NGOS and the environment: From knowledge to action. Third World Q 1997
Crafa A, Calogero AE, Cannarella R, Mongioi’ LM, Condorelli RA, Greco EA, et al. The Burden of Hormonal Disorders: A Worldwide Overview With a Particular Look in Italy. Front Endocrinol (Lausanne) 2021.[crossref]
Climate Change and Health | Endocrine Society.[cited 2024 Feb 7]
Climate change.[cited 2024 Feb 7].
Colón-González FJ, Bastos LS, Hofmann B, Hopkin A, Harpham Q, Crocker T, et al. Probabilistic seasonal dengue forecasting in Vietnam: A modelling study using superensembles. PLoS Med 2021.[crossref]
Health Technology and Climate Change | Hoover Institution Health Technology and Climate Change.[cited 2024 Feb 7].
Collins SP, Barton-Maclaren TS. Novel machine learning models to predict endocrine disruption activity for high-throughput chemical screening. Frontiers in toxicology 2022.[crossref]