Author Archives: admin

Time for New Recommendation of Upper Limit of Serum Vitamin D in Humans

Abstract

There is a continued debate and exchange of knowledge with respect to serum 25- hydroxyvitamin D (25(OH)D) cut-off levels. Based on our current knowledge it is time to reconsider our recommendations of the optimal level of serum 25(OH)D in the clinical setting and not only focus on low levels but also recommend an upper serum limit of around 125 nmol/L (40–50 ng/mL) among healthy and diseased.

Keywords

Vitamin D

Issues and Opinions

There is a continued debate and exchange of knowledge with respect to serum 25-hydroxyvitamin D (25(OH) D) cut-off in the lower end and when to start supplementation. This debate includes the general population as well as in a long list of diseases. The discussion of a cut-off level insufficiency and deficiency of25 mmol/L (10 ng/mL) and 50 mmol/L (20 ng/mL), respectively, is one debate another is the optimal level of serum 25(OH)D and of most importance a missing debate of a recommended upper limit.

It is well known that vitamin D plays an essential role in the regulation of metabolism, calcium and phosphorus absorption.Essentially, the effect of vitamin D is in the hydroxylated form 1,25-dihydroxy vitamin D. However, the effects of vitamin D are not limited to mineral homeostasis and skeletal health maintenance. The presence of Vitamin D Receptors (VDR) in other tissue and organs suggest that vitamin D physiology extends well above and beyond bone homeostasis in cell and animal studies. There has been an association of serum 25(OH)D deficiency to several diseases among others osteoporosis, cancers, autoimmune disorders, infectious diseases, cardiovascular disease, Type 2 Diabetes (T2D) and neurological disorders such as sclerosis [1]. Knowledge from the literature is that low levels are problematic and strong associations are published indicating higher morbidity and mortality among individuals with the low levels of serum 25(OH)D<50 mmol/L (20 ng/mL). On the other hand, clinical randomized studies do not so far support the beneficial effect of vitamin D supplementation other than in osteoporosis, falls and fractures.

A vitamin D dose range of 20–25 µg (800–1000 IU) per day has been effective in several studies whereas lower doses have generally been ineffective. Further hereto several doses above this range have increased the risk of falls and therefor the recommendation is that older adults with serum 25(OH)D levels < 40 nmol/L likely have fewer falls if supplemented with 20–25 µg (800–1000 IU) per day of vitamin D [2]. A recent RCT showed maximum decrease in falls at 12-month serum 25(OH)D level of 80–95 nmol/L (32–38ng/mL) and of extreme importance is that the faller rates increase when the serum 25(OH)D level exceed 40–45 ng/mL (100–112.5 nmol/L) [3].

We have learned from clinical randomized studies (RCT) with high-dose vitamin D supplementation that for mental health benefit is seen when normalizing. But no benefit is seen of higher high levels of monthly doses of vitamin D compared with the standard monthly dose of 600 µg (24,000 IU) [4]. Monthly high-dose vitamin D supplementation does not prevent Cardio-Vascular Disease (CVD) [5] and a combined study evaluating supplementation with vitamin Ddid not show a lower incidence of cardiovascular events or invasive cancer than placebo [6]. Long-term vitamin Dsupplementation, which increased mean 25-hydroxyvitamin D3 concentration >100 nmol/L for 18 months, had no effect on systolic or diastolic BP in predominantly white, healthy adults without severe vitamin D deficiency [7].In a long-time the authors of a RCT showed no significant lung function improvements in a study of high-dose vitamin D versus placebo [8]. It is often claimed that vitamin D might protect colo-rectal cancer but among patients with metastatic colo-rectal cancer, addition of high-dose vitamin D3 vs standard-dose of vitamin D3 to standard chemotherapy was inconclusive indicating the need of further and larger multicenter randomized clinical trials [9]. Related hereto, patients with digestive tract cancer, vitamin D supplementation, compared with placebo, did not result in significant improvement in relapse-free survival at 5 years [10]. Looking at neurology, the latest published meta-analysis of vitamin D supplementation in sclerosis were including all the RCT’s and highlighted the very low-quality of these and the missing evidence of effect as data suggests no benefit of vitamin D for patient-important outcomes among people with multiple sclerosis (MS). Several studies inMS is initiated and will likely provide further evidence that can be included in a future updates [11]. A meta-analysis of 19 RCT’s of vitamin D supplementation in T2D patients shows that supplementation seem to improve HbA1c, insulin resistance, and insulin in short-term intervention, suggesting that vitamin D can be considered as a therapeutic agent along with the other treatments for T2D if patients are supplemented at low serum levels [12]. In patients with pre-diabetes and hypovitaminosis D, high dose vitamin D improves insulin sensitivity and decreases risk of progression toward diabetes [13]. In thyroid disease no significant changes were observed in the serum levels of T3 and T4 hormones to vitamin D supplementation and therefore further well controlled, large, longitudinal studies are needed [14]. In all these executed studies the included patients mostly improve serum 25(OH)D from low to normal levels and in few cases to high levels and as presented the risk of fall increases.

Several epidemiologic studies support a  serum 25(OH)D upper limit of 100–125 nmol/L (40–50 ng/mL) when evaluating all-cause mortality [15,16], CVD [17] and cancer [18]. The J-shaped curve indicate significant higher risk than benefits at levels higher than 100–125 nmol/L (40–50 ng/mL) and the above mentioned high-dose RCT’s does not report on benefits.

In the literature the excess and toxicity levels of serum 25(OH)D are as high as 250 nmol/L (100 ng/mL) and 325 nmol/L (150 ng/mL), respectively. Based on the literature we have no evidence in support of a normal level up to 250 nmol/L (100 ng/mL).

I think it is time to reconsider our recommendations of the optimal level of serum 25(OH)D in the clinical setting and not only focus onlow levels but also recommend an upper serum limit of around 125 nmol/L (40–50 ng/mL) among healthy and diseased (Table 1).

Table 1. Diagnostic clinical cut-offs of levels of serum 25(OH)D

Serum 25(OH) Level (nmol/L)

Serum 25(OH) Level (ng/mL)

Laboratory Diagnosis

<25

<10

Insufficiency

<50

25

Deficiency

50–125

25–50

Normal

>125

>50

Excess

>325

>150

Intoxication

References

  1. Holick MF (2017) The vitamin D deficiency pandemic: Approaches for diagnosis, treatment and prevention. Rev Endocr Metab Disord 18: 153–165.
  2. Dawson-Hughes B (2017). Vitamin D and muscle function. J Steroid Biochem Mol Biol 173: 313–316.
  3. Smith LM, Gallagher JC, Suiter C (2017). Medium doses of daily vitamin D decrease falls and higher doses of daily vitamin D3 increase falls: A randomized clinical trial. J Steroid Biochem Mol Biol 173: 317–322.
  4. Gugger A, Marzel A, Orav EJ, Willett WC, Dawson-Hughes B et al (2019) Effect of Monthly High-Dose Vitamin D on Mental Health in Older Adults: Secondary Analysis of a RCT. J Am Geriatr Soc..
  5. Scragg R, Stewart AW, Waayer D, Lawes CMM, Toop L, et al (2017) Jr. Effect of Monthly High-Dose Vitamin D Supplementation on Cardiovascular Disease in the Vitamin D Assessment Study : A Randomized Clinical Trial. JAMA Cardiol 2: 608–616.
  6. Manson JE, Cook NR, Lee IM, Christen W, Bassuk SS, et al (2019) Vitamin D Supplements and Prevention of Cancer and Cardiovascular Disease. N Engl J Med 380: 33–44.
  7. Scragg R, Slow S, Stewart AW, Jennings LC, Chambers ST, et al (2014) Long-term high-dose vitamin D3 supplementation and blood pressure in healthy adults: a randomized controlled trial. Hypertension 64: 725–730.
  8. Sluyter JD, Camargo CA, Waayer D, Lawes CMM, Toop L, et al (2017) Effect of Monthly, High-Dose, Long-Term Vitamin D on Lung Function: A Randomized Controlled Trial. Nutrients 9(12).
  9. Ng K, Nimeiri HS, McCleary NJ, Abrams TA, Yurgelun MB, et al (2019) Effect of High-Dose vs Standard-Dose Vitamin D3 Supplementation on Progression-Free Survival Among Patients With Advanced or Metastatic Colorectal Cancer: The SUNSHINE Randomized Clinical Trial. JAMA 321: 1370–1379.
  10. Urashima M, Ohdaira H, Akutsu T, Okada S, Yoshida M, et al (2019). Effect of Vitamin D Supplementation on Relapse-Free Survival Among Patients With Digestive Tract Cancers: The AMATERASU Randomized Clinical Trial. JAMA 321: 1361–1369.
  11. Jagannath VA, Filippini G, Di Pietrantonj C, Asokan GV, Robak EW, et al (2018). Vitamin D for the management of multiple sclerosis. Cochrane Database Syst Rev 9: CD008422.
  12. Hu Z, Chen J, Sun X, Wang L, Wang A (2019) Efficacy of vitamin D supplementation on glycemic control in type 2 diabetes patients: A meta-analysis of interventional studies. Medicine (Baltimore) 98: e14970.
  13. Niroomand M, Fotouhi A, Irannejad N, Hosseinpanah F (2019). Does high-dose vitamin D supplementation impact insulin resistance and risk of development of diabetes in patients with pre-diabetes? A double-blind randomized clinical trial. Diabetes Res Clin Pract 148: 1–9.
  14. Chahardoli R, Saboor-Yaraghi AA, Amouzegar A, Khalili D, Vakili AZ, et al (2019) Can Supplementation with Vitamin D Modify Thyroid Autoantibodies (Anti-TPO Ab, Anti-Tg Ab) and Thyroid Profile (T3, T4, TSH) in Hashimoto’s Thyroiditis? A Double Blind, Randomized Clinical Trial. Horm Metab Res 51: 296–301.
  15. Durup D, Jorgensen HL, Christensen J, Schwarz P, Heegaard AM, et al (2012). A reverse J-shaped association of all-cause mortality with serum 25-hydroxyvitamin D in general practice: the CopD study. J Clin Endocrinol Metab 97: 2644–2652.
  16. Sempos CT, Durazo-Arvizu RA, Dawson-Hughes B, Yetley EA, Looker AC, et al (2013). Is there a reverse J-shaped association between 25-hydroxyvitamin D and all-cause mortality? Results from the U.S. nationally representative NHANES. J Clin Endocrinol Metab 98: 3001–3009.
  17. Durup D, Jorgensen HL, Christensen J, Tjonneland A, Olsen A, et al (2015). A Reverse J-Shaped Association Between Serum 25-Hydroxyvitamin D and Cardiovascular Disease Mortality: The CopD Study. J Clin Endocrinol Metab 100: 2339–2346.
  18. Vojdeman FJ, Madsen CM, Frederiksen K, Durup D, Olsen A, et al (2019). Vitamin D levels and cancer incidence in 217,244 individuals from primary health care in Denmark. Int J Cancer 145: 338–346.

LDL and beyond: New emerging LDL biomarkers in lipidology

Abstract

Lipidology as super-specialty is evolving both in terms of risk prediction but also to uncover the hidden mysteries within humans suffering from atherosclerotic cardiovascular disease (ASCVD) associated complication with apparently similar LDL concentration and particle size. Over decades since LDL discovery in 1950, the science has covered miles to allow us to learn more about the villainous nature of LDL lipoprotein i.e., ApoB, size wise fractions of LDL particles especially the small dense and large buoyant LDL types and oxidized LDLs. However, the recent evidence suggest exploring the morphology of LDLp within plaques suggest the varying concentration of sphingolipids to phosphatidylcholine in LDL-aggregates. This discovery has allowed newer insights into the pathophysiological mechanisms leading to plaque instability and rupture though an accelerated atherosclerotic mechanistic phenomena. This newer development will also allow us to segregate individuals with similar LDL phenotypes in terms of concentration and particle size to end up with ASCVD related complications. This brief communication discusses briefly discusses the recent LDL-plaque relationship and highlights new lipid biomarkers to further allow personalized segregation of cardiovascular disease (CVD) risk.

Key words

LDL-cholesterol (LDLc), small dense LDL-cholesterol (sdLDLc), Large buoyant LDL-cholesterol (lbLDLc), LDL-aggregates, Oxidized LDL, Lipoprotein associated phospholipase A2 (Lp-LPA2), ApoB

1. Introduction

While cholesterol was acknowledged as one of the components being present in the blood from 16th century onwards, it was Oncley et al in 1950 who isolated the beta globulin from fraction-III by means of ultracentrifugation. [1] Since then it was realized that the increasing LDL lipoprotein concentration emerged strongly as a risk for various atherosclerotic cardiovascular diseases (ASCVD) and was thus included as a primary prevention target parameter. [2] Though multiple studies have highlighted LDL lipoprotein concentration as the culprit, but later research further dissected LDL fractions to identify particle size to be more related with ASCVD. [3] Down the line researchers were able to segregate LDL particles between two broad categories including small dense LDL particles (sdLDc) and large buoyant LDL particles (lbLDLc), where the former category is associated with more atherogenicity and ASCVD. [4] Guidelines followed the initial research and quickly adopted the concept of particle size and some labs even marketed the LDL-particle size as of now. [5] The traditional concept of LDL cholesterol concentration measurements is still, however in vogue across the world and evolved from calculation based methods to directly measuring techniques which have improved at least the precision of LDL measurement. [6] Form the point of view developing and under developed economies the strategy still remains the most cost-effective, well-understood in terms of data interpretation and feasibility in terms of instrument availability. While the reliance on conventional lipid profile data currently seem to be the logical option for many set ups across the globe still, there are gaps with this “LDL concentration approach” to predict ASCVD risk. [7] LDL Lipoprotein structure has more to offer, than just the cholesterol content as the origin from VLDL to movement within circulation and with dumping down physiologically through LDL receptors into liver and pathologically into vasculature is highly variable between subjects. [8] Data suggest simple LDL concentration measures does not provide optimal appraisal of ASCVD in many subjects. Ramasamy et al in his very recent publication has clearly highlighted the limitations in lipid measurement technologies to highlight the need to develop biomarkers to better predict cardio vascular disease (CVD) risk. [7] Lawler et al using Nuclear Magnetic Resonance (NMR) Spectroscopy evaluated different fractions of LDL particles and concluded that small LDL particle was associated with CVD risk.[9] Finally literature at least now clearly acknowledges the LDL sub-fractions to be differently linked with ASCVD, and the whole lipoprotein risk evaluation using traditional lipid markers are poorly equated with future CVD prediction. [10]

2. Emerging biomarkers in Lipidology

a. Small dense LDL-cholesterol (sdLDLc)

The initial search comes in through discovery of LDL-fractions where an initial broader categorization was made as to segregate LDL particles into two categories i.e., sdLDLc and large buoyant LDL cholesterol (lbLDLc). sdLDLc in current research has been considered as risk for CVD. [11] However, lbLDLc were not considered atherogenic which clearly challenges the use of LDLc in clinics for identifying ASCVD risk.

b. ApoB measurements

Alongside the protein components within lipoprotein also entered clinical market as ApoA as surrogate for HDLc and ApoB for LDLc. The Insulin Resistance Atherosclerosis Study (IRAS) have graded ApoB measurements to be more predicative than LDLc.[12] However, research shows ApoB not to provide any additional information than conventional LDLc. [13,14]

c. Lipoprotein associated phospholipase A2 (Lp-LPA2)

This enzyme is found mainly in LDLc where it helps contributes to atherosclerosis but confers some anti-atherogenic advantages to HDLc as well. Lp-PLA(2) studies collaboration group have identified a strong association of enzyme activity and mass with various ASCVD adverse outcomes like stroke, heart diseases and hypertension. Similarly, Anderson J et al have demonstrated Lp-LPA2 as an independent risk factor for predicting coronary artery disease (CAD). [16] Though appealing in terms of its role to cleave oxidized phospholipids and acting as a chemo-attractant to bring inflammatory proteins and cells to unstable plaque, still large trials like JUPITER and HPS have not found additional benefit of its utilization for both primary and secondary prevention of ASCVD than conventional LDLc. [17,18] Another issues haunting Lp-PLA(2) is the measurement variability due to assay formats, which stands mandatory before its clinical use in routine. [19] So it seems that Lp-PLA(2) use in clinical arena is bound to face delays or may never be used due to incoming better markers.

d. LDL Particles

Over the last 2 decades LDL particles have been found to have multiple sizes, where the literature has identified varying atherogenic potential for LDL-sub particles. Gourgari et al have identified in a study LDL-particle size to be higher in polycystic ovarian syndrome subjects (PCOS) in comparison to controls which was related with markers of inflammation and insulin resistance. [20] Similarly others have highlighted LDL particles to be more related with ASCVD. [3] However, the contrasting evidence highlighted in the Multi-Ethnic Study of Atherosclerosis(MESA) observed slightly greater benefit by using LDLp/HDLp ratio but identified this risk prediction for coronary heart disease (CHD) to get attenuated after adjustment of standard lipid variables. [21]

e. Oxidized LDL

For some time researchers did thrive on the concept of LDL concentration and particle size, but emerging evidence from kinetic studies identified various post-translational modifications like oxidative changes. [22, 23] These oxidized LDL (oxLDLc) are considered to result in certain “damage associated molecular patterns” (DAMP), which are later to result in vascular inflammation. [22] So oxLDLc within vessel walls can act as new LDL biomarkers; however, no standardized lipid lowering therapy is yet available to prevent this oxidative damage in LDL.[23]

f. LDL-aggregates

Within vessel wall it has been demonstrated that LDL particles aggregate. [24] These aggregates of LDL particles within arterial walls are quite atherogenic and can cause changes like conversion of macrophages into foam cells and accumulation within smooth muscles to cause accelerated atherosclerosis and plaque formation by the enzyme sphingomyelinase (SMase). [24, 23] LDL-aggregates, though not in correlation with conventional lipid and inflammatory markers but still have been observed to change with lifestyle modifications, use of PCSK9 inhibitors and other treatment modalities. These LDL-aggregates are distinguished by the fact that they have increase sphingolipids to phospatidylcholine ratio, which accelerates the process of atherosclerosis and in turn predispose plaques to rupture.Therefore, LDL-aggregates may emerge as powerful diagnostic and monitoring tool in future. [23–25]

3. Futuristic incorporation in lipid clinic care pathways

While current clinical market poses both economic issues and lack of quality research, still visibility is now here that conventional lipid markers are not able to predict ASCVD in multiple cases and the need is ever appreciated for advance lipid biomarkers to address both personalized medicine and health economics. The below mentioned algorithm is meant for a dedicated lipid clinic where an individualized diagnosis of lipid pathology could be diagnosed to avoid pan-medical trials and to provide specific interventional approached to reduce ASCVD risk for the patients and genetic solutions for the family members.

This data, albeit discussed recently in literature replies to the critical question raised in the clinics that “why ASCVD prevalence did not correspond with LDL concentration and particle size?” Deeper insight intoLDLp interaction within plaque, ratio of sphingolipid / phosphatidylcholine as prevails within LDLp and the activity of sphingomyelinase (SMase) all finally converge towards plaque progression, rupture and thus the acute consequences resulting from the ASCVD. It is anticipated that SMase activity and genetic alterations in LDL aggregation will probably follow these phenotypic changes to clarify the mutations and polymorphisms underlying the varying development of plaques and onward ASCVD risk among individuals.

4. Closing remarks

Incorporation overtime to address one of the crucial villains to cause ASCVD would require additional biomarker arsenal to allow meaningful data to segregate risk prediction among individuals with similarities baseline LDL phenotypes i.e., Aggregation-prone LDLp and Aggregation-resistant LDLp. In this regard advanced lipid clinics can extend help to incorporate LDL particle measurements, phenotyping of LDL classes, functional assays to asses to learn LDL aggregation and oxidized LDL types. Molecular diagnostics can also be added to specifically diagnose the underlying genetic pathology. A one-time assessment can help predict risk for ASCVD related morbidity and mortality along with avoiding people with unnecessary lifelong medication, concerns and as a very powerful primary prevention tool. Perhaps larger tertiary care set ups in country should develop tools and arsenals to perform advanced lipid testing within dedicated lipid clinics to address the multifactorial pathogenesis of ASCVD to address the pushing needs to “personalized medicine”, cost-effective care provision and finally to segregate .patients who need lipid lowering treatment or otherwise.

Consent for publication: Not applicable (No individual data was presented)

Competing interests: The author has no competing interests to declare.

Data funding: There are no funding sources to disclose.

JCRM 2019-108 - SikhindharKhan UK_F1

Figure 1. The process of LDLp entry into carotid intima, to changeswithin the plaque resulting in plaque instability and onward rupture.

JCRM 2019-108 - SikhindharKhan UK_F2

Figure 2. Evolution LDL biomarkers for predicting adverse ASCVD consequences

References

  1. Oncley JL, Gurd FRM, Melin M (1950) Preparation and properties of serum and plasma proteins XXV. Composition and properties of human serum β-lipoprotein. J. Am. Chem. Soc. 68: 458–464.
  2. Piepoli MF, Hoes AW, Agewall S, Albus C, Brotons C, Catapano AL, et al. (2016) ESC Scientific Document Group. 2016 European Guidelines on cardiovascular disease prevention in clinical practice: The Sixth Joint Task Force of the European Society of Cardiology and Other Societies on Cardio vascular Disease Prevention in Clinical Practice (constituted by representatives of 10 societies and by invited experts) Developed with the special contribution of the European Association for Cardiovascular Prevention & Rehabilitation (EACPR). Eur Heart J. 37(29): 2315–2381. doi: 10.1093/eurheartj/ehw106. [Crossref]
  3. Otvos JD, Mora S, Shalaurova I, Greenland P, Mackey RH, Goff DC Jr. (2011) Clinical implications of discordance between low-density lipoprotein cholesterol and particle number. J Clin Lipidol. 5(2): 105–13. doi: 10.1016/j.jacl.2011.02.001. [Crossref]
  4. Srisawasdi P, Vanavanan S, Rochanawutanon M, Kruthkul K, Kotani K, Kroll MH (2015) Small-dense LDL/large-buoyant LDL ratio associates with the metabolic syndrome. Clin Biochem. 48(7–8): 495–502. doi: 10.1016/j.clinbiochem.2015.01.011. [Crossref]
  5. Kulkarni KR (2006) Cholesterol profile measurement by vertical auto profile method. Clin Lab Med. 26(4): 787–802. [Crossref]
  6. Miller WG, Myers GL, Sakurabayashi I, Bachmann LM, Caudill SP, Dziekonski A, et al. (2010) Seven direct methods for measuring HDL and LDL cholesterol compared with ultracentrifugation reference measurement procedures. Clin Chem. 56(6): 977–86. doi: 10.1373/clinchem.2009.142810. [Crossref]
  7. Ramasamy I (2018) Update on the laboratory investigation of dyslipidemias. Clin Chim Acta. 479: 103–125. doi: 10.1016/j.cca.2018.01.015. [Crossref]
  8. Silva IT, Almeida-Pititto Bd, Ferreira SR (2015) Reassessing lipid metabolism and its potentialities in the prediction of cardiovascular risk. Arch Endocrinol Metab. 59(2): 171–80. doi: 10.1590/2359-3997000000031. [Crossref]
  9. Lawler PR, Akinkuolie AO, Chu AY, Shah SH, Kraus WE, Craig D, et al. (2017) Atherogenic Lipoprotein Determinants of Cardiovascular Disease and Residual Risk Among Individuals With Low Low-Density Lipoprotein Cholesterol. J Am Heart Assoc. 6(7). pii: e005549. doi: 10.1161/JAHA.117.005549. [Crossref]
  10. Diffenderfer MR, Schaefer EJ (2014) The composition and metabolism of large and small LDL. Curr Opin Lipidol. 25(3): 221–6. doi: 10.1097/MOL.0000000000000067. [Crossref]
  11. Gerber PA, Nikolic D, Rizzo M (2017) Small dense LDL: an update. Curr Opin Cardiol. 32(4): 454–459. doi: 10.1097/HCO.0000000000000410. [Crossref]
  12. Williams K, Sniderman AD, Sattar N, D’Agostino R Jr, Wagenknecht LE, Haffner SM (2003) Comparison of the associations of apolipoprotein B and low-density lipoprotein cholesterol with other cardiovascular risk factors in the Insulin Resistance Atherosclerosis Study (IRAS). Circulation. 108(19): 2312–6. [Crossref]
  13. Fernández-Friera L, Fuster V, López-Melgar B, Oliva B, García-Ruiz JM, Mendiguren J, et al. (2017) Normal LDL-Cholesterol Levels Are Associated With Subclinical Atherosclerosis in the Absence of Risk Factors. J Am Coll Cardiol. 70(24): 2979–2991. doi: 10.1016/j.jacc.2017.10.024. [Crossref]
  14. Sniderman AD, Robinson JG (2018) ApoB in clinical care: Pro and Con. Atherosclerosis. pii: S0021-9150(18)31456-4. doi: 10.1016/j. atherosclerosis.2018.11.001. [Crossref]
  15. Lp-PLA (2) Studies Collaboration, Thompson A, Gao P, Orfei L, Watson S, Di Angelantonio E, Kaptoge S, et al. (2010) Lipoprotein-associated phospholipase A(2) and risk of coronary disease, stroke, and mortality: collaborative analysis of 32 prospective studies. Lancet. 375(9725): 1536–44. doi: 10.1016/S0140-6736(10)60319-4. [Crossref]
  16. Anderson JL (2008) Lipoprotein-associated phospholipase A2: an independent predictor of coronary artery disease events in primary and secondary prevention. Am J Cardiol. 101(12A): 23F-33F. doi: 10.1016/j.amjcard.2008.04.015. [Crossref]
  17. Ridker PM, MacFadyen JG, Wolfert RL, Koenig W (2012) Relationship of lipoprotein-associated phospholipase A2mass and activity with incident vascular events among primary prevention patients allocated to placebo or to statin therapy: an analysis from the JUPITER trial. Clin Chem 58: 877–86.
  18. Heart Protection Study Collaborative Group. Lipoprotein-associated phospholipase A2 activity and mass in relation to vascular disease and nonvascular mortality. J Intern Med 2010;268: 348–58. [Crossref]
  19. McConnell JP, Jaffe AS (2008) Variability of lipoprotein-associated phospholipase A2 measurements. Clin Chem. 54(5): 932–3. doi: 10.1373/clinchem.2008.103358. [Crossref]
  20. Gourgari E, Lodish M ,Shamburek R, Keil M, Wesley R, Walter M, et al. (2015) Lipoprotein Particles in Adolescents and Young Women With PCOS Provide Insights Into Their Cardiovascular Risk. J Clin Endocrinol Metab. 100(11): 4291–8. doi: 10.1210/jc.2015–2566. [Crossref]
  21. Steffen BT, Guan W, Remaley AT, Paramsothy P, Heckbert SR, McClelland RL, et al. (2015) Use of lipoprotein particle measures for assessing coronary heart disease risk post-American Heart Association/American College of Cardiology guidelines: the Multi-Ethnic Study of Atherosclerosis. Arterioscler Thromb Vasc Biol. 35(2): 448–54. doi: 10.1161/ATVBAHA.114.304349. [Crossref]
  22. Choi SH, Sviridov D, Miller YI (2017) Oxidized cholesteryl esters and inflammation. Biochim Biophys Acta Mol Cell Biol Lipids. 1862(4): 393–397. doi: 10.1016/j.bbalip.2016.06.020. [Crossref]
  23. Laufs U, Weingärtner O (2018) Pathological phenotypes of LDL particles. Eur Heart J. 39(27): 2574–2576. doi: 10.1093/eurheartj/ehy387.
  24. Deevska GM , Sunkara M, Morris AJ, Nikolova-Karakashian MN (2012) Characterization of secretory sphingomyelinase activity, lipoprotein sphingolipid content and LDL aggregation in ldlr-/- mice fed on a high-fat diet. Biosci Rep. 32(5): 479–90. doi: 10.1042/BSR20120036. [Crossref]
  25. Ruuth M, Nguyen SD, Vihervaara T, Hilvo M, Laajala TD, Kondadi PK, et al. (2018) Susceptibility of low-density lipoprotein particles to aggregate depends on particle lipidome, is modifiable, and associates with future cardiovascular deaths. Eur Heart J. 39(27): 2562–2573. doi: 10.1093/eurheartj/ehy319. [Crossref]

Expectations and Attitudes Regarding Chronic Pain Control: An Exploration Using Mind Genomics

Abstract

We present the emerging science of Mind Genomics, to understand people’s responses to health-related issues, specifically pain. Mind Genomics emerge out of short, affordable, scalable, east-to-run experiments. The topic, here pain, is deconstructed into four questions, each with four separate answers (elements.) The answers are combined into vignettes, presented to respondents, who rate the entire vignette. Emerging from the study are the ratings and the response times to the vignettes, both of which are deconstructed into the contributions of the different underlying elements which the vignettes comprise. The answers cannot be gamed, and the data quickly reveal what is important to the individual, as well as revealing the existence of new-to-the-world mind-sets which differ in the pattern of elements that they find important. Mind Genomics  provides the opportunity to understand the person’s needs and wants for specific health as well as other experiential situations where human judgment is relevant.

Introduction

Pain is an inevitable companion in our life’s journey. Pain is defined through its association with actual or potential tissue damage, denoting it as a necessary characteristic of the experience, but also recognizing that events other than tissue damage can serve as determinants, consistent with a bio psychosocial model of pain [1,2]. This definition of pain denotes multiple causal factors underlying pain, beyond the issue pathology.

There is no dearth of studies on pain, whether these studies are report of pain from one’s everyday life [3], a topic dealt with in medicine [4], and a topic of scientific investigation [5]. When we talk about pain, can we probe into the mind of the person beyond simply the report, beyond a simplistic scale? Can we move beyond simple indicators, approaching a more detailed description of one’s pain but yet not forcing the respondent to become a scientist?

Pain, a highly subjective phenomenon, often refers to a sensory experience resulting from actual damage to the body or from non-bodily damage [6]. Pain may be influenced by psychological mechanisms such as: attention, emotion, beliefs and expectations [7].

In general, there are two different classifications of physical pain, visceral and somatic. Visceral pain originates in the internal organs whereas somatic pain stems from skin, muscle, soft tissue, and bone. There are many types of pain which fall under these categories. A person’s pain can also be classified as acute or chronic. Pain can be described as nerve pain, psychogenic pain, muscle pain, abdominal pain, back pain, pelvic pain, etc.

Subjective pain is influenced by its intensity and by interventions to treat the pain. Expectations and attitudes towards pain, may stem from psychological processes that are fundamental to learning across various sensory experiences and affect. Understanding expectations and attitudes towards pain may help us form communication messaging to help individuals deal more effectively with their chronic pain.

The subjective nature of pain makes it difficult to test the actual nature of perceived pain across populations, within a country, and in different countries. There are accepted methods of testing the actual perception of pain, specifically pain thresholds and pain tolerance, as well as psychophysical scaling of pain. One example is measuring the time one can submerge a limb in an ice bath, to test the ability of subjects to tolerate pain under varying conditions, most notable with the testing of analgesics of anesthetics. These methods give a measure of the all-or-none response to pain, and even the qualitative nature of the pain, but do not give a sense of the mind of the person who is undergoing the pain.

Increase in pain accompanies one’s beliefs that a certain treatment will cause pain or increase one’s symptoms overtime [7]. Negative beliefs regarding pain and its effects may occur in some types of chronic pains. To test whether expectations affect pain, studies tested the extent to which expectations influenced physiological responses among individuals. Placebo treatments truly reduced pain intensity [8–12]. These studies also indicated that short-term expectations varied and strongly affected perceptions of pain and pain-evoked responses [13].

Other studies linked differences in expectations regarding pain to the magnitude of responses to pain treatments [14]. Research on the relationship between expectations and pain experiences, showed that expectations about treatments and painful stimuli profoundly influenced behavioral markers of pain perception [7].

Pain treatments also bring positive changes in negative emotions [15]. Expectations affect pain through attention, executive functioning, value learning, anxiety and negative emotions [16]. Attitudes towards pain such as anxiety raised subjective pain. Pain is, thus a complex experience, involving sensory, motivational, and cognitive components. Affect any one of these components may change one’s attitudes towards pain [7].

Whereas studies indicate that beliefs influenced pain experience, it is unclear to what extent psychological processes such as attention, anxiety and emotions affect choice of treatments and what communication messages may mediate the effects of these psychological processes. This study tests communication messaging that affect emotion, attitudes towards pain and choice of treatment for pain.

In his book, Pain: The Gift Nobody Wants, author Paul Brand, MD describes his observations across cultures. Growing up as the child of missionaries in India and then moving to the US, Brand noted the difference in pain and suffering that existed in the East versus the West. He noted that, “as a society gained the ability to limit suffering, it lost the ability to cope with what suffering remains”. He stated that he believed that Easterners have learned to control pain at the level of the mind and spirit whereas, Westerners tend to view pain and suffering as an injustice or failure and an infringement on their right to happiness [17].

In the newly developing science of Mind Genomics we attempt to demonstrate a richer understanding of one’s inner life by presenting the respondent (or ill/healthy pain sufferer, here) with vignettes describing the inner experience, instructing the respondent to rate the fit of the vignettes, one at a time, and then estimating the degree to which each of the elements of the vignette ‘fits’ the respondent.

Method

Mind Genomics as an emerging science has been previously presented [18]. Mind Genomics works by presenting respondents with vignettes, combinations of statements which together tell a story. The respondent is instructed to judge the vignette, rating the vignette as a totality. The rating scale for this study is simply ‘How well does this describe you?’

The statements, elements in the language of Mind Genomics, present simple ideas. The approach requires the construction of four questions which ‘tell a story.’ For each question, the researcher is required to provide four answers, all expressed in simple language.  Table 1 presents the four questions, and the four answers to each question. Ideally, the questions and answers should deal with the topic, here pain, but need not mention pain directly. Rather, the questions and answers should be relevant to the topic.

Table 1. The four questions and the four answers to each question.

Question A: how would you describe the nature of pain you are feeling?

Pain bothers me all over my body

The pain is localized but intolerable

The pain radiates and makes it difficult to function

The pain is minor but frequent and annoying

Question B: Describe a situation that would make you feel more comfortable

The doctor explains to me how to deal with the pain

I try to deal with the pain to work through it

I’m happy when I can use a device that delivers therapeutic solution

I just like taking a pill that deals with the pain.

Question C: Describe how would you like to to avoid future pain

I would like to have a diet that is tailored to reduce my pain

I would like exercises and stretches that reduce pain

I would like regular therapy sessions to reduce my pain

I would like a prescription that gives me the medication I need to feel better

Question D: Describe what you would like the doctor to do

The doctor should give me advice

The doctor should give me a shot that delivers long term relief

The doctor should set me up with a system for me to follow

The doctor should give me a regular schedule of visits to treat my pain

The answers in Table 1 are combined by experimental design into a set of 24 vignettes, with each vignette comprising 2–4 elements. Table 2 shows an example of the first six vignettes. The elements appear an equal number of times. Each of the 16 elements is, by design, statistically independent of every other element.

Table 2. The first seven vignettes for the first respondent, created by the experimental design. The table shows the combinations, then the combinations transformed into binary, and then the ratings.

Vig1

Vig2

Vig3

Vig4

Vig5

Vig6

Vig7

A

4

0

4

3

1

0

0

B

3

2

1

2

1

1

3

C

4

2

0

0

4

4

3

D

2

3

4

0

3

1

4

Binary

A1

0

0

0

0

1

0

0

A2

0

0

0

0

0

0

0

A3

0

0

0

1

0

0

0

A4

1

0

1

0

0

0

0

B1

0

0

1

0

1

1

0

B2

0

1

0

1

0

0

0

B3

1

0

0

0

0

0

1

B4

0

0

0

0

0

0

0

C1

0

0

0

0

0

0

0

C2

0

1

0

0

0

0

0

C3

0

0

0

0

0

0

1

C4

1

0

0

0

1

1

0

D1

0

0

0

0

0

1

0

D2

1

0

0

0

0

0

0

D3

0

1

0

0

1

0

0

D4

0

0

1

0

0

0

1

Rating

7

8

4

7

9

7

9

Binary

100

100

0

100

100

100

100

RT (response time) in seconds

10

6

9

6

10

8

7

Each respondent evaluates a unique set of 24 vignettes. The underlying mathematical structure of the experimental design is maintained, but the specific combinations are changed, in a permutation scheme which preserves the mathematical properties of the design [19]. The permutation covers many more combinations of elements compared to the standard approach of creating one experimental design and presenting that design to many respondents.  The Mind Genomics achieves stability by testing many combinations, each a single time, but the expanded coverage ensures that a great of the ‘space of combinations’ is covered. It is difficult to be very ‘wrong’ with a Mind Genomics study because the scope. In contrast, traditional research works with a very small experimental design, e.g., equivalent to the combinations tested by one person, but the combinations are tested by many respondents in order to obtain a stable estimate of the value for each combination.

Mind Genomics and traditional statistics are on opposite sides in terms of what generates valid data. Is valid data obtained by sampling a few of the many possible combinations, albeit with stability for each point (traditional), or by sampling a great many of the combinations, albeit with less stability at any point. A good analogy to Mind Genomics is, metaphorically, the MRI, which discovers the configuration of tissue by taking different ‘snapshots’ and integrating them into one picture.  With the permuted experimental one need not ‘be sure’ that the limited number of combinations is the correct set to represent the total set of possible alternatives. With as few as 25 respondents, the number of respondents participating, generating a total of 720 different combinations has covered the space quite well.

Running the Mind Genomics experiment

The experiment is run on the web, typically with respondents from a specific population who have agreed to participate (e.g., those being treated for a condition), or more typically with respondents recruited from the general population, when the objective is a quick ‘scan’ of what is important.  The base sizes of these studies range from 25 for an exploration to 500 for a massive deconstruction of the population into different mind-sets.  The more typical base size of 25–50 respondents reveals quite a bit about the nature of people’s minds with regard to a particular issue.  This study shows the type of learning emerging from this small base size of respondents from the general population, and can be followed with many different studies to follow up on various interesting aspects.

The elements, answers to the questions, are created by experimental design [20]. The 16 elements are combined into 24 combinations or vignettes, similar in structure to the vignettes shown schematically in Table 2. The vignette can be presented on smartphones, tablets, or PC’s.

Although the respondent might feel that the vignettes are created in a random fashion, the reality is just the opposite. The vignettes are created within the framework of the design, which prescribe the exact combinations. The elements are placed one atop the other, centered, without any connectives, making the respondent’s task easier as the respondent ‘grazes for information’.

The experimental design ensures that the elements are statistically independent; appear several times against different backgrounds provided by the other elements in the vignette. Each respondent evaluates a unique set of 24 vignettes, permuted as noted above, so that the design structure is maintained but the specific combinations are new. The permutation system allows a great deal of the design space, or combinations, to be tested, and allows the information to emerge even when the researcher has absolutely no idea what will be important and what won’t. In other words, Mind Genomics is a discovery system, and not a confirmation system. One can learn quickly from a base of zero knowledge, simply by doing 1–4 easy studies of different facets of a topic.

The respondents who participated were US residents, members of a 10+ million world-wide panel of Luc.id Inc., who had previously agreed to participate in these studies for a reward administered by the panel provider. All respondents participated anonymously. The only information about the respondent was age, gender, and the answer to the third question about what type of pain they had.  There were five answers to the third question, three dealing with chronic pain of various sorts, and two saying either ‘no pain,’ or ‘not applicable.’  All respondents were classified by gender, age, and by either pain/yes versus pain/no.

Preparing the data for analysis

The respondent assigns a rating to assess ‘How much does this describe how you feel’. The low anchor, 1, is ‘not at all.’ The high anchor, 9, is ‘very much.’ The Mind Genomics program bifurcates the scale, dividing it into the lower part, ratings of 1–6, transformed to 0, plus a very small random number (<10–5), and a high part, ratings of 7–9, transformed to 100, plus a very small random number. The bifurcation comes from the decades of experience which suggest that managers and scientists alike do not ‘understand’ the meaning or use of the Likert or category scale, but they easily understand the meaning of a no/yes, binary scale.  The choice of where to bifurcate is left to the researcher. Thirty-five years of experiments suggest that a 2/3 vs 1/3 division seems to work well.  The small random number added to the binary transformed data ensures that when it is time to run the OLS (ordinary least-squares) regression on the data at the level of the individual respondent, there will not be a ‘crash’ of the regression program when the respondent confined the ratings to either the low range (1–6) or to the high range (7–9.) Either of those two cases produces all 0’s or all 1’s, crashing the regression. The small random number ensures that there is variability in the dependent variable, the binary transformed data.

How the different elements drive the binary transformed rating

Table 3 shows the parameters and relevant statistics for the additive model created from the ratings of the total panel, after transformation to a binary scale. The model itself is a simple linear equation of the form: Binary Rating = k0 + k1(A1) + k2(A2) … K16(D4). The experimental design allows us to create the model either at the level of the individual respondent or at the grand level, combining all of the data from the ‘relevant’ respondents, with relevant being

Table 3. Parameters of the model for ‘Fits Me’ after binary transformation. The data come from the Total Panel (720 observations, 24 tested vignettes from each of 30 respondents.) The table is sorted in descending order of coefficient for ‘describes me.’ At the right is the associated coefficient for response time.


Coeff Desc.

T-stat

P-Value

Coeff RT

Additive constant

46

4.68

0.00

C2

I would like exercises and stretches that reduce pain

6

0.95

0.34

0.9

D3

The doctor should set me up with a system for me to follow

2

0.39

0.69

2.1

B2

I try to deal with the pain to work through it

2

0.39

0.70

1.9

A1

Pain bothers me all over my body

1

0.23

0.82

1.3

A3

The pain radiates and makes it difficult to function

0

0.05

0.96

1.6

C3

I would like regular therapy sessions to reduce my pain

-2

-0.28

0.78

1.7

D2

The doctor should give me a shot that delivers long term relief

-3

-0.53

0.59

1.8

D4

The doctor should give me a regular schedule of visits to treat my pain

-3

-0.58

0.56

1.7

B3

I’m happy when I can use a device that delivers therapeutic solution

-4

-0.65

0.52

2.1

D1

The doctor should give me advice

-4

-0.69

0.49

1.5

B1

The doctor explains to me how to deal with the pain

-4

-0.73

0.47

1.8

A4

The pain is minor but frequent and annoying

-5

-0.90

0.37

2.1

A2

The pain is localized but intolerable

-6

-0.95

0.34

1.2

C4

I would like a prescription that gives me the medication I need to feel better

-7

-1.19

0.24

1.4

C1

I would like to have a diet that is tailored to reduce my pain

-7

-1.22

0.22

1.4

B4

I just like taking a pill that deals with the pain.

-8

-1.35

0.18

1.6

The analysis suggests the following:

  1. Additive constant, the expected binary value in the absence of elements: Without any elements, the likely response that the vignette will ‘describe me’ is about 46%. By design, all vignettes comprised 2–4 elements, so the additive constant is an estimated parameter.  Thus, the value of 46 for additive constant says that half the time respondents will answer that whatever appears will describe them. It is the elements which must do the work to move beyond this almost 50% agreement rate. It is worthwhile commenting here that this baseline of 46% is modest. When the topic is credit cards and the rating is ‘interested in acquiring this credit card,’ the additive constant plummets to about 10–15. When the topic is pizza and the rating is ‘interested in eating this pizza,’ the additive constant skyrockets to 60–70.
  2. There are no very strong elements for the total panel: That is, no element drives the description of ‘me.’ This weakness can either be the result of choosing the wrong elements, or the result of dealing with two or perhaps even three or more different populations, who describe their impressions by different terms, and who may live in quite different worlds of pain.
  3. The highest scoring element is C2, I would like exercises and stretches that reduce pain. This element generates a coefficient of only 6, and has a t-statistic of 0.95, with a probability of 0.34 that it came from a distribution with a true mean of 0. That is, it’s quite likely that were we to do this study again, we would come up with a coefficient much lower than 6, probably 0 or thereabouts.
  4. The remaining elements do not ‘fit’ the respondent:  It may well be that the elements are simply incorrect and others will fit the respondent better, or more likely that we are dealing with a segmented population of individuals, some of whom feel that an element ‘fits them,’ whereas others feel that the same element ‘does not fit them.’ In such a situation the responses cancel each other, and we are left with a coefficient around 0, denoting ‘no fit.’

Key subgroups

We know three additional things about the respondent based upon the self-profiling questions completed during the study. The first is gender, the second is age, and the third is whether or not they suffer pain on a regular basis. In this computerized application, the respondent is required to select one of two genders (male/female), and required to put in the year of birth, which provides age.  The third question is left to the discretion of the researcher. In this study is the selection of pain, with five options. Two options are defined as ‘no pain’ (actual selection of ‘no pain’ as an answer, selection of not applicable). The remaining three options as pain (i.e. pain in the limbs, back, etc.).  We will look at gender, age, and self-reported pain as the three self-defined subgroups. We will also explore two new subgroups, mind-sets inherent in the population but revealed by understanding patterns of responses, behavioral patterns, rather than self-classification.

The focus of interest in Mind Genomics studies is on the additive constant as the ‘baseline,’ and then on the ‘story’ told by the winning elements.  These elements are operationally defined as having a value of +6.51 or higher, which becomes 7 when rounded to the nearest whole number.

Gender

  1. Males show a higher additive constant than do females (57 vs 38). In the absence of elements, men are more likely to say that a vignette ‘describes ME.’  Women are less likely to say that, and require more specification.
  2. We get a good sense of what is important by looking at the elements which are most positive (most like me), and most negative (least like me)
  3. For men, the single phrase which most describes them is

    C2: I would like exercises and stretches that reduce pain

  4. For men, the single phrase which least describes them is

    C1: I would like to have a diet that is tailored to reduce my pain

  5. For women, the two phrases phrase which most describe them are

    B2: I try to deal with the pain to work through it,

    A1: Pain bothers me all over my body. The degree of fit is less, however, for these elements than the corresponding best fits for males.

  6. For women, the phrase which least describes them is

    B4: I just like taking a pill that deals with the pain.

Age: Under 50 versus 50+

Respondents provided the year of their birth. One respondent did not provide the year and was eliminated from this particular analysis by age.

  1. Surprisingly, the additive constant is much higher for the younger respondents versus the for the older respondents (48 vs 31.)
  2. For the younger respondents, there are no strong elements which fit them. The two elements which most describe them are those which suggest control over the pain:

    C2: I would like exercises and stretches that reduce pain

    D3: The doctor should set me up with a system for me to follow

  3. For the younger respondents, the two elements which least describe them are those which suggest passivity, and no control over the pain.

    B1: The doctor explains to me how to deal with the pain

    B4: I just like taking a pill that deals with the pain.

  4. For the older respondents, the two elements which most describe them are actual experience to reduce the pain, as well as a description of the experience.

    A3: The pain radiates and makes it difficult to function

    C2: I would like exercises and stretches that reduce pain

  5. For the older respondents, the three elements which least describe them is passivity

    D1: The doctor should give me advice

    C4: I would like a prescription that gives me the medication I need to feel better

    C1: I would like to have a diet that is tailored to reduce my pain

No pain versus pain

As part of the self-profiling classification, the respondents selected the type of pain, if any, afflicting them. The respondents who check any of the three types of pain assigned to the group saying YES. The remaining respondents were assigned to the group saying NO.

  1. The additive constant is virtually the same, 46 vs 48, meaning that in the absence of elements in the vignette; a little fewer than 50% of the responses will be ‘describes me.’
  2. For those with pain, the phrase which most describes them is

    C2:  I would like exercises and stretches that reduce pain.

  3. For those with pain, the element which least describes

    C1:  I would like to have a diet that is tailored to reduce my pain

  4. For those with no pain, virtually no element most describes them
  5. For those with no pain, many elements least describe. The strong element which least describes is

    C4: I would like a prescription that gives me the medication I need to feel better

Mind-Sets: Dividing respondents by the patterns of their coefficients for a specific topic

We have just seen that there are some differences in terms of ‘describes me’ across genders, and across those who define themselves as having pain versus no pain. These are ways that people describe themselves. People may differ in ways that the researcher cannot describe in simple terms, or even in way that they themselves don’t understand.

A major tenet of Mind Genomics is that within any topic area, such as the description of pain presented here, there are fundamental differences across people, differences that are obvious once demonstrated, but differences limited to a single topic area.  This is the case of the data here. Even within the small sample of 30 respondents we can extract two, possibly three different mind-sets. The method for extracting mind-sets has been previously described [21]. Quite simply, the technique is a matter of clustering the respondents into two or three groups based upon the pattern of their 16 coefficients. The statistical method of clustering is well accepted [22] All that remains is the clustering, extracting the small groups with the property that these mutually exclusive groups represent different ways of thinking about the topic.

Table 4 shows the results for the two mind-set segments emerging from the clustering of the 30 respondents. A base size of 25–30 suffices to reveal the nature of these different mind-sets, especially because the segments are so obviously different and interpretable.

Table 4. Coefficients for the binary-transformed scale ‘Describes me’ across gender, age, pain, and mind-set, respectively. Coefficients of +7 or more are presented in bold, and shaded.


Male

Female

Age<50

Age 50+

Pain Yes

Pain No

Mind Set 1: Wants a cure

Mind Set 2: Simplicity through the doctor

Additive constant

57

38

58

31

46

48

37

54

A1

Pain bothers me all over my body

1

4

-1

3

6

-9

10

-9

A2

The pain is localized but intolerable

-4

-4

-9

0

-3

-11

-2

-9

A3

The pain radiates and makes it difficult to function

1

1

-7

9

2

-4

10

-11

A4

The pain is minor but frequent and annoying

-11

2

-5

-2

-2

-12

-3

-8

B1

The doctor explains to me how to deal with the pain

-8

-1

-11

2

-7

1

3

-12

B2

I try to deal with the pain to work through it

-2

4

-1

4

4

-2

8

-3

B3

I’m happy when I can use a device that delivers therapeutic solution

-6

-3

-7

-1

-4

-2

1

-9

B4

I just like taking a pill that deals with the pain.

-9

-8

-12

-5

-7

-11

-16

1

C1

I would like to have a diet that is tailored to reduce my pain

-15

0

-5

-10

-10

-3

2

-17

C2

I would like exercises and stretches that reduce pain

13

-3

5

7

10

-5

9

3

C3

I would like regular therapy sessions to reduce my pain

-1

-3

-3

1

-2

-2

3

-7

C4

I would like a prescription that gives me   the medication I need to feel better

-11

-4

-4

-9

-5

-14

-9

-5

D1

The doctor should give me advice

-7

-5

-1

-9

-4

-3

-2

-4

D2

The doctor should give me a shot that delivers long term relief

-9

0

-1

-5

-3

-3

-6

3

D3

The doctor should set me up with a system for me to follow

-1

2

5

-1

4

-2

-4

10

D4

The doctor should give me a regular schedule of visits to treat my pain

-10

1

0

-5

-2

-6

-8

4

  1. Mind-Set 1 (wants a cure) begins with a low additive constant, 37. To them, it’s not the general response which ‘describes me’ but rather the specific phrase. Mind-Set 1 suffers pain, and wants a cure. Here are the elements which Mind-Set 1 feels best describes them:

    A1: Pain bothers me all over my body

    A3: The pain radiates and makes it difficult to function

    C2: I would like exercises and stretches that reduce the pain

  2. Mind-Set 1 do not want simple medical treatment which will alleviate their pain. Here is the element which is they feel least describes them:

    B4: I just like taking a pill that deals with the pain.

  3. Mind Set 2 (simplicity through the doctor) shows a higher additive constant, 54. Mind-Set 2 is less discriminating among elements. Mind-Set 2 wants simplicity. Here is the one element that they feel best describes them:

    D3: The doctor should set me up with a system for me to follow

  4. Mind Set 2 does not want to take responsibility. Here are the elements that they feel least describe them:

    C1: I would like to have a diet that is tailored to reduce my pain

    B1: The doctor explains to me how to deal with the pain

    A3: The pain radiates and makes it difficult to function

Response times as a measure of cognitive processing of information

At the same time that the respondents were reading the vignettes, the response time was being measured. Response time is operationally defined as the time between the appearance of the vignette and the assignment of the rating. The experiment was executed on the internet.

 The respondent was unaware of response time being measured, being instructed simply read the vignette and assign a ‘gut-level’ judgment. Occasionally, in about 10% of the cases, the response time was longer than 10 seconds, suggesting that the respondent was doing something as well, so-called multi-tasking. Those response times of 10 seconds or longer were recoded as 10 seconds. Figure 1 shows the distribution of the 720 response times (30 respondents, each evaluating 24 vignettes)

Mind Genomics-008 IMROJ Journal_F1

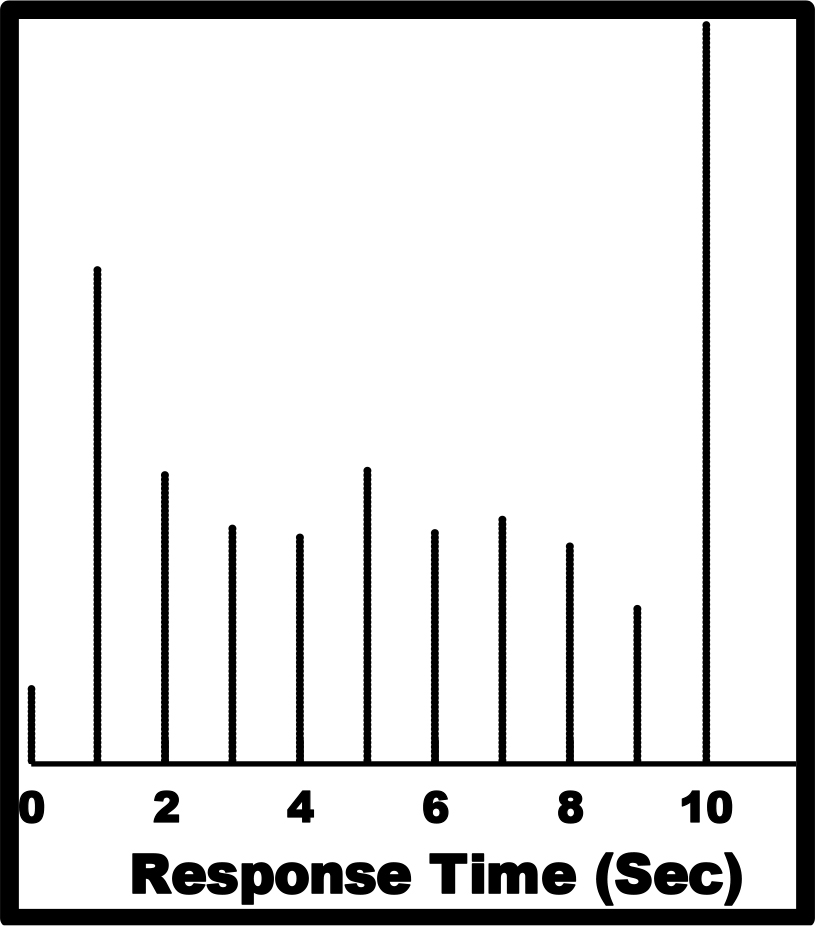
Figure 1. Distribution of response times for the total panel of 30 respondents, each rating 24 unique vignettes.

Response time patterns for different subgroups

The measurement of response times as a key feature of Mind Genomics began during the summer of 2019. In the studies run since that introduction, the response time data suggests that when the topic deals with an important health issue, the respondents spend a long time reading the vignette, and thus their response times are long, often 1.0 seconds or longer. When the topic deals with something commercial or ‘fun’ the response times are very short, around 0.2 – 0.7 seconds.

Table 5 presents the response time coefficients for the key subgroups. The model for response time is written in the same way as the model for the binary transformed rating, with the key difference being that that the model for response time does not have an additive constant. The ingoing assumption is that the response time is 0 when there are no elements in the vignette.

Table 5. The coefficients for the response time models. The models do not feature an additive constant.


Male

Female

Age <50

Age 50+

Pain YES

Pain NO

Mind-Set 1: Wants a cure

Mind-Set 2: Simplicity through the doctor

A1

Pain bothers me all over my body

1.3

1.1

1.0

1.6

1.0

2.0

1.3

1.3

A2

The pain is localized but intolerable

1.0

1.2

1.3

1.1

1.1

1.5

1.0

1.4

A3

The pain radiates and makes it difficult to function

1.7

1.5

1.8

1.4

1.8

1.2

1.6

1.7

A4

The pain is minor but frequent and annoying

2.5

1.7

1.9

2.5

1.9

2.7

1.8

2.6

B1

The doctor explains to me how to deal with the pain

1.8

1.9

1.2

2.6

1.9

1.6

1.8

1.7

B2

I try to deal with the pain to work through it

2.3

1.6

1.6

2.1

2.1

1.5

2.1

1.7

B3

I’m happy when I can use a device that delivers therapeutic solution

2.1

2.3

1.8

2.7

2.3

1.8

2.0

2.2

B4

I just like taking a pill that deals with the pain.

2.0

1.0

1.1

2.2

1.9

0.8

1.4

1.8

C1

I would like to have a diet that is tailored to reduce my pain

1.6

1.0

1.5

1.5

1.7

0.5

1.3

1.4

C2

I would like exercises and stretches that reduce pain

1.2

0.6

1.2

0.8

1.3

-0.1

0.9

1.0

C3

I would like regular therapy sessions to reduce my pain

1.9

1.5

1.7

1.9

2.0

0.9

1.4

1.9

C4

I would like a prescription that gives me the medication I need to feel better

2.1

0.6

1.7

1.6

2.0

0.0

1.2

1.7

D1

The doctor should give me advice

1.5

1.5

1.4

1.5

1.5

1.3

1.4

1.6

D2

The doctor should give me a shot that delivers long term relief

1.5

2.1

1.6

2.0

1.9

1.5

1.7

1.9

D3

The doctor should set me up with a system for me to follow

1.7

2.7

2.0

2.2

2.0

2.2

2.4

1.8

D4

The doctor should give me a regular schedule of visits to treat my pain

1.7

1.8

1.4

2.0

1.8

1.4

1.3

2.1

In Table, coefficients of 2.0 or higher are shaded and shown in bold. These are the elements to which the respondent pays attention.  There are some simple patterns which emerge from visual inspection of these elements that are processed ‘more slowly.’

  1. For gender, males focus on the description of symptoms.

    A4  The pain is minor but frequent and annoying

    B2   I try to deal with the pain to work through it

    B3   I’m happy when I can use a device that delivers therapeutic solution

    C4  I would like a prescription that gives me the medication I need to feel better

    B4   I just like taking a pill that deals with the pain.

  2. For gender, females want a relationship, or at least someone/something external to them.

    D3  The doctor should set me up with a system for me to follow

    B3   I’m happy when I can use a device that delivers therapeutic solution

    D2  The doctor should give me a shot that delivers long term relief

  3. For age, those under 50 focus on only one element:

    D3  The doctor should set me up with a system for me to follow

  4. For age, those 50+ focus on a number of phrases, most dealing with methods to assure pain reduction

    B3   I’m happy when I can use a device that delivers therapeutic solution

    B1   The doctor explains to me how to deal with the pain

    A4  The pain is minor but frequent and annoying

    B4   I just like taking a pill that deals with the pain.

    D3  The doctor should set me up with a system for me to follow

    B2   I try to deal with the pain to work through it

    D4  The doctor should give me a regular schedule of visits to treat my pain

    D2  The doctor should give me a shot that delivers long term relief

  5. For pain, those with PAIN YES, i.e., who say they suffer from one or another pain, the focus is on what stops the pain, i.e., assure pain reduction

    B3   I ‘m happy when I can use a device that delivers therapeutic solution

    B2   I try to deal with the pain to work through it

    D3  The doctor should set me up with a system for me to follow

    C3  I would like regular therapy sessions to reduce my pain

    C4  I would like a prescription that gives me the medication I need to feel better

  6. For pain, those with PAIN NO, i.e., who say that they do not suffer from pain, the focus is on descriptions of pain

    A4  The pain is minor but frequent and annoying

    D3  The doctor should set me up with a system for me to follow

    A1  Pain bothers me all over my body

  7. For Mind-Sets, Mind-Set 1 (Wants a cure)

    D3  The doctor should set me up with a system for me to follow

    B2   I try to deal with the pain to work through it

    B3   I’m happy when I can use a device that delivers therapeutic solution

  8. For Mind-Sets, Mind-Set 2 (Simplicity through the doctor)

    A4  The pain is minor but frequent and annoying

    B3   I’m happy when I can use a device that delivers therapeutic solution

    D4  The doctor should give me a regular schedule of visits to treat my pain

Finding the mind-sets in the population using a PVI (Personal Viewpoint Identifier)

The mind-sets reveal different ways of perceiving the nature of pain.  The mind-sets represent a way to divide what is likely a continuum of feelings and points of view into at least two distinct groups, a division which may provide further understanding, and certain a division that can be used to deal with patients in different, and possibly more appropriate fashion.

Table 6 shows, however, that it’s unlikely to identify mind-sets by their age and gender. It is also quite possible that there are no direct classifications of who a person ‘is’ or what a person ‘experiences’ which can easily assign a person to one of these two mind-sets.

Table 6. How the two emergent mind-sets for pain distribute on the self-profiling classification in terms of age, sex, and experience of pain.


Mind-Set1 Wants a cure

Mind-Set2 Simplicity through the doctor

Total

Male

6

10

16

Female

9

5

14

Total

15

15

30

Under 50

7

9

16

50+

7

6

13

Total

14

15

29

NOPAIN

6

3

9

YESPAIN

9

12

21

Total

15

15

30

An alternative way to assign new individuals to mind-set has been developed by author Gere. It is called the PVI, the personal viewpoint identifier. The PVI comprises a set of six questions, answered with one of two answers, no or yes.  The pattern of the answers to the six questions assigns the respondent to one of the two mind-sets.  Figure 2 shows the PVI questionnaire at the left, and the response emerging, given either to the physician and/or to the patient/client.  The questions themselves are taken from the actual study. These are the answers or elements, now turned into questions.

The PVI can be deployed along with additional information obtained during the questions. Thus, Figure 2 shows that the respondent, a new person not part of the previous study establishing the PVI, is asked for his or her email. Other questions can be asked, to relate mind-set membership to external variables, whether of a medical/health nature, or of a life-style nature.

Discussion & Conclusions

Since pain is a complex sensation involving sensory, motivational, and cognitive components, and affecting any one of these may change one’s attitudes towards pain [7]; we tested the effect of communication messaging, across mind-set segments towards pain. We tested how each min-set segment we identified emotionally responds to chronic pain, and which treatment choices are preferred by attitudinal mind-sets towards pain.

People who belong to the first mind-set segment feel the pain as radiating and challenging their daily functioning. The pain is very bothersome, but they choose to alleviate it by exercises and stretching. They chose to avoid medical treatment to simply deal with the pain and its ramifications.  People belonging to the second mind-set segment also view their chronic pain as radiating and challenging their daily functioning.  They, however, choose to simply take pain medication their doctor will prescribe.  They expect their doctor to also set them up with a system to follow.  In addition, they do not want to take responsibility for self-managing the illness which causes their pain. They prefer to avoid a diet that is tailored to reduce their pain.

Mind Genomics-008 IMROJ Journal_F2

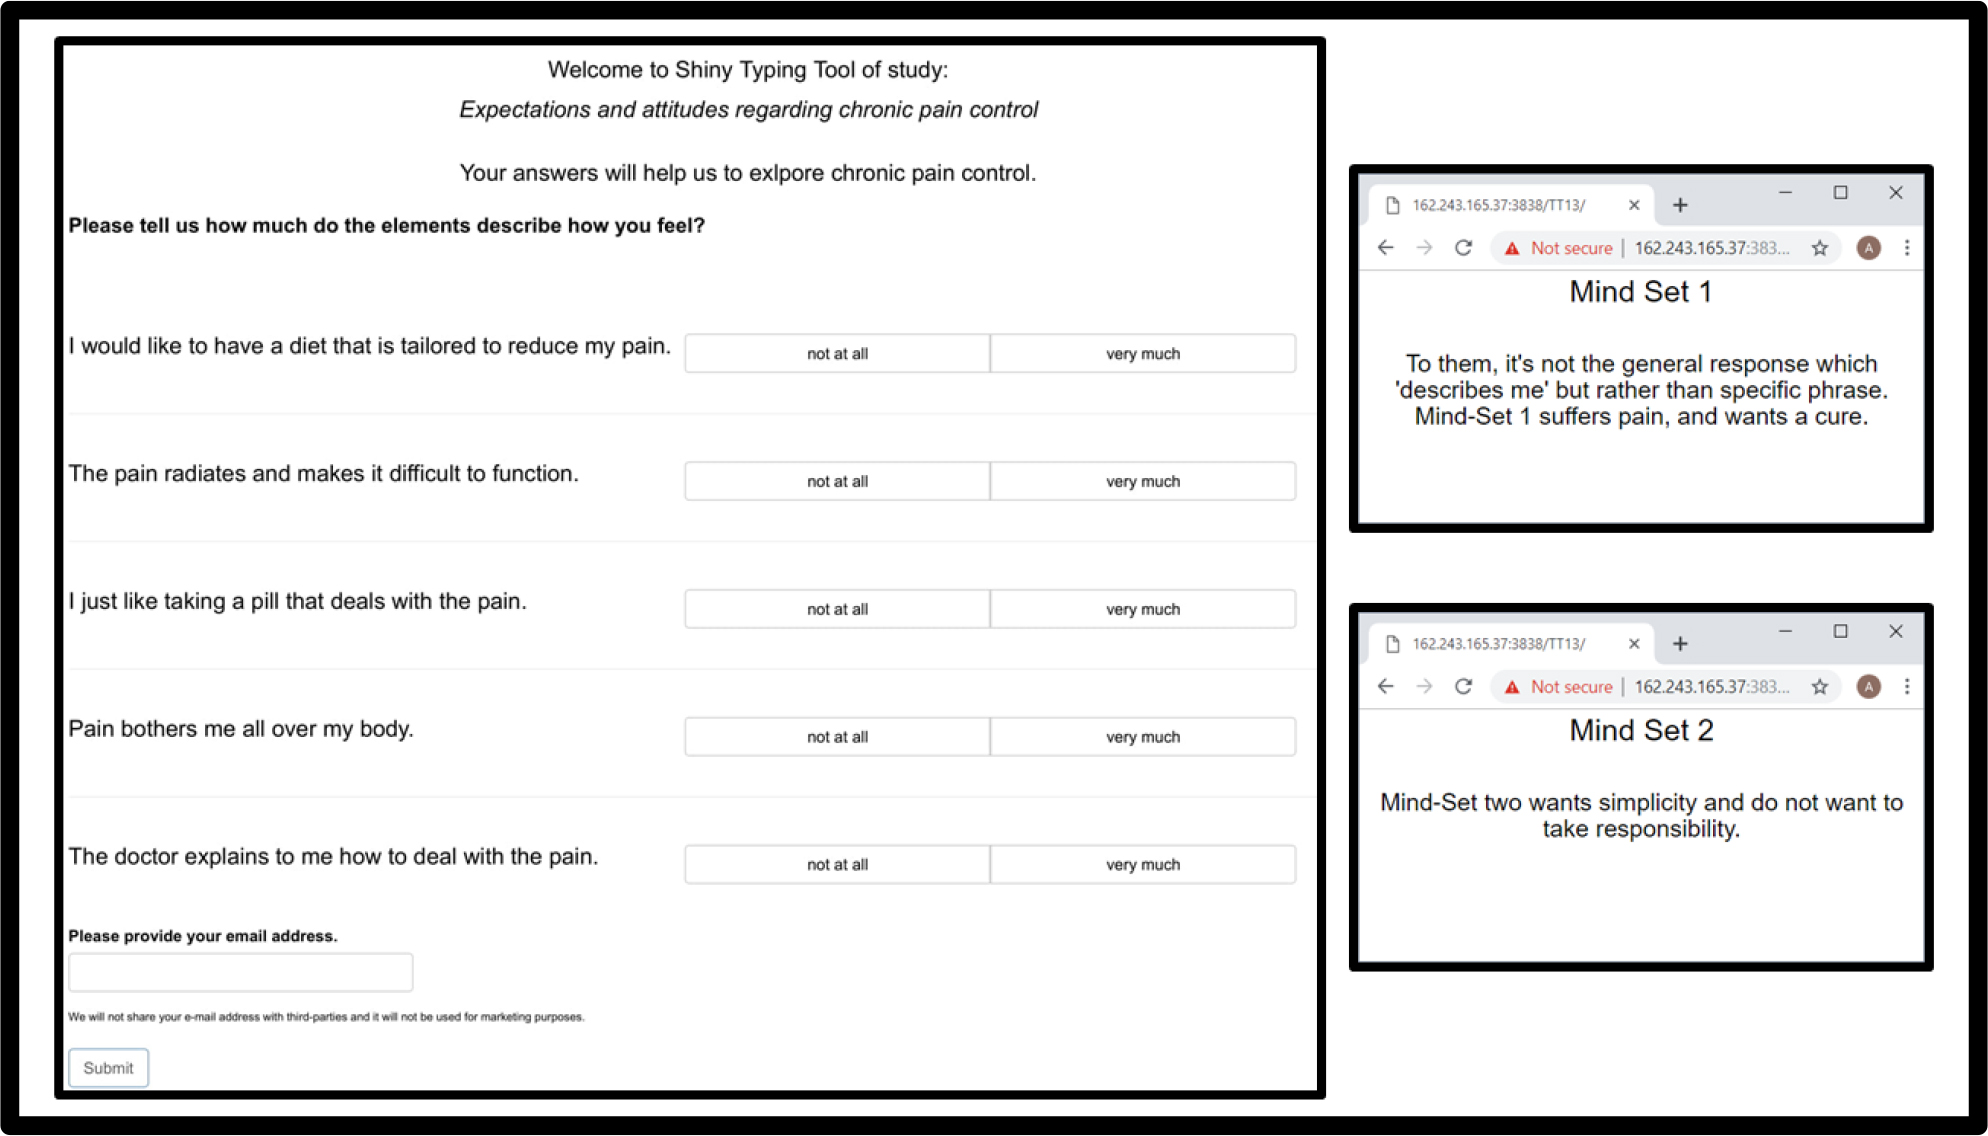
Figure 2. The PVI created for the pain study. The link for the PVI as of this writing (Feb. 2019) is: http://162.243.165.37:3838/TT13/

This study also illustrated how a medical professional may easily identify the mind-set segment to which a patient belongs and accord communication messaging to patient choices and values. Identification of the mind-set to which a patient belongs may assist in building patient-physician trust resulting in higher patient adherence and better implementation of patient-centered care [21].

Mind Genomics provides the ability to segment out populations that share a common mind type and thereby help identify the possibility of determining the types of pain that a person is most likely to experience. It may help answer the question of why people with the same disease experience pain in profoundly different ways. By mind-typing patients who share ailments, Mind Genomics may aid in helping tailor a treatment plan best suited to that individual lying within a disease spectrum.

In light of the current opioid epidemic, it more important, now more than ever, to address how to customize pain treatments to individuals. There are many modalities to treat pain. In the West, pain medications are the first line of treatment. These medications include narcotics/opiates, Non-Steroidal Anti-Inflammatory Drugs (NSAIDs), acetaminophen, certain antidepressants, muscle relaxants, anticonvulsants, corticosteroids, local anesthetics, and most recently medical marijuana. Other modalities such as Transcutaneous Nerve Stimulation (TENS), implantable spinal cord stimulators, meditation and biofeedback are also used to help combat pain. Health care professionals who specialize in pain management use experience and training to try and help tailor treatment regimens to the individual patient. But a tool like Mind Genomics may help the practitioner go beyond the current protocols and prejudices of current practice. Mind Genomics may provide a “cheat sheet” to the patient’s mind and help provide a short cut to success by focusing on pathways that will more likely work for a given patient and eliminating the pathways that will waste time and resources.

References

  1. Hadjistavropoulos T, Craig KD, Duck S, Cano A, Goubert, L, et al. (2011) A biopsychosocial formulation of pain communication. Psychological bulletin 137: 9.
  2. Williams AC, Craig KD (2016) Updating the definition of pain. Pain 157: 2420– 2423. [crossref]
  3. Baker KS, Gibson S, Georgiou-Karistianis N, Roth RM, Giummarra MJ (2016) Everyday executive functioning in chronic pain: specific deficits in working memory and emotion control, predicted by mood, medications, and pain interference. The Clinical Journal of Pain 32: 673–680.
  4. Morrison RS, Maroney-Galin C, Kralovec PD, Meier (2005) The growth of palliative care programs in United States hospitals. Journal of Palliative Medicine 8: 1127–1134.
  5. Schug SA, Palmer GM, Scott DA, Halliwell R, Trinca J (2016) Acute pain management: scientific evidence, 2015. Medical Journal of Australia 204: 315–317.
  6. Loeser JD, Treede RD (2008) The Kyoto protocol of IASP Basic Pain Terminology. Pain 137: 473–477. [crossref]
  7. Atlas LY, Wager TD (2012) How expectations shape pain. Neurosci Lett 520:140–148. [crossref]
  8. Goffaux P, de Souza JB, Potvin S, Marchand S (2009) Pain relief through expectation supersedes descending inhibitory deficits in fibromyalgia patients. Pain 145: 18–23.
  9. Goffaux P, Redmond WJ, Rainville P, Marchand S (2007) Descending analgesia–when the spine echoes what the brain expects. Pain 130: 137–143. [crossref]
  10. Matre D, Casey KL, Knardahl S (2006) Placebo-induced changes in spinal cord pain processing. Journal of Neuroscience 26: 559–563.
  11. Price DD, Craggs J, Verne GN, Perlstein WM, Robinson ME (2007) Placebo analgesia is accompanied by large reductions in pain-related brain activity in irritable bowel syndrome patients. Pain 127: 63–72.
  12. Alkes L. Price, Arti Tandon, Nick Patterson, Kathleen C. Barnes, Nicholas Rafaels, et al (2009) Sensitive Detection of Chromosomal Segments of Distinct Ancestry in Admixed Populations. PLoS Genet 5: 1000519.
  13. Atlas LY, Bolger N, Lindquist MA, Wager TD (2010) Brain mediators of predictive cue effects on perceived pain. J Neurosci 30: 12964–12977. [crossref]
  14. Watson A, El-Deredy W, Iannetti GD, Lloyd D, Tracey I, et al. (2009) Placebo conditioning and placebo analgesia modulate a common brain network during pain anticipation and perception. PAIN 145: 24–30.
  15. Wager TD, Atlas LY, Leotti LA, Rilling JK (2011) Predicting individual differences in placebo analgesia: contributions of brain activity during anticipation and pain experience. Journal of Neuroscience 31: 439–452.
  16. Flaten MA, Aslaksen PM, Lyby PS, Bjørkedal E (2011) The relation of emotions to placebo responses. Philosophical Transactions of the Royal Society B: Biological Sciences 366: 1818–1827.
  17. Brand PW, Yancey P (1993) Pain: the gift nobody wants. New York, HarperCollins Publishers.
  18. Moskowitz HR, Gofman A, Beckley J, Ashman H (2006) Founding a new science: Mind genomics. Journal of sensory studies 21: 266–307.
  19. Gofman A, Moskowitz HR (2010) Isomorphic permuted experimental designs and their application in conjoint analysis. Journal of Sensory Studies 25: 127–145.
  20. Box GE, Hunter JS, Hunter WG (2005) Statistics for experimenters: design, innovation, and discovery (Vol. 2). New York: Wiley-Interscience.
  21. Gabay G, Moskowitz HR, Silcher M, Galanter E (2017) The New Novum Organum: Policies, Perceptions and Emotions in Health. Pardes-Ann Harbor Publishing.
  22. Moskowitz HR, Martin DM (1993) How computer aided design and presentation of concepts speeds up the product development process. Paper presented at the ESOMAR Congress, September, 1993, Copenhagen.
  23. Eippert F, Finsterbusch J, Bingel U, Büchel C (2009) Direct evidence for spinal cord involvement in placebo analgesia. Science 326: 404. [crossref]
  24. Moskowitz, HR (2012) ‘Mind genomics’: The experimental, inductive science of the ordinary, and its application to aspects of food and feeding. Physiology & behavior 107: 606–613.

First Fabulous Fifty – An Initial Experience of Dulaglutide from a Tertiary Care Centre in Eastern India

Abstract

Objective: This retrospective single centred real world observational study was undertaken with the aim to introspect the glycaemic control, weight loss, changes in lipid parameters, adverse events and treatment adherence with Dulaglutide therapy.

Methodology: Single centered, retrospective, real world, observational study conducted on subjects taking liraglutide for a mean duration of 41 weeks in the endocrine out-patient department.

Results: Data of 45 subjects were available. Mean age was 46.67 ± 5.53years. Glycosylated haemoglobin (HbA1c) significantly decreased from 8.68 ± 0.43% at baseline to 7.58 ± 0.19% at end of therapy. Body weight significantly reduced from 74.2 ± 8.07 kg at baseline to 69.27 ± 4.74kg at end of therapy and BMI significantly declined from 33.06 ± 4.5 to 30.09 ± 0.93 at end of therapy respectively. Nausea, vomiting and diarrhoea (15.55%) were the major adverse events noted in the study. Only one patient developed acute pancreatitis (2.22%).

Conclusion: Treatment with Dulaglutide resulted in clinically meaningful HbA1c, FPG and weight reductions. The overall safety profile is consistent with the GLP-1 receptor agonist class. However, Dulaglutide did not show statistically greater reduction of glycaemic parameters in the subset of Indian patients compared to RCT data of Western population.

Keywords

Dulaglutide, obesity, Indian, type 2 diabetes

Introduction

Glucagon-like peptide-1 (GLP-1) agonists act at GLP-1 receptors in pancreatic beta cells to increase glucose-dependent insulin secretion, in pancreatic alpha cells to decrease glucagon release and slow gastric emptying. Over the years, glucagon-like peptide-1 receptor agonists (GLP-1 RAs) have become integral in diabetes management as demonstrated by various publications from India [1–7]. Short-acting GLP-1 RAs requires either a once-daily (e.g. liraglutide) or twice-daily dosing (e.g., exenatide and lixisenatide). Studies published as back as 2005 from India by Vijan et. Al [8]. Showed that the injection burden was definitely an issue to be considered. When adherence to injectable treatment was looked into, the increased number of injection burden was found to be responsible for missed doses and non-adherence to treatment (GAAP study) [9]. Dulaglutide is longer acting GLP-1RA for the treatment of type 2 diabetes mellitus (T2D) and requires once-weekly dosing [10]. Hence the launch of Dulaglutide since march 2016 in India, the novel once weekly GLP1 RA was an welcome step and expected to increase the adherence to GLP1 RA treatment. However, adverse effects if any with one shot of the weekly once Dulaglutide would carry on for the entire week relentlessly. This retrospective single centred real world observational study was undertaken with the aim to introspect the glycaemic control, weight loss, changes in lipid parameters, adverse events and treatment adherence with Dulaglutide therapy.

Materials and Methods

This retrospective real world observational study was conducted in the Endocrinology Department of KPC Medical College and Hospital. It is a 700 bedded tertiary care hospital, situated in the southern fringes of the city of Kolkata, in the eastern part of India. The Endocrine out-patient database was frisked to tease out the initial 50 patients who were prescribed Dulaglutide over and above standard of care (with the exception that DPP 4 inhibitors if any on board) and weren’t lost to follow-up thereafter irrespective of the fact whether they were able to initiate or carry on Dulaglutide therapy continuously or not. No patients with e GFR <30, family history of medullary carcinoma of the thyroid and history of pancreatitis were offered the Dulaglutide as a standard of care of the Department.

The inclusion and exclusion criteria used while selecting the cohort of patients were as follows:

Inclusion Criteria:

  1. Adult type 2 diabetes between 18–75 year age
  2. HbA1C >= 7% and < 11% on a combination of OAD ± insulin
  3. First 50 patients to be prescribed Dulaglutide therapy and who came for a second follow up irrespective of whether he/she had started Dulaglutide.

Exclusion Criteria:

  1. Patients who were initially prescribed Dulaglutide but were lost to follow up after 1st visit
  2. Pregnancy
  3. Hospitalisation during follow-up

Statistical Analysis

Descriptive statistical analysis has been carried out in the present study. Results on continuous measurements are presented on Mean ± SEM and results on categorical measurements are presented in Number (%). Significance is assessed at a level of 5 %.

The following assumptions on data are made.

Assumptions:

  1. Cases of the samples should be independent.
  2. The populations from which the samples are drawn have the same variance (or standard deviation).
  3. The samples drawn from different populations are random.

Normality of data tested by Anderson Darling test, Shapiro-Wilk, Kolmogorov-Smirnoff test and visually by QQ plot. Paired t-test has been used to find the significance of study parameters within groups of patients measured on two occasions.

Statistical software: The Statistical software namely SAS (Statistical Analysis System) version 9.2 for windows, SAS Institute Inc. Cary, NC, USA and Statistical Package for Social Sciences (SPSS Complex Samples) Version 21.0 for windows, SPSS, Inc., Chicago, IL, USA were used for the analysis of the data and Microsoft word and Excel have been used to generate graphs and tables.

Results and Analysis

In the present analyses, a total of 50 patients with T2D were included out of which 45 did actually initiate the drug as was revealed in the first follow-up visit. Patient numbers for gender, age, height, BMI, duration of diabetes, baseline blood pressure, FPG, PPPG, HbA1c, Cholesterol, HDL, LDL, TG and duration of follow up are listed in Table 1. Out of 45, 24 were female and 21 were male having a mean age of 46.67 ± 5.53 years .The patients had a mean height, mean body weight of 74.2 ± 8.07 kg and mean BMI of 33.06 ± 1.47 kg /m2. The mean FPG was 169.18 ± 11.38 mg/dl, PPPG was 222.46 ± 23.77 mg/dl and mean Hba1c was 8.68+- 0.43% before the initiation of Dulaglutide. The baseline demographic and clinical characteristics of the study subjects are enumerated in (Table 1). Post analysis it was revealed that the mean follow up period for the 45 patients who ultimately initiated dulaglutide therapy was 41.2 ± 11.71 weeks.

Table 1. Baseline Characteristics of the Patients (N = 45)

Demographic & Clinical Profile

Values

Male, n (%)

21 (46.67)

Female, n (%)

24 (53.33)

Age(years), Mean ± SEM

46.67 ± 5.53

Height (centimeters), Mean ± SEM

161.63 ± 11.42

Body weight (Kg), Mean ± SEM

74.2 ± 8.07

SBP (mmHg), Mean ± SEM

133.68 ± 12.11

DBP (mmHg), Mean ± SEM

84.03 ± 10.51

BMI (kg/m2), Mean ± SEM

33.06 ± 1.47

BMI – 23 -29.9

22 (48.89%)

BMI – 30–34.9

11 (24.44%)

BMI – 35–39.9

11 (24.44%)

BMI – ≥ 40

1 (2.22%)

FPG (mg/dL), Mean ± SEM

169.18 ± 11.38

PPPG (mg/dL), Mean ± SEM

222.46 ± 23.77

HbA1c(%), Mean ± SEM

8.68 ± 0.43

Total Cholesterol (mg/dL), Mean ± SEM

165.68 ± 6.23

LDL- Cholesterol (mg/dL), Mean ± SEM

115.06 ± 27.2

HDL- Cholesterol (mg/dL), Mean ± SEM

42.35 ± 1.70

Triglycerides (mg/dL), Mean ± SEM

189.87 ± 12.35

Duration of follow-up (weeks), Mean ± SEM

41.2 ± 11.71

HbA1c, FBG reductions and weight changes

All the glycaemic parameters viz. FPG, PPPG and HbA1C had statistically significant reductions, with the respective p values achieved being 0.044, 0.018 and 0.032 during the study period. FPG was reduced by 31.14 ± 0.17 mg/dl, PPPG was reduced by 53.02 ± 10.52 mg/dl and HBA1C was also reduced by 1.10 ± 0.24%. (Table 2) In this small subgroup of patients 22.2% achieved a target HBA1C of less than 7% and 55.56% achieved a target of less than 7.5%, which is a significant proportion considering the fact that the average HBA1C of Indian Diabetic patients undergoing treatment is far higher than this (18). 26.67% of patients were able to achieve a reduction of greater than 1% HBA1C , 17.78% achieved a reduction between 0.5%-1.0%, however interesting is the fact that 37.78 % showed no change in HBA1C and 13.33 % were showing an increased HBA1C than that at baseline (Table 3, 4).

Table 2. Change in study parameters during the follow-up period, (N = 45)**

Parameter

Baseline
Mean ± SEM

Follow-up**
Mean ± SEM

P value

Body weight (kg)

74.2 ± 8.07

69.27 ± 4.74

<0.001

BMI (kg/m2)

33.06 ± 1.47

30.09 ± 0.93

0.041

SBP (mmHg)

133.68 ± 12.11

130.92 ± 3.63

0.731

DBP (mmHg

84.03 ± 10.51

81.65 ± 8.03

0.930

FPG(mg/dl)

169.18 ± 11.38

138.04 ± 11.21

0.044

PPPG(mg/dl)

222.46 ± 23.77

169.44 ± 13.25

0.018

HbA1c (%)

8.68 ± 0.43

7.58 ± 0.19

0.032

Total Cholesterol (mg/dL)

165.68 ± 6.23

142.11 ± 6.17

0.020

LDL- Cholesterol (mg/dL)

115.06 ± 27.2

71.95 ± 5.57

0.43

HDL- Cholesterol (mg/dL)

42.35 ± 1.70

42.26 ± 3.15

0.178

Triglycerides (mg/dL)

189.87 ± 12.35

137.21 ± 10.05

0.068

p < 0.05 considered as statistically significant, p computed by paired-t-test,
** Calculated as per the data available at last follow-up visit

Table 3. Proportion of patients achieving HbA1c less than 7%, 7%-7.5%, 7.5%-8.5% and beyond, (N = 45)

Follow-up HbA1c (in %)

Number of subjects

% of subjects

<7%

8

17.78

7%-7.5%

10

22.22

7.5–8.5%

8

17.78

>8.5%

2

4.44

Drop-out

17

37.78

Table 4. Change in HbA1c from baseline to follow-up, (N = 45)

Change in HbA1c (in %)

Number of subjects

% of subjects

Drop of 1% and more

12

26.67

Drop of 0.5% to 1%

8

17.78

Drop of less than 0.5%

2

4.44

Increase from baseline

6

13.33

Drop out at 3 months

17

37.78

The statistical analysis of the cohort of 45 patients revealed a weight loss of 4.93 ± 3.33 kg which had a p value of <0.001 and thereby also achieved a statistically significant reduction in BMI from an initial value of 33.06 ± 1.47 kg/m2 to 30.09 ± 0.93 kg/m2 (p value 0.041). (Table 2) Weight benefits were more robust with 40% showing a weight loss of 5% or less from the baseline and another 20%showing a weight loss between 5.1–10 % from the baseline. 3 patients who had Insulin and Pioglitazone on board showed an increase in weight from the baseline and as many as 28.87% of patient showed no appreciable change in bodyweight despite addition of Dulaglutide reiterating the presence of non-responders to GLP 1 RA therapy with respect to reduction of weight (Table 5).

Table 5. Percentage Change in Weight during the 3 months follow-up period, (N = 45)


Number of subjects

% of subjects

Weight gain

3

6.67

Weight loss (Less than 5%)

14

31.11

Weight loss (5.1% to 10%)

9

20

Weight loss
(Greater than 10%)

2

4.44

Drop out

17

28.89

Blood pressure and lipid changes

When the blood pressure and lipid data of the 45 patients were analysed, systolic and diastolic pressure did not show any statistically significant reduction and amidst the lipid parameters only the total cholesterol values showed a significant reduction with a p value of 0.20 (Table 2).

Hypoglycaemia Gastrointestinal adverse events

Nausea, vomiting and diarrhoea (15.55%) were the major adverse events noted in the study. Only one patient developed acute pancreatitis (2.22%). Ten patients (22.22%) had to discontinue Dulaglutide due to financial constraints. (Table 6, 7)

Table 6. Reason for Drop-out

Reason for Drop-out

Number of subjects

% of subjects

Financial constraint

10

22.22

Nausea/Vomiting

6

13.33

Acute Pancreatitis

1

2.22

Diarrhea

1

2.22

Table 7. Adverse Effect Profile

Reason for Drop-out

Number of subjects

% of subjects

Nausea/Vomiting

6

13.33

Acute Pancreatitis

1

2.22

Diarrhea

1

2.22

Discussion

In this analysis of the 45 patients who (out of the 50 patients prescribed) we observed significant reduction of HbA1c with the initiation of Dulaglutide which was similar in either sex and as expected with all anti diabetic agents the fall was greater in the group with a higher baseline HbA1c (8.5% and above) and the drop of HbA1c achieved was 1.1 ± 0.24%. Fasting plasma glucose was reduced by 31.14 ± 0.14 mg/dl and the post prandial values dropped by 53.02 ± 10.52 mg/dl at the end of the analysis period. The change in the glycaemic indices namely HbA1c, FPG and PPPG all achieved statistical significance with p values of 0.032, 0.044 and 0.018 respectively.

Amidst the other parameters measured and the lipid parameters did not achieve statistical significance – except for the total cholesterol value which showed a drop of 23.57 ± 0.06 mg/dl and had a p value of 0.020 which was statistically significant. Weight however showed an overwhelming drop of 4.93 ± 3.33 kg and BMI also showed a drop of 2.97 ± 0.54 kg/m2 -both thus achieving statistical significance with p values of < 0.001 and 0.041. When we compare this data with the data of the various AWARD trials some stark differences do stand out all of which can perhaps be explained and some of which can be expected as a part of standard differences which occur in between RCTs and RWE (real world evidence) generated data. Dulaglutide being an once weekly GLP-1RAs is structurally a large molecule and is expected to have a more profound action over fasting plasma glucose rather than on the post prandial plasma glucose levels [11], however in this real world generated data the same was not reflected due to the heterogeneity of concomitant anti diabetic medication which perhaps played a differential role in the control of fasting and post prandial blood glucose levels. AWARD 3 assessed dulaglutide monotherapy at 1.5 gm dose over a 52 week period and achieved an HbA1C reduction of 0.78 ± 0.06 % and this data from the series of AWARD studies was less than the HbA1c reduction achieved in the subset of patients which we included in our study cohort [12]. AWARD 2 studied the effect of Dulaglutide on top of existing glimepiride and metformin therapy and over a period of 72 weeks and the HbA1c reduction of 1.08 ± 0.06 achieved, was a wee bit less than that achieved in our subjects; who, however had a mean duration of follow up of just over 41 weeks [13]. AWARD 1 studied Dulaglutide 1.5 mg in addition to Pioglitazone (30- 45 mg) and Metformin (2000- 3000mg) over a period of 24 weeks and showed a robust reduction of HbA1c of -1.51 ± 0.06 which was substantially greater than that achieved in our real world study of just over 41 weeks [14]. This discrepancy between the two reductions achieved may be attributed to the fact that both Pioglitazone and Metformin were used in lower doses of 7.5–15 mg and 1500–2000 mg respectively. AWARD-4 [15] studied prandial doses of insulin Lispro in addition to Dulaglutide over a period of 26 weeks and the combination achieved the highest HbA1c reduction of -1.64%( 95% CI -1.50 to – 1.78) and AWARD-10 studied effect of Dulaglutide 1.5 mg and SGLT2 inhibitor combination over a similar time period and achieved a HbA1c reduction of 1.34% [16]. The HbA1c reductions in these two RCTs were however significantly more than that achieved in our real world data of just over 41 weeks of Dulaglutide therapy.

In general, Incretin based therapies are more efficacious in the south-east Asian population suffering from Type 2 Diabetes than in their counterparts coming from the Western world [17]. With the previously available once daily GLP1RA – Liraglutide; the Indian experience (1–7) when taken together also showed superior glycaemic control and weight reduction than all the LEAD trials [18] which were RCTs performed with the same drug in Western population used at a dose of 1.8 mg /day – a dose which was not always used in the Indian real world studies. Doses as low as 0.6 mg/day were used and 1.2 mg/day rather than 1.8mg/day was the most frequently used dosage) [19].

The weight loss achieved by the subjects in this real world study is quite robust – a loss of 4.93 ± 3.33 kg. Considering the impact of weight loss on remission of diabetes as shown in the DIRECT trial [20] published in The Lancet, this weight loss, if it can be sustained over longer periods may have substantial role to play in redirecting the future management of diabetes in these subjects. If we closely assess the data 15 out of 50 subjects were not able to carry on Dulaglutide and dropped out on economic grounds. Of these, five patients came back to state that although prescribed reconsidering their finances they were unable to start the drug. Of the rest, ten more patients dropped out within the observation period, cumulating to a drop-out rate of 30% within the first year. GLP-1 RAs usually are thought to exert their cardiovascular benefit via modification of the atherosclerotic pathway [21] due to the delayed bifurcation of the outcomes graph in contrast to that of SGLT2 inhibitors [22]. Thus choosing the right patient who can carry on the GLP-1 therapy for longer periods to harness the CV outcome benefits also should be a clinical consideration before initiating the therapy.

GI Side effect and Drop-out

The incidence of gastrointestinal adverse events on dulaglutide treatment was observed in 41.47 % of patient’s. Out of 45 subjects, 18 had stopped treatment. Limitations in these analyses restrict the application of these data to the larger population of patients with T2D. No placebo or active comparator data were included in the analyses. The number of patients was small and may not necessarily be representative of the entire T2D patient population in clinical practice. The mean duration of diabetes of years and the mean age of 46 years were typical for the real world study, but may differ from the wider T2D population. Moreover, the durations of the study in the present analysis were limited to 32.2 weeks, which may not reflect the effect of longer‐term use of dulaglutide.

Conclusion

Treatment with dulaglutide resulted in clinically meaningful HbA1c, FBG and weight reductions. The overall safety profile is consistent with the GLP‐1 receptor agonist class. However, Dulaglutide did not show statistically greater reduction of glycaemic parameters in the subset of Indian patients compared to RCT data of Western population.

References

  1. Kaur P, Mahendru S, Mithal A (2016) Long-term efficacy of liraglutide in Indian patients with Type 2 diabetes in a real-world setting. Indian J Endocrinol Metab 20: 595–599. [crossref]
  2. Kaur P, Mishra SK, Mittal A, Saxena M, Makkar A, et al.  (2014) Clinical experience with Liraglutide in 196 patients with type 2 diabetes from a tertiary care center in India. Indian J Endocrinol Metab 18: 77–82.
  3. Kesavadev J, Shankar A, Gopalakrishnan G, Jothydev S (2015) Efficacy and safety of liraglutide therapy in 195 Indian patients with type 2 diabetes in real world setting. Diabetes MetabSyndr 9: 30–33.
  4. Roy Chaudhuri S, Sanyal D, Majumder A, Bhattacharjee K (2016) LIRA 365 Plus-A Real World Experience of 82 week Use of Liraglutide in the Obese Indian Type 2 Diabetic Subjects. AdvObes Weight Manag Control 5: 00136.
  5. Roy Chaudhuri S, Sanyal D, Majumder A,  Bhattacharjee K (2016) Short Term Outcomes of Low Dose Liraglutide in Obese Non Diabetic Indian Subjects-A Real World Experience. Diabetes ObesInt J 1: 000140.
  6. Sanyal D, Majumdar A (2013) Low dose liraglutide in Indian patients with type 2 diabetes in the real world setting. Indian J Endocrinol Metab 17: 301–303. [crossref]
  7. Majumder Anirban, Bhattacharjee K (2017) Beginning With Very Low Dose (0.2mg) Liraglutide in Indian Type 2 Diabetic Patients Appears Better Tolerated: Experience from Real Life Practice. J Diabetes MetabDisord Control 4: 00127.
  8. Vijan S, Hayward RA, Ronis DL (2005) The Burden of Diabetes Therapy: Implications for the Design of Effective Patient-centered Treatment Regimens. J Gen Int Med 20: 479–482.
  9. Peyrot M, Barnett AH, Meneghini LF, Schumm-Draeger P-M (2012) Insulin adherence behaviours and barriers in the multinational Global Attitudes of Patients and Physicians in Insulin Therapy study. Diabetic Medicine 29: 682–689.
  10. Kalra S, Baruah MP, Sahay RK, Unnikrishnan AG, Uppal S, et al.  (2016) Glucagon-like peptide-1 receptor agonists in the treatment of type 2 diabetes: Past, present, and future. Indian Journal of Endocrinology and Metabolism 20: 254–267.
  11. Miñambres I, Pérez A (2017) Is there a justification for classifying GLP-1 receptor agonists as basal and prandial? Diabetology & Metabolic Syndrome 9: 1–6.
  12. Umpierrez G, ToféPovedano S, Pérez Manghi F, Shurzinske L, Pechtner V (2014) Efficacy and safety of dulaglutide monotherapy versus metformin in type 2 diabetes in a randomized controlled trial (AWARD-3). Diabetes Care 37: 2168–2176.
  13. Giorgino F, Benroubi M, Sun JH, Zimmermann AG, Pechtner V (2015) Efficacy and Safety of Once-Weekly Dulaglutide Versus Insulin Glargine in Patients With Type 2 Diabetes on Metformin and Glimepiride (AWARD-2). Diabetes Care 38: 2241–2249
  14. Wysham C, Blevins T, Arakaki R, Colon G, Garcia P, et al. (2014) Efficacy and Safety of Dulaglutide Added Onto Pioglitazone and Metformin Versus Exenatide in Type 2 Diabetes in a Randomized Controlled Trial (AWARD-1). Diabetes Care 37: 2159–2167.
  15. Blonde L, Jendle J, Gross J, Woo V, Jiang H, et al. (2015) Once-weekly dulaglutide versus bedtime insulin glargine, both in combination with prandial insulin lispro, in patients with type 2 diabetes (AWARD-4): a randomised, open-label, phase 3, non-inferiority study. Lancet 385: 2057–2066.
  16. Ludvik B, Frías JP, Tinahones FJ, Wainstein J, Jiang H, et al. (2018) Dulaglutide as add-on therapy to SGLT2 inhibitors in patients with inadequately controlled type 2 diabetes (AWARD-10): a 24-week, randomised, double-blind, placebo-controlled trial. Lancet Diabetes Endocrinol 6: 370–381.
  17. Wong MCS, Wang HHX, Kwan MWM (2014) Comparative Effectiveness of Dipeptidyl Peptidase-4 (DPP-4) Inhibitors and Human Glucagon-Like Peptide-1 (GLP-1) Analogue as Add-On Therapies to Sulphonylurea among Diabetes Patients in the Asia-Pacific Region: A Systematic Review. Blachier F, ed. PLoS ONE 9: 90963.
  18. Rigato M, Fadini GP (2014) Comparative effectiveness of liraglutide in the treatment of type 2 diabetes. Diabetes, Metabolic Syndrome and Obesity. Targets and Therapy 7: 107–120.
  19. Sanyal D, Majumdar A (2013) Low dose liraglutide in Indian patients with type 2 diabetes in the real world setting. Indian J Endocrinol Metab 17: S301–303. [crossref]
  20. Lean ME, Leslie WS, Barnes AC, Brosnahan N, Thom G, et al. (2018) Primary care-led weight management for remission of type 2 diabetes (DiRECT): an open-label, cluster-randomised trial. Lancet 391: 541–551. [crossref]
  21. Álvarez-Villalobos NA, Treviño-Alvarez AM, González-González JG (2016) Liraglutide and Cardiovascular Outcomes in Type 2 Diabetes. N Engl J Med 375: 1797–1798. [crossref]
  22. Rosenstein R, Hough A (2016) Empagliflozin, Cardiovascular Outcomes, and Mortality in Type 2 Diabetes. N Engl J Med 374: 1093–1094. [crossref]

Burroughs Wellcome: The Seminal Link between Academia and the Pharmaceutical Industry

Abstract

This article reviews the research carried out by outstanding scientists to underscore the significant role played by Burroughs Wellcome Research Laboratories in erasing the differences in the objectives of scientists in academia and those in industry. These enlightened policies not only markedly advanced our fund of scientific knowledge in the biomedical sciences but led to the production of drugs that were of major benefit to mankind.

Introduction

Henry S. Wellcome (1853–1936) was an American-British entrepreneur who established the Burroughs Wellcome pharmaceutical conglomerate in London with his partner Silas Burroughs in the late 1880’s. Four years later, Wellcome formed a research component, which he named The Wellcome Physiological Research Laboratories. The creation of laboratories to conduct research was quite unusual in the late 1800’s, especially in association with a pharmaceutical enterprise [1–3]. When Henry Wellcome passed away in 1936, he left two legacies, his pharmaceutical company, The Wellcome Foundation and The Wellcome Trust, which distributed the financial resources for biomedical research [4].

This article will convey the company’s long time commitment to research by the fact that the staff scientists highlighted herein won a share of five Nobel Prizes (see below). At the same time, as a result of its long term involvement in basic research, Burroughs Wellcome became a major factor in bridging the gap that existed between academia and the pharmaceutical industry.

Sir Henry Hallett Dale (1875–1968)

Henry Dale (Figure 1), the renowned pioneer and leader in the discipline of Physiology/ Pharmacology, was the first major recruit to join Henry Wellcome’s new research initiative when he reluctantly accepted a research position at The Wellcome Research Laboratories in 1904 [5]. In those days it was unusual for a researcher at a university to give up his academic freedom to work in industry, and several colleagues advised him to decline the offer. However, Wellcome convinced Dale that he would be able to conduct basic research without concern for the business side of the organization.

Although Dale was free to select his own topics of research to investigate, Wellcome requested that Dale undertake the problem of ergot, which was marketed by the company as an abortifacient. Wellcome’s interest in ergot was in part commercially driven by the fact that Parke Davis was also marketing an ergot preparation for use in obstetrics. This competition prompted Henry Wellcome to also recruit a chemist, George Barger, whom he also encouraged to investigate ergot. Dale did not plan on ergot studies occupying a major portion of his time; however, his initial investigations into ergot properties proved to be unexpected and exciting and led him on a path that would ultimately provide the foundation for understanding the pharmacology of autonomic drugs and culminate in the awarding of the Nobel Prize.

IMROJ 2018-108 - Ronald Rubin USA_F1

Figure 1. Sir Henry Hallett Dale (1875–1968)

In 1906, Dale provided the first example of an adrenergic blocking agent by demonstrating that a substance obtained from ergot called ergotoxine reversed the hypertensive effect of sympathetic nerve stimulation and epinephrine (adrenaline) [6]. The sympatholytic action of ergotoxine prompted Dale to interpret his own studies in the light of recent work by Thomas Elliott, who in 1905 observed that the action of exogenous epinephrine mimicked the effects of sympathetic nerve stimulation [7]. Thus, ergotoxine became important in medical history because Dale’s observation that it inhibited sympathetic activity eventually led to the discovery of chemical synaptic transmission. In 1910, Dale also published a detailed account of the sympathomimetic actions of a number of biogenic amines synthesized by George Barger [8]. Unfortunately, Dale chose to exclude the epinephrine (adrenaline) series of sympathomimetics and overlooked the most physiologically relevant derivative – norepinephrine (noradrenaline) – and thus delayed for several more decades the discovery of norepinephrine as a physiological neurotransmitter.

Ergot yielded additional constituents, including histamine in 1907 and acetylcholine in 1913, although neither provided any results that could be marketed for sale. A few years later, an accidental observation made with a particular extract of ergot prompted Dale’s interest in the possible existence of chemical transmission across neuronal synapses. A conventional dose of this extract caused a profound inhibition of heart rate, and was later identified as the labile substance, acetylcholine. In a paper published in 1914, Dale identified a nicotinic and muscarine-like substance in ergot as acetylcholine [9]. In this article, Dale summarizes his work by noting that “acetylcholine occurs occasionally in ergot, but its instability renders it improbable that its occurrence has any therapeutic significance [10].” Nevertheless, such findings set the stage for the classical experiments of Otto Loewi in 1921 and beyond, which provided direct evidence in favor of the theory of chemical synaptic transmission.

Thus, because of Dale’s commitment to deciphering the puzzling effects of ergot, much of our knowledge of the action of autonomic drugs on the physiological components of the autonomic nervous system stems directly from the work of Henry Dale carried out at Burroughs Wellcome Research Laboratories. The quality of Dale’s work was recognized by his academic peers and had much to do with reducing the prevailing negative opinion of the scientific mission of pharmaceutical companies. Dale was subsequently elected to the Royal Society and later served as President of the Royal Society of Medicine. He was knighted in 1932, and shared the Nobel Prize with Otto Loewi for a discovery of fundamental physiological significance that had its origins in a drug company interested in the pharmacological properties of ergot.

Dale spent 10 years at the Burroughs Wellcome Research Laboratories at Brockwell Park, where a great deal of his most productive work was carried out. Although Dale was appointed the first Director of the Medical Research Council at the National Institute for Medical Research in 1928, his link to Burroughs Wellcome was not at an end. In 1936, he became associated with the Trust which had been created by the will of Henry Wellcome. He first served as a Trustee, then as Chairman from 1938 to 1960. He spent the last eight years of his life as its scientific advisor [11]. In addition, a special Henry Dale Fellowship sponsored by the Wellcome Trust provides funds for biomedical research. The basic research fostered by Henry Wellcome and implemented by Henry Dale was not only profoundly significant in its day, but it led Burroughs Wellcome to become a dominant force in biomedical research. And, it was Sir Henry Dale who set the landscape for those who were to follow.

Sir John Robert Vane (1927–2004)

John Vane (Figure 2) was considered one of Britain’s most eminent pharmacologists [12]. He began working with Joshua Harold Burn at Oxford in 1946, where he learned to utilize bioassays. At the time, chemical methods were generally unavailable and bioassays, which detected and measured sensitivity of tissue strips to biologically active substances, required laborious procedures. As a graduate student, I myself toiled at a bath containing aortic strips to measure catecholamines by bioassay, and my task was made much easier when I learned the fluorometric method of assaying adrenomedullary catecholamines at Burroughs Wellcome.

IMROJ 2018-108 - Ronald Rubin USA_F2

Figure 2. Sir John Vane

After graduating in Pharmacology and obtaining additional experience in the United States at Yale University, Vane returned to the United Kingdom where he was offered a position in The Department of Pharmacology at the University of London, which was headed by Sir William Paton. During those years, Vane, striving to move beyond outdated methodologies and antiquated concepts, further developed the blood-bathed organ bioassay system. By slowly perfusing mammalian blood over a series of isolated tissues in a cascade, Vane was able to measure the release of biologically active substances in a manner that simulated release in vivo. One of the first major biochemical processes to be discovered using the blood-bathed organ system was the conversion of angiotensin I to angiotensin II in the pulmonary vasculature. This finding led to the development of Angiotensin Converting Enzyme Inhibitors, which at the time revolutionized the treatment of hypertension. But, it was at the College of Surgeons that John Vane made an indelible mark on the scientific world by elucidating the mechanism of action of aspirin [13].

Vane left the Chair at the Royal College of Physicians in 1973, and followed the example of Henry Dale by joining The Wellcome Research Laboratories in the UK [14]. Vane, like Henry Dale, found that friends and colleagues were dubious about his accepting the offer to enter the industrial realm. Nevertheless, Vane was impressed by the fact that some seventy years before, Henry Dale had accepted a position at Burroughs Wellcome after experiencing academic life. Understanding that good science was not limited to academia, Vane undertook his new role as Director of Research and Development for a major pharmaceutical company.

The fact that he was able to take a number of his research team with him was a major factor in his final decision, and Vane never expressed any regrets about this move. The colleagues he recruited from the Royal College of Surgeons, included Salvador Moncada, Richard Gryglewski, and Rod Flower [15].This research group composed of very talented individuals of diverse ethnic origins, backgrounds, and traditions worked together in a highly competitive research environment. Vane’s laboratory became known as the Prostaglandin Research Group and served as a venue where basic pharmacological research could be carried out without being limited by outdated and narrow approaches to biomedical research. An example of the rewards that could be achieved by this philosophy was the other watershed in Vane’s storied history, the discovery of prostacyclin.

The years spent at Burroughs Wellcome was a challenging period for John Vane since he assumed a new set of managerial responsibilities, as well as research goals. Imbuing colleagues with the concept that it was possible to carry out quality science in an industrial setting, Vane advised them to follow their instincts with regard to drug discovery. This concept soon reaped rewards when in 1976 the Prostaglandin Research Group under the leadership of Salvador Moncada discovered prostacyclin and elucidated its pharmacological properties by utilizing the bioassay of extracts from platelets and vascular tissues [16]. Capitalizing on the versatility of the bioassay cascade, prostacyclin was found to be the main product of arachidonic acid metabolism in arteries and veins and its major effect was to inhibit platelet aggregation by stimulating adenylate cyclase.

John Vane presided over an environment in which there was a strong interaction with academia and the pharmaceutical industry. He, like Henry Dale, clearly demonstrated how it was possible to conduct quality scientific research in an industrial setting. During those years, Vane was awarded several honors, including Fellowship in the Royal Society, The Lasker Prize, and in 1982 the Nobel Prize for Medicine [17]. Salvador Moncada, who was also involved in the discovery of nitric oxide, was considered by some as deserving of a share of the Nobel Prize [18].

The work carried out by John Vane and his associates at the Wellcome Foundation spawned important research around the world that provided additional insights into the key factors that regulate blood circulation. In 1993, after much more information was accumulated about prostacyclin, Vane eventually reached the conclusion that the endothelium occupied a key role in regulating blood circulation and that prostacyclin, as well as nitric oxide, was responsible for defending against atherosclerotic angiopathies [19].

One of Vane’s other major contributions was to promote the link between scientists at academic institutions with those in the pharmaceutical industry, and he did a great deal to blur the boundaries that had separated these two groups of research scientists. In 1985, Vane returned to academia by establishing the William Harvey Research Institute at the Medical College of St. Bartholomew’s Hospital, where his research group focused its attention on cyclooxygenase-2 inhibitors and the interplay between nitric oxide and endothelin in the regulation of vascular function [20].

Sir James Whyte Black (1924- 2010)

The Nobelist, James Black (Figure 3), was one of the first scientists who utilized “rational design” for discovering new drugs [21,22]. Much of Black’s early work was carried out at the now defunct Imperial Chemical Industries (ICI Pharmaceuticals) in the United Kingdom from 1958–1964. Becoming aware of the importance of a balance between experimental research and drug development, Black and coworkers developed propranolol, the first clinically effective beta-adrenergic antagonist. The development of this drug not only represented a marked advance in the pharmacotherapy of hypertension, angina pectoris, and arrhythmias, but it also initiated further studies on the physiological role of beta adrenergic receptors by subsequently dividing them into beta-1 and beta-2 subtypes. At Black’s next position at Smith Kline and French (now GlaxoSmithKline), he introduced a new concept in the treatment of gastric ulcers by producing a drug that blocks histamine (H2) receptors.

IMROJ 2018-108 - Ronald Rubin USA_F3

Figure 3. Sir James Black (left), Gertrude Elion (middle), and George Hitchings (right)

Black wanted to escape from commercial constraints in order to have the freedom to pursue his research interests, so he returned to academia by accepting a Chair in Pharmacology at University College London. But, it was not long before John Vane invited Black to join him at Burroughs Wellcome in the United Kingdom in 1977. Black accepted the offer to serve as Director of Therapeutic Research in order to implement ideas he held about the reasons for the success and failure of industrial projects.

During the next six years at Burroughs Wellcome, Black failed to make much progress in his managerial role, but his research, now involving analytical pharmacology, produced a major advance in the description of the functional effects of drugs and their therapeutic potential. A collaboration with Paul Leff, which compared pharmacological data to quantitative models, developed a new framework for categorizing and analyzing drug actions. The most significant tool employed was the operational model, in which the quantitation of agonist activity in one test system enabled the prediction of activity in another system [23]. The principles of this analytical approach have since been employed in drug classification and the mechanisms of drug action [24].

However, despite the fact that Burroughs Wellcome enjoyed an impeccable reputation with regard to its research activity, Black spent seven years dealing with what he felt were traditional and conservative attitudes. For Black, the interplay between corporate commercial needs and personal scientific aspirations provided an ongoing dilemma. The perceived counterproductive policies were resolved when a small independent research unit in King’s College, London was established for him in 1984 and financially supported by Burroughs Wellcome. It had modern facilities, and together with talented researchers and doctoral students, Black was able to carry out non-profit research with complete independence. Black received his Nobel Prize there in 1988, together with George Hitchings and Gertrude Elion (Figure 3), and remained at Kings College as Professor of Analytical Pharmacology until 1993 when he became Professor Emeritus. In 1988, Black also established the James Black Foundation in the United Kingdom to promote his own vision of pharmacological research [25].

As a fulltime employee of pharmaceutical companies, including Burroughs Wellcome, Black was provided with the independence and resources to be successful. In this way, he was able to offer benefit to both his company and for the good of mankind. Although he derived little personal gain from his discoveries, his strong sense of independence, combined with his dislike for large institutions, caused him to frequently abandon positions whenever he felt the short-sightedness of corporations was obstructing progress in his research. Black’s outstanding quality as a researcher can best be described as being able to discover drugs by meticulous structural design based upon known agonists, rather than by random screening.

George Herbert Hitchings (1905–1998) and Gertrude Belle Elion (1918–1999)

George Hitchings and Gertrude Elion (Figure 3) were the only Nobel Laureates who spent their entire careers at Burroughs Wellcome, even when the company moved from Tuckahoe, New York to North Carolina during a period of sustained research activity. Their investigations covered a span of nearly 40 years and were previously chronicled in some detail [26].

Hitchings received his doctoral degree in Biochemistry from Harvard in 1933, where he studied analytical methods used in physiological studies of purines at a time when little was known about nucleic acid metabolism. After working at several colleges for ten years, Hitchings was hired in 1942 as the only scientist in the Biochemistry Department at Burroughs Wellcome at the Tuckahoe New York facility. Two years later, he recruited Gertrude Elion, a chemist by training, to join his small research group. Elion was then able to leave a rather tedious job of food analyst to join Hitchings when World War II made research positions available for women.

Although up to that time women had difficulty finding jobs in scientific research, Hitchings had no trouble working with women or men from different ethnic backgrounds or religious beliefs, and he encouraged Elion to learn as rapidly and as much as she could. Because she never felt constrained to restrict herself to the subject of chemistry, Elion, who possessed only a Bachelor’s and a Master’s degree, greatly expanded her scope of knowledge in biochemistry, pharmacology, immunology and virology. As a result, Elion began to take on more and more responsibility by concentrating almost exclusively on purines. Because of residency requirements at Brooklyn Polytechnic University, which would take her away from Burroughs Wellcome, Elion never obtained a formal doctorate. However, she was later awarded an honorary PhD degree from Polytechnic University in 1989 and an honorary SD degree from Harvard in 1998.

As previously noted, drug development had historically been a consequence of random trial and error, as in the case of sulfa drugs for example [27]. Because of the legacy provided by the vision of Henry Wellcome, Hitchings and Elion, like James Black, were free to diverge from this approach by using what then was called “rational drug design [28].” It was based upon the supposition that the understanding of basic biochemical and physiological processes formed the basis for the design and development of drugs. Because their research was based upon the premise that drugs could be designed which were based upon differences in nucleic acid metabolism in normal and abnormal cells, Elion and Hitchings employed specifically designed chemicals to form atypical DNA in abnormal cells which did not affect normal cells. By blocking nucleic acid synthesis, the growth of the abnormal cells would be inhibited. Thus, for example, Hitchings postulated that folic acid deficiency would lead to alterations in the synthesis of purines and pyrimidines and thus DNA.

By 1950, this line of research reaped major dividends when Hitchings and Elion synthesized two antimetabolites, diaminopurine and thioguanine. These substances proved to be effective in the treatment of leukemia. In 1957, further alterations in chemical structure led to the production of azathioprine (AZT). This immunosupressant is now used to prevent the rejection of transplanted organs and to treat rheumatoid arthritis and other autoimmune disorders. However, in the 1980’s, because AZT was the primary treatment for AIDS, the United States government allowed Burroughs Wellcome to apply for full patent rights to the drug. As a result, Burroughs Wellcome was able to charge an exorbitant price for AZT to patients with AIDS, despite the fact that the majority of the company was owned by a charitable Foundation, the Wellcome Trust [29,30]. Thus, there was an aspect of the policies of Burroughs Wellcome that dimmed the luster of its legacy.

In 1967 Hitchings became Vice President in charge of research at Burroughs Wellcome, which virtually terminated his involvement in research and redirected his attention to philanthropy. Elion took over his position as Head of the Department of Experimental Therapy. In 1970, the group headed by Hitchings and Elion moved to Research Triangle Park, North Carolina, where they developed the first antiviral drug acyclovir, as well as allopurinol, which is used in the treatment of gout.

Although Henry Wellcome had always been resolute in his commitment to unencumbered biomedical research, Hitchings and Elion did not always find that their efforts were totally supported by management. Hitchings and Elion were subjected to interference by the Head of the Tuckahoe laboratories, William Creasy, who tried to persuade the chemists to work on projects that he favored. Eventually, Creasy relented, realizing that the successes achieved by Hitchings and Elion made it unwise to interfere with their work [31]. In marked contrast, Hitchings and his elite group had key collaboration from the Sloan-Kettering Institute to examine whether purines/pyrimidines possessed anti-neoplastic activity. Moreover, the financial support afforded by Sloan- Kettering enabled Burroughs Wellcome to expand and eventually become self-sustaining [32]. Thus, the ability of Hitchings and Elion to test their theories without interference by commercial considerations led to discoveries of important principles for drug treatment resulting in the development of new approaches to pharmacotherapy.

Hitchings and Elion were initially overlooked by the Nobel Committee. One reason perhaps had to do with the fact that the Nobel Prize Committee rarely honors the work of scientists who develop new drugs. However, in 1988 they were awarded the Nobel Prize, some 30 years after most of their major discoveries. Gertrude Elion underscored the profound significance of her work in a review published in Science in 1989, “…chemotherapeutic agents are not only ends in themselves but also serve as tools for unlocking doors and probing Nature’s mysteries [33].” When Hitchings retired in 1975, and Elion followed eight years later, another memorable chapter in the history of Burroughs Wellcome came to an end.

John J. Burns (1920–2007) and Allan H. Conney (1930–2013)

During the same period that Hitchings and Elion were making their invaluable drug discoveries in the Biochemistry Department, John Burns (Figure 4) joined Burroughs Wellcome as Vice-President and Director of Research in 1960. Prior to his arrival at the Tuckahoe New York facility, Burns had worked at the NIH and had provided valuable information about the biosynthesis and metabolism of Vitamin C (ascorbic acid) and the etiology of scurvy [34]. At Burroughs Wellcome, his seminal investigations demonstrated the clinical importance of microsomal enzyme induction. In particular, Burns demonstrated that phenylbutazone is converted in man to two major metabolites, one with anti-rheumatic activity, the other possessing uricosuric actions [35]. The importance of this basic research was underscored by the fact that during the 1960’s, the NIH provided financial support for the research being conducted at the Tuckahoe facility.

IMROJ 2018-108 - Ronald Rubin USA_F4

Figure 4. John J. Burns. Courtesy of ASPET)

Coincident with the advent of John Burns, a talented research group was formed in the Department of Biochemistry that included Allan Conney, Ronald Kuntzman, and Richard Welch. Providing fundamental knowledge concerning drug metabolism and its clinical implications, this group was the first to demonstrate the clinical significance of microsomal enzyme induction by showing that chronic administration of several drugs to animals stimulated their metabolism and decreased their toxicity [36]. Also by employing selective inhibitors, they were able to determine whether a drug possessed intrinsic pharmacological activity or owed its activity to a metabolite. This work was of considerable significance in the field of drug metabolism and led to early studies on individual differences in the metabolism of drugs in humans.

John Burns wore many hats as a scientist. While at Burroughs Wellcome, he was also an advisor to a number of biotech companies, a member and officer in a large number of national and international scientific committees, and served as a Visiting Professor of Pharmacology at Albert Einstein College of Medicine. In his capacity as an adjunct faculty member, Burns became thesis advisor to a graduate student, Louis Lemberger. Alfred Gilman, the Chairman of the Pharmacology Department was not enamored of the fact that Lemberger had graduated from a Pharmacy School. Nevertheless, Gilman allowed Lemberger to carry out his doctoral thesis with John Burns. At the time, I was a graduate student at Albert Einstein, and because of the prevailing views I was surprised that one of my fellow students had been allowed to carry out his research at an industrial setting.

Despite the vestiges of prejudice that still existed in academia about drug companies at the time, the legacy generated by Henry Wellcome endured. Subsequently, John Burns encouraged Lemberger to obtain his MD degree and gain further clinical training; and so, Lemberger went on to an outstanding career as Director of Clinical Pharmacology at Eli Lilly in Indianapolis Indiana and as Professor of Pharmacology Medicine and Psychiatry at the Indiana School of Medicine [37]. He was involved in the development of several centrally acting drugs, including Prozac, a commonly prescribed anti-depressant.

John Burns subsequently left Burroughs Wellcome in 1968 to serve as Vice President of Research & Development at Hoffmann LaRoche, where he helped to develop the famed Roche Institute of Molecular Biology. Adhering to the view that basic research would lead to practical results, Burns supported basic research as much as any pharmaceutical executive. The extensive research conducted by Burns and his colleagues on the metabolic fate and the mechanism of action of drugs provided a fundamental basis for discovering new drugs and improving their therapeutic use. After Dr. Burns retired from Hoffman LaRoche, he served as Adjunct Professor of Pharmacology at Weill Medical College and was scientific advisor to many biotech companies and a member of the National Academy of Sciences. However, his work at Burroughs Wellcome proved to be seminal.

The Biochemistry group led by Allan Conney (Figure 5) was also involved in investigating other areas of drug metabolism, including cytochrome P-450, a family of enzymes responsible for the biotransformation of many medications, toxic substances, and environmental chemicals [38,39]. Conney’s work provided the molecular basis for understanding how drugs induce tolerance and environmental chemicals produce mutagenesis and carcinogenesis.

Much of Conney’s career was spent in the pharmaceutical industry, first at Burroughs Wellcome and then at Hoffman-LaRoche, where he rejoined John Burns. Further recognition of Conney’s work came from a prestigious faculty appointment at Rutgers University in 1987, where he established the Department of Chemical Biology and founded the Laboratory for Cancer Research. At Rutgers University, Conney continued to carry out research mainly on cancer prevention [40]. His contributions were recognized by his election to the National Academy of Sciences in 1982, and as President of the American Society for Pharmacology and Experimental Therapeutics (ASPET) (1983–1984). During the years 1965–1978, Dr. Conney was among the 40 most cited scientists in the field of pharmacology.

IMROJ 2018-108 - Ronald Rubin USA_F5

Figure 5. Allan Conney

It was fitting that we end this article by recounting the work of Allan Conney, because it defines a gifted scientist who readily bridged the gap between industry and academia. The now entrenched alliances between academia and industry provided another important advance in mankind’s search for more effective medications. Once again, it took some time, but the overall lesson learned by scientists is that forward thinking and cooperation will always trump unfounded biases.

Epilogue

The research laboratories that Henry Wellcome set up first in the United Kingdom in 1880 and then throughout the world employed elite researchers who performed rational and outstanding biomedical research. As a result, the company set the stage for the advent of Pharmacology as an established biomedical discipline. Although the Burroughs Wellcome Research Institute is no longer a functional entity, having been assimilated by Smith/Kline/Glaxo in the 1980’s, the research arm of the company provided the path for academicians to join forces with industrial companies to produce medications that have extended human life and reduced human suffering.

References

  1. Church R, Tansey EM (2007) Burroughs Wellcome and Company: Knowledge, Trust, Profit and the Transformation of the British Pharmaceutical Industry  Crucible Books, Lancaster UK, Pg No :1880–1940
  2. Bailey P (2008) The birth and growth of Burroughs-Wellcome & Co. The Wellcome Trust, 2008.
  3. James RR. Henry Wellcome (1994) Hodder & Stoughton, London, United Kingdom.
  4. Bailey P (2008) Henry Wellcome’s Physiological and Chemical Research Laboratories. Wellcome Trust. 2008. http//www.wellcome.ac.uk./About-us/History/WTX052313.htm.
  5. Dale HH (1938) An autobiographical sketch. Perspec. Biol. Med. 1938; 1: 128–130. See also Dale HH. Introduction; In: Adventures in Physiology. London. Pergamon Press. pp x-xvi.
  6. Dale HH (1906) On some physiological actions of ergot. J Physiol 34: 163–206. [crossref]
  7. Elliott TR (1905) The action of adrenalin. J Physiol 32: 401–467. [crossref]
  8. Barger G, Dale HH (1910) Chemical structure and sympathomimetic action of amines. J Physiol 41: 19–59. [crossref]
  9. Dale HH (1914) The action of certain esters and ethers of choline, and their relation to muscarine. J. Pharmacol. Exp. Ther. 6: 147–190.
  10. Dale HH. (op cit. Ref 7). pg. 189.
  11. Sánchez García P (2010) [The neurotransmision from the other side]. An R Acad Nac Med (Madr) 127: 257–268. [crossref]
  12. Moncada S (2006) Sir John Robert Vane: 29 March 1927 – 19 November 2004. Biogr Mem Fellows R Soc 52: 401–411. [crossref]
  13. Vane JR (1971) Inhibition of prostaglandin synthesis as a mechanism of action for aspirin-like drugs. Nat New Biol 231: 232–235. [crossref]
  14. John R. Vane- Biographical. Nobelprize.org. Nobel Media AB 2014. Web. 7 Apr 2016.
  15. Flower R (2006) John Vane. A Biographical Sketch. In Memory of Sir John Vane. (Nistico, G. McGiff J & Born G. Editors); 2006; Roma; Exorma. pp. 53–55.
  16. Moncada S (1982) Eighth Gaddum Memorial Lecture. Biological importance of prostacyclin. Br. J. Pharmacol. 76: 3–31.
  17. Obituary (2004) Sir John Vane. The Telegraph.
  18. Howlett R (1998) Nobel award stirs up debate on nitric oxide breakthrough. Nature 395: 625–626. [crossref]
  19. Vane JR (1994) The Croonian Lecture, 1993. The endothelium: maestro of the blood circulation. Philos Trans R Soc Lond B Biol Sci 343: 225–246. [crossref]
  20. Moncada S (2006) Sir John Robert Vane: 29 March 1927 – 19 November 2004. Biogr Mem Fellows R Soc 52: 401–411. [crossref]
  21. Braunwald E (2010) Sir James W. Black MD, FRS. In Memoriam. Circ. Res. 107: 3–5.
  22. Black’s autobiographical sketch can be found in: Les Prix Nobel. The Nobel Prizes 1988; Editor Tore Frangsmyr. (Nobel Foundation) 1989. Stockholm.
  23. Black JW, Leff P (1983) Operational models of pharmacological agonism. Proc R Soc Lond B Biol Sci 220: 141–162. [crossref]
  24. Kenakin T, Christopoulos A (2011) Analytical pharmacology: the impact of numbers on pharmacology. Trends Pharmacol Sci 32: 189–196. [crossref]
  25. Wright P (2010) Sir James Black obituary: Nobel prizewinning pharmacologist who invented new drugs such as beta-blockers. The Guardian.
  26. Rubin RP. A brief history of great discoveries in pharmacology. Pharmacol. Rev. 2007; 59: pp. 311–314.
  27. Rubin RP (op. cit. Ref. 23). pp. 315–318.
  28. Turney J (2009) Rational drug design: Gertrude Elion and George Hitchings. Wellcome Trust. London, England.
  29. http://www.nytimes.com/1989/08/28/opinion/azt-s-inhuman-cost.html
  30. Emmons WM (1991) Burroughs Wellcome and AZT. (A): Faculty & Research. Harvard Business School Case 792–004.
  31. Turney J. (op. cit. Ref. 25).
  32. George H. Hitchings- Biographical. The Nobel Prize in Physiology or Medicine 1988. From Les Prix Nobel; The Nobel Prize 1988. Editor Tore Frangsmyr [Nobel Foundation]. Stockholm.1988.
  33. Elion G The purine path to chemotherapy. Science. 1989; 244: pg. 46.
  34. Kuntzman R and Conney A (2008) Dr. John J. Burns. 1920–2007. Obituary. Neuropsychopharmacology. 33: 458–459.
  35. Kuntzman R and Conney A. (op. cit. Ref. 34). pg. 458.
  36. Burns JJ (1964) Editorial. Implications of enzyme induction for drug therapy. Amer. J. Med. 37: 327–331.
  37. Albert Einstein College of Medicine (1989) Alumni. Louis Lemberger M.D, PH.D. Distinguished Alumnus.
  38. Conney AH (1967) Pharmacological implications of microsomal enzyme induction. Pharmacol. Rev. 19: 317–366.
  39. Conney AH (2003) Induction of drug-metabolizing enzymes: a path to the discovery of multiple cytochromes P450. Annu Rev Pharmacol Toxicol 43: 1–30. [crossref]
  40. Yang CS Suh N Stoner G, Dong, Z and Surh Y-J. Allan H (2013) Conney: In Memoriam (1930–2013). Cancer Prev. Res. 6: 1376–1377.

Targeting of the Wnt/β-Catenin Pathway in Chronic Lymphocytic Leukaemia may adversely affect CTLA-4 expression and function

Abstract

In chronic lymphocytic leukemia, overexpression of CTLA-4 may be associated with a good outcome, whereas the Wnt/β-catenin-regulated transcription factor LEF1 is a pro-survival factor and is markedly overexpressed compared to normal B cells. In this study, peripheral blood B cells from 20 patients with CLL were purified and a strong correlation between gene expression levels of CTLA-4 and LEF-1 was found. This suggests that CTLA-4 expression in CLL may be a target of Wnt/β-catenin signalling.

Keywords:

CLL; CTLA-4; Wnt/β-catenin pathway; LEF1; CD38

Highlights

Percentage surface expression of CD38 and CTLA-4 and gene expression levels of CTLA-4, CCND1, LEF1 and STAT3 were measured in 20 patients with chronic lymphocytic leukemic. A strong positive correlation was found between gene expression levels of CTLA-4 and LEF-1.

Targeting of the Wnt/β-catenin pathway in CLL may result in unwanted effects on CTLA-4 expression and function.

Introduction

Chronic lymphocytic leukemia (CLL) is a clonal proliferation of mature CD5+ CD19+ CD23+ B lymphocytes, characterized by progressive accumulation of leukemic cells in peripheral blood, bone marrow and lymphoid tissues. Cytotoxic T-lymphocyte-associated antigen 4 (CTLA-4, CD152) is a member of the CD28 receptor family and is mainly expressed on CD4+ T-cells. In CLL, overexpression of the CTLA-4 gene is associated with lower CD38-expression and, therefore, perhaps a better outcome [1]. CLL cells also exhibit aberrantly active Wnt signaling and Wnt/β-catenin-regulated transcription factor lymphoid enhancer binding factor-1 (LEF1) has been shown to be a pro-survival factor in CLL [2]. In this study, we wished to further investigate the relationship between CD38 and CTLA-4 in CLL and their potential relationship with transcription factors LEF1, signal transducer and activator of transcription 3 (STAT3) and cyclin D1. In purified peripheral blood B cells from 20 patients with CLL, a strong positive correlation between gene expression levels of CTLA-4 and LEF1 was found, suggesting that CTLA-4 expression in CLL may well be a target of Wnt/β-catenin signalling.

Material and methods

After ethical approval and signed written consent, 20 patients with CLL (9 previously treated, 11 untreated) donated peripheral blood for this study. No patient had active therapy for CLL in the 3 months prior to blood donation. All patients had FISH analysis performed. CD19+ B lymphocytes were isolated using a magnetic bead separation technique (Invitrogen-Dynabeads). The percentage surface expression of CD38 and CTLA-4 was measured by flow cytometry. Total RNA was isolated from the B cells by the RNeasy Mini Kit (QIAGEN). Gene expression levels of CTLA-4, cyclin D1 (CCND1), LEF1 and STAT3 were measured using RT-PCR (ABI 7500 Fast-Applied Biosystems). GAPDH was used as a reference gene. Statistical analyses of data were performed using Spearman rank correlation and Mann-Whitney U tests. Differences of P < 0.05 were considered statistically significant.

Results

Median (range) CD19+ B cell purity was 93.8 (84.8-98.5) %, with CD19+ B cell purity > 90% in 19/20 cases. Median (interquartile range) percentage surface expression of CD38 and CTLA-4 was 8.36 (26.45) % and 43.32 (50.22) % respectively. Median (range, interquartile range) ∆CT gene expression levels of CCND1, CTLA-4, LEF1 and STAT3 were 11.89 (1.81), 4.79 (2.35), 4.82 (0.89) and 9.12 (0.75) respectively. Gene expression of LEF1 showed significant positive correlations with gene expression levels of CTLA-4 (rs=0.572, p=0.008), CCND1 (rs=0.61, p=0.004) and STAT3 (rs=0.587, p=0.006). There was also a significant positive correlation between gene expression of CCND1 and of STAT3 (rs =0.486, p=0.03). No significant correlations were found between percentage surface expression of CTLA-4 and gene expression levels of either CTLA-4 or of LEF1. Although we found a negative correlation between percentage surface expression of CTLA-4 and CD38, this was not statistically significant. Comparing untreated and previously treated patients or comparing patients with poor risk cytogenetics (17p or 11q deletions: n = 6) to those without, there was no significant difference in gene expression levels of CTLA-4, CCND1, LEF1 and STAT3 or in surface expression of CTLA-4 and CD38.

Discussion

The Wnt signalling pathway has been shown to be activated in CLL cells and uncontrolled Wnt/β-catenin signalling contributes to defective apoptosis in CLL [3]. Importantly, Wnt pathway activation leads to upregulation of β-catenin and subsequently LEF1 activation, which is markedly overexpressed in CLL compared to normal B cells [4] and appears to play an essential role in the leukaemogenesis of CLL [2]. Furthermore, cyclin D1, a downstream target of LEF-1, is overexpressed in CLL. Targeting of LEF-1 has been shown to induce apoptosis in CLL cells both in vitro and in vivo [5].

In CLL, CTLA-4 expression is higher on the leukemic cells that on their normal B cell counterparts. A recent study has shown that CTLA-4 inhibits the proliferation/survival of CLL cells via regulation of the expression/activation of STAT1, NFATC2, Fos, Myc and Bcl-2 [6] and CTLA-4 blockade induces pro-survival signals in leukemic cells from CLL patients exhibiting high CTLA-4 expression [7]. However, CTLA-4 expression was also found to be the most highly induced gene following treatment with recombinant Wnt-3a in melanoma cell lines and CTLA-4 expression appeared to be directly regulated by the Wnt/β-catenin pathway as the β-catenin responsiveness of CTLA-4 promoter region required a T-cell factor-1/LEF-1 consensus site [8]. In our study, CTLA-4 and LEF-1 gene expression levels were strongly correlated, suggesting that CTLA-4 expression in CLL may well also be a direct target of Wnt/β-catenin signalling. Although the relationship between CTLA-4 and the Wnt/β-catenin pathway in CLL requires further study, the findings of this study suggest that targeting of the Wnt/β-catenin pathway in CLL may result in unwanted effects on CTLA-4 expression and function.

This research did not receive any specific grant from funding agencies in the public, commercial, or not-for-profit sectors.

Conflicts of interest: none

References

  1. Joshi AD, Hegde GV, Dickinson JD (2007) ATM, CTLA4, MNDA and HEM1 in high versus low CD38 expressing B-cell chronic lymphocytic leukemia. Clin Cancer Res 13: 5295–5304. [Crossref]
  2. Gutierrez Jr A, Tschumper RC, Wu X (2010) LEF-1 is a prosurvival factor in chronic lymphocytic leukemia and is expressed in the preleukemic state of monoclonal B-cell lymphocytosis. Blood 116: 2975–2983. [Crossref]
  3. Lu D, Zhao Y, Tawatao R (2004) Activation of the Wnt signaling pathway in chronic lymphocytic leukemia. Proc Natl Acad Sci USA. 101: 3118–3123. [Crossref]
  4. Gandhirajan RK, Poll-Wolbeck SJ, Gehrke I, Kreuzer KA (2010) Wnt/β-catenin/LEF-1 signaling in chronic lymphocytic leukemia (CLL): a target for current and potential therapeutic options. Curr Cancer Drug Targets 10: 716–727. [Crossref]
  5. Gandhirajan RK, Staib PA, Minke K (2010) Small molecule inhibitors of Wnt/β-carenin/Lef-1 signaling induces apoptosis in chronic lymphocytic leukemia cells in vitro and in vivo. Neoplasia 12: 326–335. [Crossref]
  6. Mittal AK, Chaturvedi NK, Rohlfsen RA (2013) Role of CTLA4 in the proliferation and survival of chronic lymphocytic leukemia. PLoS ONE 8: e70352. [Crossref]
  7. Ciszak L, Frydecka I, Wolowiec D, Szteblich A, Kosmaczewska A (2016) Patients with chronic lymphocytic leukemia (CLL) differ in the pattern of CTLA-4 expression on CLL cells: the possible implications for immunotherapy with CTLA-4 blocking antibody. Tumour Biol 37: 4143–4157. [Crossref]
  8. Shah KV, Chien AJ, Yee C, Moon RT (2008) CTLA-4 is a direct target of Wnt/β-catenin signaling and is expressed in human melanoma tumors. J Invest Dermatol 128: 2870–2879. [Crossref]

Surrogate Markers of Liver Fibrosis in Primary Sclerosing Cholangitis (PSC)

Introduction

Primary Sclerosing Cholangitis (PSC) is a chronic inflammatory cholangiopathy that results in fibrotic strictures and dilations of the intra- and extrahepatic bile ducts. The pathogenesis of PSC has not been fully elucidated, the disease is uncommon, occurs predominantly in young males and has a strong association with Inflammatory Bowel Disease (IBD). There are significant variation in clinical course of PSC associated with age at diagnosis, sex, and ductal and IBD subtypes [1]. There is no medical treatment of proven benefit on survival; most liver-related morbidity and mortality is the results of portal hypertension and chronic liver failure. However, the course of PSC is highly variable, and so far no prognostic markers have been shown to predict outcomes in asymptomatic, early-stage patients.

The prognosis of chronic cholestatic liver disease depends at least in part on the extent of fibrosis in the liver parenchyma [2]. Semi-quantitative evaluation of nodular size and fibrotic septal width in respect to hepatic venous pressure gradient (HVPG) were proposed by Laennec based on the original histological description of the cirrhosis [3-6]. HVPG is the gold standard to estimate the severity of portal hypertension in liver cirrhosis. It correlates with structural and functional changes in liver parenchyma and gives valuable prognostic information to stratify the mortality risk [7]. Liver cirrhosis should be regarded as a multistage liver disease [8]; it can be accurately sub-classified using quantification of fibrosis with collagen proportionate area (CPA) as the predictor of clinical decompensation [9].

Liver biopsy remains the “gold standard” in evaluation of necroinflammation activity and fibrosis of the liver parenchyma. However, it has limitations due to invasiveness, small tissue samples, patchy distribution of fibrotic areas in parenchyma and inter- and intra-observer error. Moreover, liver biopsy is not appropriate to regularly monitor fibrosis progression or response to treatment [10]. Thus, ultrasound-based shear wave elastography methods enabling liver stiffness measurements (LSM) have been implemented for noninvasive evaluation of fibrosis of the liver, with biopsy reserved for uncertain cases.

The various elastography methods differ with respect to what they do with these displacement data to create an elastogram or elasticity measurement. There are three options for the property to be displayed:

1. Display of displacement without further processing, as in acoustic radiation force impulse (ARFI) imaging. Tissue displacement is associated with shear deformation. The greater the force, the greater the displacement, but stiff tissues are displaced less than soft tissues. ARFI remains the proprietary imaging technology Siemens Virtual Touch™, and it is not used for assessment of diffuse liver conditions.

2. Display of tissue strain or strain rate, calculated from the spatial gradient of displacement or velocity,

3. Display of shear wave speed, calculated by using the time varying displacement data to measure the arrival time of a shear wave at various locations. All such methods are grouped under the heading shear wave elastography (SWE), and include transient elastography (TE), point shear wave elastography (pSWE) and multidimensional shear wave elastography (2D‑SWE and 3D-SWE).

Shear wave elastography (SWE) is a method that use shear wave speed and includes:

1.Transient elastography (TE, FibroScan, Echosens, France): shear wave elastometry by measurement of the speed of a shear wave that has been generated using a surface impulse,

2.Point shear wave elastography (pSWE): shear wave elastometry at a location by measurement of the speed of a shear wave generated using acoustic radiation force,

3.Multidimensional shear wave elastography (2D-SWE, 3DSWE): quantitative SWE imaging (and elastometry) by measuring the speed of shear waves generated using acoustic radiation force.

The major potential confounding factors (liver inflammation indicated by AST and/or ALT elevation >5 times the normal limits, obstructive cholestasis, liver congestion, acute hepatitis and infiltrative liver diseases) should be excluded before performing LSM with SWE, in order to avoid overestimation of liver fibrosis [11].

Ultrasound-based methods

In chronic liver disease LSM accurately reflects liver fibrosis, which is the major component of increased intrahepatic vascular resistance leading to portal hypertension. LSM improves the noninvasive risk stratification of patients with compensated advanced chronic liver disease as a possible surrogate for portal hypertension [12]. More than 90% of patients with an LSM > 20-25 kPa ( evaluated by transient elastography ) will have clinically significant portal hypertension. In advanced chronic liver disease of non-cholestatic aetiology, endoscopy can be safety avoided by using LSM and platelet count in combination: LSM of < 20 kPa and PLT > 150 g/L pointed to < 5% risk of esophageal varices needing treatment [12].

Transient elastography (TE) (FibroScan, Echosens, France) is currently the most widely used technique, validated in chronic hepatitis C [13], in primary biliary cholangitis (PBC) [14, 15] and primary sclerosing cholangitis [16]. TE measures the speed of propagation of an elastic shear wave in the liver, and the harder the tissue, the faster the shear, which is measured in kilopascals (kPa). The examination is performed on the right lobe of the liver, and the measurement depth trough intercostal space is 25-65 mm using standard M-probe, and 35-75 mm with XL-probe (Figure 1). Liver stiffness measurement based on TE has been shown to correlate with histological fibrosis stage and severity of portal hypertension [17, 18]. TE seems to be a predictor of clinical outcomes in relationship to liver-related complications and mortality [19, 20]. Additionally, TE is able to predict clinically significant portal hypertension in patients with compensated chronic liver disease or cirrhosis [21]. However, early compensated liver cirrhosis can be overlooked in up to 30% of patients and transient elastography seems to be better at excluding advanced fibrosis rather than confirming liver cirrhosis. Fibrosis stage F > 2 is diagnosed with 84-87% accuracy, and F> 3 with 88-89%. Diagnostic accuracy is excellent – 93-96% for the diagnosis of liver cirrhosis, with sensitivity and specificity of 70-79%, 78-84% for F > 2 and 83-87% and 89-95% for the diagnosis of F = 4. Cut-offs were in the range of 7.3-7.9 kPa for F > 2, and 13.0-15.6 kPa for the diagnosis of liver cirrhosis.

IMROJ 2017-208 Figure1A

IMROJ 2017-208 Figure1B

Figure 1. Transient elastrography

In the newest study of Krawczyk et al. TE correlated with Laennec stages of fibrosis, collagen contents and with diameter of thickest septa in explanted livers in PSC patients. In multivariate model liver fibrosis according to either Leannec score or collagen contents was significantly associated with TE. PSC cirrhotics patients had increased liver stiffness and the TE cut-off of 13.7 kPa showed the best predictive value (AUC=0.90, 95%CI 0.80–1.00, P<0.0001) for detecting liver cirrhosis [57].

The measurement failure rate is low (5-10%) with obesity (BMI > 30 kg/m2), ascites, congestive heart failure, postprandial time and the presence of narrow intercostal space considered to be limiting factors. However, obstructive cholestasis also influenced the results of TE [22].

Newer elastography methods based on the measurements of shear wave velocity include point share wave elastography (pSWE) and two-dimensional SWE (2D- SWE). SWE is usually integrated into conventional ultrasonography system (Figure 2). The region of interest (ROI) can be positioned under brightness-modulation (B-mode), and a single acoustic impulse is used to induce a share wave within a ROI of 1.0 x 0.5 cm or 2 x 2 cm in 2D SWE. The examination should be performed at least 1 cm below the liver capsule on the right lobe, and can be displayed in m/s and/or kPa. ROI can be positioned manually in different depths of the liver. However, there are no clear interpretation of point SWE and 2D SWE recommended to date.

IMROJ 2017-208 Figure2A

IMROJ 2017-208 Figure2B

Figure 2. Shear-wave elastography

The probability of correctly diagnosing EV following a positive measurement did not exceed 70% [21]. Thus, LSM-spleen diameter to platelet ratio score and simplified combination of LSM and platelet count were also assessed with good results of ruling out varices needing treatment [23, 24]. LSM can be also used to predict clinical decompensation in the patients with compensated cirrhosis of the liver. On the other hand, spleen undergoes parenchymal modeling in patients with portal hypertension, and spleen stiffness measurement (SSM) is closely associated with portal hypertension, its severity and complications [25]. SSM is promising parameter for use in predicting the presence and size of EV [12]. Validated cut-off values in PSC are not available yet.

Magnetic-resonance based method

With magnetic resonance elastography (MRE) mechanical shear waves are sent into the tissue and displayed as elastograms using phase-contrast image sequences. MRE can examine the very large areas of the right lobe of liver. The limitation of MRE are obesity, claustrophobia and iron overload. Recently, in the study of Wang et al. the performance of MRE was significantly better than laboratory tests for detection of advanced fibrosis, and cirrhosis and better than conventional MRI for diagnosis of cirrhosis in patients with autoimmune hepatitis [26]. In a retrospective review of 266 PSC patients to examine whether liver stiffness (LS) was associated with the primary endpoint of hepatic decompensation (ascites, variceal hemorrhage and hepatic encephalopathy), MRE was able to detect cirrhosis with high specificity and LS obtained by MRE was predictive of hepatic decompensation in PSC patients in Eaton et al study. Liver stiffness of 4.93 kPa was the optimal point to detected F4 fibrosis, with sensitivity 1.00 (95% confidence interval (CI), 0.40-1.00) and specificity of 0.94 (95%CI, 0.68-1.00). LS was associated with the development of decompensated liver disease (Hazard ratio, 1.55; 95%CI, 1.41-1.70). The optimal LS thresholds that stratified patients at a low, medium and high risk for hepatic decompensation were <4.5, 4.5-6.0 and >6.0 kPa, respectively [27]. However, MRE seems to be promising modality for detection of advanced fibrosis and liver cirrhosis, with superior diagnostic accuracy compared to laboratory assessment and MRI, but not precirrhotic stages of chronic liver diseases. On the other hand, MRE is very expensive and time-consuming.

Serum biomarkers

Prospective studies demonstrated that single markers e. g., α2-macroglobulin [28], procollagen III N-peptide [29], apolipoprotein A1 [28], haptoglobin [30], hyaluronic acid [31], metalloproteinases [32] allow discrimination between advanced and absent fibrosis.

The enhanced liver fibrosis (ELF) test is a promising panel, incorporating three direct serum markers of fibrosis in an algorithm: hyaluronic acid, tissue inhibitor of metalloproteinases-1 (TIMP-1), and amino-terminal pro-peptide of type III pro-collagen (PIIINP) [33]. The ELF test accurately predicted significant liver fibrosis and furthermore predicted clinical outcome in several independent populations and in patients with various aetiologies of chronic liver disease [34] as well as with PSC. The ELF test consistently predicted liver transplant-free survival in PSC patients independently of other risk factors or risk scores [35]. The ELF test distinguished between mild and severe disease defined by clinical outcome (transplantation or death) with an area under the curve of 0.81 (95% confidence interval [CI] 0.73-0.87) and optimal cutoff of 10.6 (sensitivity 70.2%, specificity 79.1%). In multivariate Cox regression analysis ELF score was associated with transplant-free survival independently of the Mayo risk score. The ELF test correlated also with ultrasound elastography in separate assessments [35]. In a large multicenter cohort, EFL test predicts prognosis in PSC and may be used for risk stratification in clinical follow up; optimally together with clinical prognostic scores may add incremental prognostic value [36].

Placental growth factor (PLGF), growth differentiation factor-15 (GDF-15) and hepatic growth factor (HGF) are involved in hepatic fibrogenesis. The panel of these three serum markers was useful for the detection of patients with advanced fibrosis and the risks described by the combinations of these markers were independent from other classical fibrosis risk factors. The set of markers may be a useful tool to monitor patients with chronic liver diseases during and after therapy [37] .

Inflammatory protein, i.e. IL-8 in bile and serum was an important indicator of disease severity and prognosis in patients with primary sclerosing cholangitis, and associated with transplant-free survival in multivariable analyses independently of age and disease duration, indicating an independent influence on PSC progression [38]. This is also in line with the results of the study of Buck et al [39]. Hepatic venous pressure gradient (HVPG) can reflect progression of disease in the precirrhosis stage. Portal hypertension is pathogenically related to liver injury and fibrosis [40] and that in turn these are associated with the activation of inflammatory pathways [41]. The novel inflammatory serum biomarkers (e.g. Il-1, Fas-R, VCAM, CD163) were significantly correlated with HVPG in patients with compensated cirrhosis in this study.

Autotaxin (ATX), which is involved in the synthesis of lysophosphatidic acid, is not only associated with pruritus but also indicates impairment of other health-related quality of life (HRQoL) aspects, liver dysfunction, and can serve as a predictor of survival [42]. Impairment of HRQoL might be also associated with vitamin D receptor (VDR) gene polymorphisms (rs1544410-BsmI; rs7975232-ApaI). ApaI polymorphisms in VDR may exert an effect on disease-related symptoms and quality of life in the study of 275 patients with PSC [43].

However, none of the proposed markers or panels have gained as much acceptance as the invasive approach [44]. This may be due to relatively high costs of marker measurements, and low sensitivity to discriminate between fibrotic, cirrhotic or steatotic liver lesions. As a result, no scores based on serum levels of hepatic fibrosis markers are actually regarded as definite methods upon which therapeutic decisions can be based. It might be that the combination of markers reflects the presence of significant liver fibrosis detected by elastography and histology and may also identify patients at risk presenting with low elastography values as proofed by Krawczyk M, et al. [37].

Simple laboratory tests

Laboratory-based methods for staging liver fibrosis include the FibroTest® [45], the serum aspartate aminotransferase/platelet ratio index (APRI) [46], the Fibrosis 4 (FIB-4) test [47], and the enhanced liver fibrosis test [48]. AST/ALT ratio [49] can also allow to discriminate between advanced and absent fibrosis.

However, these tests may detect cirrhosis, but their ability to reflect the stages of fibrosis in AIH is uncertain [50-54]. The result of the recent study of Anastasiou et al. showed that TE, NAFLD fibrosis score and FibroQ might help in evaluation of liver fibrosis in AIH, but without differentiating mild form from advanced stages of fibrosis in autoimmune hepatitis [55].

In the study of Krawczyk et al. TE correlated with Laennec stages of fibrosis, and with serum indices of liver injury, namely AST, bilirubin as well as FIB-4 and APRI scores in patients with PSC [57].

Conclusion

Primary sclerosing cholangitis (PSC) is a progressive biliary disease lacking medical treatment with currently no established tools to predict prognosis in the individual patient. The lack of biomarkers for risk stratification is an important obstacle to the development of therapy.

Liver fibrosis seems to be the strongest predictor of liver stiffness assessed with TE. TE correlates with liver fibrosis, markers of liver injury and portal hypertension in patients with PSC. It might be that TE is a reliable tool for non-invasive monitoring of PSC. It seems also that the combination of serum profibrotic biomarkers with evaluation of liver fibrosis with elastography may improve the non-invasive diagnostic utility for clinically significant fibrosis [56]. However, still the Enhanced Liver Fibrosis (ELF®) test and Mayo risk score proved to be stronger predictors of transplant-free survival in PSC [38].

Conflict of interest: Nothing to declare

References

  • Weismuller TJ, Trivedi PJ, Bergquist A, Imam M, Lenzen H, Ponsioen CY, et al. (2017) Patient Age, Sex, and Inflammatory Bowel Disease Phenotype Associate With Course of Primary Sclerosing Cholangitis. Gastroenterology 152:1975-84 e8.
  • Dickson ER, Murtaugh PA, Wiesner RH, Grambsch PM, Fleming TR, Ludwig J, et al. (1992) Primary sclerosing cholangitis: refinement and validation of survival models. Gastroenterology 103:1893-901.
  • Kim G, Lee SS, Baik SK, Cho YZ, Kim MY, Kwon SO, et al. (2016) The need for histological subclassification of cirrhosis: a systematic review and meta-analysis. Liver Int 36:847-55.
  • Kim SU1, Oh HJ, Wanless IR, Lee S, Han KH, et al. (2012) The Laennec staging system for histological sub-classification of cirrhosis is useful for stratification of prognosis in patients with liver cirrhosis. J Hepatol 57: 556-563. [crossref]
  • Rastogi A, Maiwall R, Bihari C, Ahuja A, Kumar A, Singh T, et al. (2013) Cirrhosis histology and Laennec staging system correlate with high portal pressure. Histopathology 62:731-41.
  • Wang W, Li J, Pan R, A S, Liao C (2015) Association of the Laennec staging system with degree of cirrhosis, clinical stage and liver function. Hepatol Int 9:621-6.
  • La Mura V, Nicolini A, Tosetti G, Primignani M (2015) Cirrhosis and portal hypertension: The importance of risk stratification, the role of hepatic venous pressure gradient measurement. World J Hepatol 7:688-95.
  • Garcia-Tsao G, Friedman S, Iredale J, Pinzani M (2010) Now there are many (stages) where before there was one: In search of a pathophysiological classification of cirrhosis. Hepatology 51:1445-9.
  • Tsochatzis E, Bruno S, Isgro G, Hall A, Theocharidou E, Manousou P, et al. (2014) Collagen proportionate area is superior to other histological methods for sub-classifying cirrhosis and determining prognosis. J Hepatol 60:948-54.
  • Rockey DC, Caldwell SH, Goodman ZD, Nelson RC, Smith AD; American Association for the Study of Liver Diseases (2009) Liver biopsy. Hepatology 49: 1017-1044. [crossref]
  • Dietrich CF, Bamber J, Berzigotti A, Bota S, Cantisani V, Castera L, et al. (2017) EFSUMB Guidelines and Recommendations on the Clinical Use of Liver Ultrasound Elastography, Update 2017 (Long Version). Ultraschall Med.
  • Berzigotti A (2017) Non-invasive evaluation of portal hypertension using ultrasound elastography. J Hepatol 67: 399-411. [crossref]
  • Ziol M, Handra-Luca A, Kettaneh A, Christidis C, Mal F, et al. (2005) Noninvasive assessment of liver fibrosis by measurement of stiffness in patients with chronic hepatitis C. Hepatology 41: 48-54. [crossref]
  • Corpechot C, Carrat F, Poujol-Robert A, Gaouar F, Wendum D, Chazouilleres O, et al. (2012) Noninvasive elastography-based assessment of liver fibrosis progression and prognosis in primary biliary cirrhosis. Hepatology 56:198-208.
  • Corpechot C1, El Naggar A, Poujol-Robert A, Ziol M, Wendum D, et al. (2006) Assessment of biliary fibrosis by transient elastography in patients with PBC and PSC. Hepatology 43: 1118-1124. [crossref]
  • Corpechot C, Gaouar F, El Naggar A, Kemgang A, Wendum D, Poupon R, et al. (2014) Baseline values and changes in liver stiffness measured by transient elastography are associated with severity of fibrosis and outcomes of patients with primary sclerosing cholangitis. Gastroenterology 146:970-9; quiz e15-6.
  • Berzigotti A, Seijo S, Arena U, Abraldes JG, Vizzutti F, Garcia-Pagan JC, et al. (2013) Elastography, spleen size, and platelet count identify portal hypertension in patients with compensated cirrhosis. Gastroenterology 144:102-11 e1.
  • Talwalkar JA, Kurtz DM, Schoenleber SJ, West CP, Montori VM (2007) Ultrasound-based transient elastography for the detection of hepatic fibrosis: systematic review and meta-analysis. Clin Gastroenterol Hepatol 5:1214-20.
  • Vergniol J, Foucher J, Terrebonne E, Bernard PH, le Bail B, et al. (2011) Noninvasive tests for fibrosis and liver stiffness predict 5-year outcomes of patients with chronic hepatitis C. Gastroenterology 140: 1970-1979. [crossref]
  • Singh S, Fujii LL, Murad MH, Wang Z, Asrani SK, Ehman RL, et al. (2013) Liver stiffness is associated with risk of decompensation, liver cancer, and death in patients with chronic liver diseases: a systematic review and meta-analysis. Clin Gastroenterol Hepatol 11:1573-84 e1-2; quiz e88-9.
  • Shi KQ, Fan YC, Pan ZZ, Lin XF, Liu WY, Chen YP, et al. (2013) Transient elastography: a meta-analysis of diagnostic accuracy in evaluation of portal hypertension in chronic liver disease. Liver Int 33:62-71.
  • Millonig G, Reimann FM, Friedrich S, Fonouni H, Mehrabi A, Buchler MW, et al. (2008) Extrahepatic cholestasis increases liver stiffness (FibroScan) irrespective of fibrosis. Hepatology 48:1718-23.
  • Abraldes JG, Bureau C, Stefanescu H, Augustin S, Ney M, Blasco H, et al. (2016) Noninvasive tools and risk of clinically significant portal hypertension and varices in compensated cirrhosis: The “Anticipate” study. Hepatology 64:2173-84.
  • Augustin S, Millan L, Gonzalez A, Martell M, Gelabert A, Segarra A, et al. (2014) Detection of early portal hypertension with routine data and liver stiffness in patients with asymptomatic liver disease: a prospective study. J Hepatol 60:561-9.
  • Colecchia A, Montrone L, Scaioli E, Bacchi-Reggiani ML, Colli A, Casazza G, et al. (2012) Measurement of spleen stiffness to evaluate portal hypertension and the presence of esophageal varices in patients with HCV-related cirrhosis. Gastroenterology 143:646-54.
  • Wang J, Malik N, Yin M, Smyrk TC, Czaja AJ, Ehman RL, et al. (2017) Magnetic resonance elastography is accurate in detecting advanced fibrosis in autoimmune hepatitis. World J Gastroenterol 23:859-68.
  • Eaton JE, Dzyubak B, Venkatesh SK, Smyrk TC, Gores GJ, Ehman RL, et al. (2016) Performance of magnetic resonance elastography in primary sclerosing cholangitis. J Gastroenterol Hepatol 31:1184-90.
  • Imbert-Bismut F, Ratziu V, Pieroni L, Charlotte F, Benhamou Y, Poynard T, et al. (2001) Biochemical markers of liver fibrosis in patients with hepatitis C virus infection: a prospective study. Lancet 357:1069-75.
  • van Zanten RA, van Leeuwen RE, Wilson JH (1988) Serum procollagen III N-terminal peptide and laminin P1 fragment concentrations in alcoholic liver disease and primary biliary cirrhosis. Clin Chim Acta 177:141-6.
  • Adams LA, Bulsara M, Rossi E, DeBoer B, Speers D, George J, et al. (2005) Hepascore: an accurate validated predictor of liver fibrosis in chronic hepatitis C infection. Clin Chem 51:1867-73.
  • Wong VS, Hughes V, Trull A, Wight DG, Petrik J, Alexander GJ (1998) Serum hyaluronic acid is a useful marker of liver fibrosis in chronic hepatitis C virus infection. J Viral Hepat 5:187-92.
  • Walsh KM, Timms P, Campbell S, MacSween RN, Morris AJ (1999) Plasma levels of matrix metalloproteinase-2 (MMP-2) and tissue inhibitors of metalloproteinases -1 and -2 (TIMP-1 and TIMP-2) as noninvasive markers of liver disease in chronic hepatitis C: comparison using ROC analysis. Dig Dis Sci 44:624-30.
  • Xie Q, Zhou X, Huang P, Wei J, Wang W, et al. (2014) The performance of enhanced liver fibrosis (ELF) test for the staging of liver fibrosis: a meta-analysis. PLoS One 9: e92772. [crossref]
  • Parkes J, Roderick P, Harris S, Day C, Mutimer D, et al. (2010) Enhanced liver fibrosis test can predict clinical outcomes in patients with chronic liver disease. Gut 59: 1245-1251. [crossref]
  • Vesterhus M, Hov JR, Holm A, Schrumpf E, Nygard S, Godang K, et al. (2015) Enhanced liver fibrosis score predicts transplant-free survival in primary sclerosing cholangitis. Hepatology 62:188-97.
  • de Vries EM, Farkkila M, Milkiewicz P, Hov JR, Eksteen B, Thorburn D, et al. (2017) Enhanced liver fibrosis test predicts transplant-free survival in primary sclerosing cholangitis, a multi-centre study. Liver Int.
  • Krawczyk M, Zimmermann S, Hess G, Holz R, Dauer M, Raedle J, et al. (2017) Panel of three novel serum markers predicts liver stiffness and fibrosis stages in patients with chronic liver disease. PLoS One 12:e0173506.
  • Vesterhus M, Holm A, Hov JR, Nygard S, Schrumpf E, Melum E, et al. (2017) Novel serum and bile protein markers predict primary sclerosing cholangitis disease severity and prognosis. J Hepatol 66:1214-22.
  • Buck M, Garcia-Tsao G, Groszmann RJ, Stalling C, Grace ND, Burroughs AK, et al. (2014) Novel inflammatory biomarkers of portal pressure in compensated cirrhosis patients. Hepatology 59:1052-9.
  • Bellot P, Garcia-Pagan JC, Frances R, Abraldes JG, Navasa M, Perez-Mateo M, et al. (2010) Bacterial DNA translocation is associated with systemic circulatory abnormalities and intrahepatic endothelial dysfunction in patients with cirrhosis. Hepatology 52:2044-52.
  • Frances R, Rodriguez E, Munoz C, Zapater P, De la ML, Ndongo M, et al. (2005) Intracellular cytokine expression in peritoneal monocyte/macrophages obtained from patients with cirrhosis and presence of bacterial DNA. Eur J Gastroenterol Hepatol 17:45-51.
  • Wunsch E, Krawczyk M, Milkiewicz M, Trottier J, et al. (2016) Serum Autotaxin is a Marker of the Severity of Liver Injury and Overall Survival in Patients with Cholestatic Liver Diseases. Sci Rep 6: 30847. [crossref]
  • Kempinska-Podhorodecka A, Milkiewicz M, Jablonski D, Milkiewicz P, Wunsch E (2017) ApaI polymorphism of vitamin D receptor affects health-related quality of life in patients with primary sclerosing cholangitis. PLoS One 12:e0176264.
  • Poynard T (2011) First-line assessment of patients with chronic liver disease with non-invasive techniques and without recourse to liver biopsy. J Hepatol 54:586-7.
  • Poynard T, Imbert-Bismut F, Ratziu V, Chevret S, Jardel C, Moussalli J, et al. (2002) Biochemical markers of liver fibrosis in patients infected by hepatitis C virus: longitudinal validation in a randomized trial. J Viral Hepat 9:128-33.
  • Angulo P, Bugianesi E, Bjornsson ES, Charatcharoenwitthaya P, Mills PR, Barrera F, et al. (2013) Simple noninvasive systems predict long-term outcomes of patients with nonalcoholic fatty liver disease. Gastroenterology 145:782-9 e4.
  • Shah AG, Lydecker A, Murray K, Tetri BN, Contos MJ, et al. (2009) Comparison of noninvasive markers of fibrosis in patients with nonalcoholic fatty liver disease. Clin Gastroenterol Hepatol 7: 1104-1112. [crossref]
  • Parkes J, Guha IN, Roderick P, Harris S, Cross R, Manos MM, et al. (2011) Enhanced Liver Fibrosis (ELF) test accurately identifies liver fibrosis in patients with chronic hepatitis C. J Viral Hepat 18:23-31.
  • Sheth SG, Flamm SL, Gordon FD, Chopra S (1998) AST/ALT ratio predicts cirrhosis in patients with chronic hepatitis C virus infection. Am J Gastroenterol 93: 44-48. [crossref]
  • Gutkowski K, Hartleb M, Kacperek-Hartleb T, Kajor M, Mazur W, Zych W, et al. (2013) Laboratory-based scoring system for prediction of hepatic inflammatory activity in patients with autoimmune hepatitis. Liver Int 33:1370-7.
  • Abdo AA (2006) Clinical presentation, response to therapy, and predictors of fibrosis in patients with autoimmune hepatitis in Saudi Arabia. Saudi J Gastroenterol 12: 73-76. [crossref]
  • Abdollahi M, Pouri A, Ghojazadeh M, Estakhri R, Somi M (2015) Non-invasive serum fibrosis markers: A study in chronic hepatitis. Bioimpacts 5: 17-23. [crossref]
  • Anastasiou J, Alisa A, Virtue S, Portmann B, Murray-Lyon I, Williams R (2010) Noninvasive markers of fibrosis and inflammation in clinical practice: prospective comparison with liver biopsy. Eur J Gastroenterol Hepatol 22:474-80.
  • Luth S, Herkel J, Kanzler S, Frenzel C, Galle PR, Dienes HP, et al. (2008) Serologic markers compared with liver biopsy for monitoring disease activity in autoimmune hepatitis. J Clin Gastroenterol 42:926-30.
  • O EA, Buchter M, H AB, Korth J, Canbay A, Gerken G, et al. (2016) Performance and Utility of Transient Elastography and Non-Invasive Markers of Liver Fiibrosis in Patients with Autoimmune Hepatitis: A Single Centre Experience. Hepat Mon 16:e40737.
  • Friedrich-Rust M, Poynard T, Castera L (2016) Critical comparison of elastography methods to assess chronic liver disease. Nat Rev Gastroenterol Hepatol 13: 402-411. [crossref]
  • Marcin Krawczyk, Joanna Ligocka, Mariusz Ligocki, Joanna Raszeja-Wyszomirska, Małgorzata Milkiewicz, et al. (2017) Does transient elastography correlate with liver fibrosis in patients with PSC? Laennec score-based analysis of explanted livers. DOI: 10.1080/00365521.2017.1370009

Infection Trend, Distribution, and Factors Associated with Hepatitis B Virus Infection in Delaware, 2005-2015

Abstract

Background: Hepatitis B virus (HBV) infection is a global health problem. Immigrants to the United States have a high prevalence of HBV infection. Understanding the HBV infection trends and its distribution can improve prevention and control strategies. This study was to determine the infection trends, distribution, and factors associated with HBV infection in Delaware.

Methods: We performed a retrospective study on persons suspected of having HBV infection reported to Delaware Division of Public Health’s Surveillance System during January 1, 2005-December 31, 2015. The charts of 4, 981 persons were reviewed and included in the analysis.

Results: Of these 4, 981 persons, 2, 119 (42.5%) had HBV infection. During 2005-2015, acute and chronic HBV infection declined 80.9% and 60%, respectively for an overall reduction of 62.2%.

Males had a higher yearly infection rate. Rates declined 63.5% among males and 60.1% among females. There was an increase of 13.4% in the HBV infection in females during 2010-2015. HBV infection declined in all racial groups. Asians had a higher yearly infection rate and it increased 40.0% during 2010-2015. HBV infection declined in all age groups. However, an increase of 12.2% was seen among those 15-39 years during 2010-2015. Sixty-six percent of infected patients were in five cities: Wilmington, Newark, New Castle, Dover, and Bear.

In a multivariable logistic model, significant predictors for HBV infection included being male [adjusted odds ratio (aOR): 1.6, 95% CI: 1.4-1.8], age 15-39 years and 40-59 years (aOR: 3.7, 95% CI: 2.3-5.9 and 2.4, 95%CI: 1.5-3.8). Asian, black, and other race had a greater risk compared with white, with aOR of 5.8 (95% CI: 4.8-7.0), 1.7 (95% CI: 1.4-1.9), and 1.4 (95% CI: 1.1-1.9), respectively.

Conclusions: HBV infection is significant in Delaware and concentrated mainly in a few cities. Despite an overall decline, increases were seen among females, in the 15-39 age group, and in the Asian population during 2010-2015. Further studies should be conducted to identify factors contributing to these increases

Keywords

Hepatitis B virus (HBV), hepatitis B virus infection, incidence, prevalence, epidemiology, surveillance

Introduction

Hepatitis B virus (HBV) infection remains a major global health problem with an estimated 257 million chronic HBV-infected persons worldwide in 2017 [1]. In the United States, despite a comprehensive vaccination program to eliminate HBV transmission since 1991 [2], the estimated prevalence of current active HBV infection during 2011-2014 was 0.4% among U.S. adults age 18 years and over [3], with an estimate of 850, 000-2.2 million HBV-infected persons [4-6]. HBV infection is a vaccine preventable disease that is transmitted by percutaneous or mucosal exposure to infectious blood or body fluids. It is among the top 10 causes of infectious disease-related mortality in the world, with over 887, 000 deaths annually [1]. Delaware is a small state with a population of 945, 934 people in 2015 and home to 76, 768 immigrants in 2013 [7]. Immigrants to the United States have a high prevalence of viral hepatitis B surface antigen (HBsAg); it was 4.9% during 2004-2008 [8] and around 71.3% of chronic HBV infections were among persons born outside the United States [9]. Since individuals with chronic HBV infection are often unaware of their infection status, they are a major source of ongoing HBV transmission [10]. An understanding of HBV epidemiology is important for targeted public health efforts. This study aimed to determine HBV infection trends, identify its distribution and factors associated with HBV infection in Delaware during the period 2005-2015.

Methods

Data and patient population

HBV data reported by hospitals, clinics, and laboratories to the Delaware Division of Public Health (DPH) through the Delaware Electronic Reporting and Surveillance System (DERSS) were obtained for the years 2005-2015 (11-year period). Data reported to DERSS include information on laboratory testing results of suspected HBV infection persons. In addition, information collected by epidemiologists during the disease investigation process was reviewed, including data on the persons’ demographics, diagnosis, hospitalization, and vaccination status.

Study design

A retrospective study on persons suspected of having HBV infection was conducted. All reported persons to DERSS and information gathered during the disease investigation were included for review and analysis. The rate of HBV infection was the principal study outcome. HBV infection was defined based upon the Center for Disease Control and Prevention’s (CDC) clinical case definitions and laboratory criteria [11]. For acute HBV infection: a case was confirmed if met the clinical case definition, was laboratory confirmed, and was not known to have chronic hepatitis B. Clinical description includes an acute illness with a discrete onset of any sign or symptom consistent with acute viral hepatitis, and either a) jaundice, or b) elevated serum alanine aminotransferase (ALT) levels >100 IU/L. Laboratory criteria include hepatitis B surface antigen (HBsAg) positive, and Immunoglobulin M (IgM) antibody to hepatitis B core antigen (IgM anti-HBc) positive (if done). For chronic HBV infection: clinically, no symptoms are required. Persons with chronic HBV may have no evidence of liver disease or may have a spectrum of disease ranging from chronic hepatitis to cirrhosis or liver cancer. Laboratory criteria include IgM anti-HBc negative and a positive result on one of the following tests: HBsAg, hepatitis B e antigen (HBeAg), or nucleic acid test for hepatitis B virus DNA, or HBsAg positive or nucleic acid test for HBV DNA positive or HBeAg positive two times at least 6 months apart. A case was classified as a probable case if a person has a single HBsAg positive or HBV DNA positive or HBeAg positive and does not meet the case definition for acute hepatitis B, and a confirmed case if a person who meets either of the above laboratory criteria for diagnosis [11].

Statistical analysis

Descriptive statistics such as frequencies, means, medians, inter-quartile range, and cross-tabulation were used for patient characteristics. Between-group differences were evaluated using the chi-square test or Fisher’s exact test for categorical data or a Mann-Whitney test for continuous data. The yearly cumulative incidence of acute HBV infection and the yearly prevalence rate of chronic HBV infection per 100, 000 population were determined for the 2005-2015 period. Calculation of the yearly cumulative incidence was based on the number of newly-diagnosed patients and the number of people at risk for HBV infection within each year. The yearly prevalence rate of chronic HBV infection was estimated based upon the yearly number of chronic HBV-infected cases divided by the number of people in the population in the same year. In addition, the yearly rate of HBV infection per 100, 000 population was calculated by population characteristics (sex, age, and race). The yearly infection rate was estimated based on the yearly number of HBV-infected cases and the Delaware population in the same year stratified by sex, age group, and race. To identify distribution of HBV infection, patient characteristics were described and established by geographical location. Risk factors associated with HBV infection were analyzed by logistic regression models. Hosmer and Lemeshow stepwise strategies were applied for model building: potential independent variables with P-value <0.25 were included in the initial full model. Data analyses were performed using the Stata software program (version 13; STATA Corp., College Station, TX). P-values less than 0.05 (two tailed) were considered statistically significant.

Results

A total of 4, 981 people suspected of having HBV infection were identified and included in the analysis. Baseline and demographic characteristics, by HBV infection status, are presented in Table 1. HBV infection was identified in 2, 119 patients (42.5%, 232 acute and 1, 887 chronic HBV-infected patients), including 1, 988 (39.9%) and 131 (2.6%) cases of confirmed and probable HBV infection, respectively. Of this study population, a significantly larger number of reported persons were males compared with females [55.0% versus (vs.) 44.8%, P<0.001]. The overall study population’s mean age was 45.3 years [inter-quartile range (IQR): 34-56]. A majority (79.2%) were 15-59 years old; and white, black, and Asian races were observed in 38.5%, 34.1%, and 16.0%, respectively. Only 10.6% of the population had received one or more doses of HBV vaccination. Compared with the non-HBV infection group, the HBV-infected patients were younger [mean age: 42.7 years (IQR: 32-52) vs. 47.2 years (IQR: 36-58)] and had a significant larger number of patients in the 15-39 age group (43.1% vs. 27.3%, P<0.001). In addition, the HBV-infected patients had significantly fewer whites (26.4% vs. 47.4%), more persons of Asian origin (26.8% vs. 7.9%, P<0.001), and fewer patients who had received one or more doses of HBV vaccination, compared with the non-HBV infection group (6.1% vs. 14.0%, P < 0.001).

Table 1. Population characteristics

Characteristics HBV Infection(N = 2,119) Non-HBVInfection(N = 2,862) Total(N = 4,981) P-value
Gender; N (%)
Male 1246 (58.8) 1495 (52.2) 2741 (55.0)  <0.001
Female 870 (41.1) 1363 (47.6) 2233 (44.8)
Missing/Unknown  3 (0.1)  4 (0.2)  7 (0.2)
Age, N (%)   mean:45.3 years, IQR: 34-56 years)
 <15 27 (1.3) 94 (3.3) 121 (2.4) <0.001
15-39 914 (43.1) 782 (27.3) 1696 (34.1)
40-59 907 (42.8) 1341 (46.8) 2248 (45.1)
≥60 271 (12.8) 646 (22.6) 917 (18.4)
Race/Ethnicity, N (%)
White 560 (26.4) 1358 (47.4) 1918 (38.5) <0.001
Black 703 (33.2) 997 (34.8) 1700 (34.1)
Asian 568 (26.8) 227 (7.9) 795 (16.0)
Others* 82 (3.8) 128 (4.5) 210 (4.2)
Unknown 14 (0.7) 68 (2.4) 82 (1.7)
Missing 192 (9.1) 84 (3.0) 276 (5.5)
Received ≥01 dose of hepatitis B virus vaccination
Yes 130 (6.1) 399 (14.0) 529 (10.6) <0.001
No 1987 (93.8) 2463 (86.0) 4450 (89.3)
Unknown/Missing 2 (0.1) 0  2 (0.1)

* American Indian/Alaska Native, Pacific Islander, Hispanic, Multiracial

Hepatitis B virus infection trend

Between 2005 and 2015, 2, 119 patients (232 acute, 1, 887 chronic) infected with HBV were identified. Figure 1 shows the incidence of acute HBV infection and the prevalence rate of chronic HBV infection per 100, 000 population from 2005 through 2015. The incidence of acute HBV per 100, 000 population declined 80.9%, from 4.2 (34 cases in 2005) to 0.8 (8 cases in 2015). Similarly, chronic HBV infection per 100, 000 population declined 60% from 36.0 (295 cases in 2005) to 14.4 (136 cases in 2015), making the overall reduction (acute and chronic) of 62.2% from 40.2 (329 cases) to 15.2 (144 cases) per 100, 000 population. During a period of 2010-2012, there was a moderate spike of 28% in the prevalence of chronic HBV infection, from 13.4 (in 2010) to 17.1 cases (in 2012) per 100, 000 population; and then a slight increase of approximately 7%, from 13.5 (in 2013) to 14.4 cases (in 2015) per 100, 000 population.

IMROJ2017-210-NhiemVietLuongUSA_f1

Figure 1. Hepatitis B virus infection trend, Delaware, 2005-2015

Hepatitis B virus infection by gender

Of the 2, 119 patients infected with HBV, males accounted for 58.8% (1, 246 cases) compared with 41.1% (870 cases) among females. In the acute HBV-infected group, 66.0% (153 cases) were in males compared with 33.6% (78 cases) in females. Similarly, in the chronic HBV-infected group, 57.9% (1, 093 cases) were in males compared with 42.0% (792 cases) in females, Table 1. Figure 2 presents the HBV infection trend by gender per 100, 000 population during the period 2005-2015: Generally, males had a higher yearly HBV infection rate in comparison with females. Between 2005 and 2015, the HBV infection rate among males declined 63.5%, from 49.1 (195 cases) to 17.9 (82 cases) per 100, 000 population; and the HBV infection rate among females declined 60.1%, from 31.8 (134 cases) to 12.7 (62 cases) per 100, 000 population. Interestingly, in the period 2005-2010, the HBV infection declined 64.8% among females, which was higher than the 56.2% decline for males. However, in the period 2010-2015, while we observed a decline of 16.7% in males (from 21.5 to 17.9 cases per 100, 000 population), the HBV infection rate increased 13.4% in females (from 11.2 to 12.7 cases per 100, 000 population).

IMROJ2017-210-NhiemVietLuongUSA_f2

Figure 2. Hepatitis B virus infection by gender, Delaware, 2005-2015

Hepatitis B virus infection by age group

Of those infected with HBV, 85.9% (1, 821/2, 119 cases) were in the age groups of 15-39 and 40-59 years old, Table 2. Figure 3 presents the HBV infection trend per 100, 000 population by age group: In general, all age groups had a huge reduction between 2005 and 2015. The highest reduction (100%) was seen in the age group <15 years, from 2.5 (4 cases in 2005) to 0.6 (1 case in 2014) and 0.0 case (0 case in 2015) per 100, 000 population. The smallest reduction (63.6%) was observed in the age group of 15-39 years, from 51.7 (141 cases in 2005) to 23.8 (73 cases in 2015) per 100, 000 population. Approximately 88.9% reduction was seen in the age group of ≥60 years, from 19.7 (29 cases in 2005) to 7.2 (16 cases in 2015) per 100, 000 population; and 65.9% reduction was seen in the age group of 40-59 years, from 65.4 (155 cases in 2005) to 22.3 (55 cases in 2015) per 100, 000 population. Interestingly, in the period of 2010-2015, there was an increase of 12.2% in the HBV infection rate in the age group of 15-39 years, from 20.9 (62 cases in 2010) to 23.8 (73 cases in 2015) per 100, 000 population.

IMROJ2017-210-NhiemVietLuongUSA_f3

Figure 3. Hepatitis B virus infection by age group, Delaware, 2005-2015

Table 2. Characteristics of patients infected with Hepatitis B virus, Delaware, Period 2005-2015

Characteristics Acute HBVInfection(N=232) Chronic HBVInfection (N=1,887) Total (N=2,119)
Gender; N (%)
Male 153 (66.0) 1, 093 (57.9) 1, 246 (58.8)
Female 78 (33.6) 792 (42.0) 870 (41.1)
Missing/Unknown 1 (0.4) 2 (0.1) 3 (0.1)
Age, N (%) mean: 42.7 years, IQR: 32-52 years old)
<15 0 27 (1.4) 27 (1.3)
15-39 103 (44.4) 811 (43.0) 914 (43.1)
40-59 110 (47.4) 797 (42.2) 907 (42.8)
≥60 19 (8.2) 252 (13.4) 271 (12.8)
Race/Ethnicity, N (%)
White 101 (43.5) 459 (24.3) 560 (26.4)
Black 94 (40.5) 609 (32.3) 703 (33.2)
Asian 16 (6.9) 552 (29.3) 568 (26.8)
Others* 3 (1.3) 79 (4.2) 82 (3.9)
Unknown/Missing 18 (7.8) 188 (9.9) 206 (9.7)
County (N, %) and City** (zip code)
New Castle Wilmington
(19801-19810)
84 (36.2) 507 (26.9) 591 (27.9)
Smyrna
(19977)
3 (1.2) 25 (1.3) 28 (1.3)
Newark
(19702, 19711, 19713)
19 (8.1) 360 (19.0) 379 (17.9)
New Castle
(19720)
28 (12.0) 131 (6.9) 159 (7.5)
Middletown
(19709)
2 (0.8) 46 (2.4) 48 (2.2)
Hockessin
(19707)
1 (0.4) 51 (2.7) 52 (2.4)
Claymont
(19703)
6 (2.5) 58 (3.1) 63 (3.0)
Bear
(19701)
10 (4.3) 104 (5.5) 114 (5.3)
Kent Dover
(19901, 19904)
13 (5.6) 139 (7.3) 152 (7.1)
Smyrna
(19977)
4 (1.7) 51 (2.7) 55 (2.6)
Sussex Georgetown
(19947)
6 (2.5) 38 (2.0) 44 (2.0)
Lewes
(19958)
6 (2.5) 33 (1.7) 39 (1.8)
Millsboro
(19966)
3 (1.2) 27 (1.4) 30 (1.4)
Rehoboth Beach
(19971)
6 (2.6) 28 (1.4) 34 (1.6)
Seaford
(19973)
4 (1.7) 44 (2.3) 48 (2.2)

*: American Indian/Alaska Native, Pacific Islander, Hispanic, Multiracial

**: Only cities with a number of cases ≥25

Hepatitis B virus infection by race

Of the entire study population (4, 981 persons), white and black population accounted for a larger number of reported persons in comparison with Asian population (38.5% and 34.1% versus 16.0%, Table 1). However, in the group of HBV-infected patients (2, 119 HBV-infected persons, Table 2): the largest infected number was seen in black (33.2%), then Asian (26.8%), and white (26.4%). Particularly, in the acute HBV-infected patients, the largest number of cases was identified in white (43.5%), then black (40.5%, Asian (6.9%), and others (1.3%). In the chronic HBV-infected patients, the largest number was identified in black (32.3%), then Asian (29.3%), white (24.3%), and others (4.2%). Figure 4 presents the HBV infection trend per 100, 000 population by racial/ethnic group from 2005 to 2015: Generally, the decline was seen in all racial/ethnic groups. Asian population had a higher yearly infection rate per 100, 000 population in comparison with other populations: Compared with white, it was 25.1-fold and 31.5-fold higher in 2005 and 2015, respectively; and it was 5.9-fold and 6.4-fold higher in comparison with black in 2005 and 2015, respectively. In addition, Asian population had the lowest decline at 54.7%, from 348.6 (78 cases in 2005) to 157.8 (57 cases in 2015) per 100, 000 population; other race had the highest decline of 89.9%, from 38.8 (12 cases in 2005) to 3.9 (2 cases in 2015) per 100, 000 population; blacks had the second lowest decline of 57.9%, from 58.3 (95 cases in 2005) to 24.5 (50 cases in 2015) per 100, 000 population; and white obtained a decline of 64.0%, from 13.9 (84 cases in 2005) to 5.0 (33 cases in 2015) per 100, 000 population. Interestingly, regardless of a decline in all racial/ethnic groups, Asian group had an increase of 40.0% in the HBV infection rate, from 94.6 (26 cases in 2010) to 157.8 (57 cases in 2015) per 100, 000 population, during a period of 2010-2015.

IMROJ2017-210-NhiemVietLuongUSA_f4

Figure 4. Hepatitis B virus infection by race, Delaware, 2005-2015

Geographical distribution of HBV infection

Delaware state consists of three counties (New Castle, Kent, and Sussex counties), with a total of 56 cities. Table 2 presents characteristics of HBV-infected patients and their geographic distribution. Of the 2, 119 HBV-infected people, 66% (1, 395 cases) were identified in five cities: Wilmington (27.9%, 591 cases), Newark (17.9%, 379 cases), New Castle (7.5%, 159 cases), Dover (7.1%, 152 cases), and Bear (5.3%, 114 cases). Figure 5 presents the trend of HBV infection for these top five cities for the period 2005-2015 versus the remaining 51 other cities combined. The top-ranking city for the number of HBV-infected patients in 2005 was Wilmington, which also achieved the largest reduction of 69.9%, from 93 cases in 2005 to 28 cases in 2015. Newark ranked second in 2005 and during the period 2005-2010, its HBV cases declined 71.4%, from 70 cases in 2005 to 20 cases in 2010; however, between 2010 and 2015, the case count increased 45%, from 20 cases in 2010 to 29 cases in 2015. The City of New Castle ranked third for HBV cases in 2005 and its case count fell 64%, from 25 cases in 2005 to 9 cases in 2015. The City of Dover’s HBV cases declined 26.3% between 2005 (19 cases) and 2006 (14 cases), and then it fluctuated up and down, maintaining around 13-15 cases per year. All other cities combined (51 cities) obtained an overall decline of 53.5%, from 112 cases in 2005 to 46 cases in 2010 and to 52 cases in 2015.

IMROJ2017-210-NhiemVietLuongUSA_f5

Figure 5. HBV infection in top five and other cities, Delaware, 2005-2015

Factors associated with HBV infection

Potential risk factors associated with HBV infection were examined in univariate and multivariate logistic regression models. These include gender, age, and race. Table 3 shows the selected demographic predictors in the univariate and multivariable logistic regression analyses. Results from the multivariable analysis indicate that males had a greater risk for HBV infection than females [adjusted odds ratio (aOR): 1.6, 95% CI: 1.4-1.8); those 15-39 years and 40-59 years had a greater risk of HBV infection (aOR: 3.7, 95% CI: 2.3-5.9 and 2.4, 95% CI: 1.5-3.8, respectively) than those in the age group less than 15 years. Interestingly, compared with whites, Asians had a 5.8-fold (aOR: 5.8, 95% CI: 4.8-7.0) greater risk of HBV infection; black and other racial groups also had a greater risk, its aOR was 1.7 (95% CI: 1.4-1.9) and 1.4 (95% CI: 1.1-1.9) for black and other racial groups compared with white, respectively.

Table 3. Factors associated with Hepatitis B virus infection

Predictor Univariate
Odds ratio (95% CI)
Multivariate
Odds ratio (95% CI)
Gender
Female 1 1
Male 1.3 (1.2-1.5) 1.6 (1.4-1.8)
Age, years
<15 1 1
15-39 4.1 (2.6-6.3) 3.7 (2.3-5.9)
40-59 2.4 (1.5-3.6) 2.4 (1.5-3.8)
≥ 60 1.5 (0.9-2.3) 1.5 (0.9-2.4)
Race/Ethnicity
White 1 1
Black 1.7 (1.4-1.9) 1.7 (1.4-1.9)
Asian 6.1 (5.1-7.3) 5.8 (4.8-7.0)
Others 1.5 (1.1-2.1) 1.4 (1.1-1.9)

Discussion

Understanding HBV infection trends and the epidemiologic characteristics of those infected with HBV are key to inform improvements in prevention and control strategies. While there are reliable data about the relationship between HBV vaccination and HBV infection, there are no published data on infection trends and epidemiologic characteristics of persons infected with HBV in Delaware. Over the past 11 years, our data suggest that HBV infection remains a significant public health issue in Delaware. During the period 2005-2015, although Delaware achieved a 62.2% overall reduction in HBV infection, its yearly infection rate exceeded the national rate and rates in many other states, including Maryland, California, New Jersey, New York, and Pennsylvania [9, 12]. The Centers for Disease Control and Prevention reported the yearly national rate of acute HBV infection per 100, 000 population at 1.9 cases for 2005, 1.1 cases for 2010, and around 0.9 cases for the period of 2011-2014 [9]. Delaware’s yearly infection rate for acute HBV infection per 100, 000 population was much higher at 4.2 cases in 2005, 2.8 cases in 2010, 1.4-1.6 cases for the period 2011-2013, and 1.0 case for 2014. In regards to chronic HBV infection, although Delaware achieved a large decline of 62.7%, from 36.0 (in 2005) to 13.4 cases (in 2010), it experienced spikes to 18.5 cases in 2011, 17.1 cases in 2012, then remained at 13.5-14.4 cases per 100, 000 population for the period 2013-2015. With the infection rate of 14.0 cases per 100, 000 population in 2014, Delaware’s infection rate was higher in comparison with the 2014 rates as reported by CDC: Massachusetts, 3.3 cases; Michigan, 4.9 cases; New York, 5.3 cases; the City of Philadelphia, 6.0 cases; and Washington, 1.3 cases, all per 100, 000 population [9].

New HBV infections in the United States are increasingly concentrated among certain populations such as injection drug users, prison inmates, and persons with sexual risk behaviors such as multiple sex partners, sex partners of HBV-infected persons, and men who have sex with men [13]. The spikes in rates of HBV infection we observed may probably be related to a rising trend of heroin use in Delaware [14]: During 2010-2014, we observed a spike in HBV infection that coincided with a spike in the number of people seeking heroin treatment. For example, in 2011, 1, 263 people in Delaware sought heroin treatment; that number accelerated to 1, 845 people in 2012, 2, 750 in 2013, and 3, 182 in 2014 [15].

Hepatitis B vaccination is the most effective measure to prevent HBV infection. In Delaware, the hepatitis B vaccination requirement for children going to public school began in the 1999-2000 school year, and by the 2005-2006 school year, all children from kindergarten to grade 12 must have the hepatitis B vaccine series. Our data showed that almost 90% of the study subjects (4, 981 persons) had no HBV vaccination, and among those infected with HBV (2, 119 persons), almost 94% had no HBV vaccination. Ongoing HBV transmission occurs primarily among unvaccinated persons with high risk behaviors for HBV transmission [16]. Our finding suggests that there is still a large proportion of Delawareans who may not have received the hepatitis B vaccine series.

We found the Asian population not only have a higher yearly infection rate in comparison to all other populations, but they also had the lowest decline in HBV infection: Compared with whites, Asians had a 5.8 fold increased risk for HBV infection; and interestingly, the Asian population had a 40% increase in HBV infection rate during a period of 2010-2015. Our findings are consistent with findings from the CDC and other studies from New York City, San Francisco, and Minnesota that Asians were at higher risk for HBV infection and the majority of chronic HBV infections in the United States were among Asians [9, 16-18].

France et al. reported that more than 93% of chronic HBV cases from January 1, 1999 to December 31, 2008 in New York City were among persons born outside the United States [19]. Recent studies also found that persons born outside of the United States, especially immigrants, had a high prevalence of chronic HBV infection and since they were often unaware of their infection status, were sources of infection [8-10]. Higher rates of HBV infection in Delaware and a recent increase in HBV infection among its Asian population may be attributed to a large number of immigrants. In 2013, Delaware was home to 76, 768 immigrants (8.3% of Delaware’s population); Asians accounted for 33, 639 persons (3.6% of the 2013 Delaware population); and around 34, 625 immigrants were naturalized U.S. citizens in Delaware in 2013. Unauthorized immigrants comprised roughly 20, 000 people (2.4% of the Delaware population) in 2012 [7], a group that may have limited access to health care. A large burden of HBV infection among certain populations suggest a need for the hepatitis B program targeting these populations to identify the infected and link them to care.

Chronic HBV was more common among males than females [20, 21]. We found males had a higher yearly rate of HBV infection, they had a 1.6 fold increased risk for HBV infection compared to females; our finding was consistent with CDC reports and other studies [5, 9, 12]. Interestingly, during the period 2010-2015, we observed an increase of 13.4% in HBV infection among females. The reasons for this increase are unknown, elucidating it would provide important insight into potential trends or behaviors that may affect Delaware’s HBV prevention efforts, such as whether Delaware females have experienced an increase using heroin or practicing risky sexual behaviors. In the United States, most infections occur among adolescents and adults due to sexual and injecting drug use exposures [16]. Adolescents and young adults are the most vulnerable subjects to risky sexual behaviors and injecting drug use. We found the young age group of 15-39 years had the least overall reduction in HBV infection compared with other age groups, and infection increased 12.2% in this age group during 2010-2015. Our finding suggests that more prevention efforts are needed to target this young age group e.g. education on HBV prevention and risky behaviors, screening for HBV, and HBV vaccination.

The geographical distribution of HBV infections provides an important hint in terms of where the HBV prevention efforts should be targeted. Delaware consists of 56 cities, however 66% of HBV-infected persons identified were in five cities: Wilmington, Newark, New Castle, Dover, and Bear. We observed different levels of reduction in these cities. Our finding suggests that there may be benefit to targeting HBV prevention activities in those five cities, especially in Newark, where HBV infection increased 45% in 2010-2015; and Wilmington, where around 60% of the state’s population lives, to reduce Delaware’s HBV infection rate.

Our study has some limitations. First, our study design was a retrospective with information obtained through chart review, we may have missed asymptomatic patients who might not be detected or documented by treating physicians; hence, have underestimated the infection rate. Nonetheless, because HBV infection is a reportable condition in Delaware, it is likely that the database captured the majority of identified HBV-infected cases. Second, our data were from the state surveillance data for hepatitis B virus infection, the study subjects were more likely to have HBV infection. Finally, DERSS is a state passive surveillance system. Although epidemiologists had tried to gather all necessary information on a case during the investigation process, it was obvious that lots of information (e.g. risky health behaviors, immigration status, comorbidities) was not captured in the system, thus, not allowing us the obtain data that definitely identify subsets of local population with higher risk for infection.

Conflict of interest: All authors have no conflict of interest to declare. This work was presented at the 2017 Council of State and Territorial Epidemiologists Annual Conference.

References

  1. World Health Organization. Hepatitis B: Fact Sheet, updated July 2017. July 2016. Accessed September 20, 2017. http: //www.who.int/mediacentre/factsheets/fs204/en/.
  2. Centers for Disease Control and Prevention (1991) Hepatitis B virus: a comprehensive strategy for eliminating transmission in the United States through universal childhood vaccination. Recommendations of the Immunization Practices Advisory Committee (ACIP). MMWR Recomm Rep 1991: 1–25.
  3. Kruszon-Moran D, Paulose-Ram R, Denniston M, McQuillan G (2015) Viral Hepatitis among Non-Hispanic Asian Adults in the United States, 2011-2014. NCHS Data Brief 2015: 1–8. [Crossref]
  4. Roberts H, Kruszon-Moran D, Ly KN, Hughes E, Iqbal K, et al. (2016) Prevalence of chronic hepatitis B virus (HBV) infection in U.S. households: National Health and Nutrition Examination Survey (NHANES), 1988-2012. Hepatology 63: 388–397.
  5. Wasley A, Kruszon-Moran D, Kuhnert W, Simard EP, Finelli L, et al. (2010) The prevalence of hepatitis B virus infection in the United States in the era of vaccination. J Infect Dis 202: 192–201.
  6. Kowdley KV, Wang CC, Welch S, Roberts H, Brosgart CL (2012) Prevalence of chronic hepatitis B among foreign-born persons living in the United States by country of origin. Hepatology 56: 422–433.
  7. American Immigration Council. New Americans in Delaware: The Political and Economic Power of Immigrants, Latinos, and Asians in the First State. 2015. Accessed January 4, 2017. https: //www.americanimmigrationcouncil.org/research/new-americans-delaware.
  8. Mitchell T, Armstrong GL, Hu DJ, Wasley A, Painter JA (2011) The increasing burden of imported chronic hepatitis B–United States, 1974–2008. PLoS One 6(12): e27717.
  9. Centers for Disease Control and Prevention (2016) Viral Hepatitis Surveillance-United States, 2014. Accessed 12/23, 2016. https: //www.cdc.gov/hepatitis/statistics/2014surveillance/index.htm.
  10. Weinbaum CM, Williams I, Mast EE, Wang SA, Finelli L, et al. (2008) Recommendations for identification and public health management of persons with chronic hepatitis B virus infection. MMWR Recomm Rep 19: 1–20. [Crossref]
  11. Centers for Disease Control and Prevention (CDC). National Notifiable Diseases Surveillance System (NNDSS). Case Definition. 2016; Accessed 12/17, 2016.https: //wwwn.cdc.gov/nndss/conditions/.
  12. Centers for Disease Control and Prevention. Viral Hepatitis Surveillance-United States, 2009. Accessed Jan 6, 2017. https://www.cdc.gov/hepatitis/statistics/2009surveillance/index.htm.
  13. Shepard CW, Simard EP, Finelli L, Fiore AE, Bell BP (2006) Hepatitis B Virus Infection: Epidemiology and Vaccination. Epidemiol Rev 28: 112–125.
  14. DEA Philadelphia Field Division. The Drug Situation in Delaware. 2016.
  15. Taylor A (2016) Delaware’s Heroin Crisis-Special report. Accessed March 13, 2017. http://www.delawareonline.com/story/news/local/heroindelaware/2014/06/14/delaware-heroin-problems/10468289/.
  16. Mast EE, Weinbaum CM, Fiore AE, Alter MJ, Bell BP, et al. (2006) A comprehensive immunization strategy to eliminate transmission of hepatitis B virus infection in the United States: recommendations of the Advisory Committee on Immunization Practices (ACIP) Part II: immunization of adults. MMWR Recomm Rep 8: 1–33.
  17. Centers for Disease Control and Prevention (CDC) (2012) Surveillance for chronic hepatitis B virus infection – New York City, June 2008-November 2009. MMWR Morb Mortal Wkly Rep 61: 6–9. [Crossref]
  18. Centers for Disease Control and Prevention (CDC) (2007) Characteristics of persons with chronic hepatitis B–San Francisco, California, 2006. MMWR Morb Mortal Wkly Rep 11: 446–448.
  19. France AM, Bornschlegel K, Lazaroff J, Kennedy J, Balter S (2012 ) Estimating the prevalence of chronic hepatitis B virus infection–New York City, 2008. J Urban Health 89: 373–383.
  20. Kim WR (2009) Epidemiology of hepatitis B in the United States. Hepatology 49: S28–34. [Crossref]
  21. Blumberg BS (2006) The curiosities of hepatitis B virus: prevention, sex ratio, and demography. Proc Am Thorac Soc 3: 14–20. [Crossref]