Author Archives: admin

Albedo Changes Drive 4.9 to 9.4°C Global Warming by 2400

Abstract

This study ties increasing climate feedbacks to projected warming consistent with temperatures when Earth last had this much CO2 in the air. The relationship between CO2 and temperature in a Vostok ice core is used to extrapolate temperature effects of today’s CO2 levels. The results suggest long-run equilibrium global surface temperatures (GSTs) 5.1°C warmer than immediately “pre-industrial” (1880). The relationship derived holds well for warmer conditions 4 and 14 million years ago (Mya). Adding CH4 data from Vostok yields 8.5°C warming due to today’s CO2 and CH4 levels. Long-run climate sensitivity to doubled CO2, given Earth’s current ice state, is estimated to be 8.2°C: 1.8° directly from CO2 and 6.4° from albedo effects. Based on the Vostok equation using CO2 only, holding ∆GST to 2°C requires 318 ppm CO2. This means Earth’s remaining carbon budget for +2°C is estimated to be negative 313 billion tonnes. Meeting this target will require very large-scale CO2 removal. Lagged warming of 4.0°C (or 7.4°C when CH4 is included), starting from today’s 1.1°C ∆GST, comes mostly from albedo changes. Their effects are estimated here for ice, snow, sulfates, and cloud cover. This study estimates magnitudes for sulfates and for future snow changes. Magnitudes for ice, cloud cover, and past snow changes are drawn from the literature. Albedo changes, plus their water vapor multiplier, caused an estimated 39% of observed GST warming over 1975-2016. Estimated warming effects on GST by water vapor; ocean heat; and net natural carbon emissions (from permafrost, etc.), all drawn from the literature, are included in projections alongside ice, snow, sulfates, and clouds. Six scenarios embody these effects. Projected ∆GSTs on land by 2400 range from 2.4 to 9.4°C. Phasing out fossil fuels by 2050 yields 7.1°C. Ending fossil fuel use immediately yields 4.9°C, similar to the 5.1°C inferred from paleoclimate studies for current CO2 levels. Phase-out by 2050 coupled with removing 71% of CO2 emitted to date yields 2.4°C. At the other extreme, postponing peak fossil fuel use to 2035 yields +9.4°C GST, with more warming after 2400.

Introduction

The December 2015 Paris climate pact set a target of limiting global surface temperature (GST) warming to 2°C above “pre-industrial” (1750 or 1880) levels. However, study of past climates indicates that this will not be feasible, unless greenhouse gas (GHG) levels, led by carbon dioxide (CO2) and methane (CH4), are reduced dramatically. Already, global air temperature at the land surface (GLST) has warmed 1.6°C since the 1880 start of NASA’s record [1]. (Temperatures in this study are 5-year moving averages from NASA, Goddard Institute for Space Studies, in °C. Baseline is 1880 unless otherwise noted.) The GST has warmed by 2.5°C per century since 2000. Meanwhile, global sea surface temperature (=(GST – 0.29 * GLST)/0.71) has warmed by 0.9°C since 1880 [2].

The paleoclimate record can inform expectations of future warming from current GHG levels. This study examines conditions during ice ages and during the most recent (warmer) epochs when GHG levels were roughly this high, some lower and some higher. It strives to connect future warming derived from paleoclimate records with physical processes, mostly from albedo changes, that produce the indicated GST and GLST values.

The Temperature Record section examines Earth’s temperature record, over eons. Paleoclimate data from a Vostok ice core covering 430,000 years (430 ky) is examined. The relations among changes in GST relative to 1880, hereafter “∆°C”, and CO2 and CH4 levels in this era colder than now are estimated. These relations are quite consistent with the ∆°C to CO2 relation in eras warmer than now, 4 and 14 Mya. Overall climate sensitivity is estimated based on them. Earth’s remaining carbon budget to keep warming below 2°C is calculated next, based on the equations relating ∆°C to CO2 and CH4 levels in the Vostok ice core. That budget is far less than zero. It requires returning to CO2 levels of 60 years ago.

The Feedback Pathways section discusses the major factors that lead from our present GST to the “equilibrium” GST implied by the paleoclimate data, including a case with no further human carbon emissions. This path is governed by lag effects deriving mainly from albedo changes and their feedbacks. Following an overview, eight major factors are examined and modeled to estimate warming quantities and time scales due to each. These are (1) loss of sulfates (SO4) from ending coal use; (2) snow cover loss; (3) loss of northern and southern sea ice; (4) loss of land ice in Antarctica, Greenland and elsewhere; (5) cloud cover changes; (6) water vapor increases due to warming; (7) net emissions from permafrost and other natural carbon reservoirs; and (8) warming of the deep ocean.

Particular attention is paid to the role that anthropogenic and other sulfates have played in modulating the GST increase in the thermometer record. Loss of SO4 and northern sea ice in the daylight season will likely be complete not long after 2050. Losses of snow cover, southern sea ice, land ice grounded below sea level, and permafrost carbon, plus warming the deep oceans, should happen later and/or more slowly. Loss of other polar land ice should happen still more slowly. But changes in cloud cover and atmospheric water vapor can provide immediate feedbacks to warming from any source.

In the Results section, these eight factors, plus anthropogenic CO2 emissions, are modeled in six emission scenarios. The spreadsheet model has decadal resolution with no spatial resolution. It projects CO2 levels, GSTs, and sea level rise (SLR) out to 2400. In all scenarios, GLST passes 2°C before 2040. It has already passed 1.5°. The Discussion section lays out the implications of Earth’s GST paths to 2400, implicit both in the paleoclimate data and in the development of specific feedbacks identified for quantity and time-path estimation. These, combined with a carbon emissions budget to hold GST to 2°C, highlights how crucial CO2 removal (CDR) is. CDR is required to go beyond what emissions reduction alone can achieve. Fifteen CDR methods are enumerated. A short overview of solar radiation management follows. It may be required to supplement ending fossil fuel use and large-scale CDR.

The Temperature Record

In a first approach, temperature records from the past are examined for clues to the future. Like causes (notably CO2 levels) should produce like effects, even when comparing eras hundreds of thousands or millions of years apart. As shown in Figure 1, Earth’s surface can grow far warmer than now, even 13°C warmer, as occurred some 50 Mya. Over the last 2 million years, with more ice, temperature swings are wider, since albedo changes – from more ice to less ice and back – are larger. For GSTs 8°C or warmer than now, ice is rare. Temperature spikes around 55 and 41 Mya show that the current one is not quite unique.
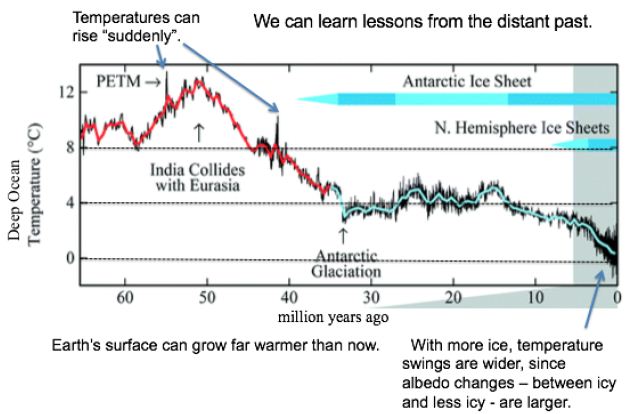
fig 1

Figure 1: Temperatures and Ice Levels over 65 Million Years [3].

Some 93% of global warming goes to heat Earth’s oceans [4]. They show a strong warming trend. Ocean heat absorption has accelerated, from near zero in 1960: 4 zettaJoules (ZJ) per year from 1967 to 1990, 7 from 1991 to 2005, and 10 from 2010 to 2016 [5]. 10 ZJ corresponds to 100 years of US energy use. The oceans now gain 2/3 as much heat per year as cumulative human energy use or enough to supply US energy use for 100 years [6] or the world’s for 17 years. By 2011, Earth was absorbing 0.25% more energy than it emits, a 300 (±75) million MW heat gain [7]. Hansen deduced in 2011 that Earth’s surface must warm enough to emit another 0.6 Wm-2 heat to balance absorption; the required warming is 0.2°C. The imbalance has probably increased since 2011 and is likely to increase further with more GHG emissions. Over the last 100 years (since 1919), GSTs have risen 1.27°C, including 1.45°C for the land surface (GLST) alone [1]. The GST warming rate from 2000 to 2020 was 0.24°C per decade, but 0.35 over the most recent decade [1,2]. At this rate, warming will exceed 2°C in 2058 for GST and in 2043 for GLST only.

Paleoclimate Analysis

Atmospheric CO2 levels have risen 47% since 1750, including 40% since 1880 when NASA’s temperature records begin [8]. CH4 levels have risen 114% since 1880. CO2 levels of 415 parts per million (ppm) in 2020 are the highest since 14.1 to 14.5 Mya, when they ranged from 430 to 465 ppm [9]. The deep ocean then (over 400 ky) ranged around 5.6°C±1.0°C warmer [10] and seas were 25-40 meters higher [9]. CO2 levels were almost as high (357 to 405 ppm) 4.0 to 4.2 Mya [11,12]. SSTs then were around 4°C±0.9°C warmer and seas were 20-35 meters higher [11,12].

The higher sea levels in these two earlier eras tell us that ice then was gone from almost all of the Greenland (GIS) and West Antarctic (WAIS) ice sheets. They hold an estimated 10 meters (7 and 3.2 modeled) of SLR between them [13,14]. Other glaciers (chiefly in Arctic islands, the Himalayas, Canada, Alaska, and Siberia) hold perhaps 25 cm of SLR [15]. Ocean thermal expansion (OTE), currently about (~) 1 mm/year [5], is another factor in SLR. This corresponds to the world ocean (to the bottom) currently warming by ~0.002°Kyr-1. The higher sea levels 4 and 14 Mya indicate 10-30 meters of SLR that could only have come from the East Antarctic ice sheet (EAIS). This is 17-50% of the current EAIS volume. Two-thirds of the WAIS is grounded below sea level, as is 1/3 in the EAIS [16]. Those very areas (which are larger in the EAIS than the WAIS) include the part of East Antarctica most likely to be subject to ice loss over the next few centuries [17]. Sediments from millions of years ago show that the EAIS then had retreated hundreds of kilometers inland [18].

CO2 levels now are somewhat higher than they were 4 Mya, based on the current 415 ppm. This raises the possibility that current CO2 levels will warm Earth’s surface 4.5 to 5.0°C, best estimate 4.9°, over 1880 levels. (This is 3.4 to 3.9°C warmer than the current 1.1°C.) Consider Vostok ice core data that covers 430 ky [19]. Removing the time variable and scatter-plotting ∆°C against CO2 levels as blue dots (the same can be done for CH4), gives Figure 2. Its observations span the last 430 ky, at 10 ky resolution starting 10 kya.
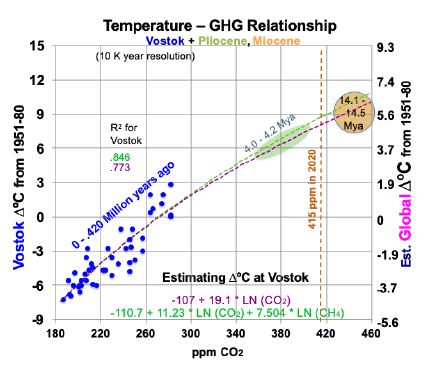
fig 2

Figure 2: Temperature to Greenhouse Gas Relationship in the Past.

Superimposed on Figure 2 are trend lines from two linear regression equations, using logarithms, for temperatures at Vostok (left-hand scale): one for CO2 (in ppm) alone and one for both CO2 and CH4 (ppb). The purple trend line in Figure 2, from Equation (1) for Vostok, uses only CO2. 95% confidence intervals in this study are shown in parentheses with ±.

(1) ∆°C = -107.1 (±17.7) + 19.1054 (±3.26) ln(CO2).

The t-ratios are -11.21 and 11.83 for the intercept and CO2 concentration, while R2 is 0.773 and adjusted R2 is 0.768. The F statistic is 139.9. All are highly significant. This corresponds to a climate sensitivity of 13.2°C at Vostok [19.1054 * ln (2)] for doubled CO2, within the range of 180 to 465 ppm CO2. As shown below, most of this is due to albedo changes and other amplifying feedbacks. Therefore, climate sensitivity will decline as ice and snow become scarce and Earth’s albedo stabilizes. The green trend line in Figure 2, from Equation (2) for Vostok, adds a CH4 variable.

(2) ∆°C = -110.7 (±14.8) +11.23 (±4.55) ln(CO2) + 7.504 (±3.48) ln(CH4).

The t-ratios are -15.05, 4.98, and 4.36 for the intercept, CO2, and CH4. R2 is 0.846 and adjusted R2 is 0.839. The F statistic of 110.2 is highly significant. To translate temperature changes at the Vostok surface (left-hand axis) over 430 ky to changes in GST (right-hand axis), the ratio of polar change to global over the past 2 million years is used, from Snyder [20]. Snyder examined temperature data from many sedimentary sites around the world over 2 My. Her results yield a ratio for polar to global warming: 0.618. This relates the left- and right-hand scales in Figure 2. The GST equations, global instead of Vostok local, corresponding to Equations (1) and (2) for Vostok, but using the right-hand scale for global temperature, are:

(3) ∆°C = -66.19 + 11.807 ln(CO2) and

(4) ∆°C = -68.42 + 6.94 ln(CO2) + 4.637 ln(CH4).

Both equations yield good fits for 14.1 to 14.5 Mya and 4.0 to 4.2 Mya. Equation 3 yields a GST climate sensitivity estimate of 8.2° (±1.4) for doubled CO2. Table 1 below shows the corresponding GSTs for various CO2 and CH4 levels. CO2 levels range from 180 ppm, the lowest recorded during the past four ice ages, to twice the immediately “pre-industrial” level of 280 ppm. Columns D, I and N add 0.13°C to their preceding columns, the difference the 1880 GST and the 1951-80 mean GST used for the ice cores. Rows are included for CO2 levels corresponding to 1.5 and 2°C warmer than 1880, using the two equations, and for the 2020 CO2 level of 415 ppm. The CH4 levels (in ppb) in column F are taken from observations or extrapolated. The CH4 levels in column K are approximations of the CH4 levels about 1880, before human activity raised CH4 levels much – from some mixture of fossil fuel extraction and leaks, landfills, flooded rice paddies, and large herds of cattle.

Other GHGs (e.g., N2O and some not present in the Vostok ice cores, such as CFCs) are omitted in this discussion and in modeling future changes. Implicitly, this simplifying assumption is that the weighted rate of change of other GHGs averages the same as CO2.

Implications

Applying Equation (3) using only CO2, now at 415 ppm, yields a future GST 4.99°C warmer than the 1951-80 baseline. This translates to 5.12°C warmer than 1880, or 3.99°C warmer than 2018-2020 (2). This is consistent not only with the Vostok ice core records, but also with warmer Pliocene and Miocene records using ocean sediments from 4 and 14 Mya. However, when today’s CH4 levels, ~ 1870 ppb, are used in Equation (4), indicated equilibrium GST is 8.5°C warmer than 1880. Earth’s GST is currently far from equilibrium.

Consider the levels of CO2 and CH4 required to meet Paris goals. To hold GST warming to 2°C requires reducing atmospheric CO2 levels to 318 ppm, using Equation (3), as shown in Table 1. This requires CO2 removal (CDR), at first cut, of (415-318)/(415-280) = 72% of human CO2 emissions to date, plus any future ones. Equation (3) also indicates that holding warming to 1.5°C requires reducing CO2 levels to 305 ppm, equivalent to 81% CDR. Using Equation (4) with pre-industrial CH4 levels of 700 ppb, consistent with 1750, yields 2°C GST warming for CO2 at 314 ppm and 1.5°C for 292 ppm CO2. Human carbon emissions from fossil fuels from 1900 through 2020 were about 1600 gigatonnes (GT) of CO2, or about 435 GT of carbon [21]. Thus, using Equation (3) yields an estimated remaining carbon budget, to hold GST warming to 2°C, of negative 313 (±54) GT of carbon, or ~72% of fossil fuel CO2 emissions to date. This is only the minimum CDR required. First, removal of other GHGs may be required. Second, any further human emissions make the remaining carbon budget even more negative and require even more CDR. Natural carbon emissions, led by permafrost ones, will increase. Albedo feedbacks will continue, warming Earth farther. Both will require still more CDR. So, the true remaining carbon budget may actually be in the negative 400-500 GT range, and most certainly not hundreds of GT greater than zero.

Table 1: Projected Equilibrium Warming across Earth’s Surface from Vostok Ice Core Analysis (1951-80 Baseline).
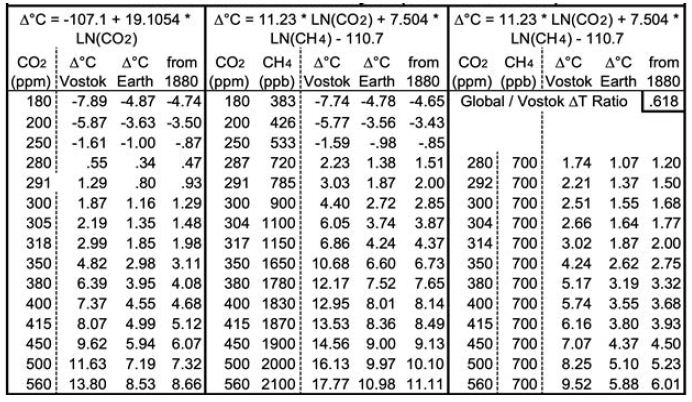
table 1

The difference between current GSTs and equilibrium GSTs of 5.1 and 8.5°C stem from lag effects. The lag effects come mostly from albedo changes and their feedbacks. Most albedo changes and feedbacks happen over days to decades to centuries. Ones due to land ice and vegetation changes can continue over longer timescales. However, cloud cover and water vapor changes happen over minutes to hours. The specifics (except vegetation, not examined or modelled) are detailed in the Feedback Pathways section below.

However, the bottom two lines of Table 1 probably overestimate the temperature effects of 500 and 560 ppm of CO2, as discussed further below. This is because albedo feedbacks from ice and snow, which in large measure underlie the derivations from the ice core, decline with higher temperatures outside the CO2 range (180-465 ppm) used to derive and validate Equations (1) through (4).

Feedback Pathways to Warming Indicated by Paleoclimate Analysis

To hold warming to 2°C or even 1.5°, large-scale CDR is required, in addition to rapid reductions of CO2 and CH4 emissions to almost zero. As we consider the speed of our required response, this study examines: (1) the physical factors that account for this much warming and (2) the possible speed of the warming. As the following sections show, continued emissions speed up amplifying feedback processes, making “equilibrium” GSTs still higher. So, rapid emission reductions are the necessary foundation. But even an immediate end to human carbon emissions will be far from enough to hold warming to 2°C.

The first approach to projecting our climate future, in the Temperature Record section above, drew lessons from the past. The second approach, in the Feedback Pathways section here and below, examines the physical factors that account for the warming. Albedo effects, where Earth reflects less sunlight, will grow more important over the coming decades, in part because human emissions will decline. The albedo effects include sulfate loss from ending coal burning, plus reduced extent of snow, sea ice, land-based ice, and cloud cover. Another key factor is added water vapor, a powerful GHG, as the air heats up from albedo changes. Another factor is lagged surface warming, since the deeper ocean heats up more slowly than the surface. It will slowly release heat to the atmosphere, as El Niños do.

A second group of physical factors, more prominent late this century and beyond, are natural carbon emissions due to more warming. Unlike albedo changes, they alter CO2 levels in the atmosphere. The most prominent is from permafrost. Other major sources are increased microbial respiration in soils currently not frozen; carbon evolved from warmer seas; release of seabed CH4 hydrates; and any net decreased biomass in forests, oceans, and elsewhere.

This study estimates rough magnitudes and speeds of 13 factors: 9 albedo changes (including two for sea ice and four for land ice); changes in atmospheric water vapor and other ocean-warming effects; human carbon emissions; and natural emissions – from permafrost, plus a multiplier for the other natural carbon emissions. Characteristic time scales for these changes to play out range from decades for sulfates, northern and southern sea ice, human carbon emissions, and non-polar land ice; to centuries for snow, permafrost, ocean heat content, and land ice grounded below sea level; to millennia for other land ice. Cloud cover and water vapor respond in hours to days, but never disappear. The model also includes normal rock weathering, which removes about 1 GT of CO2 per year [22], or about 3% of human emissions.

Anthropogenic sulfur loss and northern sea ice loss will be complete by 2100 and likely more than half so by 2050, depending on future coal use. Snow cover and cloud cover feedbacks, which respond quickly to temperature change, will continue. Emissions from permafrost are modeled as ramping up in an S-curve through 2300, with small amounts thereafter. Those from seabed CH4 hydrates and other natural sources are assumed to ramp up proportionately with permafrost: jointly, by half as much. Ice loss from the GIS and WAIS grounded below sea level is expected to span many decades in the hottest scenarios, to a few centuries in the coolest ones. Partial ice loss from the EAIS, led by the 1/3 that is grounded below sea level, will happen a bit more slowly. Other polar ice loss should happen still more slowly. Warming the deep oceans, to reestablish equilibrium at the top of the atmosphere, should continue for at least a millennium, the time for a circuit of the world thermohaline ocean circulation.

This analysis and model do not include changes in (a) black carbon; (b) mean vegetation color, as albedo effects of grass replacing forests at lower latitudes may outweigh forests replacing tundra and ice at higher latitudes; (c) oceanic and atmospheric circulation; (d) anthropogenic land use; (e) Earth’s orbit and tilt; or (f) solar output.

Sulfate Effects

SO4 in the air intercepts incoming sunlight before it arrives at Earth’s surface, both directly and indirectly via formation of cloud condensation nuclei. It then re-radiates some of that energy upward, for a net cooling effect at Earth’s surface. Mostly, sulfur impurities in coal are oxidized to SO2 in burning. SO2 is converted to SO4 by chemical reactions in the troposphere. Residence times are measured in days. Including cooling from atmospheric SO4 concentrations explains a great deal of the variation between the steady rise in CO2 concentrations and the variability of GLST rise since 1880. Human SO2 emissions rose from 8 Megatonnes (MT) in 1880 to 36 MT in 1920, 49 in 1940, and 91 in 1960. They peaked at 134 MT in 1973 and 1979, before falling to 103-110 during 2009-16 [23]. Corresponding estimated atmospheric SO4 concentrations rose from 41 parts per billion (ppb) in 1880 (and a modestly lower amount before then), to 90 in 1920, 85 in 1940, and 119 in 1960, before reaching peaks of 172-178 during 1973-80 [24] and falling to 130-136 over 2009-16. Some atmospheric SO4 is from natural sources, notably dimethyl sulfides from some ocean plankton, some 30 ppb. Volcanoes are also an important source of atmospheric sulfates, but only episodically (mean 8 ppb) and chiefly in the stratosphere (from large eruptions), with a typical residence time there of many months.

Figure 3 shows the results of a linear regression analysis, in blue, of ∆°C from the thermometer record and concentrations of CO2, CH4, and SO4. SO4 concentrations between the dates referenced above are interpolated from human emissions, added to SO4 levels when human emissions were very small (1880). All variables shown are 5-year moving averages and SO4 is lagged by 1 year. CO2, CH4, and SO4 are measured in ppm, ppb and ppb, respectively. The near absence of an upward trend in GST from 1940 to 1975 happened at a time when human SO2 emissions rose 170% from 1940 to 1973 [23]. This large SO4 cooling effect offset the increased GHG warming effect, as shown in Figure 3. The analysis shown in Equation (5) excludes the years influenced by the substantial volcanic eruptions shown. It also excludes the 2 years before and 2-4 years after the years of volcanic eruptions that reached the stratosphere, since 5-year moving temperature averages are used. In particular, it excludes data from the years surrounding eruptions labeled in Figure 3, plus smaller but substantial eruptions in 1886, 1901-02, 1913, 1932-33, 1957, 1979-80, 1991 and 2011. This leaves 70 observations in all.
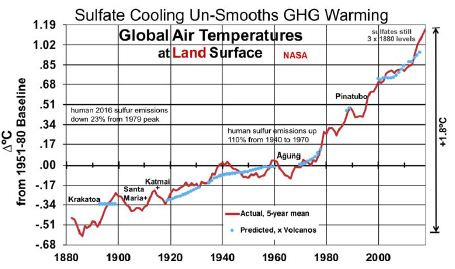
fig 3

Figure 3: Land Surface Temperatures, Influenced by Sulfate Cooling.

Equation (5)’s predicted GLSTs are shown in blue, next to actual GLSTs in red.

(5) ∆°C = -20.48 (±1.57) + 09 (±0.65) ln(CO2) + 1.25 (±0.33) ln(CH4) – 0.00393 (±0.00091) SO4

R2 is 0.9835 and adjusted R2 0.9828. The F-statistic is 1,312, highly significant. T-ratios for CO2, CH4, and SO4 respectively are 7.10, 7.68, and -8.68. This indicates that CO2, CH4, and SO4 are all important determinants of GLSTs. The coefficient for SO4 indicates that reducing SO4 by 1 ppb will increase GLST by 0.00393°C. Deleting the remaining human 95 ppb of SO4 added since 1880, as coal for power is phased out, would raise GLST by 0.37°C.

Snow

Some 99% of Earth’s snow cover, outside of Greenland and Antarctica, is in the northern hemisphere (NH). This study estimates the current albedo effect of snow cover in three steps: area, albedo effect to date, and future rate of snow shrinkage with rising temperatures. NH snow cover averages some 25 million km2 annually [25,26]. 82% of month-km2 coverage is during November through April. 25 million km2 is 2.5 times the 10 million km2 mean annual NH sea ice cover [27]. Estimated NH snow cover declined about 9%, about 2.2 million km2, from 1967 to 2018 [26]. Chen et al. [28] estimated that NH snow cover decreased by 890,000 km2 per decade for May to August over 1982 to 2013, but increased by 650,000 km2 per decade for November to February. Annual mean snow cover fell 9% over this period, as snow cover began earlier but also ended earlier: 1.91 days per decade [28]. These changes resulted in weakened snow radiative forcing of 0.12 (±0.003) W m-2 [28]. Chen estimated the NH snow timing feedback as 0.21 (±0.005) W m-2 K-1 in melting season, from 1982 to 2013 [28].

Future Snow Shrinkage

However, as GST warms further, annual mean snow cover will decline substantially with GST 5°C warmer and almost vanish with 10°. This study considers analog cities for snow cover in warmer places and analyzes data for them. It follows with three latitude and precipitation adjustments. The effects of changes in the timing of when snow is on the ground (Chen) are much smaller than from how many days snow is on the ground (see analog cities analysis, below). So, Chen’s analysis is of modest use for longer time horizons.

NH snow-covered area is not as concentrated near the pole as sea ice. Thus, sun angle leads to a larger effect by snow on Earth’s reflectivity. The mean latitude of northern snow cover, weighted over the year, is about 57°N [29], while the corresponding mean latitude of NH sea ice is 77 to 78°N. The sine of the mean sun angle (33°) on snow, 0.5454, is 2.52 times that for NH sea ice (12.5° and 0.2164). The area coverage (2.5) times the sun angle effect (2.52) suggests a cooling effect of NH snow cover (outside Greenland) about 6.3 times that for NH sea ice. [At high sun angles, water under ice is darker (~95% absorbed or 5% reflected when the sun is overhead, 0°) than rock, grass, shrubs, and trees under snow. This suggests a greater albedo contrast for losing sea ice than for losing snow. However, at the low sun angles that characterize snow latitudes, water reflects more sunlight (40% at 77° and 20% at 57°), leaving much less albedo contrast – with white snow or ice – than rocks and vegetation. So, no darkness adjustment is modeled in this study]. Using Hudson’s 2011 estimate [30] for Arctic sea ice (see below) of 0.6 W m-2 in future radiative forcing, compared to 0.1 to date for the NH sea ice’s current cooling effect, indicates that the current cooling effect of northern snow cover is about 6.3 times 0.6 W m-2 = 3.8 W m-2. This is 31 times the effect of snow cover timing changes, from Chen’s analysis.

To model evolution of future snow cover as the NH warms, analog locations are used for changes in snow cover’s cooling effect as Earth’s surface warms. This cross-sectional approach uses longitudinal transects: days of snow cover at different latitudes along roughly the same longitude. For the NH, in general (especially as adjusted for altitude and distance from the ocean), temperatures increase as one proceeds southward, while annual days of snow cover decrease. Three transects in the northern US and southern Canada are especially useful, because the increases in annual precipitation with warmer January temperatures somewhat approximate the 7% more water vapor in the air per 1°C of warming (see “In the Air” section for water vapor). The transects shown in Table 2 are (1) Winnipeg, Fargo, Sioux Falls, Omaha, Kansas City; (2) Toronto, Buffalo, Pittsburgh, Charleston WV, Knoxville; and (3) Lansing, Detroit, Cincinnati, Nashville. Pooled data from these 3 transects, shown at the bottom of Table 2, indicate 61% as many days as now with snow cover ≥ 1 inch [31] with 3°C local warming, 42% with 5°C, and 24% with 7°C. However, these degrees of local warming correspond to less GST warming, since Earth’s land surface has warmed faster than the sea surface and observed warming is generally greater as one proceeds from the equator toward the poles; [1,2,32] the gradient is 1.5 times the global mean for 44-64°N and 2.0 times for 64-90°N [32]. These latitude adjustments for local to global warming pair 61% as many snow cover days with 2°C GLST warming, 42% with 3°C, and 24% with 4°C. This translates to approximately a 19% decrease in days of snow cover per 1°C warming.

Table 2: Snow Cover Days for Transects with ~7% More Precipitation per °C. Annual Mean # of Days with ≥ 1 inch of Snow on Ground.
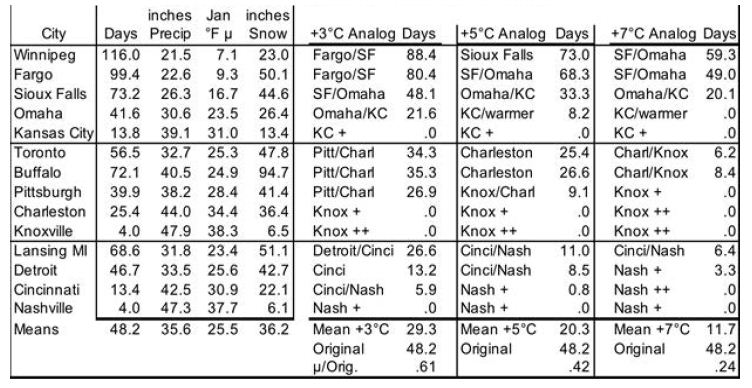
table 2

This study makes three adjustments to the 19%. First, the three transects feature precipitation increasing only 4.43% (1.58°C) per 1°C warming. This is 63% of the 7% increase in global precipitation per 1°C warming. So, warming may bring more snowfall than the analogs indicate directly. Therefore the 19% decrease in days of snow cover per 1°C warming of GLST is multiplied by 63%, for a preliminary 12% decrease in global snow cover for each 1°C GLST warming. Second, transects (4) Edmonton to Albuquerque and (5) Quebec to Wilmington NC, not shown, lack clear precipitation increases with warming. But they yield similar 62%, 42%, and 26% as many days of snow cover for 2, 3, and 4°C increases in GST. Since the global mean latitude of NH snow cover is about 57°, the southern Canada figure should be more globally representative than the 19% figure derived from the more southern US analysis. Use of Canadian cities only (Edmonton, Calgary, Winnipeg, Sault Ste. Marie, Toronto, and Quebec, with mean latitude 48.6°N) yields 73%, 58%, and 41% of current snow cover with roughly 2, 3, and 4°C warming. This translates to a 15% decrease in days of snow cover in southern Canada per 1°C warming of GLST. 63% of this, for the precipitation adjustment, yields 9.5% fewer days of snow cover per 1°C warming of GLST. Third, the southern Canada (48.6°N) figure of 9.5% warrants a further adjustment to represent an average Canadian and snow latitude (57°N). Multiplying by sin(48.6°)/sin(57°) yields 8.5%. The story is likely similar in Siberia, Russia, north China, and Scandinavia. So, final modeled snow cover decreases by 8.5% (not 19, 12 or 9.5%) of current amounts for each 1°C rise in GLST. In this way, modeled snow cover vanishes completely at 11.8°C warmer than 1880, similar to the Paleocene-Eocene Thermal Maximum (PETM) GSTs 55 Mya [3].

Ice

Six ice albedo changes are calculated separately: for NH and Antarctic (SH) sea ice, and for land ice in the GIS, WAIS, EAIS, and elsewhere (e.g., Himalayas). Ice loss in the latter four leads to SLR. This study considers each in turn.

Sea Ice

Arctic sea ice area has shown a shrinking trend since satellite coverage began in 1979. Annual minimum ice area fell 53% over the most recent 37 years [33]. However, annual minimum ice volume shrank faster, as the ice also thinned. Estimated annual minimum ice volume fell 73% over the same 37 years, including 51% in the most recent 10 years [34]. Trends in Arctic sea ice volume [34] are shown in Figure 4, with their corresponding R2, for four months. One set of trend lines (small dots) is based on data since 1980, while a second, steeper set (large dots) uses data since 2000. (Only four months are shown, since July ice volume is like November’s and June ice volume is like January’s). The graph suggests sea ice will vanish from the Arctic from June through December by 2050. Moreover, NH sea ice may vanish totally by 2085 in April, the minimum ice volume month. That is, current volume trends yield an ice-free Arctic Ocean about 2085.
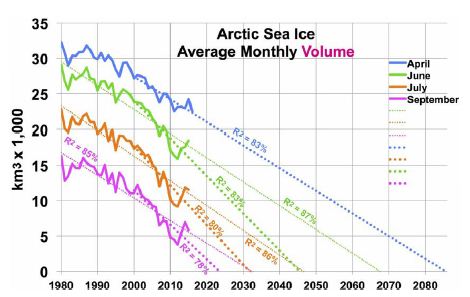
fig 4

Figure 4: Arctic Sea Ice Volume by Month and Year, Past and Future.

Hudson estimated that loss of Arctic sea ice would increase radiative forcing in the Arctic by an amount equivalent to 0.7 W m-2, spread over the entire planet, of which 0.1 W m-2 had already occurred [30]. That leaves 0.6 W m-2 of radiative forcing still to come, as of 2011. This translates to 0.31°C warming yet to come (as of 2011) from NH sea ice loss. Trends in Antarctic sea ice are unclear. After three record high winter sea ice years in 2013-15, record low Antarctic sea ice was recorded in 2017-19 and 2020 is below average [27]. If GSTs rise enough, eventually Antarctic land ice and sea ice areas should shrink. Roughly 2/3 of Antarctic sea ice is associated with West Antarctica [35]. Therefore, 2/3 of modeled SH sea ice loss corresponds to WAIS ice volume loss and 1/3 to EAIS. However, to estimate sea ice area, change in estimated ice volume is raised to the 1.5 power (using the ratio of 3 dimensions of volume to 2 of area). This recognizes that sea ice area will diminish more quickly than the adjacent land ice volume of the far thicker WAIS (including the Antarctic Peninsula) and the EAIS.

Land Ice

Paleoclimate studies have estimated that global sea levels were 20 to 35 meters higher than today from 4.0 to 4.2 Mya [13,14]. This indicates that a large fraction of Earth’s polar ice had vanished then. Earth’s GST then was estimated to be 3.3 to 5.0°C above the 1951-80 mean, for CO2 levels of 357-405 ppm. Another study estimated that global sea levels were 25-40 meters higher than today’s from 14.1 to 14.5 Mya [11]. This suggests 5 meters more of SLR from vanished polar ice. The deep ocean then was estimated to be 5.6±1.0°C warmer than in 1951-80, in response to still higher CO2 levels of 430-465 ppm CO2 [11,12]. Analysis of sediment cores by Cook [20] shows that East Antarctic ice retreated hundreds of kilometers inland in that time period. Together, these data indicate large polar ice volume losses and SLR in response to temperatures expected before 2400. This tells us about total amounts, but not about rates of ice loss.

This study estimates the albedo effect of Antarctic ice loss as follows. The area covered by Antarctic land ice is 1.4 times the annual mean area covered by NH sea ice: 1.15 for the EAIS and 0.25 for the WAIS. The mean latitudes are not very different. Thus, the effect of total Antarctic land ice area loss on Earth’s albedo should be about 1.4 times that 0.7 Wm-2 calculated by Hudson for NH sea ice, or about 1.0 Wm-2. The model partitions this into 0.82 Wm-2 for the EAIS and 0.18 Wm-2 for the WAIS. Modeled ice mass loss proceeds more quickly (in % and GT) for the WAIS than for the EAIS. Shepherd et al. [36] calculated that Antarctica’s net ice volume loss rate almost doubled, from the period centered on 1996 to that on 2007. That came from the WAIS, with a compound ice mass loss of 12% per year from 1996 to 2007, as ice volume was estimated to grow slightly in the EAIS [36,37] over this period. From 1997 to 2012, Antarctic land ice loss tripled [36]. Since then, Antarctic land ice loss has continued to increase by a compound rate of 12% per year [37]. This study models Antarctic land ice losses over time using S-curves. The curve for the WAIS starts rising at 12% per year, consistent with the rate observed over the past 15 years, starting from 0.4 mm per year in 2010, and peaks in the 2100s. Except in CDR scenarios, remaining WAIS ice is negligible by 2400. Modeled EAIS ice loss increases from a base of 0.002 mm per year in 2010. It is under 0.1% in all scenarios until after 2100, peaks from 2145 to 2365 depending on scenario, and remains under 10% by 2400 in the three slowest-warming scenarios.

The GIS area is 17.4% of the annual average NH sea ice coverage [27,38], but Greenland experiences (on average) a higher sun angle than the Arctic Ocean. This suggests that total GIS ice loss could have an albedo effect of 0.174 * cos (72°)/cos (77.5°) = 0.248 times that of total NH sea ice loss. This is the initial albedo ratio in the model. The modeled GIS ice mass loss rate decreases from 12% per year too, based on Shepherd’s GIS findings for 1996 to 2017 [37]. Robinson’s [39] analysis indicated that the GIS cannot be sustained at temperatures warmer than 1.6°C above baseline. That threshold has already been exceeded locally for Greenland. So it is reasonable to expect near total ice loss in the GIS if temperatures stay high enough for long enough. Modeled GIS ice loss peaks in the 2100s. It exceeds 80% by 2400 in scenarios lacking CDR and is near total by then if fossil fuel use continues past 2050.

The albedo effects of land ice loss, as for Antarctic sea ice, are modeled as proportional to the 1.5 power of ice loss volume. This assumes that the relative area suffering ice loss will be more around the thin edges than where the ice is thickest, far from the edges. That is, modeled ice-coved area declines faster than ice volume for the GIS, WAIS, and EAIS. Ice loss from other glaciers, chiefly in Arctic islands, Canada, Alaska, Russia, and the Himalayas, is also modeled by S-curves. Modeled “other glaciers” ice volume loss in the 6 scenarios ranges from almost half to almost total, depending on the scenario. Corresponding SLR rise by 2400 ranges from 12 to 25 cm, 89% or more of it by 2100.

In the Air: Clouds and Water Vapor

As calculated by Equation (5), using 70 years without significant volcanic eruptions, GLST will rise about 0.37°C as human sulfur emissions are phased out. Clouds cover roughly half of Earth’s surface and reflect about 20% [40] of incoming solar radiation (341 W m–2 mean for Earth’s surface). This yields mean reflection of about 68 W m–2, or 20 times the combined warming effect of GHGs [41]. Thus, small changes in cloud cover can have large effects. Detecting cloud cover trends is difficult, so the error bar around estimates for forcing from cloud cover changes is large: 0.6±0.8 Wm–2K–1 [42]. This includes zero as a possibility. Nevertheless, the estimated cloud feedback is “likely positive”. Zelinka [42] estimates the total cloud effect at 0.46 (±0.26) W m–2K –1. This comprises 0.33 for less cloud cover area, 0.20 from more high-altitude ones and fewer low-altitude ones, -0.09 for increased opacity (thicker or darker clouds with warming), and 0.02 for other factors. His overall cloud feedback estimate is used for modeling the 6 scenarios shown in the Results section. This cloud effect applies both to albedo changes from less ice and snow and to relative changes in GHG (CO2) concentrations. It is already implicit in estimates for SO4 effects. 1°C warmer air contains 7% more water vapor, on average [43]. That increases radiative forcing by 1.5 W m–2 [43]. This feedback is 89% as much as from CO2 emitted from 1750 to 2011 [41]. Water vapor acts as a warming multiplier, whether from human GHG emissions, natural emissions, or albedo changes. The model treats water vapor and cloud feedbacks as multipliers. This is also done in Table 3 below.

Table 3: Observed GST Warming from Albedo Changes, 1975-2016.

table 3

Albedo Feedback Warming, 1975-2016, Informs Climate Sensitivities

Amplifying feedbacks, from albedo changes and natural carbon emissions, are more prominent in future warming than direct GHG effects. Albedo feedbacks to date, summarized in Table 3, produced an estimated 39% of GST warming from 1975 to 2016. This came chiefly from SO4 reductions, plus some from snow cover changes and Arctic sea ice loss, with their multipliers from added water vapor and cloud cover changes. On the top line of Table 3 below, the SO4 decrease, from 177.3 ppb in 1975 to 130.1 in 2016, is multiplied by 0.00393°C/ppb SO4 from Equation (5). On the second line, in the second column, Arctic sea ice loss is from Hudson [30], updated from 0.10 to 0.11 W m–2 to cover NH sea ice loss from 2010 to 2016. The snow cover timing change effect of 0.12 W m–2 over 1982-2013 is from Chen [28]. But the snow cover data is adjusted to 1975-2016, for another 0.08 W m-2 in snow timing forcing, using Chen’s formula for W m-2 per °C warming [28] and extra 0.36°C warming over 1975-82 plus 2013-16. The amount of the land ice area loss effect is based on SLR to date from the GIS, WAIS, and non-polar glaciers. It corresponds to about 10,000 km2, less than 0.1% of the land ice area.

For the third column of Table 3, cloud feedback is taken from Zelinka [42] as 0.46 W m–2K–1. Water-vapor feedback is taken from Wadhams [43], as 1.5 W m–2K–1. The combined cloud and water-vapor feedback of 1.96 W m–2K–1 modeled here amounts to 68.8% of the 2.85 total forcing from GHGs as of 2011 [41]. Multiplying column 2 by 68.8% yields the numbers in column 3. Conversion to ∆°C in column 4 divides the 0.774°C warming from 1880 to 2011 [2] by the total forcing of 2.85 W m-2 from 1880 to 2011 [41]. This yields a conversion factor of 0.2716°C W-1m2, applied to the sum of columns 2 and 3, to calculate column 4. Error bars are shown in column 5. In summary, estimated GST warming over 1975-2016 from albedo changes, both direct (from sulfate, ice, and snow changes) and indirect (from cloud and water-vapor changes due to direct ones), totals 0.330°C. Total GST warming then was 0.839°C [2]. (This is more than the 0.774°C (2) warming from 1880 to 2011, because the increase from 2011 to 2016 was greater than the increase from 1880 to 1975.) So, the ∆GST estimated for albedo changes over 1975-2016, direct and indirect, comes to 0.330/0.839 = 39.3% of the observed warming.

1975-2016 Warming Not from Albedo Effects

The remaining 0.509°C warming over 1975-2016 corresponds to an atmospheric CO2 increase from 331 to 404 ppm [44], or 22%. This 0.509°C warming is attributed in the model to CO2, consistent with Equations (3) and (1), using the simplification that the sum total effect of other GHGs changes as the same rate as for CO2. It includes feedbacks from H2O vapor and cloud cover changes, estimated, per above, as 0.686/(1+1.686) of 0.509°C, which is 0.207°C or 24.7% of the total 0.839°C warming over 1975-2016. This leaves 0.302°C warming for the estimated direct effect of CO2 and other factors, including other GHGs and factors not modeled, such as black carbon and vegetation changes, over this period.

Partitioning Climate Sensitivity

With the 22% increase in CO2 over 1975-2016, we can estimate the change due to a doubling of CO2 by noting that 1.22 [= 404/331] raised to the power 3.5 yields 2.0. This suggests that a doubling of CO2 levels – apart from surface albedo changes and their feedbacks – leads to about 3.5 times 0.509°C = 1.78°C of warming due to CO2 (and other GHGs and other factors, with their H2O and cloud feedbacks), starting from a range of 331-404 ppm CO2. In the model, for projected temperature changes for a particular year, 0.509°C is multiplied by the natural logarithm of (the CO2 concentration/331 ppm in 1975) and divided by the natural logarithm of (404 ppm/331 ppm), that is divided by 0.1993. This yields estimated warming due to CO2 (plus, implicitly, other non-H2O GHGs) in any particular year, again apart from surface albedo changes and their feedbacks, including the factors noted that are not modelled in this study.

Using Equation (3), warming associated with doubled CO2 over the past 14.5 million years is 11.807 x ln(2.00), or 8.184°C per CO2 doubling. The difference between 8.18°C and 1.78°C, from CO2 and non-H2O GHGs, is 6.40°C. This 6.40°C climate sensitivity includes the effect of albedo changes and the consequent H2O vapor concentration. Loss of tropospheric SO4 and Arctic sea ice are the first of these to occur, with immediate water vapor and cloud feedbacks. Loss of snow and Antarctic sea ice follow over centuries to decades. Loss of much land ice, especially where grounded above sea level, happens more slowly.

Stated another way, there are two climate sensitivities: one for the direct effect of GHGs and one for amplifying feedbacks, led by albedo changes. The first is estimated as 1.8°C. The second is estimated as 6.4°C in epochs, like ours, when snow and ice are abundant. In periods with little or no ice and snow, this latter sensitivity shrinks to near zero, except for clouds. As a result, climate is much more stable to perturbations (notably cyclic changes in Earth’s tilt and orbit) when there is little snow or ice. However, climate is subject to wide temperature swings when there is lots of snow and ice (notably the past 2 million years, as seen in Figure 1).

In the Oceans

Ocean Heat Gain: In 2011, Hansen [7] estimated that Earth is absorbing 0.65 Wm-2 more than it emits. As noted above, ocean heat gain averaged 4 ZJ per year over 1967 to 1990, 7 over 1991-2005, and 10 over 2006-16. Ocean heat gain accelerated while GSTs increased. Therefore, ocean heat gain and Earth’s energy imbalance seem likely to continue rising as GSTs increase. This study models the situation that way. Oceans would need to warm up enough to regain thermal equilibrium with the air above. While oceans are gaining heat (now ~ 2 times cumulative human energy use every 3 years), they are out of equilibrium. The ocean thermohaline circuit takes about 1,000 years. So, if human GHG emissions ended today, this study assumes that it could take Earth’s oceans 1,000 years to thermally re-equilibrate heat with the atmosphere. The model spreads the bulk of that over 400 years, in an exponential decay shape. The rate peaks during 2130 to 2170, depending on the scenario. The modeled effect is about 5% of total GST warming. Ocean thermal expansion (OTE), currently about 0.8 mm/year [5], is another factor in SLR. Changes to its future values are modeled as proportional to future temperature change.

Land Ice Mass Loss, Its Albedo Effect, and Sea Level Rise: Modeled SLR derives mostly from modeled ice sheet losses. Their S-curves were introduced above. The amount and rate parameters are informed by past SLR. Sea levels have varied by almost 200 meters over the past 65 My. They were almost 125 meters lower than now during recent Ice Ages [3]. SLR reached some 70 meters higher in ice-free warm periods more than 10 Mya, especially more than 35 Mya [3]. From Figure 1, Earth was largely ice-free when deep ocean temperature (DOT) was 7°C or more, for SLR of about 73 meters from current levels, when DOT is < 2°C. This yields a SLR estimate of 15 meters/°C of DOT in warm eras. Over the most recent 110-120 ky, 110 meters of SLR is associated with 4 to 6°C GST warming (Figure 2), or 19-28 meters/°C GST in a cold era. The 15:28 warm/cold era ratio for SLR rate shows that the amount of remaining ice is a key SLR variable. However, this study projects only 1.5 to 4 meters rate of SLR by 2400 per °C of GST warming, but still rising. The WAIS and GIS together hold 10-12 meters of SLR [15,16]. So, 25-40 meter SLR during 14.1-14.5 Mya suggests that the EAIS lost about 1/3 to 1/2 of its current ice volume (20 to 30 meters of SLR, out of almost 60 today in the EAIS [45]) when CO2 levels were last at 430-465 ppm and DOTs were 5.6±1.0°C [11,12]. This is consistent with this study’s two scenarios with human CO2 emissions after 2050 and even 2100: 13 and 21 meters of SLR from the EAIS by 2400, with Δ GLSTs of 8.2 and 9.4°C. DeConto [19] suggested that sections of the EAIS grounded below sea level would lose all ice if we continue emissions at the current rate, for 13.6 or even 15 meters of SLR by 2500. This model’s two scenarios with intermediate GLST rise yield SLR closest to his projections. SLR is even higher in the two warmest scenarios. Modeled SLR rates are informed by the most recent 19,000 years of data ([46,47], chart by Robert A. Rohde). They include a SLR rate of 3 meters/century during Meltwater Pulse 1A for 8 centuries around 14 ky ago. They also include 1.5 meters/century over the 70 centuries from 15 kya to 8 kya. The DOT rose 3.3°C over 10,000 years, for an average rate of 0.033°C per century. However, the current SST warming rate is 2.0°C per century [1,2], about 60 times as great. Although only 33-40% as much ice (73 meters SLR/(73+125)) is left to melt, this suggests that rates of SLR will be substantially higher, at current rates of warming, than the 1.5 to 3 meters per century coming out of the most recent ice age. In four scenarios without CDR, mean rates of modeled SLR from 2100 to 2400 range from 4 to 11 meters per century.

Summary of Factors in Warming to 2400

Table 4 summarizes the expected future warming effects from feedbacks (to 2400), based on the analyses above.

Table 4: Projected GST Warming from Feedbacks, to 2400.
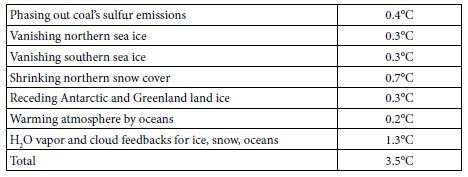
table 4

The 3.5°C warming indicated, added to 1.1°C warming since 1880, or 4.6°C, is 0.5°C less than the 5.1°C warming based on Equation (4) from the paleoclimate analysis. This gap suggests four overlapping possibilities. First, underestimations (perhaps sea ice and clouds) may exceed overestimations (perhaps snow) for the processes shown in Table 4. Underestimation of cloud feedbacks, and their consequent warming, is quite possible. Using Zelinka’s 0.46 Wm–2K–1 in this study, instead of the IPCC central estimate of 0.6, is one possibility. Moreover, recent research suggests that cloud feedbacks may be appreciably stronger than 0.6 Wm–2K–1 [48]. Second, change in the eight factors not modelled (black carbon, vegetation and land use, ocean and air circulation, Earth’s orbit and tilt, and solar output) may provide feedbacks that, on balance, are more warming than cooling. Third, temperatures used here for 4 and 14 Mya may be overestimated or should not be used unadjusted. Notably, the joining of North and South America about 3 Mya rearranged ocean circulation and may have resulted in cooling that led to ice periodically covering much of North America [49]. Globally, Figure 1 above suggests this cooling effect may be 1.0-1.6°C. In contrast, solar output increases as our sun ages, by 7% per billion years [50], so that solar forcing is now 1.4 W m–2 more than 14 Mya and 0.4 more than 4 Mya. A brighter sun now indicates that, for the same GHG levels and albedo levels, GST would be 0.7°C warmer than it would have been 14 Mya and 0.2°C warmer than 4 Mya. Fourth, nothing (net) may be amiss. Underestimated warming (perhaps permafrost, clouds, sea ice, black carbon) may balance overestimated warming (perhaps snow, land ice, vegetation). The gap would then be due to a lower albedo climate sensitivity than 6.4°C, as discussed above using data for 1975-2016, because all sea ice and much snow vanish by 2400.

Natural Carbon Emissions

Permafrost: One estimate of the amount of carbon stored in permafrost is 1,894 GT of carbon [51]. This is about 4 x carbon that humans have emitted by burning fossil fuels. It is also 2 x as much as in Earth’s atmosphere. More permafrost may lie under Antarctic ice and the GIS. DeConto [52] proposed that the PETM’s large carbon and temperature (5-6°C) excursions 55 Mya are explained by “orbitally triggered decomposition of soil organic carbon in circum-Arctic and Antarctic terrestrial permafrost. This massive carbon reservoir had the potential to repeatedly release thousands of [GT] of carbon to the atmosphere-ocean system”. Permafrost area in the Northern Hemisphere shrank 7% from 1900 to 2000 [53]. It may shrink 75-88% more by 2100 [54]. Carbon emissions from permafrost are expected to accelerate, as the ground in which they are embedded warms up. In general, near-surface air temperatures have been warming twice as fast in the Arctic as across the globe as a whole [32]. More research is needed to estimate rates of permafrost warming at depth and consequent carbon emissions. Already in 2010, Arctic permafrost emitted about as carbon as all US vehicles [55]. Part of the carbon emerges as CH4, where surface water prevents carbon under it being oxidized. That CH4 changes to CO2 in the air over several years. This study accounts for the effects of CO2 derived from permafrost. MacDougall et al. estimated that thawing permafrost can add up to ~100 ppm of CO2 to the air by 2100 and up to 300 more by 2300, depending on the four RCP emissions scenarios [56]. This is 200 GT of carbon by 2100 plus 600 GT more by 2300. The direct driver of such emissions is local temperatures near the air-soil interface, not human carbon emissions. Since warming is driven not just by emissions, but also by albedo changes and their multipliers, permafrost carbon losses from thawing may proceed faster than MacDougall estimated. Moreover, MacDougall estimated only 1,000 GT of carbon in permafrost [56], less than more recent estimates. On the other hand, a larger fraction of carbon may stay in permafrost soil in than MacDougall assumed, leaving deep soil rich in carbon, similar to that left by “recent” glaciers in Iowa.

Other Natural Carbon Emissions

Seabed CH4 hydrates may hold a similar amount of carbon to permafrost or somewhat less, but the total amount is very difficult to measure. By 2011, subsea CH4 hydrates were releasing 20-30% as much carbon as permafrost was [57]. This all suggests that eventual carbon emissions from permafrost and CH4 hydrates may be half to four times what MacDougall estimated. Also, the earlier portion of those emissions may happen faster than MacDougall estimated. In all, this study’s modeled permafrost carbon emissions range from 35 to 70 ppm CO2 by 2100 and from 54 to 441 ppm CO2 by 2400, depending on the scenario. As stated earlier, this model simply assumes that other natural carbon reservoirs will add half as much carbon to the air as permafrost does, on the same time path. These sources include outgassing from soils now unfrozen year-round, the warming upper ocean, seabed CH4 hydrates, and any net decrease in worldwide biomass.

Results

The Six Scenarios

  1. “2035 Peak”. Fossil-fuel emissions are reduced 94% by 2100, from a peak about 2035, and phased out entirely by 2160. Phase-out accelerates to 2070, when CO2 emissions are 25% of 2017 levels, then decelerates. Permafrost carbon emissions overtake human ones about 2080. Natural CO2 removal (CDR) mostly further acidifies the oceans. But it includes 1 GT per year of CO2 by rock weathering.
  2. “2015 Peak”. Fossil-fuel emissions are reduced 95% by 2100, from a peak about 2015, and phased out entirely by 2140. Phase-out accelerates to 2060, when CO2 emissions are 40% of 2017 levels, then decelerates. Compared to a 2035 peak, natural carbon emissions are 25% lower and natural CDR is similar.
  3. “x Fossil Fuels by 2050”, or “x FF 2050”. Peak is about 2015, but emissions are cut in half by 2040 and end by 2050. Natural CDR is the same as for the 2015 Peak, but is lower to 2050, since human CO2 emissions are less. This path has a higher GST from 2025 to 2084, while warming sooner from less SO4 outweighs less warming from GHGs.
  4. “Cold Turkey”. Emissions end at once after 2015. Natural CDR is only by rock weathering, since no new human CO2 emissions push carbon into the ocean. After 2060, cooling from ending CO2 emissions earlier outweighs warming from ending SO2
  5. “x FF 2050, CDR”. Emissions are the same as for “x FF 2050”, as is natural CDR. But human CDR ramps up in an S-curve, from less than 1% of emissions in 2015 to 25% of 2015 emissions over the 2055 to 2085 period. Then they ramp down in a reverse S-curve, to current levels in 2155 and 0 by 2200.
  6. “x FF 2050, 2xCDR” is like “x FF 2050, CDR”, but CDR ramps up to 52% of 2015 emissions over 2070 to 2100. From 2090, it ramps down to current levels in 2155 and 0 by 2190. CDR = 71% of CO2 emissions to 2017 or 229% of soil carbon lost since farming began [58], almost enough to cut CO2 in the air to 313 ppm, for 2°C warming.

Projections to 2400

The results for the six scenarios shown in Figure 5 spread ocean warming over 1,000 years, more than half of it by 2400. They use the factors discussed above for sea level, water vapor, and albedo effects of reduced SO4, snow, ice, and clouds. Permafrost emissions are based on MacDougall’s work, adjusted upward for a larger amount of permafrost, but also downward and to a greater degree, assuming much of the permafrost carbon stays as carbon-rich soil as in Iowa. As first stated in the introduction to Feedback Pathways, the model sets other natural carbon emissions to half of permafrost emissions. At 2100, net human CO2 emissions range from -15 GT/year to +2 GT/year, depending on the scenario. By 2100, CO2 concentrations range from 350 to 570 ppm, GLST warming from 2.9 to 4.5°C, and SLR from 1.6 to 2.5 meters. CO2 levels after 2100 are determined mostly by natural carbon emissions, driven ultimately by GST changes, shown in the lower left panel of Figure 5. They come from permafrost, CH4 hydrates, unfrozen soils, warming upper ocean, and biomass loss.
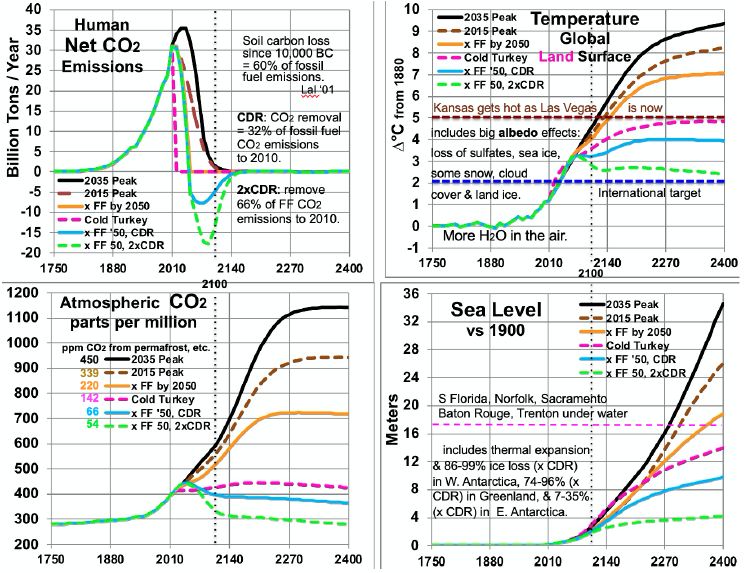
fig 5

Figure 5: Scenarios for CO2 Emissions and Levels, Temperatures and Sea Level.

Comparing temperatures to CO2 levels allows estimates of long-run climate sensitivity to doubled CO2. Sensitivity is estimated as ln(2)/ln(ppm/280) * ∆T. By scenario, this yields > 4.61° (probably ~5.13° many decades after 2400) for 2035 Peak, > 4.68° (probably ~5.15°) for 2015 Peak, > 5.22° (probably 5.26°) for “x FF by 2050”, and 8.07° for Cold Turkey. Sensitivities of 5.13, 5.15 and 5.26° are much less than the 8.18° derived from the Vostok ice core. This embodies the statement above, in the Partitioning Climate Sensitivity section, that in periods with little or no ice and snow [here, ∆T of 7°C or more – the 2035 and 2015 Peaks and x FF by 2050 scenarios], this albedo-related sensitivity shrinks to 3.3-3.4°. Meanwhile, the Cold Turkey scenario (with a good bit more snow and a little more ice) matches well the relationship from the ice core (and validated to 465 ppm CO2, in the range for Cold Turkey: 4 and 14 Mya). Another perspective is the climate sensitivity starting from a base not of 280 ppm CO2, but from a higher level: 415 ppm, the current level and the 2400 level in the Cold Turkey case. Doubling CO2 from 415 to 830 ppm, according to the calculations underlying Figure 5, yields a temperature in 2400 between the x FF by 2050 and the 2015 Peak cases, about 7.6°C and rising, to perhaps 8.0°C after 1-2 centuries. This yields a climate sensitivity of 8.0 – 4.9 = 3.1°C in the 415-830 ppm range. The GHG portion of that remains near 1.8° (see Partitioning Climate Sensitivity above). But the albedo feedbacks portion shrinks further, from 6.4°, past 3.3° to 1.3°, as thin ice and most snow are gone, as noted above, plus all SO4 from fossil fuels, leaving mostly thick ice and feedbacks from clouds and water vapor.

Table 5 summarizes estimated temperatures effects of 16 factors in the 6 scenarios to 2400. Peaking emissions now instead of in 2035 can keep eventual warming 1.1°C lower. Phasing out fossil fuels by 2050 gains another 1.2°C relatively cooler. Ending fossil fuel use immediately gains another 2.2°C. Also removing 2/3 of CO2 emissions to date gains another 2.4°C relatively cooler. Eventual warming in the higher emissions scenarios is a good bit lower than what would be inferred by using the 8.2°C climate sensitivity based on an epoch rich in ice and snow. This is because the albedo portion of that climate sensitivity (currently 6.4°) is greatly reduced as ice and snow disappear. More human carbon emissions (the first three scenarios especially) warm GSTs further, especially from less snow and cloud cover, more water vapor, and more natural carbon emissions. These in turn accelerate ice loss. All further amplify warming.

Table 5: Factors in Projected Global Surface Warming, 2010-2400 (°C).
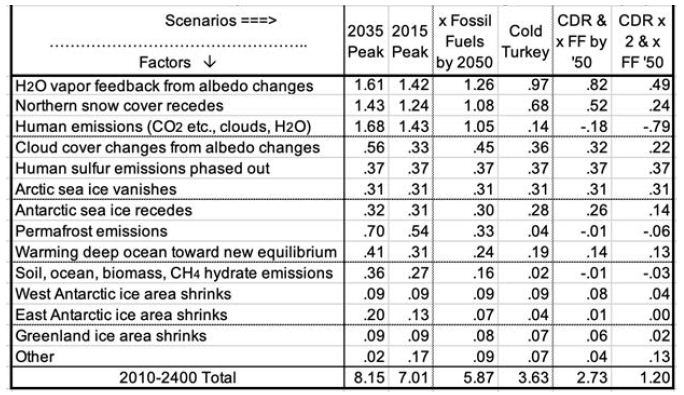
table 5

Carbon release from permafrost and other reservoirs is lower in scenarios where GSTs do not rise as much. GSTs grow to the end of the study period, 2400, except for the CDR cases. Over 99% of warming after 2100 is due to amplifying feedbacks from human emissions during 1750-2100. These feedbacks amount to 1.5 to 5°C after 2100, in the scenarios without CDR. Projected mean warming rates with continued human emissions are similar to current rates of 2.5°C per century over 2000-2020 [2]. Over the 21st century, they range from 62 to 127% of the rate over the most recent 20 years. The mean across the 6 scenarios is 100%, higher in the 3 warmest scenarios. Warming slows in later centuries. The key to peak warming rates is disappearing northern sea ice and human SO4, mostly by 2050. Peak warming rates per decade in all 6 scenarios occur this century. They are fastest not for the 2035 Peak scenario (0.38°C), but for Cold Turkey (.80°C when our SO2 emissions stop suddenly) and xFF2050 (0.48°C, as SO2 emissions phase out by 2050). Due to SO4 changes, peak warming in the x FF 2050 scenario, from 2030 to 2060, is 80% faster than over the past 20 years, while for the 2035 Peak, it is only 40% faster. Projected SLR from ocean thermal expansion (OTE) by 2400 ranges from 3.9 meters in the 2035 Peak scenario to 1.5 meters in the xFF’50 2xCDR case. The maximum rate of projected SLR by 2400 is 15 meters from 2300 to 2400, in the 2035 Peak scenario. That is 5 times the peak 8-century rate 14 kya. However, the mean SLR rate over 2010-2400 is less than the historical 3 meters per century (from 14 kya) in the CDR scenarios and barely faster for Cold Turkey. The rate of SLR peaks from 2130 to 2360 for the 4 scenarios without CDR. In the two CDR scenarios, projected SLR comes mostly from the GIS, OTE, and the WAIS. But the EAIS is the biggest contributor in the three fastest warming scenarios.

Perspectives

The results show that the GST is far from equilibrium; barely more than 20% of 5.12°C warming to equilibrium. However, the feedback processes that warm Earth’s climate to equilibrium will be mostly complete by 2400. Some snow melting will continue. So will melting more East Antarctic and (in some scenarios) Greenland ice, natural carbon emissions, cloud cover and water vapor feedbacks, plus warming the deep ocean. But all of these are tapering off by 2400 in all scenarios. Two benchmarks are useful to consider: 2°C and 5°C above 1880 levels. The 2015 Paris climate pact’s target is for GST warming not to exceed 2°C. However, projected GST warming exceeds 2°C by 2047 in all six scenarios. Focus on GLSTs recognizes that people live on land. Projected GLST warming exceeds 2°C by 2033 in all six scenarios. 5° is the greatest warming specifically considered in Britain’s Stern Review in 2006 [59]. For just 4°, Stern suggested a 15-35% drop in crop yields in Africa, while parts of Australia cease agriculture altogether [59]. Rind et al. projected that the major U.S. crop yields would fall 30% with 4.2°C warming and 50% with 4.5°C warming [60]. According to Stern, 5° warming would disrupt marine ecosystems, while more than 5° would lead to major disruption and large-scale population movements that could be catastrophic [59]. Projected GLST warming passes 5°C in 2117, 2131, and 2153 for the three warmest scenarios. But it never does in the other three. With 5° GLST warming, Kansas, until recently the “breadbasket of the world”, would become as hot in summer as Las Vegas is now. Most of the U.S. warms faster than Earth’s land surface in general [32]. Parts of the U.S. Southeast, including most of Georgia, become that hot, but much more humid. Effects would be similar elsewhere.

Discussion

Climate models need to account for all these factors and their interactions. They should also reproduce conditions for previous eras when Earth had this much CO2 in the air, using current levels of CO2 and other GHGs. This study may underestimate warming due to permafrost and other natural emissions. It may also overestimate how fast seas will rise in a much warmer world. Ice grounded below sea level (by area, ~2/3 of the WAIS, 2/5 of the EAIS, and 1/6 of the GIS) can melt quickly (decades to centuries). But other ice can take many centuries or millennia to melt. Continued research is needed, including separate treatment of ice grounded below sea level or not. This study’s simplifying assumptions, that lump other GHGs with CO2 and other natural carbon emissions proportionately with permafrost, could be improved with modeling for the individual factors lumped here. More research is needed to better quantify the 12 factors modeled (Table 5) and the four modeled only as a multiplier (line 10 in Table 5). For example, producing a better estimate for snow cover, similar to Hudson’s for Arctic sea ice, would be useful. So would other projections, besides MacDougall’s, of permafrost emissions to 2400. More work on other natural emissions and the albedo effects of clouds with warming would be useful.

This analysis demonstrates that reducing CO2 emissions rapidly to zero will be woefully insufficient to keep GST less than 2°C above 1750 or 1880 levels. Policies and decisions which assume that merely ending emissions will be enough will be too little, too late: catastrophic. Lag effects, mostly from albedo changes, will dominate future warming for centuries. Absent CDR, civilization degrades, as food supplies fall steeply and human population shrinks dramatically. More emissions, absent CDR, will lead to the collapse of civilization and shrink population still more, even to a small remnant.

Earth’s remaining carbon budget to hold warming to 2°C requires removing more than 70% of our CO2 emissions to date, any future emissions, and all our CH4 emissions. Removing tens of GT of CO2 per year will be required to return GST warming to 2°C or less. CDR must be scaled up rapidly, while CO2 emissions are rapidly reduced to almost zero, to achieve negative net emissions before 2050. CDR should continue strong thereafter.

The leading economists in the USA and the world say that the most efficient policy to cut CO2 emissions is to enact a worldwide price on them [61]. It should start at a modest fraction of damages, but rise briskly for years thereafter, to the rising marginal damage rate. Carbon fee and dividend would gain political support and protect low-income people. Restoring GST to 0° to 0.5°C above 1880 levels calls for creativity and dedication to CDR. Restoring the healthy climate on which civilization was built is a worthwhile goal. We, our parents and our grandparents enjoyed it. A CO2 removal price should be enacted, equal to the CO2 emission price. CDR might be paid for at first by a carbon tax, then later by a climate defense budget, as CO2 emissions wind down.

Over 1-4 decades of research and scaling up, CDR technology prices may drop far. Sale of products using waste CO2, such as concrete, may make the transition easier. CDR techniques are at various stages of development and prices. Climate Advisers provides one 2018 summary for eight CDR approaches, including for each: potential GT CO2 removed per year, mean US$/ton CO2, readiness, and co-benefits [62]. The commonest biological CDR method now is organic farming, in particular no-till and cover cropping. Others include several methods of fertilizing or farming the ocean; planting trees; biochar; fast-rotation grazing; and bioenergy with CO2 capture. Non-biological ones include direct air capture with CO2 storage underground in carbonate-poor rocks such as basalts. Another increases surface area of such rocks, by grinding them to gravel, or dust to spread from airplanes. They react with weak carbonic acid in rain. Another adds small carbonate-poor gravel to agricultural soil.

CH4 removal should be a priority, to quickly drive CH4 levels down to 1880 levels. With a half-life of roughly 7 years in Earth’s atmosphere, CH4 levels might be cut back that much in 30 years. It could happen by ending leaks from fossil fuel extraction and distribution, untapped landfills, cattle not fed Asparagopsis taxiformis, and flooding rice paddies. Solar radiation management (SRM) might play an important supporting role. Due to loss of Arctic sea ice and human SO4, even removing all human GHGs (scenario not shown) will likely not bring GLST back below 2°C by 2400. SRM could offset these two soonest major albedo changes in coming decades. The best known SRM techniques are (1) putting SO4 or calcites in the stratosphere and (2) refreezing the Arctic Ocean. Marine cloud brightening could play a role. SRM cannot substitute for ending our CO2 emissions or for vast CDR, both of them soon. We may need all three approaches working together.

In summary, the paleoclimate record shows that today’s CO2 level entails GST roughly 5.1°C warmer than 1880. Most of the increase from today’s GST will be due to amplification by albedo changes and other factors. Warming gets much worse with continued emissions. Amplifying feedbacks will add more GHGs to the air, even if we end our GHG emissions now. Further GHGs will warm Earth’s surface, oceans and air even more, in some cases much more. The impacts will be many, from steeply reduced crop yields (and widespread crop failures) and many places too hot to survive sometimes, to widespread civil wars, billions of refugees, and many meters of SLR. Decarbonization of civilization by 2050 is required, but far from enough. Massive CO2 removal is required as soon as possible, perhaps supplemented by decades of SRM, all enabled by a rising price on CO2.

List of Acronyms
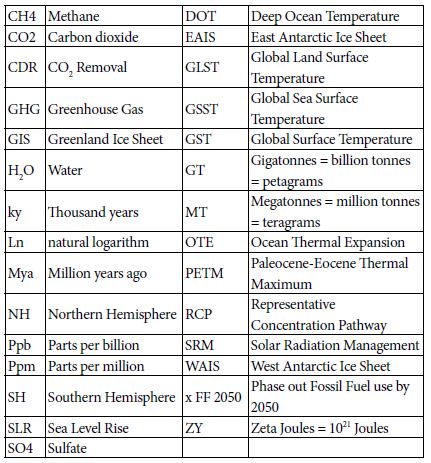
List of Acro

References

  1. https://data.giss.nasa.gov/gistemp/tabledata_v3/
  2. https://data.giss.nasa.gov/gistemp/tabledata_v3/GLB.Ts+dSST.txt
  3. Hansen J, Sato M (2011) Paleoclimate Implications for Human-Made Climate Change in Berger A, Mesinger F, Šijački D (eds.) Climate Change: Inferences from Paleoclimate and Regional Aspects. Springer, pp: 21-48.
  4. Levitus S, Antonov J, Boyer T (2005) Warming of the world ocean, 1955-2003. Geophysical Research Letters
  5. https://www.nodc.noaa.gov/OC5/3M_HEAT_CONTENT/
  6. https://www.eia.gov/totalenergy/data/monthly/pdf/sec1_3.pdf
  7. Hansen J, Sato M, Kharecha P, von Schuckmann K (2011) “Earth’s Energy imbalance and implications. Atmos Chem Phys 11: 13421-13449.
  8. https://www.eia.gov/energyexplained/index.php?page=environment_how_ghg_affect_climate
  9. Tripati AK, Roberts CD, Eagle RA (2009) Coupling of CO2 and ice sheet stability over major climate transitions of the last 20 million years. Science 326: 1394-1397. [crossref]
  10. Shevenell AE, Kennett JP, Lea DW (2008) Middle Miocene ice sheet dynamics, deep-sea temperatures, and carbon cycling: a Southern Ocean perspective. Geochemistry Geophysics Geosystems 9:2.
  11. Csank AZ, Tripati AK, Patterson WP, Robert AE, Natalia R, et .al. (2011) Estimates of Arctic land surface temperatures during the early Pliocene from two novel proxies. Earth and Planetary Science Letters 344: 291-299.
  12. Pagani M, Liu Z, LaRiviere J, Ravelo AC (2009) High Earth-system climate sensitivity determined from Pliocene carbon dioxide concentrations, Nature Geoscience 3: 27-30.
  13. Wikipedia – https://en.wikipedia.org/wiki/Greenland_ice_sheet
  14. Bamber JL, Riva REM, Vermeersen BLA, Le Brocq AM (2009) Reassessment of the potential sea-level rise from a collapse of the West Antarctic Ice Sheet. Science 324: 901-903.
  15. https://nsidc.org/cryosphere/glaciers/questions/located.html
  16. https://commons.wikimedia.org/wiki/File:AntarcticBedrock.jpg
  17. DeConto RM, Pollard D (2016) Contribution of Antarctica to past and future se-level rise. Nature 531: 591-597.
  18. Cook C, van de TF, Williams T, Sidney RH, Masao I, al. (2013) Dynamic behaviour of the East Antarctic ice sheet during Pliocene warmth, Nature Geoscience 6: 765-769.
  19. Vimeux F, Cuffey KM, Jouzel J (2002) New insights into Southern Hemisphere temperature changes from Vostok ice cores using deuterium excess correction. Earth and Planetary Science Letters 203: 829-843.
  20. Snyder WC (2016) Evolution of global temperature over the past two million years, Nature 538: 226-
  21. https://www.wri.org/blog/2013/11/carbon-dioxide-emissions-fossil-fuels-and-cement-reach-highest-point-human-history
  22. https://phys.org/news/2012-03-weathering-impacts-climate.html
  23. Smith SJ, Aardenne JV, Klimont Z, Andres RJ, Volke A, al. (2011). Anthropogenic Sulfur Dioxide Emissions: 1850-2005. Atmospheric Chemistry and Physics 11: 1101-1116.
  24. Figure SPM-2 in S Solomon, D Qin, M Manning, Z Chen, M. Marquis, et al. (eds.) IPCC, 2007: Summary for Policymakers. in Climate Change 2007: The Physical Science Basis. Contribution of Working Group I to the 4th Assessment Report of the Intergovernmental Panel on Climate Change. Cambridge University Press, Cambridge, UK and New York, USA.
  25. ncdc.noaa.gov/snow-and-ice/extent/snow-cover/nhland/0
  26. https://nsidc.org/cryosphere/sotc/snow_extent.html
  27. ftp://sidads.colorado.edu/DATASETS/NOAA/G02135/
  28. Chen X, Liang S, Cao Y (2016) Satellite observed changes in the Northern Hemisphere snow cover phenology and the associated radiative forcing and feedback between 1982 and 2013. Environmental Research Letters 11:8.
  29. https://earthobservatory.nasa.gov/global-maps/MOD10C1_M_SNOW
  30. Hudson SR (2011) Estimating the global radiative impact of the sea ice-albedo feedback in the Arctic. Journal of Geophysical Research: Atmospheres 116:D16102.
  31. https://www.currentresults.com/Weather/Canada/Manitoba/Places/winnipeg-snowfall-totals-snow-accumulation-averages.php
  32. https://data.giss.nasa.gov/gistemp/tabledata_v3/ZonAnn.Ts+dSST.txt
  33. https://neven1.typepad.com/blog/2011/09/historical-minimum-in-sea-ice-extent.html
  34. https://14adebb0-a-62cb3a1a-s-sites.googlegroups.com/site/arctischepinguin/home/piomas/grf/piomas-trnd2.png?attachauth=ANoY7coh-6T1tmNEErTEfdcJqgESrR5tmNE9sRxBhXGTZ1icpSlI0vmsV8M5o-4p4r3dJ95oJYNtCrFXVyKPZLGbt6q0T2G4hXF7gs0ddRH88Pk7ljME4083tA6MVjT0Dg9qwt9WG6lxEXv6T7YAh3WkWPYKHSgyDAF-vkeDLrhFdAdXNjcFBedh3Qt69dw5TnN9uIKGQtivcKshBaL6sLfFaSMpt-2b5x0m2wxvAtEvlP5ar6Vnhj3dhlQc65ABhLsozxSVMM12&attredirects=1
  35. https://www.earthobservatory.nasa.gov/features/SeaIce/page4.php
  36. Shepherd A, Ivins ER, Geruo A, Valentina RB, Mike JB, et al. (2012) A reconciled estimate of ice-sheet mass balance. Science 338: 1183-1189.
  37. Shepherd A, Ivins E, Rignot E, Ben Smith (2018) Mass balance of the Antarctic Ice Sheet from 1992 to 2017. Nature 558: 219-222.
  38. https://en.wikipedia.org/wiki/Greenland_ice_sheet
  39. Robinson A, Calov R, Ganopolski A (2012) Multistability and critical thresholds of the Greenland ice sheet. Nature Climate Change 2: 429-431.
  40. https://earthobservatory.nasa.gov/features/CloudsInBalance
  41. Figures TS-6 and TS-7 in TF Stocker, D Qin, GK Plattner, M Tignor, SK Allen, J Boschung, et al. (eds.). IPCC, 2013: Climate Change 2013: The Physical Science Basis. Contribution of Working Group I to the Fifth Assessment Report of the Intergovernmental Panel on Climate Change. Cambridge University Press, Cambridge, UK and New York, NY, USA.
  42. Zelinka MD, Zhou C, Klein SA (2016) Insights from a refined decomposition of cloud feedbacks. Geophysical Research Letters 43: 9259-9269.
  43. Wadhams P (2016) A Farewell to Ice, Penguin / Random House, UK.
  44. https://scripps.ucsd.edu/programs/keelingcurve/wp-content/plugins/sio-bluemoon/graphs/mlo_full_record.png
  45. Fretwell P, Pritchard HD, Vaughan DG, Bamber JL, Barrand NE et al. (2013) Bedmap2: improved ice bed, surface and thickness datasets for Antarctica .The Cryosphere 7: 375-393.
  46. Fairbanks RG (1989) A 17,000 year glacio-eustatic sea- level record: Influence of glacial melting rates on the Younger Dryas event and deep-ocean circulation. Nature 342: 637-642.
  47. https://en.wikipedia.org/wiki/Sea_level_rise#/media/File:Post-Glacial_Sea_Level.png
  48. Zelinka MD, Myers TA, McCoy DT, Stephen PC, Peter MC, al. (2020) Causes of Higher Climate Sensitivity in CMIP6 Models. Geophysical Research Letters 47.
  49. https://earthobservatory.nasa.gov/images/4073/panama-isthmus-that-changed-the-world
  50. https://sunearthday.nasa.gov/2007/locations/ttt_cradlegrave.php
  51. Hugelius G, Strauss J, Zubrzycki S, Harden JW, Schuur EAG, et al. (2014) Improved estimates show large circumpolar stocks of permafrost carbon while quantifying substantial uncertainty ranges and identifying remaining data gaps. Biogeosciences Discuss 11: 4771-4822.
  52. DeConto RM, Galeotti S, Pagani M, Tracy D, Schaefer K, al. (2012) Past extreme warming events linked to massive carbon release from thawing permafro.st Nature 484: 87-92.
  53. Figure SPM-2 in IPCC 2007: Summary for Policymakers. In: Climate Change 2007: The Physical Science Basis.
  54. Figure 22.5 in Chapter 22 (F.S. Chapin III and S. F. Trainor, lead convening authors) of draft 3rd National Climate Assessment: Global Climate Change Impacts in the United States. Jan 12, 2013.
  55. Dorrepaal E, Toet S, van Logtestijn RSP, Swart E, van der Weg, MJ, et al. (2009) Carbon respiration from subsurface peat accelerated by climate warming in the subarctic. Nature 460: 616-619.
  56. MacDougall AH, Avis CA, Weaver AJ (2012) Significant contribution to climate warming from the permafrost carbon feedback. Nature Geoscience 5:719-721.
  57. Shakhova N, Semiletov I, Leifer I, Valentin S, Anatoly S, et al. (2014) Ebullition and storm-induced methane release from the East Siberian Arctic Shelf. Nature Geoscience 7: 64-70.
  58. Sandeman J, Hengl T, Fiske GJ (2018) Soil carbon debt of 12,000 years of human land use PNAS 114:36, 9575-9580, with correction in 115:7.
  59. Stern N (2007) The Economics of Climate Change: The Stern Review. Cambridge University Press, Cambridge UK.
  60. Rind D, Goldberg R, Hansen J, Rosenzweig C, Ruedy R (1990) Potential evapotranspiration and the likelihood of future droughts. Journal of Geophysical Research. 95: 9983-10004.
  61. https://www.wsj.com/articles/economists-statement-on-carbon-dividends-11547682910
  62. www.climateadvisers.com/creating-negative-emissions-the-role-of-natural-and-technological-carbon-dioxide-removal-strategies/
Factors Influencing the Adoption of Cocoa Agroforestry Systems in Mitigating Climate Change in Ghana: The Case of Sefwi Wiawso in Western Region

Introduction

Climate change is having great impact on agricultural productivity worldwide. Agriculture is strongly influenced by weather and climate [1,2]. Climate change and variability adversely affect environmental resources such as soil and water upon which agricultural production depends, which poses a serious threat to sustainable agricultural production [2]. In Ghana climate variability and change is expected to have an adversely effect on the agriculture sector. According to the NIC, (2009) by 2030 temperature are projected to rise by 0.5 °C. This situation would result in fewer rainy days and more extreme weather conditions like prolonged droughts. The impacts of a changing climate will have direct and indirect effects on global and domestic food systems [3,4]. Rioux [5] reported that climate change has affected yields in food crop production in many Africa countries. If the issues of climate change and variability are not addressed incomes and food security of rural households in Ghana would be undermined because there would be increased incidence of diseases and pest as well as prolonged variable rainfall patterns.

Cocoa production employs over 15 million people worldwide with over 10.5 million workers in West Africa [6]. Cocoa, in addition to cereals and other root and tuber  crops  contribute  largely  to  food security in Ghana. In Ghana cocoa production is an essential component of  rural  livelihoods  and  its  cultivation  is  considered a ‘way of life’ in many production communities [7]. The cocoa sub sector cocoa employs about 800,000 farm families spread across the cocoa growing regions of Ghana and generating about $2 billion in foreign exchange annually [8,9]. The expansion of cocoa production is replacing substantial areas of primary forest. It’s of no surprise that the total area under cocoa cultivation increased by 50,000 hectares between 2012 and 2013 and there is no indication that the rate is slowing down. According to Anim Kwapong et al. [10] the government of Ghana recognizes that climate change is already negatively affecting Ghana’s cocoa sector in myriad ways and that, it is likely to continue hampering Ghana’s environmental and socio-economic prospects in the coming decades. Cocoa agroforestry system has been identified as is an important strategy that can ameliorate climate change [11].

This system can play a dual role of mitigation and adaptation, which makes it one of the best responses to climate change. It is noted that agroforestry has multi-functional purposes which makes it one of  the most promising strategies for climate change adaptation [11,12]. The use of trees and shrubs in agricultural systems help to tackle the triple challenge of securing food security, mitigation and reducing the vulnerability and increasing the adaptability of agricultural systems to climate change [13,14]. With this view, serious attention must be given to cocoa agroforestry which is capable of reducing temperatures and enhancing the growing of cocoa thus sustaining livelihood of many households in this climate changing pattern. According to previous studies [11,13,15] agroforestry as an adaptation strategy could sustain agricultural production and enhance farmers’ ability to improve livelihoods and will minimize the impacts of climate change which include drought, variable rainfall and extreme temperatures. Agroforestry as a forest-based system plays a significant role in conserving existing carbons, thereby limiting carbon emissions and also absorbing carbons that are released into the atmosphere [16]. Nair [17] also indicated that agroforestry has received international attention as an effective strategy for carbon sequestration and greenhouse mitigation. Cocoa agroforestry can increase farmers’ resilience and position them strategically to adapt to the impacts of a changing climate. This system of cocoa production can be very useful because it generates quite substantial benefits on arable lands in diverse ways; trees in agricultural fields improve soil fertility through control of erosion, improve nitrogen content of the soil and increase organic matter of the soil [18,19]. Agroforestry can also transform degraded lands into productive agricultural lands and improves productive capacities of soils [18]. Although agroforestry is not new in Ghana, it is quite optimistic that effective adoption to climate change will contribute towards the achievement of sustainable development and to a large extent, the attainment of the Sustainable Development Goals (SDGs). Despite the immeasurable benefits of cocoa agroforestry system, adoption is not widespread and for that matter success stories are found in isolated cocoa farming areas among few adapters of cocoa agroforestry system initiatives. Aidoo and Fromm [20] report that although cocoa farmers are aware about sustainability issues, they hardly adopt sustainable production practices. It is quite not always the case that policies are implemented as they were intended and so the need to assess farmers’ perspectives on cocoa agroforestry adoption and implementation especially when climate change has become a serious constraint to cocoa production in Ghana. Traditional coping mechanisms to the impact of climate change in the Western Region of Ghana include mixed cropping, non-farm activities and traditional agroforestry practices by some individual cocoa farmers. However, non-shade cocoa production systems, bush burning, slash and burn farming methods expose the cocoa communities to further impacts of climate change. This calls for swift attention from all, especially cocoa farmers in the study communities to tackle the problem. Despite the economic, environmental and sustainable cocoa production potential via agroforestry systems, farmers have not adopted cocoa agroforestry practices entirely especially in Sefwi Wiawso District. Understanding cocoa farmers decision making processes in ensuring sustainable food supply and cocoa yield in cocoa agroforestry system is critical. Research frontiers in cocoa agroforestry systems need to be identified and better understand barriers to adoption and the development of strategies to support cocoa agroforestry that enhance food security in climate changing conditions. The objectives of this study are therefore to empirically assess the factors that affect farmers’ decision to adopt cocoa agroforestry systems and determine cocoa farmers’ perception on cocoa agroforestry as an adaptation strategy to climate change.

Methodology

The study was conducted at Sefwi Wiawso in the Western and region of Ghana. The district lies within latitudes 6º 00“and 6º 30 North and Longitudes 2º 15‟ and 2º 45 West. The District covers an area of about 2,634 square kilometers. The detailed hydrometeorological characteristics of the study area are provided in Table 1.

Table 1: Hydrometeorological characteristics of the study area.

Characteristics

Levels

Mean temperature

Maximum: 33°C Minimum: 26°C

Climate

Tropical rainforest

Average humidity

Dry season: 50-75%
Rainy season: 85-90%

Average rainfall

1500-1800 mm

Topography

Undulating

Soil condition

Loamy

Average elevation

206 m

A stratified random sampling technique was employed in the selection of the 300 cocoa farmers interviewed for the study. In the first stage, Western Region was purposively selected due to the fact that apart from being one of the highest cocoa producing regions    in Ghana, it is one of the regions which has experienced significant impact as a result of climate change. In the second stage, Sefwi Wiawso was randomly selected. In the third stage, five communities were randomly selected. In the final stage 60 cocoa farmers were randomly selected from each village. Primary data were employed in the study. The primary data consisted of qualitative data and household survey interviews. Specifically, the primary data were collected through focus group discussions (FGD), stakeholder interviews, and field observations. The household survey interviews employed both open- ended and close ended survey instruments.

To examine the factors that influence a household’s decision to participate in agroforestry a logistic regression model was employed.

The model was specified as:

ESCC-2-1-202-e001

Where: i = 1, 2, 3………., k are the observations, α= constant. β = the regression parameter to be estimated. βX= linear combination of independent variables.  Zi= the log odds of choice for the  ithobservation. Pi= the probability of observing
a specific outcome of the dependent variable (adoption). Xn = nth explanatory observation. u = the error term.

Results and Discussion

The gender composition of the cocoa farmers among revealed that 81.5 percent of the respondent are males with 19.5 percent been females. This indicates that cocoa production is a male dominated occupation in the study area. In Ghana cocoa production is considered a male job but this is not the situation at the study sites because both women and men play a critical role in the production cycle. Within the last 30 years, cocoa farmers observed some impacts of climate change in the study communities, information gather from the cocoa farmers showed that there has been varying pattern in rainfall and sunshine. With regards to drought, overwhelming 98 percent of cocoa farmers reported the occurrence of drought in the study area and linked it to climate change. The pattern of rainfall distribution has changed as reported from the study. The study reported high level of windstorm, high incidence of flooding and frequent occurrences of pests and disease on their cocoa farms in recent time. These are attributed to climate change. Frequent felling of trees, non-shade cocoa production systems, wood harvesting for charcoal and firewood and bush burning among others were mention as some course of changing climate in the farming communities. About two thirds of the farmers reported unplanned trees harvesting as a major cause for variable rainfall thus climate change. This suggest that majority of farmers are aware of some of the causes of climate change in the study area. About 58 percent of cocoa farmers are using doing the non-shade cocoa production system. This result confirms a report [21], indicating that high proportion of Ghana’s cocoa is grown in full sun at the expense of primary or secondary forest conversion. A study [22] reported that shaded tree densities, and average number of tree species per hectare vary according to cultural tradition and ethnic group, age of farms, proximity to markets, and intensity of farming, this situation is similar to that of the study area after personal interaction with the cocoa farmers. This current trend of no shade is not only common in Ghana but other cocoa growing countries like Cote d’Ivoire, Malaysia, Indonesia and Ecuador. A study [23] in Ecuador reported that half of the new cocoa plantations are now full-sun and are from high-yielding variety. A study [24] also revealed that in Sulawesi cocoa farmers are switching from long-fallow shifting cultivation of food crops to intensive full-sun cocoa. This current trend of cocoa production put the food security of these cocoa farmers in doubt with the impact of climate change.

Cocoa farmers acknowledge the benefits of adopting cocoa agroforestry system in cocoa production. Farmers indicated that cocoa agroforestry has the potential of maintaining soil moisture, improving soil fertility as well as suppressing weeds within the cocoa farm. A study by Bentley [23] on cocoa farmers in Ecuador also indicated similar characteristics. Cocoa farmers acknowledged that no shade cocoa system is agriculturally unsustainable and is becoming common in the study area. The study reported that cocoa agroforestry mimics the natural sub canopy cover of traditional cocoa tree in the forest thus good practice to mitigate climate change. The shade trees selected by the cocoa farmers need to provide products and additional income when sold. Terminalia superb, Milicia excels, Terminalia ivorensis, Cedrella odorata,Ceiba pentandra and Ceiba pentandraas are the most dominant shade tree on cocoa farms  and are retained because of their economic importance. Eighty-five percent have little knowledge about the tree rights in the community although there are existing policies and legislations in Ghana. The average knowledge of useful species in this cocoa farming communities are fading out. For example, some of the younger farmers interviewed retain shade trees on an interest in the knowledge of their parents and grandparents.

Cocoa farmers have various levels of perception on certain characteristics of cocoa agroforestry. About 54 percent of cocoa farmers strongly perceive that cocoa agroforestry improves yield of cocoa. These trees ensure a microclimate condition which enhance the yield of the cocoa and thus mitigate climate change. Other perception held by cocoa farmers for cocoa agroforestry are enhancing soil moisture, improve farm humidity and environment, protecting young cocoa trees from pest and diseases and direct sun rays (Table 2).

Table 2: Perception of cocoa farmers on cocoa agroforest in mitigating climate change.

Cocoa agroforestry ensure sustainable yield

Strongly agree

162 (54)

Agree

66 (22)

Undecided

54 (18)

Disagree

18 (6)

Cocoa agroforestry improves soil fertility

Strongly agree

195 (65)

Agree

75 (25)

Undecided
Disagree

30 (10)

Cocoa agroforestry improve farm humidity

Strongly agree

204 (68)

Agree

60 (20)

Undecided

18 (6)

Disagree

8 (24)

Cocoa agroforestry enhance rainfall

Strongly agree

225 (75)

Agree

45 (15)

Undecided

21 (7.0)

Disagree

9 (3.0)

Cocoa agroforestry serves as a wind break on farms

Strongly agree

240 (80)

Agree

45 (15)

Undecided
Disagree

15 (5)

Factors Affecting Adoption of Climate-Smart Agriculture Innovations in Isolation and in Combination

Farmers’ adaption decisions were found to be influenced by several varying factors. The factors include farming experience, agricultural land size, belonging to farmer association, access to extension services, awareness of climate change, and experience in farming.

Results from the regression are reported here to tell the factors determining of adoption of individual farmer. The base category used in the analysis was non-adoption. Table 3 report coefficients and marginal effects from MNL regression respectively. Marginal effects (Table 3) are reported and discussed here. In this instance,  the marginal effects measure the expected change in probability of   a certain choice (of a cocoa agroforestry system) being made with respect to a unit change in an explanatory variable, all in comparison to the no adoption category.

Table 3: Factors influencing farmers adaption decision.

Variable Name

Estimate

SE

Wald

p (Sig.)

Odds ratio

Agriculture land size

0.239

.139

2.944

.086*

.787

Experience in farming

0.823

.388

4.499

.034**

2.278

Member of farmer Assciation

1.037

.453

5.240

.022**

2.821

Gender

0.474

.502

.892

.345

1.607

Awareness of climate change

0.063

.054

1.378

.0240**

1.065

Age of respondent

-011

.016

.447

.504

0.989

Access to extension service

2.976

0.756

15.510

.000***

0.51

Constant

2.901

1.092

7.060

.008***

18.19

Model chi-square 53.87 p<0.000

-2 log likelihood 171.058a

Nagelkerke (R Square) .730

***Significant at 1%, **Significant at 5%, *Significant at 10%.

Results are compared to the base category of no-adoption. The results indicated that adoption of cocoa agroforestry is negatively associated with age of farmer and positively associated with agriculture land size, experience in farming, member of farmer association, gender, awareness of climate change and access to extension service. Results imply that probability of adopting cocoa agroforestry decreases with ageing of cocoa farmer possibly due to risk aversion of innovative practices like cocoa agroforestry by older cocoa farmers. The positive association of cocoa agroforestry adoption with agriculture land size imply that larger plot sizes could be more flexible to experiment with cocoa agroforestry. Also, the positive association of extension could be due to availability of information for cocoa farmers with access to it. The factors of cocoa agroforestry adoption is in agreement with studies [25,26]. Extension services are very critical for availing necessary information on cocoa agroforestry. Overall, results show the importance of cocoa agroforestry system at the farmer level in building resilience to climate variability and change as well as other productivity related challenges in cocoa farming in Ghana. Adoption of cocoa agroforestry system reduces the impacts of climate change on cocoa productivity and hence farmer incomes. The enhanced impact of adopting cocoa agroforestry systems possibly arise as a result of the micro climatic conditions that is favorable for cocoa production. Findings of the study conform to other related literature that indicates that, adoption  of new agricultural technologies needs to positively impact on productivity, income and other welfare related variables of the adaptors.

Conclusion and Recommendation

Cocoa researchers and development partners are becoming more concern with welfare of cocoa farm in Ghana by promoting cocoa agroforestry systems which is essential in a bid to improve climate resilience. Cocoa agroforestry has the potential to improve soil fertility, regulate soil temperature, control soil moisture among other benefits. The study outcomes have shown that climatic changes have occurred over the years and these have had effect on the annual cocoa yield. The study revealed that some cocoa farmers are presently ignorant about their tree ownership on their farms. It therefore recommended that agricultural extension officers should educate these farmers on tree rights. Cocoa farmers in the study areas have noticed changes   in climate conditions through their own experiences and careful observations over the year of farmers. Also, respondents reported that cocoa agroforestry systems can offer numerous environmental, social and financial benefits, and can lead to an alternative way to mitigate climate change and variability. Land size, member of farmer association, experience in farming, awareness of climate change and access to extension service are the main factors that influence cocoa farmers’ decision to adopt cocoa agroforestry system. There is the need for effective provision of extension services through farmer field school programs. Programs of this nature have the potential to change farmers’ attitudes towards adopting a technology. Access to information and credit needs to be enhanced so as to get the needed logistics for managing cocoa agroforestry systems. This would facilitate farmers’ access to information about technical issues of the systems and how it can be managed in mitigating climate change. Finally, government should support cocoa famers through subsidies and long-term loans. There is also the need for more concerted and strong collaborative effort among Ghana COCOBOD, the Ministry of Food and Agriculture and Forestry Commission so as to reach greater a policy impacts on cocoa agroforestry system.

References

  1. Parry L (2019) Climate Change and World Agriculture. Routledge Library Editions: Pollution, Climate and Change, London, 172.
  2. Gornall J, Betts R, Burke E, Clark R, Camp J, et al. (2010) Implications of climate change for agricultural productivity in the early twenty-first century. Philos. Trans R Soc B Biol Sci 5: 2973-2989. [crossref]
  3. Lake IR, Hooper L, Abdelhamid A, Bentham G, Boxall ABA, et al. (2012) Climate change and food security: Health impacts in developed countries. Environ Health Perspect 120: 1520-1526. [crossref]
  4. Edwards F, Dixon J, Friel S, Hall G, Larsen K, et al. (2011) Climate change adaptation at the intersection of food and health. Asia Pac J Public Health 23: 91-104. [crossref]
  5. Rioux J (2012) Nature & Faune 26: 63-68.
  6. De Lattre-Gasquet M, Despéraux D, Barel M (1998) ‘Prospective de la Filière du Cacao Plantation’. Recherche Développment 5: 423-434
  7. Nunoo I and Owusu V (2015) Comparative analysis on financial viability of cocoa agroforestry systems in Ghana. Environment Development and Sustainability 19.
  8. COCOBOD (2018) Ghana Cocoa Board Handbook16th ed. Jamieson’s Cambridge Faxbooks Ltd, Accra.62pp.
  9. Ministry of food and Agriculture (2017) Directorate of Agricultural Extension Services: Agricultural Extension Approaches Being Implemented in Ghana.
  10. Anim Kwapong, et al. (2005) Vulnerability and Adaptation Assessment under the Netherlands Climate Change Studies Assistance Programme Phase 2.
  11. Kuyah S, Whitney CW, Jonsson M, et al. (2019) Agroforestry delivers a win-win solution for ecosystem services in sub-Saharan Africa. A meta-analysis. Agron Sustainm Dev 39: 47.
  12. Campbell ID, Durant DG, Hunter KL, Hyatt KD (2014) Food production. In Canada in a Changing Climate: Sector Perspectives on Impacts and Adaptation 99–134
  13. Carsan S, Stroebel A, Dawson I (2014) Can agroforestry option values improve the functioning of drivers of agricultural intensification in Africa? Curr Opin Environ Sustain 6: 35-40.
  14. McCabe Colin (2013)”Agroforestry and Smallholder Farmers: Climate Change Adaptation through Sustainable Land Use” Capstone Collection.
  15. Syampungani SC (2010) The Potential of Using Agroforestry as a Win-Win Solution to Climate Change Mitigation and Adaptation and Meeting Food Security Challenges in Southern Afri. Agricultural Journal 5: 80-88.
  16. Mbow C, Smith P, Skole D, et al. (2014) Achieving mitigation and adaptation to climate change through sustainable agroforestry practices in Africa. Curr Opin Environ Sustain 6: 8-14.
  17. Nair PK (2009). J Plant Nutr Soil Sci 172: 10-23.
  18. Pinho CR, Miller PR, Alfaia SS (2012) Agroforestry and the Improvement of Soil Fertility: A View from Amazonia. Applied and Environmental Soil Science 2012: 11.
  19. Thangataa PH, Hildebrand PE (2012) Carbon stock and sequestration potential      of agroforestry systems in smallholder agroecosystems of sub-Saharan Africa: mechanisms for reducing emissions from deforestation and forest degredation (REDD+). Agric Ecosyst Environ 158: 172-183.
  20. Aidoo R, Fromm I (2015) Willingness to Adopt Certifications and Sustainable Production Methods among Small-Scale Cocoa Farmers in the Ashanti Region of Ghana. Journal of Sustainable Development 8: 33-43.
  21. UNDP (2011) Greening the sustainable cocoa supply chain in Ghana.
  22. Sonwa DJ (2004) Biomass management and diversification within cocoa agroforests in the humid forest zone of southern Cameroon. PhD thesis. Institute fur Gartenbauwissenshaft der Rheinischen FriedrichWilhelms-Universitat Bonn.
  23. Bentley JW, Boa E, Stonehouse J (2004) Neighbor trees: Shade, intercropping, and cacao in Ecuador. Human Ecology 32: 241-270.
  24. Belsky JM, Seibert S (2003) Cultivating cacao: implications of sun-grown cacao on local food security and environmental sustainability. Agric Human Values 20: 277- 285.
  25. Mazvimavi K, Twomlow S (2009) Socioeconomic and institutional factors influencing adoption of conservation farming by vulnerable households in Zimbabwe. Agric Syst 101: 20-29.
  26. Makatea C, Makateb M, Mangoc N, Sizibad S (2019) Increasing resilience of smallholder farmers to climate change through multiple adoption of proven climate-smart agriculture innovations. Lessons from Southern Africa. Journal of Environmental Management 231: 858-868.

Sensory Stimulation and Bradykinesia Aponeurotic Stimulation Effects on Parkinson Bradykinesia

Abstract

Introduction: Bradykinesia is one of the main motor symptoms in Parkinson Disease (PD). Studies have shown that patients with PD exhibit bradykinesia because they have difficulties integrating multi-sensorial information, mainly proprioception, leading to difficulties in modulating the velocity of self-paced voluntary movements. We hypothesized that stimulation of aponeurotic tissues of the upper limb, which contains numerous types of mechanoreceptors, could therefore have a therapeutic effect on PD-induced bradykinesia.

Method: We investigated changes in bradykinesia in patients with PD after aponeurotic stimulation (AS) of tissues of upper limb muscles with a metallic hook, according to the diacutaneous fibrolysis method. A control group received placebo stimulation (PS) that consisted of manipulating the skin over the muscles that were the targets for AS treatment. We assessed symptoms of bradykinesia in a total of 10 patients with PD in terms of movement velocity for upward rotations of the outstretched arm and in terms of UPDRS motor score, before and after AS or PS treatment.

Results: Parkinson’s motor symptoms, as measured by the UPDRS motor scored, decreased for the AS group from 31.3±13.2 % to 26.8±12 % (p<0.003), whereas for the control group there was no significant difference after PS treatment. AS treatment also led to an increase in peak velocity at the shoulder (8.1±1.3°/s before vs. 10.2±1.1°/s after; p=0.037), whereas the placebo treatment induced no significant modifications.

Conclusions: The results of this pilot study suggest that aponeurotic stimulation directly improves motor output, with the potential of alleviating bradykinesia in patients with PD.

Introduction

Current knowledge attributes movement disorders in PD to a dysfunction of the basal ganglia-motor cortex circuits, but it is also known that abnormalities in the processing of peripheral afferents may interfere with movement execution [1]. Studies have shown that patients with PD rely excessively on visual information to guide movements [1–3] and that they present deficits in the conscious perception of limb and body motion (i.e. kinaesthesia) [4]. Exploring rehabilitation possibilities for PD-related movement disorders via sensory stimulation is therefore very attractive, especially since cutaneous and proprioceptive stimulation strongly activates both the olivo-cerebellum and basal ganglia networks [5–6]. In this light, we hypothesized that diacutaneous fibrolysis method, a form of aponeurotic manipulation, could be beneficial. By applying this approach on the triceps surae, Vezsely et al [7]. Showed that dorsi-flexion at the ankle increased while passive tension decreased. More importantly, tendon reflexes decreased, indicating a modification of proprioceptive information processing. To the extent that sensory processes may underlie bradykinesia in PD, aponeurotic stimulation could affect, and hopefully alleviate, some of these symptoms.

Methods

Participants

Ten participants gave written consent and the Ethical Committee of the “Hôpital Brugmann” (Brussels) approved the study. Table 1 shows the characteristics of each participant. Each participant continued their usual medical treatment and for those using deep brain electrical stimulation (DBS), the stimulation was turned on during the experiment.

Experimental procedure

Participants performed a pointing task consisting of an upward rotation of the outstretched arm around the shoulder joint, initiated after a self-timed delay. Patients were seated in front of a panel showing two targets and pointed at these targets with a laser pointer fixed to their index finger (Figure 1A). Movements of reflective markers attached to the upper limb were recorded in 3D at 100 Hz with an optoelectronic device (BTS Elite System).

An experimental session consisted of 10 pointing movements performed before and after 45 minutes of AS or PS treatment (see below). At the beginning and end of the session, a therapist performed the UPDRS test (part III: Motor evaluation) [8] concerning motor function. One week before the recording session, each patient was trained to perform the pointing movements at their own ‘natural’ velocity.

JCRM 2019-119 - Ana Bengoetxea Belgium_F1

Figure 1:

A) Experimental conditions. Seated subjects pointed with a laser to targets (diameter of 4 cm) located at a distance of 3.5m. The starting target was in the middle of the panel and the ending target 42 cm above. They were asked to perform the movements with the upper arm in an extended position (shoulder movements around a nominal position of 90° flexion, with the elbow fully extended).

B) Mean peak shoulder velocity (Vy) before (ordinate) versus after (abscissa) treatment. Open circles represent the PS treatment group and black circles the AS treatment group. Dashed lines show the range (mean±SD) for the healthy control group.

C) Mean and SD for Vy before and after PS and AS treatment, and for healthy control subjects.

A second therapist imposed passive movements of the patient’s shoulder and elbow used to localize the muscles manifesting the greatest rigidity. In general the main muscles manipulated were: the superior or inferior trapezium, the anterior and posterior deltoid, the external or internal rotators of the shoulder, the pectoralis major, the triceps brachii and the brachialis. AS treatment consisted of back-and-forth displacements of the aponeurotic tissues enrobing the heads of the target muscles, applied by a hook perpendicular to the axis of the muscular fibers. PS stimulation consisted of manipulating the skin over the same target muscles. The second therapist was the only person to know if AS or PS was applied to a given patient.

We computed the peak angular velocity for rotation at the shoulder (Vy) from the 3D marker data for each pointing movement. Statistical analyses consisted of repeated measure ANOVA (Statistica®, StatSoft) with treatment (AS or PS) and repetition (before or after treatment) as within-subjects factors, applied to Vy and to UPDRS scores.

Results

Before manipulation the AS and PS groups presented no significant differences in their motor UPDRS scores. ANOVA showed a significant cross-effect (F(1, 9)=8.76, p=0.016) between test repetition (before or after treatment) and treatment type (AS or PS). The subsequent Bonferroni-corrected post-hoc analyses showed a highly significant decrease of the UPDRS motor score from 31.3±13.2% to 26.8±12 % after AS treatment compared to before (p<0.003), whereas for the PS treatment group there was no significant difference (Table 1).

Table 1. Profile and clinical features of subjects. UPDRS score for part III (Motor evaluation) and scores on selected items before and after treatment.

JCRM 2019-119 - Ana Bengoetxea Belgium_F2

We then assessed what items of the UPDRS presented the main changes after treatment. Table 1 shows the values before and after treatment for 6 specific items (the values correspond only to the treated upper limb); 3 of them corresponding to the ‘triad’ of main symptoms of PD disease and the 3 others corresponding to hand movements. It is interesting to note that treatment produced a significant cross-effect between the ‘hand’ and ‘triad’ groups (F(1, 9)=6.024, p=0.04). After treatment the mean of hand-movement items decreased from 1.36±0.16 to 1.06±0.18 (Bonferroni post-hoc p<0.01), whereas the mean values of the triad symptoms remained stable (1.26±0.13 and 1.23±0.15, respectively).

Figure 1B shows Vy measured for our participants, compared to the mean±SD of “natural” shoulder velocity for 10 healthy control subjects (area between dashed lines) who performed this pointing movement after the same training as our patients. Patients presented significantly lower Vy on average than the control group (8.8±0.8°/s vs. 13.8±1.5°/s), however, we found no difference in Vy between our two patient groups prior to treatment (8.2±1.3°/s for AS vs. 9.9±1.9°/s for PS). Repeated measures ANOVA showed a significant main effect of test period (before and after treatment) on Vy (F(1,9)=5.7, p=0.04). Bonferroni post-hoc tests showed that treatment modified Vy only for the AS group (10.23±1.13°/s after versus 8.17±1.28°/s before; p=0.037) whereas the PS treatment induced no significant modifications (Figure 1C).

Discussion

Aponeurotic stimulation increased the shoulder velocity for vertical pointing movements (Vy) and improved the velocity of hand gestures (UPDRS’s items), indicating a decrease of bradykinesia in our PD patients. It is worth noting that our participants performed these movements under conditions that increase the risk of bradykinesia, because they were voluntary, internally driven movements with accuracy constraints [9] and because repeating movements makes the symptoms more prominent [10]. It is also worth noting that our treatment produced a positive effect on the UPDRS items concerning repetitive sequential movements of isolated fingers, hand and wrist (items 23, 24 and 25 respectively).

Conclusions

More research is needed to understand the mechanisms of motor output improvement brought on by the aponeurotic stimulation. Whatever the cause, however, the results from this pilot study indicate that aponeurotic manipulation could provide a new therapeutic approach to improve the quality of every-day movements in patients with PD.

Acknowledgments

This work was funded by the Belgian National Fund for Scientific Research (FNRS), the Research Fund of the Université Libre de Bruxelles (Belgium), the Belgian Federal Science Policy Office, the European Space Agency (AO-2004, 118), the FP7 support (ICT-247959-MINDWALKER). The authors thank J. McIntyre for fruitful comments about the manuscript, J. Burnotte for teaching all the subtleties of the aponeurotic technique, all the persons who participated in the study, the LNMB team for rich discussions, E. Hortmanns and T. d’Angelo for expert technical assistance and C. de Scoville for administrative assistance.

References

  1. Abbruzzese G, Berardelli A. (2003) Sensorimotor integration in movement disorders. Mov Disord 18(3): 231–40. [Crossref]
  2. Adamovich SV, Berkinblit MB, Hening W, Sage J, Poizner H. (2001) The interaction of visual and proprioceptive inputs in pointing to actual and remembered targets in Parkinson’s disease. Neuroscience 104 (4): 1027–41. [Crossref]
  3. Poizner H, Feldman AG, Levin MF, Berkinblit MB, Hening WA, Patel A, Adamovich SV. (2000) The timing of arm-trunk coordination is deficient and vision-dependent in Parkinson’s patients during reaching movements. Exp Brain Res 133(3): 279–92. [Crossref]
  4. Konczak J, Krawczewski K, Tuite P, Maschke M. (2007) The perception of passive motion in Parkinson’s disease. J Neurol 254(5): 655–63. [Crossref]
  5. Ekerot CF, Garwicz M, Jörntell H. (1997) The control of forelimb movements by intermediate cerebellum. Prog Brain Res 114: 423–9. [Crossref]
  6. Hoshi E, Tremblay L, Féger J, Carras PL, Strick PL. (2005) The cerebellum communicates with the basal ganglia. Nat Neurosci 8(11): 1491–3. [Crossref]
  7. Vezsely M, Guissard N, Duchateau J. (2000) Contribution à l‘étude des effets de la fibrolyse diacutanée sur le triceps sural. Annales de kinésithérapie 27: 54–59.
  8. Fahn S, Elton RL, Members of the UPDRS Development Committee. (1987) The Unified Parkinson’s Disease Rating Scale. In Fahn S, Marsden CD, Calne DB, Goldstein M, editors. Recent developments in Parkinson’s disease, vol 2. Florham Park, NJ: Macmillan Health Care Information 153–163, 293–304
  9. Sheridan MR, Flowers KA. (1990) Movement variability and bradykinesia in Parkinson’s disease. Brain 113 ( Pt 4): 1149–61 [Crossref]
  10. Agostino R, Berardelli A, Formica A, Stocchi F, Accornero N, Manfredi M. (1994) Analysis of repetitive and nonrepetitive sequential arm movements in patients with Parkinson’s disease. Mov Disord 9(3): 311–4 [Crossref]

Promoting Medication-Adherence by Uncovering Patient’s Mindsets and Adjusting Clinician-Patient Communication to Mindsets: A Mind Genomics Cartography

Abstract

We present a new approach to understanding how patients want doctors to communicate to them. The approach uses Mind Genomics, an emerging science in experimental psychology, which looks at the way people make decisions about the everyday. Respondents in an experiment evaluated different combinations of messages (elements) in vignettes. The results suggest three minds (privacy-oriented; doctor oriented; control-oriented), requiring three different types of messages. These mind-sets also pay attention to the messages in different ways, as shown by the pattern of their response times. We present a PVI (personal viewpoint identifier), which in six questions can suggest the mind-set to which a new person might belong.

Introduction

Patient self-management programs are the aim of health systems and public health policy makers. The main goal of health systems is to improve clinical outcomes of patients by engaging them to adhere to medications, to adopt a healthy lifestyle and to properly manage their illnesses. Patient adherence is defined as the degree to which patients follow physician’s guidelines and recommendations. Patient non-adherence has been a challenge for clinicians with evidence indicating that 25% to 50% of patients are non-adherent [1–4]. Furthermore, patients suffering a more severe illness in serious diseases were surprisingly less adherent [5]. Consequently, across illnesses non-adherence results in comorbidities, re-admissions to hospitals, in lower quality of life and in economic burdens for public health systems. Adherence to guidelines and medications was found to promote illness-self management (e.g., appointments, screening, exercise, and diet).Adherence is affected by: clinician-patient relationship, the illness itself, the treatment, patient characteristics and socioeconomic factors [6].

Patients expect their physicians to inspire them through communication leading to patient trust which is strongly related to medication-adherence[7–9]. Physician-patient communication was found to enhance patient adherence to decrease re-admissions [10,11]. To promote adherence patients need to understand the illness, the risks it entails and the treatment benefits [11]. Clinician-patient communication is an essential in adherence promotion [11–14]. Moreover, the odds of patient adherence are 2.16 times higher if a clinician communicates effectively [2,5,15].

Communication entails support, empathy and compassion leveraging collaborative patient-physician decision-making [9,12]. Whereas ‘content communication’ focuses on clinical aspects of the disease (e.g., the illness, the treatment regimens), ‘process communication’ focuses on psychosocial aspects (motivation, drivers, life–meaning, gathering information about the patient and environment, understanding how to remove barriers to adherence and identifying steps in the change process towards adherence.

‘Process communication has been report found to effectively raise patient-adherence [2,10,16–19]. Furthermore, patients who perceived their clinicians as their partners to the change process demonstrated a 19% higher medication-adherence. Furthermore, training physicians on ‘process communication’ improved patient-adherence by 12% [5,18,19]Essentials of behavioral research: methods and data analysis McGraw-Hill; 2007.

Despite evidence those clinicians’ skills of process communication are central to patient-adherence; clinicians mostly use content communication and have difficulties crossing this chasm [20]. Several factors underlie the challenge of crossing this chasm. First, there is a lack of sufficient training on psychosocial communication during and after medical school [20]. Second, there is a low prioritization of such skills in training programs [21]. Third, there is a lack of incentives for physicians to participate in such training [22]. Finally, there are misconceptions among physicians who perceive psychosocial communication as time consuming [23] when in fact it requires shorter, more effective time [18].

Previous studies suggest that interventions to improve psychosocial communication among clinicians should focus on a variety of aspects, not just one. These aspects are, respectively, verbal and nonverbal communication, affective communication, psychosocial communication and task-oriented behavior that create opportunities for active patient involvement throughout the change process towards patient-adherence [24]. Previous studies indicate that in order to reduce barriers which stand in the way of optimal health outcomes, communication is to be personalized enabling clinicians to understand what is most relevant for each particular patient and tailor the messages accordingly [4].

But what do we know about the mind of the patient? How can we find out what the patient feels to be important? What does the patient feel is relevant and irrelevant for her or him? In response to existent discourse in the literature, in 2011we conducted an internet experiment using Mind-Genomics to investigate combinations of messages on ‘living with the regimen’ (Moskowitz, unpublished observations).We identified three mind-sets. This study extends the 2011 study looking more closely at messages about how people feel about themselves in terms of how the doctor communicates with them. Our objective is to identify participants by psychographic mindsets so clinicians may quickly identify the belonging of each patient to a mindset and use tailored effective communication congruent to that mindset-segment in the context of medication adherence.

Method

Mind Genomics works in a Socratic fashion, first identifying a topic, then requiring the researcher to ask four questions, and finally requiring the researcher to provide four separate answers to each question. Inspired by existing literature and research instruments, we shaped questions which ‘tell a story’ [25–30]. Once the questions are asked, the answers are quickly provided. Asking the questions forces the researcher to think critically. Table 1 shows the four questions and the four answers to each question. The series of questions probe the way the person feels about information. The ‘story’ underlying the four questions is not sequential, but rather topic, as if an interview were being conducted with a person to under how the person feels about giving and receiving information about his or her own health status.

Table 1. Raw material comprising four questions, and four answers to each question

Question A: How would you like your doctor to discuss your health with you?

A1

Doctor talks to me, face to face… not just those phone calls with clinical message

A2

Doctor explains to me WHY this medicine, and what should I DO

A3

My friends explain this stuff to me… I’m more comfortable with them

A4

Doctor guides me to the Internet sites… so I CAN TAKE CONTROL

Question B: What honestly is your relationship with your health?

B1

I’m pretty private about my health… no one’s business

B2

I don’t feel like going to the doctor… even for the most severe symptoms… I can take care of it

B3

When it comes to illness, I’m on Google, so I really become an expert

B4

I’m nervous about health – but really want to be healthy to see my kids, grandkids, or even relatives and friends in the years to come

Question C: How do you interact with your family about your health?

C1

My family is always there to listen, and support me… I like that

C2

My family and others butt-in to my health… I want my privacy

C3

I really am happy when someone takes control, and tells me what to take, and schedules my meds for me

C4

I’m pretty private… my health meds are my business… and maybe the doctor’s, but that’s all

Question D: Do friends and family play an important role in your life?

D1

My family means the world to me

D2

I reach out to talk to friends about my health and illness

D3

I reserve my friends for non-medical talks, like politics, or people

D4

My friends really are there to listen to me about my medical experience – sometimes I feel I’m wearing out my welcome

Procedure

Vignettes: The test stimuli for Mind Genomics comprise easy-to-read vignettes, containing 2–4 answers or elements, at most one answer or element from each question. The vignettes are created according to an experimental design, which prescribes the specific combination. Each respondent evaluated 24 vignettes created according to the same basic design, with the specific combinations changing in a deliberate fashion according to a permutation scheme [31]. Thus, the entire experiment covered 24×100 or 2400 vignettes, most of which differed from each other.

It is important to note that the Mind Genomics approach to understanding is similar metaphorically to the MRI machine, which takes many different ‘pictures’ of the underlying tissue, each picture from a different angle and vantage point. Afterwards, a computer program combines these different views into a single 3-D image of the underlying tissue. Each individual picture may have error, but the entire pattern becomes clear once these individual pictures are combined. In a like fashion, Mind Genomics gets the response to many different vignettes, and then synthesizes the overall pattern. Each individual observation is ‘noisy’ with a base size of ‘1’ but the pattern is not as noisy.

The approach of Mind-Genomics covers a wide range of alternative clinical and psychosocial communication concepts, each with elements revealing response patterns by using various permutations of the same stimuli, responses to different combinations of the answers of elements, in order to obtain a stable estimate of the underlying pattern Conventional science attempts to minimize the error around each observation through replication of the same stimulus (average to increase precision)or through reduction of extraneous factors which could increase the error variability (suppressing noise to increase precision).

The respondents were selected at random from a pool of 20+ million respondents in the United States, with approximately equal distribution of age and gender. The respondents were part of the panel provided by the strategic partner of Mind Genomics, Luc.id, Inc. Respondents were compensated by Luc.id.

Each respondent who participated clicked on an embedded link in the email invitation and was taken to a first slide which oriented the respondent. The respondent was told to consider the entire vignette, the combination of elements (answers) as a ‘whole’ and to rate it on the scale below. The questions were never shown to the respondent. Only the answers were shown; the questions served simply as a way to elicit the set of appropriate answers that would be shown to the respondent in the vignette.

Imagine if these qualities were reflected on a magnet. How does this capture your thoughts?

1= Not at all like me. If this is a magnet, it just won’t work for me

5= Very much like me. This magnet will really help me

A surface analysis of the responses – distribution and means

Most surveys work with the responses to single questions and compute the mean of the responses. Mind Genomics proceeds by experimentation, presenting the respondent with combinations of answers or elements, and obtains their rating. The actual ratings themselves pertain to different test stimuli. Furthermore, an inspection of the different patterns across gender and ages fails to give us any insight into the mind of the respondent with respect to feelings about discussing one’s own state of health and receptivity to health information. The means across key subgroups (Table 2) provides little insight, other than perhaps that older respondents had a longer response time, on average, than did younger respondents. A deeper analysis is necessary to understanding the meaning of the data, not just the surface morphology of the response patterns.

Table 2. Mean ratings on the 5-point rating scale, by total panel, gender, and ages


5- Point RATING

Binary TOP2 (Works YES)

Binary BOT2 (Works No)

Response Time

Total

3.2

42

31

5.0

Male

3.1

42

32

4.7

Female

3.2

42

31

5.4

Age 18–30

3.2

38

30

4.3

Age 31–49

3.4

53

27

4.5

Age 50–64

2.9

34

37

6.1

Transforming the data in preparation for regression modeling

In consumer research an oft-heard complaint from managers who use the data is ‘what does the rating point mean?’ In consumer research, the values of the scales are not necessarily easy to understand. That is, for researchers and respondents it seems easy to use the 5-point or 9-point or even a 100-point like rt scale. It may take a bit of use for a respondent, but sooner or later, usually sooner, the respondent falls into a pattern and intuitively senses that ‘this vignette is a 3 or a 4.’

One strategy commonly used, and adopted here, divides the scale into two regions, typically the high region (scale points 4–5) to denote a positive feeling about the vignette, and the remaining low region (scale points 1–3) to denote a negative feeling. We are interested in both sides of the scale, however, specifically what ‘works’ and what ‘don’t work’. Thus, we divide the scale twice, first into the top part and then second into the bottom part:

Works YES – Ratings 1–3 transformed to 0, ratings 4–5 transformed to 100

Works NO – Ratings 1–2 transformed to 100, ratings 3–5 transformed to 0.

The transformation removes some of the granular information but makes the results easy to understand. Managers who work with the data understand in an intuitive sense, because the information is presented in a all-or-none fashion.

Regression Modeling

The experimental design makes it straightforward to apply OLS (ordinary least-squares) regression to the raw data, after transformation. The data matrix comprises 16 independent variables, the elements, coded as 1 when present in the vignette, and coded as 0 when absent from the vignette. The matrix comprises three dependent variables, the binary transformation for Works YES (4–5 coded as 100, 1–3 coded as 0), the binary transformation for Works NO (1–2 coded as 100, 3–5 coded as 0), and the response time in seconds with the resolution to the nearest tenth of second. The response time is defined as the recorded time between the appearance of the vignette on the respondent’s screen and the time to assign a rating, which the respondent did by pressing a key.

Results –Total Panel

OLS regression generates an equation relating the presence/absence of the 16 answers or elements to the response. Table 2 shows the parameters of the three equations, one each for the positive Works YES, the negative Works NO, and the response time.

The additive constant (Works YES, Works NO) shows the estimated percent of the time the answer would be ‘Works YES or Works NO, in the absence of any elements. The additive constant represents a baseline, but not an actual situation because all vignettes by design comprised 2–4 elements or answers.’

The coefficient for each element shows the additive percent of the responses that would be expected to shift from ‘not Works YES’ to ‘Works Yes’ (or from ‘not Works NO’ to ‘Works NO), when the element is incorporated into a vignette. Statistical analyses as well as previous research by author Moskowitz suggest a standard error of approximately 4 for the coefficient, making values of 6–7 begin to reach statistical significance.

The results lead to some immediate and easy interpretation because the test elements are cognitively rich. We don’t have to stand back and search for a pattern in the way we do when we are looking at the pattern described by set of otherwise mute measures. Rather, we can understand the nature of a pattern simply by looking at the elements which score well, with high coefficients for the two binary scales (Works YES, Works NO) and long response times.

What ‘works’ for the respondent (Adherence promotion): The additive constant is 43, meaning that in the absence of anything else, we expect about 43% of the responses to be 4–5 for ‘Works YES.’ This means that if we were to ask a person whether giving and receiving medical information from various sources in general ‘works for that person’ almost 50% of the time we would get a positive answer. The strongest performers comprise a mix of statements about getting information directly from the doctor (Doctor talks to me, face to face… not just those phone calls with clinical message) as well as emotional messages (I’m nervous about health – but really want to be healthy to see my kids, grandkids, or even relatives and friends in the years to come and My family means the world to me.)

What doesn’t ‘work’ for the respondent (Adherence prevention): The additive constant is 30; meaning about 30% of the time we will get responses that say ‘doesn’t work for me’ the key message which resonates in a negative way is ‘I don’t feel like going to the doctor… even for the most severe symptoms… I can take care of it. This is not an easy negative to resolve.

Response time: The model for response time does not have an additive constant. The rationale is that without any elements, there is no response at all.

Studies on health drive respondents to pay a great deal of attention to the vignettes. Table 2 shows that the average for the total panel is approximately 5 seconds for a vignette. The response time, when deconstructed into the contributions of the different messages, show that there is a range of response times, all of which are high compared to the response times from previous studies. In this study the estimated response times for the individual answers or elements vary from a high of 1.8 seconds to a low of 1.1 seconds. We end up with these long response times when we deal with topics relevant to the respondent, issues which engage and make the respondent think. In contrast, when we deal with less relevant topics, e.g., studies about products such as foods, we see far shorter response times. It might be that the messages are easier with foods, being tag lines and short descriptions. Whatever the reason for the difference, the response times are far longer here.

The longer response times are those which ‘engage.’ They may be positive or negative, but they ‘engage’ the respondent, holding the attention. The most engaging elements are these below, describing who the person is, and perhaps forcing the respondent to compare him or herself. One can sense that each of these statements is a ‘conversation opener.’

When it comes to illness, I’m on Google, so I really become an expert I’m pretty private about my health… no one’s business

I really am happy when someone takes control, and tells me what to take, and schedules my meds for me

My family and others butt-in to my health… I want my privacy

I’m nervous about health – but really want to be healthy to see my kids, grandkids, or even relatives and friends in the years to come

I don’t feel like going to the doctor… even for the most severe symptoms… I can take care of it

In contrast, the least engaging elements are those of practice, with a sense that there is no conversation to be started

Doctor explains to me WHY this medicine, and what should I DO

I reach out to talk to friends about my health and illness

Table 3. Coefficients relating the presence/absence of the 16 answers (elements) to the binary transformed ratings, and to response time. The table is sorted by Works YES

Works YES

Works NO

Resp Time

Additive constant

43

30

A1

Doctor talks to me, face to face… not just those phone calls with clinical message

7

-8

1.3

B4

I’m nervous about health – but really want to be healthy to see my kids, grandkids, or even relatives and friends in the years to come

6

-1

1.6

D1

My family means the world to me

6

-6

1.3

A2

Doctor explains to me WHY this medicine, and what should I DO

5

-5

1.2

D4

My friends really are there to listen to me about my medical experience – sometimes I feel I’m wearing out my welcome

1

2

1.5

C4

I’m pretty private… my health meds are my business… and maybe the doctor’s, but that’s all

1

0

1.4

A4

Doctor guides me to the Internet sites… so I CAN TAKE CONTROL

0

-3

1.4

B3

When it comes to illness, I’m on Google, so I really become an expert

-1

3

1.8

C1

My family is always there to listen, and support me… I like that

-1

0

1.5

B1

I’m pretty private about my health… no one’s business

-2

5

1.7

A3

My friends explain this stuff to me… I’m more comfortable with them

-2

0

1.3

D3

I reserve my friends for non-medical talks, like politics, or people

-3

1

1.4

D2

I reach out to talk to friends about my health and illness

-3

-2

1.1

C3

I really am happy when someone takes control, and tells me what to take, and schedules my meds for me

-5

6

1.7

C2

My family and others butt-in to my health… I want my privacy

-6

4

1.7

B2

I don’t feel like going to the doctor… even for the most severe symptoms… I can take care of it

-7

11

1.6

Scenario Analysis: Uncovering Pair-Wise Interactions among Answers/Elements: The messages that we encounter in the environment comprise combinations of ideas, rather than single ideas in ‘splendid isolation.’ We know that in the world of food, the taste of a food is determine by the interplay of ingredients, and that experimental design of ingredients can help us understand the nature of that interplay, also called ‘pairwise interaction’. In consumer research with ideas, we may test single messages (promise testing), or test combinations of messages in a final format (concept testing), but rarely do we search for significant pairwise interactions in the world of ideas. There are so-called ‘creative’ in the advertising agency who may be aware that some ideas ‘synergize’ when in pairs, but this knowledge is specific, experienced-based, and hard to create in a systematic fashion on a go-forward basis.

A key benefit of the Mind Genomics approach is the ability to cover many combinations of ideas in the vignettes, all combinations prescribed by a basic experimental design which is permuted (Gofman & Moskowitz, 2010.) Adhering to the experimental design forces the research to work with a wide number of different combinations. In fact, among the 2400 vignettes created for this study, most are unique. Within the 2400 combinations, specific pairs of messages appear several times. It is this property that the various pairs of messages appear several times across the permutations which makes it possible to hold one the options of one question constant a specific option (e.g., one of the options for Question A: How would you like your doctor to discuss your health with you?), and then assess how the vignettes perform when that specific option is held constant.

Table 4 presents the scenario analysis for the positive responses (Works YES), and Table 5 presents the scenario analysis for the negative response (Works NO). The analysis works in a straightforward manner, following these steps:

Table 4. Scenario analysis, revealing pairwise Interactions to drive perceived positive responses, ‘Works YES’

Element held constant in the vignette

A0

A1

 A2

A3

A4

Top 2 – Works YES (Positive Outcome)


No element from question A

Doctor talks to me, face to face… not just those phone calls with clinical message

Doctor explains to me WHY this medicine, and what should I DO

My friends explain this stuff to me… I’m more comfortable with them

Doctor guides me to the Internet sites… so I CAN TAKE CONTROL

A0

A1

A2

A3

A4

Additive Constant

28

53

50

50

34

B4

I’m nervous about health – but really want to be healthy to see my kids, grandkids, or even relatives and friends in the years to come

15

10

1

-5

17

D1

My family means the world to me

14

-8

3

16

11

C4

I’m pretty private… my health meds are my business… and maybe the doctor’s, but that’s all

11

-5

1

-9

11

B1

I’m pretty private about my health… no one’s business

7

7

-4

-17

-2

D2

I reach out to talk to friends about my health and illness

6

-9

-4

-7

3

B3

When it comes to illness, I’m on Google, so I really become an expert

5

12

0

-8

-6

C2

My family and others butt-in to my health… I want my privacy

2

-15

-10

-1

-5

B2

I don’t feel like going to the doctor… even for the most severe symptoms… I can take care of it

1

1

-5

-24

-6

C1

My family is always there to listen, and support me… I like that

1

-5

1

-1

-3

C3

I really am happy when someone takes control, and tells me what to take, and schedules my meds for me

0

-7

-3

-3

-7

D4

My friends really are there to listen to me about my medical experience – sometimes I feel I’m wearing out my welcome

-2

-2

-1

-2

17

D3

I reserve my friends for non-medical talks, like politics, or people

-6

-8

-3

5

4

Table 5. Scenario analysis, revealing pairwise Interactions to drive perceived negative responses, ‘Works NO’

Bot 2 – Works NO (Negative Outcome)

No element from question A

Doctor talks to me, face to face… not just those phone calls with clinical message

Doctor explains to me WHY this medicine, and what should I DO

My friends explain this stuff to me… I’m more comfortable with them

Doctor guides me to the Internet sites… so I CAN TAKE CONTROL

A0

A1

A2

A3

A4

Additive Constant

37

21

23

27

31

C3

I really am happy when someone takes control, and tells me what to take, and schedules my meds for me

9

1

7

8

7

C2

My family and others butt-in to my health… I want my privacy

6

4

4

5

5

C1

My family is always there to listen, and support me… I like that

5

3

0

-2

-1

B2

I don’t feel like going to the doctor… even for the most severe symptoms… I can take care of it

4

7

7

16

13

D3

I reserve my friends for non-medical talks, like politics, or people

2

2

6

-4

-6

D4

My friends really are there to listen to me about my medical experience – sometimes I feel I’m wearing out my welcome

2

8

2

-2

-4

C4

I’m pretty private… my health meds are my business… and maybe the doctor’s, but that’s all

0

0

1

7

-8

B1

I’m pretty private about my health… no one’s business

-5

0

7

12

9

D1

My family means the world to me

-6

2

-2

-17

-9

D2

I reach out to talk to friends about my health and illness

-8

8

0

-3

-8

B3

When it comes to illness, I’m on Google, so I really become an expert

-9

-3

4

9

8

B4

I’m nervous about health – but really want to be healthy to see my kids, grandkids, or even relatives and friends in the years to come

-11

-6

-2

8

-6

  1. Identify the variable to be held constant. In our study, this is Question A: How would you like your doctor to discuss your health with you?
  2. In our 4×4 design (four questions, four answers per question), Question A has five alternatives, comprising the four answers and the ‘no answer’ option wherein Question A does not contribute to a vignette.
  3. We sort the full set of 2400 records, one record per vignette per respondent, based upon the specific answer. This step ‘stratifies’ the database, into five strata, one stratum for each answer. One stratum comprises those vignettes without an answer to Question A.
  4. We then run the OLS regression on each stratum, but do not use A1-A4 as independent variables since they are held constant in a stratum.
  5. The coefficients tell us the contribution of each element to WORKS YES, for a specific answer.
  6. Thus, when we have A0, we deal with no answer from Question A.
  7. The additive constant is 28, meaning that for these vignettes we are likely to get only 28% positive response (works for ME, rating 4–5).The additive constant, 28, is probably the lowest level we will reach in basic response.
  8. Three very strong performing answers emerge. These are likely to lead to strong positive feelings, even starting from the low baseline of 28

    I’m nervous about health – but really want to be healthy to see my kids, grandkids, or even relatives and friends in the years to come

    My family means the world to me

    I’m pretty private… my health meds are my business… and maybe the doctor’s, but that’s all

  9. Now let us move to the strongest performing answer, A1: Doctor talks to me, face to face… not just those phone calls with clinical message. When this answer is the keystone of the vignette, the additive constant jumps up to 53. That means that in the absence of anything else, just knowing that message increases the frequency of positive answers 4–5 on the 5-point scale, namely Works YES
  10. When we combine this strong basic idea presented in A1 with the two answers or elements below, we end up with an additional 10% to 12% positive responses.

    When it comes to illness, I’m on Google, so I really become an expert

    I’m nervous about health – but really want to be healthy to see my kids, grandkids, or even relatives and friends in the years to come

  11. When we run the scenario analysis looking at the Works NO (a negative outcome), we see that without any element from question A, the additive constant is highest (37), and then decreases as the doctor becomes increasing involved. When the doctor talks with the respondent, the additive constant is lowest (A1 = face to face = additive constant 21; A2 = doctor explains = additive constant 23.)

    The most negative elements come from interactions where either the friends explain the medical material, or the doctor guides the respondent to the internet, allowing the respondent to take control.

  12. Response time. We can perform the same scenario analysis. This time, however, we eliminate the condition where an answer to A does not appear (A0). Table 6 shows the dramatic effects of interaction. The response time changes depending upon the specific element from question A about how the respondent wants to get information. A dramatic example comes from answer A1 (doctor talks to me face to face…). When A1 is paired with B1 (I’m pretty private about my health … no one’s business) the response time for element B1 is 3.0 seconds. When A4 (Doctor guides me to the internet sites…) is paired with B1, the response time for element B1 is just about half, 1.4 seconds.

Table 6. Scenario analysis, revealing pairwise Interactions to drive response time


Doctor talks to me, face to face… not just those phone calls with clinical message

Doctor explains to me WHY this medicine, and what should I DO

My friends explain this stuff to me… I’m more comfortable with them

Doctor guides me to the Internet sites… so I CAN TAKE CONTROL

A1

A2

A3

A4

B1

I’m pretty private about my health… no one’s business

3.0

2.1

2.2

1.4

B3

When it comes to illness, I’m on Google, so I really become an expert

2.6

2.3

2.2

1.8

C1

My family is always there to listen, and support me… I like that

2.5

1.4

1.6

2.3

B4

I’m nervous about health – but really want to be healthy to see my kids, grandkids, or even relatives and friends in the years to come

2.3

2.0

2.3

1.3

D4

My friends really are there to listen to me about my medical experience – sometimes I feel I’m wearing out my welcome

1.2

2.4

2.0

2.5

B2

I don’t feel like going to the doctor… even for the most severe symptoms… I can take care of it

2.2

1.8

2.5

1.4

C3

I really am happy when someone takes control, and tells me what to take, and schedules my meds for me

2.0

1.6

2.0

2.6

C2

My family and others butt-into my health… I want my privacy

1.5

1.8

1.7

2.4

D3

I reserve my friends for non-medical talks, like politics, or people

1.7

2.0

2.0

2.2

C4

I’m pretty private… my health meds are my business… and maybe the doctor’s, but that’s all

1.8

1.5

1.8

2.0

D1

My family means the world to me

1.7

1.9

1.6

2.0

D2

I reach out to talk to friends about my health and illness

1.2

2.0

1.7

1.8

It is clear from Table 6 that there is cognitive processing occurring, with the data suggesting that mutually contradictory elements, in terms of implications, the respond processes the information, attempting to resolve these contradictory elements.

Responses from Key Subgroups

Positive Outcome (Works YES): Table 7 presents the performance of the elements by key subgroups, comprising gender, age, and stated concern about their health. In the interest of easing the inspection, we present only those elements which score well with at least one of the key subgroups.

Table 7. Performance of the answers/elements by key subgroup for the criterion ofWorks YES. Only strong performing elements for at least one subgroup are shown

Top 2 – Works YES

Male

Female

Age 18–30

Age 31–49

FW 50+

Don’t think

Healthy

Concerned

Additive Constant

45

42

29

58

33

26

48

43

A1

Doctor talks to me, face to face… not just those phone calls with clinical message

5

10

7

4

12

17

-3

16

A2

Doctor explains to me WHY this medicine, and what should I DO

9

1

2

7

4

6

2

7

A3

My friends explain this stuff to me… I’m more comfortable with them

0

-3

1

3

-6

17

-6

0

A4

Doctor guides me to the Internet sites… so I CAN TAKE CONTROL

2

-2

3

4

-2

22

-4

2

B3

When it comes to illness, I’m on Google, so I really become an expert

-4

3

2

-2

-1

9

-1

-2

B4

I’m nervous about health – but really want to be healthy to see my kids, grandkids, or even relatives and friends in the years to come

3

8

10

1

8

-1

1

11

D1

My family means the world to me

4

8

3

-1

16

1

4

8

D4

My friends really are there to listen to me about my medical experience – sometimes I feel I’m wearing out my welcome

4

-2

13

-4

-2

5

0

1

The key differences emerge from the additive constants and a few elements, only. Most respondents are positive. The least positives are two groups; those age 18–30 (additive constant = 29) and those age 50+ (additive constant 33) and those not concerned with their health (additive constant = 26). The only groups which surprises are those age 50+.

Looking across subgroups, we find two messages which appear to do well on a consistent basis

Doctor talks to me, face to face… not just those phone calls with clinical message

But really want to be healthy to see my kids, grandkids, or even relatives and friends in the years to come

Looking down, within a subgroup, we find some patterns which strongly resonate, and are meaningful when we think about the needs and wants of the subgroup.

Those age 50+

I’m nervous about health – but really want to be healthy to see my kids, grandkids, or even relatives and friends in the years to come

My family means the world to me

Those who classify themselves as not concerned

Doctor talks to me, face to face… not just those phone calls with clinical message

My friends explain this stuff to me… I’m more comfortable with them

Doctor guides me to the Internet sites… so I CAN TAKE CONTROL

When it comes to illness, I’m on Google, so I really become an expert

When we perform the same analysis, this time for the lower part of the scale (Works NO), where ratings 1–2 were assigned 100, and ratings 3–5 were assigned 0, we find a different pattern. We again present only those elements which score strongly among at least one of the subgroups.

When we look at the key subgroups, we find that most of the groups begin with a low additive constant, which means that they feel these messages will not do any harm. The two groups which surprise are those who are age 50+ (additive constant = 44) and those who say that they are concerned about their health (additive constant = 48.)The likelihood is probably their fear that the ‘wrong’ thing could exacerbate a problem. In contrast those who are age 31–49 show a very low additive constant (12), as do those who classify themselves as health (additive constant = 18).

The additive constant provides only part of the story. Some of the elements drive a perception of poor outcomes, especially those who call themselves healthy. A pleasant surprise is that the elements which these self-described healthy respondents feel to lead to a bad outcome are those which talk about avoiding the medical establishment. That is, those who consider themselves health are already aware of good practices, and react negatively to poor practices, as shown by the high coefficients for this reversed scale.

I don’t feel like going to the doctor… even for the most severe symptoms… I can take care of it

I’m pretty private about my health… no one’s business

My friends explain this stuff to me… I’m more comfortable with them

Emergent Mind Sets Showing Different Patterns of What is Important

One of the ingoing premises of Mind Genomics is that within any topic area where people make decisions or have points of view there exist mind-sets, groups of ideas which ‘go together.’ Mind Genomics posits that at any specific time, a given individual will have only one of the several possible mind-sets, although over time, e.g., years or due to some unforeseen circumstance, one’s mind-set will change.

The metaphor for a mind-set it a mental genome. There is no limit to the number of such mental genomes, at least in terms of defining them by experiments. Virtually every topic can be broken down into smaller and smaller topics, and studied, from the very general to the most granular. In that respect, Mind Genomics differs from its namesake, Biological Genomics, which posits that there are a limited number of possible genes. In Mind Genomics, each topic area comprises a limited number of mind genomes, but there are uncountable topics.

The notion of mind-sets in the population, these so-called mind genomes, opens a variety of vistas. From the vantage point of psychology, the mind-genomes present the opportunity to study individual differences in the world of the everyday, and to systematize these differences, perhaps even finding ‘supersets’ of mind genomes which go across many different types of behavior. From the vantage point of biology, discovering mind-genomes holds the possibility of ‘correlating’ mind-genomes with actual genomes. And finally, from the vantage point of economics and commerce, discovering the pattern of a person’s mind genomes leads to better customer experience, and perhaps more responsiveness to suggestions about lifestyle modifications in the search for better health. The last is the focus of this study, the search for how to best communicate to people.

The process of uncovering mind genomes or mind-sets is empirical, modeling the relation between elements and responses (our Works YES model), clustering the respondents on the basis of the pattern of their coefficients, and finally extracting clusters which are few in number (parsimony), and which are coherent and meaningful, telling a ‘simple story’ (interpretability).Clustering has become a standard method in exploratory data analysis (e.g., Dubes & Jain, 1980.)

The approach to creating these mind-sets has already been documented extensively in [25–30]. It is vital to keep in mind that modeling and clustering is virtually automatic and intellectual agnostic. It takes a researcher to determine whether the clusters, the so-called mind-sets, really make sense when interpreted. There is no way for the clustering algorithm to easily interpret the meaning of the clusters other than perhaps doing a word count. The involvement of the research is vital, albeit not particularly taxing. The computer program does all the work.

The clustering based on the positive outcome models (Works YES) suggest three interpretable mind-sets, shown in Table 9 fop the positive outcome, Works YES, and in Table 10 for the negative outcome, Works NO. The names for the mind-sets were selected on the basis the elements which scored highest for the Works YES models. The mind-sets make sense (privacy seeker; doctor focus; control focus) for both the positive and the negative models (Works YES, Works NO), respectively. The clustering also parallels preliminary results from the aforementioned study run eight years before, in 2011(Moskowitz, unpublished), which suggested three similar three mind-sets of this type. It is important to note that these mind-sets are not ‘set in stone,’ but rather represent interpretable areas in what is more likely a continuum of preferences.

Table 9. Performance of the answers/elements by three emergent mind-sets for the criterion of Works YES

 Positive Outcome – Works YES
(Basis for the mind-set segmentation)

MS3 Privacy-seeker

MS2 Doctor focus

MS1 Control focus

Additive constant

45

50

34

C4

I’m pretty private… my health meds are my business… and maybe the doctor’s, but that’s all

15

-1

-13

A1

Doctor talks to me, face to face… not just those phone calls with clinical message

-7

15

16

A2

Doctor explains to me WHY this medicine, and what should I DO

-11

11

16

A4

Doctor guides me to the Internet sites… so I CAN TAKE CONTROL

-15

11

8

D1

My family means the world to me

-5

10

15

B4

I’m nervous about health – but really want to be healthy to see my kids, grandkids, or even relatives and friends in the years to come

3

2

14

D4

My friends really are there to listen to me about my medical experience – sometimes I feel I’m wearing out my welcome

-9

5

9

D2

I reach out to talk to friends about my health and illness

-11

-3

8

B3

When it comes to illness, I’m on Google, so I really become an expert

5

-16

8

A3

My friends explain this stuff to me… I’m more comfortable with them

-16

6

7

B1

I’m pretty private about my health… no one’s business

5

-19

5

D3

I reserve my friends for non-medical talks, like politics, or people

-2

-8

3

B2

I don’t feel like going to the doctor… even for the most severe symptoms… I can take care of it

5

-23

-6

C3

I really am happy when someone takes control, and tells me what to take, and schedules my meds for me

0

-3

-12

C1

My family is always there to listen, and support me… I like that

4

7

-14

C2

My family and others butt-in to my health… I want my privacy

2

-2

-18

Table 10. Performance of the answers/elements by three emergent mind-sets for the criterion of Works NO

Negative Outcome – Works NO

MS3 Privacy-focus

MS2 Doctor focus

MS1 Control focus

Additive constant

24

34

31

A3

My friends explain this stuff to me… I’m more comfortable with them

16

-5

-11

D4

My friends really are there to listen to me about my medical experience – sometimes I feel I’m wearing out my welcome

11

-8

-1

A2

Doctor explains to me WHY this medicine, and what should I DO

10

-12

-12

A4

Doctor guides me to the Internet sites… so I CAN TAKE CONTROL

10

-9

-12

B2

I don’t feel like going to the doctor… even for the most severe symptoms… I can take care of it

8

12

13

C3

I really am happy when someone takes control, and tells me what to take, and schedules my meds for me

5

9

6

B1

I’m pretty private about my health… no one’s business

4

9

4

C4

I’m pretty private… my health meds are my business… and maybe the doctor’s, but that’s all

-9

1

9

C1

My family is always there to listen, and support me… I like that

0

-8

8

A1

Doctor talks to me, face to face… not just those phone calls with clinical message

2

-14

-12

B3

When it comes to illness, I’m on Google, so I really become an expert

5

7

-2

B4

I’m nervous about health – but really want to be healthy to see my kids, grandkids, or even relatives and friends in the years to come

-2

-1

-1

C2

My family and others butt-in to my health… I want my privacy

2

6

7

D1

My family means the world to me

-4

-8

-7

D2

I reach out to talk to friends about my health and illness

2

-2

-6

D3

I reserve my friends for non-medical talks, like politics, or people

-3

3

1

Response Time (engagement) – Key Subgroups: Table 11 shows us the differences in response time across the 16 elements. The data are repeated for the total panel, along with the estimated response times for each element by each key subgroup. The patterns differ by subgroup. Some of the key results are:

  1. Males focus for longer times about being an expert and wanting privacy.

    When it comes to illness, I’m on Google, so I really become an expert

    I’m pretty private about my health… no one’s business

  2. Females focus slight longer about most of the elements than do males. Two elements capture their attention, but do not capture the attention of males

    Doctor talks to me, face to face… not just those phone calls with clinical message

    My friends explain this stuff to me… I’m more comfortable with them

  3. The youngest respondents (age 18–30) focus on only one element

    My friends really are there to listen to me about my medical experience – sometimes I feel I’m wearing out my welcome

  4. The oldest respondents focus a lot more time than other respondents on the need for expertise and privacy

    When it comes to illness, I’m on Google, so I really become an expert

    I’m pretty private about my health… no one’s business

    My family and others butt-in to my health… I want my privacy

  5. Those who say they are not concerned focus a great deal on one element

    I don’t feel like going to the doctor… even for the most severe symptoms… I can take care of it

  6. Those who say they are healthy focus on

    When it comes to illness, I’m on Google, so I really become an expert

    I’m pretty private about my health… no one’s business

  7. Those say they are concerned about their health focus a great deal on two issues, opposites of each other

    My family and others butt-in to my health… I want my privacy

    I really am happy when someone takes control, and tells me what to take, and schedules my meds for me

  8. The privacy mind-set focuses on privacy, but also on the lack of privacy (someone else taking control). Keep in mind that this is response time, not a judgment. The respondents in this mind-set pay attention to the statement about someone else taking control, rather than just disregarding it.

    When it comes to illness, I’m on Google, so I really become an expert

    My family and others butt-in to my health… I want my privacy

    I’m pretty private about my health… no one’s business

    I really am happy when someone takes control, and tells me what to take, and schedules my meds for me

  9. The doctor mind-set actually spends more time on elements which do not agree with their mind-set and spend little time on elements dealing with the doctor. It is as if they are ‘wired’ to accept the information of the doctor but have to think about contravening data.

    My friends explain this stuff to me… I’m more comfortable with them

    When it comes to illness, I’m on Google, so I really become an expert

    My family and others butt-in to my health… I want my privacy

  10. The control mind-set focus on loss of control, again spending little time on elements which agree with their mind-setI really am happy when someone takes control, and tells me what to take, and schedules my meds for me

Table 8. Performance of the answers/elements by key subgroup for the criterion of Works NO. Only strong performing elements for at least one subgroup are shown


Bot 2 – Works NO

Male

Female

Age 18–30

Age 31–49

Age 50+

Don’t think

Healthy

Concerned

Additive Constant

29

30

34

12

44

32

18

38

A3

My friends explain this stuff to me… I’m more comfortable with them

2

-1

-2

2

0

-9

10

-7

B1

I’m pretty private about my health… no one’s business

4

6

2

10

2

1

12

1

B2

I don’t feel like going to the doctor… even for the most severe symptoms… I can take care of it

13

9

2

15

13

-4

14

10

B3

When it comes to illness, I’m on Google, so I really become an expert

3

4

4

7

-1

-7

8

1

B4

I’m nervous about health – but really want to be healthy to see my kids, grandkids, or even relatives and friends in the years to come

1

-3

-9

6

-4

0

9

-10

C3

I really am happy when someone takes control, and tells me what to take, and schedules my meds for me

4

9

6

6

10

-7

9

5

D1

My family means the world to me

-4

-8

-16

2

-10

10

-8

-5

D2

I reach out to talk to friends about my health and illness

-4

1

-7

1

-1

13

-1

-2

Table 11. Response times for elements, by total panel and key subgroups


total

Male

Female

A18–30

A31–49

50+

Not concerned

Healthy

Concern

Doctor focus

Control focus

B3

When it comes to illness, I’m on Google, so I really become an expert

1.8

1.7

1.9

1.4

1.6

2.1

2.2

1.9

1.6

1.9

1.6

B1

I’m pretty private about my health… no one’s business

1.7

1.7

1.7

1.5

1.3

2.2

1.6

2.0

1.5

1.8

1.5

C2

My family and others butt-in to my health… I want my privacy

1.7

1.4

2.0

1.4

1.7

2.0

1.3

1.4

2.0

1.4

1.8

C3

I really am happy when someone takes control, and tells me what to take, and schedules my meds for me

1.7

1.5

1.8

1.0

1.8

1.9

1.6

1.2

2.0

1.4

1.9

B2

I don’t feel like going to the doctor… even for the most severe symptoms… I can take care of it

1.6

1.4

1.7

1.2

1.5

1.8

2.6

1.7

1.3

1.9

1.2

B4

I’m nervous about health – but really want to be healthy to see my kids, grandkids, or even relatives and friends in the years to come

1.6

1.6

1.6

1.4

1.6

1.6

1.5

1.5

1.6

1.8

1.4

C1

My family is always there to listen, and support me… I like that

1.5

1.5

1.5

1.1

1.4

1.8

1.8

1.1

1.9

1.3

1.7

D4

My friends really are there to listen to me about my medical experience – sometimes I feel I’m wearing out my welcome

1.5

1.5

1.6

1.9

1.0

1.9

2.0

1.2

1.8

1.8

1.3

A4

Doctor guides me to the Internet sites… so I CAN TAKE CONTROL

1.4

1.2

1.6

1.1

1.3

1.7

-0.3

1.4

1.6

1.5

1.3

C4

I’m pretty private… my health meds are my business… and maybe the doctor’s, but that’s all

1.4

1.3

1.5

1.0

1.3

1.8

1.1

1.0

1.8

1.2

1.3

D3

I reserve my friends for non-medical talks, like politics, or people

1.4

1.4

1.4

1.4

1.1

1.8

1.7

1.4

1.4

1.7

1.1

A1

Doctor talks to me, face to face… not just those phone calls with clinical message

1.3

1.0

1.6

0.9

1.1

1.8

-0.2

1.3

1.5

1.3

1.4

A3

My friends explain this stuff to me… I’m more comfortable with them

1.3

1.0

1.7

1.0

1.4

1.5

0.6

1.2

1.5

2.0

1.0

D1

My family means the world to me

1.3

1.6

0.9

1.5

0.9

1.6

1.9

1.2

1.3

1.6

1.3

A2

Doctor explains to me WHY this medicine, and what should I DO

1.2

1.0

1.4

1.1

1.1

1.6

0.6

1.0

1.5

1.4

1.3

D2

I reach out to talk to friends about my health and illness

1.1

0.9

1.3

1.4

0.7

1.3

0.3

1.1

1.1

1.4

1.0

Identifying Sample Mindsets at the Clinic

The conventional wisdom in consumer research is that we can use a person’s demographics or psychographics to predict the mind-set to which the person belongs. The actual practice is to cluster people based upon their demographics, attitudes and/or behavior, arriving at a set of individuals who LOOK different by standard measures, and then to map these clusters to different ways of thinking about the same problem.

 The conventional approach occasionally works but fails to deal with the granularity of the situations having many aspects. The different aspects of a single topic, such as dealing with medical information, may generate a variety of different groups of mind-sets, depending upon the topic of medical information, whether that be simply informative, or prescriptive, and forth. Conventional research is simply too blunt an instrument to assign people to these different arrays of mind-sets, each of which emerges from different aspects of the same general problem. Once granularity becomes a factor in one’s knowledge, the standard methods no longer work, in light of the vastly increased sophistication of one’s knowledge about a topic.

An example of the difficulty of traditional methods to assign new people to the three mind-sets uncovered here can be sensed from Table 12, which shows the membership pattern in the three mind-sets by gender, by age, and by self-described concern with one’s health. The distributions are similar across the three mind-sets. One either needs much more data, from many other measured aspects of each person, or a different way to establish mind-set membership in this newly uncovered array of three mind-sets emerging from the granular topic of the way one wants to give and get medical information.

Table 12. Distribution of mind-set membership by gender, age, and self-described concern with one’s health

Privacy focus

Doctor focus

Control focus

Total

100

38

29

33


Male

51

18

16

17

Female

49

20

13

16


Age 18–30

21

11

5

5

Age w

39

14

12

13

Age 50+

37

12

11

14

Not answered

3

1

1

1


Healthy

44

20

12

12

Concerned

49

17

13

19

Never think about it

7

1

4

2

Discovering these three mind-sets in the population by a PVI (Personal Viewpoint Identifier)

The ideal situation in research is to discover a grouping of consumers, e.g., our three mind-sets, and then discover some easy-to-measure set of variables which, in concert, assign a person to a mind-set. With such an assignment rule it may be possible to scan a database of millions of people, and assign each person in the database to one of the empirically discovered mind-sets. That process may work, but the occasions are few and far between.

An alternative method uses the coefficients from the three mind-sets to create a typing tool, a set of questions with simple answers, so that the pattern of answers assigns a person to one of the three mind-sets. The method uses the coefficients for Works YES (Table 9), identifies the most discriminating patterns, and then simulates many thousands of data sets, perturbing each data set thousands of times. These data sets are, for each mind-set, the 16 coefficients and the additive constant. The process is a so-called Monte-Carlo simulation.

The actual PVI is available at the link below, as of this writing (summer, 2019).

http://pvi360.com/TypingToolPage.aspx?projectid=78&userid= 2018

Figure 1 shows the information collected from the respondent (classification), and Figure 2 shows the actual PVI questions. In practice they are randomized. Following the six questions, the patterns of answers to which assign a person to a mind-set, we see four additional questions that the respondent who is doing the typing can answer, to provide additional information.

Mind Genomics-026 - JCRM Journal_F1

Figure 1. The self-classification, completed at the start of the PVI

Mind Genomics-026 - JCRM Journal_F2Figure 2. The actual PVI showing the six PVI questions, and the four general questions below

Discussion and conclusions

This study identified mindsets regarding how the person would like to communicate with the physician the underlying goal being to increase adherence through proper communication. Communication messaging typically involves identifying a subgroup by common characteristics of its members and according the information to group members by these characteristics (Kreuter, Strecher& Glassman, 1999). The notion underlying this approach is that group members possess similar characteristics and, therefore, will be influenced by the same message. Similarly, in health communication, messaging may be customized to a subgroup, members of which share characteristics such as illness, health conditions and needs, etc. Individuals, however, are most persuaded by personally relevant communication and are more likely to pay attention and to process such information more thoroughly (Petty &Cacioppo, 2012).

Since fitting a message to meet personal needs of patients, rather than group criteria, is more effective for influencing attitudes and health behaviors, we suggest that to promote adherence, clinicians should tailor their messages to individuals. Sophisticated approaches to tailor communication aimed at changing complex health behaviors such as adherence, call upon clinicians to integrate detailed information into communication messages for each patient (Cantor &Kihlstrom, 2000).An advantage of such strategies for communication is that messages tailored to a patient do not need to be modified very often (Schmid, Rivers, Latimer &Salovey, 2008).

Our viewpoint enables clinicians to identify the sample mindset to which a patient in the population belongs, for a specific topic, i.e., granular. Messages about adherence and non-adherence should be congruent with those specifically strong elements for the mind-set to which the patient belongs for the particular topic. There are some messages which appear to be universal, such as the need of patients to have eye contact with the clinician. At the deeper level, the level of granular message; the data suggests three mind-sets, membership in which should be known to the physician and guide style of communication.

People belonging to the first mindset focus on privacy and expect their clinician to take control (e.g., tell me what to take, schedules my meds for me).

People belonging to the second mindset accept what the clinician advises them but spend time discussing it with other patients and enhancing their knowledge on Google. People in this mindset expect their clinician to carry a dialogue respecting the information they learned and their thoughts.

People belonging to the third mindset, need to have control. Aiming at behavioral changes and adherence promotion, clinicians might adopt communication with a tonality of process oriented, along with personal relevance for the patient.

Tailoring the message to the patient requires the clinician to assess each patient belonging to a mindset by asking the six questions according to our viewpoint identifier.

Acknowledgement

Attila Gere thanks the support of the Premium Postdoctoral Researcher Program of the Hungarian Academy of Sciences

References

  1. DiMatteo MR (2004) Variations in patients’ adherence to medical recommendations: a quantitative review of 50 years of research. MedicalCare 42: 200–209.
  2. Haskard-Zolnierek KB, DiMatteo MR (2009) Physician communication and patient adherence to treatment: a meta-analysis. Medical care 47: 826.
  3. Vermeire E, Hearnshaw H, Van Royen P (2001) Patient adherence to treatment: three decades of research, a comprehensive review. J Clin Pharm Ther26: 331–342.
  4. Zolnierek KB, DiMatteo MR(2009) Physician communication and patient adherence to treatment: a meta-analysis. Medical care 47: 826.]
  5. DiMatteo MR, Haskard KB, Williams SL (2007) Health beliefs, disease severity, and patient adherence: a meta-analysis. Medical Care45: 521–528.
  6. Sabate E (2003) Adherence to long-term therapies: Evidence for action. Geneva: World Health Organization.
  7. Gabay G, Moskowitz HR (2012)the algebra of health concerns: implications of consumer perception of health loss, illness and the breakdown of the health system on anxiety. International Journal of Consumer Studies36: 635–646.
  8. Gabay G (2015) Perceived control over health, communication and patient- physician trust. Patient Education and Counseling98: 1550–1557.
  9. Beck RS, Daughtridge R, Sloane PD (2002) Physician-patient communication in the primary care office: a systematic review. Journal of the American Board of Family Practice15: 25–38.
  10. Gabay G (2016) Exploring perceived control and self-rated health in re-admissions among younger adults: A retrospective Study. Patient Education and Counseling 99: 800–806.
  11. Osterberg L, Blaschke T (2005) Adherence to medication. N Engl J Med 353: 487–497.
  12. Chewning B, Sleath B (1996) Medication decision-making and management: a client-centered model. SocSci Med 42: 389–398.
  13. Squier RW (1990) A model of empathic understanding and adherence to treatment regimens in practitioner-patient relationships. SocSci Med 30: 325–339.
  14. Stewart MA (1984) what is a successful doctor-patient interview? A study of interactions and outcomes. SocSci Med 19: 67–175.
  15. DiMatteo MR, Haskard-Zolnierek KB, Martin LR (2012) Improving patient adherence: a three-factor model to guide practice. Health Psychology Review 1: 74–91.
  16. Haynes RB, Yao X, Degani A, Kripalani S, Garg A, et al.(2005) Interventions to enhance medication adherence. Cochrane Database Systematic Review 4
  17. Haynes R, Ackloo E, Sahota N, McDonald H, Yao X (2008) Interventions for enhancing medication adherence. Cochrane Database of Systematic Review 2: CD000011.
  18. Ratanawongsa N, Karter AJ, Parker MM, Lyles CR, Heisler M, et al. (2013Communication and medication refill adherence: the Diabetes Study of Northern California. JAMA internal medicine11: 173–210.
  19. Rosenthal R, Rosnow R (2007) Essentials of behavioral research: methods and data analysis. McGraw-Hill.
  20. Levinson W, Lesser CS, Epstein RM (2010) Developing physician communication skills for patient-centered care. Health affairs29: 1308–1310.
  21. Epstein RM, Street RL (2007) Patient-centered communication in cancer care: promoting healing and reducing suffering. National Cancer Institute.
  22. Brown RF, Butow PN, Dunn SM, Tattersall MH (2001) Promoting patient participation and shortening cancer consultations: a randomised trial. British Journal of Cancer 85: 1273.
  23. Tulsky JA (2005) Interventions to enhance communication among patients, providers, and families. Journal of palliative medicine 8: 95.
  24. Rao JK, Anderson LA, Inui TS (2007) Communication interventions make a difference in conversations between physicians and patients: a systematic review of the evidence. Med Care45: 340–349.
  25. Gabay G, Zemel G, Gere A, Zemel R, Papajorgji P, et al. (2018) On the threshold: What concerns healthy people about the prospect of cancer.Cancer Studies and Therapeutics Journal 3: 1–10.
  26. Gabay G, Gere A, Stanley J, Habsburg-Lothringen C, Moskowitz HR(2019) Health threats awareness – Responses to warning messages about cancer and smartphone Usage. Cancer Studies Therapy Journal4: 1–10.
  27. Gabay G, Gere A, Zemel G, Moskowitz D, Shifron R, et al. (2019) Expectations and attitudes regarding chronic pain control: An exploration using Mind Genomics. Internal Medicine Research Open Journal4: 1–10.
  28. Gabay G, Gere A, Moskowitz HR (2019) Uncovering communication messages for health promotion: The case of arthritis. Integrated Journal of Orthopedic Traumatology2: 1–13.
  29. Gabay G, Gere A, Moskowitz HR. (2019) Understanding effective web messaging – The Case of Menopause. Integrated Gynecology & Obstetrics Journal 2: 1–16.
  30. Gabay G, Gere A, Stanley J, Habsburg-Lothringen C, Moskowitz HR (2019) Health threats awareness – Responses to warning messages about Cancer and smartphone usage. Cancer Studies Therapeutics Journal4: 1–10.
  31. Gofman A, Moskowitz HR (2010) Isomorphic permuted experimental designs and their application in conjoint analysis. Journal of Sensory Studies 25: 127–45.
  32. Beck RS, Daughtridge R, Sloane PD (2002) Physician-patient communication in the primary care office: a systematic review. Journal of the American Board of Family Practice15: 25–38.
  33. Brown RF, Butow PN, Dunn SM, Tattersall MH (2001) Promoting patient participation and shortening cancer consultations: a randomised trial. British Journal of Cancer 85: 1273.
  34. Campbell, James D, Hans O, Mauksch, Helen J Neikirk, Hosokawa CM (1990) Collaborative practice and provider styles of delivering health care. Social Science & Medicine 30: 1359–1365.
  35. Cantor N, Kihlstrom JF (2000) Social intelligence. Handbook of intelligence 2: 359–379.
  36. Charlton CR, DearingKS, Berry JA, Johnson MJ (2008) Nurse practitioners’ communication styles and their impact on patient outcomes: an integrated literature review. Journal of the American Academy of Nurse Practitioners 20: 382–388.
  37. Chewning B, Sleath B (1996) Medication decision-making and management: a client-centered model. SocSci Med42: 389–398.
  38. Coeling, Van EH, Cukr PR (2000) Communication styles that promote perceptions of collaboration, quality, and nurse satisfaction. Journal of Nursing Care Quality14: 63–74.
  39. DiMatteo MR (2004) Variations in patients’ adherence to medical recommendations: a quantitative review of 50 years of research. MedicalCare 42: 200–209.
  40. DiMatteo MR, Haskard KB, Williams SL (2007) Health beliefs, disease severity, and patient adherence: a meta-analysis. Medical Care 45: 521–528.
  41. DiMatteo MR, Haskard-Zolnierek KB, Martin LR (2012) Improving patient adherence: a three-factor model to guide practice. Health Psychology Review 1: 74–91.
  42. Dubes R, Jain AK (1980) Clustering methodologies in exploratory data analysis. In Advances in Computers 1: 13–228.
  43. Epstein RM, Street RL (2007) Patient-centered communication in cancer care: promoting healing and reducing suffering. National Cancer Institute
  44. Gabay G (2015) Perceived control over health, communication and patient- physician trust. Patient Education and Counseling98: 1550–1557.
  45. Gabay G (2016) Exploring perceived control and self-rated health in re-admissions among younger adults: A retrospective Study. Patient Education and Counseling 99: 800–806.
  46. Gabay G, Moskowitz HR (2012)the algebra of health concerns: implications of consumer perception of health loss, illness and the breakdown of the health system on anxiety. International Journal of Consumer Studies36: 635–646.
  47. Gabay G, Zemel G, Gere A, Zemel R, Papajorgji P, et al. (2018) On the threshold: What concerns healthy people about the prospect of cancer.Cancer Studies and Therapeutics Journal 3: 1–10.
  48. Gabay G, Gere A, Stanley J, Habsburg-Lothringen C, Moskowitz HR(2019) Health threats awareness – Responses to warning messages about cancer and smartphone Usage. Cancer Studies Therapy Journal4: 1–10.
  49. Gabay G, Gere A, Zemel G, Moskowitz D, Shifron R, et al. (2019) Expectations and attitudes regarding chronic pain control: An exploration using Mind Genomics. Internal Medicine Research Open Journal4: 1–10.
  50. Gabay G, Gere A, Moskowitz HR (2019) Uncovering communication messages for health promotion: The case of arthritis. Integrated Journal of Orthopedic Traumatology2: 1–13.
  51. Gabay G, Gere A, Moskowitz HR. (2019) Understanding effective web messaging – The Case of Menopause. Integrated Gynecology & Obstetrics Journal 2: 1–16.
  52. Gabay G, Gere A, Stanley J, Habsburg-Lothringen C, Moskowitz HR (2019) Health threats awareness – Responses to warning messages about Cancer and smartphone usage. Cancer Studies Therapeutics Journal4: 1–10.
  53. Gofman A, Moskowitz HR (2010) Isomorphic permuted experimental designs and their application in conjoint analysis. Journal of Sensory Studies 25: 127–45.
  54. Haskard-Zolnierek KB, DiMatteo MR (2009) Physician communication and patient adherence to treatment: a meta-analysis. Medical care 47: 826.
  55. Haynes R, Ackloo E, Sahota N, McDonald H, Yao X (2008) Interventions for enhancing medication adherence. Cochrane Database of Systematic Review 2: CD000011.
  56. Haynes RB, Yao X, Degani A, Kripalani S, Garg A, et al.(2005) Interventions to enhance medication adherence. Cochrane Database Systematic Review 4
  57. Kreuter MW, Strecher VJ, Glassman B (1999) One size does not fit all: the case for tailoring print materials. Annals of behavioral medicine 21: 276.
  58. Levinson W, Lesser CS, Epstein RM (2010) Developing physician communication skills for patient-centered care. Health affairs 29: 1308–1310.
  59. Osterberg L, Blaschke T (2005) Adherence to medication. N Engl J. Med 353: 487–497.
  60. Petty RE, Cacioppo JT(2012) Communication and persuasion: Central and peripheral routes to attitude change. Springer Science & Business Media 6.
  61. Ratanawongsa N, Karter AJ, Parker MM, Lyles CR, Heisler M, et al. (2013) Communication and medication refill adherence: the Diabetes Study of Northern California. JAMA internal medicine 11: 173–210.
  62. Rao JK, Anderson LA, Inui TS (2007) Communication interventions make a difference in conversations between physicians and patients: a systematic review of the evidence. Med Care 45: 340–349.
  63. Rosenthal R, Rosnow R (2007) Essentials of behavioral research: methods and data analysis. McGraw-Hill.
  64. Sabate E (2003) Adherence to long-term therapies: Evidence for action. Geneva: World Health Organization.
  65. Schmid KL, Rivers SE, Latimer AE, Salove P (2008) Targeting or tailoring?. Marketing health services 28: 32–37.
  66. Squier RW (1990) A model of empathic understanding and adherence to treatment regimens in practitioner-patient relationships. SocSci Med 30: 325–339.
  67. Stewart MA (1984) what is a successful doctor-patient interview? A study of interactions and outcomes. SocSci Med 19: 67–175.
  68. Tulsky JA (2005) Interventions to enhance communication among patients, providers, and families. Journal of palliative medicine 8: 95.
  69. Vermeire E, Hearnshaw H, Van Royen P (2001) Patient adherence to treatment: three decades of research, a comprehensive review. J Clin Pharm Ther26: 331–342.
  70. Williams-Piehota P, Schneider TR, Pizarro J, Mowad L, Salovey P (2003) Matching health messages to information-processing styles: Need for cognition and mammography utilization. Health Communication15: 375–392.
  71. Zolnierek KB, DiMatteo MR(2009) Physician communication and patient adherence to treatment: a meta-analysis. Medical care 47: 826.

Vegetation in Semi-Arid Areas as a Direct Meso and Macro Climatic Factor: First Evidence of Duplicate Climate Protective Effect of Large Scale Afforestation?

Abstract

Management of climate via vegetation mainly focuses on the CO₂ sequestration activity of plants. Ecologists and Meteorologists so far agree that vegetation has an impact on micro and meso climatic level. Settlement of new vegetation on bare steppe ground over thousands of square km created within short time as seen in a “Great Green Wall” (GGW) – this still is a “new” engineering event, climatic evaluation of greening of entire regions is only starting. Large scale vegetation in semi-arid areas may have a role as direct meso – and macro climatic factor, developing over decades. Discrepant results are found in simulation models (afforestation related risk of heat in same or neighboring region) versus biophysical analysis of satellite data (warming effect of deforestation in dry climate). In trying to explain this discrepancy the reported effects of large scale afforestation in the Chinese GGW on regional and continental climate are reviewed, as reported for model regions sized a few thousand square km. Long term data showing a mitigating effect on wind, temperature and dryness, an important function of trees in breaking hot dry desert wind, a change to moderately humid climate and the critical minimum density of tree cover are reported. Potential errors underlying the simulation models are being discussed. We derive that the first signs of a potential direct meso and macroclimatic effect of additional vegetation in dry semi-arid and arid areas may become visible in the Chinese GGW, which would mean a duplicate climate mitigating effect here. As more and more afforestation areas of this GGW are established this effect is expected to develop in even larger regions during the next two decades.

Keywords

semi-arid, macro climatic, afforestation, CO₂ independent, climate protection, Great Green Wall

Introduction

There is an increasing interest in managing climate, globally. The topic of managing global climate by means of additional vegetation so far is focused mainly on the CO₂ sequestration activity of plants. Natural climate solution projects are aiming to gain a maximum amount of CO₂ fixation, therefore plantation projects were started preferably in regions where high amount of CO₂ can be sequestered within short time, ie where fast growth of trees is supported by humidity of the local climate. The direct climatic impact of vegetation observed in hot dry regions is: breaking of hot desert winds, cooling effect via evapotranspiration and shadow, increasing water storage capacity of the ground, introduction of a hydrate cycle, etc. Ecologists and Meteorologists agree in that direct effects of vegetation can be demonstrated on micro and meso climatic level. The reason for limiting it to a local and regional scale possibly is because the settlement of new tree vegetation over ten thousands of square km, developing, e.g. on bare steppe ground within short time as seen in the “Great Green Walls” (GGW)– this rarely happened before in human history, so there was no opportunity to observe a macro climatic impact. If afforestation of a huge area with desert-like climate and formerly very sparse vegetation has an impact on climate – how long would it take for such new „savannah plantation“ to really show an impact on the dominating semi-arid (almost desert like) climate?

Evidence of such effects of vegetation so far can only be shown indirectly from analysing the meteorological outcome of large scale deforestation, which is leading to weather extremes. If taking place on several continents at the same time (as is the case with tropical forests) such deforestations are expected to bear risk of global temperature rise [1]. Climatic evaluation of the newly existing large scale GGW in Northern China is only starting [2, 3]. This “North Shelterbelt Development Program” was built on the Southern edges of the Gobi and Taklamakan deserts, predominantly in semi-arid climate, an area measuring up to 4,800 km from West to East.

The oldest GGW was started in the early 1970s in Algeria (1,500 km), and the so far largest GGW is planned since 2005 in the South (Sahel) and North of the Sahara Desert. Today the idea is to create a network of vegetation areas over a territory of more than 7,500 km from coast to coast across the North African continent. It is coordinated by the African Union Commission [4, 5]. New large scale afforestation in hot dry climate needs several decades to get established, vegetation here may directly reduce ground temperature, cause regularity of precipitation and humidity of soil and air. Additional evidence of trees and shrubs in semi-arid areas to have a possible cooling effect on surface temperature is coming from the biophysical investigation of vegetation changes on the energy balance in a global context [6]. On the other hand, two studies simulating the impact of large scale afforestation in semi-arid climate are reviewed here which are finding a risk of surface temperature warming in the planted area or the neighboring regions. The warming trend typically found in simulations is connected to the expected changes in albedo. To better understand the discrepant finding I will review the first long-term real life climate data published for the Chinese GGW.

Review

Afforestation in dry climate – Biophysical analysis and Simulation models

Only recently it has become possible to evaluate the effects of vegetation changes on the energy balance in a global context by means of satellite data analysis. Duveiller et al. [6] have shown that the conversion of forests into grassland or agricultural land in dry climate will lead to rise in mean land surface temperatures. The local effects of vegetation loss or land degradation are an increase in the reflected portion of the short wave radiation, and this was most significant in dry climate regions. The resulting emitted long wave radiation is higher in dry regions and lower in northern latitudes. In addition, vegetation loss will lead to strongly reduced latent heat stream, particularly in tropical climate.

„The type of vegetation covering the landscape has a direct influence on local climate through its control of water and energy fluxes. The albedo (brightness) of the vegetation cover will determine how much energy is reflected back into space as shortwave radiation. Its roughness determines how much mixing of air occurs between the atmosphere and the vegetation canopy. The depth and structure of its rooting system can determine how much soil moisture and groundwater might be tapped and thus how much heat can be dissipated through evapotranspiration or latent heat flux. The balance of all these surface properties determines the direct influence of vegetation on the surface energy budget and ultimately on the local temperature” [7]. It therefore seems that changes in surface properties resulting in reduced number of trees in regions with dry and warm climate can lead to a local warming effect. Can we derive from this finding that, vice versa plantation of trees on bare ground in dry climate will have a cooling effect on surface temperatures? The albedo changing effect of vegetation cover is a strong factor in current climate simulation models. Typically, these models are finding that albedo will be reduced by vegetation, i.e. in comparison with the highly reflective bare ground of steppe or desert, the reduced reflection of sun heat radiation will lead to warming of surface temperature via the non-reflected portion absorbed by vegetation.

Simulation of a Western African GGW [8] has investigated how a seamless vegetation cover with evergreen broad leafed plants in a several hundred km wide area (here called „Savannah“) in the South of the Sahel would impact the number of days with extreme hot temperature, since heat waves are becoming more frequent in some areas of the world and they could as well become a risk for man and agriculture here in the South of the Sahel. The simulation is finding that indeed the number of days with extremely hot temperature will increase over the Savannah region, whereas temperature reduction will be found in the „Guinea“ region in the South along the Ivory Coast and in the Sahel region in the North. The increase in days with hot temperature in the afforested „Savannah“ region would predominantly occur during the dry season. At the end of this article it is stated that further analysis work is needed due to some uncertainty factors in order to come to more robust conclusions but that afforestation would lead to increased risk of heat waves in the „Savannah“ and a reduced risk for regions of comparable size in the North and South of it. Another investigation has been conducted to simulate afforestation in the East of South Africa [9], and the results are similar: In the simulated scenario afforestation would lead to reduced albedo and an increase in surface temperature over the plantation area, as well as a certain cooling effect on the neighbouring regions. Some areas would become more dry, other areas of South Africa may get more precipitation than before. Therefore, afforestation could lead to unfavourable changes in local climate in unpredictable areas, which is why besides the positive biogeochemical impact of large scale afforestation also its possible biophysical effects needed to be considered. In trying to overcome the dilemma of the conflicting results, I will review the first real life climate data published for the world´s largest GGW in China, separated by their potential regional (meso climatic) and continental (macro climatic) effects.

Examples of direct meso climatic effects of vegetation in semi-arid climate

The Chinese state and part of its population have been tackling the “Northern Shelter Belt” project since the 1970’s by planting a reported 66 billion trees along the roads, ditches, ponds, and cultivated land ridges, with the aim of a total of 100 billion trees and shrubs planted by 2050.Today these activities are supported by increasingly sophisticated technology resulting in the (re-) greening of steppes and even sand deserts in a gigantic large scale, on an area of 4,800 x 1,500 km. By 2050 these measures are hoped to improve soil degradation on 40% of China´s total area [2, 3].  A detailed case study by Zhuang et al. [10] published in 2017 is based on long-term data from a ”show case“ region of 152,000 hectars (an area of about 50 x 30 km) in Northern Jiangsu. Some 132,600 hectares of the total ground had been desertified until the early 1950´s when afforestation with millions of trees was started here as one of the first regions in the fight against desertification. It is not reported but the proximity to the Yellow River may have made afforestation easier. A marked improvement of the regional climate data is reported: air humidity has increased, the number of days with dust winds is decreased and the formerly steppe landscape was transformed into a green patchwork of forests and agriculture. Reliable publications of detailed afforestation related climate parameters are still rare, therefore the findings are presented in more detail.

The authors claim that today, “the formerly extremely severe climate along the old course of the Yellow River has been fundamentally changed. The improved quality of the regional environment is verified by the greatly increased productivity and welfare of the people. The saline alkali soil has been treated, along with poverty, transforming a beggar’s hometown into a modern region, famous as a producer of food, fruits, vegetables and wood.“ [10]. Regional climate data for the last 66 years were documented by the Fengxian Meteorological Bureau. Data are showing a reduction in strong wind days per year by 80%, reduction in maximum wind speed from 26 to 11 m/sec and reduction of the average wind speed over the ground by 90%. The forested area has been expanded within 60 years, starting from 3% in the 1950´s to 36.9% in the 2010´s. This would have transformed the long term trend of sand storms and desertification into more humid climate in which catastrophic droughts have become rare, despite the underlying global warming mega trend. The local climate has benefitted from reduced temperature extremes, reduced strength and frequency of sand storms and more days with fog.

Precipitation data before / after afforestation are not presented in this paper. However, from 1958 to 1980 the average relative humidity in June had been between 55 and 80%, then during the last 30 years it has varied from 78 to 90%. The increase in relative humidity possibly would result from an increase in evapotranspiration of trees and shrubs and on the other hand from the markedly reduced frequency of strong winds and decreased average yearly wind speed. The number of foggy days per year in this region is reported to have increased from 10 to 20 days (1958 -1971), to 18 to 35 days (1972 – 2000), and 35 to 45 days (2001 – 2013). Before 1960 there were 1 to 22 days with hot dry wind per year, this value has gone down to 0 to 6 (1981 – 2005) and 0 to 3 per year (2005 – 2013). This finding is interesting as it is showing an important impact of vegetation on hot dry desert wind that had caused extreme temperatures in the past – and it contradicts the expected role of a reduced albedo that is to be assumed for an increase in vegetation coverage by 33%. Today this feature of hot dry desert winds seems to have mostly gone and a reduced average wind speed is caused by the additional vegetation. In China, as in many other countries a recent trend of warming and increase in droughts is found, as shown for the period from 1982 to 2011 in [7]. Despite this fact, Zhuang et al report that the June average temperatures have remained constant over the last 60 years in this Northern Jiangsu region. Given the global warming trend (with a reported increase of about 1.5 degrees for China during the last three decades) this arguably may be considered a net decrease of surface temperature.

The authors conclude that, “with constant application of reforestation for 50 years, the regional climate in the old course of Yellow River has improved greatly, from its former long term status as a region of sandstorms and desertification, into a region that can be considered as being intermediate between mesic and humid in weather, and with few natural disasters. Sandstorms, dry-hot wind and saline alkali soil have been eliminated at the root source, along with poverty of the local population.”[10]. The authors propose that, “even though a single or several plots of trees might be net consumers of water in arid and half arid region, millions of trees may have a ‘‘mass effect function on improving regional climate.’’

Furthermore, based on long term climate data a „critical mass“, i.e. a minimum number of trees per area required to find measurable climatic effects of vegetation was discovered. In the hostile semi-arid basic climate a reported 16% and higher tree coverage had led to the moderately sub humid conditions observed today. Less marked results so far are reported in another example. The arid Kubuqi desert is located in the Ordos prefecture of Inner Mongolia, an Autonomous Region in the Northwest of China. Here, a total area of almost 6,000 square km of sand desert has been greened. This achievement was sponsored by a private ecology and investment company, Elion Research Ltd. since 1988 [11, 12]. “Emerging private enterprises such as Elion have played an important role in desertification control and governance in the Kubuqi Desert with the support of local government in terms of policies, planning, and infrastructure construction” [12]. Along the south bank of the Yellow River, Elion has established shelter forest in a belt of 242 km length and 5 to 20 km wide, consisting of trees, bushes and grass. Kubuqi has a temperate continental arid monsoon climate (Köppen class BWk, desert climate), with a long cold winter and warm short summer. January is the coldest month with average of –11.7ºC, July is the hottest month with average of 22.1ºC [12].

In a newspaper article precipitation is reported to have increased during the last 30 years from 100 mm to more than 400 mm in 2018 in this part of the desert [11]. However, there is a constant risk for such reports to originate from biased source. A reliable report including meteorological long term data published by the United Nations (UNEP) in 2015 [12] has found only around 10 % increase in precipitation. The shape of the main tree plantation area is a stretched, rather narrow belt. Evapotranspiration is reported to be generally low due to the low temperatures in autumn and winter. Precipitation results published in [12] are between 260 and 280 mm from the 1960´s to the 2000´s, and 310 mm for the 2010´s decade.

As to sand storms, the UNEP report concludes: “The Kubuqi Project area displays a consistent greening trend that could have caused a decrease in dust storms. This is supported by evidence from the meteorological records at Hangjin Qi which indicated that the number of sandstorm days per year decreased dramatically after the 1970s. Although the decreasing trend was evident before the Kubuqi Project started it has continued until now.”

Days of sandstorm per year until 1985 was between 10 and 50, and since then has decreased to 0 to 8 days.

Annual air temperatures recorded at Hangjin Qi station seems to follow the continental trend as given in [7].

The UNEP report identifies a risk typical for large scale afforestation in semi-arid areas: “While there is currently some risk of overuse of the water table, that is… mitigated by the fact that high water use species, such as non-native vegetables and trees, are only a portion of the developed area, the remainder being mostly plants native to desert areas.” The report recommends “a thorough assessment of water resources before extending to new areas so that the risk of water table depletion can be managed in terms of planting the appropriate species at suitable densities for the local hydrological conditions” [12]. In summary, in both example regions which may belong to the most advanced areas of the Chinese GGW, a reduction in sand storms and events of strong wind can be found following afforestation. In addition, for Jiangsu region an increase in air humidity and constant temperatures over the last 6 decades are found which on basis of global warming trend could indicate a slight cooling effect resulting from afforestation. This may be evidence of direct effects of afforestation on meso climatic level, leading to mitigation of dryness, heat, wind and sand storms in semi-arid and arid climate. Regional transformation from semi-arid to now moderately humid climate was reported.

Direct macro climatic effect of vegetation

During the last three decades, increased drought severity has led to loss of biomass in China, particularly around the year 2000 [7]. This trend clearly will have impacted the Chinese GGW afforestation efforts but plantations may have recovered since then. However, significant increase of forested area in Northern China also has been confirmed for other regions of the GGW. In a study published in 2013 the forested area in the district of Yulin (Shaanxi province) was analysed by mapping afforestation and deforestation from 1974 to 2012. Here, the forested area grew from 14.8% (380,394 hectares) in 1974 to 43.9% (1,128,380 hectares) in 2010. This was determined in a validated evaluation of time series stacks taken by Landsat satellite [13]. The semi-arid continental climate here has an average annual precipitation as low as 400 mm, falling mostly in the hot months of July and August.

In the last century sand and dust from the Gobi and Taklamakan deserts have been reported to be blown over thousands of km, leading to regular heavy air pollution in the capital of Beijing, and even causing coloration of rain and surfaces in Korea and Japan. These dust storm events, so called “Yellow dragon”, probably have been worsened in the last century by deforestations and over use of vegetation and ground water in the climatically sensitive semi-arid Northern territories of China, thereby leading to desertification of wide areas. A publication of Feng Wan et al. (2013) is showing that the frequency of sand storms of different strength in China indeed has gone down since 1954. According to this study, until 2010 the last strong sand storm in Beijing has been registered in 1995 [2]. The reduction of these events has been connected by local meteorologists to the large scale fixation of sand dunes and steppes of Northern and Northwest China. Evidence is given in a study (2015) of time trends in vegetation index in the GGW region, showing that, when compared with adjacent regions the GGW has improved the vegetation index and effectively reduced dust storm intensity (frequency, visibility, duration) in Northern China [14]. The Normalized Vegetation Difference Index (NDVI) is a measure of green vegetation cover from satellite imagery. For this parameter time trends were analyzed together with rainfall and dust storm data from weather stations. An index of dust storm intensity was deployed that takes frequency, visibility, and duration of dust storm events into account. The study found that NDVI was not related to rainfall trends, whereas dust storm intensity was decreased, resulting from increase in NDVI.

An investigation published by the same author in 2016 [15] has analysed air pollution data as generated by 186 observational stations across China. Average NDVI values in the 20-km radius of the 186 stations for six selected years in the period from 1983 to 2003 were analysed. Tan concludes that sand storms and dust storm intensity had decreased markedly during this time period in the area of the GGW and that in parallel the vegetation had recovered here. Thus, reduction in sand and dust storm events seems to be the first and most obvious climatic change introduced by afforestation. It is mentioned in all studies on the subject and noticed on regional as well as on continental level.

Discussion

The biophysical analysis of satellite derived data by Duveiller et al. [6] is showing that in dry climate, when compared to any other form of vegetation, forests have a cooling effect on surface temperature. This finding is surprising and it may necessitate a correction of the existing albedo simulation models for this climate zone. The review of simulation results in contrast suggests that afforestation of steppes and desert bordering areas may lead to a rise in surface temperature and risk of extreme hot temperatures in the same or neighbouring regions.

The West African simulation study [8] is mentioning uncertainty factors to be considered, e.g., choice of simulation model, and definition of extreme heat. At least for the vegetation found naturally in this climate it is fair to say that it would not show dark green colour throughout the year: Leaves and bark of sclerophylls often show bright wax cover, white „hair“, spines, prickles or thorns reflecting the sun light, thereby protecting them from UV radiation. In the typical savannah landscape trees are not standing very close and the grass in between will show light yellow colour during the hot dry season, i.e. for 7 to 9 months of the year. During this time fresh green leaves will dry out and fall off, they typically do not exist on the local species during most of the year. Therefore it seems doubtful whether the standard used here (“evergreen broad leafed plants“) can be applied to simulations of semi-arid conditions. Any existing or newly developed savannah vegetation cover that is adapted to this climate would probably not present dark green colour during dry season thus have a lower effect on albedo most time of the year.

With more and more simulations and investigations being undertaken to analyse the climatic impact of trees and forests scientists are now heavily discussing the overall net contribution of afforestation on global warming. In this situation it may help to search for afforestation related real life (semi-arid) climate data. The dilemma being that for such experiment we would need 1. about 50 years of time to establish tree vegetation cover in semi-arid area, 2. perfect baseline regional climate data and 3. to come to a reliable conclusion the temperature rise of global warming trend over these decades is to be taken into account. Afforestation in the Chinese example areas more or less is those 50 years ahead. By using long term climate data collected in one and the same meteorological station an interesting regulation mechanism was found that may not be as predominant in simulation models [10]. In the Jiangsu region, an actual tree coverage as high as 36% (starting from 3%) led to significantly reduced wind speed so that days of hot dry desert wind and extreme temperature in this region are almost gone. Where did the heat go, has it led to warming of the neighbouring regions?

We do not know, but certainly part of the energy will have gone into evapotranspiration of the newly developed forests. In the context of a GGW we need to ”think big“, we should find similar, maybe weaker cooling trends in other parts of the gigantic large Chinese GGW. The example described in above is a simple cause-and-effect relationship but it seems to have large meso climatic effect. It is questionable whether simulation would have shown that the vegetational impact on wind speed would by far overweight the impact of reduced albedo in the investigated region – and probably to some degree in all surrounding regions that have been enriched with vegetation. Albedo change and reduction in wind speed – these are only two of the factors of the complex regional interaction between vegetation, ground and climate. Other single factors that speak against warming effect of afforestation in dry hot climate which seem difficult to analyse or simulate are:

  1. Shade: Shade reduces temperature, increases humidity, leading to constant soil moisture and thereby an increased uptake of rare precipitation. In this climate partial shadow may enable life, whereas absence of shadow does not. On a ground that is entirely dried out water can stay for long time without being taken up. During this time the majority of precipitation may already have run away in a wadi.
  2. Root system: Deep root penetration of the ground will give it structure that allows for infiltration and long term storage of precipitation in deeper zones of the ground, leading to rise of the ground water level. Strong main roots will break up soil compaction in deep ground, fibre roots will increase the water holding capacity of desert sand… All of which will contribute to the water cycle, thereby increasing the cooling effect via evapotranspiration. In this climate zone water is of ultimate importance as it dominates life here in a “all or nothing rule”.

Can these and other biophysical single factors related to afforestation be simulated appropriately, with their specific intensity and meaning in semi-arid regions? Today, where would we get reference data to underlie a realistic simulation, even if these were given for an area of ”only“ 1,500 square km, like the Jiangsu region in China? When in this climate it takes at least 4, 5 or more decades until such „test area“ is established? Probably it is not a simple task to simulate an overall cooling effect of new vegetation that may evolve to its full extent in nature only after 5 to 7 decades, as can be derived from review of dry climate ecological data [16].

Often questions around publication of data of the Chinese GGW are raised: Where do data come from, what is the source? Analysts may be over motivated to sell a positive outcome of such huge project leading to biased reporting of results. As shown in the Kubuqi example, true facts (increase in precipitation) can be mixed with “half truth” (100 mm instead 260 mm initial value, 400 mm instead of 310 mm averaged value today) which is disappointing as it may mask any helpful interpretation based on true data. The UNEP (2015) report in this respect seems trustworthy, doing only interpretation of long term data, gathered from a local weather station.

Likewise, climate data from the Jiangsu region do meet these criteria. They are also underlined by positive agro economical facts on the development from steppe land in the 1950´s to farming land and fruit garden today. The authors even complain that, because harvests here are so rich farmers would now start to cut trees on the field borders in order to gain more arable land, they see a risk that very soon such behaviour could bring back the old days of hot sand storms.

The Northern Jiangsu region seems to be a “show case” or “model” region: Its´ proximity to the Yellow River is likely to have enabled irrigation of young plants, maybe there is a high water table as in the example of Kubuqi where the stretched narrow green belt was built along the banks of Yellow River. Here a high water table in a few meters depth is reported which clearly has made afforestation easier. Other regions of the Chinese GGW may not have this luxury. Their development into a state of 16, 20 or more percent tree cover when transition to sub-humid climate can be expected (as in Jiangsu) – this is likely to take more years here.

In this review we do not cover the question of which kind of species or vegetation to be chosen for which climate situation. Reports of the Chinese GGW make clear that also plantation of grassland and shrubs is part of the afforestation campaign. The high mortality rate of trees in this climate and a preferably lower water consumption rate of grassland are typical points of criticism of scientists [17]. Today China looks back on three generations of large scale planting efforts, and correction of some of the ecological parameters has been and will need to be done.

Any improvement of climate parameters may only develop over years and decades, hand in hand with the establishment of the new vegetation. Such improvement likely will be counteracted by the effects of global warming. It is therefore difficult to measure any balancing climate effect of new vegetation since these two activities minimize each other. In addition, the larger the region being analysed the more difficult it seems to relate any change in climate parameters to afforestation activity. Long term investigations over the next decades will show whether a still growing new vegetation cover in semi-arid Northern China, besides sand storm events also will modify temperature and humidity on a continental level, similar to the reports on regional level.

Conclusion

It is surprising that we may be able to already find meso and macro climatic effects of vegetation only 50 years after the first plantations were started. In comparison to afforestation in humid climate, newly planted vegetation in semi-arid climate is expected to need significantly more time to take root and get established. Based on semi-arid ecological observations it may take up to 70 years until new vegetation in steppes is well established [16] and only then would also have developed its´ full climatic potential for increased deposition of precipitation in the ground, for the activation of hydrate cycle, formation of clouds, reduction of wind speed, and stabilized surface temperatures. Similarly, a recent report from a Chinese science journalist indicates that it is expected to take another 20 years until we will see the full spectrum of positive results from the Chinese GGW that was started in 1978 (“France 24”, online news 2018). We need to „think big“ in terms of geography – and time. The ability of such plantation to develop, spread and expand further, this certainly can be used as a measure of persistence and success of semi-arid afforestation.

Striking discrepancy was found between the theoretical impact of albedo changes outweighing afforestation results in simulation studies when compared to the importance of wind breaking activity of vegetation on the border of deserts, as seen in real life. The difficult afforestation of steppes and desert border regions may be of high value, functioning as a „vegetational climate barrier“, in addition to the climate protective effect via CO₂ fixation. Here the desert climate parameters are being controlled, vegetation here is buffering the climatic impact of deserts on their adjacent regions.

The first results from Jiangsu region with a size of about 30 x 50 km are showing a threshold with 16 to 20 % of minimum tree cover that is leading to beneficial regional climate changes, i.e. an increase in humidity that is enabling agricultural production in an area dominated by hostile semi-arid climate before. Especially in semi-arid and arid climate it seems obvious that vegetation should have a minimum density over a larger area, a certain minimum percentage in order to show climatic impact and to support or enable agriculture via humidity and precipitation induced by the additional vegetation.

Current natural climate solution projects are focused on maximum fixation of CO₂ amounts, consequently plantation projects were supported preferably in regions where high amount of CO₂ can be sequestered within short time, i.e. where fast growth of trees is supported by humidity of the local climate. In the semi-arid climate of desert border regions however, viability of vegetation depends on a certain regularity of precipitation, additional vegetation may create a duplicate climate mitigating effect, leading to additional humidity and reduced surface temperatures on formerly bare ground.

What if many or most of the desert bordering regions and semi-arid areas with signs of desertification, globally are considered as GGW candidates, getting re-greened in order to maintain soil fertility and a balanced regional and continental climate? Regions in question for respective activities are the Sahel, South Africa, the entire region from Syria to Pakistan, parts of India, and Australia. GGWs and networks of existing and new vegetation in desert bordering areas may be stabilizing in many regards, leading to a more balanced climate regionally and perhaps, globally – in addition to the benefit for agriculture and economy.

Acknowledgement

I would like to thank Professor Dr. Klaus Becker, University of Hohenheim, Germany for all helpful feedback and discussion of the topic.

References

  1. Sven Ploeger, Frank Boettcher: Klimafakten“, Westend Verlag GmbH, Frankfurt (2013). ISBN 978-3-86489-048-2. Pg No: 124–125.
  2. China’s ‘Great Green Wall’ Fights Expanding Desert by Alexandra Petri E (2017) National Geographic, Apr 21.
  3. Feng Wan, Xubin Pan, Dongfang Wang, ChongyangShen, Qi Lu (2013) Combating desertification in China: Past, present and future“. Land Use Policy 31: 311–313.
  4. World leaders renew commitment to strengthen climate resilience through Africa’s Great Green Wall“. Article based on The African Union Commission Press Release, Paris, France, 02 December 2015. In: The African Union, Link: http://www.au.int/en/
  5. Eduardo Mansur in Great Green Wall’ initiative offers unique opportunity to combat climate change in Africa. UN agency. 17 November 2016. Link: http://www.un.org/sustainabledevelopment/blog/2016/11/great-green-wall-Ca-un-agency/
  6. Gregory Duveiller, Giovanni Forzieri, Eddy Robertson, Wei Li, Goran Georgievski, et al. (2018) Biophysics and vegetation cover change: a process-based evaluation framework for confronting land surface models with satellite observations. Earth Syst Sci Data 10: 1265-1279, https://doi.org/10.5194/essd-10-1265-2018
  7. WAD – World Atlas of Desertification, European Commission, Joint Research Center Update 21.11.2018, Link: https://wad.jrc.ec.europa.eu/
  8. Odoulami RC, Abiodun BJ, Ajayi AE, Diasso UJ, Saley MM (2017) Potential impacts of forestation on heatwaves over West Africa in the future. Ecological Engineering 102: 546–556.
  9. Myra Naik, Babatunde J (2016) Potential impacts of forestation on future climate change in Southern Africa”. Int. Journal of Climatology 36: 4560–4576.
  10. Jia-Yao Zhuang, Jin-Chi Zhang, Yangrong Yang, Bo Zhang, Juanjuan Li (2017) Effect of forest shelter-belt as a regional climate improver along the old course of the Yellow River, China. AgroforestSyst 91: 393–401.
  11. Li Yang: Kubuqi a successful example of desert greening.China Daily, Updated: 2018-08-06, 07:39h.
  12. UNEP: Review of the Kubuqi Ecological Restoration Project: A Desert Green Economy Pilot Initiative.” 2015. United Nations Environment Programme, Nairobi.
  13. Liangyun Liu,Huan Tang, Peter Caccetta, Eric A. Lehmann, Yong Hu,Xiaoliang Wu (2013) Mapping afforestation and deforestation from 1974 to 2012 using Landsat time-series stacks in Yulin District, a key region of the Three-North Shelter region, China Environ Monit Assess. 185: 9949–9965.
  14. Minghong Tan, Xiubin Li (2015) Does the Green Great Wall effectively decrease dust storm intensity in China? A study based on NOAA NDVI and weather station data. Land Use Policy 43: 42–47.
  15. Minghong Tan (2016) Exploring the relationship between vegetation and dust-storm intensity (DSI) in China. Journal of Geographical Science 26: 387–396.
  16. Lorenz Huebner (2019) Der Gruene Rettungsring. MitvernetzterSteppenbegruenung global der Klimakrisebegegnen”.OekomVerlag, Munich, Germany.
  17. Alexandra E. Petri (2017) China’s ‘Great Green Wall’ Fights Expanding Desert”. National Geographic Link: https://news.nationalgeographic.com/ 2017/04/china-great-green-wall-gobi-tengger desertification/

Occupational Performance of Children and Adolescents with Mucopolysaccharidosis Using Assistive Technologies

Abstract

Mucopolysaccharidoses (MPS) are a specific group of genetic diseases in which due to the accumulation of glycosaminoglycans (GAGs) in different organs and tissues, causes multisystemic changes that compromise the functionality and occupational performance of individuals. Occupational performance, understood as the participation and execution of activities of daily living, may be favoured using Assistive Technology (AT). Since there are no studies reporting the influence of AT on the occupational performance of children and adolescents with MPS, the objective of this study was to evaluate the occupational performance in self-care activities, based on the use of low-cost AT in children and adolescents with Mucopolysaccharidosis. Six individuals with MPS types I, IV-A and VI, aged 9 to 16 years participated. The instruments used for data collection were the Pediatric Disability Assessment Inventory (PEDI) – self-care area only, and the Canadian Occupational Performance Measure (COPM). The results showed that the tasks that presented the greatest disabilities in the performance are the areas of dressing, personal hygiene and bath. Thus, TA resources were made for five activities related to dressing and one for personal hygiene. After the use of AT, there was a positive and significant change in occupational performance and satisfaction of these individuals. Thus, the use of AT can significantly improve the occupational performance of this population.

Keywords

Adolescent, Assistive Technology, Child, Mucopolysaccharidosis, Occupational Performance, Self-Care Activities

Introduction

Mucopolysaccharidoses (MPS) are rare diseases, characterized by genetically determined metabolic errors, which are part of the Lysosomal Deposit Disease group. In these diseases there is accumulation of substrates that are normally degraded in lysosomes, and in MPS, deficiencies of specific enzymes lead to the accumulation of glycosaminoglycans (GAGs), resulting in a series of signs and symptoms, which together bring systemic impairment [1–3]. There is no cure for this group of diseases, and the current treatment is aimed at delaying its progress. Even with treatments, progression is nonetheless long-term, and changes in body structures and functions (joint stiffness, decreased range of motion, joint laxity, claw hand) result in limited functionality in the areas of occupational performance, especially in self-care tasks – related to dressing, personal hygiene and food [4].

Occupational performance is understood as the ability to perform routines and perform roles and tasks, involving the areas of self-care, productivity and leisure, being influenced by the factors of the individual, their skills and the context in which they are inserted [5]. Thus, for individuals with some form of physical limitation, occupational therapists may use Assistive Technology (AT) as an effort to enable improved independence and occupational performance, to the extent that limitations can be overcome through adaptations and use of ATs.

Assistive Technology allows a person with a limitation to perform activities and tasks more independently, and can be characterized as technology of high complexity (high cost – with electronic components) or low complexity (low cost), the latter being designed from everyday easily accessible materials that can often be made from materials available at home, in the office, at school or in the hospital. This type of AT is something that can be done right away to meet the needs of those who need it, with the resources at hand [7–9]. However, there are no studies linking the use of AT and MPS. Thus, this study aims to evaluate occupational performance in self-care activities, based on the use of low-cost assistive technology in children and adolescents with Mucopolysaccharidoses.

Methods

This is a prospective and descriptive longitudinal quantitative research, conducted at the outpatient infusion and enzyme replacement therapy center of a reference Hospital for the treatment of rare diseases, located in Rio de Janeiro – Brazil. Participated in the study: Six children and adolescents of both sexes between 9 years and 6 months and 16 years and 4 months of age, with type I, IV-A and VI MPS, with biochemical diagnosis of MPS that are treated with enzyme replacement in the institution’s medical genetics department. Were excluded from this research: Individuals with type III MPS because of neurological impairment; children and adolescents who had severe cognitive and / or motor impairment that prevented them from responding to assessments; and children and adolescents who reached the maximum PEDI score. For data collection, the Pediatric Disability Assessment Inventory – PEDI was used, only Part I – Child Abilities, which reports on the child’s functional abilities to perform daily activities and tasks and on the self-care scale [10] and, then, the Canadian Occupational Performance Measure – COPM was applied.

The PEDI was applied through a structured interview with children and adolescents, lasting on average 30 to 40 minutes, where it was identified if individuals can perform certain activities. The COPM was administered in around 10–15 minutes, with participants identifying issues related to their occupational performance related to the activities contained in PEDI. They chose the activities that were meaningful to them, quantifying the degree of satisfaction and importance they attributed to each of the activities. At the end of the application of the instruments, it was made a survey from the chosen activities (the activity that obtained the highest importance score in the COPM) and the possible assistive technology resources to be incorporated in the intervention process of the activity that gained the most quantification, by the participants, including from creating and building a low-cost TA resource to providing guidance to follow during activities performance. With the AT done, its use was trained with the participants and the responsible person accompanying them by the main researcher and after the participant’s minimum 2 weeks of AT use, the COPM was reapplied to assess if there were changes in occupational performance with the aid of the AT. This reapplication was made by a blinded evaluator who had no prior knowledge of previous results.

The COPM was created as an outcome measure, therefore, the total scores of the initial moment and the moment of re-evaluation were used with the objective of comparing the occurrence or not of changes in occupational performance and satisfaction, so it could be proved the effectiveness of an approach or intervention – in this case, the use of Assistive Technology. These changes were calculated by subtracting the evaluation values from the re-evaluation values, both for performance and satisfaction. The participants’ scores were not compared with each other, as COPM is an individual measure. With the completion of research data collection, the assistive technology resource made and/or adapted for each participant remained the same for continuous use. This study is part of a project approved by the Research Ethics Committee of the research site, under the number 1.827.932, valid until 31/10/2021, complying with the ethical principles in accordance with resolution 466/2012, and all participants were informed about the study, objectives, benefits and risks.

Results

From PEDI results we observed impacts on occupational performance, which consequently affects the ability to perform self-care tasks, especially in dressing, personal hygiene and bathing activities, as can be seen in Table 1. The changes in self-care activities observed from PEDI, participants chose the activities that were most significant through COPM, adding a value about it, to quantify its importance in performing it on a daily basis or wanting to execute it. Table 2 shows the chosen activities, the degree of importance and the AT made. It is noted that the activities varied, related to dressing or personal hygiene.

Table 1. Affected items grouped by tasks performed in PEDI self-care.

Participant

ITEMS AFFECTED

Feeding (14)*

Personal hygiene (14)*

Bathing (10)*

Dressing (20)*

Toilet use (5)*

Sphincter control (10)*

1

12

2

2

2

5

2

3

2

2

1

12

1

4

5

11

5

4

9

6

2

4

3

12

2

*:  Number of items contained in each self-care task according to PEDI.

Table 2. Description of activities, importance given by participants – COPM and AT made

Participant

MPS

Activities chosen at COPM

Grau de importância

AT

1

II

Put on socks

9

Sock on Applicator

2

IV-A

Brush hair

9

Hair brush with L-form

3

IV-A

Remove socks

8

Stretch cable to remove socks

4

VI

Put on socks

10

Sock on Applicator

5

VI

Wear lower end (buttoning and zipper handling)

9

Buttoning

6

VI

Dress upper and lower extremity (buttoning and zipper handling)

8

Buttoning

After making and training the ATs, Table 3 presents the changes in occupational performance and satisfaction in performing the selected tasks. The improvement of these two parameters was observed throughout the sample. However, it was observed that it was not possible to infer changes in two cases (participant 4 and participant 6), because they did not use the AT after training: participant 4 started training at home, but didn’t feel willing to keep using the AT, preferring that his mother did the activity for him; and participant 6, did not use, because he did not wear clothes that have button or zipper at home, only using to go out and preferring that his mother performed the activity.

Table 3. Importance / Performance / Satisfaction Relationship – Before and after the application of AT and observed changes

Participant/ MPS

Activity

Importance

Initial Evaluation

Revaluation

Change

Performance 1

Satisfaction 1

Performance  2

Satisfaction  2

Performance

Satisfaction

1 (type II)

Put on socks

9

2

2

5

8

3

6

2 (type  IV)

Brush hair

9

5

3

10

10

5

7

3 (type  IV)

Remove socks

8

2

4

4

7

2

3

4 (type  VI)

Put on socks

10

1

5

*

*

*

*

5 (type  VI)

buttoning and zipper handling

9

2

5

10

10

8

5

6 (type VI)

buttoning and zipper handling

8

3

5

*

*

*

*

Note: *: Data were not obtained as the participant reported not using the AT

Discussion

Children and adolescents with MPS, the limitation of mobility caused by the accumulation of glycosaminoglycans in tissues and joints, causes a loss in the ability to perform occupational activities, especially related to activities of daily living (ADLs), especially those requiring fine movements (eg: buttoning) or of large amplitudes (brush hair) [11–15]. It is widely discussed in the literature that progressive musculoskeletal impairment, found regardless of the type of MPS, impacts occupational performance. Studies show that joint stiffness, common in MPS, and even MPS IV-A-specific ligament laxity and muscle weakness, as well as carpal tunnel syndrome and Dupuytren’s contractures, all contribute to important limitation in self-care activities such as eating, dressing and personal hygiene [14, 16,17,18]. From the knowledge of body structure and function deficiencies related to self-care activities, it is possible to establish intervention priorities and select better strategies to be used, in order to enhance occupational performance. Among the intervention strategies, AT is a possibility of occupational therapist resource for the promotion of functionality [10].

Although the entire sample showed impairment in the area of dressing, the choices of tasks for making the AT were diverse and did not show a pattern by MPS type. This is because each individual sees itself in a way, and different activities may be a priority for one but not to the other. The activities that a person chooses to engage in are full of meaning and purpose and are related to their roles and how they relate to the world/environment [19], and therefore each individual attaches meaning and importance to each task of your day to day, like doing one activity is more important than performing another. With the application of COPM, besides allowing the choices of self-care activities that are significant for individuals, it was possible to measure the importance of the activity and quantify its performance and satisfaction. This is because according to the COPM theory was developed occupational performance is viewed as a subjective individual experience [20].

As much as it is not possible to make inferences between participants and their scores, it is possible to say that in the initial assessment of occupational performance, the average among participants was 2.5 points and in the revaluation, an improvement of the results was observed with an average of 7,25 points (minimum value of 4 and maximum of 10) There was also some improvement in the performance rate of activities, in the initial rating the group average was 4 (minimum 2 and maximum of 5) and in the revaluation the average value was 8.75 points (minimum 7 and maximum of 10). According to Carswell (2004), the variation found from 2 or more points in the COPM can be considered a clinically significant intervention [21]. That said, there was an improvement in the occupational performance of individuals with MPS, based on assistive technology, thus seeking to increase the independence of these individuals.

With these changes presented in a significant way,  it is possible to suggest that the higher the performance in performing self-care activities, the better the satisfaction in performing it, as seen in the work of Mildner et al., 2017, where the use of AT was described as significant in another health condition [22]. According to Persson et al. (2014) changes in occupational performance are associated with changes in psychosocial functioning and psychological well-being of individuals [23]. Regarding the non-use or abandonment of AT devices by users (occurred with two participants), Costa and collaborators (2015) conducted a literature review on the reasons that led individuals to abandon their resources. The most quoted factors were: problems with the user’s physical state; lack of information and training from both professionals and users; pain; functional limitations; preference for another resource or use of remaining capacities [24]. Among the factors mentioned, only the “preference of using remaining capacities” was found in this paper. In addition to this factor it was also quoted “lack of user motivation” and “lack of device functionality”.

Regarding AT, social acceptance is an important variable that permeates the decision of the user or his family to use the resource, because even if a certain resource improves the quality of life and occupational performance, but represents a negative social connotation and stigmatizing, the user tends to abandon it. If there is no support or encouragement from family members or if the device is viewed as a validation of being sick/being different (by the individual or family members) the chances of abandonment may be high [24–26].

Conclusion

AT has become an importante occupation therapeutic resource for children and adolescentes with problems in performing activities of daily living, such as MPS, increasing their autonomy and personal satisfaction. Thus, we highlight the importance of investing in future research in AT field focusing on occupational performance, especially self-care of individuals with MPS to then guide the intervention and occupational therapeutic care.

References

  1. Guarany NR, Schwartz IVD, Guarany FC, Giugliani R (2012) Functional capacity evaluation of patients with Mucopolysaccharidosis. J Pediatr Rehabil Med  1: 37–49.
  2. Nussbaum RL, Mcinnes RR, Willard HF (2008) Thompson e Thompson Genética médica, 7º edição. Saunders, Elsevier.
  3. Schwart, IVD, Boy R (2011) As doenças lisossômicas e tratamento das mucopolissacaridoses. Rev do Hosp Univ Ped Ernest 2.
  4. Silva MCA, Horovitz DDG, Ribeiro CTM (2015) Desempenho ocupacional de crianças e adolescentes com mucopolissacaridose de uma instituição de saúde do município do Rio de Janeiro [dissertação de mestrado]. Rio de Janeiro.
  5. Magalhães LC, Magalhães LV, Cardoso, AA (2009) Medida Canadense de Desempenho Ocupacional – COPM. Belo Horizonte: Editora UFMG.
  6. Barata-Assad DA, Elui VMC (2010) Limitações no desempenho ocupacional de indivíduos portadores de hemofilia em centro regional de hemoterapia de Ribeiro Preto, Brasil. Rev. Ter. Ocup. São Paulo 3: 198–206.
  7. Anson D. (2004) Tecnologia assistiva. In: Pedretti LW, Early MB. Terapia Ocupacional: Capacidades práticas para as disfunções físicas. Quinta edição. São Paulo: Roca P. 276–296
  8. Rodrigues AC (2008) Reabilitação: Tecnologia Assistiva. In: Rodrigues, AC. Reabilitação. Práticas inclusivas e estratégias para a ação.  São Paulo: Livraria e Editora Andreoli p. 39–41.
  9. Sfredo Y, Silva RCR. (2013) Terapia Ocupacional e o uso de tecnologia assistiva como recurso terapêutico na artrogripose. Cad Ter Ocup. UFSCar 3: 479 – 491.
  10. Mancini, MC (2005) Inventário de Avaliação Pediátrica de Incapacidade (PEDI): Manual da versão brasileira adaptada. Belo Horizonte; UFMG.
  11. Rocha JSM, Bonorandi AD, Oliveira LS, Silva MNS, Silva, VF (2012) Avaliação do desempenho motor em crianças com mucopolissacaridose II. Cad Ter Ocup UFSCar 2012 20(3): 403–12.
  12. Amaral IABS, Filho RLO; Neto JAR, Reis MCS. Avaliação da capacidade funcional de adolescentes portadores de Mucopolissacaridose do tipo II. Cad Bras Ter Ocup, São Carlos. 2017; 25(2): 297–303.
  13. Schwart, IVD; Boy, R. (2011) Às doenças lisossômicas e tratamento das mucopolissacaridoses. Rev do Hosp Univ Ped Ernest 2.
  14. Santos AC, Azevedo ACMM, Fagondes S, Burin MG, Giugliani R, Schwartz IVD (2008) Mucopolysaccharidosis type VI (Maroteaux-Lamy syndrome): assessment of joint mobility and grip and pinch strength. Jorn de Ped 2: 130–5.
  15. Pinto LLC, Schwartz IVD, Puga ACS, Vieira TA, Munoz MVR, Giugliani R, et al. (2006) Prospective study of 11 Brazilian patients with mucopolysaccharidosis II. Jornal de Ped 4: 273–8
  16. Vieira TA, Giugliani R, Schwartz I (2007) História natural das mucopolissacaridoses: Uma investigação da trajetória dos pacientes desde o nascimento até o diagnóstico. [dissertação de mestrado] [online]. Universidade Federal do Rio Grande do Sul, Porto Alegre.
  17. Viapina M, Burin MG, Wilke M, Schwartz IVD (2011) Síndrome de Morquio – Mucopolissacaridose IV-A. Serviço de Genética Médica – Hospital de Clínicas de Porto Alegre.
  18. Azevedo ACMM, Giugliani R (2004) Estudo clínico e bioquímico de 28 pacientes com MPS tipo VI. [Dissertação de mestrado]. Universidade Federal do Rio Grande do Sul; Porto Alegre.
  19. Pelosi, MB (2009) Tecnologias em comunicação alternativa sob o enfoque da terapia ocupacional. In: Deliberato D.; Gonçalves MJ; Macedo EC (Org.). Comunicação alternativa: teoria, prática, tecnologias e pesquisa. São Paulo: Memnon Edições Científicasp 163–173.
  20. Andolfato C, Mariotti MC (2009) Avaliação do paciente em hemodiálise por meio da medida canadense de desempenho ocupacional. Rev Ter Ocup Univ São Paulo 1: 1–7.
  21. Carswell A, Mccoll MA, Baptiste S, Law M, Polatajko HL, Pollock N (2004) The Canadian occupational performance measure: a research and clinical literature review. Can Jour Occup Ther 4: 210–222.
  22. Mildner AR, Ponte AS, Pommerehn J, Estivalet KM, Duarte BSL, Delboni MCC. Desempenho ocupacional de pessoas hemiplégicas pós-avc a partir do uso de tecnologias assistivas.
  23. Persson E (2014) Occupational performance and factors associated with outcomes in patients participating in a musculoskeletal pain rehabilitation programme. J Rehabil Med. Uppsala 46: 546–552.
  24. Costa CR, Ferreira FMRM, Bortolus MV, Carvalho MGR (2015) Dispositivos de tecnologia assistiva: fatores relacionados ao abandono. Cad. Ter. Ocup. UFSCar, São Carlos 3: 611–624.
  25. Kruger, JM; Ferreira, AR (2013) Aplicação da Tecnologia Assistiva para o desenvolvimento de uma classe ajustável para cadeirantes. Iberoamerican Journal of Industrial Engineering. Florianópolis 9: 43–69.
  26. Zelia ZLC, Bittencourt DC, Cheraid RC, Montilha, Elisabete RF (2016) Expectativas quanto ao uso de tecnologia assistiva. Journal of Research in Special Educational Needs 1: 492–496

Thoughts at a White Coat Ceremony


The first documented White Coat Ceremony was held 10 years after I entered medical school. Dr. Arnold P. Gold held his first White Coat Ceremony four years after that [1]. White Coat Ceremonies have spread throughout US medical schools and even internationally [2,3], largely through the support of the foundation established by Dr. Gold, his family and his colleagues [3]. I confess that when I first heard of these events sometime in the mid to late 1990s, the idea of presenting a white coat to entering medical students in a ceremony so that they would understand that they are beginning their entry into a profession, reminded me of an old Monty Python sketch. A middle-aged man with spectacles (not unlike me) goes into an employment office and asks if there are any job openings for a lion tamer. When asked about his qualifications, he pulls out a pith helmet and says, “I’ve got the hat”.

After I began attending White Coat Ceremonies in 2011, I realized my flippant initial reaction was unjust. I have come to appreciate White Coat Ceremonies as an opportunity for helping new students understand and embrace the values of the medical profession, with the white coat as a symbol of those values. Of course, the holistic admissions practices of most medical schools, at least in the US, aim to ensure that matriculated students possess many of the underlying humanistic qualities desired in physicians; and certainly, the students should understand that ultimately what makes one a physician is not the white coat but the person who is inside it.

However, even the apparently innocuous activity of the White Coat Ceremony has generated controversy. There was always some debate about the timing of the ceremony in the process of education: some schools would hold their ceremony at matriculation, while others might schedule it at the point in the curriculum where students shift from their preclinical studies to working in the clinics and wards. As earlier clinical exposure becomes more common, it is likely that White Coat Ceremonies held in the end of the second year of medical school will shift earlier in the educational process. More significant controversies revolve around the purpose and symbolism of the White Coat Ceremony itself.

For Dr. Arnold Gold, it seems clear that there was no intrinsic conflict between “humanism” and medical “professionalism” and the White Coat Ceremony represented both [3]. This perspective was certainly that held by physicians of his generation [4], and certainly is an aspirational goal even now. Even early in their history, White Coat Ceremonies were recognized as a tool for inculcating and teaching professionalism [5]. More recent commentators have argued that humanism, defined by values that are egalitarian and universal, has become distinct from professionalism, which may be parochial and culturally determined, and to at least some degree, self-interested [6]. It has also been suggested that the White Coat Ceremony is a defensive action by the medical profession, symbolizing a claim of entitlement in a world where physician leadership of healthcare is challenged [7]. Perhaps reflecting these perceived conflicts is a model in which a “profession-entry” ceremony is held early in the first year followed by a later “humanistic” ceremony including individual statements of values, a high level of student engagement, and artistic performances [2]. Most White Coat Ceremonies include recitation of some sort of commitment or oath: the meaning and appropriateness of such recitations has also been debated [8,9].

The widely discussed issue of physician burnout engages the issues reflected in debates about the appropriateness and meaning of White Coat Ceremonies. Challenges to the autonomy of the medical profession are not only of a financial or administrative nature, but also reflect challenges to the humanistic expectations of patient centeredness and empathy. For that reason, it has been suggested that the term “burnout” should be replaced by the term “moral injury” [10].

When I discuss these issues with students, either individually or in small group learning settings, I emphasize that medicine is one of the professions as traditionally defined. More specifically, it is one of the three characterized as “learned professions”. Medicine is also a vocation, or if one prefers, a “calling”. The word “vocation” derives from the same Latin root as “vocal”. It refers to something to which one is called or summoned, and accepting the call implies a commitment with attendant obligations. For medicine, the commitment is to the service of the patient. For each of us, the obligation is for that service always to reflect our best, with a further obligation that through lifelong learning we will strive to ensure that the gap between our best and the ever-shifting target of “THE best” is always small as circumstances permit. The White Coat Ceremony and the acceptance by a student of her or his first white coat symbolize recognition that they are beginning the path to that commitment and to the obligations that follow from it.

In thinking about these issues, I am reminded of things other than Monty Python. When I was in college, the US Navy ran a series of recruiting commercials with the tagline “It’s not a job, it’s an adventure”. Medicine is not just a job: it is a profession, a calling, a commitment. However, a lot of us believe it is also an adventure [11].

Adapted from remarks made at the James H. Quillen College of Medicine Class of 2022 White Coat Ceremony – July 20, 2018.  Dr. Means is a former dean of the College

The White Coat Ceremony was supported in part by the Arnold P. Gold Foundation.

References

  1. Gold A, Gold S (2006) Humanism in medicine from the perspective of the Arnold Gold Foundation: challenges to maintaining the care in health care. Journal of child neurology 21: 546–549.
  2. Tamai R, Koyawala N, Dietrick B, Pain D, Shochet R (2019) Cloaking as a community: re-imagining the White Coat Ceremony with a medical school learning community. J Med Educ Curric Dev 6: 2382120519830375.
  3. Kavan MG (2009) The White Coat Ceremony: a tribute to the humanism of Arnold P. Gold. Journal of child neurology 24: 1051–1052.
  4. Lepore MJ (1982) Death of the Clinician: Requiem Or Reveille? Springfield, IL USA: Charles C. Thomas; 1982.
  5. Swick HM, Szenas P, Danoff D, Whitcomb ME (1999) Teaching professionalism in undergraduate medical education. Jama 282: 830–832.
  6. Goldberg JL (2008) Humanism or professionalism? The White Coat Ceremony and medical education. Academic Medicine: Journal of the Association of American Medical Colleges 83: 715–722.
  7. Russell PC (2002) The White Coat Ceremony: turning trust into entitlement. Teaching and learning in medicine 14: 56–59.
  8. Huber SJ (2003) The White Coat Ceremony: a contemporary medical ritual. Journal of medical ethics. 29: 364–366.
  9. Veatch RM (2002) White coat ceremonies: a second opinion. Journal of medical ethics. 28: 5–9.
  10. Heston TF (2019) Pahang JA. Moral Injury or Burnout? South Med J 112: 483.
  11. Robinson GC (1957) Adventures in Medical Education. A Personal Narrative of the Great Advance of American Medicine. Cambridge: Commonwealth Fund 1957.

Blood Transfusion Guided by Physiological Markers

Abstract

Introduction: For decades, intraoperative anemia has been treated with red blood cell transfusions since it was believed that oxygen supply would increase by increasing hemoglobin levels. There is evidence that blood transfusion is associated with adverse events and should be avoid as much as possible. For this purpose, it is essential to know the compensatory physiological mechanisms during anemia. Venous oxygen saturation is a clinical tool that integrates the relationship between oxygen intake and consumption, which is easy to obtain once a central venous catheter, is available.

Material and methods: A longitudinal, prospective, observational study was conducted which included patients schedule for elective or emergency procedures that, due to their clinical conditions, had a central venous catheter. A sample of venous blood was taken from the central venous catheter and sent to the laboratory for gasometry. The results were correlated with the clinical status and vital signs of the patient. The following variables were evaluated: vital signs, hemoglobin, and hematocrit and oxygen saturation before and after transfusion.

Results: 34 patients were evaluated with an average age of 52 years. 58.8% was transfused. Despite the transfusion and variations of hemoglobin, the SaO2 in the pulse oximeter remained without changes pre and post transfusion. In gasometry, a difference between hemoglobin and initial hematocrit and pre-transfusion was observed, this due to bleeding that occurred. No differences in SaO2 values were observed for pre-transfusion vs post-transfusion pulse oximetry.

Conclusions: We found no evidence to support the linear correlation of ScvO2 with the hemoglobin levels, there is great variability of ScvO2 at different hemoglobin level, we suggest the use of venous central saturation as a physiological marker for transfusions, avoiding with this practice making decisions only with the hemoglobin levels.

Keywords

Transfusion, Oxygenation, Saturation, Blood, Hemoglobin, Catheter

Introduction

For decades, intraoperative anemia has been treated with red blood cell transfusions based on the concept that the oxygen supply to the tissues is increased by increasing hemoglobin levels. Likewise, arbitrary transfusion rules such as the “10/30 rule” have been used indicating that the transfusion of erythrocyte concentrates is required when the hemoglobin concentration is less than 10g / dl or the hematocrit decreases by 30% [1]. There is evidence that blood transfusion is associated with adverse events, so it should be avoided as much as possible [1–3]. For this purpose, it is essential to know the compensatory physiological mechanisms during anemia. The main function of red blood cells is the transport of oxygen from the pulmonary capillaries to the peripherals. The oxygen delivery (DO2) is defined as the product of cardiac output (CO) and arterial oxygen concentration (CaO2). DO2 = CO × CaO2 where DO2 is expressed in mL/min, CO in dL/min, and CaO2 in mL/dL.

The arterial oxygen concentration can be defined with the following formula: CaO2 = (SaO2 × 1.34 × Hb) + (0.0031 × PaO2)

Where SaO2 is the arterial saturation (in %), 1.34 is the amount of oxygen carried on the hemoglobin (in mL/g), Hb represents the hemoglobin level (in g/dL), 0.0031 is the solubility coefficient of oxygen in human plasma at 37°C (in mL/dL*mmHg) and PaO2 the arterial tension measure in mmHg. From this equation, we can infer that to maintain the tissue oxygen supply the organism must adjust some variables such as: Hb, CO, oxygen consumption (VO2) and SaO2. The ratio of oxygen consumption (VO2) to oxygen delivery (DO2) is defined as “Oxygen extraction ratio” (O2ER) in normal circumstances the normal range is from 20–30% because the DO2 (800- 1200 mL/min) exceeds VO2 (200–300 mL/min) three to five times. In this way the hemoglobin concentration and the oxygen delivery (DO2) can decrease significantly without affecting the oxygen consumption, which makes it independent of DO2 [4,5].

However, below a critical threshold of hemoglobin concentration (HbCRIT) and critical oxygen delivery (DO2 CRIT), a level of VO2 / DO2 dependence is reached. This means that below this threshold any decrease in DO2 or Hb also results in a decrease in VO2 and therefore in tissue hypoxia. Venous oxygen saturation is a clinical tool that integrates the relationship between the intake and oxygen consumption in the body, in absence of a mixed venous saturation sample (SvO2) obtained through a pulmonary arterial catheter, central venous oxygen saturation (SvcO2) is being used as an accurate substitute. Central venous catheters are simpler to insert, safer and cheaper than pulmonary artery catheters [6].

By means of a central venous catheter, it is possible to take blood samples for the measurement of ScvO2, whose value ranges around 73% – 82% [6, 7]. Since, as stated, the Hb level does not guarantee an adequate tissue perfusion. Accordingly, the physiological transfusion markers should replace the arbitrary markers currently used based only on hemoglobin levels [8, 9]. In this way, we could avoid the unnecessary use of transfusions with the consequent savings in blood banks, reserving it only to those patients who really require it, avoid adverse transfusion reactions such as acute lung injury, infection transmission, among others. Transfusion guidelines should consider the individual ability of each patient to tolerate and compensate the acute decrement of hemoglobin concentration in the account that there is not a universal threshold to indicate a transfusion [10]. The markers should instead consider signs of tissue dysoxia, which may occur at different hemoglobin concentrations depending on the comorbidities of each patient. These signs may be based on signs and symptoms of inadequate oxygenation, however, before a decision is made regarding transfusion, it must be ensured that there is an adequate supply of volume with crystalloids and / or colloids and that the anesthetic management at the time is optimal. The objective of the present study was to demonstrate that physiological markers, specifically central venous saturation, are parameters that are useful to determine the use of blood transfusion

Materials and Methods

Study design and ethical aspects

A longitudinal, prospective, observational study was conducted which included patients from 18 to 60 years, of indistinct gender, who entered the operating room for any surgical procedure of any specialty in in a third level hospital. The procedures included needed to carry a risk of bleeding greater than 15–20% of the circulating blood volume and the patients that, due to its clinical conditions, required a central venous catheter. Exclusion criteria included patients who refuse to participate in the study, with active bleeding from the gastrointestinal tract, with anemia or blood dysrcrasias and hemodynamically unstable. The elimination criteria included patients in whom the history of blood dyscrasias is unknown or confirmed, patients who have some other pathological condition that alters the results and interpretation of the study, patients with active bleeding and who require an urgent blood transfusion. This protocol was submitted for evaluation to the ethics committee. Because the study was carried out only in patients who already have a central venous catheter in place, patient authorization was not required by informed consent. In the same way the patient was not intervened, since this is an observational study, only the data was collected and analyzed.

Study variables

For each patient who met the criteria a sample of venous blood was taken from the central venous catheter. The sample was then taken to the hospital’s gasometry laboratory where the study was conducted. Once the result of the sample was obtained, it was captured in a database including as variables the results of arterial gasometries, vital signs and laboratory tests that the patient will have, such as blood count and blood chemistry.

Statistical analysis

Epidemiological data such as age and sex will be obtained. The data will be analyzed with measures of central tendency such as mean, median and dispersion measures such as the standard deviation. In the bivariate analysis, it is planned to use the Shapiro-Wilk test to observe the dispersion of the data and classify it as parametric or non-parametric. Based on the results obtained, non-parametric statistical tests such as square chi for two groups and Wilcoxon were performed, given that related groups are compared. If the results obtained are parametric, tests such as Student’s T will be performed for related groups. The SPSS version 24 program was used to perform the statistical tests described above.

Results

34 patients were evaluated with an age average of 76 years (± 16 years). The average weight of the patients was 80 kg and the average size was 164 cm. 64.7% of the patients were male and 35.3% female (Table 1). 58.8% of the patients evaluated had the need to be transfused. An average of 777 cm3 of blood was transfused; the most common amount of transfused packets was two globular packages. Vital signs were evaluated with a range of 83–84 beats per minute, respiratory frequency varied from 21 breaths per minute prior the surgical procedure and an average pulse oximeter saturation of 98%. Systolic blood pressure fluctuated from 127–109 mmHg at the end of the procedure and the initial diastolic pressure was 74-mmHg compare to the 66 mmHg at the end of the procedure. (Figure 1–4). An initial mean Hb was obtained in venous gases of 8.9, pre-transfusion of 7.8 and post transfusion of 10. A statistically significant difference was observed in pre and post transfusion hemoglobin, as well as in pre and post transfusion hematocrit unlike SaO2, where there was no difference between pre-transfusion and post transfusion. In arterial gases, a statistically significant difference was found in the initial hematocrit levels and the hemoglobin levels pre transfusion, no differences were observed in SaO2 values or in any of the pre-transfusion vs. post-transfusion data (Table 2). Finally, a comparative analysis between the markets as cut- off points in the literature reviewed was made. A chi-square cross-tabulation table analysis was performed for qualitative variables, where no statistically significant differences were found in patients with indication of transfusion at the beginning of the procedure; pre-intervention and post-intervention (Table 3).

Table 1. Demographic characteristics of the patients.

Demographic data

Patients

34

Age (years)

52

Size (cm)

164 ± 11

Weight (kg)

80 ±20

Gender

Female 11 (%)

22 (64.7)

Male 11 (%)

12(35.3)

Table 2. Venous and arterial gases, pre transfusion and post transfusion.

Initial

Pre­ transfusion

P

Pre­ transfusion

Post transfusion

P

Venous Gases

Hb

8.980

7.800

0.074

7.800

10.028

0.008

Hcto

29.500

24.631

0.031

24.631

32.011

0.008

SaO2

118.35

72.94

0.198

72.94

114.50

0.683

Arterial Gases

Hb

9.970

8.893

0.035

8.93

9.817

0.239

Hcto

31.65

28.53

0.035

28.53

31.67

0.195

SaO2

99.00

98.73

0.627

98.73

98.83

0.219

Table 3. Patients with indication of transfusion at the beginning of the procedure, pre intervention and post intervention.

Venous Hb

Venous
SaO2

P

Arterial Hb

Arterial
SaO2

P

Initials

Requires transfusion

17

6

0.05

19

0

*

No transfusion required

15

32

14

32

*

Pre intervention

Requires transfusion

17

6

0.554

15

19

*

No transfusion required

2

13

4

15

Post intervention

Requires transfusion

12

9

0.056

13

21

0.05

No transfusion required

10

12

8

13

* The variables evaluated are constant, so there is no statistically significant difference.

IMROJ 19 - 141_Rodriguez Dominguez_f1

Figure 1. Average Hear Rate.

IMROJ 19 - 141_Rodríguez Domínguez_f2

Figure 2. Average Breathing Rate.

IMROJ 19 - 141_Rodríguez Domínguez_f3

Figure 3. Average Systolic Pressure.

IMROJ 19 - 141_Rodríguez Domínguez_f4

Figure 4. Average Diastolic Pressure.

IMROJ 19 - 141_Rodríguez Domínguez_f5

Figure 5. Average Arterial Oxygen Saturation.

Discussion

Based on the considerations above, the present investigation was carried out, with the aim of demonstrating, within our institution and in the operating room environment, the need to take other considerations in addition to a laboratory value when indicating a transfusion. The transfusion of erythrocyte concentrates is a very common practice within the operating room, it is very important for those who are responsible for carrying out this work to have deep knowledge about the physiology and biochemistry involved in the oxygenation process. This in order to achieve the main objective of hemotransfusion, without neglecting the other two variables that the blood influences, which are the rheological and volume effect [11, 12].

Unfortunately, routinely monitored variables such as blood pressure, heart rate, urine output, arterial gases and filling pressures do not necessarily reflect tissue perfusion. The mixed venous saturation (SvO2) and central venous oxygen saturation (SvcO2) are better indicators of oxygen delivery (DO2) and perfusion [13, 14]. The hemoglobin value has been considered as the determinant to indicate blood transfusion for many years. Although there are guides from different associations and different countries that provide us with great support when deciding if it is necessary to administer blood components to our patients, we propose that we also seek the support of physiological variables and markers when making this important decision. Taking into consideration that nowadays, at an international level, the transfusion of blood components cannot yet be performed without a residual risk [15,16].

The appropriate use of blood components should be promoted, avoiding abuse, by developing medical guidelines for therapeutic use by specialties based on scientific evidence. Awareness should be made of the high cost of production, the permanent existence of residual risks of infectious diseases and the possibility of causing immediate or late post-transfusion reactions in the patient [17]. Understanding the costs associated with blood products requires extensive knowledge about transfusion medicine and this is attracting not only clinicians but also administrative personnel from the health care sector worldwide. To improve both the clinical and the economic situation, the use of blood bank resources should be optimized [17–19]. Estimate the costs of storage, procurement, transfer among others is complex, however they should be minimized and used only when strictly necessary based on clinical judgment and on the use of technology and tools that allow estimating the state of patient oxygenation. With a rapid and accessible examination in many of the hospitals where surgical procedures are performed, we can obtain data about tissue oxygenation and thus be able to decide more effectively the use of blood bank resources.

Conclusion

This study does not find enough evidence to support the correlation of ScVO2 with hemoglobin, that is, there is great variability in venous saturation at different hemoglobin levels, and however, there is a tendency to increase ScvO2 after transfusion of globular packages. In the absent of a mixed venous saturation sample (SvO2) which is obtain via a Swan Ganz catheter, the central venous oxygen saturation (SvcO2) is a precise substitute and a reliable tool that integrates the relationship between the supply and consumption of oxygen in the body. By means of a central venous catheter, it is possible to take blood samples for the measurement of ScvO. We recommend that in patients who have this catheter use it to obtain a sample for gasometry and guide better decision-making regarding blood administration. There is an increase in interest in the use of mixed venous saturation and central venous saturation to guide therapeutic interventions during the intraoperative period. However, an understanding of the physiological principles and venous oximetry are essential for safe use in clinical practice. The venous oxygen saturation reflects the balance between the overall oxygen supply and its consumption, which can be affected by a large number of factors during the intraoperative period.

References

  1. Madjdpour C, Spahn DR, Weiskopf RB (2006) Anemia and perioperative red blood cell transfusion: a matter of tolerance. Crit Care Med 34: S102–108. [crossref]
  2. Vazquez Flores JA (2006) La seguridad de las reservas sanguíneas en la república mexicana. Revista de Investigación Clínica 58: 101–108.
  3. Añón JM, García de Lorenzo A, Quintana M, González E, Bruscas MJ (2010) [Transfusion-related acute lung injury]. Med Intensiva 34: 139–149. [crossref]
  4. Walley KR (2011) Use of central venous oxygen saturation to guide therapy. Am J Resp Crit Care 184(5): 514–520.
  5. Cain SM (1965) Appearance of excess lactate in anesthetized dogs during anemic and hypoxic hypoxia. Am J Physiol 209: 604–610. [crossref]
  6. Vallet B, Emmanuel Robin, Lebuffe G (2010) Venous oxygen saturation as a physiologic transfusion trigger. Critical Care 14: 213.
  7. Reinhart K, Kuhn HJ, Hartog C, Bredle DL (2004) Continuous central venous and pulmonary artery oxygen saturation monitoring in the critically ill. Intens Care Med 30: 1572–1578.
  8. Adamczyk S, Robin E, Barreau O, Fleyfel M, Tavernier B, et al. (2009) Contribution of central venous oxygen saturation in postoperative blood transfusion decision. Ann Fr Anesth 28: 522–530.
  9. Vincent JL (2012) Transfusion triggers: getting it right! Crit Care Med 40: 3308–3309. [crossref]
  10. Vallet B, Adamczyk S, Lebuffe G (2007) Physiologic transfusion triggers. Best Pract Res Clin Anaesthesiol. 21: 173–181.
  11. Colomina M, Guilabert P (2016) Transfusion according to haemoglobin levels or therapeutic objectives. Rev Esp Anestesiol Reanim 63: 65–68.
  12. Shander A, Gross I, Hill S, Javidroozi M, Sledge S (2013) A new perspective on best transfusion practices. Blood Transfus 11: 193–202.
  13. Carrillo R, Núñez J (2007) Saturación venosa central. Conceptos actuales. Rev Mex Anestesiol 30: 165–171.
  14. Cabrales P, Intaglietta M, Tsai AG (2007) Transfusion restores blood viscosity and reinstates microvascular conditions from hemorrhagic shock independent of oxygen carrying capacity. Resuscitation 75: 124–134. [crossref]
  15. Shander A, Hofmann A, Gombotz H, Theusinger OM, Spahn DR (2007) Estimating the cost of blood: past, present, and future directions. Best Pract Res Clin Anaesthesiol 21: 271–289. [crossref]
  16. Rojo J (2014) Enfermedades infecciosas transmitidas por transfusión. Panorama internacional y en México. Gac Med Mex 150: 78–83
  17. Goodnough LT (2005) Risks of blood transfusion. Anesthesiol Clin North Am 23: 241–252, [crossref].
  18. Shepherd SJ1, Pearse RM (2009) Role of central and mixed venous oxygen saturation measurement in perioperative care. Anesthesiology 111: 649–656. [crossref]
  19. Park D, Chun B, Kwon S (2012) Red blood cell transfusions are associated with lower mortality in patients with severe sepsis and septic shock: A propensity-matched analysis. Crit Care Med 40: 3140–3145.

Expectations and Attitudes Regarding Chronic Pain Control: An Exploration Using Mind Genomics

Abstract

We present the emerging science of Mind Genomics, to understand people’s responses to health-related issues, specifically pain. Mind Genomics emerge out of short, affordable, scalable, east-to-run experiments. The topic, here pain, is deconstructed into four questions, each with four separate answers (elements.) The answers are combined into vignettes, presented to respondents, who rate the entire vignette. Emerging from the study are the ratings and the response times to the vignettes, both of which are deconstructed into the contributions of the different underlying elements which the vignettes comprise. The answers cannot be gamed, and the data quickly reveal what is important to the individual, as well as revealing the existence of new-to-the-world mind-sets which differ in the pattern of elements that they find important. Mind Genomics  provides the opportunity to understand the person’s needs and wants for specific health as well as other experiential situations where human judgment is relevant.

Introduction

Pain is an inevitable companion in our life’s journey. Pain is defined through its association with actual or potential tissue damage, denoting it as a necessary characteristic of the experience, but also recognizing that events other than tissue damage can serve as determinants, consistent with a bio psychosocial model of pain [1,2]. This definition of pain denotes multiple causal factors underlying pain, beyond the issue pathology.

There is no dearth of studies on pain, whether these studies are report of pain from one’s everyday life [3], a topic dealt with in medicine [4], and a topic of scientific investigation [5]. When we talk about pain, can we probe into the mind of the person beyond simply the report, beyond a simplistic scale? Can we move beyond simple indicators, approaching a more detailed description of one’s pain but yet not forcing the respondent to become a scientist?

Pain, a highly subjective phenomenon, often refers to a sensory experience resulting from actual damage to the body or from non-bodily damage [6]. Pain may be influenced by psychological mechanisms such as: attention, emotion, beliefs and expectations [7].

In general, there are two different classifications of physical pain, visceral and somatic. Visceral pain originates in the internal organs whereas somatic pain stems from skin, muscle, soft tissue, and bone. There are many types of pain which fall under these categories. A person’s pain can also be classified as acute or chronic. Pain can be described as nerve pain, psychogenic pain, muscle pain, abdominal pain, back pain, pelvic pain, etc.

Subjective pain is influenced by its intensity and by interventions to treat the pain. Expectations and attitudes towards pain, may stem from psychological processes that are fundamental to learning across various sensory experiences and affect. Understanding expectations and attitudes towards pain may help us form communication messaging to help individuals deal more effectively with their chronic pain.

The subjective nature of pain makes it difficult to test the actual nature of perceived pain across populations, within a country, and in different countries. There are accepted methods of testing the actual perception of pain, specifically pain thresholds and pain tolerance, as well as psychophysical scaling of pain. One example is measuring the time one can submerge a limb in an ice bath, to test the ability of subjects to tolerate pain under varying conditions, most notable with the testing of analgesics of anesthetics. These methods give a measure of the all-or-none response to pain, and even the qualitative nature of the pain, but do not give a sense of the mind of the person who is undergoing the pain.

Increase in pain accompanies one’s beliefs that a certain treatment will cause pain or increase one’s symptoms overtime [7]. Negative beliefs regarding pain and its effects may occur in some types of chronic pains. To test whether expectations affect pain, studies tested the extent to which expectations influenced physiological responses among individuals. Placebo treatments truly reduced pain intensity [8–12]. These studies also indicated that short-term expectations varied and strongly affected perceptions of pain and pain-evoked responses [13].

Other studies linked differences in expectations regarding pain to the magnitude of responses to pain treatments [14]. Research on the relationship between expectations and pain experiences, showed that expectations about treatments and painful stimuli profoundly influenced behavioral markers of pain perception [7].

Pain treatments also bring positive changes in negative emotions [15]. Expectations affect pain through attention, executive functioning, value learning, anxiety and negative emotions [16]. Attitudes towards pain such as anxiety raised subjective pain. Pain is, thus a complex experience, involving sensory, motivational, and cognitive components. Affect any one of these components may change one’s attitudes towards pain [7].

Whereas studies indicate that beliefs influenced pain experience, it is unclear to what extent psychological processes such as attention, anxiety and emotions affect choice of treatments and what communication messages may mediate the effects of these psychological processes. This study tests communication messaging that affect emotion, attitudes towards pain and choice of treatment for pain.

In his book, Pain: The Gift Nobody Wants, author Paul Brand, MD describes his observations across cultures. Growing up as the child of missionaries in India and then moving to the US, Brand noted the difference in pain and suffering that existed in the East versus the West. He noted that, “as a society gained the ability to limit suffering, it lost the ability to cope with what suffering remains”. He stated that he believed that Easterners have learned to control pain at the level of the mind and spirit whereas, Westerners tend to view pain and suffering as an injustice or failure and an infringement on their right to happiness [17].

In the newly developing science of Mind Genomics we attempt to demonstrate a richer understanding of one’s inner life by presenting the respondent (or ill/healthy pain sufferer, here) with vignettes describing the inner experience, instructing the respondent to rate the fit of the vignettes, one at a time, and then estimating the degree to which each of the elements of the vignette ‘fits’ the respondent.

Method

Mind Genomics as an emerging science has been previously presented [18]. Mind Genomics works by presenting respondents with vignettes, combinations of statements which together tell a story. The respondent is instructed to judge the vignette, rating the vignette as a totality. The rating scale for this study is simply ‘How well does this describe you?’

The statements, elements in the language of Mind Genomics, present simple ideas. The approach requires the construction of four questions which ‘tell a story.’ For each question, the researcher is required to provide four answers, all expressed in simple language.  Table 1 presents the four questions, and the four answers to each question. Ideally, the questions and answers should deal with the topic, here pain, but need not mention pain directly. Rather, the questions and answers should be relevant to the topic.

Table 1. The four questions and the four answers to each question.

Question A: how would you describe the nature of pain you are feeling?

Pain bothers me all over my body

The pain is localized but intolerable

The pain radiates and makes it difficult to function

The pain is minor but frequent and annoying

Question B: Describe a situation that would make you feel more comfortable

The doctor explains to me how to deal with the pain

I try to deal with the pain to work through it

I’m happy when I can use a device that delivers therapeutic solution

I just like taking a pill that deals with the pain.

Question C: Describe how would you like to to avoid future pain

I would like to have a diet that is tailored to reduce my pain

I would like exercises and stretches that reduce pain

I would like regular therapy sessions to reduce my pain

I would like a prescription that gives me the medication I need to feel better

Question D: Describe what you would like the doctor to do

The doctor should give me advice

The doctor should give me a shot that delivers long term relief

The doctor should set me up with a system for me to follow

The doctor should give me a regular schedule of visits to treat my pain

The answers in Table 1 are combined by experimental design into a set of 24 vignettes, with each vignette comprising 2–4 elements. Table 2 shows an example of the first six vignettes. The elements appear an equal number of times. Each of the 16 elements is, by design, statistically independent of every other element.

Table 2. The first seven vignettes for the first respondent, created by the experimental design. The table shows the combinations, then the combinations transformed into binary, and then the ratings.

Vig1

Vig2

Vig3

Vig4

Vig5

Vig6

Vig7

A

4

0

4

3

1

0

0

B

3

2

1

2

1

1

3

C

4

2

0

0

4

4

3

D

2

3

4

0

3

1

4

Binary

A1

0

0

0

0

1

0

0

A2

0

0

0

0

0

0

0

A3

0

0

0

1

0

0

0

A4

1

0

1

0

0

0

0

B1

0

0

1

0

1

1

0

B2

0

1

0

1

0

0

0

B3

1

0

0

0

0

0

1

B4

0

0

0

0

0

0

0

C1

0

0

0

0

0

0

0

C2

0

1

0

0

0

0

0

C3

0

0

0

0

0

0

1

C4

1

0

0

0

1

1

0

D1

0

0

0

0

0

1

0

D2

1

0

0

0

0

0

0

D3

0

1

0

0

1

0

0

D4

0

0

1

0

0

0

1

Rating

7

8

4

7

9

7

9

Binary

100

100

0

100

100

100

100

RT (response time) in seconds

10

6

9

6

10

8

7

Each respondent evaluates a unique set of 24 vignettes. The underlying mathematical structure of the experimental design is maintained, but the specific combinations are changed, in a permutation scheme which preserves the mathematical properties of the design [19]. The permutation covers many more combinations of elements compared to the standard approach of creating one experimental design and presenting that design to many respondents.  The Mind Genomics achieves stability by testing many combinations, each a single time, but the expanded coverage ensures that a great of the ‘space of combinations’ is covered. It is difficult to be very ‘wrong’ with a Mind Genomics study because the scope. In contrast, traditional research works with a very small experimental design, e.g., equivalent to the combinations tested by one person, but the combinations are tested by many respondents in order to obtain a stable estimate of the value for each combination.

Mind Genomics and traditional statistics are on opposite sides in terms of what generates valid data. Is valid data obtained by sampling a few of the many possible combinations, albeit with stability for each point (traditional), or by sampling a great many of the combinations, albeit with less stability at any point. A good analogy to Mind Genomics is, metaphorically, the MRI, which discovers the configuration of tissue by taking different ‘snapshots’ and integrating them into one picture.  With the permuted experimental one need not ‘be sure’ that the limited number of combinations is the correct set to represent the total set of possible alternatives. With as few as 25 respondents, the number of respondents participating, generating a total of 720 different combinations has covered the space quite well.

Running the Mind Genomics experiment

The experiment is run on the web, typically with respondents from a specific population who have agreed to participate (e.g., those being treated for a condition), or more typically with respondents recruited from the general population, when the objective is a quick ‘scan’ of what is important.  The base sizes of these studies range from 25 for an exploration to 500 for a massive deconstruction of the population into different mind-sets.  The more typical base size of 25–50 respondents reveals quite a bit about the nature of people’s minds with regard to a particular issue.  This study shows the type of learning emerging from this small base size of respondents from the general population, and can be followed with many different studies to follow up on various interesting aspects.

The elements, answers to the questions, are created by experimental design [20]. The 16 elements are combined into 24 combinations or vignettes, similar in structure to the vignettes shown schematically in Table 2. The vignette can be presented on smartphones, tablets, or PC’s.

Although the respondent might feel that the vignettes are created in a random fashion, the reality is just the opposite. The vignettes are created within the framework of the design, which prescribe the exact combinations. The elements are placed one atop the other, centered, without any connectives, making the respondent’s task easier as the respondent ‘grazes for information’.

The experimental design ensures that the elements are statistically independent; appear several times against different backgrounds provided by the other elements in the vignette. Each respondent evaluates a unique set of 24 vignettes, permuted as noted above, so that the design structure is maintained but the specific combinations are new. The permutation system allows a great deal of the design space, or combinations, to be tested, and allows the information to emerge even when the researcher has absolutely no idea what will be important and what won’t. In other words, Mind Genomics is a discovery system, and not a confirmation system. One can learn quickly from a base of zero knowledge, simply by doing 1–4 easy studies of different facets of a topic.

The respondents who participated were US residents, members of a 10+ million world-wide panel of Luc.id Inc., who had previously agreed to participate in these studies for a reward administered by the panel provider. All respondents participated anonymously. The only information about the respondent was age, gender, and the answer to the third question about what type of pain they had.  There were five answers to the third question, three dealing with chronic pain of various sorts, and two saying either ‘no pain,’ or ‘not applicable.’  All respondents were classified by gender, age, and by either pain/yes versus pain/no.

Preparing the data for analysis

The respondent assigns a rating to assess ‘How much does this describe how you feel’. The low anchor, 1, is ‘not at all.’ The high anchor, 9, is ‘very much.’ The Mind Genomics program bifurcates the scale, dividing it into the lower part, ratings of 1–6, transformed to 0, plus a very small random number (<10–5), and a high part, ratings of 7–9, transformed to 100, plus a very small random number. The bifurcation comes from the decades of experience which suggest that managers and scientists alike do not ‘understand’ the meaning or use of the Likert or category scale, but they easily understand the meaning of a no/yes, binary scale.  The choice of where to bifurcate is left to the researcher. Thirty-five years of experiments suggest that a 2/3 vs 1/3 division seems to work well.  The small random number added to the binary transformed data ensures that when it is time to run the OLS (ordinary least-squares) regression on the data at the level of the individual respondent, there will not be a ‘crash’ of the regression program when the respondent confined the ratings to either the low range (1–6) or to the high range (7–9.) Either of those two cases produces all 0’s or all 1’s, crashing the regression. The small random number ensures that there is variability in the dependent variable, the binary transformed data.

How the different elements drive the binary transformed rating

Table 3 shows the parameters and relevant statistics for the additive model created from the ratings of the total panel, after transformation to a binary scale. The model itself is a simple linear equation of the form: Binary Rating = k0 + k1(A1) + k2(A2) … K16(D4). The experimental design allows us to create the model either at the level of the individual respondent or at the grand level, combining all of the data from the ‘relevant’ respondents, with relevant being

Table 3. Parameters of the model for ‘Fits Me’ after binary transformation. The data come from the Total Panel (720 observations, 24 tested vignettes from each of 30 respondents.) The table is sorted in descending order of coefficient for ‘describes me.’ At the right is the associated coefficient for response time.


Coeff Desc.

T-stat

P-Value

Coeff RT

Additive constant

46

4.68

0.00

C2

I would like exercises and stretches that reduce pain

6

0.95

0.34

0.9

D3

The doctor should set me up with a system for me to follow

2

0.39

0.69

2.1

B2

I try to deal with the pain to work through it

2

0.39

0.70

1.9

A1

Pain bothers me all over my body

1

0.23

0.82

1.3

A3

The pain radiates and makes it difficult to function

0

0.05

0.96

1.6

C3

I would like regular therapy sessions to reduce my pain

-2

-0.28

0.78

1.7

D2

The doctor should give me a shot that delivers long term relief

-3

-0.53

0.59

1.8

D4

The doctor should give me a regular schedule of visits to treat my pain

-3

-0.58

0.56

1.7

B3

I’m happy when I can use a device that delivers therapeutic solution

-4

-0.65

0.52

2.1

D1

The doctor should give me advice

-4

-0.69

0.49

1.5

B1

The doctor explains to me how to deal with the pain

-4

-0.73

0.47

1.8

A4

The pain is minor but frequent and annoying

-5

-0.90

0.37

2.1

A2

The pain is localized but intolerable

-6

-0.95

0.34

1.2

C4

I would like a prescription that gives me the medication I need to feel better

-7

-1.19

0.24

1.4

C1

I would like to have a diet that is tailored to reduce my pain

-7

-1.22

0.22

1.4

B4

I just like taking a pill that deals with the pain.

-8

-1.35

0.18

1.6

The analysis suggests the following:

  1. Additive constant, the expected binary value in the absence of elements: Without any elements, the likely response that the vignette will ‘describe me’ is about 46%. By design, all vignettes comprised 2–4 elements, so the additive constant is an estimated parameter.  Thus, the value of 46 for additive constant says that half the time respondents will answer that whatever appears will describe them. It is the elements which must do the work to move beyond this almost 50% agreement rate. It is worthwhile commenting here that this baseline of 46% is modest. When the topic is credit cards and the rating is ‘interested in acquiring this credit card,’ the additive constant plummets to about 10–15. When the topic is pizza and the rating is ‘interested in eating this pizza,’ the additive constant skyrockets to 60–70.
  2. There are no very strong elements for the total panel: That is, no element drives the description of ‘me.’ This weakness can either be the result of choosing the wrong elements, or the result of dealing with two or perhaps even three or more different populations, who describe their impressions by different terms, and who may live in quite different worlds of pain.
  3. The highest scoring element is C2, I would like exercises and stretches that reduce pain. This element generates a coefficient of only 6, and has a t-statistic of 0.95, with a probability of 0.34 that it came from a distribution with a true mean of 0. That is, it’s quite likely that were we to do this study again, we would come up with a coefficient much lower than 6, probably 0 or thereabouts.
  4. The remaining elements do not ‘fit’ the respondent:  It may well be that the elements are simply incorrect and others will fit the respondent better, or more likely that we are dealing with a segmented population of individuals, some of whom feel that an element ‘fits them,’ whereas others feel that the same element ‘does not fit them.’ In such a situation the responses cancel each other, and we are left with a coefficient around 0, denoting ‘no fit.’

Key subgroups

We know three additional things about the respondent based upon the self-profiling questions completed during the study. The first is gender, the second is age, and the third is whether or not they suffer pain on a regular basis. In this computerized application, the respondent is required to select one of two genders (male/female), and required to put in the year of birth, which provides age.  The third question is left to the discretion of the researcher. In this study is the selection of pain, with five options. Two options are defined as ‘no pain’ (actual selection of ‘no pain’ as an answer, selection of not applicable). The remaining three options as pain (i.e. pain in the limbs, back, etc.).  We will look at gender, age, and self-reported pain as the three self-defined subgroups. We will also explore two new subgroups, mind-sets inherent in the population but revealed by understanding patterns of responses, behavioral patterns, rather than self-classification.

The focus of interest in Mind Genomics studies is on the additive constant as the ‘baseline,’ and then on the ‘story’ told by the winning elements.  These elements are operationally defined as having a value of +6.51 or higher, which becomes 7 when rounded to the nearest whole number.

Gender

  1. Males show a higher additive constant than do females (57 vs 38). In the absence of elements, men are more likely to say that a vignette ‘describes ME.’  Women are less likely to say that, and require more specification.
  2. We get a good sense of what is important by looking at the elements which are most positive (most like me), and most negative (least like me)
  3. For men, the single phrase which most describes them is

    C2: I would like exercises and stretches that reduce pain

  4. For men, the single phrase which least describes them is

    C1: I would like to have a diet that is tailored to reduce my pain

  5. For women, the two phrases phrase which most describe them are

    B2: I try to deal with the pain to work through it,

    A1: Pain bothers me all over my body. The degree of fit is less, however, for these elements than the corresponding best fits for males.

  6. For women, the phrase which least describes them is

    B4: I just like taking a pill that deals with the pain.

Age: Under 50 versus 50+

Respondents provided the year of their birth. One respondent did not provide the year and was eliminated from this particular analysis by age.

  1. Surprisingly, the additive constant is much higher for the younger respondents versus the for the older respondents (48 vs 31.)
  2. For the younger respondents, there are no strong elements which fit them. The two elements which most describe them are those which suggest control over the pain:

    C2: I would like exercises and stretches that reduce pain

    D3: The doctor should set me up with a system for me to follow

  3. For the younger respondents, the two elements which least describe them are those which suggest passivity, and no control over the pain.

    B1: The doctor explains to me how to deal with the pain

    B4: I just like taking a pill that deals with the pain.

  4. For the older respondents, the two elements which most describe them are actual experience to reduce the pain, as well as a description of the experience.

    A3: The pain radiates and makes it difficult to function

    C2: I would like exercises and stretches that reduce pain

  5. For the older respondents, the three elements which least describe them is passivity

    D1: The doctor should give me advice

    C4: I would like a prescription that gives me the medication I need to feel better

    C1: I would like to have a diet that is tailored to reduce my pain

No pain versus pain

As part of the self-profiling classification, the respondents selected the type of pain, if any, afflicting them. The respondents who check any of the three types of pain assigned to the group saying YES. The remaining respondents were assigned to the group saying NO.

  1. The additive constant is virtually the same, 46 vs 48, meaning that in the absence of elements in the vignette; a little fewer than 50% of the responses will be ‘describes me.’
  2. For those with pain, the phrase which most describes them is

    C2:  I would like exercises and stretches that reduce pain.

  3. For those with pain, the element which least describes

    C1:  I would like to have a diet that is tailored to reduce my pain

  4. For those with no pain, virtually no element most describes them
  5. For those with no pain, many elements least describe. The strong element which least describes is

    C4: I would like a prescription that gives me the medication I need to feel better

Mind-Sets: Dividing respondents by the patterns of their coefficients for a specific topic

We have just seen that there are some differences in terms of ‘describes me’ across genders, and across those who define themselves as having pain versus no pain. These are ways that people describe themselves. People may differ in ways that the researcher cannot describe in simple terms, or even in way that they themselves don’t understand.

A major tenet of Mind Genomics is that within any topic area, such as the description of pain presented here, there are fundamental differences across people, differences that are obvious once demonstrated, but differences limited to a single topic area.  This is the case of the data here. Even within the small sample of 30 respondents we can extract two, possibly three different mind-sets. The method for extracting mind-sets has been previously described [21]. Quite simply, the technique is a matter of clustering the respondents into two or three groups based upon the pattern of their 16 coefficients. The statistical method of clustering is well accepted [22] All that remains is the clustering, extracting the small groups with the property that these mutually exclusive groups represent different ways of thinking about the topic.

Table 4 shows the results for the two mind-set segments emerging from the clustering of the 30 respondents. A base size of 25–30 suffices to reveal the nature of these different mind-sets, especially because the segments are so obviously different and interpretable.

Table 4. Coefficients for the binary-transformed scale ‘Describes me’ across gender, age, pain, and mind-set, respectively. Coefficients of +7 or more are presented in bold, and shaded.


Male

Female

Age<50

Age 50+

Pain Yes

Pain No

Mind Set 1: Wants a cure

Mind Set 2: Simplicity through the doctor

Additive constant

57

38

58

31

46

48

37

54

A1

Pain bothers me all over my body

1

4

-1

3

6

-9

10

-9

A2

The pain is localized but intolerable

-4

-4

-9

0

-3

-11

-2

-9

A3

The pain radiates and makes it difficult to function

1

1

-7

9

2

-4

10

-11

A4

The pain is minor but frequent and annoying

-11

2

-5

-2

-2

-12

-3

-8

B1

The doctor explains to me how to deal with the pain

-8

-1

-11

2

-7

1

3

-12

B2

I try to deal with the pain to work through it

-2

4

-1

4

4

-2

8

-3

B3

I’m happy when I can use a device that delivers therapeutic solution

-6

-3

-7

-1

-4

-2

1

-9

B4

I just like taking a pill that deals with the pain.

-9

-8

-12

-5

-7

-11

-16

1

C1

I would like to have a diet that is tailored to reduce my pain

-15

0

-5

-10

-10

-3

2

-17

C2

I would like exercises and stretches that reduce pain

13

-3

5

7

10

-5

9

3

C3

I would like regular therapy sessions to reduce my pain

-1

-3

-3

1

-2

-2

3

-7

C4

I would like a prescription that gives me   the medication I need to feel better

-11

-4

-4

-9

-5

-14

-9

-5

D1

The doctor should give me advice

-7

-5

-1

-9

-4

-3

-2

-4

D2

The doctor should give me a shot that delivers long term relief

-9

0

-1

-5

-3

-3

-6

3

D3

The doctor should set me up with a system for me to follow

-1

2

5

-1

4

-2

-4

10

D4

The doctor should give me a regular schedule of visits to treat my pain

-10

1

0

-5

-2

-6

-8

4

  1. Mind-Set 1 (wants a cure) begins with a low additive constant, 37. To them, it’s not the general response which ‘describes me’ but rather the specific phrase. Mind-Set 1 suffers pain, and wants a cure. Here are the elements which Mind-Set 1 feels best describes them:

    A1: Pain bothers me all over my body

    A3: The pain radiates and makes it difficult to function

    C2: I would like exercises and stretches that reduce the pain

  2. Mind-Set 1 do not want simple medical treatment which will alleviate their pain. Here is the element which is they feel least describes them:

    B4: I just like taking a pill that deals with the pain.

  3. Mind Set 2 (simplicity through the doctor) shows a higher additive constant, 54. Mind-Set 2 is less discriminating among elements. Mind-Set 2 wants simplicity. Here is the one element that they feel best describes them:

    D3: The doctor should set me up with a system for me to follow

  4. Mind Set 2 does not want to take responsibility. Here are the elements that they feel least describe them:

    C1: I would like to have a diet that is tailored to reduce my pain

    B1: The doctor explains to me how to deal with the pain

    A3: The pain radiates and makes it difficult to function

Response times as a measure of cognitive processing of information

At the same time that the respondents were reading the vignettes, the response time was being measured. Response time is operationally defined as the time between the appearance of the vignette and the assignment of the rating. The experiment was executed on the internet.

 The respondent was unaware of response time being measured, being instructed simply read the vignette and assign a ‘gut-level’ judgment. Occasionally, in about 10% of the cases, the response time was longer than 10 seconds, suggesting that the respondent was doing something as well, so-called multi-tasking. Those response times of 10 seconds or longer were recoded as 10 seconds. Figure 1 shows the distribution of the 720 response times (30 respondents, each evaluating 24 vignettes)

Mind Genomics-008 IMROJ Journal_F1

Figure 1. Distribution of response times for the total panel of 30 respondents, each rating 24 unique vignettes.

Response time patterns for different subgroups

The measurement of response times as a key feature of Mind Genomics began during the summer of 2019. In the studies run since that introduction, the response time data suggests that when the topic deals with an important health issue, the respondents spend a long time reading the vignette, and thus their response times are long, often 1.0 seconds or longer. When the topic deals with something commercial or ‘fun’ the response times are very short, around 0.2 – 0.7 seconds.

Table 5 presents the response time coefficients for the key subgroups. The model for response time is written in the same way as the model for the binary transformed rating, with the key difference being that that the model for response time does not have an additive constant. The ingoing assumption is that the response time is 0 when there are no elements in the vignette.

Table 5. The coefficients for the response time models. The models do not feature an additive constant.


Male

Female

Age <50

Age 50+

Pain YES

Pain NO

Mind-Set 1: Wants a cure

Mind-Set 2: Simplicity through the doctor

A1

Pain bothers me all over my body

1.3

1.1

1.0

1.6

1.0

2.0

1.3

1.3

A2

The pain is localized but intolerable

1.0

1.2

1.3

1.1

1.1

1.5

1.0

1.4

A3

The pain radiates and makes it difficult to function

1.7

1.5

1.8

1.4

1.8

1.2

1.6

1.7

A4

The pain is minor but frequent and annoying

2.5

1.7

1.9

2.5

1.9

2.7

1.8

2.6

B1

The doctor explains to me how to deal with the pain

1.8

1.9

1.2

2.6

1.9

1.6

1.8

1.7

B2

I try to deal with the pain to work through it

2.3

1.6

1.6

2.1

2.1

1.5

2.1

1.7

B3

I’m happy when I can use a device that delivers therapeutic solution

2.1

2.3

1.8

2.7

2.3

1.8

2.0

2.2

B4

I just like taking a pill that deals with the pain.

2.0

1.0

1.1

2.2

1.9

0.8

1.4

1.8

C1

I would like to have a diet that is tailored to reduce my pain

1.6

1.0

1.5

1.5

1.7

0.5

1.3

1.4

C2

I would like exercises and stretches that reduce pain

1.2

0.6

1.2

0.8

1.3

-0.1

0.9

1.0

C3

I would like regular therapy sessions to reduce my pain

1.9

1.5

1.7

1.9

2.0

0.9

1.4

1.9

C4

I would like a prescription that gives me the medication I need to feel better

2.1

0.6

1.7

1.6

2.0

0.0

1.2

1.7

D1

The doctor should give me advice

1.5

1.5

1.4

1.5

1.5

1.3

1.4

1.6

D2

The doctor should give me a shot that delivers long term relief

1.5

2.1

1.6

2.0

1.9

1.5

1.7

1.9

D3

The doctor should set me up with a system for me to follow

1.7

2.7

2.0

2.2

2.0

2.2

2.4

1.8

D4

The doctor should give me a regular schedule of visits to treat my pain

1.7

1.8

1.4

2.0

1.8

1.4

1.3

2.1

In Table, coefficients of 2.0 or higher are shaded and shown in bold. These are the elements to which the respondent pays attention.  There are some simple patterns which emerge from visual inspection of these elements that are processed ‘more slowly.’

  1. For gender, males focus on the description of symptoms.

    A4  The pain is minor but frequent and annoying

    B2   I try to deal with the pain to work through it

    B3   I’m happy when I can use a device that delivers therapeutic solution

    C4  I would like a prescription that gives me the medication I need to feel better

    B4   I just like taking a pill that deals with the pain.

  2. For gender, females want a relationship, or at least someone/something external to them.

    D3  The doctor should set me up with a system for me to follow

    B3   I’m happy when I can use a device that delivers therapeutic solution

    D2  The doctor should give me a shot that delivers long term relief

  3. For age, those under 50 focus on only one element:

    D3  The doctor should set me up with a system for me to follow

  4. For age, those 50+ focus on a number of phrases, most dealing with methods to assure pain reduction

    B3   I’m happy when I can use a device that delivers therapeutic solution

    B1   The doctor explains to me how to deal with the pain

    A4  The pain is minor but frequent and annoying

    B4   I just like taking a pill that deals with the pain.

    D3  The doctor should set me up with a system for me to follow

    B2   I try to deal with the pain to work through it

    D4  The doctor should give me a regular schedule of visits to treat my pain

    D2  The doctor should give me a shot that delivers long term relief

  5. For pain, those with PAIN YES, i.e., who say they suffer from one or another pain, the focus is on what stops the pain, i.e., assure pain reduction

    B3   I ‘m happy when I can use a device that delivers therapeutic solution

    B2   I try to deal with the pain to work through it

    D3  The doctor should set me up with a system for me to follow

    C3  I would like regular therapy sessions to reduce my pain

    C4  I would like a prescription that gives me the medication I need to feel better

  6. For pain, those with PAIN NO, i.e., who say that they do not suffer from pain, the focus is on descriptions of pain

    A4  The pain is minor but frequent and annoying

    D3  The doctor should set me up with a system for me to follow

    A1  Pain bothers me all over my body

  7. For Mind-Sets, Mind-Set 1 (Wants a cure)

    D3  The doctor should set me up with a system for me to follow

    B2   I try to deal with the pain to work through it

    B3   I’m happy when I can use a device that delivers therapeutic solution

  8. For Mind-Sets, Mind-Set 2 (Simplicity through the doctor)

    A4  The pain is minor but frequent and annoying

    B3   I’m happy when I can use a device that delivers therapeutic solution

    D4  The doctor should give me a regular schedule of visits to treat my pain

Finding the mind-sets in the population using a PVI (Personal Viewpoint Identifier)

The mind-sets reveal different ways of perceiving the nature of pain.  The mind-sets represent a way to divide what is likely a continuum of feelings and points of view into at least two distinct groups, a division which may provide further understanding, and certain a division that can be used to deal with patients in different, and possibly more appropriate fashion.

Table 6 shows, however, that it’s unlikely to identify mind-sets by their age and gender. It is also quite possible that there are no direct classifications of who a person ‘is’ or what a person ‘experiences’ which can easily assign a person to one of these two mind-sets.

Table 6. How the two emergent mind-sets for pain distribute on the self-profiling classification in terms of age, sex, and experience of pain.


Mind-Set1 Wants a cure

Mind-Set2 Simplicity through the doctor

Total

Male

6

10

16

Female

9

5

14

Total

15

15

30

Under 50

7

9

16

50+

7

6

13

Total

14

15

29

NOPAIN

6

3

9

YESPAIN

9

12

21

Total

15

15

30

An alternative way to assign new individuals to mind-set has been developed by author Gere. It is called the PVI, the personal viewpoint identifier. The PVI comprises a set of six questions, answered with one of two answers, no or yes.  The pattern of the answers to the six questions assigns the respondent to one of the two mind-sets.  Figure 2 shows the PVI questionnaire at the left, and the response emerging, given either to the physician and/or to the patient/client.  The questions themselves are taken from the actual study. These are the answers or elements, now turned into questions.

The PVI can be deployed along with additional information obtained during the questions. Thus, Figure 2 shows that the respondent, a new person not part of the previous study establishing the PVI, is asked for his or her email. Other questions can be asked, to relate mind-set membership to external variables, whether of a medical/health nature, or of a life-style nature.

Discussion & Conclusions

Since pain is a complex sensation involving sensory, motivational, and cognitive components, and affecting any one of these may change one’s attitudes towards pain [7]; we tested the effect of communication messaging, across mind-set segments towards pain. We tested how each min-set segment we identified emotionally responds to chronic pain, and which treatment choices are preferred by attitudinal mind-sets towards pain.

People who belong to the first mind-set segment feel the pain as radiating and challenging their daily functioning. The pain is very bothersome, but they choose to alleviate it by exercises and stretching. They chose to avoid medical treatment to simply deal with the pain and its ramifications.  People belonging to the second mind-set segment also view their chronic pain as radiating and challenging their daily functioning.  They, however, choose to simply take pain medication their doctor will prescribe.  They expect their doctor to also set them up with a system to follow.  In addition, they do not want to take responsibility for self-managing the illness which causes their pain. They prefer to avoid a diet that is tailored to reduce their pain.

Mind Genomics-008 IMROJ Journal_F2

Figure 2. The PVI created for the pain study. The link for the PVI as of this writing (Feb. 2019) is: http://162.243.165.37:3838/TT13/

This study also illustrated how a medical professional may easily identify the mind-set segment to which a patient belongs and accord communication messaging to patient choices and values. Identification of the mind-set to which a patient belongs may assist in building patient-physician trust resulting in higher patient adherence and better implementation of patient-centered care [21].

Mind Genomics provides the ability to segment out populations that share a common mind type and thereby help identify the possibility of determining the types of pain that a person is most likely to experience. It may help answer the question of why people with the same disease experience pain in profoundly different ways. By mind-typing patients who share ailments, Mind Genomics may aid in helping tailor a treatment plan best suited to that individual lying within a disease spectrum.

In light of the current opioid epidemic, it more important, now more than ever, to address how to customize pain treatments to individuals. There are many modalities to treat pain. In the West, pain medications are the first line of treatment. These medications include narcotics/opiates, Non-Steroidal Anti-Inflammatory Drugs (NSAIDs), acetaminophen, certain antidepressants, muscle relaxants, anticonvulsants, corticosteroids, local anesthetics, and most recently medical marijuana. Other modalities such as Transcutaneous Nerve Stimulation (TENS), implantable spinal cord stimulators, meditation and biofeedback are also used to help combat pain. Health care professionals who specialize in pain management use experience and training to try and help tailor treatment regimens to the individual patient. But a tool like Mind Genomics may help the practitioner go beyond the current protocols and prejudices of current practice. Mind Genomics may provide a “cheat sheet” to the patient’s mind and help provide a short cut to success by focusing on pathways that will more likely work for a given patient and eliminating the pathways that will waste time and resources.

References

  1. Hadjistavropoulos T, Craig KD, Duck S, Cano A, Goubert, L, et al. (2011) A biopsychosocial formulation of pain communication. Psychological bulletin 137: 9.
  2. Williams AC, Craig KD (2016) Updating the definition of pain. Pain 157: 2420– 2423. [crossref]
  3. Baker KS, Gibson S, Georgiou-Karistianis N, Roth RM, Giummarra MJ (2016) Everyday executive functioning in chronic pain: specific deficits in working memory and emotion control, predicted by mood, medications, and pain interference. The Clinical Journal of Pain 32: 673–680.
  4. Morrison RS, Maroney-Galin C, Kralovec PD, Meier (2005) The growth of palliative care programs in United States hospitals. Journal of Palliative Medicine 8: 1127–1134.
  5. Schug SA, Palmer GM, Scott DA, Halliwell R, Trinca J (2016) Acute pain management: scientific evidence, 2015. Medical Journal of Australia 204: 315–317.
  6. Loeser JD, Treede RD (2008) The Kyoto protocol of IASP Basic Pain Terminology. Pain 137: 473–477. [crossref]
  7. Atlas LY, Wager TD (2012) How expectations shape pain. Neurosci Lett 520:140–148. [crossref]
  8. Goffaux P, de Souza JB, Potvin S, Marchand S (2009) Pain relief through expectation supersedes descending inhibitory deficits in fibromyalgia patients. Pain 145: 18–23.
  9. Goffaux P, Redmond WJ, Rainville P, Marchand S (2007) Descending analgesia–when the spine echoes what the brain expects. Pain 130: 137–143. [crossref]
  10. Matre D, Casey KL, Knardahl S (2006) Placebo-induced changes in spinal cord pain processing. Journal of Neuroscience 26: 559–563.
  11. Price DD, Craggs J, Verne GN, Perlstein WM, Robinson ME (2007) Placebo analgesia is accompanied by large reductions in pain-related brain activity in irritable bowel syndrome patients. Pain 127: 63–72.
  12. Alkes L. Price, Arti Tandon, Nick Patterson, Kathleen C. Barnes, Nicholas Rafaels, et al (2009) Sensitive Detection of Chromosomal Segments of Distinct Ancestry in Admixed Populations. PLoS Genet 5: 1000519.
  13. Atlas LY, Bolger N, Lindquist MA, Wager TD (2010) Brain mediators of predictive cue effects on perceived pain. J Neurosci 30: 12964–12977. [crossref]
  14. Watson A, El-Deredy W, Iannetti GD, Lloyd D, Tracey I, et al. (2009) Placebo conditioning and placebo analgesia modulate a common brain network during pain anticipation and perception. PAIN 145: 24–30.
  15. Wager TD, Atlas LY, Leotti LA, Rilling JK (2011) Predicting individual differences in placebo analgesia: contributions of brain activity during anticipation and pain experience. Journal of Neuroscience 31: 439–452.
  16. Flaten MA, Aslaksen PM, Lyby PS, Bjørkedal E (2011) The relation of emotions to placebo responses. Philosophical Transactions of the Royal Society B: Biological Sciences 366: 1818–1827.
  17. Brand PW, Yancey P (1993) Pain: the gift nobody wants. New York, HarperCollins Publishers.
  18. Moskowitz HR, Gofman A, Beckley J, Ashman H (2006) Founding a new science: Mind genomics. Journal of sensory studies 21: 266–307.
  19. Gofman A, Moskowitz HR (2010) Isomorphic permuted experimental designs and their application in conjoint analysis. Journal of Sensory Studies 25: 127–145.
  20. Box GE, Hunter JS, Hunter WG (2005) Statistics for experimenters: design, innovation, and discovery (Vol. 2). New York: Wiley-Interscience.
  21. Gabay G, Moskowitz HR, Silcher M, Galanter E (2017) The New Novum Organum: Policies, Perceptions and Emotions in Health. Pardes-Ann Harbor Publishing.
  22. Moskowitz HR, Martin DM (1993) How computer aided design and presentation of concepts speeds up the product development process. Paper presented at the ESOMAR Congress, September, 1993, Copenhagen.
  23. Eippert F, Finsterbusch J, Bingel U, Büchel C (2009) Direct evidence for spinal cord involvement in placebo analgesia. Science 326: 404. [crossref]
  24. Moskowitz, HR (2012) ‘Mind genomics’: The experimental, inductive science of the ordinary, and its application to aspects of food and feeding. Physiology & behavior 107: 606–613.

The Impact of Accountable Care Units on Patient Outcomes

Abstract

Background: Effective hospital teams can improve outcomes, yet, traditional hospital staffing, leadership, and rounding practices discourage effective teamwork and communication. Under the Accountable Care Unit model, physicians are assigned to units, team members conduct daily structured interdisciplinary bedside rounds, and physicians and nurses are jointly responsible for unit outcomes.

Objectives: To evaluate the impact of ACUs on patient outcomes.

Design: Retrospective, pre-post design with concurrent controls.

Patients: 23,406 patients admitted to ACU and non-ACU medical wards at a large academic medical center between January 1, 2008 and December 31, 2012.

Measures: In-hospital mortality and discharge to hospice, length of stay, 30-day readmission.

Results: Patients admitted to ACUs were less likely to be discharged dead or to hospice (-1.8 percentage point decline [95% CI: -3.3, -0.3; p = .015]) ACUs did not reduce 30 day readmission rates or have a significant effect on length-of-stay.

Conclusions: Results suggest ACUs improved patient outcomes. However, it is difficult to identify the impact of ACUs against a backdrop of low inpatient mortality and the development of a hospice unit during the study period.

Keywords

quality improvement, teamwork, hospital medicine, care standardization

Introduction

Under the traditional model of inpatient staffing, hospitals nurses and allied health professionals are assigned to a unit, while hospital medicine physicians treat patients on multiple units. Care is delivered asynchronously. Physicians see patients when their schedules permit, usually early in the morning or in the late afternoon and update orders at those times. Nurses and other professionals care for patients separately. They may not see the physician during rounds, and their priorities for patient care may be different from those of the physician. In our experience, they often obtain information from second-hand sources or the often difficult-to-decipher notes in patients’ charts.

The traditional, physician-centric model of inpatient care poses significant coordination and incentive problems. Beginning in October 2010, Emory University Hospital re-organized two medical units into Accountable Care Units (ACU® units). In the ACU care model, hospital-based physicians are assigned to a home unit where they can focus on the patients in the unit and work with the same nurse team. By assigning physicians to home units with other unit-based personnel such as nurses and having teams engage in structured interdisciplinary bedside rounds, ACUs enable clinicians to recognize preventable hospital complications and signs of deterioration or diagnostic error that might otherwise have been missed and implement a coordinated response.

Previous publications on the ACU model have been mostly descriptive in nature [1–4]. Using electronic medical records and a pre-post study design with concurrent controls, we retrospectively evaluated the effect of ACUs on patient mortality, length of stay, and readmissions at Emory University Hospital.

Methods

Intervention

Emory University Hospital is a 500 bed teaching hospital in Atlanta, Georgia. Prior to the implementation of ACUs, hospital medicine physicians at Emory University Hospital treated patients in as many as eight units. In the first unit to be organized into an ACU, patients were divided between five physician care teams prior the re-organization. Beginning in October 2010, Emory University Hospital assigned two physician care teams to each of two newly-constituted ACU units. ACUs combine a number of interventions, some of which have been implemented at other hospitals [5–8] , into a single, cohesive bundle.

ACU physician teams were assigned to units and included one hospital medicine attending physician, one internal medicine resident, and three interns. Within an ACU, two teams rotated call schedules over a 24 hour period. The team on-call admitted every patient who arrived at the unit. The same nurse teams continued to staff each unit as before the reorganization.

ACUs standardize communication through a series of brief but highly scripted intra- and inter-professional exchanges to review patients’ conditions and care plans. Each shift change begins with a five minute huddle where the departing staff hands over the unit to the incoming staff. During the huddle, the departing staff alerts the incoming staff to patient- and quality-related issues. After the huddle, nurses hand over individual patients at the bedside using a structured format, highlighting patient-level factors that might indicate patient instability or are outside the expected range. Once a day, each patient’s care team meets for structured interdisciplinary bedside rounds. Structured interdisciplinary bedside rounds bring the bedside nurse, attending physician, and unit-based allied health professionals to the bedside every day with the patient and family members to review the patient’s current condition, response to treatment, care plan, and discharge plan collaboratively [5–8]. Evidence-based actions, such as “bundles” to prevent hospital acquired conditions, are embedded in structured interdisciplinary bedside rounds, and reported on by the patient’s nurse. A scripted, standard communication protocol reduces extraneous communication and focuses the structured interdisciplinary bedside round team’s attention on aspects of patients’ conditions that are responsive to staff attention and effort.

A unit leadership dyad, consisting of a nurse manager and senior physician, set explicit expectations for staff and manage unit process and performance. Physicians operating in the traditional model may be unaware of unit-level quality protocols and outcome measures. As part of the re-organization, a data analyst prepared quarterly unit-level performance reports describing rates of in-hospital mortality, blood stream infections, 30-day readmissions and patient satisfaction scores and length of stay. These reports are used by hospital administrators to set goals for the ACU leadership team and may figure into the performance evaluations of ACU administrators. Readers interested in additional details about the ACU model are urged to consult previous publications [1–4].

Following implementation of ACUs, physician teams assigned to ACUs saw patients on only 1.5 units, with 90% of their patients located in the ACUs, compared to non-ACU physician teams, which cared for patients spread across 6 to 8 units every day.1 The number of patient encounters per day for the ACU physician teams increased from 11.8 in the year before the ACUs (when the teams were not unit based) to 12.9 in the four years following implementation [1]. No changes were made to nurse staffing levels (1 to 4 or 5 nurses per patient).

During the study period, Emory University Hospital created two ACUs, but medical patients were also admitted to seven other units in the hospital. The units that became ACUs were selected because nearly all the patients were under the care of hospital medicine attending physicians so we could designate them as hospital medicine units. In other units, hospital medicine patients were mixed in with patients from other specialties (for example, cardiology). The assignment of patients to ACUs or other medical units was determined by bed control officers based on a mix of criteria that can include bed availability, relative patient wait times, and individual judgement. Bed managers know patients’ names, medical record number, and admitting diagnosis when they assign patients to units. They do not know have access to other prognostic indicators.

Study Sample

The study sample includes patients ages 18 and older admitted to the medical units of Emory University Hospital between January 1, 2008 and December 31, 2013. Following an intent-to-treat framework, we grouped patients who were transferred into ACUs during their hospital stay with non-ACU patients. Patients admitted to surgical, orthopedic, observation, or other specialty units (e.g. medical oncology) were excluded from the analysis, as were patients with cystic fibrosis who are treated only within one of the two ACUs. Patients in the control group were spread across 38 units, though 70% were in just 8 of these units.

Data and Outcome Variables

All study variables are captured in Emory’s internal electronic medical record and administrative data systems. We evaluated the impact of ACUs on in-hospital mortality, discharge to hospice, length of stay, readmission or emergency department visit to Emory University hospital within 30 days, and hospital-acquired urinary tract infection and deep vein thrombosis and pulmonary embolism. We counted a patient as having hospital-acquired urinary tract infection and deep vein thrombosis and pulmonary embolism if their records listed ICD-9 codes for these condition but not if they were among the present-on-admission ICD-9 codes.

Emory University Hospital opened an on-site hospice during the study period in November 2010, potentially reducing the barriers to transferring patients from the hospital to hospice care. While discharge to hospice is in many cases an indication of appropriate care, the opening of the inpatient hospice complicates efforts to measure trends in in-patient mortality. The opening of the unit may be responsible for changes in the site of death for patients admitted to the hospital over time. For this reason, we highlight the impact of ACUs on the combined outcome of in-hospital death or discharge to hospice.

Statistical Analysis

We compared patient characteristics between ACUs and control units using chi-squared tests. We estimated the impact of ACUs on these outcomes using a difference-in-difference study design (equivalently, a pre/post study with a concurrent control group). The pre period was January 1, 2008 to October 31, 2010. The post period was November 1, 2010 to December 31, 2012. We calculated the change in outcomes between the pre and post periods among patients admitted to the units that became ACUs and the change among patients in the control group. The difference of these changes is the difference-in-difference estimator. It assesses changes in outcomes in the units that became ACUs relative to changes in the control group. It assumes that absent any change in policy (i.e., the implementation of ACUs), trends in outcomes among patients admitted to the ACUs would have mirrored trends among patients in the control group. We calculated 95% confidence intervals for unadjusted estimates using z-tests. We used logistic regression with robust standard errors to estimate adjusted effects for in-hospital mortality and hospice discharges and readmissions. We used Poisson regression with robust standard errors to estimate adjusted effects for length of stay. We calculated standard errors and 95% confidence intervals for the difference-in-difference estimator using the Delta method [9].

In multivariable analysis, we adjusted estimates for patient age group, sex, race, primary payer, admission source (hospital or skilled nursing facility versus other), and Elixhauser comorbidities (based on all diagnosis codes) [10] that were present in at least 2.5% of patients in the sample. About one-third of the sample had missing values for admission source. We included each Elixhauser comorbidities as a separate variable in the model rather than collapsing the conditions into a count to avoid imposing unnecessary restrictions on the relationship between conditions and outcomes. Conditions are not mutually exclusive.

Estimates from difference-in-difference models may be biased if there are pre-existing trends in outcomes that differ between ACU and non-ACU units. We tested for pre-existing trends by estimating a model that included, in addition to the variables described above, indicators for the years in the pre-period (2008 to 2010) and these year indicators interacted with treatment group (ACU versus non ACU). We assessed the significance of the year-group interactions and used a likelihood ratio test to compare the model fit with a model that omitted the year-group interactions [11].

Estimates of the impact of ACUs on in-hospital mortality and hospice discharge rates may be biased by differences in length of stay. An intervention that reduces length of stay but does not affect mortality rates will reduce in-hospital mortality rates by shifting the place of death from the hospital to the community. In a sensitivity analysis we assessed the robustness of logistic regression estimates by estimating a Weibull survival model with robust standard errors of the time to hospice discharge or in-hospital death. Records for patients who were not discharged to hospice or dead are censored.

Results

There were 23,403 patients included in the study sample, of whom 10,639 were admitted to the ACU units (including patients admitted to the units before they became ACUs) and 12,764 patients in the control group. There are significant differences in some of the characteristics of ACU and control group patients in the pre and post periods (Table 1), but most differences are qualitatively small. There are some clinically meaningful differences in patients’ diagnoses. For example, in the pre-ACU period, 8.2% of patients in the control group had a solid tumor compared to 6.7% in the ACU group.

The unadjusted proportion of ACU patients discharged to hospice or dead declined from 7.7% to 5.8% (Figure 1) or -2.0 (95% CI: -2.9, -1.0) percentage points. The unadjusted proportion of patients discharged to hospice and dead both declined. A reduction in in-hospital mortality rates accounted for 70% of the decline (= [2.5–1.1] ÷ 2).

IMROJ 2019-105 - Jason Stein USA_figure1

Figure 1. Discharge destination in ACUs and control units

Table 1. Sample characteristics

  Pre

 Post


All


Control patients

ACU patients

P-value

Control patients

ACU patients

P-value

N (%)

N (%)

N (%)

N

23,403

6,219

5,499

6,545

5,140

Age

<0.001

.043

18–49

6,580

(28.1)

1,721

(27.7)

1,577

(28.7)

1,827

(27.9)

1,455

(28.3)

50–64

5,760

(24.6)

1,459

(23.5)

1,477

(26.9)

1,582

(24.2)

1,242

(24.2)

65–74

3,900

(16.7)

1,000

(16.1)

904

(16.4)

1,089

(16.6)

907

(17.6)

75–84

3,850

(16.5)

1,063

(17.1)

883

(16.1)

1,051

(16.1)

853

(16.6)

85+

3,313

(14.2)

976

(15.7)

658

(12.0)

996

(15.2)

683

(13.3)

White

11,719

(50.1)

3,314

(53.3)

2,796

(50.8)

.008

3,195

(48.8)

2,414

(47.0)

.047

Male

9,939

(42.5)

2,542

(40.9)

2,393

(43.5)

.004

2,746

(42.0)

2,258

(43.9)

.032

Insurance status

.024

.965

Medicare

12,079

(51.6)

3,144

(50.5)

2,728

(49.6)

3,470

(53.0)

2,737

(53.2)

Medicaid

2801

(12.0)

632

(10.2)

642

(11.7)

849

(13.0)

677

(13.2)

Self-pay

1598

(6.8)

416

(6.7)

400

(7.3)

439

(6.7)

343

(6.7)

Private/Other

2504

(10.7)

5,171

(83.1)

4,457

(81.1)

5,257

(80.3)

4,120

(80.2)

Admitted from facility

2504

(10.7)

798

(12.8)

503

(9.1)

<0.001

730

(11.2)

473

(9.2)

0.001

Diagnoses

Congestive heart failure

1,998

(8.5)

438

(7.0)

389

(7.1)

.948

653

(10.0)

518

(10.1)

.857

Pulmonary circulation disorders

1,211

(5.2)

331

(5.3)

252

(4.6)

.066

399

(6.1)

229

(4.5)

<0.001

Hypertension

719

(3.1)

148

(2.4)

179

(3.3)

.004

217

(3.3)

175

(3.4)

.790

Other neurological disorders

2,869

(12.3)

530

(8.5)

631

(11.5)

<0.001

867

(13.2)

841

(16.4)

<0.001

Chronic pulmonary disease

1,205

(5.1)

287

(4.6)

268

(4.9)

.511

352

(5.4)

298

(5.8)

.326

Diabetes

895

(3.8)

188

(3.0)

201

(3.7)

.057

258

(3.9)

248

(4.8)

.020

Renal failure

1,531

(6.5)

234

(3.8)

315

(5.7)

<0.001

473

(7.2)

509

(9.9)

<0.001

Liver disease

796

(3.4)

142

(2.3)

215

(3.9)

<0.001

211

(3.2)

228

(4.4)

.001

Metastatic cancer

694

(3.0)

248

(4.0)

170

(3.1)

.009

152

(2.3)

124

(2.4)

.750

Solid tumor

1,548

(6.6)

512

(8.2)

371

(6.7)

.002

365

(5.6)

300

(5.8)

.547

Fluid and electrolyte disorders

1,814

(7.8)

410

(6.6)

379

(6.9)

.519

506

(7.7)

519

(10.1)

<0.001

Deficiency anemias

672

(2.9)

150

(2.4)

176

(3.2)

.010

179

(2.7)

167

(3.2)

.104

The unadjusted proportion of patients in the control group discharged to hospice or dead declined from 7.9% to 7.1%, or -0.8 (95% CI: -1.7, 0.1) percentage points. A decline in the proportion of patients discharged dead was offset by an increase in the proportion discharged to hospice.

Adjusted estimates of the impact of ACUs are displayed in the last columns of Table 2. (Full regression results are available in the Appendix Table.) The adjusted estimate of the impact of ACUs on the composite outcome of discharged dead or to hospice is -1.8 (95% CI: -3.3, -0.3; p = .015) percentage points. The adjusted difference-in-difference estimate of the impact of ACUs on length of stay is negative but not statistically significant (-0.5 days [95% CI: -1.2, -0.3; p =.21]). The estimates for 30 day readmissions and hospital-acquired urinary tract infections are close to 0. The estimate of the impact of ACUs on the occurrence of pulmonary embolism/deep vein thrombosis was positive and borderline significant (0.6 percentage points [95% CI: -0.05, 1.3] p = .07).

Table 2. Changes in outcomes among ACU and non-ACU patients


Time period


Pre-ACU


Post-ACU


Unadjusted difference

P-value

Adjusted difference

P-value

In-hospital mortality (%)

ACU

2.5

(2.1,

2.9)

1.1

(0.8,

1.4)

-1.4

(-1.9,

-0.9)

Control

3.5

(3.0,

4.0)

2.0

(1.6,

2.3)

-1.5

(-2.1,

-1.0)

Difference

-1.0

(-1.6,

-0.4)

-0.9

(-1.3,

-0.4)

0.1

(-0.6,

0.9)

.765

-0.1

(-0.7,

0.8)

0.88

Hospice discharge (%)

ACU

5.2

(4.6,

5.8)

4.6

(4.1,

5.2)

-0.6

(-1.4,

0.3)

Control

4.4

(3.9,

4.9)

5.1

(4.6,

5.6)

0.7

(0.0,

1.5)

Difference

0.8

(0.1,

1.6)

-0.5

(-1.2,

0.3)

-1.3

(-2.4,

-0.2)

.023

-1.8

(-3.2,

-0.4)

0.013

In-hospital mortality and hospice discharge (%)

ACU

7.7

(7.0,

8.5)

5.8

(5.1,

6.4)

-2.0

(-2.9,

-1.0)

Control

7.9

(7.2,

8.6)

7.1

(6.5,

7.7)

-0.8

(-1.7,

0.1)

Difference

-0.1

(-1.1,

0.8)

-1.3

(-2.2,

-0.4)

-1.2

(-2.5,

0.2)

.083

-1.8

(-3.3,

-0.3)

0.015

Length of stay (days)

ACU

6.5

(6.3,

6.7)

6.4

(6.2,

6.6)

-0.1

(-0.4,

0.2)

Control

5.1

(4.6,

5.7)

5.4

(5.2,

5.5)

0.2

(-0.3,

0.8)

Difference

1.4

(0.8,

2.0)

1.0

(0.8,

1.3)

-0.4

(-1.0,

0.3)

.281

-0.5

(-1.2,

0.3)

0.21

30 day readmissions (%)

ACU

22.2

(21.1,

23.3)

21.0

(19.8,

22.1)

-1.2

(-2.8,

0.3)

Control

22.3

(21.3,

23.4)

20.9

(19.9,

21.9)

-1.4

(-2.9,

0.0)

Difference

-0.1

(-1.7,

1.4)

0.1

(-1.4,

1.5)

0.2

(-1.9,

2.3)

.852

0.3

(-1.8,

2.4)

0.80

Urinary tract infection (%)

ACU

5.2

(4.6,

5.8)

6.6

(6.0,

7.3)

1.4

(0.5,

2.3)

Control

5.5

(4.9,

6.0)

6.7

(6.1,

7.3)

1.3

(0.4,

2.1)

Difference

-0.2

(-1.1,

0.6)

-0.1

(-1.0,

0.8)

0.1

(-1.1,

1.4)

.819

0.01

(-1.2,

1.2)

0.99

Pulmonary embolism/Deep vein thrombosis (%)

ACU

1.8

(1.4,

2.2)

2.0

(1.7,

2.4)

0.2

(-0.3,

0.8)

Control

1.8

(1.5,

2.2)

1.6

(1.3,

1.9)

-0.2

(-0.7,

0.2)

Difference

0.0

(-0.5,

0.4)

0.4

(-0.1,

0.9)

0.5

(-0.2,

1.2)

.167

0.6

(-0.05,

1.3)

0.07

Models that included year-group interactions rejected the hypothesis of pre-existing trends for discharge status and readmissions (see Appendix for details). In the survival model estimating time to in-hospital death or discharge to hospice, the hazard ratio for the interaction of the ACU group indicator and the post period indicator was less than one but did not achieve significance at α = 0.05 threshold (0.80 [95% CI: .63 to 1.00]; p = .052).

Discussion

Results indicate that ACUs reduced the proportion of patients discharged dead or to hospice. Length of stay declined in ACUs relative to control units, but the effect was mostly driven by an increase in length of stay in control units rather than a decrease in ACUs. ACUs did not appear to affect readmission rates. The opening of an inpatient hospice unit coincided with the introduction of ACUs, making it more difficult to identify the discrete impact of ACUs. However, physicians in all units of the hospital could transfer patients to the inpatient hospice unit, and so it should not have differentially affected outcomes in ACU versus non-ACU patients. The proportion of patients discharged to hospice actually declined slightly in the units that implemented ACUs. This pattern may reflect mean-reversion (the hospice discharge rate was higher in ACU units in the pre-period).

Given the low rates of in-hospital mortality in this patient population and hospital-wide efforts to reduce in-hospital mortality, patient discharge status may not be particularly sensitive to the quality of care. The regular rotation of residents and movement of other unit staff through the hospital may have spread some of the features of ACUs and their processes, resulting in hospital-wide improvements in outcomes.

Consistent with our predetermined analysis plan, we evaluated trends in ACU units relative to trends in control units. However, there were baseline differences in mortality rates and length of stay.

ACUs did not reduce the occurrence of hospital-acquired urinary tract infections and pulmonary embolism/deep vein thrombosis, at least as measured from billing records. It is unclear whether these results reflect a failure of ACUs to improve care or whether they reflect “surveillance bias” [12] : ACU teams may be more likely to recognize and diagnose patients with these conditions. The hospital implemented an initiative to more accurately document patients’ conditions during the study period, which may account for the increase in urinary tract infection rates.

Lacking access to information about patient health after discharge, we were unable to determine the impact of being admitted to an ACU on long-term outcomes. Patients discharged too early may experience adverse outcomes. We found that readmission rates were similar between the ACU and control groups, suggesting that patients were not being discharged from ACUs prematurely.

Although we evaluated the impact of ACUs in a single, large academic medical center, there are no elements or features of the ACU model that would prevent it from being expanded to other care settings. ACUs have already been implemented in community hospitals in the US, Canada (see http: //www.rqhealth.ca/department/patient-flow/accountable-care-unit accessed April 19th 2019) and Australia (see http: //www.cec.health.nsw.gov.au/quality-improvement/team-effectiveness/insafehands accessed April 19th 2019).

Most prior studies on teams in inpatient and outpatient settings focus on single specialty teams (e.g. psychiatric care) and teams designed to address a specific quality issue (e.g., hospital acquired infections) [13,14].A recent report on the implementation of an Accountable Care Teams model, which shares many of the features of ACUs, at Indiana University Health Methodist Hospital found that implementation was associated with reductions in length of stay and costs but did not affect readmission rates or patient satisfaction [15].The assignment of hospitalists to units at Northwestern Memorial Hospital improved communication but did not increase physician-nurse agreement on patients’ care plans [16].

High risk industries with excellent safety records have recognized the value of teams to improving outcomes. ACUs, with their emphasis on patient-centered, interprofessional collaboration, were designed to address shortcomings of the traditional model of hospital organization. Our findings suggest that these and other features of the model were associated with reductions in the proportion of patients discharged dead or to hospice but did not affect other outcomes. Unfortunately, we were unable to assess the degree of fidelity of the study units to all features of the ACU model. Futures studies should include estimates of the extent to which units are implementing all four essential components of the model in estimating the effects of the model on distal outcomes.

Funding: Agency for Healthcare Research and Quality, R03 HS 022595-01

Conflicts of Interest: Dr Stein and Dr Chadwick are officers of 1Unit, a company that helps hospitals set up and run Accountable Care Units. Drs Howard, Shapiro, Murphy, and Ms Overton do not have any conflicts of interest.

References

  1. Stein J, Murphy DJ, Payne C et al. (2015) A Remedy for fragmented hospital care. Harvard Business Review-New England Journal of Medicine Online Forum: Leading Healthcare Innovation.
  2. Stein J, Payne C, Methvin A, et al. (2015) Reorganizing a Hospital Ward as an Accountable Care Unit. J Hosp Med 10: 36–40.
  3. Castle B, Shapiro S (2016) Accountable Care Units: A Disruptive Innovation in Acute Care delivery. Nurs Adm Q 40: 14–23.
  4. Shapiro S (2015) Accountable care at Emory Healthcare: Nurse-led interprofessional collaborative practice. VOICE of Nursing Leadership 13: 6–9
  5. Pronovost P, Berenholtz S, Dorman T, et al. (2003) Improving communication in the ICU using daily goals. J Crit Care 18: 71–75.
  6. O’Mahony S, Mazur E, Charney P, et al. (2007) Use of multidisciplinary rounds to simultaneously improve quality outcomes, enhance resident education, and shorten length of stay. J Gen Intern Med 22: 1073–1079.
  7. Cowan M, Shapiro M, Hays R, et al. (2006) The effect of a multidisciplinary hospitalist/physician and advanced practice nurse collaboration on hospital costs. J Nurs Adm 36: 79–85.
  8. Vazirani S, Hays RD, Shapiro MF, et al. (2005) Effect of a multidisciplinary intervention on communication and collaboration among physicians and nurses. Am J Crit Care 14: 71–77
  9. Dowd BE, Greene WH, Norton EC (2014) Computation of Standard Errors. Health Serv Res 49: 731–750.
  10. Elixhauser A, Steiner C, Harris DR, Coffey RM (1998) Comorbidity measures for use with administrative data. Med Care 36: 8–27.
  11. Volpp KG, Small DS, Romano PS (2013) Teaching hospital five-year mortality trends in the wake of duty hour reforms. J Gen Intern Med 28: 1048–1055.
  12. Bilimoria KY, Chung J, Ju MH, et al. (2013) Evaluation of surveillance bias and the validity of the venous thromboembolism quality measure. JAMA 310: 1482–1489.
  13. Bosch M, Faber M, Cruijsberg J, et al. (2009) Effectiveness of patient care teams and the role of clinical expertise and coordination: a literature review. Med Care Res Rev 66: 5S-35S.
  14. Pannick S, Davis R, Ashrafian H, Byrne BE, Beveridge I, et al (2015) Effects of Interdisciplinary Team Care Interventions on General Medical Wards: A Systematic Review. JAMA Intern Med. 175: 1288–98.
  15. Kara A, Johnson C, Nicely A, Neimeier MR, Hui SL (2015) Redesigning inpatient care: Testing the effectiveness of an Accountable Care Team model. Journal of Hospital Medicine 10: 773–779.
  16. O’Leary KJ, Wayne DB, Landler MP, et al. (2009) Impact of localizing physicians to hospital units on nurse-physician communication and agreement on the plan of care. J Gen Intern Med 24: 1223–1227.