Monthly Archives: February 2026

The Role of the Medical Sector in Victim Protection and Early Intervention in Intimate Partner Violence

DOI: 10.31038/IJNM.2026711

Abstract

Intimate partner violence (IPV) constitutes a major public health and human rights issue with profound physical, psychological, and social consequences for individuals and societies worldwide. Extensive research demonstrates that IPV contributes significantly to morbidity, mortality, and long-term health inequalities across populations. The medical sector occupies a critical frontline position in victim protection and early intervention, as healthcare professionals are often the first formal point of contact for individuals experiencing violence. This paper examines the role of the medical sector in victim protection and early intervention in cases of intimate partner violence, integrating empirical findings from the EU-funded VIPROM (Victim Protection in Medicine) project with established international research and policy frameworks. By analysing stakeholder needs, institutional challenges, and innovative training and capacity-building models, the paper highlights persistent gaps in medical responses to IPV as well as promising strategies for improvement. The findings underscore the importance of societal awareness, trauma-informed care, early identification in healthcare settings, interdisciplinary cooperation, and the sustainable integration of domestic violence training into medical education. Strengthening the capacity of the medical sector is essential for preventing further victimisation, improving long-term health outcomes, and advancing broader public health and human rights objectives.

Keywords

Intimate partner violence, Victim protection, Healthcare professionals, Trauma-informed care, Early intervention, Clinical training

Introduction

Intimate partner violence (IPV) is widely recognised as a pervasive and global public health issue affecting individuals across gender, age, socioeconomic status, and cultural contexts. International evidence indicates that a substantial proportion of women worldwide experience physical or sexual violence by an intimate partner during their lifetime, with similarly severe consequences observed among other victim groups [1]. Beyond immediate physical injuries, IPV is strongly associated with long-term mental health disorders, including depression, anxiety, post-traumatic stress disorder, and substance use disorders. It is also linked to chronic pain, gastrointestinal disorders, reproductive health complications, disability, and increased risk of premature mortality [2]. Consequently, IPV is increasingly conceptualised not solely as a criminal justice concern but as a critical public health and human rights issue requiring comprehensive and coordinated responses [3]. Healthcare systems occupy a unique and strategically important position within this response landscape. Individuals experiencing violence often seek medical care for injuries, chronic symptoms, or stress-related health problems long before disclosing abuse to law enforcement or specialised victim support organisations. Emergency departments, primary care practices, dental clinics, gynaecology and obstetrics units, paediatric services, and orthopaedic settings frequently serve as the first professional environments in which the consequences of violence become visible [4]. This situates healthcare professionals at the forefront of early detection, victim protection, documentation of injuries, and referral to appropriate support services. Despite this critical role, extensive research demonstrates that many healthcare professionals feel insufficiently prepared to identify and respond effectively to intimate partner violence. Commonly reported barriers include limited training, lack of clear institutional protocols, uncertainty regarding legal responsibilities, time pressure, and fear of causing further harm or offending patients [5,6]. These challenges highlight the need for structured, evidence-based approaches that support healthcare professionals in fulfilling their role in victim protection and early intervention. Addressing IPV within the medical sector therefore requires both individual competence and systemic organisational change.

Conceptual Framework: Victim Protection and Early Intervention

Victim protection in the context of intimate partner violence refers to a set of measures aimed at preventing further harm, safeguarding physical and psychological well-being, and facilitating access to specialised protection and support services. Early intervention involves the timely identification of violence and the initiation of appropriate responses at the earliest possible stage, ideally before violence escalates or becomes chronic. Within healthcare settings, victim protection and early intervention are closely interconnected and mutually reinforcing [7]. A central component of effective victim protection is societal awareness and sensitivity to the prevalence and dynamics of intimate partner violence. Recognising that victims of IPV may be present in everyday clinical encounters challenges persistent stereotypes about who is affected by violence and under what circumstances. Increased awareness within healthcare settings can foster environments in which patients feel safe to disclose abuse and confident that their experiences will be taken seriously [7]. Equally important is the adoption of trauma- informed approaches to care. Trauma-informed practice acknowledges the widespread impact of trauma and emphasises safety, trust, choice, collaboration, and empowerment. In the context of IPV, trauma- informed care aims to avoid secondary victimisation by ensuring that medical examinations, questioning, and documentation are conducted sensitively and respectfully. Research consistently shows that negative or dismissive responses by healthcare professionals can retraumatise victims and deter future engagement with services, whereas supportive and validating interactions can facilitate disclosure and improve long- term outcomes [8].

The Medical Sector as a Frontline Actor in IPV Response

Healthcare professionals across medical disciplines are uniquely positioned to identify and respond to intimate partner violence. Victims may present with a wide range of indicators, including acute injuries, unexplained or recurrent trauma, chronic pain, gastrointestinal complaints, reproductive health issues, dental injuries, and psychosomatic symptoms. However, these indicators are often non-specific, making detection challenging without appropriate training and awareness [2]. Empirical evidence from international research demonstrates that healthcare professionals regularly encounter victims of IPV but frequently fail to recognise the underlying cause of health problems [4]. Findings from the VIPROM Stakeholder Needs Assessment confirm these patterns across multiple European countries, revealing substantial variation in awareness, confidence, and expertise among medical professionals. Detection of IPV often depends on individual experience rather than systematic institutional practices, resulting in inconsistent responses and unequal levels of victim protection [9]. When disclosure of violence occurs, healthcare professionals play a decisive role in shaping victims’ subsequent pathways to safety and recovery. Compassionate listening, validation of experiences, and the provision of clear information about available resources are essential components of effective response. Even brief supportive interventions in healthcare settings have been shown to positively influence victims’ willingness to seek further help [5]. Nevertheless, many healthcare professionals report uncertainty regarding legal obligations, documentation procedures, and referral pathways. This uncertainty can lead to hesitation or inaction, even when violence is suspected or disclosed. Furthermore, a narrow focus on women and children as the primary victims of IPV, while justified by prevalence data, risks overlooking other affected groups such as men, older adults, individuals with disabilities, and those in same-sex relationships. An inclusive and intersectional approach is therefore necessary to ensure equitable access to protection and care [1].

Training and Capacity Building in the Medical Sector

A robust body of evidence demonstrates that targeted training significantly improves healthcare professionals’ ability to identify and respond to intimate partner violence. Effective training programmes increase confidence, enhance communication skills, improve documentation practices, and strengthen referral pathways [5,8]. However, research also indicates that training is most effective when it is practical, multidisciplinary, and embedded within institutional structures rather than offered as isolated or optional initiatives [6]. The VIPROM project provides a comprehensive example of how training and capacity building can be systematically addressed within the medical sector. Based on extensive stakeholder needs assessments conducted across several European countries, VIPROM developed tailored training curricula for various medical professionals, including physicians, nurses, midwives, dentists, and medical students. The curricula emphasise practical competencies such as recognising indicators of violence, trauma-informed communication, medical documentation, risk assessment, and interprofessional cooperation [10]. A key innovation of the VIPROM approach is the use of a modular European Training Platform on Domestic Violence, complemented by a Train-the-Trainer model. This structure supports sustainability by enabling trained professionals to disseminate knowledge within their institutions and national contexts. Importantly, the training materials are adapted to different professional roles and healthcare settings, enhancing relevance and uptake. By embedding IPV training within existing medical education and professional development structures, VIPROM addresses a critical gap in traditional medical curricula [10,11].

Discussion

The findings presented in this paper reaffirm the central role of the medical sector in victim protection and early intervention in intimate partner violence. Healthcare professionals often represent the first and sometimes only formal point of contact for individuals experiencing violence, placing them in a critical position to identify risk, initiate support, and prevent further harm [4]. Nevertheless, a substantial gap remains between this potential role and everyday clinical practice. Recognition of IPV indicators continues to rely heavily on individual awareness rather than standardised institutional procedures. Time pressure, high workloads, and competing clinical priorities further limit opportunities for proactive intervention. These challenges underscore the importance of organisational support, clear protocols, and leadership commitment in enabling effective medical responses to IPV [11]. The persistence of stereotypical assumptions about victim profiles also constrains effective intervention. Although women and children are disproportionately affected by IPV, other victim groups remain under-recognised and underserved. Adopting intersectional frameworks that acknowledge diverse experiences of violence is essential for inclusive and equitable care. Training initiatives such as VIPROM demonstrate how healthcare systems can move towards more comprehensive, prevention-oriented responses through structured education, multidisciplinary collaboration, and institutional change.

Conclusion

This paper has examined the role of the medical sector in victim protection and early intervention in intimate partner violence, integrating international research with empirical findings from the VIPROM project. The analysis confirms that healthcare professionals are pivotal actors in identifying violence, responding to disclosures, and facilitating access to specialised support services, thereby influencing both immediate safety and long-term recovery [2,10]. At the same time, structural constraints including insufficient training, lack of institutional guidance, and organisational pressures continue to undermine effective responses. Strengthening the medical sector’s role requires sustained integration of IPV training into medical education, the adoption of trauma-informed and inclusive frameworks of care, and robust interprofessional cooperation [7,11]. By embedding victim protection within healthcare systems, initiatives such as VIPROM contribute not only to improved clinical practice but also to broader public health and human rights objectives. Enhancing the medical response to intimate partner violence is therefore both an ethical obligation and a critical strategy for preventing further violence and promoting safer societies.

Acknowledgment

VIPROM (Victim Protection in Medicine) is a European Union’s Citizens, Equality, Rights and Values Programme (CERV-2022- DAPHNE, No.101095828) project co-funded by the European Union Views and opinions expressed are however those of the author(s) only and do not necessarily reflect those of the European Union or CERV. Neither the European Union nor the granting authority can be held responsible for them.

References

  1. World Health Organization (2021) Violence against women prevalence estimates, 2018: Global, regional and national prevalence estimates for intimate partner violence against Geneva: World Health Organization.
  2. Campbell JC (2002) Health consequences of intimate partner The Lancet 359: 1331-1336. [crossref]
  3. Krug EG, Dahlberg LL, Mercy JA, Zwi AB, et (eds) (2002) World report on violence and health. Geneva: World Health Organization.
  4. García-Moreno C, Hegarty K, d’Oliveira AFL, Koziol-McLain J, et al. (2015) The health-systems response to violence against The Lancet 385: 1567-1579. [crossref]
  5. Feder G, Davies R.A, Baird K, Dunne D, Sandra E, et al. (2011) Identification and referral to improve safety (IRIS) of women experiencing domestic violence with a primary care training and support programme. The Lancet 378: 1788-1795. [crossref]
  6. Taft A, O’Doherty L, Hegarty K, Ramsay J, Leslie LD, Gene F, et al. (2013) Screening women for intimate partner violence in healthcare settings. Cochrane Database of Systematic Reviews (4), CD007007.
  7. World Health Organization (2013) Responding to intimate partner violence and sexual violence against women: WHO clinical and policy Geneva: World Health Organization.
  8. Hegarty K, O’Doherty L, Taft A, Chondros P, Stephanie B, et al. (2013) Screening and counselling in primary care for women who have experienced intimate partner violence (WEAVE): A cluster randomised controlled The Lancet 382: 249-258. [crossref]
  9. VIPROM Consortium (2023) Deliverable 1: Stakeholder Needs Assessment.
  10. VIPROM Consortium (2024a) Deliverable 1: EU and international Training content tailored to the various first line responders in the medical sector.
  11. VIPROM Consortium (2024b) Deliverable 2: Design of EU and national Train- the-Trainer curricula tailored to various frontline responders.

Beyond Size: Multistage Coalescence and Crystallinity-dependent Nucleation Pathways

DOI: 10.31038/NAMS.2026912

Abstract

Within classical nucleation theory (CNT), an initially formed crystal nucleus is often treated analogously to a droplet, with its evolution primarily described by changes in cluster size. However, increasing evidence suggests that the internal phase state of a cluster, including density for liquids and crystallinity for solids, evolves together with size and plays a decisive role in determining nucleation pathways and rates. Here we relate in situ transmission electron microscopy (TEM) observations of intermediate monomers to recent theoretical simulations, showing a phase-aware description of nucleation. Time-resolved TEM reveals that (i) coalescence proceeds through discrete, multistage events assisted by e-beam energy input; (ii) intermediate monomers repeatedly switch roles between reactants and products as their phase stability evolves; and (iii) mass redistribution can occur, consistent with crystallinity-dependent chemical potential and phase-dependent susceptibility to vaporization and redeposition. Motivated by these observations, we propose a more general framework that extends classical nucleation descriptions by incorporating coupled size and phase variables together with external driving fields. This phase aware description reconciles nonclassical multistage pathways with a tractable energetic model and suggests experimentally accessible control parameters, such as dose rate and dwell time, for steering early stage nanocrystal evolution.

Keywords

Nucleation, Nonclassical crystallization, In Situ TEM, Electron beam

Introduction

Understanding nucleation and early growth is central to controlling nanomaterial synthesis and transformation. Although classical nucleation theory (CNT) remains a useful baseline, its size-only description implicitly assumes that a nascent nucleus already possesses the bulk properties of the product phase. Recent rare-event simulations of Lennard–Jones vapor condensation demonstrate that this assumption can fail even for simple fluids: critical droplets nucleate with a density substantially different from the macroscopic liquid, and the reactive pathway involves simultaneous growth and densification [1]. In solids, an analogous internal variable is structural order (crystallinity, defect density, polymorph), which can evolve concurrently with size and invert size-only expectations such as anti-Ostwald ripening [2].

ZnO is a particularly suitable model to explore this coupling because it exhibits crystalline, poorly crystalline and amorphous states on the nanoscale, and these states respond differently to electron irradiation. In earlier in situ TEM studies, we observed multistage transitions among ZnO intermediate species and anti-Ostwald-like mass diffusion, indicating that intermediate monomers are not rigid building blocks but continually change size and phase [2]. More recently, we showed that e-beam irradiation can facilitate crystal reconstruction and even promote vapor-mediated mass transfer between unconnected particles, with the direction set by crystallinity- dependent stability [3].

In this paper, as an extension of our previous studies [2,3], we revisit representative multistage coalescence events in the pulsed- laser-produced ZnO system and use them to formulate a concise, phase-aware nucleation framework that bridges liquid condensation and nanocrystal evolution. Our goals are to distill experimental signatures of coupled size and phase evolution under e-beam driving, and to provide a minimal model that can be used to interpret and control such pathways in nanoscale crystallization.

Results and Discussion

Revisiting Classical Nucleation Theory

The theoretical fundamentals of crystal synthesis and crystallization are mainly based on classical theories, ascending to Gibbs free energy theories [4]. In CNT, when a crystal is initially formed, it could be regarded as a droplet. The Gibbs free energy ΔG of a droplet (assuming in a spherical shape) is described as in the following:

where  is the bulk energy, is the surface energy also referred to as the resistance force for nucleation, and r is the radius of the droplet. is often referred to as the driving force of nucleation. The difference in bulk free energy between product and reactant is related to saturation of solution, which is expressed as:

where C is the concentration of a solution, C0 is the concentration of a solution when it is saturated, k is the Boltzmann constant, and T is temperature.

The Gibbs free energy change with the crystal radius is shown in Figure 1. A diagram of Gibbs free energy is provided vs. radius of nucleation, showing graphs of interface free energy, , the Gibbs free energy, ΔG, and bulk energy, . The maximum value of free energy is the energy barrier for nucleation, ΔG*, when Correspondingly, the value of r* at the energy barrier is the critical size of nucleation, after which the addition of new molecules to nuclei decreases the free energy, so nucleation is favorable.

Figure 1: Free Gibbs energy diagram of nucleation in classical nucleation theory.

CNT remains a foundational framework because it reduces an intrinsically collective, many body process to a simple thermodynamic competition between a bulk free energy gain that scales with cluster volume and an interfacial free energy penalty that scales with cluster area. This reduction yields a single critical cluster size and a corresponding free energy barrier, providing a convenient and widely adopted basis for comparing nucleation behavior across different systems and conditions. However, the most consequential assumption underlying CNT is not the capillary approximation itself, but rather the implicit identification of the nucleating cluster with the equilibrium bulk phase. While cluster size quantifies the amount of material involved in nucleation, it does not specify the internal thermodynamic or structural state of that material.

In many nucleation processes, internal equilibration within the cluster is not instantaneous. Liquid droplets may initially form with reduced density and undergo subsequent densification, while crystalline nuclei may first appear as amorphous or poorly ordered aggregates before transforming into an ordered phase. Similarly, nanoparticles can nucleate in metastable polymorphs or defect rich configurations and later evolve toward more stable structures. When internal ordering and cluster growth occur on comparable time scales, nucleation cannot be adequately described by a single size parameter, but must instead be treated as a coupled process involving at least two collective variables: a size coordinate, such as the cluster radius R, particle number n, or volume, and an internal phase or order parameter, such as density ρ in fluids or crystallinity and structural order α in solids, with additional variables including composition or strain becoming relevant in more complex systems.

In literatures [5], the authors regarded the intermediate monomers, i.e., the primary particles, having energy at its minimum as , where is its energy averaging over both surface and bulk energies. The intermediate monomers were proposed to contribute the free energy of the crystallization system by . Therefore, the critical energy of the system change is   It implied that the primary particle was a precursor-like reactant, which has the effect equivalent to a change in the saturation of the solution, from S0Sp x S, where the supersaturation is defined as , where C is the concentration and Cs is the solubility limit. As a result, the intermediate monomers affects the free energy of the system simply by adding/subtracting an amount of free energy (depending on the primary particles metastable/stable).

In the model proposed by Mirabello and coworkers [6], the process of non-classical crystallization was described as a three-stage transition: (1) the formation particle (P); (2) the aggregation of Ps in which the Gibbs free energy changes due to the change of surface area; (3) the phase transition into the final crystalline phase. In the stage of the phase transition, a factor was assigned to describe the degree of the conversion. However, the definition of the conversion factor Φ is intuitional. Neither mass conservation nor additional nucleation was considered. Moreover, the model identified a critical cluster size, Rconv, by the condition: It implies that the transition direction is predetermined, from P to crystals (C) with increasing of Φ, and the process is size depended that in the early stage of R < Rconv the phase is dominated by P, and the conversion to C becomes favorable above Rconv. However, this predetermined phase change direction excludes the possibility of phase change from C to amorphous (A), or the possibilities of the growth of P consuming C, as we observed in this study.

Observation of Multistages of Crystal Evolution

ZnO crystals or intermediate monomers in this study were produced by the pulsed laser method, similar to the previous studies [7]. The precursor solution for producing ZnO crystals was prepared from zinc acetate dihydrate in alcoholic solution under basic conditions [8]. Specifically, 1.5mM Zn(CH3COO)2 · 2H2O was dissolved in 25 mL DI water and mixed with 25mL ethanol (all chemicals from Sigma-Aldrich). Additionally, 1mL dilute NH3 · H2O solution (pH = 10) was added dropwise under vigorous stirring at room temperature. The substrate of Si (100) in a size of 1 cm × 1 cm was cleaned by DI water and immersed in the precursor solution. Copper grid holder for Transmission Electron Microscope (TEM) was placed on the silicon substrate, with film side face-up, and the grid edge was sealed by copper tape. The copper grid has 400 mesh with a thin film of pure silicon monoxide (15 – 30 nm) (SF400-Cu from Electron Microscopy Sciences, Hatfield, PA). The substrate was irradiated by pulsed laser for 1s. Ytterbium pulsed fiber laser with a wavelength of 1064 nm, pulse width of 100 ns was used to irradiate the substrate to trigger the hydrothermal reaction. Pulsed laser power density is 1.27 kW/cm2 in a repetition rate of 100kHz. After irradiated by the pulsed laser, the grid was taken out and rinsed with DI water. After dried by air, it was cleaned by plasma (Ar) for 40s before TEM observation. FEI Tecnai G2 20 TEM with 200 kV LaB6 filament was used. The CCD camera is a bottom mount Gatan US1000 2K x 2K, and videos were captured with a frame rate of ~30s-1 [frames per second (fps)].

Figure 2 shows an in-situ observation of multistages of crystallization. Starting from 1 s, two adjacent ZnO particles (intermediate monomers) can be resolved as distinct entities in the time resolved TEM sequence, each maintaining its own boundary and contrast. Under continuous electron beam irradiation, the pair evolves progressively toward integration through coupled interfacial and structural relaxation processes. As irradiation proceeds, surface atom diffusion smooths initially rough or high energy surface segments and promotes the development of a contact neck at the junction, while gradual lattice rearrangement and rotation reduce the crystallographic mismatch across the interface. Concurrently, local mass transport and boundary relaxation decrease the interfacial free energy, leading to a steady loss of boundary sharpness and a more coherent morphology. By the end of the 60 s observation window, the two monomers have merged into a single larger particle that exhibits a more uniform, crystal like contrast, consistent with the electron beam facilitated structural evolution mechanisms previously reported for multiphase nano ZnO, including surface diffusion, grain rotation, and irradiation activated mass transfer that collectively drive the system toward a lower energy configuration [3].

Figure 2: Particle coalescence processes. The frame size of each picture: w:153 nm, h:133 nm.

The theoratical model could be summarized in Figure 3 that in one stage of the reaction during the multi-stage process, from monomer (Mi) at stage i, which composed of two monomers (Mi1 and Mi2) to monomer (Mi+1) at stage i+1, representing the aggregated monomer (Mi1+Mi2). ΔE represents the energy barrier of particles’ moving, attaching, and aggregating under the assistance of the mass diffusion. The electron beam provided the energy for overcoming the energy barrier. Monomer Mi has a Gibbs energy of Gi, and monomer Mi+1 has a smaller energy of  Gi+1. ΔG<0 indicates that Mi+1 is more stable than Mi. Monomer Mi+1 will continue interacting with surrounding monomers, evolving in the following stages.

Figure 3: Energy diagram of the particle coalescence processes shown in Figure 2.

Mass Redistribution Among Clusters

Mass transfer among monomers was experimentally observed and shown as an important mechanism in the crystallization process. The continuous change of individual monomers (particles) indicated that successive mass transfer and phase change was induced by e-beam. Figure 4 was viewed from a TEM view window; each frame size is about 1.28× 0.81 μm. Two particles were tracked over 100s; the particle on the left is marked as p1, and the particle on the right is marked as p2. Two particles didn’t have significant change during the first 10s. At 12.90s, e-beam intensity increased artificially. As a result, particles shrank and p1 was hardly observed. At 22.83s, particles reappeared and continue to grow. At about 53.87s, p1 and p2 showed a crystalline structure rather than round shape. After 66.27s, particles continue to shrank. p1 disappeared at 73.93s and reappeared at 78.63s, and p2 disappeared at 78.63s. Although they disappeared eventually, a series of shrinkage and growth indicated the existence of local minimums in crystal growth energy diagrams.

Figure 4: A series of phase changes of two particles due to e-beam. Snapshots from videos of observations from TEM view window. Magnification is 19.5k. Each frame size is about 1.28 × 0.81 μm. E-beam intensity increase at 12.90 s.

The reaction is found dose sensitive, in which a high dose rate leads to a high reaction rate. Particles didn’t have significant change until increasing the e-beam intensity (dose rate) at 12.90 s. In-situ measurement of the intensity of e-beam interacting with the sample is difficult (not allowed at our equipment). However, it could be a good reference using the dose rate projected at the screen, which records the electron density transmitted through the sample to detectors sitting below the sample. In this study, a dose rate of 673 e/(nm2s) was used at a magnification of 19.5 k; 1560 e/(nm2s) at a magnification of 29 k; and 3330 e/(nm2s) at a magnification of 43 k. Convert the electron flux to dose rate, ψ, on samples, using equation [9]:

where S is total stopping power for water, 2.79 (MeV cm2 g-1), a is the radius of irradiation area, I is the beam current, unit of Gy is defined as the absorption of one joule per kilogram of matter. Dose- related effect was studied by the effect of e-beam induced damage effect [10,11]. Therefore, the dose rate is then 3.01 × 10⁷ Gy/s for 19.5 k,  6.98 × 10⁷ Gy/s for 29 k, and 1.49 × 10⁸ Gy/s for 43 k. Although it’s hard to have precise quantitative results between dose rate and crystallization kinetics, this result shows that electron beams could not only be used for imaging crystallization processes, but also as a promising tool to initiate and control the reactions in the observed area.

A General Framework of Crystallinity-dependent Nucleation Pathways

These observations align with our prior in situ TEM and simulation results on multiphase nano ZnO under electron irradiation, where the electron beam can induce constructive microstructural evolution rather than only damage [3]. Here, as an extension of our previous studies, we presented a generic model by extending the Gibbs energy profile of classical nucleation theories. The cases in ref. [5,6] discussed above could be included in this model. Moreover, two new features described by this model need to be stressed: firstly, considering that the crystal evolution results from the equilibrium among M, P, and C or A, intermediate monomers change their roles dynamically. Representative monomer types are schematically illustrated in Figure 5a. The relatively stable phase will consume less stable ones, e.g., the growth of stable P may consume adjacent C or A. Secondly, the phase transition and size change has no specific direction. The multi-stages reactions could result from either change of  μMi , γMi or RMi , as long as the system reduce the Gibbs free energy as a whole, for example, a transition from A to C by reducing RMi .

The crystal evolution includes multi-stages reaction, and intermediate monomers at different stages indicated the local minimums in energy diagrams (shown in Figure 5b). Figure 5c describes a schematic overview of crystal evolution pathways, starting from intermediate monomers. Intermediate monomers were a mixture of ion-molecule monomers, dense liquid, amorous particles, poorly crystalline particles and nanocrystals, generated by the pulsed laser method from indirect nucleation in our system. The intermediate monomers under e-beam continue to undergo a kinetically favored pathway, in which mass- transfer induced new monomer formation and existed monomer dissolving lower energy barriers and alter evolution pathways.

In each stage (shown in Figure 5c), monomers move and attach, with or without adjustment of crystalline orientation depending on the phase properties of monomers, as discussed above. Then monomers coalesce directly or through mass distribution to form a new crystalline phase. The new crystalline phase then transforms into a more stable phase by mass redistribution and phase adjustment. Finally, the large newly formed phase shows as a more stable monomer, usually a crystalline phase, with lower Gibbs free energy and serves as the reactant for the next stage. The final crystal is the product of several stages of monomer interactions. In addition, as the trajectories of monomer interactions may not remain in the final crystals, single crystals could also be formed from various monomers’ interactions.

Figure 5: (a) Various monomers types shown in blue dash block, adapted from [12]. (b) Proposed crystallization dynamics schematic diagram showing multi-stages transformation from initial monomers M1 to final crystals. (c) A proposed example of a certain stage of crystal evolution. The mass and phase transfer from unstable phases to more stable phases. The product of a certain stage (M2) continue react and contribute to the crystal evolution in next stage.

The proposed mechanism in literatrues are certain possible crystal evolution pathways. Here, we extend the diversity of the intermediate reactions, in which the role of the primary particles or intermediate monomers could be more complex. The reaction from molecules (M) to crystals (C) or amorphous (A) involving primary particle (P) is not only in the form of M + P C or A as implied in ref. [5], but could be considered as the equilibrium among MP and C or A as:

If P is unstable (Sp>1), reaction (1) will be reversely favored, and reaction (2)(3) is forwardly promoted. Similar to the case described in Figure S4D-E of Ref.5, consuming P will lower the total free energy of the system. However, if P is stable (Sp<1), we should consider whether it will still be consumed and increase the energy barriers, as described in Figure 3C-D of Ref. [5]. If it favors reaction in a different way, such as by the direct growth of P, the role of the primary particle will not always be a reactant but could be a product, and its effect on the free energy diagram of the system would be more complicated. The generic model proposed here implies all those possible roles of intermediate monomers and all the possible evolution pathways.

Conclusions

In summary, we combined in-situ intermediate monomer observations with a phase-aware nucleation viewpoint to highlight a unifying principle: nucleation and early growth are governed by coupled evolution of size and an internal phase coordinate. In the ZnO system, e-beam irradiation facilitates discrete multistage coalescence events, enables dynamic role switching of intermediates, and drives crystallinity-dependent, sometimes anti-Ostwald, mass redistribution. By casting these behaviors on a minimal two-coordinate free-energy landscape and including an explicit driving term for e-beam energy input, we obtain a compact framework that connects nanocrystal evolution to recently established variable-density nucleation pathways in liquid condensation. This framework motivates phase-aware experimental metrics and provides actionable control knobs for e-beam-assisted nanomanufacturing.

Notes: The authors declare no competing financial interest.

References

  1. Wu Y, Philippe T, Graini A, Lam J (2026) Nonclassical Nucleation Pathways in Liquid Condensation Revealed by Simulation and Phys Rev Lett. [crossref]
  2. Liu S, Liu C R (2021) Observation of New Dynamics of Transitions among Intermediate Species in Crystal Evolution and Its Role in a Generic Model of Journal of Physical Chemistry C. [crossref]
  3. Liu S, Wang R, Cai X, Wang Y (2025) Electron beam facilitated structural evolution of nano-zincoxide. Nanoscale. [crossref]
  4. Gibbs JW, Bumstead H A (1906) Longmans Green and Company
  5. Baumgartner J et al (2013) Nucleation and growth of magnetite from Nature Materials. [crossref]
  6. Mirabello G et al (2020) Crystallization by particle attachment is a colloidal assembly Nature Materials. [crossref]
  7. Liu S, Liu CR (2019) Morphology Control by Pulsed Laser in Chemical Deposition Illustrated in ZnO Crystal Crystal Growth and Design. [crossref]
  8. Pacholski C, Kornowski A, Weller H (2002) Self-Assembly of ZnO From Nanodots to Angew Chem Int Ed. [crossref]
  9. De Jonge N, Ross F M (2011) Electron microscopy of specimens in liquid. Nature Nanotechnology. [crossref]
  10. Egerton R F, Li P, Malac M (2004) Radiation damage in the TEM and Micron. [crossref]
  11. Jiang N (2015) Electron beam damage in oxides A Reports on Progress in Physics. [crossref]
  12. De Yoreo J J et al (2015) Crystallization by particle attachment in synthetic biogenic and geologic Science. [crossref]

Assessing Perceptions of the Healthcare Community, Perceived Stress, Perceived Racism, Postpartum Depression, and Differences in Income among Black Women

DOI: 10.31038/AWHC.2025844

Abstract

Purpose: The purpose of this study was to assess differences in perceptions of the healthcare community across annual income and perceived stress levels, and the relationship between perceived stress, perceived racism, postpartum depression, and the perceptions of the healthcare community among Black women.

Methods: Two Hundred Nineteen Black mothers participated in this study. To better understand the relationship between the primary variables, Spearman Rho, Correlations, and a Non-Parametric Independent Sample T test were run. Standard, Multiple, and Hierarchical regressions were used to measure the moderating role of perceptions of racism on perceptions of the healthcare community and perceived stress.

Results: Results indicated that higher levels of stress in Black women were related to lower perceptions of the healthcare community, and there was evidence to support perceived racism as a moderator between perceptions of the healthcare community and perceived stress. There were unique differences in perceived racism across income and middle-income individuals reported less perceived racism. Lastly, perceptions of the healthcare community and annual pre-tax income combined were found to be better predictors of postpartum depression than either variable alone.

Conclusion: By understanding these factors as contributors to maternal mortality rates among Black women, it can influence training and professional development for new and existing mental health practitioners.

Keywords

Healthcare community, Income, Perceived stress, Perceived racism, Postpartum depression

Introduction

Black mothers are dying at 3 to 4 times the rate of non-Hispanic white mothers [1]. Seven hundred individuals die during pregnancy or in the year after in the United States while Black mothers represent almost 45% of the deaths [2]. The etiology of maternal-related mortality disproportionately affecting Black women is quite complex. Three key issues have been presented to explain this difference in outcomes: 1- Black women are more susceptible to having a pre- existing cardiovascular morbidity; 2- Black women are more likely to experience adverse pregnancy outcomes including a high risk for cardiovascular disease, and; 3- racial bias of providers and perceived racial discrimination of themselves as a patient [3].

As important as maternal mortality is in representing differences in outcomes, maternal morbidity rates may best represent the size of the problem for many women. Koblinsky (2012) defined maternal morbidity as a term that refers to any physical or mental illness or disability related to pregnancy and/or childbirth [4]. Examples of maternal morbidity include, but are not limited to, diabetes, high blood pressure, preeclampsia, blood clots, hemorrhage, and anemia. On average, more than 60,000 women in the United States affected by severe maternal morbidity annually. The rates of morbidity for Black women exceeds that of their white counterparts in 22 of the 25 severe morbidity indicators [2,4]. The Center for Disease Control (CDC) has reduced the original list of indicators to now represent 21 items that correspond to severe maternal morbidity (SMM) [2].

Pieterse et al. (2012) suggest that perceived racial discrimination can occur on multiple levels (interpersonal, institutional, cultural) and can be stressful for Black individuals negatively affecting their mental and physical health. Black individuals, on average, report higher levels of exposure to racism and discrimination than any other marginalized group [5]. Persistent high levels of stress can cause a deterioration of mental, emotional, and physical health. Persistent high levels of stress have been linked, but are not limited to heart disease, high blood pressure, heart attacks, depression, anxiety, and stroke.

Black individuals deal with racism-related stress daily, and it is very prominent in every aspect of living in the United States and thusly creating grave concern as it pertains to the healthcare system. Black individuals have not been afforded non-racial biased treatment, whether it was for a physical or mental ailment. Researchers previously found that there is a significant racial difference in mistrust of medical care settings for Black individuals. This was due to the Tuskegee Study and from broader personal and historical experiences [6]. Over time, the mistrust of the healthcare community has influenced the Black community to not seek medical attention when needed. Furthermore, it discourages Black mothers from seeking proper prenatal care out of fear of getting racially biased treatment from their nurses and doctors.

Perceptions of the Healthcare Community

One’s view of something or someone can influence how they interact with it. Perceptions of the healthcare community are having an impact on how Black women are viewing their quality of healthcare. This is evidenced by a study conducted by Blair and her colleagues (2013) that involved administration of a telephone survey on White and Black patients completing the Primary Care Assessment Survey. The Primary Care Assessment survey assessed the patients’ view of the clinicians’ interpersonal treatment, communication, trust, and contextual knowledge. They also had a panel of 134 clinicians that completed the explicit/implicit ethnicity/race bias assessments. The findings from this study revealed that clinicians with greater implicit bias were rated lower in patient-centered care by their Black patients as compared to the White patients. Another study conducted by Cuevas and her colleagues (2016) involved focus groups of Black women and men discussing their perceptions of racism in the medical setting, mistrust in medical settings, poor communication from doctors, and race discordance. The findings from this study revealed that Black women perceived higher discrimination than Black men feeling as though their symptoms were being discredited and ignored [7,8].

Perceptions of the Healthcare Community and Income

The intersectionality of income and race has shown to have an impact on the quality of care you may receive and your perception of your quality of healthcare. This is evidenced by a study conducted by Oliha and her colleagues (2020), which involved in-depth interviews of low-income Black women. Black women in this study reported receiving less than satisfactory patient care. The findings from this study attributed their less than satisfactory patient care to three significant themes: 1) perceived discrimination based on race, 2) perceived discrimination based on socioeconomic status, and 3) stereotypical assumptions (i.e., drug-seeking or having an STD) (Oliha et. al., 2020). Another study conducted by Berry and Colleagues (2009) examined the effects of race on cancer outcomes by performing a retrospective study. The methodology involved analyzing the cancer registry, billing, and medical records for Black and White patients diagnosed with Stage 4 cancer between the years of 2000 and 2005. The findings from this study revealed that even after controlling for insurance, income, and disease severity, Black patients were receiving lower quality care [9,10].

A pivotal survey was conducted by the Commonwealth Fund in 2001 to assess the quality of healthcare based on race. The study was conducted using a sample size of 1,037 Americans that identify as Black or Black out of a total sample size of 6,722 [11]. Results from this survey provided evidence of racial disparities economically and in the quality of healthcare.

Income and access make a difference on your quality of healthcare or whether you end up receiving healthcare at all. This is evidenced by a survey conducted by Collins and Colleagues (2001). The results revealed that 59% of Black individuals were less likely to have job-based insurance and were more likely to rely on public programs. The survey also revealed that 50% of Black individuals reported annual income at or near poverty levels as compared to 30% of White individuals. Furthermore, regular doctor access was assessed as consistent access to a doctor that knows of your health status and that addresses all your concerns. It was found that 28% of Black individuals reported not having a regular doctor and cite emergency rooms, “nowhere”, and clinics as usual sources of care as compared to 9% of white individuals. This previous evidence suggests that income does not protect a Black woman from the risk of dying from pregnancy complications. It is a racial systematic issue that needs to be considered [11].

Perceived Stress and Postpartum Depression

The interaction of perceived stress and postpartum depression has an impact on the mothers’ postpartum experience, which can be detrimental for the mother and the baby. This is evidenced by a study conducted by Sidor and his colleagues (2011) that involved assessing Black non-clinical mother-infant dyads at psychosocial risk. The psychosocial risks they focused on included poverty, alcohol or drug abuse, and lack of social support. The findings from this study suggested that mothers that reported higher postpartum depression reported higher perceptions of parenting stress. Another study conducted by Suárez-Rico and his colleagues (2021) involved collecting data on postpartum Mexican mothers between August and September 2020. The purpose of this study specifically was to look at the perceived stress accumulated from COVID-19 by a postpartum mother. The findings from this study revealed that depression, anxiety, and perceived stress was higher during the COVID-19 pandemic lockdown for Mexican postpartum mothers than previously reported in literature [12,13].

Postpartum depression also known as perinatal depression is a mood disorder that can affect women during and after childbirth. Symptoms include anxiety, feelings of extreme sadness, and fatigue that can make it difficult for them to carry out daily tasks, including caring for themselves and others. Previous research suggests that postpartum depression is caused by an integration of environmental and genetic factors. Some environmental factors could be experiences of past trauma, while genetic factors can be a family history of depression.

Previous studies have measured postpartum depression by using the tool known as the Edinburgh Postnatal Depression Scale, which screens women for psychological distress. The prevalence of depression and anxiety for women during pregnancy was 16 percent and 19 percent after pregnancy. Halbreich and Karkun (2006) conducted a comprehensive review of depression attributing the cultural differences in young women reporting and understanding depression. Perinatal depression is another form of depression that constitutes being depressed during pregnancy. The risk for suicidality is significantly elevated among depressed women in the perinatal period and has been found to be the second leading cause of death in the depressed population of pregnant women [14-16].

Perceived Racism and Postpartum Depression

The relationship of perceived racism and postpartum depression is important to look at given that systemic racism is constantly negatively impacting Black women and mothers. This is evidenced by a study conducted by Stepanikova & Kukla (2017), which involved collecting survey data mid-pregnancy and at 6 months postpartum on Black mothers with low and high education. The findings revealed that Black mothers with low education perceived higher racism and discrimination, which was in turn associated with higher odds of postpartum depression. Another study by Rosenthal and colleagues (2015) involved examining changes across pregnancy and postpartum as it relates to perceived discrimination for Black and Hispanic mothers [18]. The findings revealed that according to the age of the mother, perceived discrimination increased and decreased between trimesters and strongly predicted anxiety and depression among Black and Hispanic mothers that reported food insecurity [17,18].

The current study assessed the differences in perceptions of the healthcare community across annual income and perceived stress levels, and the relationship between perceived stress, perceived racism, postpartum depression, and the perceptions of the healthcare community among Black women. With the minimal amount of information on this topic there is a need for further research on maternal mortality and solutions as it pertains to Black Women and the role of perceived discrimination. The following research questions were explored (1) Are there differences in perceptions of the healthcare community for women that report high levels of stress and those that report low levels of stress? (2) Do the perceptions of racism moderate the relationship between Black women’s perceptions of the healthcare community and stress and (3) Are there differences in the perceptions of the medical health care community for Black women across income level? (4) Does the combination or combined influence of perceptions of the healthcare community and income predict postpartum depression than either variable alone?

Methods

Research Design

To understand the differences in perceptions of the healthcare community across annual income, and the relationship between perceived stress, perceived racism, & postpartum depression among Black women, survey methodology was used. Twenty percent of data were randomly reentered. Frequency and distributions were run to ensure data is in acceptable data ranges. Non-Parametric Independent Sample T-tests were run to investigate differences in the perceptions of the healthcare community across stress and income. Spearman Rho correlations were run to investigate relationships between primary variables. Standard, Multiple, and Hierarchical regressions were run to investigate the moderating role of perceived racism and combined influence of perceptions of the healthcare community and annual pre-tax income.

Participants

Two-Hundred Nineteen Black mothers were recruited for the present study and solicited through agencies that provide services to expecting mothers in the Triangle Area. Black mothers were also solicited via online platforms such as Facebook, Instagram, and Tiktok. The only requirements or exclusions were that all participants must be at least 18 years of age or older, had a baby within the last two years, and identify as Black or of African descent. Finally, Cohen’s (1992) power analysis determined that for results to be significant at the .05 alpha level, and using a medium effect size, the present study needed a total of at least 85 participants to assess perceptions of the healthcare community, perceived stress, perceived racism, and postpartum depression. However, given that regression analysis needed to be performed, 200 was needed according to Fidell [19,20].

Regarding the participants in this study, 9.6% were 18-25 years old, 20.5% were 25-30 years old, 32.9% were 30-35 years old, and 37% were 35 years of age or older. In terms of their level of education, 6.4% of the participants were continuing education students, 1.4% non-degree seeking, .5% undergraduate freshmen, 2.3% sophomore, 3.7% junior, 6.4% senior, 42.5% Bachelor’s, 10% Master’s/Doctoral, and 19.6% Associate’s. 95.9% of the participants reported being enrolled full-time in school. 33.8% of the participants in the study reported being married.

In terms of socioeconomic status, 2.7% reported having an income of $15,000 or less, 34.7% reported having an income of $45,001-$60,000, and 5.5% reported making approximately over $100,000 a year. Regarding children, 74.5% of the participants reported having 3 children or less, while 6.4% of participants reported having a total of five or more children. Regarding children that were given birth to within the last five years, 89.4% of the participants reported having 1-2 children, while 1.9% of the participants reported having a total of four or more children. In terms of prenatal care, 95% of the participants reported having received it, while 5% reported not receiving prenatal care.

Regarding mental health counseling during or after pregnancy, 22.9% of the participants reported having received counseling, while an average of 89% of participants reported not receiving counseling and 92.2% of the participants reported experiencing financial difficulties, while 7.8% reported experiencing no financial difficulties. Roughly 90.9% of the participants reported being the primary caregiver of their children. Fifty point two percent of the participants reported having 3-4 family members or friends that help raise the child, while 33.8% of the participants reported having 4 or more family members or friends that help.

Forty-five-point two percent of the participants reported that they have sometimes seen media coverage regarding maternal health, while 7.8% of the participants reported that they have very often seen media coverage regarding maternal health. Thirty-nine point three percent of the participants reported that they have sometimes heard family or friends discuss maternal health, while 11.4% of the participants reported that they have very often heard family or friends discuss maternal health. Thirty point six percent of the participants reported having attended maternal health support groups sometimes, while 19.2% of the participants reported having attended maternal health support groups very often (Table 1).

Table 1: Descriptive Statistics for Participants’ Demographic Information.

Variable

Mean SD n

%

Age     219 100
18-25     21 9.6
25-30     45 20.5
30-35     72 32.9
35 or Older     81 37
Race/Ethnicity        
African     15 6.8
Black American     104 47.5
Afro-Black Caribbean     48 21.9
Afro-Black Latin X     38 17.4
Afro Latino     14 6.4
Region        
Northeast     19 8.7
Southwest     47 21.6
West     52 23.9
Southeast     63 28.9
Midwest     37 17
Missing     1  
Enrollment Status        
Part-Time     9 4.1
Full-Time     209 95.9
Missing     1  
Education        
High-School Diploma/GED     16 7.3
Freshman     1 .5
Sophomore     5 2.3
Junior     8 3.7
Senior     14 6.4
Bachelor’s Degree     93 42.5
Continuing Education Student     14 6.4
Masters/Doctoral/Professional     22 10
Non-Degree Seeking     3 1.4
Associates degree     43 19.6
Marital Status        
Single     13 5.9
In a Relationship     81 37
Married     74 33.8
Separated     25 11.4
Divorced     20 9.1
Widowed     6 2.7
Annual Income        
$15,000 or less     6 2.7
$15,001 – $30,000     19 8.7
$30,001 – $45,000     45 20.5
$45,000 – $60,000     76 34.7
$60,001 – $80,000     50 22.8
$80,000 – $100,000     11 5
Over $100,000     12 5.5
Number of Children        
1     24 11
2     56 25.6
3     83 37.9
4     42 19.2
5+     14 6.4
Number of Children in the last Five years        
1     119 54.8
2     75 34.6
3     19 8.8
4     3 1.4
5+     1 .5
Missing     2  
Prenatal Care During Pregnancy        
No     11 5
Yes     208 95
Pregnancy Complications        
No     19 8.7
Yes     199 91.3
Missing     1  
Mental Health Services During Pregnancy        
No     196 88.1
Yes     26 11.9
Missing     1  
Mental Health Services After Pregnancy        
No     195 89
Yes     24 11
Financial Difficulties During Pregnancy        
No     17 7.8
Yes     201 92.2
Missing     1  
Average Work Hours/ Week        
5 hours or less     8 3.7
5-10 hours     16 7.3
10-15 hours     102 46.6
15+ hours     93 42.6
Number of Jobs        
None     4 1.8
One     83 38.1
Two     95 43.6
Three     32 14.7
More than Three     4 1.8
Missing     1  
Primary Caregiver        
No     20 9.1
Yes     199 90.9
Number of Family/Friends That Help        
1-2     35 16
3-4     110 50.2
4+     74 33.8
Media on Maternal Health        
Very Often     17 7.8
Often     86 39.3
Sometimes     99 45.2
Not at All     17 7.8
Maternal Health discussed. By Family/Friends        
Very Often     25 11.4
Often     72 32.9
Sometimes     86 39.3
Not at All     36 16.4
Maternal Health Support Groups        
Very Often     42 19.2
Often     47 21.5
Sometimes     67 30.6
Not at All     63 28.8
N=219        

Measures

Demographics

Demographic information was collected by asking the participants to indicate their age, race or ethnicity, region of the U.S. in which they were born, current or previous enrollment status in school, highest level of education received, marital status, annual pre-tax income, number of children, number of children they had within the last five years, whether they received prenatal care during pregnancy, whether they experienced pregnancy complications, whether they received counseling during or after pregnancy, whether they experienced financial difficulties during pregnancy, how many hours a week they work, how many jobs they hold, whether they are the primary caregiver, and number of family or friends that help with child caring. The questionnaire also assessed aspects of the individual’s awareness about maternal health outcomes and if they have attended maternal health support groups for women of color.

Perceptions of the Healthcare community

The Discrimination in Medical Settings Scale

In 1997, David Williams and his colleagues cultivated a scale known as the Everyday Discrimination Scale (EDS) [21]. This widely utilized and measure of self-reported discrimination was adapted and modified into the DMS. The Discrimination in Medical Settings Scale is a 7-item 5-point Likert scale (1-never, 2-rarely, 3-sometimes, 4-most of the time, 5-always) used to assess discrimination in medical settings. Some examples of items are as follows: 1) You are treated with less respect than other people. 2) A doctor or nurse is not listening to what you were saying. 3) A doctor or nurse acts as if he or she thinks you are not smart. 4) The doctor or nurse acts as if he or she is afraid of you. This measure was found to be of good internal reliability; Cronbach’s alpha for the 7-item scale was 0.89 or higher. This measure also expanded upon the previous measures of discrimination and provided more focus on defining experiences of discrimination in healthcare settings.

Perceived Stress

Perceived Stress Scale

In 1983, Sheldon Cohen and his colleagues cultivated a scale known as the Perceived Stress Scale (PSS) [22]. This is the most widely used psychological instrument for measuring the perception of stress within the last 30 days. The Perceived Stress Scale (PSS) is a 10-item 4-point Likert scale (0-never, 1-almost never, 2-once in a while, 3-often, 4-very often). Some examples of items are as follows: 1) In the last month, how often have you felt that things were going your way? 2) In the last month, how often have you found that you could not cope with all the things that you had to do? 3) In the last month, how often have you felt nervous and stressed? 4) In the last month, how often have you felt that you were on top of things? This measure was found to be of good internal reliability; Cronbach’s alpha for the 10-item scale was 0.70 or higher. This measure also expanded upon the previous measures of stress.

Perceived Racism

The Perceived Racism Scale.

In 1996, Mcneily and her colleagues cultivated a scale known as the Perceived Racism Scale (PRS) [23]. This scale was created to assess the experiences of white racism against Blacks in multiple domains including employment and public domains. The Perceived Racism Scale (PSS) is a 14-item 4-point Likert scale (0-never, 1-rarely, 2-sometimes, 3- fairly often, 4-very often). Some examples of items are as follows: 1) How often in the past year have you had difficulty getting a loan because you are Black? 2) How often during your life have waiters and waitresses ignored you and served whites first? 3) How often in the past year have people “talked down” to you because you are Black? 4) How often in the past year have you experienced being followed, stopped, or arrested by White police more than others because of your race? This measure was found to be of good internal reliability; Cronbach’s alpha for the 14-item Likert scale was 0.70 or higher. This measure also expanded upon the previous measures of racism.

This scale was adapted to be appropriate for use in a cohort of Black mothers that have had a baby within the last two years. The Adapted Perceived Racism Scale (PSS) is a 12-item 5-point Likert scale (1-never, 2-less than once a year, 3-a few times a year, 4- about a few times a month, 5-once a week or more). Some examples of items are as follows: 1) How often have you been made to feel intimidated or less intelligent by doctors or nurses? 2) How often have you had a doctor or nurse make minimal eye contact with you or don’t give you a thorough physical examination? 3) How often do you feel that you have had to work twice as hard to explain your symptoms to a doctor for them to take you seriously? 4) How often do you feel that you are ignored or not taken seriously by doctors or nurses? This measure was found to be of good internal reliability; Cronbach’s alpha for the 12- item scale was 0.925. This measure also expanded upon the previous measures of racism.

Postpartum Depression

The Edinburgh Postnatal Depression Scale

In 1987, Cox and colleagues developed this scale to assist health professionals in detecting mothers that are suffering from postpartum Depression [24]. Postpartum is defined as a prolonged “blues” that can begin for the mother within a week after delivery of the baby. The Edinburgh Postnatal Depression Scale (EDPS) is a 10-item 3-point Likert scale (0-yes, all of the time, 1-yes, most of the time, 2-no, not very often, 3-no, not at all). Some examples of items are as follows: 1) I have felt miserable or sad.2) I have been so unhappy that I have been crying. 3) The thought of harming myself has occurred to me. 4) I have been so unhappy that I have had difficulty sleeping.

Procedures

To assess the differences in perceptions of the healthcare community across annual income, and the relationship between perceived stress, perceived racism, and postpartum depression, the present researcher submitted the study to the NCCU Institutional Review Board for approval. After receiving approval, the researcher contacted maternal health agency directors to gain permission to solicit participation from their mothers. The researcher also solicited participation from social media platforms such as Facebook, Instagram, and TikTok. The data was collected via an online survey on Qualtrics where the participants first completed a consent from, the demographic measure, and then completed the Discrimination in Medical Settings Scale, Perceived Stress Scale, The Perceived Racism Scale (Adapted), and The Edinburgh Postnatal Depression Scale to examine the variables. Participants were provided with a list of local mental health resources at the end of the survey [14-21].

Results

Data analysis was conducted using the SPSS 29.0 software. Frequency distributions were run to ensure that the data was within normative ranges. Spearman Rho correlations were calculated to examine the primary variables and demographic variables. Multiple and hierarchical regressions were utilized next to view to what extent perceived racism is a moderator for perceptions of the medical health community and perceived stress. As well as the combined influence of perceptions of the healthcare community and annual pre-tax income as predictors of postpartum depression. Median scores were created for each scale (see Table 2).

Table 2: Psychometric Properties (Medians and Ranges for Primary Variables).

Variables

Mdn

IQR

Perceived Stress (PSS)

29

14-40

Perceived Racism in Medical Settings (PRS) Postpartum Depression (PND)

49

14

12-60

4-37

Perceptions of the Medical Health Care Community (DMS)

26

7-35

Preliminary Analysis

In order to understand differences in the healthcare community across income, and the relationship between perceived stress, perceived racism, and postpartum depression among Black women Spearman Rho correlations were run. Spearman Rho correlations to assess the relationship between primary variables. The results revealed that there was a significant positive relationship between perceptions of the healthcare community and perceived stress (rs=.75, p≤0.001). Perceptions of the healthcare community was related to perceived racism (rs=.67, p≤0.001). Perceived racism was related to perceived stress (rs=.68, p≤0.001). Perceived stress and postnatal depression were negatively associated and not significant, however, it was approaching (rs=-.13, p=.06). Perceived stress and postnatal depression were negatively related (rs=-.14, p≤0.05). The Annual Pre-Tax Income was not significantly related to any of the primary variables (Tables 2 and 3).

Table 3: Correlation Results for Primary Variables

Variables

API PND DMS PSS

PRS

Annual Pre-Tax Income (API)          
Postpartum Depression (PND)

-.017

       
Discrimination in Medical Settings (DMS)

-.028

-.110

     
Perceived Stress (PSS)

.026

-.141*

.752**

   
Perceived Racism (PRS)

.017

-.130 .671**

.675**


p<.05* p<.01** p<.001***

Hypothesis 1: Differences in Perceptions of the Healthcare Community Across Levels of Stress

To assess differences in perceptions of the Healthcare community across levels of stress, a Mann Whitney U Test was run. The Mann Whitney U Test indicated that negative perceptions of the healthcare community were greater for individuals that reported higher levels of stress (Mdn=29) than those that had lower levels of stress (Mdn=21) (See Table 4a) that reported high levels of perceived stress (U=10638.5, p≤0.05) (see Table 4b).

Table 4a: Statistics: Perceptions of the Medical HealthCare.

Community across levels of Stress

Stress Group

DMS

1 Median

21
2 Median

29

Table 4b: Independent -Samples Mann-Whitney U.

Stress Group

1 (n=219)

2 (n=219)

Perceptions of the Mean Rank Medical HealthCare Community (DMS) 67.79

Mean Rank Z-Value

152.60 -9.921

Hypothesis 2: Perceptions of Racism as a Moderator between Perceptions of the Healthcare Community and Stress

In the first regression analysis, perceptions of racism were examined as a moderator between the perceptions of the healthcare community and perceived stress. The first regression model accounted for 49% of the variance (R2=.49., F (1,218)=, p≤0.001). Independently, perceived racism was associated with perceived stress among Black women (b=.70, p≤0.001). The results of the second regression model explained that these combined variables accounted for 62% of the variance (R2=.617, F (2,218)=, p≤0.001) and perceptions of the healthcare community was associated with perceived stress in Black women (b=.53, p≤0.001). In the third model of the regression analysis, the interaction term (perceptions of the healthcare community x perceived racism) was entered into the model to determine the possibility of moderation. The model was significant and accounted for 63% of the variance (R2=.63, F (3,218)=, p≤0.001), and there was evidence for moderation (∆R2=.009, ∆F=4.95). Independent Samples Non-Parametric Mann Whitney U Tests were run and individuals who were high in perceived stress (Mdn=52) reported significantly more racism than individuals that were low in perceived stress (Mdn=43) (U=10077.5, p≤0.001)) (Table 5).

Table 5: Moderator Analysis: Perceived Racism and Perceptions of the Medical Health Care Community on Perceived Stress.

β p R2

∆R2

Model 1

Perceived Racism (PRS)

.70

.001*** .49

.49

Model 2

Perceptions of the Medical Health Care Community (DMS)

.53

.001*** .62

.13

Model 3

PRS x DMS

.49

.001*** .63

.01

*p< .05, **p<.01, ***p<.001

Hypothesis 3: Perceptions of the Healthcare Community and Income

To assess mean differences in the perceptions of the healthcare community, a One-Way ANOVA was run. Results of the ANOVA indicated that there was significant mean difference in perceptions across income F(6, 218)=6.79, p≤0.001) (Table 6). Post Hoc analysis using Tukey and Bonferroni indicated that individuals that made $45,000-$60,0000 reported more favorable views of the healthcare community than those who made $30,000 and less and individuals who made over $100,000.

Table 6: One-Way ANOVA: Perceptions of the Medical Health Care Community across Income.

Source

df SS MS F p

N

Between Groups

6

1369.321 228.220 6.79 <.001***

218

Within Groups

212

7129.237 33.628    

218

Total

218

8498.557


p< .05* p< .01** p< .001***

Hypothesis 4: Perceptions of the Healthcare Community and Annual Pre-Tax Income as Predictors Postpartum Depression

The fourth hypothesis predicted that Perceptions of the Healthcare community and Annual Pre-Tax Income combined will be better predictors of Postpartum Depression than either variable alone. Standard and multiple regressions were run. Independently, perceptions of the healthcare community accounted for 3% of the variance in postpartum depression among Black women F(1, 218)=5.52, p≤0.05) (See Table 7) and was a significant negative predictor of postpartum depression among Black women (b=-.16, p≤0.05). Independently, annual pre-tax income accounted for less than 1% of the variance in postpartum depression among Black women F(1,218)=.25, p=ns and was not significantly associated with postpartum depression (b=.03, p=ns). Combined in the regression model, perceptions of the healthcare community and annual pre- tax income accounted for 3% of the variance and the model was approaching significance F(2, 218)=2.962, p≤0.054 (See Table 7). Thus, hypothesis 4 was not supported but approaching significance.

Table 7: Predictors of Postpartum Depression.

β p

R2

Model 1

Perceptions of the Medical Health Care Community (DMS)

-.157

.020*

.025

Model 2

Annual Pre-Tax Income

-.034

.620

.001

Model 3

DMS + Income

-.204

.001***

.018

*p< .05, **p<.01, ***p<.001.

Discussion

Findings

The current study was conducted to better understand differences and relationships in perceptions of the healthcare community, annual pre-tax income, perceived stress, perceived racism, and postpartum depression. In doing so, we hoped to provide detailed results about the relationships between these variables while also pinning down potential underlying factors. Research on perceptions of the healthcare community, annual pre-tax income, perceived stress, perceived racism, and postpartum depression among Black women has been largely qualitative. The current study sought to assess the relationship between perceptions of the healthcare community, annual pre-tax income, perceived stress, perceived racism, and postpartum depression.

We found a statistically significant difference in perceptions of the healthcare community between participants reporting high versus low perceived stress. This finding is consistent with prior literature examining healthcare mistrust, discrimination, and stress among Black women. Previous studies have shown that negative healthcare experiences and perceived discrimination are associated with increased psychological distress and stress-related outcomes [18-25]. For example, Cuevas and colleagues have documented that African American adults who report greater mistrust in healthcare institutions also report poorer psychological outcomes, including heightened stress and negative emotional responses related to healthcare encounters. Qualitative and quantitative studies by Cuevas and colleagues further indicate that experiences of discrimination, poor communication, and lack of respect in medical settings contribute to diminished trust and increased stress among Black patients [8,25]. These experiences are frequently framed as discrimination-related stressors rather than isolated interpersonal events. Related work has also demonstrated that medical mistrust and perceived discrimination are associated with adverse mental health outcomes among Black patients, including anxiety and depressive symptoms. Studies using established measures of physician mistrust and institutional medical mistrust have shown that discriminatory healthcare experiences contribute to stress and disengagement from care [26,27].

We found evidence of a moderation effect; women that were low on the PRS reported higher stress and those that were high in PRS reported less stress. Black women who had higher perceptions of racism reported higher levels of stress, whereas Black women that had lower perceptions of racism reported lower levels of stress. These findings are consistent with previous research by Suárez-Rico and his colleagues (2021) involved collecting data on postpartum Mexican mothers between August and September 2020 [13]. The purpose of this study specifically was to look at the perceived stress accumulated from COVID-19 by a postpartum mother. The findings from this study revealed that depression, anxiety, and perceived stress was higher during the COVID-19 pandemic lockdown for Mexican postpartum mothers than previously reported in literature.

We also found that there was a statistically significant mean difference in perceptions of the healthcare community across incomes. More specifically, we found that lower and higher income Black mothers reported less favorable views of the healthcare community than the middle-class income Black mothers. These findings could indicate that lower income women have a perceptual bias or potentially received subpar levels of care. Middle-class income women have insurance and certain expectations along with a certain level of education about the prenatal process. High income women have insurance, have the money to pay for prenatal health experts, and may live with a heightened awareness of racism. and the resources to pay for experts.

We lastly found that perceptions of the healthcare community accounted for more of the variability in postpartum depression than annual pre-tax income as an independent predictor. These findings are consistent with previous research while adding more information to the literature about Black women [28].

Conclusions

The purpose of this study was to assess differences in perceptions of the healthcare community across annual income, and the relationship between perceived stress, perceived racism, and postpartum depression. The results from this study give distinctive insight into Black women’s pregnancy and birthing experience, as well as how varying factors such as annual pre-tax income and social support, can act as potential buffers for postpartum depressive symptomatology. Future research is warranted given maternal and mental health challenges among the population and continued systematic racism and negative perceptions of the healthcare community.

Future studies investigating the relationship between perceptions of the healthcare community, perceived stress, perceived racism, and postpartum depression may benefit greatly from more extensive participant solicitation techniques via the internet (i.e., snowballing, purposive sampling) and in-person data collection in maternal health agencies. It is imperative that the researcher takes time to build relationships (i.e., volunteering, participating in different events or activities, etc.) with the maternal health agencies before soliciting participants. It is also imperative that future research focus on empowering Black women, through programmatic activities, to be aware of and then effectively manage the morbidities that are most associated with poor clinical maternal outcomes [29].

References

  1. Novoa C, Taylor J (2018) Exploring African Americans’ high maternal and infant death Center for American Progress. Available from: https://www. americanprogress.org/issues/early-childhood/reports/2018/02/01/445576/ exploring-African-Americans-high-maternal-infant-death-rates
  2. Centers for Disease Control and Prevention (2021) Working Together to Reduce Black Maternal Mortality.
  3. Lister RL, Drake W, Scott BH, Graves C (2019) Black Maternal Mortality-The Elephant in the World J Gynecol Womens Health 3(1): 10.33552/wjgwh.2019.03.000555. [crossref]
  4. Koblinsky M, Chowdhury ME, Moran A, Ronsmans C (2012) Maternal morbidity and disability and their consequences: neglected agenda in maternal J Health Popul Nutr 30(2): 124-130. [crossref]
  5. Pieterse AL, Todd NR, Neville HA, Carter RT (2012) Perceived racism and mental health among Black American adults: a meta-analytic review. J Couns Psychol 59(1): 1-9. [crossref]
  6. Brandon DT, Isaac LA, LaVeist TA (2005) The legacy of Tuskegee and trust in medical care: is Tuskegee responsible for race differences in mistrust of medical care? J Natl Med Assoc 97(7): 951-956. [crossref]
  7. Blair IV, Steiner JF, Fairclough DL, et al. (2013) Clinicians’ implicit ethnic/racial bias and perceptions of care among Black and Latino patients. Ann Fam Med 11(1): 43-52. [crossref]
  8. Cuevas AG, O’Brien K, Saha S (2016) African American experiences in healthcare: “I always feel like I’m getting skipped over”. Health Psychol 35(9): 987-995. [crossref]
  9. Okoro ON, Hillman LA, Cernasev A (2020) “We get double slammed!”: Healthcare experiences of perceived discrimination among low-income African-American Womens Health (Lond) 16: 1745506520953348. [crossref]
  10. Berry J, Caplan L, Davis S, et (2010) A black-white comparison of the quality of stage-specific colon cancer treatment. Cancer 116(3): 713-722. [crossref]
  11. Collins KS, Tenney K, Hughes DL (2002) Quality of health care for African Americans: findings from the Commonwealth Fund 2001 health care quality New York, NY: The Commonwealth Fund.
  12. Sidor A, Kunz E, Schweyer D, Eickhorst A, Cierpka M (2011) Links between maternal postpartum depressive symptoms, maternal distress, infant gender and sensitivity in a high-risk Child Adolesc Psychiatry Ment Health 5(1): 7. [crossref]
  13. Suárez-Rico BV, Estrada-Gutierrez G, Sánchez-Martínez M, et al. (2021) Prevalence of Depression, Anxiety, and Perceived Stress in Postpartum Mexican Women during the COVID-19 Int J Environ Res Public Health 18(9): 4627. [crossref]
  14. Fisher J, Cabral de Mello M, Patel V, et al. (2012) Prevalence and determinants of common perinatal mental disorders in women in low- and lower-middle-income countries: a systematic review. Bull World Health Organ 90(2): 139G-149G. [crossref]
  15. Halbreich U, Karkun S (2006) Cross-cultural and social diversity of prevalence of postpartum depression and depressive symptoms. J Affect Disord 91(2-3): 97-111. [crossref]
  16. Lindahl V, Pearson JL, Colpe L (2005) Prevalence of suicidality during pregnancy and the postpartum. Arch Womens Ment Health 8(2): 77-87. [crossref]
  17. Stepanikova I, Kukla L (2017) Is Perceived Discrimination in Pregnancy Prospectively Linked to Postpartum Depression? Exploring the Role of Matern Child Health J 21(8): 1669-1677. [crossref]
  18. Rosenthal L, Earnshaw VA, Lewis TT, et al. (2015) Changes in Experiences With Discrimination Across Pregnancy and Postpartum: Age Differences and Consequences for Mental Health. American Journal of Public Health 105(4): 686-693. [crossref]
  19. Cohen J (1992) A power Psychol Bull. 1992 112(1): 155-159. [crossref]
  20. Tabachnick BG, Fidell LS (2007) Using multivariate statistics. 5th New York, NY: Pearson Education.
  21. Williams DR, Yu Y, Jackson JS, Anderson NB (1997) Racial differences in physical and mental health: Socio-economic status, stress and J Health Psychol 2(3): 335-351. [crossref]
  22. Cohen S, Kamarck T, Mermelstein R (1983) A global measure of perceived stress. J Health Soc Behav 24(4): 385-396. [crossref]
  23. McNeilly MD, Anderson NB, Armstead CA, et (1996) The perceived racism scale: a multidimensional assessment of the experience of white racism among African Americans. Ethn Dis 6(1-2): 154-166. [crossref]
  24. Cox JL, Holden JM, Sagovsky R (1987) Detection of postnatal depression. Development of the 10-item Edinburgh Postnatal Depression Br J Psychiatry 150: 782-786. [crossref]
  25. Cuevas AG, O’Brien K (2019) Racial centrality may be linked to mistrust in healthcare institutions for African J Health Psychol 24(14): 2022-2030. [crossref]
  26. LaVeist TA, Isaac LA, Williams KP (2009) Mistrust of health care organizations is associated with underutilization of health services. Health Serv Res 44(6): 2093-2105. [crossref]
  27. Bazargan M, Cobb S, Assari S (2021) Discrimination and Medical Mistrust in a Racially and Ethnically Diverse Sample of California Ann Fam Med 19(1): 4-15. [crossref]
  28. Hansotte, E, Payne, S. I, Babich, S. M (2017) Positive postpartum depression screening practices and subsequent mental health treatment for low-income women in Western countries: a systematic literature review. Public Health Reviews, 38(3). [crossref]
  29. Collins-McNeil J, Edwards CL, Batch BC, Benbow D, McDougald CS, et al. (2012) A culturally targeted self-management program for African Americans with type 2 diabetes mellitus. Can J Nurs Res 44(4): 126-141. [crossref]

Examining the Impact of Cultural Education on Fertility Behaviours Among Schoolgirls in South African Schools

DOI: 10.31038/AWHC.2025843

Abstract

The South African government has introduced various policies designed to prevent and manage learner pregnancy within schools. These initiatives form part of a broader national effort to address the social and health challenges that young people encounter across the country. Despite various interventions, teenage pregnancy remains a persistent social and public health challenge in South Africa with the rates of pregnancy and subsequent school dropouts among these young mothers persist, leading to severe economic consequences and perpetuating cycles of poverty. This paper examines how cultural education affects fertility behaviors among schoolgirls in South Africa, drawing from contemporary literature on cultural norms, teenage pregnancy, and school-based interventions. Evidence suggests that culturally grounded learning improves critical awareness, supports contraceptive uptake, and empowers girls to navigate pressures from families and communities. However, cultural barriers, religious norms, and moralistic attitudes often limit the effectiveness of these initiatives.

Keywords

Teenage pregnancy, Poverty, Cultural barriers, Prevention, Contraceptives

Introduction

Teenage pregnancy is a major concern in South African schools, with thousands of pregnancies recorded each year [1]. In support of this is [2] who argues that South Africa has one of the highest teenage pregnancy rates in the world, with nearly one in four girls becoming pregnant before the age of 20. According to Statistics South Africa, 90,037 girls aged 10 to 19 gave birth across the nine provinces between March 2021 and April 2022 (Stats SA [3]). This pattern highlights the urgent need for comprehensive sexual and reproductive health education and adolescent‑focused services to help curb rising teenage pregnancy rates, particularly during periods of crisis [4].

Many of pregnancies occur in contexts shaped by cultural expectations related to femininity, sexuality, and motherhood [5]. According to [6] cultural norms often transmitted through families, communities, and religious institutions play a significant role in shaping adolescents’ fertility decisions. Hence, [7], argues that 85% of pregnant women indicated that their families favoured their pregnancy. Research also shows that peer education and cultural dialogue are important interventions in addressing contraceptive behavior [8] and [2], but these efforts must meaningfully engage cultural and religious influences to be effective.

Therefore, cultural education, when integrated into school curricula, can challenge harmful norms, promote informed reproductive choices, and empower schoolgirls. Hence, is of paramount important to undergo this study as it aims to explore how such education affects fertility behavior among schoolgirls.

Literature Review

Cultural Norms as Predictors of Fertility Behavior

Socio‑cultural factors such as religion, ethnicity, and community beliefs significantly predict teenage pregnancy in South Africa. In the same vein, [9] argus that cultural beliefs and principles play a significant role in shaping the social landscape of the macrosystem. For instance, cultural predictors such as religious affiliation and ethnicity strongly influence adolescent fertility, especially in urban areas. In the same breath, [1] argues that the influence of ethnicity and religion play a crucial role more so in urban areas than in rural areas. All these are found in the macrosystem the adolescent leaves in. Above all, these norms shape beliefs about ideal family size, the acceptability of contraceptive use, and the meaning of womanhood [2]. In the same breath, [10] argues that women’s fertility preferences such as the number of children they desire and their willingness to use modern family planning methods are shaped by a complex interplay of social, economic, and cultural factors operating at multiple levels, often reinforcing or counterbalancing one another. Demographic characteristics including age and geographic context, levels of education [11‑13], religious orientation [14], as well as prevailing social norms and cultural beliefs [15], all play influential roles in determining women’s fertility aspirations and their adoption of family planning practices. Together, these factors contribute significantly to broader fertility patterns.

The Role of Education in Shaping Reproductive Behavior

Educational interventions, particularly peer education programs, have been shown to improve young people’s sexual health knowledge and reduce risky behavior. Hence, [2] argues that cultures, values, and traditions influence the prevailing negative perception of teenage mothers. However, their effectiveness is constrained if they do not address cultural and religious pressures. As one study found, cultural norms, church teachings, and community expectations limited adolescents’ ability to mentor peers on contraception, despite improved knowledge [1]. In the same vein, [16], argues that such perceptions have a key influence on decision‑ making processes and behaviour and may be particularly important in contexts of subsistence livelihoods and resource constraints, where households are vulnerable to both food insecurity and environmental degradation.

School Policy, Gender Norms, and Reproductive Outcomes

South African schools often operate within moralistic and conservative discourses around sexuality. These school‑based cultural norms can affect students’ reproductive choices. Research indicates that dominant school cultures that frame teenage pregnancy as moral failure reinforce shame, exclusion, and silence factors that limit informed fertility choices [17].

Cultural Education as an Intervention

Cultural education helps learners question harmful traditions, challenge myths about contraception, and understand the cultural roots of gender expectations. By discussing cultural norms openly, girls can develop stronger decision‑making skills. Literature further suggests that including cultural discussions in reproductive health interventions increases adolescents’ acceptance of contraception and reduces pregnancy risk [18]. On the other hand, [19] argues that cultural education serves as a mechanism to challenge and reshape these dominant social norms by engaging students in discussions about traditions, beliefs, and cultural misconceptions.

Theoretical Framework

This study is underpinned by Social Norms Theory (SNT). Social norms theory explains how individuals often misjudge the attitudes or behaviours of their peers and wider community, assuming them to differ from their own. This pattern of misunderstanding referred to as pluralistic ignorance [20] can arise in relation to both risky or problematic behaviours as well as healthy or protective ones. Such misperceptions may lead people to modify their own behaviour to align with what they mistakenly believe to be the norm [21]. As a result, individuals may adopt or justify harmful behaviours or, conversely, suppress positive, health‑promoting behaviours.

The Social Norms Theory asserts that individuals’ behaviours are shaped by perceived social expectations, cultural beliefs, and community norms. This theory deemed relevant to the current study as it allows the researcher to explain why schoolgirls may conform to social expectations encouraging early sexual activity or discouraging contraceptive use. Furthermore, it will guide the researcher to propose the interventions which will correct these misperceptions by revealing the actual, healthier norm that will have a beneficial effect on adolescent girl in, to reduce their participation in potentially problematic behaviour or be encouraged to engage in protective, healthy behaviours [22].

Methodology

Research Design

The methodology employed in this study involved the implementation of a systematic literature review research strategy synthesizing findings from peer‑reviewed studies, government reports, and policy documents exploring cultural influences on adolescent fertility. The researcher searched for peer‑reviewed studies on socio‑cultural predictors of teenage pregnancy, school‑based responses to teenage pregnancy, South African public health and educational reports and studies examining the interaction between culture and contraceptive use via google scholar.

This approach involved the meticulous identification and selection of relevant articles, as well as the exclusion of those that did not meet the predetermined inclusion criteria [2]. The detailed process of article retrieval, inclusion, and exclusion is elaborated upon in this section. According to [23], as cited in [24], conducting reviews transparently and reproducibly is what the systematic literature review as a research method aims to achieve. Above all, it enables the researcher to make selection of articles to incorporate or omit in the study [24]. Upon completing the reading, themes were identified across the literature reviewed, which includes, cultural norms and fertility, school‑based cultural influences, effects of cultural education, and barriers to culturally relevant sexual education.

Discussion

Cultural Education Improves Reproductive Knowledge

Evidence shows that when cultural beliefs are openly discussed in education settings, students gain a more nuanced understanding of fertility and contraception. Peer‑education programs, when culturally grounded, increase knowledge and enable adolescents to critically examine cultural messages about sexuality [1].

Challenging Myths and Misconceptions

Several scholars [25‑27] contend that rumours surrounding contraceptives such as beliefs that injectable methods damage the body negatively and oral contraceptives cause lower rates of acne, hirsutism, and weight gain, but higher rates of venous thromboembolism [28] influence both access to and utilisation of contraception. These misconceptions contribute to low contraceptive uptake, which in turn results in high levels of unmet need and increased rates of unintended pregnancy among adolescent girls and women. Similarly, [29] notes that many individuals are more preoccupied with the perceived negative side effects of contraceptives than with their effectiveness in preventing unwanted pregnancies. [27] further report that numerous adolescent girls and women cite side effects such as weight gain or loss, irregular bleeding, amenorrhea, and other bodily changes as reasons for avoiding contraceptive use. Participants also expressed fears that contraception could cause infertility or make the vagina “too wet,” leading to concerns about being viewed as undesirable by partners. Condoms, on the other hand, were often associated with discomfort, irritation from lubricants, and suspicions of infidelity. These misconceptions persist largely due to limited contraceptive education, particularly in low‑ and middle‑income countries (LMICs) [27]. Cultural beliefs such as the idea that contraceptives cause infertility also to exacerbate these concerns. [30] argue that dismissing these beliefs as mere rumours simply because they stem from social accounts of other women’s experiences rather than from clinical providers undermines a valuable and legitimate source of knowledge for many women.

Consequently, Jones (2023) argues that the decision to initiate contraception and select a method requires careful consideration; however, conflicting and confusing information often leaves individuals without the necessary knowledge to make informed choices. Culturally sensitive education has therefore been identified as essential for dispelling myths, reducing fear, and promoting informed contraceptive decision‑making. On the other hand, many programs recommend that providers address women’s concerns about the possible negative health effects of contraceptive methods by reassuring them that such fears are unfounded and that any side effects are likely to be minimal [31,32]. This type of counselling is commonly advocated in research that identifies associations between women’s beliefs and their contraceptive use [26,33‑35].

Empowering Girls Against Harmful Gender Norms

Many South African girls face cultural pressure to prove fertility, maintain submissiveness to partners, or conform to traditional femininity. Cultural education empowers girls to question these norms, advocate for themselves, and resist early sexual debut. According to [1] statistics of girls affiliating to traditional African religion were significantly positive with a 24% higher likelihood of pregnancy compared with Christian girls, while it was not significant and almost equal with a 1% lower chance of pregnancy among rural dwellers. This indicates that cultural education has its ways of decreasing teenage pregnancy. As observed in a practice of Basotho culture, where girls are not allowed to eat food such as eggs and intestine . This kind of practice is pass down to girls through gathering such as pitiki. According to [36], Basotho women gather during pitiki celebrations to support one another, share their experiences, and offer advice on addressing various challenges, particularly those involving their marriages or relationships with men. Consequently, ([37]: 88) agrees with [36] by pointing out that ‘we need new alternatives and sometimes this means revisiting the old wisdoms and tapping into the maternal legacies of knowledge in Africa’. Hence, pitiki is seen as a good space were Indigenous Basotho women’s knowledges related to sexual, reproductive health and well‑being, maternal and child health within and around the Indigenous are discussed [38]. In this space, girls are free to discuss any matters related to sex, as such this helps to reduce teenage pregnancy.

Addressing Cultural and Religious Barriers

Studies show that religion and cultural identity strongly influence teenage fertility. Cultural education enables learners to navigate these influences by offering critical reflection rather than dismissing cultural identity. Programs that ignore culture tend to be ineffective [2]. Previous research has highlighted religion understood as systems of faith and worship as a factor that influences teenage pregnancy [39,40]. In the South African context, the influence of religion on teenage pregnancy appears to stem largely from religious teachings that discourage the use of contraceptives. For example, a study conducted in the North‑West province found that 6.83% of participants believed that using contraception was against their religious beliefs [41]. Likewise, research carried out in the Vhembe district of Limpopo reported that, because most teenagers (94.1%) identified as Christian, religious beliefs played a significant role in teenage pregnancy, as contraception was generally not supported [42]. Concurring to this is [1] who argues that the most affected groups are Nguni group (51%), Christian faith (84.9%) and lived in urban areas (53%) in KwaZulu‑Natal (21%). Therefore, understanding these cultural and religious influences is essential for developing effective, culturally and religiously sensitive reproductive health strategies that respect community beliefs while promoting women’s autonomy and well‑being.

The Role of Schools

The South African government has introduced various policies designed to prevent and manage learner pregnancy within schools. Amongst those policies is the Policy on the Prevention and Management of Learner Pregnancy in that was finalised in 2021 by the Department of Basic Education. The policy expressly provides that a school may not discriminate against a learner based on her pregnancy status [43]. The School Governing Body (SGB) is given the mandate to implement and fulfil the need of the policies governing the school [44]. This suggest that SBG in their policy will be in position to suggest the programmes that raise awareness on teenage pregnancy. Therefore, these initiatives form part of a broader national effort to address the social and health challenges that young people encounter across the country.

To reduce the likelihood of young people engaging in unsafe sexual practices, it is essential to equip them with the knowledge and skills necessary for practicing safe sex [45‑47]. Schools serve as an ideal setting for delivering this education, as they provide access to most children and adolescents. I therefore, argue that recently schools often perpetuate moralistic messages about sexuality, which create stigma around pregnancy and contraceptive use. This is because teachers offering sex education often use more passive forms of learning and tend to disregard skill‑oriented learning activities [48‑50]. On the same breath, [51] argue that cultural and societal taboos surrounding sexual and reproductive health strongly shape both educational content and public health policies. In many countries, school‑based sex education is either highly restricted or entirely absent due to cultural sensitivities and political opposition. The United States, for example, has long experienced controversy over abstinence‑only versus comprehensive sex education, with the preference for abstinence‑only approaches often grounded in religious and cultural norms [52]. In contrast, nations that adopt more open and comprehensive approaches to sexual health such as the Netherlands report lower rates of teenage pregnancy and sexually transmitted infections [53]. These comparisons demonstrate how cultural contexts are both reflected in and reinforced by policy choices, which signal varying levels of societal comfort and openness toward sexual and reproductive health topics. Therefore, changing school culture through inclusive cultural education can create safer environments for discussing reproductive choices [2].

Conclusion

It has been observed that fertility choices such as preferred family size, timing of childbearing and contraceptive use are deeply shaped by cultural and religious norms as well as social expectations. In many communities, beliefs about womanhood, lineage continuation, masculinity, religious teachings, and social status influence how women make reproductive decisions. Cultural education significantly shapes fertility behavior among South African schoolgirls. By addressing cultural norms, challenging myths, and empowering girls, it contributes to informed reproductive decision‑making and helps reduce teenage pregnancy. However, cultural education must be delivered in ways that respect community traditions while promoting girls’ rights and autonomy. Schools, families, and communities must collaborate to develop culturally sensitive and empowering educational interventions. As observed, high fertility rates pose challenges not only for country, but also for food security and the general welfare of households [54].

References

  1. Mkwananzi S, Lebelo RS, Mashinini A, Ngake A, Paledi MS, Thwala LS (2022) Socio‑ cultural predictors of teenage pregnancy in South Africa: A cross‑sectional study that compares rural and urban Gender and Behaviour 20(4): 20525‑20541.
  2. Mbongwa L, Mpanza S, Mlambo VH (2024) The teenage pregnancy crisis in South Africa among high school students, causes, implications and possible solutions: A literature review. Futurity Education 4(3): 200‑216.
  3. Pikoli Z (2023) Teenage pregnancy prevention is not just about irresponsible teens say activists. Daily Available from: https://www.dailymaverick.co.za/ article/2023‑09‑29‑teen‑pregnancyprevention‑not‑just‑about‑irresponsible‑teens/
  4. Barron P, Subedar H, Letsoko M, Makua M, Pillay Y (2022) Teenage births and pregnancies in South Africa, 2017‑2021‑a reflection of a troubled country: Analysis of public sector data. South African Medical Journal 112(4): 252‑258. [crossref]
  5. Blackwood E (2000) Culture and women’s Journal of Social Issues 56(2): 223‑238.
  6. Taiwo MO, Oyekenu O, Hussaini R (2023) Understanding how social norms influence access to and utilization of adolescent sexual and reproductive health services in Northern Frontiers in Sociology 8: 865499. [crossref]
  7. Bhana D, Morrell R, Shefer T, Ngabaza S (2010) South African teachers’ responses to teenage pregnancy and teenage mothers in Culture Health and Sexuality 12(8): 871‑83. [crossref]
  8. Gwala L (2022) Recent policy around teenage pregnancy within the South African basic education sector. Adams & Adams. https://www.adams.africa/commercial‑litigation/ familylaw/recent‑policy‑around‑teenage‑pregnancy‑within‑the‑south‑african‑ basic‑education‑sector/
  9. Donald D, Lazarus S, Lolwana P (2002) Educational psychology in social context (2nd ) Oxford University Press.
  10. Rodrigues P, Manlosa AO, Fischer J, Schultner J, Hanspach J, et (2022) The role of perceptions and social norms in shaping women’s fertility preferences: a case study from Ethiopia. Sustainability Science 17(6): 2473‑2488.
  11. Martin TC (1995) Women’s education and fertility: results from 26 demographic and health Stud Fam Plann 26: 187. [crossref]
  12. Bongaarts J (2003) Completing the fertility transition in the developing world: the role of educational differences and fertility Popul Stud. 57(3): 321‑335. [crossref]
  13. Bongaarts J, Mensch BS, Blanc AK (2017) Trends in the age at reproductive transitions in the developing world: the role of education. Popul Stud 71(2): 139‑154. [crossref]
  14. Adsera A (2006) Religion and changes in family‑size norms in developed Rev Relig Res 47: 271‑286.
  15. Caldwell JC, Caldwell P (1987) The cultural context of high fertility in sub‑Saharan Population and Development Review 13: 409‑437.
  16. Pyhälä A, Fernández‑Llamazares Á, Lehvävirta H, Byg A, Ruiz‑Mallén I, et (2016) Global environmental change: local perceptions, understandings, and explanations. Ecology and society: a journal of integrative science for resilience and sustainability 21(3): 25. [crossref]
  17. Twitty TD, Hitch AE, Marais L, Sales JM, Sharp C, et (2024) Pregnancy and STI/ HIV prevention intervention preferences of South African adolescent girls: Findings from a cultural consensus modelling qualitative study. Culture Health & Sexuality 26(2): 191‑207. [crossref]
  18. Roets L, Clemence IS (2021) Teenage pregnancy prevention: The church, community, culture and African Journal of Reproductive Health 25(6): 51‑57. [crossref]
  19. Zalli E (2024) Globalization and education: exploring the exchange of ideas, values, and traditions in promoting cultural understanding and global citizenship. Interdisciplinary Journal of Research and Development 11(1 S1): 55‑55.
  20. Miller, DT, McFarland, C (1991) When Social Comparison Goes Awry: The Case of Pluralistic Chapter 11 in Suls J, Wills, T (Eds) Social Comparison: Contemporary Theory and Research, Hillsdale, NJ: Erlbaum.
  21. Prentice, DA, Miller DT (1993) Pluralistic Ignorance and Alcohol Use on Campus: Some Consequences of Misperceiving the Social Norm. Journal of Personality and Social Psychology 64(2): 243‑256. [crossref]
  22. Berkowitz AD (2003) Applications of social norms theory to other health and social justice issues. The social norms approach to preventing school and college age substance abuse: A handbook for educators counselors and clinicians 1: 259‑279.
  23. Davis J, Mengersen K, Bennett S, Mazerolle L (2014) Viewing systematic reviews and meta‑analysis in social research through different lenses. Springer Plus 3: 511.
  24. Snyder H (2019) Literature review as a research methodology: An overview and Journal of Business Research 104: 333‑339.
  25. Ankomah A, Anyanti J, Oladosu M (2011) Myths, misinformation, and communication about family planning and contraceptive use in Open Access J Contracept. 2: 95‑105.
  26. Gueye A, Speizer IS, Corroon M, Okigbo CC (2015) Belief in family planning myths at the individual and community levels and modern contraceptive use in urban International Perspectives on Sexual and Reproductive Health 41(4): 191.
  27. Jonas K, Duby Z, Maruping K, Harries J, Mathews C (2022) Rumours, myths, and misperceptions as barriers to contraceptive use among adolescent girls and young women in South Frontiers in Reproductive Health 4: 960089. [crossref]
  28. Joseph J, Pradeepkumar K, Chettyparambil Lalchand T (2024) Myths and Misconceptions‑Unraveling the Paradox of Oral Contraceptive International Journal of Health Sciences and Research 14(5): 368‑375.
  29. Castle S (2003) Factors influencing young Malians’ reluctance to use hormonal contraceptives, Studies in Family Planning 34(3): 86‑199. [crossref]
  30. Stevens R, Machiyama K, Mavodza CV, Doyle AM (2023) Misconceptions, misinformation, and misperceptions: A case for removing the “mis‐” when discussing contraceptive Studies in Family Planning 54(1): 309‑321. [crossref]
  31. PATH (2015) “Outlook on Reproductive Health: Countering Myths and Misperceptions about ” Washington, DC.
  32. Kaur Simranvir, Paul Blumenthal (2021) “Global Myth Busting in Family Planning.” Current Opinion in Obstetrics & Gynecology 33(6): 458‑462. [crossref]
  33. Odwe G, Wado YD, Obare F, Machiyama K, Cleland J (2021) Method‑specific beliefs and subsequent contraceptive method choice: Results from a longitudinal study in urban and rural PloS one 16(6): e0252977. [crossref]
  34. Wado YD, Mutua MK, Odwe G, Obare F, Machiyama K, et (2021) Method Related Attributes and Contraceptive Discontinuation: Results from A Prospective Study from Nairobi and Homa Bay Counties in Kenya.
  35. Sedlander E, Bingenheimer JB, Lahiri S, Thiongo M, Gichangi P, et (2021) Does the belief that contraceptive use causes infertility actually affect use? Findings from a social network study in Kenya. Studies in Family Planning 52(3): 343‑359. [crossref]
  36. Mokala NT (2020) Understanding the Meanings Represented in Ditolobonya Songs: Basotho Women’s Experiences and Realities. International Journal of Linguistics Literature and Translation 3(3): 144‑153.
  37. Magoqwana B (2021) Gendering social science: Ukubuyiswa of maternal legacies of knowledge for balanced social science studies in South Africa. In J. B. Bernedette Muthien (Ed.), Rethinking Africa: Indigenous women re-interpret Southern Africa’s pasts (pp. 87‑102) Johannesburg: Jacana Media.
  38. Mohlabane N (2022) Unsettling knowledge boundaries: the Indigenous pitiki space for Basotho women’s sexual empowerment and reproductive well‑being. Health Sociology Review 31(2): 158‑172. [crossref]
  39. Thobejane TD (2015) Factors contributing to Teenage Pregnancy in South Africa: The Case of Matjitjileng Journal of Sociology and Social Anthropology 6(2): 273‑277.
  40. Yakubu I, Salisu WJ (2018) Determinants of adolescent pregnancy in sub‑Saharan Africa: A systematic Reproductive Health 15(1): 15. [crossref]
  41. Donatus, Sama, Tsoka‑Gwegweni, Cumber (2018) Factors associated with adolescent school girl’s pregnancy in Kumbo East Health District North West region Pan African Medical Journal 31(138): 1‑11. [crossref]
  42. Miriri, T.M, Ramathuba, D.U, Mangena‑Netshikweta ML (2014) Social factors contributing to teenage pregnancy at Makhado Municipality, Limpopo province, South African Journal for Physical Health Education Recreation and Dance 20(sup‑1): 130‑141.
  43. Veriava F (2024) The Basic Education Laws Amendment Bill: A case study in transformative constitutionalism beyond the African Human Rights Law Journal 24(1): 153‑178.
  44. Masowa AM (2024) The Impact of Kwazulu‑Natal Provincial Language Policy on Sesotho Speakers at Nquthu. E-Journal of Humanities Arts and Social Sciences 5(11): 1831‑1840.
  45. Rotheram‑Borus MJ (1995) Aids prevention with AIDS Education and Prevention 7: 320‑336. [crossref]
  46. Jemmott, JB III (2000) HIV risk reduction behavioral interventions with heterosexual AIDS 14: S40‑S52. [crossref]
  47. Kirby D (2002) .The impact of schools and school programs upon adolescent sexual Journal of Sex Research 39(1): 27‑33. [crossref]
  48. Schaalma H, Poelman J, Reinders J (1993) De herziening van ‘Lang leve de liefde’. Een lespakket over aids, soa en veilig vrijen [Revision of Long Live Love. A curriculum about AIDS, STD and safe sex]. Tijdschrift Gezondheidsvoorlichting 10: 5‑7.
  49. Van den Akker J, Kuiper W (1993) .The implementation of a social studies Journal of Curriculum and Supervision 8: 293‑305.
  50. Paulussen TGW (1994) Adoption and implementation of AIDS education in Dutch secondary schools. Dissertation. Landelijk Centrum GVO, Utrecht.
  51. Tohit NFM, Haque M (2024) Forbidden conversations: A comprehensive exploration of taboos in sexual and reproductive health. Cureus 16(8). [crossref]
  52. Santelli JS, Kantor LM, Grilo SA, Speizer IS, Lindberg LD, et (2017) Abstinence‑ only‑until‑marriage: An updated review of US policies and programs and their impact. Journal of Adolescent Health 61(3): 273‑280. [crossref]
  53. Wiefferink CH, Poelman J, Linthorst M, Vanwesenbeeck I, Van Wijngaarden JCM, et (2005) Outcomes of a systematically designed strategy for the implementation of sex education in Dutch secondary schools. Health Education Researc20(3): 323‑333. [crossref]
  54. Shefer T, Bhana D, Morrell R (2013) Teenage pregnancy and parenting at school in contemporary South African contexts: Deconstructing school narratives and understanding policy implementation. Perspectives in Education 31(1): 1‑10.

Using Mind Genomics Thinking and AI Simulation to Study Socio-political Issues: Possible Individual ‘Fall-Out’ from the US DOGE Efforts

DOI: 10.31038/MGSPE.2026611

Abstract

Using a combination of the Mind Genomics platform BimiLeap.com and AI, the paper shows how one can rapidly explore ideas in today’s unstable world of political instability coupled with social instability. The paper shows by means of simulation how the investigator can identify a problem by using AI to create a ‘situation backgrounder’, and then use that backgrounder in turn to create classification questions about people, questions about responses to situations calling for betraying one’s country, and then answers to those questions. The questions never appear in the analysis, but simply act as guides to generate answers, which are presented as statements. Synthetic respondents, created by AI, are then exposed to vignettes comprising 2-4 of these above-mentioned answers. The respondents are also given personas by AI, as well as given different types of background instructions. The effort provides an instructional database showing how response classified as either ‘loyal’ or ‘tempted’ can be traced to the types of messages a person receives, the persona of the person created by AI, and finally the type of situation which prevails (e.g., public feelings shortly after DOGE, Department of Government Efficiency has made its cuts). The process is quick (hours and days), affordable (only costs are AI), and deep information, allowing the simulation to give a sense of what may happen.

Introduction

In President Trump’s second term as US President, he created DOGE. Dept of Governmental; Efficiency. The goal was to audit government expenditures and cut waste, doing so dramatically by firing people who had spent years and even decades as civil servants and as other ways of working for the US government. The outcome was that many government employees lost their jobs. There were, of course, negative feelings by the fired people (and others) towards the government. The topic here is to simulate what might be the actions of these disaffected, fired people, were they to be approached by individuals by another country to take money for selling what they know, and possibly learned during their tenure with the US government [1,3,7,8].

During this same period, research in the emerging science of Mind Genomics continued to show the ability of this science to understand the way people think about the topics of ordinary life and make decisions of the ordinary [4]. The Mind Genomics process of creating elements (messages) about a topic and combining these messages into vignettes according to an underlying plan called an experimental design ended up revealing many facets of how people think about topics. The strategy was to avoid having people ‘intellectualize’ about a topic. Rather, one would create simple combinations of messages, so-called vignettes, and have the respondent rate the vignette. The respondent was not challenged at all to defend the choice or even to verbalize the reasons for the choice of rating scale value for a particular vignette). The subsequent analysis, using standard statistical methods like regression and clustering, revealed in clear detail the criteria that the respondent used to rate the individual elements in the vignette [9,11].

The happy outcome of the above was a way to simulate the compound nature of reality. Much like in daily life, the respondent simply made decisions, almost without thinking. We should not be surprised at this behavior, and how natural it is easy. What is important comes down to the simple reality that here is a more natural way to measure thinking about a topic, and in fact one which is becoming increasingly cheaper, faster, and simpler from the user’s point of view.

A historical note is in order here: The original efforts began in the 1980’s, four decades ago. The process was simple although convoluted and effortful by today’s standards. In an era when the personal computer was starting, the researcher would assemble the material, usually sentences, but sometimes pictures. The user would then create one experimental design, with 2-3 times the number of fixed vignettes as elements. That is, the researcher might have 96 elements. The researcher would then create 192 combinations, which each element appearing 4-5 times across the 192 combinations. These combinations were fixed. The design was ‘tested’ ahead of time to make sure that it was amenable to analysis by OLS (ordinary least squares) regression [12]. The creation of one experiment allowed the researcher to manually check each vignette, each combination of elements, to make sure no vignette contained prohibited combinations, viz, elements which contradicted each other.

Today’s version of BimiLeap has evolved from those early days of forty years ago. Today’s version has evolved from a starting idea about 36 elements requiring 60 combinations or vignettes (4 categories, each with 9 elements), then 36 elements requiring 48 combinations or vignettes (6 categories, each with 6 elements), and finally today’s time- starved design of 16 elements requiring 24 combinations (4 categories, each with four elements).

Incorporating AI into the Process

AI interacts with Mind Genomics at least four levels, all ow which are currently available on the Mind Genomics platform, www. BimiLeap.com.

Step 1: Create a Backgrounder to Develop a Deeper Sense of the Topic

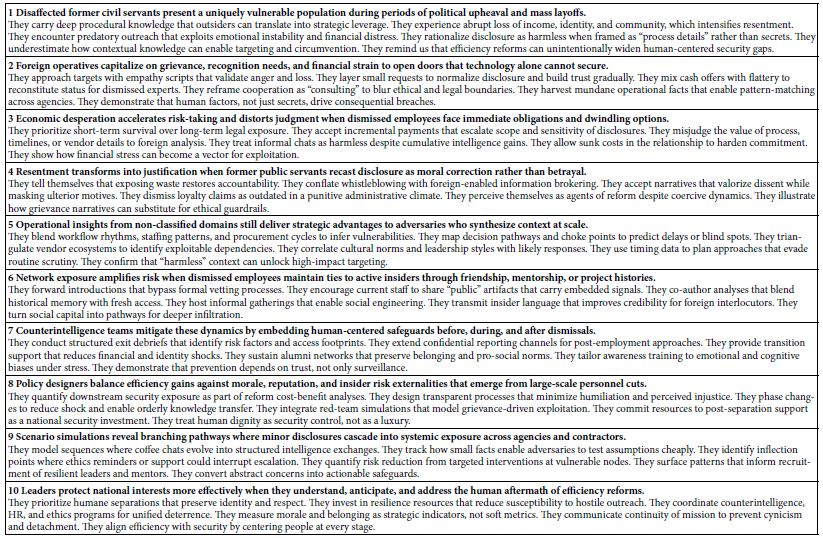
Our first step is to assemble information about the topic, more for general knowledge than for the framing of specific questions. Any of today’s LLM models, e.g., Chat GPT or Co-Pilot can provide a useful backgrounder to the topic. The backgrounder shown in Table 1 was developed by Microsoft’s LLM, Co-Pilot. The request was to provide a 10-paragraph composition on the likely feelings, opportunities and vulnerabilities of those civil servants who were summarily dismissed without cause from their jobs as part of the DOGE effort. As we will see below, this first effort need not be made, but it is advisable to do so just for the purposes of creating an overview of the topic.

Table 1: Using AI to create a general story.

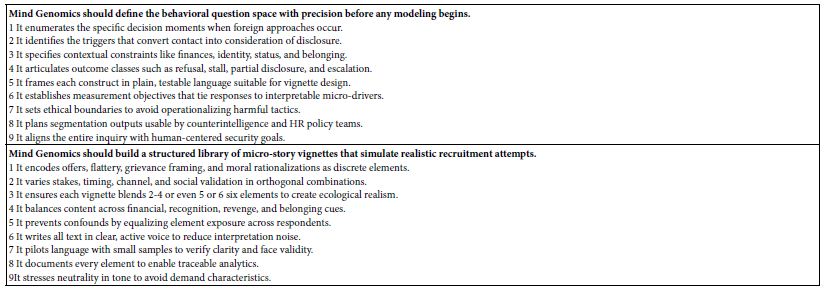
Moving beyond the orientation to the problem is using AI to sharpen one’s ideas about how the Mind Genomics approach should be used. Table 2 shows how Microsoft’s CoPilot provides a way to focus the user on what might be the most effective way to use Mind Genomics. The information in Table 2 is not necessary for the project and indeed was never codified in such a short form until AI was available. Table 2 may provide material already known to experts, but at the same time the user can benefit from a reiteration of basic ideas provided by reinterrogating AI.

Table 2: AI introduction to the process of Mind Genomics.

Step 2: Set Up the Mind Genomics Study

  1. Develop a series of questions which ‘tell a story’,
  2. For each question create four answers, the four answers (or elements) differing as much as possible from each other.
  3. Create up to 16 classification questions which allow the respondent to profile themselves.
  4. Create an introductory statement explaining the topic, and then provide rating scale.

The order of activities listed above has changed in different versions of the Mind Genomics program. `

Figure 1 (left panel) shows the first screen that the user fills. The left panel shows simply the name of the Mind Genomic study (really ‘experiment’) the language, and a disclaimer that no personal information will be taken.

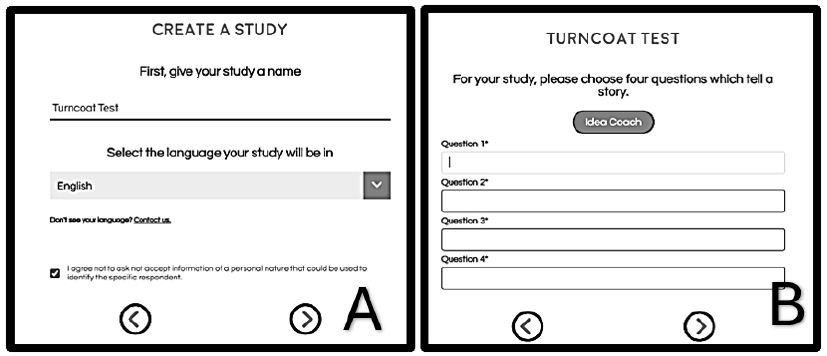
Figure 1: User steps to set up a Mind-Genomics study (Panel A), and to create four questions (Panel B).

Panel B below shows the request for four questions. Up to the advent of LLM models such as Chat GPT, it was at this first step that the process often encountered is first resistance, and indeed many studies were aborted at this early stage. Panel B requests that the respondent generate four questions which tell a story. During the period of evolution, from approximately 1998 onwards, it seemed to be becoming increasingly harder for researchers, or at least those who wanted to use Mind Genomics, to come up with four questions which ‘told a story’ That observation, although subjective, corresponded to many people saying that they wished there were an easier way to develop these questions along. Indeed, by the year 2020 it seemed that Mind Genomics was destined to suffer a death because many prospective users felt simply that coming up with questions was beyond them. This observation tallies with the often- repeated observation by many that the thinking abilities of people seemed to be eroding.

Step 3: Generate the Four Questions Using AI

Figure 2 shows the Idea Coach section introduced in Figure 1. The left panel shows the request made to the AI embedded in the Idea Coach. The right panel shows the output from this initial iteration. Each iteration of the Idea Coach at this stage generates 15 different questions. The iterations may be repeated to generate a new set of 15 questions. Some of the questions will overlap. A strong introduction to the topic may emerge when the user runs many iterations, since later AI will analyze the output from AI, and offer new insights as Table 3 shows.

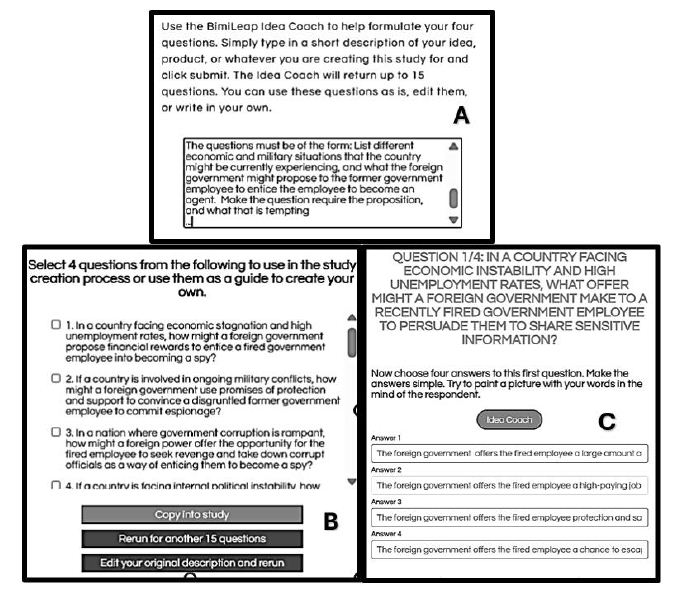
Figure 2: Idea Coach allowing user to write about the study (panel A), an intermediate output of 15 questions with the output comprising the first of possibly many iterations (panel B) and finally an example of four question finally selected from or even across several iterations (panel C).

The actual output from the Mind Genomics set-up is much richer, with the analysis occurring as the study is being completed. An ‘iteration’ in the setup occurs when then the Idea Coach on the left is submitted. Table 3 shows the rich nature of the outcome, including the original input request the questions, as well as AI analysis of the output. The AI is once again Chat GPT.

Table 3: First iteration, viz., first set of questions generated by AI, based upon the information provided in the Idea Coach.


Step 4: Use AI to Guide Thinking about the Questions and Answers to Choose

When AI was first incorporated into Mind Genomics in 2023, the principal use was to make researcher’s job less taxing, viz., by providing questions and then answers to the questions. Table 4 shows four questions generated by the AI in IDEA Coach, and for each question, four of the 15 answers further generated by Idea Coach. Table 4 need not contain questions from the same iteration. The BimiLeap program is set up so that the user can instruct the embedded AI to go through another iteration. Only when the user finally selects the four questions (from repeated iterations) and well as provides four answers to a specific question (from repeated iterations does the program move on.

The actual process to generate the questions and then select the answers was approximately 15 minutes, a speed unimagined even a decade ago. The actual study ended up being created in a matter of about an hour.

Table 4: The four questions and the four answers (elements) generated for the study.

Step 5: Create Self-proflling Questions as the Basis of ‘Personas’ to be Used by AI

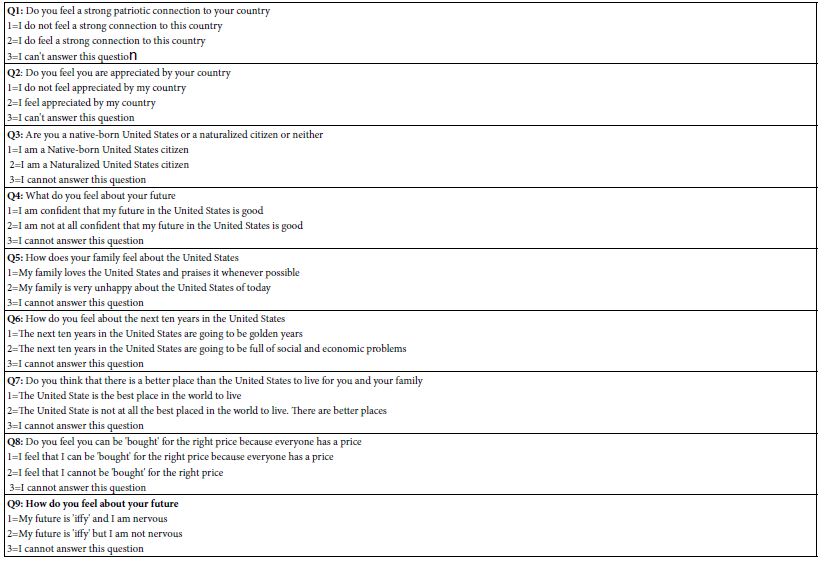
It is by now a truism that people differ from each other. When working with Mind Genomics, whether using people or synthetic AI- created ‘personas’, it is instructive to find out about the respondent. This discovery may be about who the respondent IS, what the respondent DOES, how the respondent FEELS AND THINKS, etc. An efficient way to discover this information is to present the respondent with a closed end questionnaire, such as that shown in Table 5. The respondent, or in this case the AI, simply chooses the most appropriate answer for each question. To arrive at the nine questions shown in Table 5 we instructed AI to provide nine different questions that could describe a person involved in losing their job due to DOGE, and then for each question generate two radically different answers.

When people answer the questions in Table 5 we end with a sense of who they ‘are’. The thinking is different with AI. The AI program can be provided by a persona, created by an underlying program. In BimiLeap the underlying program randomly selects one of the three answers for each question in Table 5. The objective was to estimate the absolute contribution of answer in the subsequent analysis. It is for that reason that a final answer, “I cannot answer this question”, was added. With that type of answer, the AI ignores the topic in the creation of the persona.

Later, in the analysis, we will consider the contribution of the elements, as well as the contributions of the persona, to the rating. This analysis will allow us to understand the relative importance of the message versus of the nature of the ‘respondent, as a driver of the response.

Table 5: The nine questions used by AI to create a synthetic persona. The person emerged from the random (but ultimately balanced) choice of one answer from each question to generate the synthetic person.

Step 6; ‘Orient’ AI in Terms of Four Introductions to the Situation, and the Five Point Rating Scale to Use to Evaluate the Vignettes

To obtain an even deeper understanding of how AI could integrate with Mind Genomics, we explored our different scenarios of introductions, with each introduction run in an experiment all its own. The top of Table 6 shows the four introductions, A-D. Introduction A talks about DOGE effort, combined with an upbeat mood. Introduction B talks about DOGE effort, with a downbeat mood. Introduction C talks about DOGE effort. All three introductions talk about foreign countries approaching laid-off government employees. Introduction provides no background at all but simply proceeds to the introduction about how to use the rating scale. The bottom of Table 6 shows the introduction to the vignettes, and the labelled five-point rating scale.

Table 6: The four introductions, one introduction for each of the four experiments and then introduction to the rating scale, and the five-point labelled rating scale.

Step 7: Prepare for Data Analysis by Regression by Specifying BDV’s (Binary Dependent Variables)

The original Mind Genomics studies were developed with a simple nine-point rating scale. The only labels were at the two extremes. The rationale for this form of scale was the popularity of top-and-bottom anchored scales in the world of applied science and consumer research. Author Moskowitz traces his roots to that field. The choice of a nine-point scale was based upon the belief that the respondents should have as much space on the scale to show the magnitude of their feelings.

Ongoing experience revealed that managers exposed to the research findings were uncomfortable with the scale. Most of the managers had been through business school, so they understood the general idea of the scale. The major problem emerging was that the scale simply could not be interpreted in a simple manner, as simple perhaps as the ‘no/yes’, is my product, my idea, even my vision ‘good’ or ‘bad.’ It became obvious that the precision to be offered by a scale did not give much to the users in terms of what the user of the scale information needed.

Rather than using the scale as a measure of magnitude, the easier approach, and one already in use by other researchers, was to divide the scale into regions, usually two regions. The common use of many researchers during the time that Mind Genomics was developing (2000 – 21010) was to use a simple, anchored 5-point scale [5,10]. Rather than searching for the so-called precision of the 9-point scale, and an ability to reveal differences, the effort recognized that five points were enough. Further practice by researchers was to divide the scale into two parts, and convert the scale to two points, for example so-called ‘Top 2’ (ratings of 5 and 4 converted to 100, ratings of 3,2, and 1 converted to 0),

The nice thing about this conversion is that it tells the researcher what percentage of the researchers can be said to agree with the idea, like the idea, etc. the specifical words to interpret Top 2 come from the anchors of the scale. The benefit for researchers of this change is that it moves the data to a form that can be analyzed by different statistical methods, whether to compute averages, or use as input in regression, or clustering.

Step 8: Run Study Once with Each Introduction, Using ‘Synthetic’ (AI-Created) Respondents

Once the user creates the test elements, the introduction, the rating scale, and if desired the self-profiling classification, the rest is left to the BimiLeap.com program. The user can select human respondents, or instruct the program to simulate respondents, viz., create synthetic respondents. Figure 3 shows the instructions for the user. The third selection allows the user to work with synthetic respondents, these respondents to be constructed by the combination of answers to the nine questions shown in Table 5.

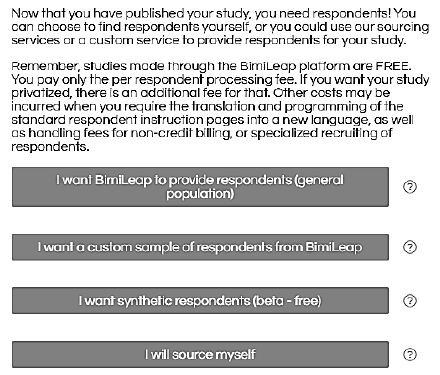
Figure 3: Screen shot showing the choice of respondents given to the user. The third row shows the option to use AI-generated synthetic respondents.

Results

The Distribution of Ratings Across the Set of Four Studies

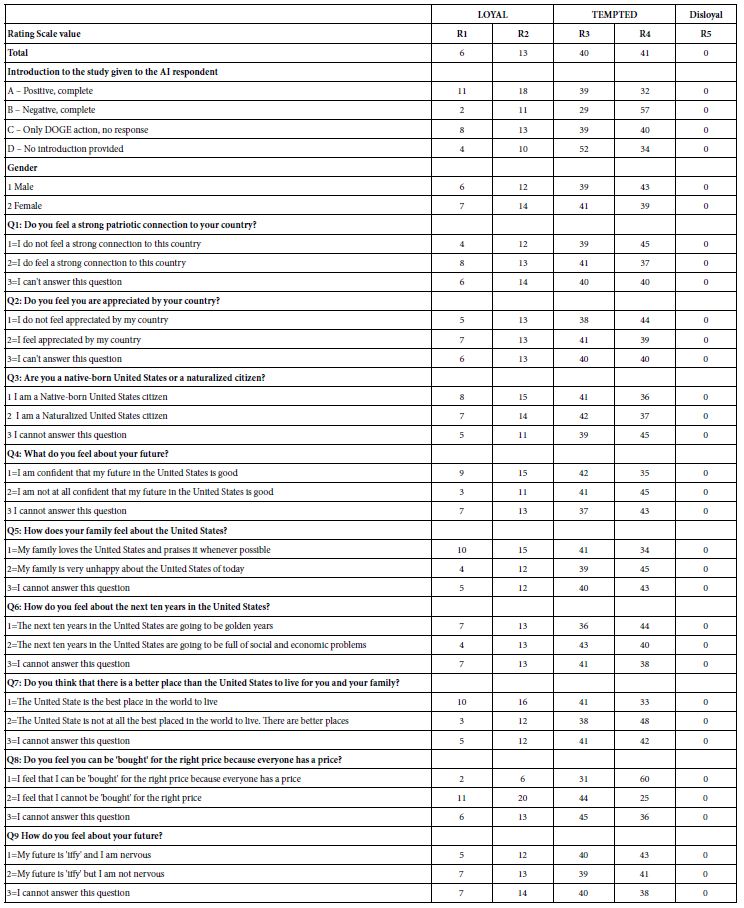
Our first analysis looks at the distribution of the five scale points across the different subgroups of usage. Table 7 shows the distribution of the five scale points for each classification statement. The classification statements were created to be independent of each other.

Across the total of four studies, each with 500 synthetic respondents, there were an altogether of 48,000 ratings (4 studies x 400 respondents/study x 24 vignettes/respondent = 48,000). Table 7 suggests that the AI did understand the meaning of the scales and chose rating 5 a vanishingly small number of times. Keep in mind that we are talking here about 48,000 independent decisions, with the AI presented with a persona, a scale, and then a vignette of 2-4 elements. A more fine-grained analysis would reveal further evidence that the synthetic respondents generated by AI make sense in terms of the linking of ‘who they are’ with what they end up rating.

The labelled 5-point can be divided into sections, one loyal (ratings 1 and 2), one disloyal (rating5), and one tempted (ratings 3 and 4). Table 7 reveals very few ratings of 5, viz., disloyal, but a substantial number of ratings for ‘tempted’ and a lesser but still substantial number of ratings for loyalty. For the remaining analysis we will consider two newly created BDV’s (binary dependent variables). R12 (Loyal) and R34 (Tempted).

Table 7: Distribution of ratings across the four sets of studies.

Relating the Presence/Absence of the 16 Elements to Positive Versus to Negative Responses

The use of an underlying permuted experimental design ensures that each synthetic respondent would test a different but appropriate set of 24 vignettes. The vignette comprises a specified combination of elements, at most one element or answer from each question, but with many vignettes comprising as few as two elements, and some vignettes comprising three elements. A vignette had at most one element or answer from a question. Across the 24 vignettes, each element appeared five times and was absent 19 times. Thus, a single question would contribute exactly one of its four answers to 20 or the 4 vignettes and be absent from the remaining four of the vignettes.

The above-mentioned design was modified so that each respondent would test a different set of 24 combinations. The mathematical structure of these 24 combinations was maintained from respondent to respondent. Only the specific combinations differed. This permutation scheme allowed the user to create individual-level models across respondents. The great benefit was the ability to analyze studies with few as well as with many respondents.

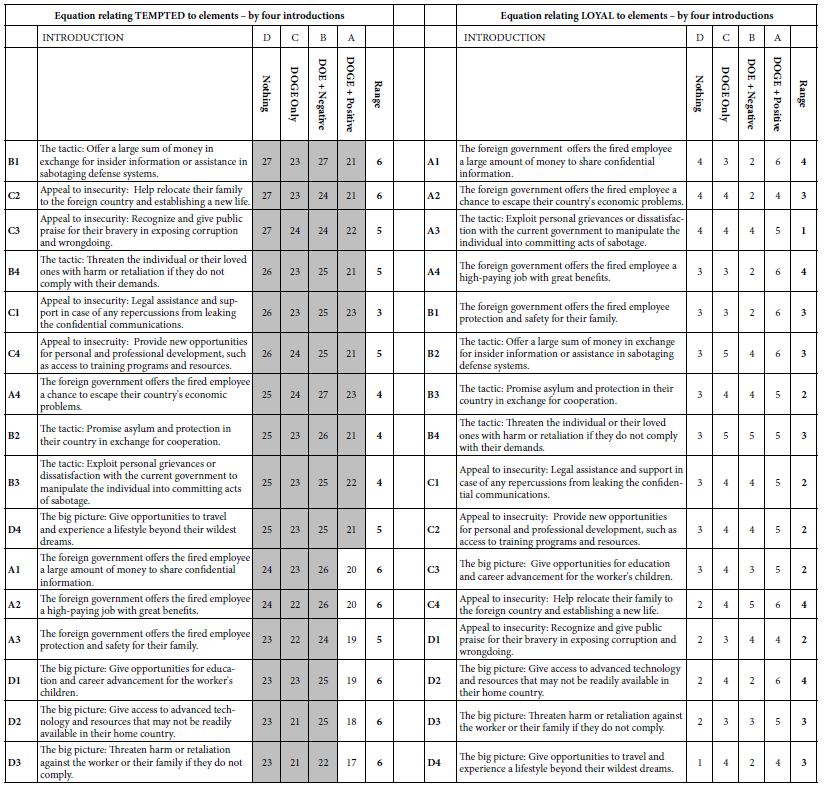
Our first analysis looks at contribution of the 16 elements to the two key BDVs, LOYAL (ratings of 1 or 2), or TEMPTED (rating 3 or 4). We eliminated rating 5 from consideration because it received vanishingly few ratings from the synthetic respondents. It is clear from Table 8A that the coefficients for Temptation are almost all high, with the cut-off of a coefficient of 21 being statistically significant (t statistic >2). Table further shows that the range of coefficients across the four introductions is usually quite small, a value of 6 or lower. Importantly, and quite remarkable, the coefficient for TEMPTED is highest when there is no introduction, and lowest for the introduction with presents DOGE along with the statement that the attitude of the citizen is upbeat, positive, and patriotic. We interpret this pattern to mean that for the same element, the most the country is described as positive and optimistic after DOGE has done its work, the (slightly) less tempting the element may be.

Table 8A: How the introduction and the elements interact to generate coefficients for equations relating the presence/absence of the 16 elements to ‘TEMPTED’ and ‘LOYAL’, respectively.

An ‘Integrative Model’ Incorporating Contributions of Messages, Introductions, and Feelings

Thus far the analysis has been of the 16 elements (A1-D4) as it has been affected by introduction to the synthetic respondent. We also know from Table 7 that there are differences in the patterns of ratings by WHO the respondent is (gender) and how the respondent profiles themselves (e.g., gender).

Our next analysis attempts to create a general, integrative model, using the variables for which there is a true zero, or for which a case can be made that variable has a meaningful zero. The model is straightforward. The independent variables are coded as ‘1’ if present, and ‘0’ if absent from the data. The elements were created by an underlying experimental design which ensured true 0’s. The first set of variables are the elements, specifically presence/absence of the elements in the vignette, with presence coded as 1, and absence coded as 0. The second set of variables are the three introductions (A, B, C) which present the DOGE action (all three introductions) as well as the emotional reactions (positive, negative, introductions A and B). The third set of variables are the nine self-profiling classification questions, each having three answers, two options, and the third option being the ‘zero’ case, presented as ‘I cannot answer this question).

Altogether, we have 16 elements, three introductions, and 18 self-profiling classifications, or 37 predictor variables. We have 2,000 respondents, each of whom provided 24 respondents on a scale which we define as either ‘loyal’ (ratings 1 and 2 transformed to 100; ratings 3,4, transformed to 0) or ‘tempted (ratings 3 and 4 transformed to 100, ratings 1 and 2 transformed t0 0). Rating 5 was entirely ignored in the analysis.

The integrated model provides a rapid way to understand the patterns in the data, and to uncover patterns that might have been missed because of the sheer volume of data (48,000 synthesized ratings). It may also be that the integrated model allows us insights that would otherwise be masked. Table 8B shows the integrated model for the Total Panel.

Table 8B: Integrated model for the total panel. The model relates relating the binary dependent variables of LOYAL and TEMPTED, respectively, to each of the elements, introductions, and self-descriptions of the way one feels. Only coefficients of +5 or higher are shown.

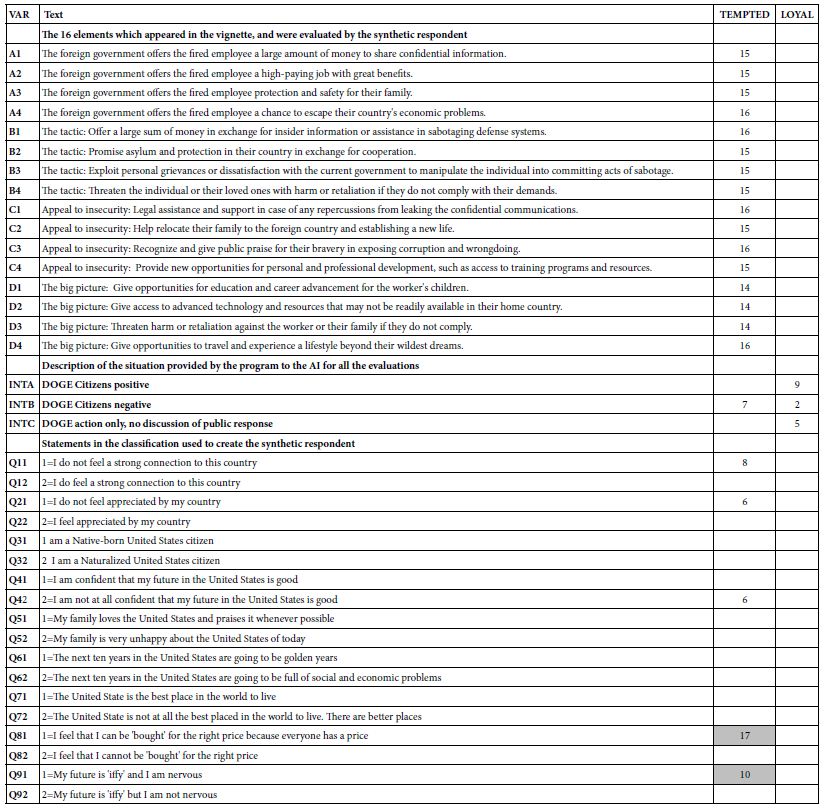
What drives loyal: No elements drive ‘loyal’

A positive reaction to DOGE and DOGE itself without any statement of citizen reaction

One specific answer in the self-profiling: Being native-born (Q31) and feeling the US is the best place to live (Q71)

What drives tempted: Most of the elements drive ‘tempted’, virtually to the same degree.

A negative reaction to DOGE in the introduction

Any of three specific answers in the self-profiling

I don’t know feel a strong connection to this country (Q11)

I do not feel appreciated by my country (Q21)

I am not at all confident that my future in the United States is good (Q42)

1=I feel that I can be ‘bought’ for the right price because everyone has a price.

Two Mind-sets and the Integrated Model Combining Elements, Personas, and Introductions

The final analysis of our data involves mind-set segmentation. A hallmark of Mind Genomics is at the level of granular experience; people differ from each other. These differences, once thought to be simply the intractable interpersonal variation which haunts ever study, turn out to be interpretable and important systematic differences between people in the way people evaluate the world of everyday. The differences end up pointing to the existence of so-called mind-sets, clusters of individuals with different ways of evaluating the stimuli of the everyday. It is not that all inter-individual variation can be traced to these mind-sets, but rather some part of the variation is due to systematic differences.

What these mind-sets are eds up emerging when we look at how people differ in what is important to them. The Mind Genomics process clusters respondents, dividing the full bank of respondents into smaller groups, based strictly on mathematical considerations. Once the respondents are divided into these smaller groups, it is straightforward to repeat the analysis on the different groups. These emergent groups, clusters in the language of statistics, are called mind- sets in the language of Mind Genomics.

Previous studies using the Mind Genomics method suggest that mind-sets abound in areas as diverse as food preferences, responses to legal issues, and the way one listens to one’s doctor and the type of information that drives patient compliance [2,6].

The Mind Genomics process lends itself to easy discovery of mind- sets. The process comprises the development of individual level models relating a specific BDV (binary defined variable) to the presence/ absence of the elements that were systematically varied. In this study we have 2000 respondents, each of whom evaluated the 16 elements combined into the 24 vignettes, with each respondent evaluating elements arranged in an experimental design. It is straightforward to create 2000 equations, one per respondent, to relate the 16 elements to Loyal (set 1) and then Tempted (set 2).

The first order of business is to create the BDV for each respondent. The BDV Loyal takes on the rating 100 when the original rating was 3 or 4. The BDV Tempted takes on the value 100 when the original rating was 1 or 2. Otherwise the BDV takes on the value 0. A vanishingly small number (<10-5) is added to every newly created BDV to ensure that there is some minimal level of variation in the BDV values when they serve as dependent variables in the regression which follows the transformation.

The foregoing modeling by OLS (ordinary least squares) regression generates two parallel sets of 2000 rows of coefficients, each row containing 16 coefficients with no additive constant. We can combine these two sets of data into one block of data of 2000 rows, one row for each respondent. In turn, the left side (columns 1-16) comprise the coefficients for Loyal, and the right side comprises the coefficients for the same respondent, this time for Tempted.

The next step in clustering uses so-called k-means clustering. The clustering program attempts to put the 2000 synthetic respondent into a minimal set of groups called clusters, or mind-sets in the language of Mind Genomics; The k-means algorithm does so by first computing the pairwise distance between every pair of the 2000 respondent. There are almost 4 million pairs of respondents. The distance between each pair is defined as (1-Pearson Correlation). In turn, the Pearson correlation is computed between every pair of respondents, based on the values of the 32 corresponding coefficients, the 16 coefficients for LOYAL and the 16 coefficients for TEMPTED.

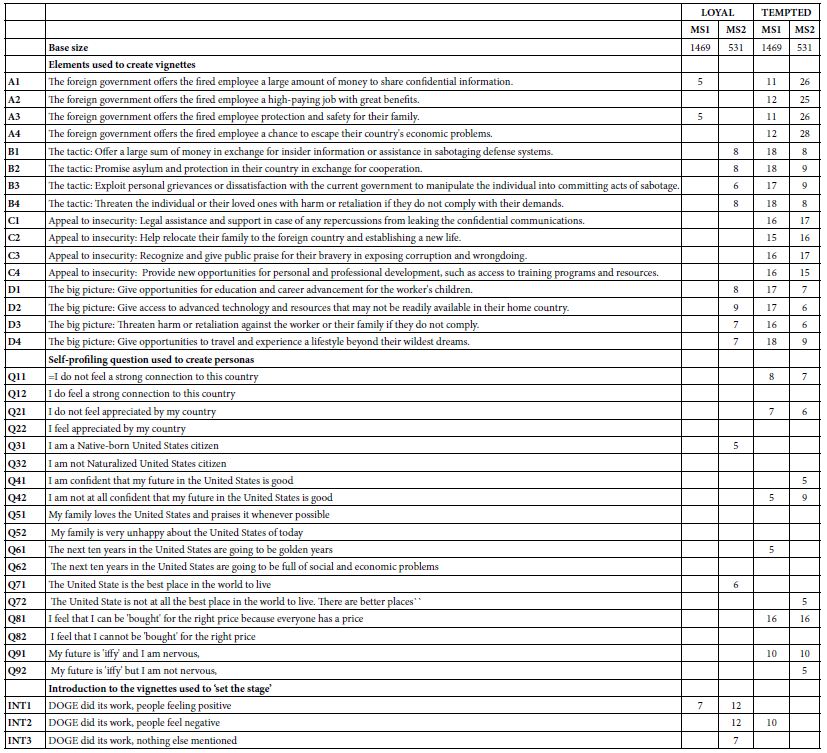
For exploratory purposes we begin with the two mind-sets, shown in Table 9. Mind-Se 1 comprises 1469 of the 2000 respondents, Mind-Set 2 comprise 531 of the 2000 respondents. Table 9 presents a great deal of data. To make the table easier to read we arbitrarily remove all coefficients of +3 or lower, leaving coefficients of 4 or higher. It is clear that the mind-sets differ dramatically on their reactions to LOYAL.

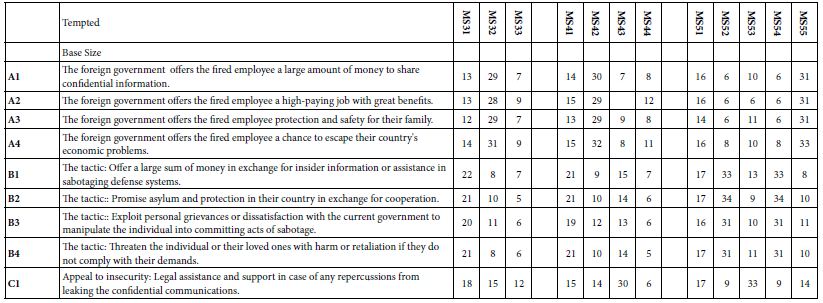
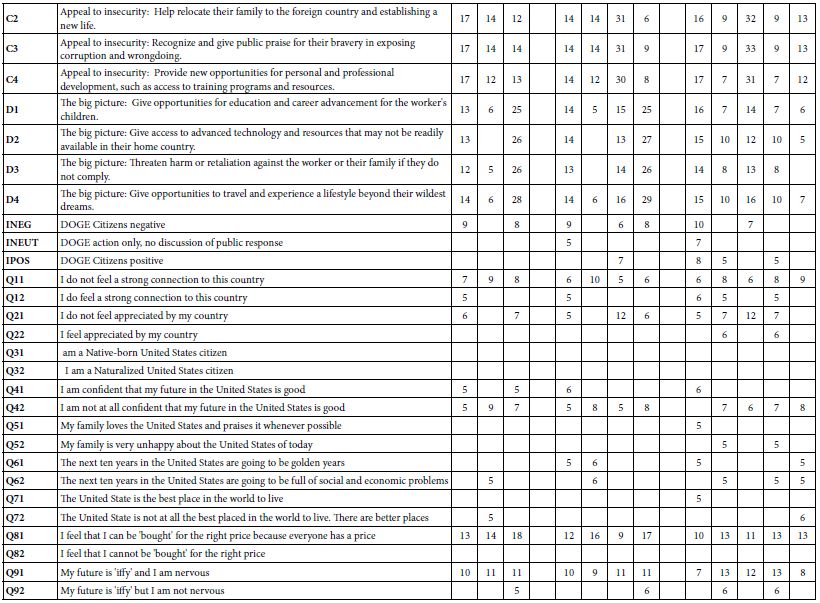
Table 9: The integrated model showing the coefficients from the single model incorporating predictors of the elements, the nine self-profiling questions to establish the persona, and the three introductions which ‘set the stage’. The table shows four integrated models, one for each pair of mind-set and BDV (loyal vs tempted).

Expanded Integrated Models for Three, Four, and Five Mind-sets

The final analysis in this exploration extracted three, four and then five mind-sets. The clustering program was precisely the same as done for the two-mind-set analysis. Table 10 shows the results. Once again, we remove any coefficients lower than 5. Table 10A shows the coefficient for LOYAL. Table 10B shows the coefficient for Tempted. Table 10 shows many more blank but also shows many higher coefficients. Furthermore, the mind-sets seem simpler in terms of the pattern of self-classifying questions, but more complex in terms of how the introduction fit into the model. The reader is invited to dive more deeply into the tables to extract additional insights about the way mind-set segmentation is influenced by personas developed by AI.

Table 10A: Coefficients for the integrated model for LOYAL, for three, four, and five mind-sets created through k-means clustering.

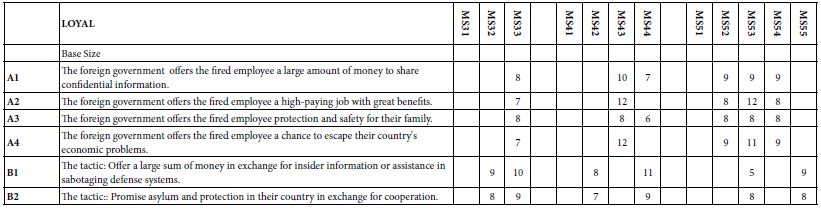
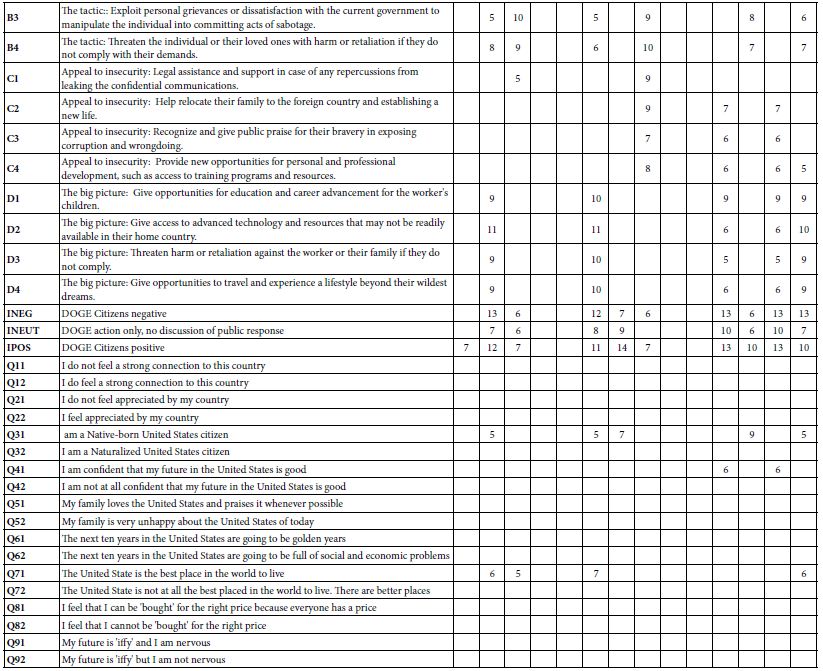
Table 10B: Coefficients for the integrated model for LOYAL, for three, four, and five mind-sets created through k-means clustering.

Discussion and Conclusions

This paper demonstrates, in example form, what might be learned about a totally new topic (effects of DOGE on loyalty vs temptation), doing so in the matter of a few hours, or at most a day or two. The approach merges the now standardized approaches used by Mind Genomics with the power of AI to synthetize personas and have those personas rate test stimuli (vignettes).

There are a variety of considerations, mostly positive, that should be kept in mind when evaluating the possible contribution of the approach presented here. These considerations range from today’s trends to today’s needs, and can be grouped into two major areas, ‘learning speed through simplicity’ and ‘learning from storytelling’.

Speed and Simplicity

1.  Speed is the New Power in Learning

This approach teaches fast. A user can set up questions, answers, and stories in hours, not weeks. A child can test ideas about honesty in school rules and see results the same day. A police officer can test ideas about crime prevention and get insights before the week finishes. A political scientist can test ideas about public opinion and see patterns in one afternoon. Speed keeps attention strong. Speed makes learning exciting. Speed builds confidence.

2.  Speed Builds Confidence

Fast results encourage learners. A student who sees patterns in one day feels proud. A police officer who sees insights in one week feels prepared. A researcher who sees trends in one afternoon feels informed. Speed keeps motivation high. Learners try repeatedly. Each cycle builds skill. Confidence grows with each fast success.

3.  Simplicity is a Path to Increasing One’s Understanding

The system uses short stories called vignettes. Each vignette shows a situation and asks for a choice. This makes the lesson easy to follow. A teenager can read a vignette about loyalty and decide how they would act. A teacher can use vignettes to explain fairness without complex words. A police trainer can use vignettes to show how suspects might be tempted. Simple stories make hard issues clear. Simplicity opens the door to learning.

4.  Simplicity Builds Trust

The system avoids complex math in the front view. Users see clear outputs like “loyal” or “tempted.” A student can understand without equations. A teacher can explain without formulas. A police officer can train without statistics. A researcher can share results without jargon. Simple outputs build trust. Learners believe what they see. Trust makes education strong.

5.   Control Belongs to the Learner, and a Tool to Drive Education

The user decides the questions, the answers, and the scenarios. This control makes the process personal. A student can design questions about friendship. A researcher can design questions about corruption. A police officer can design questions about crime. Each user shapes the study to fit their interest. Control teaches responsibility. Control makes learning active, not passive. Control builds ownership of knowledge.

6.  Control Builds Responsibility

When users design their own experiments, they learn to think carefully. A student who writes a question about honesty must decide what honesty means. A police officer who writes a question about crime must decide what crime means. A researcher who writes a question about loyalty must decide what loyalty means This reflection teaches values. Responsibility grows with control. Learners become thoughtful.

7.  Education Can Inspire Better Action

Learning should not stop at knowledge. It should lead to wise choices. Simulation makes issues vivid, simple, and under user control. A student learns to act fairly. A police officer learns to act carefully. A researcher learns to act responsibly. Each user sees choices clearly. Each user imagines better futures. Education inspires action. Action makes society stronger.

Stories Teach Better than Simple Facts, Engaging Creativity and Thinking

8.  Stories Build Memory

People remember stories better than lists of facts. A vignette about a worker facing temptation sticks in the mind. Later, the learner recalls the lesson about loyalty and risk. A student remembers the story about cheating. A police officer remembers the story about bribery. A researcher remembers the story about betrayal. Stories make lessons last. Memory grows stronger with stories.

9.  Stories Bring Issues to Life

Numbers alone do not move the heart. Stories make issues real. A vignette about a fired worker tempted to share secrets feels alive. Readers imagine the worker’s choice and feel the tension. A child reading about a friend tempted to cheat feels the same pull. A police officer reading about a suspect tempted by money feels the risk. A political scientist reading about citizens tempted by anger feels the danger. Stories make lessons stick in memory.

10.  Creativity Grows from Mixing Ideas

The system combines different answers into new vignettes. This mixing creates surprises. A student may see that anger plus money creates more risk than sadness plus flattery. A police officer may see that fear plus friendship creates more temptation than greed alone. A researcher may see that pride plus recognition creates stronger loyalty than rules alone. These surprises spark imagination. Creativity grows when people see new patterns. Mixing ideas makes learning playful and deep.

11.  Young Learners can Explore Society

Teenagers curious about politics can use the system to test ideas. They can design questions about fairness, loyalty, or justice. They can see how synthetic personas respond. This builds civic awareness. A student may learn that anger leads to rash choices. Another may learn that kindness builds trust. These lessons prepare young people to think about society. Simulation gives them a safe way to explore big issues.

12.  Simulation Teaches Without Danger

Real experiments with betrayal or crime would be unsafe. Simulation avoids risk. AI creates synthetic respondents who act like real people. Learners can explore sensitive topics safely. A student can study cheating without hurting classmates. A police officer can study bribery without risking real cases. A researcher can study espionage without touching secrets. Simulation makes dangerous lessons safe. Safety allows bold exploration.

13.  Law Enforcement can Train with Realism

Police and security teams face real temptations and risks. Simulation lets them practice safely. They can design vignettes about suspects offered money or friendship. They can see how synthetic personas respond. This prepares them for real cases. A police officer may learn that suspects often justify betrayal as harmless. Another may learn that suspects respond strongly to flattery. These lessons improve training. Simulation builds readiness.

14.  Political Scientists can Map Ideas

Researchers study how public opinion shifts. Simulation helps them test scenarios. They can design vignettes about economic crises or foreign threats. They can see how synthetic groups respond. This shows patterns of social change. A researcher may learn that fear increases loyalty. Another may learn that anger increases betrayal. These insights help predict society’s future. Simulation gives political science new tools.

15.  Simulation Builds Bridges

The same tool works for young learners, police, and scholars. This connects groups. A high school project and a government training can use the same platform. A college class and a research lab can share methods. A police academy and a university can compare results. This shared method builds common understanding. Bridges grow between groups. Simulation unites society.

Acknowledgments

The authors would like to acknowledge the extensive use of AI (specifically Microsoft CoPilot) as an assistant helping to frame the ideas. The use of AI provides a way to incorporate an ‘objective’ way to help structure the data. The AI was extensively ‘trained’ on the Mind Genomics and Psychophysics publications of author Moskowitz, publications appearing from 1990 onwards.

The authors would like to thank Vanessa M. Arcenas for her ongoing participation as coordinator and editor of these efforts regarding Mind Genomics and its intersection with Psychophysics and with AI, respectively.

References

  1. Chohan UW (2025) DOGE A Public Value Critique SSRN.
  2. Coussa A, Bellissimo N, Poulia K-A, Karavetian M (2024) Use of mind genomics for public health and wellbeing Lessons from COVID 19 Advances in Biomedical and Health Sciences. [crossref]
  3. Gentry JA (2025) Strategic warning intelligence Revival Comparative Strategy. [crossref]
  4. Gere A, Papajorgji P, Moskowitz H, Milutinovic V (2019) Using a Rule Developing Experimentation Approach to Study Social Problems The Case of Corruption in International Journal of Political Activism and Engagement. [crossref]
  5. Gofman A, Moskowitz HR (2010) Isomorphic Permuted Experimental Designs And Their Application In Conjoint Analysis. Journal of Sensory Studies. [crossref]
  6. Harizi A, Trebicka B, Tartaraj A, Moskowitz H (2020) A mind genomics cartography of shopping behavior for food products during the covid-19 23rd International Conference on Multidisciplinary Studies Resilience for Survival.
  7. Makridis C (2025) Overcoming the Federal Talent Gap Evidence from Special Governmental Employees and Other Pathways SSRN.
  8. Monahan T (2025) Surveillance in Trump’s Surveillance & Society. [crossref]
  9. Moskowitz H, Kover A, Papajorgji P (2022) Applying Mind Genomics to Social IGI Global. [crossref]
  10. Moskowitz H, Wren J, Papajorgji P (2020) Mind Genomics and the LAP LAMBERT Academic Publishing. [crossref]
  11. Papajorgji P, Moskowitz H (2022) The ‘Average Person’ Thinking About Radicalization A Mind Genomics Cartography. Journal of Police and Criminal Psychology. [crossref]
  12. Zdaniuk B (2014) Ordinary Least-Squares OLS Model Encyclopedia of Quality of Life and Well-Being Research. Springer Netherlands.

After 45 Years of Pancreatic Islet Transplantation, Is It Time to Seriously Consider Molecular Alternatives to Cure Type 1 Diabetes?

DOI: 10.31038/EDMJ.20261022

Abstract

Type 1 diabetes (T1D) is caused by the autoimmune destruction of the insulin-producing beta (b)-cells of the pancreas resulting in hyperglycaemia and life-threatening complications. The promise of a β-cell replacement therapy has yet to be fulfilled due to the shortage of donor pancreata and the requirement for lifelong immunosuppression to prevent recurrent autoimmunity and allograft rejection, both of which pose significant clinical risks. Therefore, islet/ pancreas transplantation is unlikely to be a realistic cure for most patients. In this opinion summary, we build on our laboratory’s work and that of other researchers demonstrating the successful genetic engineering of surrogate b-cells from hepatocytes that are capable of synthesising and secreting insulin in response to physiological metabolic cues, akin to pancreatic b-cells. We propose that these advances highlight the feasibility of clinical translation and provide proof-of-principal that a patient’s own hepatocytes could ultimately be reprogrammed in vivo towards a b-cell phenotype. This approach bypasses the challenges of both donor tissue availability and immune-mediated rejection that complicate allogeneic islet and pancreas transplantation.

Introduction and Background

Type 1 diabetes (T1D) is caused by the autoimmune destruction of the insulin-producing pancreatic beta (β)-cells. It is the most common chronic disease of childhood in developed nations and its incidence continues to rise each year. Current treatment constitutes multiple daily insulin injections and blood glucose monitoring. Tight glucose control achieved through intensive insulin therapy can delay, but not eliminate, complications such as nephropathy, retinopathy, cardiovascular disease, and neurological impairment, which collectively contribute to significant morbidity and mortality. Since the 1970s pancreatic (β)-cell replacement has been considered a promising approach for the treatment of T1D, where pancreatic islets, purified from either an allogeneic or xenogeneic donor pancreas are administered to the patient, most commonly through portal vein infusion [1]. However, this procedure is limited by a shortage of donor pancreata and the requirement for lifelong immunosuppression, with its associated adverse side effects, together with a number of other unresolved issues, including limitations in encapsulation technology. Microencapsulation technology isolates islets in a thin layer of biomaterials, such as alginate, which allow the exchange of nutrients, insulin and other substances, improving immuno-rejection. However, studies have encountered several challenges, including pores blockage or obstruction, reduced cell viability and cell death and diminished insulin response to glucose levels [1].

Before the clinical onset of T1D, islet autoantibodies signal the initiation of silent and progressive destructive autoimmune processes, often appearing months or even years before hyperglycaemia develops. This pre-symptomatic phase presents a unique opportunity for early intervention. Indeed, population-based screening programs for T1D have been shown to reduce the incidence of diabetic ketoacidosis at diagnosis by enabling earlier detection [2]. To date the most successful studies aimed at delaying T1D onset has been the administration of anti-CD3 monoclonal antibodies, such as Teplizumab [3]. So far, immunotherapies have not had ultimate successes in altering T1D disease course. Their benefits are typically short term and long term favourable immune responses or regulation has remained difficult to sustain.

Thus, alternative therapeutic strategies are urgently needed. Gene therapy, whereby an “artificial β-cell”, capable of synthesising and secreting insulin in response to the physiological metabolic signals, is generated by genetically engineering the patient’s own cells. This approach would circumvent the issues of tissue rejection inherent to both allogeneic transplantation of islets and pancreas. Our laboratory (and others) has shown that a number of cell types can be used for the genetic engineering of artificial β-cells [4-15], but hepatocytes are particularly useful as they as they derive from the same endodermal precursors as pancreatic cells and possess similar characteristics to pancreatic β-cells, including an ability to process and secrete proteins, and a glucose sensing system (glucose transporter 2 [GLUT2] and glucokinase [Gck] [ 6-8,12,14,15].

Recent Work from Our Laboratory

Our team and others have established that specific combinations of β-cell transcription factors exert a synergistic effect in stimulating β-cell transdifferentiation, storage of insulin in granules, regulated insulin secretion to glucose and other β-cell secretogogues, and, most importantly, permanent reversal of diabetes [5,6,13]. Additionally, and very importantly, this transdifferentiation process does not result in recurrent autoimmune reactions against the surrogate β-cells [14]. Together, these findings highlight that only approaches combining immune regulation with enhanced β-cell survival have the potential to delay, prevent and ultimately cure T1D.

A recent study investigated a novel gene therapy approach that prevented disease development by replacing pancreatic β-cell function with insulin-producing cells generated through hepatic transdifferentiation [14]. In this model, a clinically applicable third- generation lentiviral vector (based on the pRRLSIN.cPPT.PGK-GFP. wpre vector) was used to deliver a cocktail of β-cell transcription factors: pancreatic and duodenal homeobox 1 (Pdx1), neuronal differentiation 1 (ND1), and MAF BZIP Transcription Factor A (MafA) to the portal vein of 5-6-week-old non-obese diabetic (NOD) mice. At the experimental endpoint of 30-weeks, all (100%) of the treated NOD mice remained normoglycemic, exhibited normal intraperitoneal glucose tolerance responses and demonstrated an ability to regulate blood glucose as effectively as the non-diabetic controls. A range of pancreatic markers, including somatostatin, Glut 2 and, most importantly mouse insulin (Ins1 and Ins2), were detected in the liver, and liver function tests remained normal. Collectively, these findings showed that expression of these β-cell transcription factors induced partial pancreatic transdifferentiation and prevented the onset of hyperglycemia and impaired glucose tolerance, as the transduced hepatocytes effectively assumed β-cell function. Immunohistochemistry confirmed that endogenous β-cells had been destroyed by the autoimmune process. As lentiviral vectors permanently transduce cells, this approach therefore holds substantial promise as a potential clinical therapy, particularly if applied in individuals at early stages of Type 1 diabetes.

Author Contributions

Both authors contributed to the writing and review of the manuscript and approved the final version.

Acknowledgements

The authors have nothing to report.

Funding

This study was supported by the National Health and Medical Research Council (NHMRC) of Australia, Ideas grant, number 1187040.

Disclosure Provenance and Peer Review

Nothing to report.

References

  1. Q Wang, Y-xi Huang, L Long, X-h Zhao, Y Sun, X Mao and S-w Li (2024) Pancreatic islet transplantation: current advances and Frontiers in Immunology. [crossref]
  2. F Chiarelli, M Rewers, M Phillip (2022) Screening of autoantibodies for children in the general population: A position statement endorsed by the European society for pediatric endocrinology. Hormone Research Pediatric. [crossref]
  3. KC Herold, BN Bundy, SA Long, JA Bluestone, LA DiMeglio, MJ Dufort and SE Gitelman (2019) An anti-CD3 antibody, teplizumab, in relatives at risk for type 1 New England Journal of Medicine. [crossref]
  4. Q Zhou, J Brown, A Kanarek, J Rajagopal and DA Melton (2008) In vivo reprogramming of adult pancreatic exocrine cells to β-cells. Nature. [crossref]
  5. E Banga, LV Akinci, JR Greder, JR Dutton and JM Slack (2012) In vivo reprogramming of Sox 9+ cells in the liver to insulin-secreting Proceedings of the National Academy of Science. [crossref]
  6. B Ren, BA O’Brien, MA Swan, ME Kiona, NT Nassif, MQ Wei, AM Simpson (2007) Long-term correction of diabetes in rats following lentiviral hepatic insulin gene Diabetologia. [crossref]
  7. B Ren, BA O’Brien, MR Byrne, E Ch’ng, PN Gatt, MA Swan, NT Nassif, MQ Wei, R Gijsbers, Z Debyser, AM Simpson (2013) Long term reversal of diabetes in non obese diabetic mice by liver-directed gene therapy. Journal of Gene Medicine. [crossref]
  8. B Ren, QT La, BA O’Brien, NT Nassif, Y Yan, D Gerace, R Martiniello-Wilks, F Torpy, AP Dane, IE Alexander IE, AM Simpson (2018) Partial pancreatic transdifferentiation of primary human hepatocytes in the livers of an humanized mouse Journal of Gene Medicine. [crossref]
  9. F Galivo, E Benedetti, Y Wang, C Pelz, J Schug, KH Kaestner, M Grompe (2017) Reprogramming human gall bladder cells into insulin-producing β-like cells. PLoS ONE. [crossref]
  10. M Elsner, T Terbish, A Jorns, O Naujok, D Wedekind, HJ Hedrich, S Lensen (2012) Reversal of diabetes through gene therapy of diabetic rats by hepatic insulin expression via lentiviral transduction. Molecular Therapy. [crossref]
  11. X Xiao, P Guo P, C Shiota, T Zhang, GM Coudriet, S Fishbach S et Endogenous reprogramming of alpha cells into beta cells, induced by viral gene therapy, reverses autoimmune diabetes. Stem Cells. [crossref]
  12. HP Huang and MJ Tsai (2000) Transcription factors involved in pancreatic islet J Biomed Sci. [crossref]
  13. L Sommer, Q Ma and D Anderson (1996) Neurogenins, a novel family of atonal- related bHLH transcription factors are putative mammalian neuronal determination genes that reveal progenitor cell heterogeneity in the developing CNS and PNS. Molecular Cell Neuroscience. [crossref]
  14. ALG Mahoney, B Ren, NT Nassif, BA O’Brien, CA Gorrie, GJ Logan, IE Alexander and AM Simpson (2025) Hepatic Expression of a Cocktail of Beta Cell Transcription Factors Stimulates Liver Cell Transdifferentiation to Prevent Hyperglycaemia in NOD Mice. Molecular Therapy.
  15. MT Tabiin, BE Tuch, L Bai, X Han and AM Simpson (2001) Susceptibility of insulin- secreting hepatocytes to the toxicity of pro-inflammatory Journal of Autoimmunity. [crossref]

Algal Blooms, Dinoflagellates and Petroleum Resources

DOI: 10.31038/GEMS.2026813

Abstract

A theory of petroleum formation from algal blooms is revised in the light of recently obtained data on biochemical composition of dinoflagellate lipids, microalgal blooms, “marine snow” and its composition, taxonomy of major phytoplankton groups and their relative abundances. The article is illustrated with electron micrographs of dinoflagellates, a scheme of petroleum formation and a map. It is concluded that seasonal dinoflagellate blooms or those of a longer period may be the principal agent in the petroleum formation.

Keywords

Algal blooms, Dinoflagellata, Marine phytoplankton, Microalgae, Oil, Petroleum formation, Petroleum resources

Introduction

Petroleum (crude oil) has played an important role for humans worldwide. During the 20th century until the present it has been an important factor in geopolitics and conflicts between countries, determining the welfare of individual humans through that of entire nations. During wars that depended on energy sources for military vehicles, it has been considered the blood of war and the blood of the economy. Today oil is the primary source of energy and the most important commodity traded among many countries. More than half of the energy that powers our civilization comes from this non- renewable energy source. Therefore, it is a strategic resource whose scarcity would cause the decline of the global economy [1,2]. Oil is not distributed evenly around the world, so many countries are heavily dependent on nations with oil resources. At present, the world’s largest proven petroleum reserves are in Venezuela, Saudi Arabia, Iran, Canada, Iraq, United Arab Emirates, Kuwait, Russia, United States of America, and Libya.

Among the hypotheses that could explain the origin of petroleum during the geological history of the Earth, there is one based on the suggestion that marine phytoplankton (in particular, algal blooms caused by dinoflagellates) are the principal source of petroleum resources [3]. Herein are some suggestions that we consider relevant:

  1. “Judging from… rough correspondences between distribution of areas of oil fields and supposedly great expanse of the so- called Old Tethys Sea, or became more and more preferable to conclude that petroleum was derived primarily from phytoplankton of this sea.”
  2. “Frequent occurrences of intense red water blooms in coastal shallow water may be responsible for petroleum formation throughout long continued geological periods.”
  3. “Planktonic diatoms are non-motile, but usually possess spiny surface extensions which give them resistance to passage through water. Largely due to this, over-crowding of diatoms is theoretically limited. In contrast, dinoflagellates are motile but frequently do not possess floatation structures.”
  4. “Poisonous effects caused by dinoflagellate also So that it is not phytoplankton only, but also all of higher marine organisms killed by intense red water occurrence that are most highly responsible for the formation of petroleum.”

The present study reviews some aspects of this hypothesis emphasizing the advances in our knowledge of algal blooms and major microalgal taxonomic groups, in particular, of recent marine dinoflagellates.

Material and Methods

To discuss Abe’s suggestions [3] previously presented, some old and modern literature was selected and reviewed. Some dinoflagellate species were selected to illustrate dinoflagellate morphological diversity. The cells were collected in the coastal water of the Peninsula of Yucatán, the southern Gulf of Mexico during the period of 2009-2012. Phytoplankton samples were fixed with a stock formaldehyde solution to a final concentration of 4% and stored in 100-ml plastic bottles. They were examined in a JEOL JSM-7600F scanning electron microscope (SEM) at a working distance of 8 to 15 mm and a voltage of 5.0 kV after a preliminary wash in distilled water, followed by dehydration in a series of ethanol solutions of increasing concentration (30, 50, 70 and 90% and twice in 100%), air drying on 0.5” aluminum mounts and sputter coating with gold-palladium using a Polaron SC7640 High Resolution Sputter Coater (Quorum Technologies, Newhaven, East Sussex, U.K.).

Results and Discussion

Elemental Composition and Generation of Petroleum Based on Organic Matter

Hydrocarbons (petroleum) originate from the thermogenic transformation of organic matter preserved in sedimentary basins. From a geological perspective, the occurrence of oil and gas reservoirs is intrinsically linked to the presence of source rocks within stratigraphic sequences [4]. Although approximately 98% of the Earth surface crust is composed of sediments or sedimentary rocks, the confluence of critical conditions for the formation of petroleum systems, such as generation, migration and entrapment, is a restrictive phenomenon, present in less than 1% of this surface [5]. At the geochemical level, while the quality of crude oil exhibits subtle variations depending on its geographic origin and thermal maturity, its elemental composition is remarkably constant. Petroleum is a complex mixture of organic compounds where the predominant elements are carbon and hydrogen, which represent approximately 95% of the total mass. The remaining percentage (between 1% and 7%) corresponds to heteroatoms, mainly sulfur, oxygen and nitrogen, whose presence and proportion define critical properties, such as viscosity and the degree of corrosivity of the fluid [6]. The generation of oil based on the amount of organic matter in marine and terrestrial systems has been accepted since the 1990s. Deng et al. (2023) [7] described the theoretical basis of oil and gas generation worldwide and confirmed that amount of hydrocarbons is closely correlated to the organic matter load present in sedimentary rocks. Furthermore, the organic matter used for oil production depends primarily on photosynthetic organisms (phytoplankton) in marine systems.

Biochemical Composition of Dinoflagellate Lipids

Due to their composition and origin, lipids produced by phytoplankton have been the subject of study for the last 50 years [8], with triacylglycerols, galactolipids and phospholipids being the main lipid components in these microorganisms [9,10]. These lipids have been of great importance in the field of biotechnology, mainly for the synthesis of a variety of saturated fatty acids, monounsaturated fatty acids, and polyunsaturated fatty acids (e.g., oleic acid (OA; 18:1(n-9), arachidonic acid (AA; 20:4(n-6), eicosapentaenoic acid (EPA; 20:5(n- 3), docosapentaenoic acid (DPA; 22:5(n-3), and docosahexaenoic acid (DHA; 22:6(n-3) that make up 5 to 60% of the cell dry weight [11,12]. In particular, triacylglycerol contributes up to 30%, free fatty acids up to 10%, and sterols approximately 5% of the phytoplankton lipid composition [10]. These lipids have multiple functions, from energy storage to the synthesis of membranes and bioactive substances that ensure their ecological success [13,14]. In particular, dinoflagellates can synthesize a mixture of highly unsaturated long-chain fatty acids (C28) and complex sterols, such as 4-methyl sterols and 4-desmethyl sterols, which serve as characteristic chemotaxonomic indicators [15,16]. These lipids are highly similar to crude oil, mainly due to the high carbon content (>85%) [4]. This is relevant for elucidating the origins of petroleum because of the quality of its organic matter; it is rich in complex lipids and specific biomarkers called dinosteranes (Table 1). These compounds are highly resistant and contribute to the formation of type I and II kerogen, both precursors of crude oil [17].

Table 1: Contribution of some groups of microorganisms to marine organic matter; Phyto – phytoplankton; Zoo – zooplankton.

Taxonomic group

Type Main contribution to organic matter Sedimentation rate (m day-1)

Petroleum potential (kerogen)

Diatoms Phyto Lipids and silica

0.5-100*

Very high: Primary source of lipids (Type II)
Dinoflagellates Phyto Dinidporins (polymers) and sterols

0.5-10

High: Excellent preservation of biopolymers
Coccolithophorids Phyto Calcium carbonate

1-50*

Medium: Provide ballast for massive sinking
Cyanobacteria Phyto Labile organic matter (proteins)

< 0.5

Low: Mostly recycled at the surface
Copepods Zoo Compact fecal pellets

30-160

Indirect: Package and protect lipids
Krill (Euphausiaceae) Zoo Fecal pellets and active transport

150-350

Medium: Inject carbon at great depths
Salps Zoo Large and dense fecal pellets

400-1,200

High: Massive and ultra-fast carbon export
Appendicularians Zoo Marine snow (mucus houses)

50-200

Medium: Trap fine particles in aggregates
Foraminiferans Zoo Calcareous skeletons

100-500

Low-medium: Key to source rock density

Algal Blooms

An algal bloom caused by dinoflagellates is a highly productive event that drastically alters carbon fluxes in the ocean. The biomass of these microorganisms can reach massive concentrations, commonly known as “red tides” [20]. Unlike diatoms, dinoflagellates possess a particular chemical composition that influences the production of organic matter, which is ultimately preserved [21]. During bloom events, the concentration of organic carbon can exceed 500 to 1,000 µg of carbon per liter, which is 10 to 50 times higher than under normal ocean conditions [22]. Furthermore, net primary production rates of 2 to 5 g C m-2 day-1 have been recorded during the peak of the bloom; additionally, many dinoflagellates produce resistant cysts, whose walls are made of dinosporins (polymers similar to sporopollenin), which increases the rate of sedimentation and transport of carbon in the deep zones [17].

Much literature has been published about harmful algal blooms (HAB), caused by both toxic and non-toxic species, and various aspects of the so-called HAB science. Most bloom-forming marine species are dinoflagellates, and many of them have been reported toxic in any part of the world ocean, in marine environments, brackish and freshwater bodies [23]. At present, pelagic and benthic blooms are distinguished. Recently, (epi)benthic species have been paid much attention, and 242 dinoflagellate species from 63 genera have been described: most of them are sand-dwelling followed by epiphytic [24]. As for the duration of HAB events, they may last from several hours to more than a year. For example, the Karenia brevis (C.C. Davis) Gert Hansen & Moestrup (= Gymnodinium breve C.C. Davis) blooms on the West Florida shelf may last more than a year, and 8-12-month blooms are not uncommon there [25]. While in freshwater most toxic species are cyanobacteria (97 species from 10 orders), in the marine environment, especially in the coastal zone, dinoflagellates have the highest species richness (118 species from 8 orders) (Figure 1).

Figure 1: Electron micrographs of recent marine dinoflagellates from the coastal zone of the southern Gulf of Mexico (A, B, E, and H are from the Yucatán Peninsula; C, D, F and G are from the state of Veracruz): A Pyrodinium bahamense L. Plate is highly toxic producer of paralytic shellfish poisoning (PSP) in humans, distributed in tropical waters; B Gonyaulax polygramma F. Stein is a non-toxic species causing harmful algal blooms in subtropical waters; C Ceratocorys horrida F. Stein is distributed mainly in the open sea in the tropical zone, possesses membraned spines characteristic of warm waters; D Blixaea quinquecornis (T.H. Abé) Gottschling in Gottschling et al. is one of the few benthic-planktonic dinoflagellates with a tropical-boreal distribution, inhabiting both marine and estuarine brackish waters, non-toxic, causing intense blooms in the southern Gulf of Mexico; E Scrippsiella spinifera G. Honsell & M. Cabrini is a non-toxic species described from the Mediterranean Sea in 1991, recently found in the southern Gulf of Mexico together with the blooming species Scrippsiella acuminata (Ehrenberg) Kretschmann, Elbrächter, Zinssmeister, S. Soehner, Kirsch, Kusber & Gottschling, capable of producing calcareous resting cysts unlike most dinoflagellates; F Phalacroma rapa F. Stein is a non-toxic species; G Dinophysis caudata Kent is a toxic neritic tropical-boreal species, producing okadaic acid and causing diarrhetic shellfish poisoning (DSP) in humans; H Prorocentrum cordatum (Ostenfeld) J.D. Dodge is a toxic bloom-forming species, causing hepatotoxicity in mice and adverse effects on invertebrates, inhabiting both marine and brackish waters.

Other major microalgal groups are Bacillariophyceae (31 species), Haptophyta (8), Raphidophyceae (4) and Dictyochophyceae (3) [23]. Sixty-seven species and the taxa identified to the generic level are harmful non-toxic, not considering 20 species in the so-called grey list. It is worth considering that about one half of the recent dinoflagellate species are heterotrophs, and the other half are photosynthetic, most of which are mixotrophs. Strictly speaking, heterotrophic species are not phytoplankton if we define it as composed of photosynthetic organisms. Furthermore, ciliates, which also belong to the clade Alveolata as do dinoflagellates, include many photosynthetic species (also known as plastidic ciliates; facultative or obligate autotrophs); e.g., Mesodinium rubrum (Lohmann) (= Myrionecta rubra Lohmann) is an obligate autotroph that contains endosymbiotic cryptophytes [26].

“Marine Snow” and Its Composition

Microalgal cells and, in particular, dinoflagellates cells, can be part of the phenomenon known as “marine snow”, organic aggregates, particle flux, detrital material, pelagic sediment(s) or particulate organic matter [27-37]. “The scientists used the term “marine snow” for the abundant, readily visible, suspended particles in the water.” [37: 6]. “Material exported from the euphotic zone leaves as large, fast-sinking particles, and constitutes a source of food for pelagic and benthic organisms.” [35: 565]. Marine snow consists of detritus (organic debris including fecal pellets), living organisms (phytoplankton, protozoans, zooplankton) and inorganic matter, with associated microbial communities [30]. The history of marine snow research, emphasizing the major discoveries prior to the end of the 20th century, was presented by Silver (2015) [37]. In addition, marine snow-like particles, such as fecal pellets (mainly of the crustacean zooplankton) and amorphous aggregations, are distinguished [34]. It is also worth noting that microaggregates found in the water column [38] are different from large or macroscopic aggregates [31,32], which are synonymous with marine snow. The composition of marine snow has been actively studied during several decades hitherto. Both prokaryotic and eukaryotic microalgae are part of it. In earlier studies, as components of sinking particles, diatoms, dinoflagellates, coccolithophorids and unidentified (micro)flagellates [35,36] have been commonly mentioned. Apart from those, the following taxonomic groups of unicellular eukaryotic organisms have been mentioned more frequently: radiolarians and foraminiferans [34]. It is logical to suggest that, considering the advances in the field of taxonomy of major microalgal groups (discussed below), most become a part of marine snow or microaggregates and participate in vertical carbon flux. Based on the data obtained with the use of sediment trap deployments in all oceans with a sampling duration of more than one year, it was concluded that at some locations the particle flux maxima are the results of bloom periods of individual phytoplankton species [33]; the highest primary production values up to more than 100 g m-2 yr-1 were related to the blooming species of dinoflagellates, diatoms and coccolithophorids [39,40].

The Origin of Petroleum

A historical overview of the origin of petroleum was given by Walters (2006) and Höök et al. (2010) [40,41]. All theories of petroleum origin can be divided into abiotic (= abiogenic or non- biogenic) and biotic (= biogenetic) (Figure 2).

Figure 2: The importance of phytoplankton and zooplankton in the formation of petroleum in marine systems.

Previously, it was concluded that the origin of petroleum is duplex, organic and inorganic, stating that petroleum was laid down in Cambrian and Ordovician strata during the last 500 million years [42] for the distribution of the land masses and water basins on the Earth 500 Mya, see Figure 3).

Figure 3: Distribution of the land masses and oceans on the Earth in the Late Jurassic; modified from Scotese (2001), and Encyclopædia Britannica.

Paleontologists indicate a possible Precambrian origin of dinoflagellates more than 570 years ago [44]. Ehrenberg (1836) [45] was the first to recognize fossil dinoflagellate cysts. At least 2,294 dinoflagellate species have been described [46], and ca. 13-16% of them produce resting cysts also called dinocysts [47]. Resting cyst are the result of sexual reproduction, and they are diploid hypnozygotes (zygotic resting cysts), unlike haploid vegetative cells (except for Noctilucophyceae that have diplontic life-cycle, i.e. with the predominant diplontic stage). However, sexual reproduction has been known only for 1% of recent dinoflagellate species, but it is suggested that it could be a universal phenomenon for this taxonomic group; the zygotic nature of most fossil cysts remains unproven [44].

Recent Advances in the Taxonomy of Major Phytoplankton Groups and Their Relative Abundances

During the last decades a number of new classes of microalgae were described, including previously described taxa of the lower taxonomic level: Dictyochophyceae Silva 1980; Coleochaetophyceae Jeffrey 1982; Pavlovophyceae Cavalier-Smith 1986, emend. Green & Medlin 2000; Pedinophyceae Moestrup 1991, emend. Fawley, Zechman & Buchheim in Adl et al. 2012; Pelagophyceae Andersen & Saunders 1993; Noctilucophyceae Fensome et al. 1993; Klebsormidiophyceae van den Hoek et al. 1995; Trebouxiophyceae Friedl 1995; Zygnematophyceae van den Hoek et al. 1995, emend. Hall et al. 1999; Bolidophyceae Guillou et al. 1999; Pinguiophyceae Kawachi et al. 2003; Chlorokybophyceae Lewis & McCourt 2004; Mesostigmatophyceae Marin & Melkonian 1999, emend. Lewis & McCourt 2004; Mediophyceae Jouse & Proshkina-Lavrenko in Medlin & Kaczmarska 2004; Mamiellophyceae Marin & Melkonian 2010; Palmophyllophyceae Lelaert et al. 2016; Chloropicophyceae Lopes dos Santos & Eikrem 2017, Picocystophyceae Lopes dos Santos & Eikrem 2017; Biddulphiophyceae D.G. Mann in Adl et al. 2019; Leprocylindrophyceae D.G. Mann in Adl et al. 2019; Corethrophyceae D.G. Mann in Adl et al. 2019 [48]. Most major microalgal taxa have been described since 1990s based on transmission electron and light microscopy observations, and some were also based on biochemical data (e.g., Pelagophyceae and Bolidophyceae). Recently, metagenomic data of the relative abundances of different taxonomic groups in marine phytoplankton of all the oceans, based on the Tara Oceans Project in 2009-2013, have been published. Although dinoflagellates and diatoms remain the dominant groups in terms of the cell abundance, there are other groups (the picocyanobacterial genera Prochlorococcus Chisholm, Frankel, Goericke, Olson, Palenik, Waterbury, West- Johnsrud & Zettler ex Komárek et al. and Synechococcus Nägeli, Haptophyta (= Prymnesiophyta), Chlorophyta and Pelagophyta [49,50].

Protecting Marine Ecosystems Where Phytoplankton Live Could Ensure Petroleum Resources in the Future

Phytoplankton are a group of unicellular and colonial photosynthetic organisms capable of inhabiting diverse marine and freshwater bodies [51]. In aquatic ecosystems, phytoplankton comprises a network of biological interactions that have enabled successful conversion of light energy to chemical energy through biogeochemical cycles. Therefore, along with higher plants, phytoplankton provides a solid foundation of ecosystem services in both terrestrial and marine environments [52]. These services include supporting, regulating, provisioning and cultural services. It is estimated that 45% of global net primary production or more (≈108 pg C yr-¹) comes from phytoplankton [53,54]. In particular, groups such as diatoms and dinoflagellates are the primary source of the organic matter that makes up kerogen types I and II. These microorganisms synthesize lipid compounds that, when attached to sediments, possess the necessary energy density to transform into liquid petroleum [17]. Therefore, the protection of marine systems should be treated globally as a matter of energy security. This will ensure phytoplankton biodiversity, which, in turn, guarantees that the chemical quality of the organic matter reaching the seabed is optimal for hydrocarbon generation [55].

Acknowledgments

We thank Marcia M. Gowing (Seattle, WA, USA) for improving the English style and for valuable advice, and Dora A. Huerta- Quintanilla (CINVESTAV-IPN, Mérida, Yucatán) for her help with the scanning electron microscope. Financial support to the FOMIX CONACYT-Yucatán project “Análisis de las causas, dispersión y consecuencias ambientales de la marea roja en Yucatán” (No. 108897; 2009–2012) given to Jorge A. Herrera-Silveira (CINVESTAV-IPN), and the FOMIX CONACYT-Yucatán (No. 108160) and CONACYT LAB-2009-01 (No. 123913) projects of the Laboratorio Nacional de Nano y Biomateriales (CINVESTAV-IPN) given to Patricia Quintana- Owen is much appreciated.

References

  1. Palazuelos E (2009) El petróleo y el gas en la geoestrategia Editions Akal.
  2. Krishna S, Gambelli AM, Sreenivasan H, Vadim F, et al. (2026) The petroleum industry and climate change. In Al-Enazi A, Al-Musleh E (Eds) Decarbonizing the petroleum Elsevier.
  3. Abé TH (1965) Red water and dinoflagellates as primary sources of In Second International Conference on Protozoology, London, August 1965. Reprinted from Excerpta Medica International Congress Series No. 91.
  4. Liu H, Jiang Y (2025) Petroleum Springer. Singapore.
  5. Biju-Duval B (2002) Sedimentary geology: sedimentary basins, depositional environments, petroleum formation. Editions Technip.
  6. Kundu N (2023) Geoscience for petroleum engineers. Springer, Singapore.
  7. Deng Y, Yang Y, Yang T (2023) Three systems of the oil and gas formation in the Acta Petrolei Sinica 44.
  8. Barkia I, Saari N, Manning SR (2019) Microalgae for high-value products towards human health and Marine Drugs 17.
  9. Falk-Petersen S, Sargeant JR, Henderson J, Hegseth EN, et (1998) Lipids and fatty acids in ice algae and phytoplankton from the Marginal Ice Zone in the Barents Sea. Polar Biology 20: 41-47.
  10. Jónasdóttir SH (2019) Fatty acid profiles and production in marine Marine Drugs 17.
  11. D’Alessandro EB, Antoniosi Filho NR (2016) Concepts and studies on lipid and pigments of microalgae: A Renewable and Sustainable Energy Reviews 58: 832-841.
  12. Morales M, Aflalo C, Bernard O (2021) Microalgal lipids: A review of lipids potential and quantification for 95 phytoplankton species. Biomass and Bioenergy 150.
  13. Ianora A, Bentley MG, Caldwell GS, Casotti R, Allan DC, et al. (2011) The relevance of marine chemical ecology to plankton and ecosystem function: an emerging field. Marine Drugs 9: 1625-1648. [crossref]
  14. Goncalves EC, Johnson JV, Rathinasabapathi B (2013) Conversion of membrane lipid acyl groups to triacylglycerol and formation of lipid bodies upon nitrogen starvation in biofuel green algae Chlorella Planta 238: 895-906. [crossref]
  15. Cárdenas P, Acuña V, Contreras S, Salgado P, et (2025) The sterol composition of harmful dinoflagellates distinguishes environmental characteristics of Chilean Patagonia. Marine Environmental Research 214. [crossref]
  16. Rathinavel L, Ravikumar Y, Jothinathan D, Pandey, A, et (2025). Extraction and enrichment of fatty acids from marine microalgae. In Marine molecules from algae and cyanobacteria. Elsevier. [crossref]
  17. Tissot BP, Welte DH (1984) Petroleum formation and Springer, Berlin, Germany.
  18. Bach LT, Bauke C, Meier KJS, Riebesell U, et (2012) Influence of changing carbonate chemistry on morphology and weight of coccoliths formed by Emiliania huxleyi. Biogeosciences 9: 3449-3463.
  19. Turner JT (2015) Zooplankton fecal pellets, marine snow, phytodetritus and the ocean’s biological Progress in Oceanography 130: 205-248.
  20. Hallegraeff GM (2003) Harmful algal blooms: A global In Hallegraeff GM, Anderson DM, Cembella AD (Eds) Manual on harmful marine microalgae (2nd ed). UNESCO, Paris, France.
  21. Inomura K, Deutsch C, Jahn O, Dutkiewicz S, et al. (2022) Global patterns in marine organic matter stoichiometry driven by phytoplankton ecophysiology. Nature Geoscience 15: 1034-1040. [crossref]
  22. Smayda TJ (1997) Harmful algal blooms: their ecophysiology and general relevance to phytoplankton blooms in the Limnology and Oceanography 42: 1137-1153.
  23. Lundholm N, Bernard C, Churro C, Escalera L, et al. (Eds) (2026) IOC-UNESCO taxonomic reference list of harmful microalgae.
  24. Hoppenrath M, Chomérat N, Horiguchi T, Murray SA, Rhodes L (2023) Marine benthic dinoflagellates – their relevance for science and society (2nd ed). Senckenberg Gesellschaft für Naturforschung, Germany.
  25. Kusek KM, Vargo GA, Steidinger KA (1999) Gymnodinium breve – A scientific and journalistic analysis. Contributions in Marine Science 34: 1-229.
  26. Barber RT, White AW, Siegelman HW (1969) Evidence for a cryptomonad symbiont in the ciliate, Cyclotrichium meunieri. Journal of Phycology 5: 86-88. [crossref]
  27. Riley GA (1963) Organic aggregates in seawater and the dynamics of their formation and Limnology and Oceanography 8: 372-381.
  28. Riley GA (1970) Particulate matter in seawater. Advances in Marine Biology 8: 1-118.
  29. Silver MW, Shanks A, Trent JD (1978) Marine snow: microplankton habitat and source of small-scale patchiness in pelagic populations. Science 201: 371-373. [Crossref]
  30. Trent JD, Shanks AL, Silver MW (1978) In situ and laboratory measurements on macroscopic aggregates in Monterey Bay, Limnology and Oceanography 23: 626-635.
  31. Shanks AL, Trent JD (1979) Marine snow: Microscale nutrient patches. Limnology and Oceanography 24: 850-854.
  32. Alldredge AL, Silver MW (1988) Characteristics, dynamics and significance of marine Progress in Oceanography 20: 41-82.
  33. Wefer, G (1989) Particulate flux in the ocean: Effects of episodic In Berger WH, Smetacek VS, Wefer G (Eds) Productivity of the ocean. John Wiley & Sons Limited, S. Bernhardt, Dahlem Konferenzen, Pg: 139-153.
  34. Silver MW, Gowing MM (1991) The “particle” flux: origins and biological Progress in Oceanography 26: 75-113.
  35. Lee C, Wakeham S, Arnosti C (2004) Particulate organic matter in the sea: The composition AMBIO 33: 565-575.
  36. Ploug H, Iversen MH, Fischer G (2008) Ballast, sinking velocity, and apparent diffusivity within marine snow and zooplankton fecal pellets: Implications for substrate turnover by attached bacteria. Limnology and Oceanography 53: 1878-1886.
  37. Silver M (2015) Marine snow: A brief historical ASLO.
  38. Goldman JC (1984) Conceptual role for microaggregates in pelagic waters. Bulletin of Marine Science 35: 462-476.
  39. Honjo S (1982). Seasonality and interaction of biogenic and lithogenic particulate flux at the Panama Science. 218: 883-884. [crossref]
  40. Walters CC (2006) The origin of petroleum. In: Hsu CS, Robinson PR (Eds) Practical advances in petroleum Springer, New York, NY, USA. Pg: 79-101.
  41. Höök M, Bardi U, Feng L, Pang X (2010) Development of oil formation theories and their importance for peak Marine and Petroleum Geology 27: 1995-2004.
  42. Robinson R (1960) The origins of Nature 5068: 1291-1295.
  43. Scotese CR (2001) Atlas of Earth PAKEOMAP Project.
  44. Fensome RA, Taylor FJR, Norris G, Sarjeant WAS, et al. (1993) A classification of living and fossil Sheridan Press, Hanover, PA, USA.
  45. Ehrenberg CG (1836) Zusätze zur Erkenntnis grosser organischer Ausbildung in den kleinsten thierschen Organismen. Preussische Akademie der Wissenschaften, Abhandlungen 1835: 151-180.
  46. Gómez F (2012) A checklist and classification of living dinoflagellates (Dinoflagellata, Alveolata). CICIMAR Oceánides 27: 65-140.
  47. Head MJ (1996) Modern dinoflagellate cysts and their biological In Jansonius J, McGregor DC (Eds). Palynology: principles and applications. The American Association of Stratigraphic Palynolologists Foundation. Pg: 1197-1248.
  48. Adl SM, Bass D, Lane CE, Lukeš J, et (2019) Revisions to the classification, nomenclature, and diversity of eukaryortes. Journal of Eukaryotic Microbiology 66: 4-119. [crossref]
  49. Pierella Karlusich JJ, Ibarbalz FM, Bowler C (2020) Phytoplankton of the Tara Annual Review of Marine Science 12: 233-265. [crossref]
  50. Pierella Karlusich JJ, Pelletier E, Zinger L, Lombard F, et (2023). A robust approach to estimate relative phytoplankton cell abundances from metagenomes. Molecular Ecology Resources 23: 16-40. [crossref]
  51. Reynolds CS (2006) The ecology of Cambridge University Press.
  52. Naselli-Flores L, Padisák J (2023) Ecosystem services provided by marine and freshwater Hydrobiologia 850: 2691-2706. [crossref]
  53. Field CB, Behrenfeld MJ, Randerson JT, Falkowski P (1998) Primary production of the biosphere: Integrating terrestrial and oceanic components. Science 281: 237-240. [crossref]
  54. Wanek E, Esteban-Cantillo OJ, Bourgeois-Gironde S (2025) Valuing marine plankton: a review of ecosystem services and disservices and an expert assessment of the potential of area-based Frontiers in Marine Science 12.
  55. Peters KE, Walters CC, Moldowan JM (2005) The biomarker guide: Biomarkers and isotopes in petroleum systems and Earth Cambridge University Press.

Pathologic Complete Response as a Prognostic and Surrogate Endpoint in Neoadjuvant Therapy for Solid Tumors: A Comprehensive Review Beyond Breast Cancer

DOI: 10.31038/CST.20261111

Abstract

Background: Neoadjuvant therapy is increasingly used across solid tumors to improve surgical outcome, assess systemic treatment sensitivity, and reduce early metastatic risk. Pathologic complete response (pCR), defined as the absence of residual invasive cancer following neoadjuvant treatment, has been accepted by the U.S. Food and Drug Administration (FDA) as a surrogate endpoint to support accelerated approval in high-risk early-stage breast cancer. However, the strength and generalizability of the association between pCR and long-term clinical outcomes, such as event-free survival (EFS) and overall survival (OS), vary substantially across tumor types and disease subgroups.

Methods: We evaluated recent meta-analyses, randomized trials, and large retrospective studies examining the association between pCR and survival outcomes, including EFS, OS, and recurrence-free survival (RFS), across multiple tumor types (ie. breast cancer, non-small cell lung cancer, melanoma, gastrointestinal malignancies, head and neck cancer, ovarian cancer, bladder cancer, and Merkel cell carcinoma).

Results: In breast cancer, pCR strongly predicts improved EFS and OS, particularly in triple-negative and HER2-positive subtypes, while its predictive value is less pronounced in HR+/HER2- disease. Emerging evidence supports pCR as a prognostic marker in melanoma, NSCLC, gastrointestinal, ovarian, head and neck squamous cell carcinoma, and muscle-invasive bladder cancers, though trial-level correlations vary and data remain limited in several settings. Associations are generally stronger in patient-level analyses than trial-level surrogacy assessments.

Conclusions: These findings highlight both the clinical value and the limitations of pCR as an endpoint. Continued tumor-specific evaluation of pCR using rigorous patient- and trial-level statistical frameworks is warranted to inform regulatory decision-making and optimize neoadjuvant drug development beyond breast cancer.

Keywords

Pathologic complete response, Breast cancer, Head and neck cancer, Melanoma, NSCLC, Esophageal cancer, Gastrointestinal cancer, Ovarian, Bladder cancer, Merkel cell carcinoma

Introduction

Neoadjuvant therapies havebecome a cornerstone in themanagement of multiple solid tumors, with potential to downstage disease, improve surgical resectability, provide early assessment of treatment sensitivity, and eradicate micrometastatic progression before surgery. With the expansion of neoadjuvant approaches to include targeted therapies and immunotherapies, the identification of robust intermediate endpoints that predict long-term clinical benefit has gained critical importance.

pCR, defined as the absence of residual invasive cancer cells in the resected primary tumor and sampled regional lymph nodes following neoadjuvant treatment (typically ypT0/is ypN0), has been recognized by the FDA as a surrogate endpoint to support accelerated approval specifically in high-risk early-stage breast cancer. Its use in other tumors is exploratory and not validated broadly for regular approval. This position is articulated in the current FDA guidance, Pathological Complete Response in Neoadjuvant Treatment of High-Risk Early- Stage Breast Cancer: Use as an Endpoint to Support Accelerated Approval [1]. The 2020 revision reflects FDA’s updated thinking and provides recommendations for trial design, statistical considerations, and acceptable pCR definitions in the neoadjuvant breast cancer setting. This regulatory precedent has motivated growing interest in evaluating pCR as a potential surrogate endpoint in additional tumor types, although its predictive value varies considerably across diseases.

Clinical practice guidelines also reflect the evolving role of treatment response in neoadjuvant care. Recent versions of the National Comprehensive Cancer Network (NCCN) Clinical Practice Guidelines in Oncology incorporate neoadjuvant systemic therapy pathways and acknowledge that the degree of treatment response—including clinical and pathological response—can inform postoperative management in specific settings. In breast cancer (NCCN Breast Cancer Version 5.2025), neoadjuvant therapy is strongly recommended for HER2- positive and triple-negative subtypes, with the extent of response (including pCR) refining adjuvant treatment decisions, consistent with evidence linking pCR to improved long-term outcomes. In rectal cancer (NCCN Rectal Cancer Version 4.2025), guidelines endorse consideration of nonoperative “watch-and-wait” management for carefully selected patients demonstrating a clinical complete response after neoadjuvant chemoradiation, underscoring the prognostic importance of response assessment even when not strictly defined pathologically [2,3]. For esophageal and gastroesophageal junction cancers (NCCN Esophageal/EGJ Cancers Version 1.2026), pathologic evaluation after neoadjuvant chemoradiotherapy is recommended as part of postoperative planning. NCCN Bladder Cancer (v3.2025) recognizes pCR post-neoadjuvant chemotherapy as prognostic but not a formal decision criterion. NCCN Cutaneous Melanoma (v2.2025) notes pCR/MPR as prognostic, informing de-escalation in responders but not standardized. NCCN NSCLC (v3.2026) emphasizes neoadjuvant chemo-immunotherapy with pCR/MPR as prognostic (e.g., CheckMate-816: pCR patients 95.3% (95% CI 82.7–98.8) 5-year OS) but not mandatory for decisions.

This review synthesizes the available evidence assessing the association between pCR and long-term survival outcomes across multiple solid tumors. We examine both patient-level prognostic associations, where pCR consistently correlates with favorable outcomes, and trial-level surrogacy analyses, where correlations between treatment effects on pCR and survival endpoints are more variable. By integrating data across tumor types, our objective is to provide a balanced and rigorous framework for evaluating the strengths, limitations, and future potential of pCR as an endpoint to guide neoadjuvant drug development, clinical trial design, and regulatory strategies beyond breast cancer.

Material and Methods

A comprehensive systematic literature review was conducted using databases including PubMed, EMBASE, and the Cochrane Library from database inception through December 2025. The literature consists of meta-analyses, randomized clinical trials, and clinical studies evaluating associations between pCR and survival outcomes. Both patient-level and trial-level associations were included if reported.

Results

Breast Cancer

In breast cancer, achieving pCR is strongly associated with improved long-term outcomes, including EFS, disease-free survival (DFS), and OS. A large pooled meta-analysis of 52 studies involving 27,895 patients treated with neoadjuvant therapy demonstrated a robust association between pCR and improved EFS across major subtypes—triple-negative breast cancer (TNBC), HER2-positive disease, and hormone receptor-positive/HER2-negative (HR+/ HER2-) disease. Across the entire population, 5-year EFS was 88% in patients achieving pCR compared with 67% in those without pCR, underscoring the prognostic significance of pCR irrespective of subtype (Table 1) [4]. While pCR is a strong patient-level prognostic marker, trial-level surrogacy is weak in some analyses; for example, a meta-regression across 29 randomized trials showed only modest correlation between treatment effects on pCR and DFS (R² = 0.08) or OS (R² = 0.09), highlighting variability by subtype and regimen [5].

Table 1: Breast Cancer

Study

Number of Patients Number of Trials

Summary of Findings

von Minckwitz et al., 2012 [8]

6,377

7

  • ypT0 ypN0 is associated with better DFS compared to ypTis ypN0 (HR = 0.57) and better OS (HR = 0.71)
  • ypT0 ypN0 is associated with better DFS (HR = 0.31) and OS (HR = 0..25) than ypT0/is ypN+
  • Prognostic impact strongest in HER2+ and TNBC; absent in luminal A
Berruti et al., 2014 [5]

14,641

29

  • Weak trial-level association between pCR and DFS (R² = 0.08) or OS (R² = 0.09)
Broglio et al., 2016 [9]

5,768

36

  • HER2+ Breast Cancer: EFS for pCR vs non-pCR was significant (HR = 0.37). Hormone receptor-negative (HR = 0.29); hormone receptor-positive (HR = 0.52).
Cortazar et al., 2014 [7]

11,955

12

  • For pCR vs non-PCR:•
    Overall population: EFS: HR 0.48; OS: HR 0.36•  HR-pos HER2-neg: EFS: HR 0.49; OS: HR 0.43
    HER2-pos: EFS: HR 0.39; OS: HR 0.34
    HR-neg: EFS HR 0.25, OS HR 0.19.
    TNBC: EFS HR 0.24; R² = 0.03 and 0.24 for EFS and OS.
Spring et al., 2020 [4]

27,895

52

  • 5-yr EFS: 88% (pCR) vs 67% (no pCR)
  • Patients with a pCR after NAT had significantly better EFS (HR = 0.31), particularly for TNBC (HR = 0.18) and HER2- pos (HR = 0.32) disease.
  • pCR after NAT was also associated with improved survival (HR = 0.22).
Huang et al., 2020 [10]

4,330

25

  • TNBC: pCR was associated with improved EFS (HR = 0.24) and OS (HR = 0.19).
  • The 5-year EFS was 86% vs 50% for pCR vs no pCR.
  • The 5-year OS was 92% vs 58% for pCR vs no pCR.
Davey et al., 2022 [6]

25,150

78

  • HER2-pos: pCR predicted better EFS (HR 0.67; 41 studies), RFS (HR 0.69; 18 studies) and OS (HR 0.63; 29 studies).

Subtype-specific analyses further reinforce this relationship. In HER2-positive early breast cancer, a systematic review and meta- analysis of 78 studies (25,150 patients) showed that pCR was associated with significant improvements in survival outcomes, with hazard ratios of 0.67 (95% CI 0.60–0.74) for EFS and 0.63 (95% CI 0.56–0.70) for OS. These benefits were consistent across various HER2-targeted regimens, though the magnitude was greatest in hormone receptor- negative HER2-positive disease [6].

A landmark systematic review and pooled analysis of approximately 12,000 patients from 12 international trials (CTNeoBC) demonstrated that pCR rates vary substantially by subtype: highest in HER2-positive (particularly HR-/HER2+) and TNBC, and lowest in HR+/HER2- disease [7]. Although the association between pCR and long-term outcomes was weaker in HR+/HER2- tumors overall, achievement of pCR in this subgroup still correlated with significantly better EFS and OS, particularly among high-grade tumors. In HER2-positive disease, pCR strongly predicted improved EFS and OS regardless of hormone receptor status, with a more pronounced prognostic effect in HR-/ HER2+ tumors than in HR+/HER2+ tumors. Across all subtypes, the collective evidence positions pCR as a strong prognostic marker, with the greatest clinical relevance in TNBC and HER2-positive disease, where both absolute pCR rates and survival correlations are highest.

Non-Small Cell Lung Cancer (NSCLC)

In resectable NSCLC, pCR is a strong patient-level prognostic marker. A meta-analysis of 7,011 patients treated with neoadjuvant chemotherapy (± radiotherapy) showed that pCR was associated with significantly improved outcomes (EFS HR 0.46; OS HR 0.50) [11]. With the introduction of neoadjuvant chemo-immunotherapy, a meta- analysis of eight randomized trials (3,387 patients) demonstrated higher pCR rates (RR 5.58) and improved 2-year EFS (HR 0.57) compared with chemotherapy alone (Table 2) [12].

Table 2: Non-small cell lung cancer.

Study

Number of Patients Number of Trials

Summary of Findings

Rosner et al., 2022 [11]

7,011

28

  • pCR vs non-pCR: OS HR 0.50; EFS HR 0.46
Banna et al., 2024 [12]

3,387

8

  • Neoadjuvant chemo-immunotherapy compared to chemo: improved 2-year EFS (HR 0.57) and increased pCR rate (RR 5.58).
  • No reports were provided about the comparison of EFS for pCR vs non-pCR patients.
Hines et al. 2024 [13]

2,385

7

  • At the patient level, the R² of pCR with 2-year EFS was 0.82. The odds ratio of 2-year EFS rates by response status was 0.12 (0.07–0.19).
  • At the trial level, the R² for the association of odds ratio of response and HR of EFS was 0.58.
Waser et al., 2024 [14]

6,530

20

  • pCR vs no pCR: HR = 0.49 for OS
  • MPR vs no MPR: HR = 0.36 for OS
  • pCR vs no pCR: HR = 0.49 for EFS (11 studies, n=2,156)
  • Trial-level analyses did not show a strong correlation between pCR and OS (R² = 0.045) or EFS (R² = 0.319).
CheckMate 816 5-yrupdate [15]

358

1

  • pCR vs non-pCR: 5-yr OS 95.3% (95% CI 82.7-98.8) vs 55.7% (95% CI 46.9-63.7) (exploratory)
  • Pre-surgery ctDNA clearance vs others: 5-yr OS 75.0% vs 52.6%

A recent surrogacy analysis of seven immune checkpoint inhibitor trials (2,385 patients) found a strong patient-level correlation between pCR and 2-year EFS (=0.82), although trial-level surrogacy was only moderate and imprecise (=0.82) [13]. A larger pooled analysis reported weaker trial-level correlations (R²=0.045 for OS; 0.319 for EFS) [14].

Long-term observational data also support pCR as a prognostic marker. In a 403-patient stage IIIA–IIIC cohort treated with induction chemotherapy, concurrent chemoradiation, and surgery, pCR occurred in 34% and independently predicted improved survival (OS HR 0.27; EFS HR 0.35) [15]. pCR rates were higher in squamous tumors (46%) than non-squamous (27%).

Updated results from major perioperative trials further reinforce this association. In the final 5-year analysis of CheckMate 816, overall 5-year OS was 65.4% in the nivolumab-chemotherapy arm versus 55.0% with chemotherapy alone (HR 0.72, P=0.048). In exploratory subgroup analyses, patients achieving pCR had a 5-year OS of 95.3% (95% CI 82.7–98.8) compared with 55.7% (95% CI 46.9–63.7) in those without pCR [16]. Similar patterns have been observed in AEGEAN and KEYNOTE-671, where higher pCR/MPR rates parallel sustained EFS benefits [17,18].

Ongoing IASLC initiatives continue to standardize pCR/MPR assessment and evaluate their potential as surrogate endpoints for regulatory use in resectable NSCLC.

Melanoma

In resectable stage III melanoma, neoadjuvant immunotherapy— particularly dual checkpoint blockade with PD-1 and CTLA-4 inhibitors—induces high pathologic response rates with strong prognostic value. In the OpACIN-neo trial, interobserver agreement for pathologic response assessment was excellent (κ = 0.879; ICC = 0.965), and patients achieving a pathologic response (<50% viable tumor) had markedly improved outcomes, with 3-year recurrence-free survival (RFS) of 95% versus 37% in non-responders (P < 0.001). An immune- active fibrosis-rich subtype further predicted absence of recurrence and prolonged RFS. Long-term follow-up from the combined OpACIN and OpACIN-neo trials confirmed durable benefit, with pathologic response remaining the strongest predictor of low relapse risk [19,20].

Single-agent PD-1 therapy demonstrates similar prognostic patterns. In a phase Ib trial of neoadjuvant pembrolizumab followed by adjuvant pembrolizumab, no deaths occurred among patients achieving major pathologic response (MPR) or pCR, yielding a 5-year OS of 100% compared with 72.8% in non-MPR patients [21].

Pooled analyses from the International Neoadjuvant Melanoma Consortium (INMC; n = 818) further confirm the prognostic value of pathologic response. In the updated INMC pooled dataset presented at ESMO 2024, patients achieving major or complete pathologic response had 3-year recurrence-free survival of 89%, demonstrating durable disease control across neoadjuvant regimens [22] (Table 3).

Table 3: Melanoma and Merkel Cell Carcinoma.

Study

Number of Patients Number of Trials

Summary of Findings

OpACIN-neo trial [20]

86

1

Melanoma:

  • Pathologic response (<50% viable tumor, including pCR + near-pCR/MPR) achieved in ~74–78% (regimen-dependent; 77% in optimal arm).
  • pCR (0% viable tumor) in substantial subset (~20–47% across arms).
  • Estimated 3-year RFS 95% for pathologic responders vs 37% for non-responders (P < 0.001) after median 47-monthfollow-up.
Study NCT02434354 [21]

30

1

Melanoma:

  • 5-yr OS 100% in MPR/pCR vs 72.8% in non-MPR; no deaths in MPR/pCR
NADINA [23]

423

1

Melanoma:

  • Neoadjuvant nivo+ipi: MPR 59%; 12-mo RFS 95.1% MPR vs 57% non-response; 2-yr EFS 77.3% (HR 0.32–0.40 vs adjuvant nivo)
  • pCR associated with 5-year EFS of 83% vs. 53% for non-pCR; 5-year OS of 89% vs. 64% for non-pCR
  • Updated 2-year data (ESMO 2025) show 24-month EFS 77.3% (HR 0.40; 95% CI 0.28-0.57; P<0.001) and DMFS 82.8% (HR0.43; 95% CI 0.29-0.64; P<0.001) for neoadjuvant vs adjuvant. MPR (59%) strongly predicted 12-month RFS (95.1% vs 57%).
INMC pooled (ESMO 2024) [22]

818

1

Melanoma:

  • 633 (77%) trial pts and 185 (23%) real-world pts
  • MPR rates 46% (PD-1 mono), 62% (PD-1+CTLA-4), 67% (PD-1+LAG-3); 3-year RFS 89% in MPR achievers (highest prognostic marker). 3-year EFS 64% (PD-1 alone), 76–77% (PD-1+CTLA-4), 82% (PD-1+LAG-3).
PRADO [24]

99

1

Melanoma:

  • MPR in 61/99 (61.6%), including pCR in 41/99 (41.4%). MPR patients underwent de-escalated surgery and omitted adjuvanttherapy. 2-year RFS was 93% (95% CI 86–100%) in MPR patients.
SWOG S1801 [25]

313

1

Melanoma:

  • 2-year EFS 72% with neoadjuvant-adjuvant pembrolizumab vs 49% with adjuvant-only pembrolizumab (HR 0.58; 95% CI 0.39–0.87; P = 0.004).
CheckMate 358 [63]

36

1

Merkel Cell Carcinoma:

  • Neoadjuvant nivolumab: pCR 47.2% (17/36);
  • no relapses in pCR patients at 19.3-month median post-op follow-up.
  • RFS at 12 months: 100% vs 59.6% (pCR vs non-pCR); at 24 months: 88.9% vs 52.2%; RFS HR 0.12.

Recent phase 3 data further validate neoadjuvant immunotherapy. In the NADINA trial, neoadjuvant nivolumab plus ipilimumab followed by response-adapted adjuvant therapy significantly improved EFS (HR 0.32–0.40 vs adjuvant nivolumab) with an MPR rate of 59%, which strongly predicted outcomes (12-month RFS 95.1% vs 57%) [23]. The PRADO extension showed that MPR enabled de-escalated surgery, with 2-year RFS of 93% in responders [24]. SWOG S1801 similarly demonstrated EFS superiority for neoadjuvant-adjuvant pembrolizumab over adjuvant-only therapy [25].

NCCN Cutaneous Melanoma Guidelines (Version 2.2025) now endorse neoadjuvant immune checkpoint inhibition for resectable stage IIIB–IIID disease and recognize pCR/MPR as important prognostic markers informing postoperative treatment intensity, though not yet validated surrogate endpoints.

Overall, achieving MPR or pCR after neoadjuvant immunotherapy predicts exceptional long-term RFS and OS in melanoma, supporting ongoing shifts toward response-adapted neoadjuvant strategies.

Merkel Cell Carcinoma

In Merkel cell carcinoma (MCC), a rare and aggressive neuroendocrine skin cancer, pCR after neoadjuvant immunotherapy is a strong patient-level prognostic marker, associated with prolonged RFS and excellent long-term outcomes in responders (Table 3).

Although data are limited by disease rarity, emerging evidence from neoadjuvant immune checkpoint inhibitor trials supports high pCR rates and favorable prognosis. In the phase I/II CheckMate 358 trial, neoadjuvant nivolumab (two doses) achieved a pCR rate of 47.2% (17/36 evaluable patients), with additional major pathologic responses observed. No patient achieving pCR experienced relapse at a median postoperative follow-up of 19.3 months, and RFS was markedly improved in responders (12- and 24-month RFS 100% and 88.9%, respectively) [63] (Table 3).

Supporting evidence from case reports and small series demonstrates similar findings with neoadjuvant avelumab, including complete pathologic responses and absence of recurrence at short- term follow-up [64].

Collectively, these findings highlight pCR/MPR as a robust prognostic indicator in resectable MCC treated with neoadjuvant immunotherapy, consistent with the tumor’s high immunogenicity. However, trial-level surrogacy remains unestablished due to small cohorts, lack of randomized data, and limited long-term follow- up. Ongoing studies evaluating neoadjuvant combinations and response-adapted strategies may further clarify the clinical utility of pCR, including potential treatment de-escalation in complete responders.

Gastrointestinal Malignancies

In gastric and gastroesophageal junction (GEJ) cancers, pCR after neoadjuvant or perioperative therapy is associated with improved survival at the patient level, but trial-level surrogacy remains limited. Foundational perioperative chemotherapy trials first established modern treatment paradigms. The MAGIC trial (ISRCTN93793971) demonstrated improved 5-year overall survival (OS) with perioperative ECF (epirubicin, cisplatin, and 5-fluorouracil) versus surgery alone (36% vs 23%; HR 0.75; 95% CI 0.60–0.93; P = 0.009), showing pathologic downstaging but without pCR as a primary endpoint [26]. The FLOT4 trial established perioperative FLOT (5-fluorouracil, leucovorin, oxaliplatin, and docetaxel) as superior to ECF/ECX (epirubicin, cisplatin, and 5-fluorouracil or capecitabine), improving median OS (50 vs 35 months; HR 0.77; 95% CI 0.63–0.94; P = 0.012) and increasing pCR rates (16% vs 6%) (Table 4) [27].

Table 4: Gastrointestinal Cancers.

Study

Number of Patients Number of Trials

Summary of Findings

MAGIC trial [26]

503

1

Gastroesophageal:

  • Improved 5-year OS 36% vs 23%; HR 0.75 (95% CI 0.60–0.93), P = 0.009. Significant pathologic T- and N-stage downstaging. pCR not prospectively assessed
FLOT4 Trial [27]

716

1

Gastric:

  • pCR rate: 16% (Becker Ia) with FLOT vs 6% with ECF/ECX (P<0.001 in phase 2 part; consistent in full trial). Higher major regression with FLOT.
MATTERHORN Trial [28]

948

1

Gastric:

  • pCR rate: 19.2% (95% CI 15.7-23.0) with durvalumab + FLOT vs 7.2% (95% CI 5.0-9.9) with FLOT alone (P<0.001).
  • Supports perioperative IO addition; linked to EFS/OS benefits
KEYNOTE-585 (2025final update) [29]

804

1

Gastric:

  • pCR rate: 12.9% (95% CI 9.8-16.6) with perioperative pembrolizumab + chemo vs 2.0% (95% CI 0.9-3.9) with chemo alone (P<0.00001).
  • Final OS showed numerical improvement but non-significant EFS benefit (44.4 vs 25.7 mo; HR 0.81, 95% CI 0.67- 0.98; did not meet prespecified threshold) and OS (71.8 vs 55.7 mo; HR 0.86, 95% CI 0.71-1.06; not significant); pCR prognostic but not strong trial-level surrogate.
Sugumar et al., 2025 [31]

11,882

25

Rectal:

  • No trial-level correlation. On meta-regression analysis, pCR was not correlated with OS (β = 0.37; 95% CI, -0.98 to 1.71; P = .57).
  • Similarly, pCR was not correlated with DFS (β = -0.84; 95% CI, -2.55 to 0.87; P = .32).
Smyth et al., 2016 [32]

330

1

Gastroesophageal:

  • Mandard TRG 1–2 vs 3–5: 5-year OS 58.8% vs 28.9%; HR 1.94, P = 0.021. Demonstrates prognostic value of histologic regression (retrospective).
Soro et al 2018 [33]

56

Esophageal:

  • pCR vs non-pCR: Median OS 4.1 vs 1.7 yrs; Median DFS 3.1 vs 1.1 yrs (P=0.04)
Murphy et al 2017 [34]

911

1

Esophageal:

  • pCR was associated with better OS (median 71.28 vs 35.87 mo) and higher 5-year OS rate 52% vs 41% compared to non-pCR; was also associated with better RFS (median 70.75 vs 26.07 mo).
Lin et al. 2018 [35]

68

1

Esophageal:

  • pCR is associated with higher 2-year OS rate 81.3% vs 58.3% (P = 0.025).
Wan et al 2019 [36]

6,780

21

Esophageal, esophagogastric junction AC, gastric AC, rectal cancer and pancreatic cancer:

  • pCR vs non-pCR: OS (HR = 0.50, P < 0.001) and DFS (HR = 0.49, P < 0.001).
  • In EGJAC/GAC, the correlation of pCR with OS was significant (HR = 0.38, p = 0.02).
Li et al. 2018 [37]

1,143

7

Gastric:

  • RR of pCR vs non-pCR is 0.5(p<0.0001), 0.34(p<0.0001), and 0.44 (p<0.0001) for 1, 3, 5-year-OS, respectively.
  • RR for 3-year DFS was 0.43 (p = 0.002)
Petrelli et al. 2017 [38]

10,050

22

Rectal:

  • Patient level: change of pCR is correlated weakly with change of OS 5-year rate (R² = 0.28). 3-year DFS rate and OS was similarly (R²=0.37). Trial level: R² = 0.41 and 0.04 respectively.
Sun et al. 2025 [40]

8,040

38

Esophageal:

  • pCR vs non-pCR (esophageal, post-NCRT): OS HR 0.54 (95% CI 0.52-0.57); DFS HR 0.51 (95% CI 0.46-0.57).
  • Strong patient-level prognostic association
RAPIDO Trial [41]

912

1

Rectal:

  • pCR rate: 28% with TNT vs 14% with standard CRT (OR 2.37; P < 0.001)
  • Disease-related treatment failure: 23.7% vs 30.4% (HR 0.75; P = 0.019)
  • TNT significantly increased pCR, but pCR showed limited trial-level surrogacy for long-term outcomes

Perioperative chemo-immunotherapy further increases pCR but demonstrates variable impact on survival. In MATTERHORN (NCT04592913), durvalumab plus FLOT doubled pCR rates (19.2% vs 7.2%; OR 3.12; 95% CI 2.23–4.37; P < 0.00001) and significantly improved event-free survival (EFS HR 0.71; 95% CI 0.58–0.86; P < 0.001), with final OS HR 0.78 (95% CI 0.63–0.96; P = 0.021) and FDA approval in November 2025 [28].

By contrast, KEYNOTE-585 (NCT03221426) significantly increased pCR with pembrolizumab plus chemotherapy (12.9% vs 2%) but did not achieve statistically significant EFS or OS improvement in final analyses. Final analysis (JCO 2025) showed non-significant EFS benefit (44.4 vs 25.7 mo; HR 0.81, 95% CI 0.67-0.98) and OS (71.8 vs 55.7 mo; HR 0.86, 95% CI 0.71-1.06), neither reaching protocol defined significance [29]. The DANTE/FLOT8 trial (NCT03421288) reported enhanced histopathologic regression and downstaging with atezolizumab + FLOT versus FLOT alone, though survival follow-up remains ongoing [30].

In rectal cancer, pCR following neoadjuvant chemoradiotherapy (CRT) or total neoadjuvant therapy (TNT) strongly predicts individual patient outcomes—including improved DFS, OS, and reduced recurrence—but does not function as a reliable trial-level surrogate. A comprehensive meta-analysis of 25 randomized trials (11,882 patients) found no significant correlation between treatment- related increases in pCR and improvements in OS or DFS, indicating that pCR does not function as a validated surrogate endpoint in rectal cancer trials [31].

pCR after CRT or total TNT is a strong patient-level prognostic marker in locally advanced rectal cancer, associated with lower rates of local and distant recurrence and superior OS and DFS in responders compared with non-responders.

In high-risk disease, TNT regimens improve both pCR rates and long-term outcomes. The RAPIDO trial (short-course radiotherapy followed by consolidation chemotherapy vs long-course CRT) reported pCR occurred in 28% of patients in the TNT arm versus 14% in the standard CRT arm (OR 2.37; P < 0.001), and disease-related treatment failure was reduced to 23.7% versus 30.4% (HR 0.75; P = 0.019) [58]. The UNICANCER-PRODIGE 23 trial (neoadjuvant mFOLFIRINOX followed by CRT vs standard CRT) showed improved 3-year DFS (76% vs 69%; HR 0.69; P = 0.034) and higher pCR rates in the experimental arm [59]. These data support TNT as a standard of care for high-risk locally advanced rectal cancer.

pCR also has important clinical implications beyond prognosis. Patients achieving complete response may be candidates for organ- preservation strategies, including watch-and-wait approaches, which have been associated with favorable oncologic outcomes and avoidance of permanent stomas in carefully selected patients [2,3].

However, a systematic review and meta-analysis of 25 randomized trials (11,882 patients) found no significant trial-level association between treatment-related differences in pCR and OS or DFS, indicating that pCR does not function as a reliable surrogate endpoint for survival at the trial level [31]. Overall, pCR remains clinically valuable for individual risk stratification and for guiding organ- preservation strategies in selected patients, but current evidence does not support its validation as a surrogate endpoint for survival in rectal cancer trials.

Achievement of pCR after CRT is strongly associated with superior survival in esophageal cancer. In a CRT cohort of 56 patients, Soror et al. reported a median OS of 4.1 years in pCR patients versus 1.7 years in non-pCR patients, and median DFS of 3.1 years versus 1.1 years, respectively (P = 0.04) [33]. In a large trimodality series of 911 patients, Blum Murphy et al. observed significantly longer survival, with median OS of 71.3 months vs 35.9 months and median RFS of 70.8 months vs 26.1 months in pCR versus non-pCR patients (both P < 0.01) [34]. Similarly reported superior outcomes in patients achieving pCR, with 2-year OS of 81.3% vs 58.3% in non-pCR patients (P = 0.025) [35].

Earlier studies by Davies et al. [36], Meredith et al. [37], Donahue et al. [38], and Berger et al. [39] consistently demonstrated markedly improved long-term survival in patients achieving pCR. A 2025 meta- analysis confirmed strong patient-level associations between pCR and survival, with OS HR 0.54 and DFS HR 0.51, consistent across histologic subtypes [40]. A 2024 pooled analysis further showed that overall pCR rates after neoadjuvant therapy were below 30%, with higher pCR rates in squamous cell carcinoma (SCC) than adenocarcinoma [41].

Neoadjuvant immunochemotherapy (PD-1/PD-L1 inhibitors + chemotherapy ± RT) increases pCR and major pathologic response rates, particularly in SCC, although trial-level surrogacy for OS remains weak (R² = 0.07) [42]. Recent comparative cohorts report pCR rates of 20–30% and improved 3-year OS compared with standard CRT in selected stage III SCC [43].

Overall, pCR remains a meaningful patient-level prognostic marker across gastrointestinal malignancies, but its trial-level surrogacy is weak, supporting its use for risk stratification but not yet as a validated regulatory surrogate.

Head and Neck Cancer

In resectable head and neck squamous cell carcinoma (HNSCC), pCR or MPR after neoadjuvant immunotherapy is associated with substantially improved long-term outcomes at the patient level. Across early-phase trials of neoadjuvant anti-PD-1 agents, reported pCR rates range from10 to15%, and MPR rates range from 20% to 50% with strong prognostic implications [44-46]. In a neoadjuvant pembrolizumab study, pCR occurred in 10% of patients and MPR in 44%, and no recurrences were observed among patients achieving MPR, whereas recurrences occurred predominantly among non-responders [44]. In a phase II trial of nivolumab ± ipilimumab, 2-year DFS was 71% in responders vs 51% in non-responders, with MPR independently predicting better outcomes [45]. A 2021 meta-analysis of neoadjuvant ICI confirmed pCR/MPR linked to superior EFS and OS [46] (Table 5).

Table 5: Neoadjuvant Immunotherapy in Head and Neck Squamous Cell Carcinoma (HNSCC).

Study

Number of Patients Number of Trials

Summary of Findings

NCT02296684 [44]

36

1

Pembrolizumab Neoadjuvant–Adjuvant Trial: pCR 10%; MPR 44%. No recurrences among MPR patients; recurrences confined to non-responders.
NCT02919683 [45]

29

1

Nivolumab ± Ipilimumab Neoadjuvant Trial: MPR 45%. 2-year DFS 71% (responders) vs 51% (non-responders). MPR independently predicted DFS and OS.
Shibata et al. 2021 [46]

382

17

Neoadjuvant ICI Systematic Review: Pooled pCR 12%; MPR 37%. pCR/MPR significantly associated with improved EFS and OS.
KEYNOTE-689 (NCT03765918) [47]

714

1

3-year EFS 57.6% vs 46.4% (perioperative pembrolizumab vs SOC); HR 0.73 (95% CI 0.58–0.92; P = 0.008). Neoadjuvant pembrolizumab did not compromise surgery.
Zandberg et al. 2025 [48]

624

9

Pooled IO Combination Analysis (2024–2025): MPR/pCR 20%–67% depending on regimen (highest with chemo-IO). Responders showed markedly longer DFS and OS; grade ≥3 toxicity higher with chemo-IO.

Recent phase III data (KEYNOTE-689, 2025) demonstrate improved EFS with perioperative pembrolizumab + standard care (surgery + adjuvant RT ± cisplatin) significantly improves EFS (3- year rates 57.6% vs 46.4%; HR reduction) versus standard care alone, with neoadjuvant pembrolizumab safe and not compromising surgery [47]). Updated meta-analyses (2024–2025) report pooled MPR or pCR rates ranging from 20% to 67% with ICI combinations (higher with chemoimmunotherapy), correlating with improved DFS/OS in responders, though chemoimmunotherapy increases grade 3–4 toxicity [48].

These data position pCR/MPR as a meaningful patient-level prognostic marker in HNSCC with neoadjuvant immunotherapy. However, trial-level surrogacy for OS remains unvalidated, and longer follow-up from randomized studies will be required before pathologic response can be accepted as a regulatory surrogate endpoint in this disease.

Ovarian Cancer

In advanced high-grade serous ovarian cancer, pCR after neoadjuvant chemotherapy (NACT) is uncommon (<5–10%) but, when achieved, is strongly associated with improved survival. Because true pCR is rare, most studies use the validated three-tier Chemotherapy Response Score (CRS), with CRS3 indicating complete or near-complete histologic response in the omentum and is considered the pathologic surrogate of chemosensitivity [49] (Table 6).

Table 6: Ovarian Cancer and Bladder Cancer.

Study

Number of Patients Number of Trials

Summary of Findings

Bohm et al., 2015 [49]

98

1

Ovarian:

  • Development and validation of 3-tier CRS in high-grade serous ovarian carcinoma post-NACT.
  • CRS3 (complete/near-complete response) vs CRS1-2: prolonged PFS and OS (strong prognostic value, especially in omentum).
Marsh et al., 2025 [50]

133

1

Ovarian (FIGO III–IV Multicenter CRS Study):

  • CRS3 vs CRS1-2: median PFS 24.8 months vs shorter (p < 0.001); improved OS (p = 0.011).
  • Pathologic response to NACT significantly associated with better PFS/OS.
Choe et al. 2023 [55]

4,287

12

Ovarian (CRS Meta-analysis):

  • CRS3 and pCR: OS HR 0.48; PFS HR 0.52
Kim et al. 2024 [56]

5,231

15

Ovarian (CRS Meta-analysis):

  • CRS3 vs CRS1–2: OS HR 0.46; PFS HR 0.51
Bhandoria et al. 2024 [57]

3,942

10

Ovarian:

  • pCR vs residual disease: OS HR 0.41; RFS HR 0.44
SWOG 8710 (Grossman et al. 2003) [60]

307

1

MIBC (MVAC vs surgery):

  • Neoadjuvant MVAC vs surgery alone: pCR (ypT0) 38% vs 15%; median OS 77 vs 46 months. Established pCR as a strong prognostic marker after cisplatin-based NAC.
PURE-01 (NCT02736266) [61]

155

1

MIBC:

  • Neoadjuvant pembrolizumab (3 cycles): pCR (ypT0N0) 36.8%. 36-month EFS 74.4%, OS 83.8%. 36-month RFS in ypT0N0: 96.3%, demonstrating near-curative outcomes in pCR patients.
NIAGARA [62]

1063

1

MIBC:

  • Durvalumab + gemcitabine-cisplatin vs GC alone: 24-mo EFS 67.8% vs 59.8% (HR 0.68; P<0.001); 24-mo OS 82.2% vs 75.2% (HR 0.75; P=0.01). First phase III trial showing that increasing pCR translates into improved survival.

Across multiple cohorts, CRS3 consistently demonstrates robust prognostic value. In a 133-patient FIGO III/IV cohort, CRS3 was associated with significantly longer progression-free survival (median 24.8 months vs 16.7 months; P < 0.001) and improved overall survival (P = 0.011) compared with CRS1–2 [50]. Foundational work by Böhm et al first established CRS3 as a marker of favorable prognosis [49], and external validation cohorts-including Lee et al. [51], Singh et al. [52], Rajkumar et al. [53] and Cohen et al. [54] -consistently confirmed that CRS3 is associated with significantly prolonged PFS and OS relative to CRS1-2.

Although rare, pCR is likewise associated with substantially longer recurrence-free and overall survival (often by 12–24 months) compared with patients with residual disease. Recent systematic reviews and meta-analyses [55-57] reaffirm the strong patient-level prognostic value of CRS3 and pCR, but highlight persistent limitations for trial-level surrogacy, including low pCR incidence and variability in histopathologic scoring.

Overall, pCR/CRS3 represents a robust patient-level prognostic marker following NACT in advanced ovarian cancer and may help refine postoperative treatment strategies, while broader validation as a regulatory surrogate endpoint is still evolving.

Bladder Cancer

In muscle-invasive bladder cancer (MIBC), pCR after NAC is a strong patient-level prognostic marker, associated with markedly improved RFS and OS. Patients achieving pCR (ypT0N0) at radical cystectomy experience significantly lower recurrence and mortality risks compared with those with residual disease, reflecting highly chemo-sensitive and immunosensitive tumor biology.

Cisplatin-based neoadjuvant chemotherapy (NAC) established this paradigm. In SWOG 8710, neoadjuvant MVAC increased pCR rates to 38% compared with 15% with surgery alone and improved median overall survival (77 vs 46 months) [60]. Subsequent pooled series and meta-analyses consistently demonstrate 5-year OS exceeding 70–80% in ypT0 patients, compared with ~40–50% in patients with residual disease, confirming pCR as a robust patient- level prognostic marker [61] (Table 6).

Neoadjuvant immune checkpoint blockade has confirmed that immunotherapy-induced pCR also translates into durable survival benefit. In PURE-01, three cycles of pembrolizumab before cystectomy produced a pCR rate of 36.8%. At 3-year median follow-up, event- free survival was 74.4% and overall survival was 83.8%. Importantly, among patients achieving ypT0N0, 36-month recurrence-free survival was 96.3%, and 96.1% (95% CI, 89-100) for ypT1/a/isN0, 74.9% (95% CI, 60.2-93) for ypT2-4N0, and 58.3% (95% CI, 36.2-94.1) for ypTanyN1-3 response, demonstrating near-curative outcomes associated with immunotherapy-mediated tumor eradication [61]

Definitive evidence that increasing pathologic response translates into improved survival now comes from the phase III NIAGARA trial. In this perioperative study of durvalumab plus gemcitabine–cisplatin versus chemotherapy alone, the dual primary endpoints of pCR and EFS were met. At 24 months, EFS was 67.8% with durvalumab versus 59.8% with chemotherapy (HR 0.68; P < 0.001), and overall survival was 82.2% versus 75.2% (HR 0.75; P = 0.01), establishing perioperative immunochemotherapy as a new standard of care [62].

Taken together, pCR is a validated patient-level prognostic biomarker in MIBC across chemotherapy and immunotherapy platforms. PURE-01 demonstrates the durability of immunotherapy- induced pCR, while NIAGARA provides the first randomized evidence that increasing pCR translates into improved EFS and OS, strengthening the regulatory case for perioperative immunochemotherapy in bladder cancer.

Discussion

This review synthesizes the evidence supporting pCR as an intermediate endpoint in neoadjuvant therapy across solid tumors, with a focus on its prognostic significance and potential role as a surrogate for long-term clinical outcomes. At the patient level, pCR is consistently associated with improved outcomes across tumors. However, trial-level surrogacy is weak or absent in rectal cancer (no correlation per Sugumar 2025), moderate but imprecise in NSCLC (R²=0.58 per Hines 2024; weaker per Waser 2024), and limited elsewhere due to data immaturity. Regulatory use beyond breast cancer requires tumor-specific validation. The association is most robust and reproducible in breast cancer, particularly in triple- negative and HER2-positive subtypes, and is also well supported in melanoma, NSCLC, muscle-invasive bladder cancer, and head and HNSCC. Emerging evidence suggests comparable prognostic relevance in ovarian cancer using near-complete response metrics such as Chemotherapy Response Score 3 [CRS3]), as well as in Merkel cell carcinoma, and selected gastrointestinal malignancies including gastric, gastroesophageal junction, rectal, esophageal. Notably, the strength of the association between pCR and long-term outcomes varies substantially by tumor biology, molecular subtype, and treatment modality, with the most pronounced effects observed in immunogenic tumors treated with immune checkpoint inhibitors.

From a regulatory standpoint, the FDA’s acceptance of pCR as an endpoint reasonably likely to predict clinical benefit—most notably in high-risk, early-stage breast cancer—rests on a combination of strong patient-level prognostic associations and supportive trial- level surrogacy. Outside this validated setting, however, pCR does not yet meet the evidentiary standard required for broad regulatory reliance. Although patient-level correlations between pCR and survival outcomes remain consistent across many tumor types, trial- level surrogacy-defined as the extent to which treatment-induced improvements in pCR reliably translate into proportional gains in long-term survival has been weak, inconsistent, or absent in several malignancies. For example, meta-regression analyses have failed to demonstrate significant trial-level correlations in rectal cancer, have yielded modest and imprecise estimates in NSCLC, and remain severely limited in rare tumor types due to small sample size and a paucity of randomized neoadjuvant trials.

This fundamental distinction between prognostic utility and surrogate validity carries critical implications for both trial design and regulatory decision-making. pCR is clinically valuable for risk stratification, response-adapted management (e.g., watch-and-wait in rectal cancer, de-escalation in melanoma or Merkel cell carcinoma), and organ preservation paradigms. However, in most settings, pCR alone is insufficient to support claims of clinical benefit or to justify accelerated approval outside of contexts in which trial-level surrogacy has been rigorously established. Consistent with guidance from EMA/CHMP, broader regulatory acceptance of pCR will require tumor-specific validation that demonstrates reproducible trial- level surrogacy, standardized pathologic assessment (e.g., immune- modified neoadjuvant criteria in melanoma and Böhm CRS in ovarian cancer), and confirmation of durable clinical benefit in adequately powered prospective studies.

In conclusion, pCR is a clinically meaningful and prognostically powerful endpoint in neoadjuvant therapy across diverse solid tumors. Its role is firmly established in breast cancer and shows strong patient-level promise in multiple other malignancies, particularly in the context of immunotherapy. However, the use of pCR as a regulatory surrogate beyond breast cancer must be determined on a tumor-specific and context-dependent basis. Continued generation of high-quality neoadjuvant trial data, extended follow-up for survival outcomes, harmonization of pathologic response criteria, and robust trial-level validation will be essential to define the appropriate role of pCR in future drug development and regulatory frameworks.

Conflict of Interest

SC is an employee of Nektar Therapeutics and may own its stocks. PH is an employee of Daiichi Sankyo Inc and may own its stocks. JF is an employee of TransThera Sciences Inc and may own its stocks and may own AstraZeneca stocks. NR declares no competing interests related to this work.

Funding

The authors received no fund for this research.

Disclaimer

Please note the views and opinions expressed are those of the authors and are not intended to reflect the views and/or opinions of their employer(s).

References

  1. U.S. Food and Drug Administration (2020) Pathological Complete Response in Neoadjuvant Treatment of High-Risk Early-Stage Breast Cancer: Use as an Endpoint to Support Accelerated Approval. Guidance for Industry. FDA. [crossref]
  2. Maas M, Nelemans PJ, Valentini V, et al. (2010) Long-term outcome in patients with a pathological complete response after chemoradiation for rectal cancer: a pooled analysis of individual patient data. Lancet Oncol. [crossref]
  3. Dossa F, Chesney TR, Acuna SA, Baxter NN (2017) A watch-and-wait approach for locally advanced rectal cancer after a clinical complete response following neoadjuvant chemoradiation: a systematic review and meta-analysis. Lancet Gastroenterol Hepatol. [crossref]
  4. Spring LM, Fell G, Arfe A, et al. (2020) Pathologic complete response after neoadjuvant chemotherapy and impact on breast cancer recurrence and survival: a comprehensive meta-analysis. Clin Cancer Res. [crossref]
  5. Berruti A, Amoroso V, Gallo F, et (2014) Pathologic complete response as a potential surrogate for survival in breast cancer: a meta-regression of 29 randomized neoadjuvant trials. J Clin Oncol. [crossref]
  6. Davey MG, Browne JP, Miller NM, et (2022) Pathologic complete response as a surrogate endpoint in HER2-positive early breast cancer: a systematic review and meta-analysis. Breast Cancer Res Treat.
  7. Cortazar P, Zhang L, Untch M, et al. (2014) Pathological complete response and long-term clinical benefit in breast cancer: the CTNeoBC pooled analysis. Lancet. [crossref]
  8. von Minckwitz G, Untch M, Blohmer JU, et (2012) Definition and impact of pathologic complete response on prognosis after neoadjuvant chemotherapy in various intrinsic breast cancer subtypes. J Clin Oncol. [crossref]
  9. Broglio KR, Quintana M, Foster M, et al. (2016) Association of pathologic complete response to neoadjuvant therapy in HER2-positive breast cancer with long-term J Natl Cancer Inst. [crossref]
  10. Huang M, O’Shaughnessy J, Zhao J, et al. (2020) Association of pathologic complete response with long-term survival outcomes in triple-negative breast cancer: a meta- Clin Cancer Res. [crossref]
  11. Rosner S, Liu C, Forde PM, et al. (2022) Association of pathologic complete response and long-term survival outcomes among patients treated with neoadjuvant chemotherapy or chemoradiotherapy for NSCLC: a meta-analysis. JTO Clin Res Rep. [crossref]
  12. Banna GL, Hassan MA, Signori A, et (2024) Neoadjuvant Chemo-Immunotherapy for Early-Stage Non–Small Cell Lung Cancer: A Systematic Review and Meta- Analysis. JAMA Netw Open. [crossref]
  13. Hines JB, Cameron RB, Esposito A, et (2024) Evaluation of major pathologic response and pathologic complete response as surrogate end points for survival in randomized controlled trials of neoadjuvant immune checkpoint blockade in resectable NSCLC. J Thorac Oncol. [crossref]
  14. Waser NA, et (2024) Trial-level and patient-level surrogacy of pathologic response for survival in neoadjuvant trials of resectable non-small cell lung cancer. Eur J Cancer.
  15. Guberina M, Metzenmacher M, Pöttgen C, Wiesweg M, Guberina N, Merkel-Jens A, et al. (2025) Pathologic Complete Response Predicts Long-Term Survival Following Neoadjuvant Induction Chemotherapy and Chemo-Radiotherapy in Stage-III Non- Small Cell Lung Cancer. Thorac Cancer. [crossref]
  16. Forde PM, Spicer J, Girard N, et (2025) Neoadjuvant nivolumab plus chemotherapy in resectable lung cancer: 5-year outcomes from CheckMate-816. N Engl J Med. [crossref]
  17. Deutsch E, et (2025) AEGEAN: Phase III trial of neoadjuvant durvalumab plus chemotherapy followed by adjuvant durvalumab in patients with resectable non-small cell lung cancer — updated analyses. IASLC World Conference on Lung Cancer. [crossref]
  18. Wakelee HA, Liberman M, Kato T, et (2023) Perioperative Pembrolizumab for Early-Stage Non-Small-Cell Lung Cancer. N Engl J Med. [crossref]
  19. Rawson RV, Thompson JF, Scolyer RA, et (2021) Pathological response and tumour bed histopathological features correlate with survival following neoadjuvant immunotherapy in stage III melanoma. Ann Oncol. [crossref]
  20. Rozeman EA, Menzies AM, van Akkooi ACJ, et (2023) Survival update of neoadjuvant ipilimumab plus nivolumab in macroscopic stage III melanoma in the OpACIN and OpACIN-neo trials. Ann Oncol. [crossref]
  21. Sharon CE, Xu X, et al. (2023) Long-term outcomes to neoadjuvant pembrolizumab based on pathological response for patients with resectable stage III/IV cutaneous Ann Oncol. [crossref]
  22. Long GV, Menzies AM, Scolyer RA, et al. (2024) Long-term survival with neoadjuvant therapy in melanoma: Updated pooled analysis from the International Neoadjuvant Melanoma Consortium (INMC) Ann Oncol. [crossref]
  23. Blank CU, Lucas MW, van Akkooi ACJ, et (2024) Neoadjuvant nivolumab plus ipilimumab versus adjuvant nivolumab in macroscopic, resectable stage III melanoma: the phase 3 NADINA trial. N Engl J Med. [crossref]
  24. Reijers ILM, Menzies AM, van Akkooi ACJ, et al. (2022) Personalized response- driven surgery and adjuvant therapy after neoadjuvant ipilimumab plus nivolumab in stage III melanoma (PRADO) Nat Med. [crossref]
  25. Patel SP, Othus M, Prieto V, et (2023) Neoadjuvant-adjuvant or adjuvant-only pembrolizumab in resectable stage III–IV melanoma (SWOG S1801) N Engl J Med. [crossref]
  26. Cunningham D, Allum WH, Stenning SP, et al. (2006) Perioperative chemotherapy versus surgery alone for resectable gastroesophageal N Engl J Med. [crossref]
  27. Al-Batran SE, Homann N, Pauligk C, et (2019) Perioperative chemotherapy with fluorouracil plus leucovorin, oxaliplatin, and docetaxel versus fluorouracil or capecitabine plus cisplatin and epirubicin for locally advanced, resectable gastric or gastro-oesophageal junction adenocarcinoma (FLOT4): a randomised, phase 2/3 trial. Lancet. [crossref]
  28. Janjigian YY, Al-Batran SE, Wainberg ZA, et al. (2025) Perioperative durvalumab in gastric and gastroesophageal junction cancer. N Engl J Med. [crossref]
  29. Shitara K, Rha SY, Wyrwicz LS, et al. (2025) Pembrolizumab plus chemotherapy versus chemotherapy as perioperative therapy in locally advanced gastric and gastroesophageal junction cancer: Final analysis of the randomized, phase III KEYNOTE-585 J Clin Oncol. [crossref]
  30. Lorenzen S, Götze TO, Thuss-Patience P, et al. (2024) Perioperative atezolizumab plus fluorouracil, leucovorin, oxaliplatin, and docetaxel for resectable esophagogastric cancer: interim results from the randomized, multicenter, phase II/III DANTE/ IKF-s633 J Clin Oncol. [crossref]
  31. Sugumar K, Lie JJ, Stucky CC, et (2025) Pathologic complete response and survival in rectal cancer: a systematic review and meta-analysis. JAMA Netw Open. [crossref]
  32. Smyth EC, Fassan M, Cunningham D, et al. (2016) Effect of pathologic tumor response and nodal status on survival after perioperative chemotherapy for gastroesophageal cancer: a post hoc analysis of the MAGIC Ann Oncol.
  33. Soror T, et (2018) Prognostic significance of pathologic complete response after neoadjuvant chemoradiotherapy in esophageal cancer. J Thorac Dis. [crossref]
  34. Blum Murphy MA, et al. (2017) Pathologic complete response after neoadjuvant chemoradiation in esophageal cancer: prognostic significance. Cancer.
  35. Lin JW, et al. (2018) Prognostic value of pathologic complete response after neoadjuvant chemoradiotherapy in esophageal squamous cell J Chin Med Assoc.
  36. Davies AR, et (2014) Tumor stage after neoadjuvant chemotherapy determines survival after surgery for locally advanced esophageal cancer. J Clin Oncol. [crossref]
  37. Meredith KL, et al. (2010) Pathologic response is the major determinant of survival in patients with esophageal cancer who receive neoadjuvant therapy. Ann Surg Oncol.
  38. Donahue TR, et al. (2009) Complete pathologic response after neoadjuvant chemoradiotherapy for esophageal carcinoma is associated with enhanced survival. Ann Thorac Surg. [crossref]
  39. Berger AC, et (2005) Complete response to neoadjuvant chemoradiotherapy in esophageal carcinoma is associated with significantly improved survival. J Clin Oncol. [crossref]
  40. Sun X, Zhang Y, Li Y, et (2025) Pathologic complete response and survival in esophageal cancer after neoadjuvant therapy: a systematic review and meta-analysis. Eur J Cancer.
  41. Gaber CE, Mönig SP, Berlth F, et (2024) Pathologic complete response after neoadjuvant therapy in esophageal cancer: pooled analysis. Cancer Med.
  42. Yuan Y, Wang H, Liu X, et (2024) Surrogacy of pathologic response for overall survival in neoadjuvant immunochemotherapy for resectable esophageal cancer. Ann Oncol.
  43. Liu J, Li Z, Zhang X, et (2024) Neoadjuvant immunochemotherapy versus chemoradiotherapy for stage III esophageal squamous cell carcinoma: a multicenter comparative cohort study. J Clin Oncol.
  44. Uppaluri R, Campbell KM, Egloff AM, et (2020) Neoadjuvant and adjuvant pembrolizumab in resectable, locally advanced, human papillomavirus–unrelated head and neck squamous cell carcinoma: a multicenter, phase II trial. Clin Cancer Res. [crossref]
  45. Wise-Draper TM, Old MO, Worden FP, et al. (2022) Phase II clinical trial of neoadjuvant and adjuvant nivolumab with or without ipilimumab in resectable locally advanced head and neck squamous cell Clin Cancer Res.
  46. Shibata H, Saito S, Uppaluri R (2021) Neoadjuvant immune checkpoint blockade in head and neck cancer: a systematic review. Cancers (Basel) [crossref]
  47. Uppaluri R, Haddad RI, Tao Y, et al. (2025) Perioperative pembrolizumab in locally advanced head and neck squamous cell N Engl J Med.
  48. Zandberg DP, Ferris RL, Haddad RI, et al. (2025) Neoadjuvant immune checkpoint inhibitor–based therapy in resectable head and neck squamous cell carcinoma: pooled analysis of pathologic response and survival from contemporary J Clin Oncol.
  49. Böhm S, Faruqi A, Said I, et al. (2015) Chemotherapy response score: Development and validation of a system to quantify histopathologic response to neoadjuvant chemotherapy in tubo-ovarian high-grade serous carcinoma. Mod Pathol. [crossref]
  50. Marsh S, Leung S, Pather S, et (2018) Histopathologic chemotherapy response score in ovarian cancer: prognostic significance in FIGO stage III–IV disease. Gynecol Oncol.
  51. Lee JY, Chung YS, Na K, et (2017) Omental chemotherapy response score predicts survival outcomes in advanced ovarian high-grade serous carcinoma treated with neoadjuvant chemotherapy. J Gynecol Oncol.
  52. Singh P, Kumar L, Saha S, et (2018) Histopathological chemotherapy response score predicts survival in high-grade serous ovarian carcinoma treated with neoadjuvant chemotherapy. Int J Gynecol Pathol. [crossref]
  53. Rajkumar S, Sarkar D, Mahajan A, et al. (2018) Omental chemotherapy response score predicts progression-free and overall survival in advanced ovarian Int J Gynecol Cancer.
  54. Cohen PA, Powell A, Beale P, et al. (2019) Omental chemotherapy response score is an independent predictor of survival in patients with advanced high-grade serous ovarian carcinoma treated with neoadjuvant Gynecol Oncol.
  55. Choe JY, Kim SI, Kim JW, et (2023) Prognostic significance of chemotherapy response score and pathologic complete response after neoadjuvant chemotherapy in advanced ovarian cancer: a systematic review and meta-analysis. Gynecol Oncol. [crossref]
  56. Kim YJ, Lee YS, Park JY, et (2024) Chemotherapy response score predicts survival in patients with advanced epithelial ovarian cancer treated with neoadjuvant chemotherapy: a meta-analysis. Eur J Surg Oncol.
  57. Bhandoria GP, Singh S, Mahajan A, et al. (2024) Prognostic impact of pathologic complete response following neoadjuvant chemotherapy in ovarian cancer: a systematic review and meta-analysis. Int J Gynecol Cancer. [crossref]
  58. Bahadoer RR, Dijkstra EA, van Etten B, et al. (2021) Short-course radiotherapy followed by chemotherapy before total mesorectal excision in locally advanced rectal cancer (RAPIDO) N Engl J Med. [crossref]
  59. Conroy T, Bosset JF, Etienne PL, et (2021) Neoadjuvant mFOLFIRINOX plus chemoradiotherapy in rectal cancer (UNICANCER-PRODIGE 23) N Engl J Med.
  60. Grossman HB, Natale RB, Tangen CM, et (2003) Neoadjuvant chemotherapy plus cystectomy compared with cystectomy alone for locally advanced bladder cancer. N Engl J Med. [crossref]
  61. Necchi A, Basile G, Bandini M, et (2022) Neoadjuvant pembrolizumab and radical cystectomy in patients with muscle-invasive urothelial bladder cancer (PURE-01): 3-year median follow-up. Clin Cancer Res. [crossref]
  62. Powles T, Assaf ZJ, Davarpanah N, et (2024) Perioperative durvalumab plus chemotherapy in muscle-invasive bladder cancer (NIAGARA) N Engl J Med. [crossref]
  63. Topalian SL, Bhatia S, Amin A, et (2020) Neoadjuvant nivolumab for patients with resectable Merkel cell carcinoma in the CheckMate-358 trial. J Clin Oncol. [crossref]
  64. Singh N, Bhatia S, Nghiem P (2019) Complete pathologic response with neoadjuvant avelumab in Merkel cell carcinoma. Oral Oncol. [crossref]