Monthly Archives: September 2024

Endotoxin Challenge: Optimizing Experimental Models for Antipyretic Drug Development

DOI: 10.31038/IDT.2024521

Abstract

The endotoxin challenge serves as a valuable experimental model for antipyretic drug development, providing insights into systemic inflammatory responses and the efficacy of novel treatments. By inducing predictable physiological reactions, it mirrors the inflammatory profile of sepsis, allowing for investigations into the pathophysiology of fever and inflammation, as well as the evaluation of antipyretic therapies. This review examines the varied applications of endotoxin administration, particularly intravenous bolus dosing, and highlights the potential of combined bolus-infusion paradigms to sustain systemic responses and better align with therapeutic pharmacokinetics and pharmacodynamics. Furthermore, mathematical modeling and simulation techniques offer innovative approaches to optimizing experimental designs and data analysis. Despite its broad application, there remains a need for models that elicit a safe, sustained, and measurable systemic response, allowing for the thorough evaluation of antipyretics. Developing such models is crucial to enhancing the efficiency of drug development and improving clinical management of pyrexia across various settings.

Keywords

Endotoxin challenge, Antipyretic drug development, Systemic inflammation, Experimental medicine models, Pharmacokinetic – pharmacodynamic optimization

Introduction

The endotoxin challenge is an experimental medicine tool that has been used for over a century across a number of investigational efforts and in some settings even as a therapeutic. Kamisoglu et al. have shown that the plasma metabolomic profile following an endotoxin challenge is concordant with that from sepsis survivors, affirming the validity of the endotoxin challenge as a viable model to recapitulate homeostatic responses to inflammatory and pyrogenic challenges [1]. Uses of the endotoxin challenge in clinical investigation include attempts to characterize pathophysiology of pyrexia and inflammatory and anti-inflammatory pathways, describe time-course of clinical and molecular events as well as assessment of the degree of benefit of novel anti-pyretic and anti-inflammatory therapies. The doses and routes of endotoxin administration vary depending on the scientific question at hand. In turn, there are some challenges to design of an endotoxin challenge tailored to address specific questions, particularly in the context of definition of quantitative estimates of therapeutic benefit.

The innate risk of administering endotoxin especially to healthy volunteers is partly balanced by the somewhat predictable nature and time-course of the systemic response it elicits [2]. To further deliver on the twin need to ensure safe use of endotoxin for investigational purposes as well as to guide drug development, the NIH and FDA jointly oversaw an effort to develop a “national biological reference standard to be made available to pharmaceutical manufacturers and qualified biomedical investigators as an aid to standardization of bioassays and research with endotoxin”. This standard developed using endotoxin from Escherichia coli O: 113: H10: K negative has also been adopted by the WHO as its reference for endotoxin assays [2].

Pyrexia or fever is defined as a state in which the central thermoregulatory set point is increased, primarily via disinhibition of thermogenesis, and pyrogens are agents that induce pyrexia [3,4]. In general, exogenous pyrogens such as bacterial and viral antigens or exotoxins activate the Toll-like receptor (TLR) pathway, that triggers a signal transduction cascade leading to increased generation of endogenous pyrogens such as prostaglandins, culminating in the pathophysiologic events that constitute the pyrexia response [3,5]. The purported teleologic role of pyrexia in the setting of disease, particularly infectious disease, is an adaptive response to inhibit microorganism proliferation and amplify endogenous immunological response [6]. However, this is accompanied by increases in metabolic demand as well as undue stress on the cardiovascular, respiratory and other systems that are less than welcome [6]. Timely and prudent use of antipyretics tailored to rein in the unwarranted systemic effects of pyrexia without impacting its benefits as an adaptive response relies heavily on clinical judgment [6]. However, there is limited standardization to guide the use of antipyretics, particularly so from a contextual perspective [6]. It is also important to note that antipyretics themselves may carry side-effects and there is a paucity of data and limited interest in developing newer antipyretics [6]. Given that fever is one of the commonest clinical symptoms and signs, there is an urgent need to develop newer antipyretics with optimized time-action and benefit-risk profiles to enable fit-for-purpose use based on the setting in which fever occurs.

The sterile inflammatory state induced by an endotoxin challenge makes it especially valuable to characterize pyrexia and evaluate antipyretics. Although endotoxin may be administered by various routes, in the context of pyrexia, given the need to elicit a measurable systemic response, intravenous (IV) administration remains the preferred route. Systemic responses have been reported in settings of high and low dose administration. Following an IV endotoxin (E. coli O: 113) bolus in the range of 2 to 4 ng/kg body weight in healthy volunteers, Suffredini et al. and others reported a monophasic febrile response with onset 1 to 2 hours after administration, peaking at 3 to 4 hours to reach a maximal rise in body temperature over baseline with spontaneous resolution of the febrile response between 8 and 12 hours after the bolus administration [2,7]. In a placebo-controlled study, Pernerstorfer et al. were able to successfully demonstrate superiority of the antipyretic effects of acetaminophen over aspirin using a 4ng/ kg IV endotoxin bolus challenge [8]. Dose-limiting toxicities at doses greater than 4ng/kg have generally precluded their routine use. The brisk and robust febrile response following IV endotoxin at the 2-4ng/ kg dose is preceded by flu-like symptoms (chills, rigors, malaise, nausea and headache) starting one hour after administration and resolving spontaneously within 3 to 5 hours [2]. Other systemic changes accompanying the febrile response include a drop in blood pressure and increases in heart and respiratory rates with alterations in various blood- based measures including leukocytosis, cytokines and hormones [7]. It is important to note that while the rapid-onset responses are a direct effect of endotoxin, some of the other observed responses are a result of triggering of the inflammatory and cytokine cascade rather than a direct effect of the endotoxin itself, whose half-life when administered as an IV bolus is short lived. The IV bolus endotoxin challenge therefore allows for insights into the inflammatory event cascade and its mediators and at the same time also sheds light on whether a novel therapeutic has antipyretic or anti-inflammatory benefits. However, its ability to inform on the magnitude and duration of such benefit is particularly dependent on the synchrony between the temporal profile of action of the investigational agent and that of the responses to the endotoxin challenge. This is especially true for a novel antipyretic.

An alternate option would be administration of endotoxin as a continuous IV infusion to attempt to synchronize temporal profiles across the endotoxin challenge and investigational agent. However, the pharmacokinetics of a continuous infusion may limit the ability to achieve a peak challenge that is sufficiently robust to trigger a measurable systemic response. And indeed, Andreason et al. [9] have reported that lower doses of endotoxin in the range of 0.06-0.08 ng/kg, achieved via IV bolus or continuous IV infusion elicit what appears to be a submaximal inflammatory response with no detectable changes in vital signs including body temperature.

There is a need for development of a reliable yet feasible endotoxin challenge model that enables elicitation of a peak systemic response that is sustained over several hours, while not exceeding the total amount of endotoxin that can be safely administered and in a paradigm that is flexible enough to investigate a range of PK-PD profiles across agents and escalating doses. This need is particularly urgent in the context of novel antipyretics where onset and offset of effects and synchrony with the febrile response are critical parameters of success. One potential option would be a combined bolus-infusion approach, where a bolus administration of endotoxin is followed by a continuous infusion such that the total dose of endotoxin does not lead to dose-limiting toxicities. Van Lier et al. have proposed that a continuous infusion of endotoxin may better reflect the prolonged systemic responses including fever observed in the setting of infection and inflammation in man [10]. In a model of endotoxin challenge with a bolus dose of 1mg/kg followed by an infusion at 0.5ng/kg/hour for 3 hours, Jansen et al. were able to successfully demonstrate the beneficial anti-inflammatory effects of Cytosorb hemoperfusion in a group of healthy volunteers [11]. In a study with endotoxin challenges on two separate occasions, using a paradigm that combined a bolus administration of endotoxin at 1ng/kg followed by an infusion at 1ng/ kg/hour for 3 hours in a group of healthy volunteers, Leijte et al. were able to show endotoxin tolerance and reversal, confirming that the total dose administered in such a paradigm is safe and that the model is able to successfully detect treatment differences [12]. In a head-to- head comparison of a bolus only paradigm (2ng/kg) versus a combined bolus-infusion paradigm (1ng/kg bolus followed by a 3-hour infusion at 1ng/kg/hr) in the context of experimental endotoxemia, Kiers et al. found that subjects attained comparable peak levels and exhibited more prolonged and sustained duration of symptoms including fever during the endotoxin challenge model of a bolus followed by a continuous infusion vs bolus only method [13]. Kiers et al. also found that subjects attained higher peak cytokine levels that were sustained for longer durations following the combined bolus-infusion paradigm vs the bolus only paradigm [13]. Hence it is possible that a carefully developed combined bolus-infusion paradigm may permit administration of higher total amounts of endotoxin that could lead to a temperature response with slower onset but more sustained duration. Yet another novel approach would be to use modeling and simulation tools either as standalone approaches or in combination with in vivo efforts to optimize experimental paradigms and data analyses strategies. Using mathematical modeling of data collated across multiple endotoxin challenge experiments and investigator groups, Windoloski et al. showed that a continuous infusion elicits a stronger response that lasts longer than a bolus only paradigm, while potentially allowing for delivery of maximal total doses of endotoxin that can be safely administered [14]. Liu et al. have used mathematical modeling to describe and predict the dynamics of responses to endotoxin challenges with intent to inform on novel clinical trial design, particularly in the context of drug development [15].

Taken together, a combined bolus-infusion paradigm coupled with a mathematical modeling and simulation strategy may be the optimal solution to provide an experimental model of endotoxin challenge that is safe but provides a measurable response while allowing for synchronization with the PK-PD properties of a novel therapeutic. Although there is evidence that speaks to each component of the above approach, data to confirm validity of the approach and develop an integrated strategy are currently lacking. Therefore, there is an urgent need for targeted experimentation to address the above gaps and provide a consolidated strategy that integrates human in vivo experimentation and modeling and simulation tools that delivers on a fit-fit-for-purpose endotoxin challenge design.

References

  1. Kamisoglu K, Haimovich B, Calvano SE, Coyle SM, Corbett SA, et (2015) Human metabolic response to systemic inflammation: Assessment of the concordance between experimental endotoxemia and clinical cases of sepsis/SIRS. Critical Care 19. [crossref]
  2. Suffredini AF, Noveck RJ (2014) Human endotoxin administration as an experimental model in drug Clinical Pharmacology & Therapeutics 96: 418-422. [crossref]
  3. Bartfai T, Conti B (2010) The Scientific World JOURNAL 10: 490-503.
  4. Ogoina D (2011) Fever, fever patterns and diseases called ‘fever’ – A Journal of Infection and Public Health 4: 108-124. [crossref]
  5. Blatteis CM, Sehic E, Li S (2000) Pyrogen sensing and signaling: Old Views and new Clinical Infectious Diseases 31. [crossref]
  6. Mehmood KT, Al-Baldawi S, Zúñiga Salazar G, Zúñiga D, Balasubramanian S (2024) Antipyretic use in noncritically ill patients with fever: A Cureus.
  7. Godin PJ, Fleisher LA, Eidsath A, Vandivier RW, Preas HL, et (1996) Experimental human endotoxemia increases cardiac regularity. Critical Care Medicine 24: 1117- 1124. [crossref]
  8. Pernerstorfer T, Schmid R, Bieglmayer C, Eichler H, Kapiotis S, et al. (1999) Acetaminophen has greater antipyretic efficacy than aspirin in endotoxemia: A randomized, double-blind, placebo-controlled trial. Clinical Pharmacology & Therapeutics 66: 51-57. [crossref]
  9. Andreasen A, Krabbe K, Krogh-Madsen R, Taudorf S, Pedersen B, et al. (2008) Human Endotoxemia as a model of systemic inflammation. Current Medicinal Chemistry 15: 1697-1705. [crossref]
  10. van Lier D, Geven C, Leijte GP, Pickkers P (2019) Experimental human Endotoxemia as a model of systemic inflammation. Biochimie 159: 99-106. [crossref]
  11. Jansen A, Waalders NJ, van Lier DP, Kox M, Pickkers P (2023) CytoSorb hemoperfusion markedly attenuates circulating cytokine concentrations during systemic inflammation in humans in vivo. Critical Care 27.
  12. Leijte GP, Kiers D, van der Heijden W, Jansen A, Gerretsen J, et (2019) Treatment with acetylsalicylic acid reverses endotoxin tolerance in humans in vivo: A randomized placebo-controlled study. Crit Care Med 47: 508-516. [crossref]
  13. Kiers D, Leijte GP, Gerretsen J, Zwaag J, Kox M, et (2019) Comparison of different lots of endotoxin and evaluation of in vivo potency over time in the experimental human ENDOTOXEMIA model. Innate Immunity 25: 34-45. [crossref]
  14. Windoloski KA, Janum S, Berg RM, Olufsen MS (2024) Characterization of differences in immune responses during bolus and continuous infusion endotoxin challenges using mathematical modelling. Experimental Physiology 109: 689-710. [crossref]
  15. Liu F, Aulin LB, Guo T, Krekels EH, Moerland M, et al. (2022) Modelling inflammatory biomarker dynamics in a human lipopolysaccharide (LPS) challenge study using delay differential equations. British Journal of Clinical Pharmacology 88: 5420-5427. [crossref]

Growth Rates, Feed Efficiency, and Condition Indices of Clarias gariepinus in Biofloc System Using Treated and Untreated Rice Bran as Carbon Sources

DOI: 10.31038/AFS.2024612

Abstract

The biofloc system uses the presence of microorganisms in the culture system to generate flocs from nitrogen waste, thus permitting continued water use. Factors like carbon source, carbon-to-nitrogen ratio, and stocking density affect the quality and density of microorganisms and the productivity of the system. This study aims to determine the growth, feed conversion ratio (FCR), and condition indices of catfish reared in a biofloc system using rice bran (RBB), fermented rice bran (FRB), and hydrolyzed fermented rice bran (HFRB) as carbon sources. Fingerling catfish with an initial mean weight of 11.15 ± 1.60 g were stocked in outdoor 200-liter plastic tanks in a randomized design with the three treatments in two replications. A biomass (g) to volume (l) ratio of 1:2 was maintained throughout the experiment. The carbon-nitrogen content was adjusted to 5:1 C-N in the system. The results showed that the water quality parameters of all the treatments were within the range recommended for aquaculture. The HFRB treatment showed significantly higher floc (P<0.05) compared with RBB and FRB. The weight of the catfish at the end of the 8-week rearing trials showed the catfish culture using RBB (80.26 ± 3.20 g), FRB (81.70 ± 2.5 g), and HFRB (85.50 ± 2.55 g) were significantly different (P<0.05). A similar trend was observed in the feed conversion ratio. The condition indices of catfish were also higher in FRB treatment. The FCR value and protein efficiency ratio were not significantly different (P>0.05) between RBB and HFRB treatments. However, the percentage survival was significantly lower in the HFRB treatment (P < 0.05) compared with the FRB and RBB treatments. While fermentation of rice bran has gained much consideration, this study demonstrated that acid-hydrolyzed fermentation of rice bran could boost its performance as a biofloc carbon source.

Keywords

Fermented rice bran, Acid-hydrolyzed rice bran, Biofloc, Carbon sources

Introduction

The African catfish, Clarias gariepinus, is valued as the most economically important fish cultured in Africa. This species is reputed for its desired aquaculture traits, including high fecundity, fast growth, hardiness, and market attractiveness. It is one of the most researched culturable fish in Nigeria. Modern culture techniques such as aquaponics and biofloc systems have also adopted catfish as one of the experimental species for the viability of the systems. Biofloc aquculture systems transform fish waste into microorganism biomass through the addition of carbon sources. The type of carbon source significantly influenced the water quality of the system. The floc serves as additional food for the fish, leading to faster growth and higher production of fish compared to traditional methods. Microorganism- enriched floc confers immunological enhancement to fish, thereby improving fish health. Many ingredients, such as grains, sucrose, sugarcane byproducts, tapioca, rice, wheat bran, etc., have been used as carbon supplements in biofloc systems. Ligno-cellulose materials like bran showed limited success in biofloc systems due to the to the slow release of carbon, but tends to have higher microbial diversity and immune-boosting potential for cultured organisms. Researcher efforts to improve carbon release and utilization of lignified and cellulose materials in biofloc systems remain pertinent. This work compared the growth performance and condition indices of catfish in biofloc systems where untreated, fermented, and hydrolyzed fermented rice bran were used as carbon sources. In ethanol production, acid hydrolysis of rice bran resulted in the conversion of its starch and cellulose component into reducing sugar, and fermentation has been used to increase the nutrient value of rice bran. While fermented rice bran has been well experimented with in biofloc, we hypothesize that acid hydrolyzed once could also serve in the system [1-12].

Materials and Methods

Experimental Setup

The experiment was conducted at the biological garden, Umaru Musa Yar’adua University. Fingerlings of African catfish, Clarias gariepinus, of 11.15 ± 1.50 g initial weight were obtained from hatchery-reared stock and kept in a 200-liter plastic tank for a 7-day acclimation period. The fish were fed a diet containing 40% crude protein at 5% body weight during 8:00–18.00 hours daily. Experimental tanks were seeded with 1 liter of water from a pre-fertilized earthen fish pond containing abundant phytoplankton. The fish were randomly distributed to the three experimental treatments of untreated, fermented, and hydrolyzed fermented rice bran biofloc in a triplicate of 20 fish per tank at a 2:1 biomass (g) to volume (l) ratio. Each experimental setup was seeded with 2 liters of water from a pre-fertilized earthen fish pond containing abundant phytoplankton.

Fermentation and Acid Hydrolysis of Rice Bran

Milled rice bran was sieved through a 0.50 mm sieve and sterilized in an autoclave. The solid-phase fermentation procedure described by [13] was followed with slight modifications. 50 g of rice bran was added to 45 ml of distilled water, while 5 g of baker’s yeast dissolved in 5 ml of water was added to make up a 1:1 weight-to-volume ratio of rice bran to water. The mixture was incubated in a beaker at a temperature of 27°C for 24 hours. Acid hydrolysis of rice bran was carried out using 50 ml of 2% sulfuric acid mixed with 50 g of rice bran, and the mixture was incubated at 90°C for 3.5 h. This was modified from. The hydrolyzed product was subjected to fermentation as described before. The fermented and hydrolyzed fermented products were oven dried at 45°C for 6 h, powdered, and sieved through 100 µm mesh. The fermented rice bran (FRB) and hydrolyzed fermented rice bran (HFRB) were used as carbon sources in biofloc production catfish [11].

Water Quality and Floc Monitoring

Water parameters were measured every two weeks. The temperature (°C) was determined using a mercury in glass thermometer, while the pH was measured using a Metrohm Herisau E520 pH meter. Dissolved oxygen concentration was determined through the Winkler-Azide method [14]. Chemical oxygen demand (COD) was determined titrimetrically, while biological oxygen demand (BOD) was determined using the incubation method at 20°C for five days [15]. The total ammonia nitrogen concentration was determined using the phenate method [16], while nitrate was determined using spectrophotometry [14]. By assuming 16% of protein is nitrogen and 46% carbon in rice bran, the amount of carbon to be added was calculated following. The total feed consumed per day was estimated, and the C:N was adjusted daily to 15:1 by adding treatments C of untreated, fermented, or hydrolyzed rice bran. The treatment carbon was mixed with 1 liter of water from the treatment before being added to the experimental setup. Biofloc volume (ml/L) was measured every 14 days for each experimental treatment using an Imhoff cone. The floc solution was allowed to settle down for one hour before the reading was taken [17-19].

Data Collection

The total length (TL) of fish in centimeters from each replicate was measured from the tip of the snout to the end of the caudal fin using a meter rule. Body weight was measured using an electronic digital balance. At the end of the experiment, all fish in the tank were counted, and the survival rate was determined. Growth performance in each treatment was estimated by weighing 10 randomly selected fish from each treatment and replicates on a biweekly basis, and the following growth and condition indices parameters were estimated:

Absolute growth (ΔG, g) = (W2 – W1), g.

Absolute growth rate (AGR, g/day)= (W2−W1)/t Relative growth (RG %) = (W2 – W1/ W1) × 100

Specific growth rate weight (%∕day) = (ln mean final weight − ln mean initial weight)/ no. of culture days ×100,

Where W1 is the initial mean weight (g), W2 is the final mean weight ( g), and t is the experimental duration.

Survival (%) = (Number of harvested fish/ number of stocked fish) × 100,

FCR = Total Feed fed (g)/Total wet weight gain (g).

Protein efficiency ratio PER = (Body weight gain g)/protein intake g)

Condition factor (CF) = [Body weight, g)/ Body length, cm3)] ×100 [20]

Hepatosomatic index (HIS) = (Liver weight, g)/(Whole body weight, g) ×100

Viscerosomatic index (VSI) = (Viscera weight, g)/ (Whole body weight, g) ×100

Statistical Analysis

Results were presented as mean ± SD. A one-way ANOVA was used to analyze the data, and the means werecompared using Duncan’s multiple range test. All the analyses were performed using SPSS 21.

Results

Water Quality Parameters

The average temperature recorded in this experiment did not differ significantly among all treatments (Table 1). A significant lower (p < 0.05) dissolved oxygen (DO) level was observed in FRB (5.95 ± 0.40 mg/L) compared to RBB (6.55 ± 0.50 mg/L) and HFRB (6.15 ± 0.10 mg/L). The highest DO and COD levels were recorded in the RBB treatment (Table 1). The average values for biological oxygen demand (BOD), total dissolved solids (TDS), and pH were highest in RBB treatment, while TDS and BOD had the highest average values in FRB treatment. HFRB treatment recorded the highest average value for nitrite. A significantly lower value of pH (6.75) was recorded in HFRB treatment (p < 0.05).

Table 1: Physicochemical parameters of water in a catfish biofloc system where rice bran, fermented rice bran, and hydrolyzed fermented rice bran (HFRB) were used as carbon sources.

Carbon sources
 

Parameters

Rice bran (RBB) Fermented rice bran (FRB) Hydrolyzed fermented rice bran (HFRB)

Significant level

Temp °C

27.80 ± 0.30a

27.50 ± 0.50a 27.60 ± 0.40a

P > 0.05

pH

7.70 ± 0.10a

7.20 ± 0.35b 6.75 ± 0.50c

P < 0.05

TDS (mg/l)

195.00 ± 10.00a

243.00 ± 15.50b 205.00 ± 18.50c

P < 0.05

COD (mg/l)

102.50 ± 5.50a

115.20 ± 8.70b 98.00 ± 5.50b

P < 0.05

BOD (mg/l)

55.50 ± 6.50a

60.45 ± 10.50a 41.50 ± 8.00b

P < 0.05

DO (mg/l)

6.55 ± 0.5a

5.95 ± 0.4ab 6.15 ± 0.10b

P < 0.05

TAN (mg/l)

3.85 ± 0.55a

2.52 ± .0.45b 2.60 ± 0.50b

P < 0.05

Nitrite (mg/l)

0.35± 0.10a

0.30± 0.10b 0.33 ± 0.10c

P < 0.05

Means with a different superscript in the same row are significantly different (P < 0.05).

Floc Production

The biofloc volume was significantly higher in HFRB starting from week 2 of the experiment compared to all other treatments (Figure 1). The floc volume reached maximum in week 7 with values of 135.1 ml/l, 166.6 ml/l, and 111.0 ml/l for HFRB, FRB, and RBB treatments, respectively.

fig 1

Figure 1: Floc production in the catfish biofloc system where rice bran, fermented rice bran, and hydrolyzed fermented rice bran were used as carbon sources.

Growth Parameters and Feed Efficiency

The growth rates, survival, and feed utilization of catfish in the biofloc system for the 8 weeks of rearing (Table 2) showed that treatment of rice bran through solid phase fermentation and acid hydrolysis enhanced its utilization as carbon sources in biofloc as the final weight and specific growth rates were higher compared with untreated rice bran. The highest final weight (85.5 g) was recorded in HFRB treatment, while the lowest value of weight gain (80.26) was in RBB. The feed conversion ratio was also highest in HFRB treatment. The survival was however lowest in HFRB, and this was significant (P < 0.05). The growth of catfish in biofloc utilizing hydrolyzed fermented rice bran as a carbon source in this experiment was better than that in untreated bran, as the growth rates were higher. The best FCR obtained for catfish (1.52 ± 0.05) was recorded in HFRB treatment, and this was significantly higher (P < 0.05). The percentage survival was significantly lower in HFRB treatment (P < 0.05).

Table 2: Growth parameters of catfish reared in a biofloc system where rice bran, fermented rice bran, and hydrolyzed fermented rice bran were used as carbon sources.

Parameters

Rice bran (RBB) Fermented rice bran (FRB)

Hydrolyzed rice bran (HFRB)

Initial weight (g)

11.15 ± 1.60a

11.15 ± 1.60a

11.55 ± 1.60a

Final weight (g)

80.26 ± 3.20a

81.70 ± 2.50b

85.50 ± 2.55b

Absolute growth (g)

70.15 ± 2.80a

70.65 ± 1.80c

74.53 ± 1.50b

Absolute growth rates(g/day)

0.992 ± 0.03a

1.000 ± 0.03c

1.031 ± 0.02b

Relative growth (%)

8.643 ± 0.21a

8.695 ± 0.11a

8.964 ± 0.10b

Specific growth rate(%/day)

1.211 ± 0.16a

1.23 ± 0.14a

1.28 ± 0.13b

Survival%

92 ± 1.55a

95 ± 1.50a

86 ± 1.52b

Feed conversion ratio

1.65 ± 0.04a

1.68 ± 0.03a

1.52 ± 0.05b

Protein efficiency ratio

0.403 ± 0.03a

0.405 ± 0.04a

0.421 ± 0.05b

Means (n=10) followed by different letters in each rows are significantly different (P < 0.05).

Condition Indices

Condition factor (Fulton factor) calculated showed that catfish in the FRB treatment had higher values (0.54) followed by those in RBB (0.47) and HFRB (0.44) treatment fishes (Figure 2). Similar trends were observed with hepatosomatic index and viscerosomatic index in this experiment. The HIS showed a significantly higher value of 5.9% in the FRB treatment (P < 0.05).

fig 2

Figure 2: HIS (hepatosomatic index), CF (condition factor), VSI (viscerosomatic index) African catfish, C. gariepinus fingerlings reared in a biofloc system where rice bran, fermented rice bran, and hydrolyzed fermented rice bran were used as carbon sources.

Discussion

This experiment demonstrated that differential treatment of rice bran influenced its performance as a carbon source in biofloc production of catfish. Even though fermented bran has been well researched in this system, our findings suggest that acid-hydrolyzed fermented rice bran also has potential for consideration as well. Acid hydrolysis of rice bran resulted in the conversion of its starch and cellulose components into reducing sugar [11]. This may improve its performance in carbon release in the biofloc system. Slow carbon release by rice bran has been attributed to its low performance as a biofloc carbon source [5,21]. Rice bran is a cheap carbon source; efforts towards boosting its carbon release have been the focus of research. All the water quality parameters recorded in the system were within the range recommended for aquaculture and catfish production. Temperature is an important ecological factor with a profound effect on fitness, growth, and metabolism performance in aquatic organisms [22-24]. Variations in the temperature in our research were not significant, indicating no external influence on the treatment used. DO is an important abiotic factor influencing the growth and survival of fish. A significant reduction in the level of dissolved oxygen (DO) observed in FRB compared to the rest of the treatment could be due to higher microorganisms in this system, as reported in previous findings [25-27]. The pH range of 7-8.5 was said to be suitable for biofloc system performance, while recommends an average pH of 6.7, as biofloc systems tend to lose their buffering capacity at lower pH. The stability of the bioflocs was found to be dictated by the pH. All the treatments used in the current research maintained the pH of catfish biofloc within the recommended range [28-31], even though the pH level in the HFRB treatment was significantly lower (P < 0.05). Recovery of the acid after the hydrolysis process is a major bottleneck, and this informed our modified method for reducing acid utilization in the hydrolysis process. Future research towards optimizing acid hydrolysis of bran for biofloc carbon usage may be important. The survival rates of RBB and FRB treatments were significantly higher (P < 0.05) than HFRB treatments. This may be connected to lower pH in HFRB treatment. In this study, a higher concentration of total ammonium nitrate was recorded in HFRB treatment even though not significant (P > 0.05). This is in line with the findings of [27,32], who reported the use of complex carbon such as bran to decrease ammonia concentration in biofloc when compared to other carbon sources with simple sugar. The growth parameters of the catfish in the biofloc system after 8 weeks of rearing in this experiment showed that treatment of rice bran through solid phase fermentation and fermentation after acid hydrolysis enhanced its utilization as carbon sources in biofloc as the final weight and specific growth rates were higher compared with untreated rice bran. Organosomatic indices of catfish in this research showed a direct link between the effects of change in carbon source and environment on the fish; the response in such indices in response to nutrition has been well reported [33,34]. The use of acid-hydrolyzed fermented bran in this research proved efficacious in the system, as the growth parameters of this fish therefrom were well above the untreated rice bran treatment. The floc level was also higher in the hydrolyzed fermented bran treatment in this research. The observed drawback in this use of hydrolyzed bran is the low pH produced in the biofloc system. This might account for the reduced survival rates of the fish in this system. In conclusion, the results of this study suggest that hydrolyzed fermented rice bran can be used in catfish biofloc systems as a carbon source without negative consequences on water quality, growth, and feed utilization. However, adjusting the pH may be required for better performance and is recommended. Further research is needed to investigate the optimal hydrolization condition of bran for their usage as carbon sources in biofloc systems.

Acknowledgements

We would like to thank, Umaru Musa Yar’Adua University for their technical assistance. This work was supported by the Tertiary Education Trust Fund, Nigeria.

References

  1. Okomoda VT, Koh ICC, Shahreza SM (2018) A simple technique for accurate estimation of fertilization rate with specific application to Clarias gariepinus (Burchell 1822). Aquaculture Research 49(2).
  2. Tesfahun A (2018) Feeding biology of the African catfish Clarias gariepinus (Burchell) in some of Ethiopian lakes: a International Journal of Fauna and Biological Studies 5(1) 19-23.
  3. Babatunde TA, Ibrahim K, Abdulkarim B, Wagini NH (2019) Co-production and biomass yield of amaranthus (Amaranthus hybridus) and tilapia (Oreochromis niloticus) in gravel-based substrate filter aquaponics. International Journal of Recycling of Organic Waste in Agriculture V(8): 1-7.
  4. Chauhan RS, Mishra A (2022) New innovative technologies for sustainable aqua In Biodiversity 97-111 CRC Press.
  5. Dauda AB, Romano N, Ebrahimi M, Karim M, Natrah I, et al. (2017) Different carbon sources affects biofloc volume water quality and the survival and physiology of African catfish Clarias gariepinus fingerlings reared in an intensive biofloc technology system. Fisheries Science 83(6).
  6. Minabi K, Sourinejad I, Alizadeh M, Ghatrami ER, Khanjani MH (2020) Effects of different carbon to nitrogen ratios in the biofloc system on water quality growth and body composition of common carp Cyprinus carpio L fingerlings. Aquaculture International 28(5).
  7. Hargreaves JA (2013) Biofloc production systems for aquaculture 4503 1-11 Stoneville MS USA: Southern Regional Aquaculture Center.
  8. Bakhshi F, Najdegerami EH, Manaffar R, Tukmechi A, Farah KR (2018) Use of different carbon sources for the biofloc system during the grow-out culture of common carp Cyprinus carpio L fingerlings. Aquaculture 484: 259-267.
  9. Sasikumar R, Saranya S, Lincy LL, Sathyan A, Chellapandi P (2024) Fermented rice extract as a carbon source for biomass production of aquaculture Biomass Conversion and Biorefinery 1-9.
  10. Arreola LR, Quiroz-Guzmán E, Caballero JL, García EIP, Murueta JHC, et (2023) Shrimp Hepatopancreatic Crude Enzymes as Aids in Rice Bran Hydrolysis: Potential Contributors to Sustainable Aquaculture Turkish Journal of Fisheries and Aquatic Sciences 23(9).
  11. Sutanto S, Go AW, Chen KH, Nguyen PLT, Ismadji S, et (2017) Release of sugar by acid hydrolysis from rice bran for single cell oil production and subsequent in-situ transesterification for biodiesel preparation. Fuel Processing Technology 16: 7281-291.
  12. Christ-Ribeiro A, Chiattoni LM, Mafaldo CRF, Badiale-Furlong E, de Souza-Soares LA (2021) Fermented rice-bran by Saccharomyces cerevisiae: Nutritious ingredient in the formulation of gluten-free cookies. Food Bioscience V(40).
  13. Chinma C, Ilowefah M, Muhammad K (2013) Optimization of Rice Bran Fermentation Conditions Enhanced by Baker’s Yeast for Extraction of Protein Nigerian Food Journal 321: 126-132.
  14. APHA (1998) Standard Methods for the Examination of Water and Wastewater (20th Ed) American Public Health Association American Water Works Association Water Environmental Federation Washington DC.
  15. APHA (2012) Standard methods for the examination of water and waste water 19th edition American Public Health Association Inc New York 1193.
  16. APHA (1985) Standard methods for the examination of water and wastewater, 15th American Public Health Association (APHA), New York.
  17. Choi HJ (2020) Agricultural biowaste rice bran as carbon source to enhance biomass and lipid production: analysis with various growth rate models. Water Science and Technology 82(6).
  18. Avnimelech Y (1999) Carbon/nitrogen ratio as a control element in aquaculture Aquaculture 176: 227–235.
  19. Saeedi KH, Chapara M (2024) Isolation, Identification, and Biofloc Production: Potential of Floc-Forming Bacteria Using a Novel Monoculture Approach and Aquaculture Studies 24(4).
  20. Fulton T (1902) Rate of Growth of Sea Fish 20th Annual Report of the Fishery Board for Scotland London.
  21. Mahadik PU, Wasave SS, Chavan BR, Meshram SJ, Ghode GS, et (2024) Effect of fermented rice bran as a carbon source for rearing genetically improved farmed Tilapia Oreochromis niloticus Linnaeus 1758 fry in biofloc system. Aquaculture V(592).
  22. Pekkoh J, Chaichana C, Thurakit T, Phinyo K, Lomakool S, et al. (2022) Dual- bioaugmentation strategy to enhance the formation of algal-bacteria symbiosis biofloc in aquaculture wastewater supplemented with agricultural wastes as an alternative nutrient sources and biomass support materials. Bioresource Technology V (359).
  23. Abakari G, Luo G, Kombat EO, Alhassan EH (2021) Supplemental carbon sources applied in biofloc technology aquaculture systems: Types effects and future Reviews in Aquaculture 13: 1193-1222.
  24. Green BS, Fisher R (2004) Temperature influences swimming speed growth and larval duration in coral reef fish Journal of Experimental Marine Biology and Ecology 299(1).
  25. Taylor JC, Miller JM (2001) Physiological performance of juvenile southern flounder Paralichthys lethostigma Jordan and Gilbert 1884 in chronic and episodic hypoxia. Journal of Experimental Marine Biology and Ecology 25(82).
  26. Adineh H, Naderi M, Jafaryan H, Khademi Hamidi M, Yousefi M, et (2022) Effect of stocking density and dietary protein level in biofloc system on the growth digestive and antioxidant enzyme activities health and resistance to acute crowding stress in juvenile common carp (Cyprinus carpio). Aquaculture Nutrition 1-12.
  27. Ajamhasani E, Akrami R, Najdegerami EH, Chitsaz H, Shamloofar M (2023) Different carbon sources and probiotics in biofloc based common carp (Cyprinus carpio) culture: Effects on water quality growth performance fish welfare and liver Journal of the World Aquaculture Society 54(6).
  28. Pérez-Rostro CI, Pérez-Fuentes JA, Hernández-Vergara MP (2014) Biofloc a technical alternative for culturing Malaysian prawn Macrobrachium rosenbergii. Sustainable Aquaculture Techniques 87-104.
  29. Azim ME, Little DC (2008) The biofloc technology (BFT) in indoor tanks: water quality biofloc composition and growth and welfare of Nile tilapia (Oreochromis niloticus). Aquaculture 283: 29-35.
  30. De Schryver P, Crab R, Defoirdt T, Boon N, Verstraete W (2008) The basics of bio- flocs technology: the added value for aquaculture. Aquaculture 277(3-4).
  31. Yustiati A, Ayuningtyas AP, Andriani Y (2023) The Effectiveness of the Red Water System RWS Technique in African Catfish Culture Clarias gariepinus: A review. Asian Journal of Fisheries and Aquatic Research 23(3).
  32. Abiri SA, Chitsaz H, Najdegerami EH, Akrami R, Jalali AS (2022) Influence of wheat and rice bran fermentation on water quality growth performance and health status of Common carp (Cyprinus carpio L) juveniles in a biofloc-based Aquaculture V(555).
  33. Akani NP, Daka ER (2015) Evaluation of weight changes condition factor and organosomatic indices of Clarias gariepinus exposed to sub-lethal concentrations of an oilfield wastewater. Current Studies in Comparative Education Science and Technology 2(2).
  34. Eroldoğan OT, Kumlu METİN, Aktaş M (2004) Optimum feeding rates for European sea bass Dicentrarchus labrax L reared in seawater and freshwater. Aquaculture 231(1-4).

Participation of the Leukemia Inhibitory Factor on Ovarian Function

DOI: 10.31038/EDMJ.2024833

Abstract

Leukaemia inhibitory factor (LIF), a cytokine in the interleukin 6 family, is considered a pleiotropic molecule with diverse functions and is expressed in different tissues and cell types. The role of LIF in the reproductive system during the implantation process has been described; however, to date, there is little available information about the effect of LIF on the function and development of the female gonad. The focus of this review is to analyse the structure of LIF, the signalling pathway involved, and the expression of LIF and its receptor in different ovarian cell types. In addition, the participation of LIF and its receptor in ovarian function, follicular development, steroidogenesis and ovulation is discussed.

Introduction

Leukaemia inhibitory factor (LIF) is a cytokine that belongs to the interleukin 6 (IL-6) family and is considered a pleiotropic molecule since it is expressed in different tissues and cell types and has diverse functions. The first observed effect of LIF was its ability to function as a differentiation inducer and proliferation inhibitor of the myeloid leukemic cell line (M1) to macrophages in an in vitro model [18]. Other specific functions of LIF have been reported, such as its participation in bone resorption [36,37] neonatal neuronal transdifferentiation [40,41] and its involvement in cardiac remodelling [19-21], folliculogenesis and spermatogenesis [14]

Currently, the study of this cytokine in the female reproductive system has attracted interest since it is found in different tissues of the female reproductive system [22]. LIF was initially discovered to be necessary for the uterine implantation process [10], and in recent decades, it has been found to be present in the oviduct [23] and ovary, but its functions at these levels have not been fully understood. In the ovaries of different species and from different study models, both in vitro and in vivo, LIF has been shown to fulfil important functions depending on folliculogenesis stage, mainly during the neonatal and fertile periods of female reproductive life; however, the role of LIF during the female subfertile period is unclear. Therefore, in the present review, we discuss the available data on the role of LIF in ovarian folliculogenesis during female reproductive life.

Lif and Its Receptor

LIF is a protein with an approximate molecular weight of 20 kDa, but its molecular weight can range from 38-67 kDa due to differences in posttranslational modifications [38,39]. Among the modifications that mature proteins present are glycosylations, which are mainly associated with asparagine residues. Although glycosylations explain, to some extent, the variations in the molecular weight of LIF (38-67 kDa) [3], we still cannot determine how the glycosylation pattern affects the function and stability of the protein. LIF is described as long-chain cytokine with four α-helices in an up-down-up configuration, as has also been shown for other IL-6 family members such as ciliary neurotrophic factor (CNTF), growth hormone (GH), granulocyte colony-stimulating factor [42,45] Although a low degree of homology is observed between the primary structures of these cytokines, they show a high degree of homology in their tertiary structures and in the functional epitopes of their receptors, as demonstrated by X-ray crystallography resonance imaging [43].

Lif Receptors as a Heterodimer and Associated Signalling Pathways

For LIF to carry out its action, it must interact with a heterodimeric plasmatic membrane receptor formed by two proteins, gp130 and LIFRβ. The LIFRβ subunit which can also interact with other cytokines of the IL-6 family, such as CNTF and oncostatin M and the gp130 is a subunit common for all IL-6 family cytokines [46]. LIF interacts specifically and directly with the LIFRβ subunit but with a relatively low affinity (Kd=1∗10−9). When the gp130 subunit interacts with the LIF-LIFRβ complex, a high-affinity trimeric LIF-LIFRβ-gp130 complex is formed (Kd=1∗10^−10), which is necessary for receptor activation and therefore intracellular signalling [24]. The interaction between LIF and LIFRβ is 80-fold greater than that between LIF and gp130, which is not surprising given that gp130 also interacts with other cytokines [25].

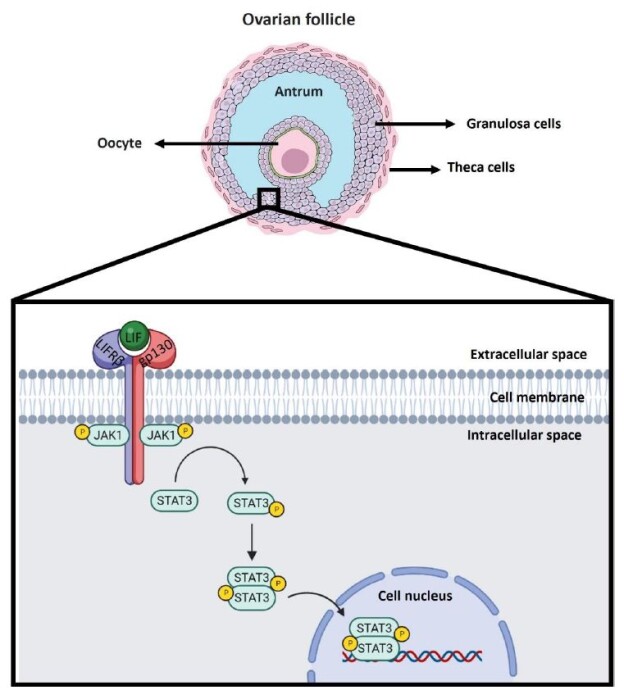
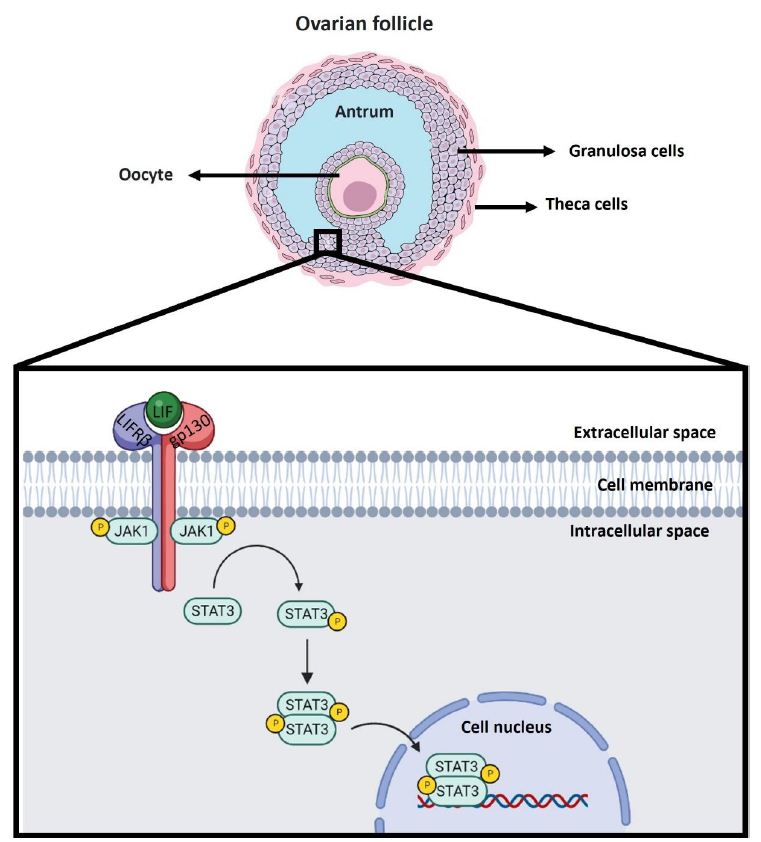
IL-6 family cytokine-associated receptors do not exhibit kinase activity. The binding of LIF to its heteroreceptor causes conformational changes in the subunits that allow cytoplasmic activation of Janus kinase (JAK), tyrosine phosphorylation of the heteroreceptor and phosphorylation of signal transducer and activator of transcription (STAT). It has been observed that LIF can activate the JAK1/STAT3 pathway, which is considered to be the canonical signalling pathway involved (Figure 1), but importantly, the JAK/STAT signalling cascade is a signalling pathway shared by several cytokine receptors [47]. In addition to activating the JAK/STAT pathway, the interaction between LIF and LIFR can activate other signalling pathways, such as the mitogen-activated protein kinase (MAPK) and phosphoinositide 3-kinase (PI3K) pathways; however, the effects vary and may even be opposite depending on the cell type involved, having been observed to either induce or inhibit cell differentiation in a variety of cases [48].

fig 1

Figure 1: Canonical LIF signaling pathway in the ovarian follicle. LIF is expressed in the ovaries of various animal models, such as mice, rats, nonhuman primates, and humans. Specifically, it has been observed that LIF is expressed in different ovarian cells such as theca cells, granulosa cells and oocyte. In the scheme, granulosa cells of antral follicles are used as an example of localization of the signaling cascade associated with LIF. The LIF molecule is shown in green. The LIF receptor as a heterodimer consists of the LIFRβ subunit in blue and the gp130 subunit in red. Upon interaction of LIF with the LIFRβ subunit of the LIF receptor, the gp130 subunit is recruited to form the heterotrimer. When this occurs the signaling cascade is triggered where JAK1 phosphorylation is induced to be activated. JAK1 upon activation subsequently phosphorylates STAT3 so that it can homodimerize and translocate to the nucleus to act as a transcription factor in the regulation of gene expression.

Role of Lif in the Female Reproductive System

Function of Lif In Utero

It has been widely reported that LIF participates in the implantation process in the uterus of several mammals [50,51]. An increase in LIF levels in utero has been observed at 2 crucial moments of pregnancy: the first is in the oestrus stage, coinciding with the ovulation process [57], and the second is on the 4th and 5th days of pregnancy. In situ hybridization has shown that LIF expression in pregnant mice is confined to the endometrial glands [39]. After the 5th day of pregnancy, once implantation and decidualization occur, the glands begin to degenerate, and LIF secretion ceases. This observation suggests that the peak LIF signal produced during pregnancy could be decisive at the time of implantation; this was corroborated in female LIF-deficient (LIF-/-) homozygous mice whose ova fertilized by either LIF-/- or wild-type (WT) males reached the blastocyst stage without problems. However, these mice could not reach the implantation stage [49] when these embryos were transferred to a pseudopregnant WT female, the pregnancy reached full term, suggesting that the implantation failure was due to a maternal defect, which was essentially attributed to the lack of LIF. Based on these studies, LIF was found to be a fundamental factor in the implantation process. However, the action of LIF in this process is subject to regulation by other factors, including kisspeptin (KP).

KP is a key neuropeptide involved in the regulation of reproductive function through the hypothalamic-pituitary-gonadal (HPG) axis [52]. Despite the important role of the KP at the central level, it also regulates gonadotrophins secretion [26,27]. Calder et al. confirmed that KP (Kiss1-/-) deficient female mice mated with WT males are unable to achieve pregnancy due to implantation defects [11]. This finding led us to consider whether Kiss1-/- females lacked some determinant signals for the implantation process. In this regard, as mentioned above, studies have shown that LIF is an essential factor for the implantation process in mice. Indeed, a therapy based on the exogenous administration of recombinant LIF was able to partially rescue the implantation process in Kiss1-/- females. Based on these findings, it was hypothesized that LIF expression was reduced in female Kiss1-/- mice, which was subsequently confirmed by the marked reduction in LIF expression at the level of the uterine glandular lumen in Kiss1-/- females compared to WT female mice. This is the first study to demonstrate that uterine KP signalling regulates glandular levels of LIF.

Function of Lif in Ovary

LIF is expressed not only in endometrial tissue in the female reproductive system but also in the ovary (Senturk & Arici 1998). LIF is expressed in the ovaries of various animal models, such as mice, rats, nonhuman primates, and humans [5,6,31,32]. During the fertile stage in human and nonhuman primates, LIF has been shown to be present in the follicular fluid of preovulatory follicles [30]. In rats, ovarian LIF levels change during the oestrous cycle, with the highest levels being observed at the night of proestrus, corresponding to oestrus and metaestrus/diestrous [28,29]. We have seen in a rat model that the ovarian expression of LIF, in addition to being different during the oestrous cycle, is different during the reproductive life of the rat, as indicated by a greater expression of this cytokine in the fertile stage and a markedly lower expression during lactation. In neonatal rats, LIF is localized to granulosa cells in primordial and primary follicles and in oocytes [53]. In mouse ovaries, LIF is localized to cumulus cells and oocytes from antral follicles. In these cells, the intensity of the LIF marker increases in growing and mature follicles [54]. According to the IHC technique, LIF is localized in theca cells, granulosa cells and oocytes from healthy antral follicles and mainly in luteal cells of the corpus luteum in fertile rats in the oestrous stage [58]. These data suggest a possible autocrine/paracrine role of LIF during the neonatal and fertile periods in females, as well as a role in the stages of cyclical recruitment, ovulation, corpora lutea development and steroid hormone production.

This paracrine or autocrine action of LIF is suggested by the fact that ovarian cells express LIF receptors. The LIF receptor has been found to localize to different ovarian follicular cells in different species [44]. In the ovaries of fertile female monkeys, LIFRβ and gp130 (also known as IL6ST) are localized by IHQ in theca cells and granulosa cells of antral follicles [33]. In humans, LIFRβ and gp130 have been identified by RT‒qPCR and IHQ in granulosa cells and oocytes from primordial follicles of foetal ovaries and in granulosa cells from primary and secondary follicles in adult ovaries [1]. The activation of the LIF receptor in ovarian follicular cells of monkeys in the fertile stage and in the human granulosa cell line COV434 is related to the signalling pathway corresponding to JAK1/STAT3 (Figure 1) and phosphorylated STAT3 after an ovulatory stimulus [35]. On the other hand, in vitro studies in pig ovaries revealed an increase in the phosphorylated form of STAT3 associated with the cumulus–oocyte complex [34]. We recently reported that, in rat ovaries incubated with LIF for 30 minutes, STAT3 phosphorylation increases [37]. LIF and its receptors can activate other signalling pathways [23] in a paracrine or autocrine manner. It must be determined whether these signalling pathways can also be activated in the ovary, for which further studies are needed.

Participation of LIF in Follicular Recruitment

LIF has been shown to promote the transition from primordial to preantral follicle in a neonatal rat and goat in vitro study [58,59] and it has been proposed that this effect in rats is indirect and mediated by an increase in the expression of kit ligand (KL), a known factor that promotes the passage from primordial to primary follicles. We recently published results that support the idea that chronic treatment with LIF for 28 days in vivo decreases the total number of small primary and secondary follicles in the ovaries of fertile rats. In contrast, the number of primordial follicles does not change with LIF treatment and therefore does not explain the decrease found in primary and secondary follicles. LIF has been shown to decrease the growth of developing follicles both in vitro in prepubertal mice [55] and in vivo in fertile rats [56] Specifically, it has been observed in vitro that both secondary and antral follicles are small in size when ovaries are incubated with LIF [60]. This decrease in the development of preantral follicles disagrees with the results of Nilsson et al. and may be due to the chronic in vivo treatment of LIF. However, the effects of LIF on apoptosis are still controversial [16]. To determine whether LIF induces apoptosis in vivo, it is necessary to carry out studies with shorter treatment durations because at 28 days, no pyknotic nuclei were observed during the morphology analysis. LIF regulates the recruitment of primordial follicles, which is relevant for maintaining the cohort of reserve follicles in the ovary. Its effect could be associated with the maintenance and avoidance of a massive loss of the ovarian follicular reserve during reproductive life. Studies focused on the subfertility stage are also necessary.

Follicular atresia corresponds to the degeneration or death of the ovarian follicle so that healthy follicles can develop normally, while defective follicles degenerate and die by apoptosis or autophagy, depending on the stage of follicular development [12,51]. Autophagic atresia has been documented to occur mainly in preantral follicles, whereas apoptosis-induced atresia occurs mainly at the antral follicle stage during cyclical recruitment. It has been observed that atresia in antral follicles is due to the lack of FSH signalling [53] and that this process is associated with the activation of the LIF-STAT3 pathway in the granulosa cells of bovine ovarian follicles [24]. FSH is important for the selection and development of antral follicles, mainly through cyclical recruitment [66]. However, treatment with LIF in rat ovaries for 28 days does not induce follicular atresia, and serum FSH levels do not change with respect to those of the control at the end of treatment. These results suggest that LIF alone does not have an effect on follicular atresia, and it is probable that atresia due to lack of FSH is due to another mechanism and not through LIF.

Participation of LIF in Ovulation and Corpus Lutea

The effect of LIF on ovulation has been evaluated by Murphy et al., 2016. In this work, LIF concentrations were determined in the follicular fluid of preovulatory follicles of fertile female rhesus macaques, and an increase in LIF was observed after hCG administration as an ovulatory stimulus and prior to ovulation. A similar phenomenon has been observed in follicular fluid from preovulatory follicles in humans after hCG has been administered [13]. These results support the premise that LIF is produced in granulosa cells, cumulus cells, and oocytes, as has been observed in rodents [65]. LIF is produced during all stages of follicular development, apparently regulating the growth and maturation of follicles and oocytes and ultimately contributing to ovulation. In summary, the data suggest that LH can stimulate the production and secretion of LIF in granulosa cells, specifically in preovulatory follicles, which express the LH receptor (LHR), to promote ovulation. For example, the administration of hCG (500 IU/ml) provoked a significant increase in intrauterine LIF, VEGF and MMP-9 (Licht et al., 2007).

There are no data in humans that evaluate the effect of LIF on ovulation itself, but when determining the concentration of LIF in the follicular fluid and in the serum of women suffering from polycystic ovarian syndrome (PCOS), a condition characterized by oligo- or anovulation, women with PCOS have decreased levels of LIF compared to what is observed in control women [64]. A study carried out in a rat model revealed that local LIF administration to the ovary for 28 days can increase the number of large corpora lutea and the serum progesterone concentration at the end of 28 days of treatment with LIF. Large corpora lutea are associated with recent ovulation of preovulatory follicles and increased progesterone production [15]. This is because the luteal cells of newly formed corpora lutea express higher levels of 3β-hydroxysteroid dehydrogenase (3β-HSD) than do those of involuting corpora lutea (from previous ovulations), suggesting that LIF could be important for the ovulatory process. In addition, luteal cells present positive immunoreactivity for LIF in the ovaries of fertile rats, and the highest levels of the messenger RNA that codes for LIF are detected in oestrous and metaestrus/diestrus [63], stages of the oestrous cycle, where the greatest amount of progesterone is produced and newly formed corpora lutea are observed. It is possible that LIF may also influence the survival of the corpora lutea, but this possibility requires further study. LIF not only locally regulates the ovulatory process but also participates at the central nervous system level. LIF induces an increase in GnRH at the hypothalamic level, regulating reproductive function locally in the gonad and in the central nervous system [17].

LIF Involvement in Ovarian Steroidogenesis

However, studies regarding the effect of LIF on steroidogenesis are rare. The first observations of the possible effect of LIF on this process were obtained from experiments carried out in the adrenal cortex and in the human adrenocortical cell line NCI-H295R, where the results indicated that LIF could increase the secretion of cortisol and aldosterone through a mechanism mediated by ACTH [4,8]. On the basis of these findings, LIF can increase the expression of the regulatory protein of acute steroidogenesis (StAR) [62], and in vitro studies of Leydig cells from immature rats incubated with different concentrations of LIF revealed that at low concentrations, this cytokine could increase androgen production, apparently increasing the expression of StAR and 17-hydroxysteroid dehydrogenase 3 (Hsd17b3) [61]. In both cases, LIF can increase the expression of the StAR protein in vitro, which suggests, on the one hand, that the increase in steroid hormone levels in vitro is due to this effect and, on the other hand, that this phenomenon could be replicated in cells of other steroidogenic tissues, such as the ovary. However, until now, there has been no published evidence supporting the involvement of LIF in enzymes or transporters involved in ovarian steroidogenesis.

Conclusions and Perspectives

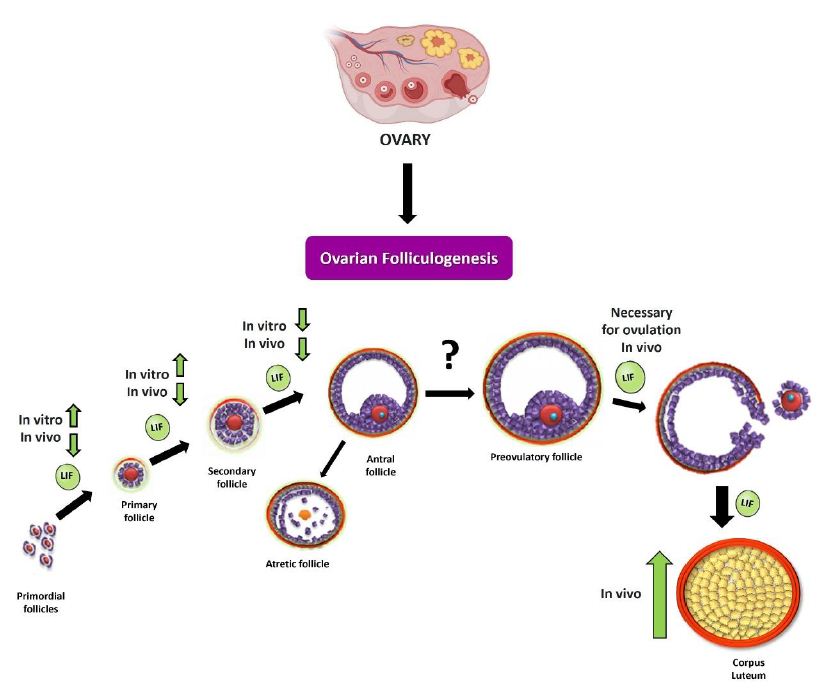
LIF is a pleiotropic cytokine that has various functions and activates various intracellular signalling pathways, depending on the cell type and tissue in which it participates. The LIF-LIFR system has been studied in the immune system and cancer, and its therapeutic role has been studied in various pathologies; its participation in the implantation process and therapeutic use in the reproductive system have been described. Recently, publications on the role of the male gonad in development and spermatogenesis have emerged. In this review, we analysed the participation of LIF in the ovary and discussed its possible signalling pathways and localization in different cell types in the female gonad. LIF is expressed at different levels during the oestrous cycle stage, and during ovary development, it participates in follicular development, ovulation (Figure 2) and steroidogenesis. We cannot exclude our analysis because, in the context of infertility pathology caused by ovarian dysfunction, LIF could also play a key role in considering future therapy or therapeutic use, but further studies are needed.

fig 2

Figure 2: Summary scheme of the effects of LIF on ovarian folliculogenesis. As discussed in the review, LIF can modulate the different stages of ovarian folliculogenesis in vitro and in vivo. During initial recruitment (passage from primordial follicle to preantal follicle), LIF promotes recruitment by increasing the number of developing follicles (primary and secondary follicles) in an in vitro neonatal ovary model [43]. In the fertile stage, LIF produces a decrease in the number of preantral follicles, in an in vivo model [48]. In studies carried out in the prepubertal stage [27] and in the fertile stage, it is observed that LIF decreases the size and number of antral follicles. It has also been observed that LIF is necessary for ovulation to occur [41], which could be closely related to the increase in the number of large corpora lutea following chronic treatment with this cytokine.

References

  1. Abir R, Fisch B, Jin S, Barnnet M, Freimann S, van den Hurk R, Feldberg D, Nitke S, Krissi H, Ao A, et al. (2004) Immunocytochemical detection and RT-PCR expression of leukaemia inhibitory factor and its receptor in human fetal and adult ovaries. Molecular Human Reproduction 10: 313-319. [crossref]
  2. Acuña E, Fornes R, Fernandois D, Garrido MP, Greiner M, Lara HE, Paredes AH, et al. (2009) Increases in norepinephrine release and ovarian cyst formation during ageing in the rat. Reproductive Biology and Endocrinology 7. [crossref]
  3. Aikawa J, Sato E, Kyuwa S, Sato E, Sasai K, Shiota K, Ogawa T, et al. (1998) Asparagine-linked glycosylation of the rat leukemia inhibitory factor expressed by simian COS7 cells. Bioscience, Biotechnology, and Biochemistry 62: 1318-1325. [crossref]
  4. Akita S, Webster J, Ren SG, Takino H, Said J, Zand O, Melmed S (1995) Human and Murine Pituitary Expression of Leukemia Inhibitory Factor: Novel Intrapituitary Regulation of Adrenocorticotropin Hormone Synthesis and Secretion. Journal of Clinical Investigation 95: 1288-1298. [crossref]
  5. Arici A, Oral E, Bahtiyar O, Engin O, Seli E, Jones EE, et al. (1997) Leukaemia inhibitory factor expression in human follicular fluid and ovarian cells. Human Reproduction Vol 12: 1233-1239. [crossref]
  6. Fukada K, Korsching S, Towle MF (1997) Tissue-specific and ontogenetic regulation of LIF protein levels determined by quantitative enzyme immunoassay. Growth Factors 14: 279-295. [crossref]
  7. Auernhammer CJ, Melmed S (2000) Leukemia-Inhibitory Factor-Neuroimmune Modulator of Endocrine Function. Endocrine Reviews 21: 313-345. [crossref]
  8. Bamberger A, Schulte H, Wullbrand A, Jung R, Beil F, Bamberger C (2000) Expression of leukemia inhibitory factor (LIF) and LIF receptor (LIF-R) in the human adrenal cortex: implications for steroidogenesis. Molecular and Cellular Endocrinology 162: 145-149. [crossref]
  9. Bazan JF (1991) Neuropoietic Cytokines in the Hematopoietic Fold. Neuron 7: 197-208. [crossref]
  10. Bhatt H, Brunet LJ, Stewart CL (1991) Uterine expression of leukemia inhibitory factor coincides with the onset of blastocyst implantation. Developmental Biology 88: 11408-11412. [crossref]
  11. Calder M, Chan YM, Raj R, Pampillo M, Elbert A, Noonan M, Gillio-Meina C, Caligioni C, Bérubé NG, Bhattacharya M, et al. (2014) Implantation failure in female Kiss1-/- mice is independent of their hypogonadic state and can be partially rescued by leukemia inhibitory factor. Endocrinology 155: 3065-3078. [crossref]
  12. Chun S-Y, Eisenhauer KM, Minami S, Billig H, Perlas E, Hsueh AJW (1996) Hormonal Regulation of Apoptosis in Early Antral Follicles: Follicle-Stimulating Hormone as a Major Survival Factor*. Endocrinology 137: 1447-1456. [crossref]
  13. Coskun S, Uzumcu M, Jaroudi K, Hollanders JMG, Parhar RS, Al-Sedairy ST (1998) Presence of leukemia inhibitory factor and interleukin-12 in human follicular fluid during follicular growth. American Journal of Reproductive Immunology 40: 13-18. [crossref]
  14. Curley M, Milne L, Smith S, Atanassova N, Rebourcet D, Darbey A, Hadoke PWF, Wells S, Smith LB, et al. (2018) Leukemia Inhibitory Factor-Receptor is Dispensable for Prenatal Testis Development but is Required in Sertoli cells for Normal Spermatogenesis in Mice. Scientific Reports 8: 1-13. [crossref]
  15. Davis JS, Rueda BR (2002) The corpus luteum: an ovarian structure with maternal instincts and suicidal tendencies. Frontiers in Bioscience 7: 1949-1978. [crossref]
  16. Dong J, Guo C, Zhou S, Zhao A, Li J, Mi Y, Zhang C (2022) Leukemia inhibitory factor prevents chicken follicular atresia through PI3K/AKT and Stat3 signaling pathways: LIF prevents chicken follicular atresia. Molecular and Cellular Endocrinology 543: 5789-5796. [crossref]
  17. Dozio E, Ruscica M, Galliera E, Corsi MM, Magni P (2009) Leptin, Ciliary Neurotrophic Factor, Leukemia Inhibitory Factor and In-terleukin-6: Class-I Cytokines Involved in the Neuroendocrine Regulation of the Reproductive Function. Current Protein and Peptide Science 10: 577-584. [crossref]
  18. Fahmi A, Smart N, Punn A, Jabr R, Marber M, Heads R (2013) P42/p44-MAPK and PI3K are sufficient for IL-6 family cytokines/gp130 to signal to hypertrophy and survival in cardiomyocytes in the absence of JAK/STAT activation. Cellular Signalling 25 898-909. [crossref]
  19. Gearing DP, Gough NM, King JA, Hilton DJ, Nicola NA, Simpson RJ, Nice EC, Kelso A, Metcalf D (1987) Molecular cloning and expression of cDNA encoding a murine myeloid leukaemia inhibitory factor (LIF) The EMBO Journal 6 3995-4002. [crossref]
  20. Gottsch ML, Cunningham MJ, Smith JT, Popa SM, Acohido BV, Crowley WF, Seminara S, Clifton DK, Steiner RA (2004) A role for kisspeptins in the regulation of gonadotropin secretion in the mouse. Endocrinology 145 4073-4077. [crossref]
  21. Harter CJL, Kavanagh GS, Smith JT (2018) The role of kisspeptin neurons in reproduction and metabolism. Journal of Endocrinology 238 R173-R183. [crossref]
  22. Hilton DJ (1992) LIF: lots of interesting functions. Trends in Biochemical Sciences 17 72-76. [crossref]
  23. Hinds MG, Maurer T, Zhang JG, Nicola NA, Norton RS (1998) Solution structure of leukemia inhibitory factor. Journal of Biological Chemistry 273 13738-13745. [crossref]
  24. Ilha GF, Rovani MT, Gasperin BG, Antoniazzi AQ, Gonçalves PBD, Bordignon V, Duggavathi R (2015) Lack of FSH support enhances LIF-STAT3 signaling in granulosa cells of atretic follicles in cattle. Reproduction 150 395-403. [crossref]
  25. Kanazawa H, Ieda M, Kimura K, Arai T, Kawaguchi-Manabe H, Matsuhashi T, Endo J, Sano M, Kawakami T, Kimura T, et al. (2010) Heart failure causes cholinergic transdifferentiation of cardiac sympathetic nerves via gp130-signaling cytokines in rodents. Journal of Clinical Investigation 120 408-421. [crossref]
  26. Keltz MD, Attar E, Buradagunta S, Olive DL, Kliman H, Arici A (1996) Modulation of leukemia inhibitory factor gene expression protein biosynthesis in the human fallopian tube. American Journal of Obstetrics and Gynecology 175 1611-1619. [crossref]
  27. Komatsu K, Koya T, Wang J, Yamashita M, Kikkawa F, Iwase A (2015) Analysis of the effect of leukemia inhibitory factor on follicular growth in cultured murine ovarian tissue. Biology of Reproduction 93 1-18. [crossref]
  28. Lass A, Weiser W, Munafo A, Loumaye E (2001) Leukemia inhibitory factor in human reproduction. Fertility and Sterility 76 1091-1096.
  29. Lecomte MJ, de Gois S, Guerci A, Ravassard P, Biguet NF, Mallet J, Berrard S (2005) Differential expression and regulation of the high-affinity choline transporter CHT1 and choline acetyltransferase in neurons of superior cervical ganglia. Molecular and Cellular Neuroscience 28 303-313. [crossref]
  30. Lédée-Bataille N, Laprée-Delage G, Taupin JL, Dubanchet S, Taieb J, Moreau JF, Chaouat G (2001) Follicular fluid concentration of leukaemia inhibitory factor is decreased among women with polycystic ovarian syndrome during assisted reproduction cycles. Human Reproduction 16 2073-2078. [crossref]
  31. Li Z, Zhu Y, Li H, Jiang W, Liu H, Yan J, Chen ZJ, Li W (2018) Leukaemia inhibitory factor in serum and follicular fluid of women with polycystic ovary syndrome and its correlation with IVF outcome. Reproductive BioMedicine Online 36 483-489. [crossref]
  32. Licht P, Fluhr H, Neuwinger J, Wallwiener D, Wildt L (2007) Is human chorionic gonadotropin directly involved in the regulation of human implantation? Molecular and Cellular Endocrinology 269 85-92. [crossref]
  33. Lovejoy B, Cascio D, Eisenberg D (1993) Crystal structure of canine and bovine granulocyte-colony stimulating factor (G-CSF) Journal of Molecular Biology 234 640-653. [crossref]
  34. Shen MM, Leder P (1992) Leukemia inhibitory factor is expressed by the preimplantation uterus and selectively blocks primitive ectoderm formation in vitro. Proceedings of the National Academy of Sciences 89 8240-8244. [crossref]
  35. Magni P, Dozio E, Ruscica M, Watanobe H, Cariboni A, Zaninetti R, Motta M, Maggi R (2007) Leukemia inhibitory factor induces the chemomigration of immortalized gonadotropin-releasing hormone neurons through the independent activation of the Janus kinase/signal transducer and activator of transcription 3, mitogen-activated protein kinase/extracellularly regulated kinase 1/2, and phosphatidylinositol 3-kinase/Akt signaling pathways. Molecular Endocrinology 21 1163-1174. [crossref]
  36. McDonald NQ, Panayotatos N, Hendrickson WA (1995) Crystal structure of dimeric human ciliary neurotrophic factor determined by MAD phasing. EMBO Journal 14 2689-2699. [crossref]
  37. Mcgee EA, Hsueh AJW (2000) Initial and Cyclic Recruitment of Ovarian Follicles. Endocrine Reviews 21 200-214. [crossref]
  38. Meng L, Jan SZ, Hamer G, van Pelt AM, van der Stelt I, Keijer J, Teerds KJ (2018) Preantral follicular atresia occurs mainly through autophagy, while antral follicles degenerate mostly through apoptosis. Biology of Reproduction 99 853-863. [crossref]
  39. Mikhaylova IV, Jääskeläinen T, Jääskeläinen J, Palvimo JJ, Voutilainen R (2008) Leukemia inhibitory factor as a regulator of steroidogenesis in human NCI-H295R adrenocortical cells. Journal of Endocrinology 199 435-444. [crossref]
  40. Mo X, Wu G, Yuan D, Jia B, Liu C, Zhu S, Hou Y (2014) Leukemia inhibitory factor enhances bovine oocyte maturation and early embryo development. Molecular Reproduction and Development 81 608-618. [crossref]
  41. Murphy MJ, Halow NG, Royer PA, Hennebold JD (2016) Leukemia inhibitory factor is necessary for ovulation in female rhesus macaques. Endocrinology 157 4378-4387. [crossref]
  42. Nicola NA, Babon JJ (2015) Leukemia inhibitory factor (LIF) Cytokine and Growth Factor Reviews 26 533-544.
  43. Nilsson E, Kezele P, Skinner MK (2002) Leukemia inhibitory factor (LIF) promotes the primordial to primary follicle transition in rat ovaries. Molecular and Cellular Endocrinology 188 65-73. [crossref]
  44. da Nóbrega JE, Gonçalves PBD, Chaves RN, Magalhães DDM, Rossetto R, Lima-Verde IB, Pereira GR, Campello CC, Figueiredo JR, de Oliveira JFC (2012) Leukemia inhibitory factor stimulates the transition of primordial to primary follicle and supports the goat primordial follicle viability in vitro. Zygote 20 73-78. [crossref]
  45. Palmqvist P, Persson E, Conaway HH, Lerner UH (2002) IL-6, Leukemia Inhibitory Factor, and Oncostatin M Stimulate Bone Resorption and Regulate the Expression of Receptor Activator of NF-κB Ligand, Osteoprotegerin, and Receptor Activator of NF-κB in Mouse Calvariae. The Journal of Immunology 169 3353-3362. [crossref]
  46. Pastuschek J, Poetzsch J, Morales-Prieto DM, Schleußner E, Markert UR, Georgiev G (2015) Stimulation of the JAK/STAT pathway by LIF and OSM in the human granulosa cell line COV434. Journal of Reproductive Immunology 108 48-55. [crossref]
  47. Pawar S, Starosvetsky E, Orvis GD, Behringer RR, Bagchi IC, Bagchi MK (2013) STAT3 regulates uterine epithelial remodeling and epithelial-stromal crosstalk during implantation. Molecular Endocrinology 27 1996-2012. [crossref]
  48. Peña S, Rubio M, Vargas C, Alanis C, Paredes A (2023) Participation of leukaemia inhibitory factor in follicular development and steroidogenesis in rat ovaries. Journal of Endocrinology 258. [crossref]
  49. Pinilla L, Aguilar E, Dieguez C, Millar RP, Tena-Sempere M (2012) Kisspeptins and Reproduction: Physiological Roles and Regulatory Mechanisms. Physiol Rev 92 1235-1316. [crossref]
  50. Reynaud K, Driancourt MA (2000) Oocyte attrition. Molecular and Cellular Endocrinology 163 101-108. [crossref]
  51. Robinson RC, Grey LM, Staunton D, Vankelecom H, Vernallis AB, Moreau J-F, Stuart DI, Heath JK, Jones EY (1994) The Crystal Structure and Biological Function of Leukemia Inhibitory Factor: Implications for Receptor Binding. Cell. [crossref]
  52. Sasai K, Aikawa J, Saburi S, Tojo H, Tanaka S, Ogawa T, Shiota K (1998) Functions of the N-Glycans of Rat Leukemia Inhibitory Factor Expressed in Chinese Hamster Ovary Cells. Biochem 124 999-1003. [crossref]
  53. Senturk LM, Arici A (1998) Leukemia inhibitory factor in human reproduction. American Journal of Reproductive Immunology 39 144-151. [crossref]
  54. Sims NA, Johnson RW (2012) Leukemia inhibitory factor: A paracrine mediator of bone metabolism. Growth Factors 30 76-87. [crossref]
  55. Somers W, Stahl M, Seehra JS (1997) 1.9 Å crystal structure of interleukin 6: Implications for a novel mode of receptor dimerization and signaling. EMBO Journal 16 989-997. [crossref]
  56. Stewart C (1994) Leukaemia inhibitory factor and the regulation of pre-implantation development of the mammalian embryo. Molecular Reproduction and Development 39 233-238. [crossref]
  57. Stewart CL, Kaspar P, Brunet LJ, Bhatt H, Gadi I, Köntgen F, Abbondanzo SJ (1992) Blastocyst implantation depends on maternal expression of leukaemia inhibitory factor. Nature 359 76-79. [crossref]
  58. Sun X, Bartos A, Whitsett JA, Dey SK (2013) Uterine deletion of Gp130 or Stat3 shows implantation failure with increased estrogenic responses. Molecular Endocrinology 27 1492-1501. [crossref]
  59. Taupin J-L, Pitard V, Dechanet J, Miossec V, Gualde N, Moreau J-F (1998) Leukemia Inhibitory Factor: Part of a Large Ingathering Family. International Reviews of Immunology 16 397-426. [crossref]
  60. Ultsch MH, Somers W, Kossiakoff AA, de Vos A (1994) The crystal structure of affinity-matured human growth hormone at 2 Å resolution. Journal of Molecular Biology 236 286-299. [crossref]
  61. Viswanadhapalli S, Dileep KV, Zhang KYJ, Nair HB, Vadlamudi RK (2022) Targeting LIF/LIFR signaling in cancer. Genes and Diseases 9 973-980. [crossref]
  62. Wang Y, Yuan K, Li X, Su Z, Li X, Guan H, Su Y, Ge HS, Ge RS (2016) Leukemia inhibitory factor stimulates steroidogenesis of rat immature Leydig cells via increasing the expression of steroidogenic acute regulatory protein. Growth Factors 34 166-176. [crossref]
  63. Yamamori T, Fukada K, Aebersold R, Korsching S, Fann M, Patterson PH (1989) The Cholinergic Neuronal Differentiation Factor from Heart Cells Is Identical to Leukemia Inhibitory Factor. Natl. Acad. Sci. U.S.A 86 1384. [crossref]
  64. Yu-Lan Chu, Ya-Ru Xu, Wan-Xi Yang, Yi Sun (2018) The role of FSH and TGF-β superfamily in follicle atresia. Aging (Albany NY) 10 305-321. [crossref]
  65. Zgheib C, Zouein FA, Kurdi M, Booz GW (2012) Chronic treatment of mice with leukemia inhibitory factor does not cause adverse cardiac remodeling but improves heart function. European Cytokine Network 23 197.
  66. Zhang F, Basinski MB, Beals JM, Briggs SL, Churgay LM, Clawson DK, Dimarchi RD, Furman TC, Hale JE, Hsiung HM, et al. (1997) Crystal structure of the obese protein leptin-E100. Nature 287 206-209. [crossref]

Self-removal of Urinary Catheter Following Pelvic Floor Surgeries: A Cost-effective Way to Reduce Hospital Stay and Improve Patient Satisfaction

DOI: 10.31038/IGOJ.2024712

Abstract

Objectives: To assess the effectiveness of patients to remove urinary catheters by themselves after pelvic floor surgery done as day cases.

Design: This was a non-randomized, single centre, prospective pilot study which included patients who have had pelvic floor surgeries (anterior and/ or posterior colporrhaphies and colpocleisis) done as day cases between February 2021 and November 2023.

Sefling: UK DGH hospital urogynecology department.

Population: All patients who had anterior, posterior colporrhaphy, and colpocleisis and fulfilled our inclusion criteria for an elective day-case surgery

Methods: Non-randomized, single centre, prospective pilot study which assess the effectiveness of day-case pelvic floor surgeries, with patients being discharged home with urinary catheters. They were instructed on how to remove these catheters on the first day following the operation. Subsequently, participants were monitored postoperatively and attended a clinic appointment six weeks later. Additionally, they were provided with a questionnaire to fill out, which was to be returned one week after the procedure.

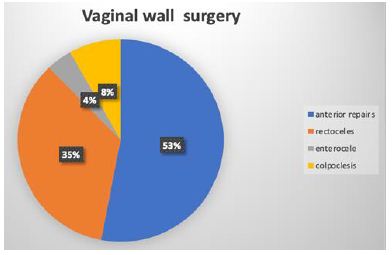
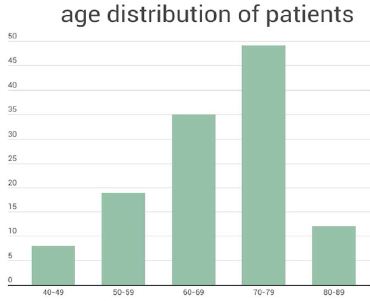
Results: The data obtained was over a 33-month period between February 2021 and November 2023. A total of 123 patients were included in the study. 65 patients (52%) had anterior repairs; 42 rectoceles (34%); 6 Enterocele (4%) and 10 colpoclesis (8%). Ages of the participants ranged from 42 years to 89 years.

Overall, 77% of feedback questionnaires were returned. Amongst the enrolled patients, 98% would prefer not to wait for another admission date where a bed will be available, 97% of our patients removed the urinary catheter by themselves and found it to be easy, 88% of our patients would prefer not to come to the hospital or have a nurse sent to their homes to remove the catheter, and finally, 89% of our patients would recommend this service to a friend.

Conclusion: Our study demonstrated that removal of patient’s own catheter following pelvic floor surgery is cost-saving and highly acceptable to this cohort of patients.

Introduction

The COVID-19 pandemic has led to a significantly increase in pressure on the already stretched National Health Service (NHS) with high demands of hospital bed space and prolonged waiting times for outpatient appointments and elective surgeries across the country [1].

A lot of healthcare services across the NHS had to be adjusted to cope with increased pressures. To help reduce waiting times for urogynaecological operations and effectively manage hospital bed space, we have introduced a new service by performing pelvic floor surgery as day cases and allowing patients to go home with an urinary catheter to be removed by themselves day 1 (D1) postoperatively. This begun as a quality improvement project and has evolved into a change of practice [2].

Before the onset of the pandemic, patients who are having elective anterior and posterior colporrhaphy would be admitted for an overnight stay in the hospital and discharged the following day provided that their trial-without-catheter (TWOC) was successful.

Due to the growing demand for hospital beds, we have initially adapted the service by performing the pelvic floor surgeries as day cases and allowing women to be discharged with urinary catheters, which would be taken out by a nurse at their homes on the first day after surgery. Nevertheless, considering the increasing COVID-19 cases and the emergence of new strains, we initiated an innovative quality improvement project to evaluate the capability of patients to self-remove their urinary catheters after undergoing day-case anterior or posterior colporrhaphy without compromising the quality of their care. The service was extended to encompass colpocleisis procedures as the study progressed.

Anterior colporrhaphy can be described as surgically correcting a vaginal wall defect resulting from the protrusion of the bladder into the vagina, while a posterior repair addresses a defect in the vaginal wall that causes the rectum to protrude into the vagina. These defects tend to affect the quality of life of these patients and can be associated with a range of bowel , urinary and sexual symptoms [3].

Colpocleisis is a surgical intervention employed to address pelvic organ prolapse in women. This procedure entails excising a portion of the vaginal wall and then joining the remaining tissue together to provide support for the pelvic organs [4].

In a previous study by Weemhoff et al. 2011, the importance of inserting urinary catheters following vaginal wall surgeries to address postoperative urinary retention was highlighted. This finding is particularly significant as it was observed that 40% of patients experienced urinary retention when the catheter was removed on the same day [5].

The primary objective of this study is to evaluate the effectiveness and safety of patients self-removal of urinary catheters after undergoing pelvic floor surgery.

Methodology

We have conducted a prospective pilot study in a single DGH hospital. Patients who were having pelvic floor surgeries were recruited between February 2021 to November 2023. A total of 123 patients were enrolled in the study.

Given that this project is focused on quality improvement and service development, ethical approval was not indicated.

The process commenced at the urogynaceology outpatient clinic, where patients received information and provided consent for the surgical procedure. A member of the urogynaecology team facilitated the consent to participate in the study.

Patients who met the inclusion criteria were subsequently counseled about the study, which entailed them independently removing their urinary catheter at home on D1 postoperatively.

A practical demonstration is done in clinic and the patients are given a hands-on experience to ensure that they were confident in deflating the catheter balloon and removing the catheter. All questions and concerns are addressed during this session.

Our inclusion and exclusion criteria are listed below:

Inclusion Criteria

  1. Fit and well women with no significant co-morbidities and suitable for day-case procedures.
  2. Must be consented to partake in the study.
  3. Women must have someone to care for them at home for the first 24 hours.

Exclusion Criteria

  1. Visually impaired.
  2. Women with cognitive disorders or learning disabilities.
  3. Patients with no support at home or living on their own.
  4. Patients who do not want a day surgery.
  5. Patients with significant medical.

On the day of the surgery, a repeated practical demonstration of deflating the catheter balloon is performed in the morning, and the patients’ willingness to participate is confirmed.

The surgical procedure begins with infiltration with 40 mls 1: 200,000 Adrenaline in 0.25% Marcaine to the vaginal wall. A vertical elliptical incision was made at the lowest point of 1 cm above POP: Q(Aa) in an anterior repair and POP: Q(Ap) in a posterior repair. Dissection was performed to the paravaginal tissue and opposed in midline by plication of fascia using 3/0 PDS. The vagina was closed with interrupted 3/0 PDS and completed by a continuous locking haemostatic 3/0 PDS. None of our patients required a vaginal pack. All patients were catheterized after the procedure and was sent home when they met the discharge criteria. Upon discharge, patients were given Voltarol suppository, either 50 mg or 100 mg to be used at night. For those sensitive to non-steroidal anti-inflammatory drugs, an alternative of Co-dydramol 10/500 mg tablets (2 tablets taken four times a day) were provided, or simply paracetamol 1g four times a day if codeine could not be tolerated. To prevent constipation, patients were prescribed Lactulose, to be taken in 10 ml doses twice daily. The postoperative medications are given for a duration of 5 days Additionally, they were sent home with a 10ml syringe, which is to be used for deflating their urinary catheters at 7am the next morning.

Some adjustments had to be made during the study as we noticed that the catheter was removed with ease when filled with 8 ml of saline rather than the standard 10mls. We then modified our practice by using silicone catheters, rather than the latex made ones which were previously used after a patient reported with a faulty latex catheter. Participants were provided with safety net advice along with an emergency contact number for seeking advice or expressing concerns in the postoperative period. Patients were provided with feedback questionnaires prior to discharge, and they were encouraged to complete them one week following the procedure. A follow-up appointment with the consultant was also scheduled for 4-6 weeks postoperatively.

Initially, for the first 17 patients, follow-up calls were scheduled on the first day postoperatively. This involved two calls in the morning and one in the afternoon. However, the team later determined that these multiple calls were unnecessary. As a result, the protocol was adjusted to only one call made by a team member from the urogynecology department in the evening. All patients were provided with an emergency contact number in case they experienced any issues. Patients who experienced difficulties with catheter removal or were suspected of being in urinary retention were encouraged to visit our gynecology ward for a comprehensive assessment. Patients who experienced urinary retention underwent re-catheterization. Following this, a subsequent follow-up appointment with our nurse specialist was arranged for a repeat TWOC in a week’s time.

Results

The data obtained from the prospective study was obtained over a 33-month period. A total of 123 patients were included in our study. This included 65 patients (53%) who had anterior repairs; 42 rectoceles (34%); 6 Enterocele (4%) and 10 colpoclesis (8%) (Figure 1).

fig 1

Figure 1: Distribution of cases in percentages.

The ages of the participants ranged from 42 years to 89 years, with a mean age of 67 years. Majority of the patients enrolled were between 70-79 years and the least number of patients were aged between 40-49 as illustrated in Figure 2.

fig 2

Figure 2: Age distribution of patients in the study (the x-axis shows the age groups of the patients and the Y-axis shows the number of patients in each group).

Ninety-five questionnaires were returned, yielding a response rate of 77% and the outcomes were highly favorable.

One participant out of the 123 (0.8%) experienced urinary retention and required re-catheterization for one week, subsequently passing her TWOC without further issues.

Additionally, another patient (0.8%) had to be admitted for overnight observation due to significant nausea and vomiting following general anesthesia. Lastly, one patient (0.8%) faced complications with a defective catheter, necessitating them reporting to the hospital for removal. Finally, 99% of patients did not require a bladder scan, suggesting routine bladder scan post pelvic floor surgery may not be indicated.

Some common theme of feedback received is seen in Table 1.

Table 1: Patient feedback.

Easy to remove catheter by myself Quick and no time wasted in the hospital
Recovered better at home than in hospital Easier than I expected
Felt better that hospital contacted me the next day, because if I had a problem, it could be solved Nervous about taking my own catheter
Less risk of COVID Did not know how to correctly remove catheter
Consultant and his team were efficient Long wait from pharmacy to get discharge medications
Very good care and well looked after… Need to wear loose clothing during a day case to hide the urinary catheter.

In terms of patient feedback, ninety eight percent of enrolled patients expressed a preference not to wait for another admission date with an available bed. Additionally, ninety seven percent successfully removed the urinary catheter themselves, finding the process easy. Eighty eight percent of patients preferred not to come to the hospital or have a nurse sent to their homes for catheter removal. Furthermore, eighty nine percent would recommend this service to a friend. A significant portion (90%) would rather avoid hospital visits or nurse home visits for catheter removal due to concerns about COVID-19.

We have received largely positive feedback from our patients stating that they were pleased with the arrangements as they felt more comfortable to be at home. Although a few patients were nervous about removing their own catheters, the vast majority of patients expressed that it was straightforward, and they were reassured by a single phone calls from the team.

Discussion

The initial motivation for this study was to find an innovative, practical and efficient way to continue urogynecological surgeries during the COVID-19 pandemic.

The Covid -19 pandemic placed an enormous amount of stress and strain on the heath service resources. It has led to changes to routine practices alternative options for the patients by reducing unnecessary contact with the health service thus reducing the risk of transmitting of Covid-19. This was particularly important in our group of patients as the average age was 65, thus placing them in the vulnerable category. On the other hand, there were delays in performing surgeries during the pandemic due to increased pressure on bed space and staffing which further complicated the issue. Recent studies have proven delays in healthcare provision to be associated with adverse outcomes and poor patient satisfaction [6-8].

Seeking to achieve a balance between patient satisfaction and safety, we launched this quality improvement project to address the extended waiting times for elective pelvic floor surgeries. Our goal was to mitigate the risk of COVID exposure without compromising patient well-being.

The outcomes of this pilot prospective study were notably positive, with over 98% of participants expressing ease in self-removing their urinary catheters postoperatively. Although majority of our patients fall into an older age group, this did not pose a hindrance to the study. Reassuringly, as we have demonstrated that this is widely acceptable to the older population, this suggests that there is a strong possibility for replicating this study outcome in different age groups. The practice could also be extrapolated to other clinical and surgical disciplines faced with similar challenges [9].

The findings of this study underscore several benefits, aligning with NICE recommendations that advocate for greater patient involvement in their care. This study, in turn, places the patient at the forefront of their care, contributing to the overall improvement of healthcare practices. It is important to point out the potential cost-saving benefits observed in our study. Considering an estimated cost of £400 for a hospital bed during an overnight stay at Southend Hospital, we have saved a total of £ 49,200 ( 123 cases x£400) over the duration of our study [10-12].

Further cost savings were made by reassigning the specialist nurse who would have otherwise gone to the homes of the patients to remove the urinary catheters. Instead, they can be deployed to cover over- stretched clinical areas in the hospital as there is currently a national shortage of nurses coupled with increased staff pressures [13].

Patients filled out the feedback forms one week after the procedure, providing them with ample time to reflect on any encountered issues and to weigh the pros and cons of participating in the study. The study received positive response from the ‘family and friends’ test as 89% would recommend it to their friends. One of the common themes in the feedback was the reassurance they had knowing that there was a point of contact they could reach out to if they had any concerns.

As the study progressed, we noted that patients when given additional time, managed to pass urine without any further intervention. This prompted the team to adjust the calling times only once daily in the evening, rather than the initial three times. Also, the patients were given the number of the gynaecology ward so that they can contact the team rather than being called multiple times by the doctor.

We expanded the service to patients undergoing colpocleisis, again with positive results. In the near future, our aim is to further extend this to other gynecology procedures as it has proven to not only be cost-effective but also associated with high patient satisfaction.

Conclusion

The majority of our patients who underwent elective vaginal wall surgeries expressed high satisfaction with the procedure being conducted as day cases and with the subsequent self-removal of their catheters.

This project allowed improvement in capacity to provide elective surgeries with better efficiency and high patient satisfaction without compromising patient safety.

With over 1250 NHS hospitals, this could lead to a potential saving of 20 million pounds, if 40 repairs are done per year which equates to over 50,000 repairs being performed multiplied by only the estimated cost of an inpatient bed (1250×40 repairs /year x £400). Furthermore, additional cost savings will be made by re-deploying nursing staff who were initially assigned to care for these patients.

We conclude that this is a sustainable service that can be continued, and we hope to extend this to other elective gynecological procedures. The inpatient beds can be redistributed for other elective surgeries.

Finally, our study demonstrated that removal of patient’s own catheter following pelvic floor surgeries is not only cost-saving, but also safe and highly acceptable to this cohort of patients.

Future Considerations

With the effective vaccination program, COVID-19 is no longer causing as much strain to our hospitals compared to three years ago, when our project was launched. However, the demand for hospital beds and waiting list for elective surgery are constant struggles within the NHS, our study outcomes should reassure other hospitals that self-TWOC post operatively with uncomplicated pelvic floor surgeries is a safe and cost-effective way of reducing the pressure on the ever- increasing demand of the NHS system.

Patient’s consent: Only anonymous data are included in the study and therefore no individual patient’s consent was required.

Disclosure of Interests

There no conflict of interests declared for this study.

Ethical Approval

Also, no ethical permission was required as it was registered as a Quality improvement project at Southend University Hospital.

Funding

This study was a quality improvement project no external funding was obtained.

Roles of Authors

Dr Papa Yaw Opoku-Ansah (trainee doctor in Obstetrics and Gynaecology ) – Lead author, I used to see the patients pre and post operatively, assist in the surgery, call the patients post operatively, did the write up of the paper.

Dr Candice Cheung – Senior Registrar – saw the patients pre and post operatively, assisted and performed the surgery, called the patients post operatively, made input to the write up of the paper.

Mr Lee – Consultant Urogynecologist, the patients were under his care, he consented the patients, operated on the patients, followed them up, made numerous changes and edits to the paper

References

  1. Uimonen M, et (2021) The impact of the COVID-19 pandemic on waiting times for elective surgery patients: A multicenter study. PLoS One 16(7).
  2. Surgeons, RCo (2020) RCS Managing elective surgery guidance 16 Dec pdf.
  3. Belayneh T, et (2021) Pelvic organ prolapse surgery and health-related quality of life: a follow-up study. BMC Womens Health 21(1). [crossref]
  4. Felder L, et (2022) How does colpocleisis for pelvic organ prolapse in older women affect quality of life, body image, and sexuality? A critical review of the literature. Womens Health (Lond) 18: [crossref]
  5. Weemhoff, et (2011) Postoperative catheterization after anterior colporrhaphy: 2 versus 5 days. A multicentre randomized controlled trial.BMC Women Health.22(4). [crossref]
  6. Moynihan R, et al. (2021) Impact of COVID-19 pandemic on utilisation of healthcare services: a systematic review. BMJ open 11(3). [crossref]
  7. Romero Starke K, et al. (2021) The isolated effect of age on the risk of COVID-19 severe outcomes: a systematic review with meta-analysis. BMJ Global Health 6(12). [crossref]
  8. Sud A, et (2020) Effect of delays in the 2-week-wait cancer referral pathway during the COVID-19 pandemic on cancer survival in the UK: a modelling study. The Lancet Oncology 21(8).
  9. Apramian T, et al. (2016) They Have to Adapt to Learn: Surgeons’ Perspectives on the Role of Procedural Variation in Surgical J Surg Educ 73(2). [crossref]
  10. NICE (2016) Patients should be more involved in decisions about their care, says NICE.
  11. Krist AH, et (2017) Engaging Patients in Decision-Making and Behavior Change to Promote Prevention. Stud Health Technol Inform 240: 284-302. [crossref]
  12. Fund, K. (2022) Key factsnabd figures. Retrieved 03-10-22, 2022, Available from: https://www.kingsfund.org.uk/audio-video/key-facts-figures-nhs.
  13. Melissa Macdonald, CB (2020) Nursing workforce shortage in England. Available From: https://researchbriefings.files.parliament.uk/documents/CDP-2020-0037/ CDP-2020-0037.pdf

New Building in an Established Residential Neighborhood: Understanding Local Issues Using a Template-driven, AI-Empowered System

DOI: 10.31038/GEMS.2024654

Abstract

The paper presents the use of AI-generated ideas in a study on evaluating offers by a builder to local neighborhood regarding use of land for building new development. The novelty of the approach comes from the use of AI-generated material evaluated by human respondents, and the use of such approach to help create an efficient system to deal with local issues. The paper moves the emerging science of Mind Genomics towards dealing with the everyday problem of negotiations about civic and property issues, showing the power of AI (Idea Coach) to make the process affordable and doable in real time.

Introduction

In the ‘project of science’ research studies are assumed to emerge as efforts to contribute to a picture of ‘how the world works.’ Those who publish their investigations are often described as ‘filling gaps in our knowledge.’ Indeed, much of the edifice of science rests on the practice of what is called the ‘hypothetico-deductive’ system, the system which requires that the researcher propose a hypothesis and do the experiment to either support the hypothesis or falsify it. It is by the accretion of such studies that the edifice of science is created, the picture of the world [1]. The assumption in science is that the researcher somehow ‘knows’ a great deal about the topic and can identify what might be the next experiment to perform. The experiments often end up as simple reports, supported by statistics, and introduced by detailed literature reviews. The research ends up being done and incorporated into the edifice. At the other side of the project of science is grounded theory [2]. Here the researcher does a study or reports a set of observations. It is from those observations that hypotheses emerge. Once again, however, the effort assumes at the start that the researcher does the experiment, and thus implicitly assumes that the researcher is beginning with a knowledgeable conjecture.

What then happens in those increasingly frequent cases where the issues are new, or at least new combinations of old issues, and where there has not been sufficient time to create a literature, or even to develop grounded theory and hypotheses? Can a method be developed which allows the exploration of issues in a manner which is quick, simple, yet profound in the depths of information and insight that it can promote, and even create? This paper presents such an approach with a worked example, and a timetable of events. The topic concerns repurposing and redeveloping land in a way suitable to the existing community while allowing the developer to maximize profits.

The approach presented here, Mind Genomics, comes from a combination of three disciplines, and has evolved since the late 1990’s. The disciplines are:

  1. Consumer research. This area of applied science studies the way people make decisions about the topics of daily life.
  2. Mathematical psychology and psychophysics; The study of how we subjectively ‘measure’ external stimuli and situations in our ‘mind’, to create an algebra of the mind. For the current topic of environment and health, mathematical psychology and psychophysics will help us create the structure of how we think about topics.
  3. Statistics, specifically experimental design. This is the study of how we can combine different variables to represent alternative ‘realities’, these realities equivalent to different descriptions of how the world works. The normal, everyday experience of the world comes in packets of stimuli, not in single ideas. Rather than surveying the person, giving that person single questions, we create combinations of those questions, and give the person these combinations. The person then rates the combinations on a defined scale.

The issue dealt with in this paper comes from a real situation lasting several years. The issue was the sale of a large plot of land on which previously was a now bankrupt golf club. As is the case with many similar pieces of land, the golf club extended over a large area, encompassing different types of land, presenting different types of issues such as a small lake in the premises, and of course the houses that had been built in proximity to the golf course over the period of a century.

The case itself, with the different points of view espoused by local homeowners, by the local city government, and by the builder brought up the possibility that cases of this type might be amenable to study using Mind Genomics. The ingoing notion was that one could define the situation, use AI (artificial intelligence) to suggest reasonable questions and answer, and then test responses to those answer among real people. The objective was to see what would emerge from this exercise, and whether there might be an opportunity to bring Mind Genomics into an entirely new world.

Applying Mind Genomics to Legal Issues and the Law

The origin of Mind Genomics can be traced to experimental psychology, and specifically to the study of perception. After years of experiments relating physical stimuli to sensed quality and magnitude, respectively, the notion of measuring ideas began to take shape [3,4]. Researchers have long measured the strength of ideas using a rating scale, with the respondent presented with a variety of different single ideas and asked to rate each idea, one at a time, in terms of importance. This approach, the typical questionnaire, although simple to do and quite popular, does not really get at the notion of measuring the power of meaningful ideas. Rather, the questions ask for the magnitude of general classes, such as the importance of general features, e.g., the importance of affordability, the importance of ecological stability, and so forth.

At least two key issues emerge when researchers work with questionnaires.

  1. The misleading simplicity inherent in general questions. People live in a granular world, not in the world of the general. To talk about general aspects of an issue, e.g., service, price, and so forth, requires that the survey respondent abstract a single answer from a variety of experiences. The abstraction may be simple and straightforward, but the reality is that the survey respondent has to understand the aspect being questioned, pull up the specific experiences (unknown to the researcher), and then assign a rating to the memory of the issue or topic. In other words, no one really knows the basis on which the survey respondent is assigning the rating,
  2. The desire to give the right answer to the interviewer, or now to the interviewing machine. Again, and again researchers are faced with the conscious or often subconscious desire by survey takers to give the ‘right’ or the ‘politically correct’ answers. Indeed, when respondents are academics, they are often the most vocal about questionnaires, insisting that the answers be simple, so that the survey taker is not at all confused. This ends up allowing the survey taker to ‘game the system’, producing the occasionally misleading result, such as what happened in political polls with surveys about voting for a new term for then President Trump [5].

The Mind Genomics approach emerged from studies about decision making [6], not so much with the desire to avoid biases as with the desire to present to survey takers or research respondents with more meaningful test stimuli. Rather than asking the respondent to rate the single ideas, the early research efforts presented the respondents with combinations of ideas, vignettes, which presented a situation. The respondent was to either choose between two vignettes in terms of some criterion (e.g., preference) in what was called a ‘choice experiment’ (ref) or was to rate the vignette, this combination, on a scale. In either case the ratings of the choices were analyzed to show the ‘driving’ power of each individual component of the vignette. Respondents were not required to intellectualize, but simply to choose. In the Mind Genomics system, the vignettes, combinations of ideas or messages about a topic, are created according to a systematic plan called an experimental design. Rather than presenting respondents with single ideas, Mind Genomics presents the respondents with sets of ideas or elements. These messages are combined into vignettes by the experimental design in a way which allows each vignette to contain a small number of different elements, a minimum of two, and a maximum of four. In this way the vignettes are short, easy to read or more realistically to ‘scan’ as the researcher grazes across the vignette taking in the relevant information.

The Mind Genomics system creates 24 unique vignettes for each respondent or survey taker. That is, the 24 vignettes created for the first respondent are different from the 24 vignettes created for the second respondent, etc. Furthermore, the vignettes are set up so that a valid, powerful statistical analysis, OLS (ordinary least squares) regression can be performed on the results from one respondent, independent of all of the other respondents. The uniqueness of the 24 vignettes is guaranteed by a permutation algorithm [7]. The variables themselves, the elements or messages, are coded in a simple fashion, namely present or absent, called ‘dummy variable coding’ [8]. The happy result is that the researcher can identify a topic, and simply explore the topic by creating different elements or messages bout topics relevant to the topic. There does not have to be much up-front thinking. That is, the structure of the Mind Genomics design promotes exploring of different ideas, promoting experimentation and data rather than extensive army chair hypothesizing. In some quarters this up-front thinking is called ‘analysis paralysis’ … over analyzing the problem up-front before doing the experiment. In this paper we explore the use of Mind Genomics as a rapid, inexpensive tool to deal with a local problem, a problem which has proved to be fractious. The problem involves the activities of a builder in a local residential area, the building having purchased the lands belonging to a defunct golf club, the builder desirous of building single family houses on the land to maximize sales revenue after the construction. We explore how this problem can be approached by a combination of AI, artificial intelligence, to suggest ideas, and people, to evaluate these ideas.

Setting Up the Mind Genomics Study

The Mind Genomics platform uses a templated approach, the template having evolved over a 30-year span since the introduction of its predecessor, IdeaMap®, during the 1993 conference of ESOMAR in Copenhagen [9]. By templating the approach, it became possible to fulfill the objective of ‘democratizing research’ world-wide, making it possible for anyone to understand the mind of people as they make decisions about the topics of the everyday

Step 1 – Name the study (Figure 1, Panel A)

‘Naming’ seems to be a simple task, but the sheer effort to reduce the research to a word or two focuses the researcher’s mind. Often the naming step turns into an exercise to hone the ‘big idea’ into something tractable, a realization which emerges after the effort is success. All too often those researchers who are new to Mind Genomics end up trying to name their study using a long phrases which ends up constraining the thinking. Forcing the researcher to use a short name opens up the researcher to thinking about the topic in a more creative fashion.

Step 2 – Develop Four Questions or ‘Categories’ Pertaining to the Topic (Figure 1, Panel B)

It is at this step that many researcher become unusually nervous as they begin to stumble about. This inability to craft questions seems endemic, across ages and cultures. It seems almost that we are taught to answer questions, but not taught to pose questions. Even seasoned researchers react with consternation and frustration at being asked to come up with four questions which ‘tell a story’, or at least four questions which end up painting a coherent picture of a topic (Figure 1).

The requirement to create four questions became simpler to fulfill with the advent of available AI, specifically ChatGPT 3.5 [10]. AI was incorporated into the BimiLeap program through Idea Coach, a program specifically developed to create questions. When invoked, Idea Coach required that the research specify the topic, background, and the nature of the level of the answer. Idea Coach would then return with 15 proposed questions from which the research could select 0-4 questions and drop those questions into the study. Idea Coach allowed the researcher to modify the specification if desired, or maintain the specification, and afterwards re-run a second time. By running the Idea Coach many times, the researcher would end up creating separate sets of 15 questions, few repeating questions, but many new questions. The ability to request Idea Coach to produce sets of 15 questions was augmented by a summarizer, with each set of 15 questions separately summarized through AI. Thus, in a matter of five minutes or so, the researcher could create up to 10 different sets of 15 questions. These sets of 15 questions would be stored in an Excel workbook. At the end of selecting the questions and answers (see below), the BimiLeap program would then take each of the pages of questions or answers, 15 per page, and summarize that page with a fixed set of AI based queries. Table 1 shows an example of one page of questions, ad the Idea Coach summarization available almost immediately after program set-up. When considering the depth of information in Table 1, one can appreciate the ‘education’ virtually immediately available to the researcher who knows little about the topic, an education which otherwise might have required a year of intensive research.

FIG 1

Figure 1: Panel A – name the study. Panel B – create four questions Panel C – create four answers to question #1.

Table 1: Summarization by AI of Idea Coach’s first iteration of 15 suggested questions, generated in the effort to create four test questions for the Mind Genomics experiment.
TAB 1(1)

TAB 1(2)

TAB 1(3)

Step 3 – Create Four Answers to Each of the Four Questions (Figure 1, Panel C)

Table 2 shows an example of 15 answers returned by Idea Coach as an attempt to answer Question #1. It is worth noting that the actual question posed to the Idea Coach moves beyond the simple question. The prompt requests that the answer ‘explain in depth’, as well as being both short (fewer than 15 words), and understandable to a 12-year-old. It is in this way that the researcher works with the AI in Idea Coach to craft a reasonable set of answers that the respondent can understand when participating in the Mind Genomics experiment. Table 2 shows both the ‘edited question’ and the first set of answers. Once again the summarizer works on each set of answers. Thus, once again the Idea Book, viz., the summarized sets of different sets of 15 questions or answers provides in 20 minutes of effort what night have taken a year or two.

Table 2: First set of answers to Question #1, followed by AI summarization of these 15 answers.
TAB 2(1)

TAB 2(2)

TAB 2(3)

TAB 2(4)

Step 4: Raw Materials Test Stimuli – Elements (Phrases Painting Word Pictures) Combined by Experimental Design

The actual raw material ends up being 16 different phrases, four selected as answers to each of the four questions. Table 3 shows these four questions and their answers. The questions and answers were generated by the combination of the researcher and the AI embedded in Idea Coach. It is important to keep in mind that the researcher is able to edit the elements at any time before the actual experiment wherein human respondents will evaluate the test stimuli.

Table 3: The final questions and their associated answers (elements).
TAB 3

Step 5: Create the Test Stimuli, Vignettes, Using Experimental Design

The actual stimuli rated by respondents comprise vignettes, combinations of the 16 elements. The combinations are specified by an underlying experimental design, which prescribes 24 different vignettes. Each vignette comprises a minimum of two elements and a maximum of four elements, at most one element from a question. There is no effect made to connect the elements to each other. Rather, the elements are presented in a simple, stark fashion, with one element atop the other. This starkness makes it easier for the respondent to scan the vignette and assign a rating, instead of forcing the respondent to dig through a mass of text to identify the salient messages. In author HRM’s experience, presenting respondents with complete paragraphs, connectives and all, with grammatically correct sentences ends up fatiguing the respondent by forcing the respondent to engage with the material in an effortful manner through the effort reading rather than simple inspection.

The 24 vignettes for each respondent differ from each other, as noted above [7]. This set of differences ensures that the vignettes cover a great number of possible combinations in the so-called design space, allowing the researcher to quickly explore the topic without having to know much about the topic at the beginning. Furthermore, the 24 vignettes are set up for individual-level analysis of OLS (ordinary least squares) regression, necessary when the research goal is to discover how each element drives the rating. Finally, the vignettes more naturally approach what might be experienced, because the respondent has to deal with combinations of elements and cannot game the system. There is no apparent pattern, forcing the respondent to stop looking for a pattern, and simply to respond naturally. In other words, the system frustrates the search for patterns, making the respondent guess in a fashion which seems unmotivated, but which ends up working effectively.

Step 6: Create a Set of Self-profiling Questions Which Allows the Researcher to Better Understand the Mind of the Respondent

The Mind Genomics platform automatically requests the respondent to provide information about gender and age, and then gives the researcher an additional eight questions to use, each question allowing 2-8 possible answers, from which the respondent is instructed to choose one answer. In the data analyses these groups Table 4 presents these self-profiling questions and answers, along with the rating scale (see Step 7). Figure 2, Panel A shows the respondent experience when presented with these self-profiling questions, at the start of the experiment.
FIG 2

Figure 2: The respondent experience. Panel A – The pull-down menu for the self-profiling questions. Panel B – example of a screen showing the vignette along with the introduction and rating scale.

Table 4: The self-profiling questions (Section A), and the introduction to study topic, and the rating scale (Section B).
TAB 4

Step 7: Create the Introduction to the Vignettes, and the Rating Question for Each Vignette

The respondent first reads an informative introduction to the situation, and then is presented with 24 ‘screens’, each ‘screen’ comprising a shortened version of the introduction, the rating scale, and then the vignette. The rating question focuses on the mind of the respondent. It is through the rating question that the researcher will end up understanding the way the respondent thinks about the topic. The introduction and rating question appear below. Note that the rating question asks the respondent to select the answer, with the answer have ‘two sides.’ The two aspects are the nature of the concessions by the builder (good versus poor), and acceptance by the community of the concession (accepts versus rejects Figure 2, Panel B shows an example.

Figure 2: The respondent experience. Panel A shows the pull-down menu for the self-profiling question. Panel B shows an example of the short introduction to the vignette, the rating scale, and then one of the vignettes. The respondent will see 24 screens similar to Panel B, as well as a first ‘training’ screen (Figure 2).

Step 8: Collect the Data by Internet-executed Experiment and Prepare the Data for Statistical Analysis

Respondents in the New York state area were invited to participate. The respondents were to have incomes above $40,000, and 30 years or older. The respondents were members of various on-line research panels, available to Luc.id Inc., a panel aggregator. The respondents were invited by email. Those who participated pressed a link embedded in the email invitation, were led to the study, read the introduction and proceeded, first with the self-profiling questions, and then with the test vignettes.

The BimiLeap program collected the ratings and created a database. The database comprised 24 rows. Each row corresponded to one of the vignettes evaluated by the respondent. The first set of columns were devoted to identifying the study, the respondent, and the self-profiling information for the respondent, respectively. The second set of columns show the order of the vignette (1 to 24), and the composition of the vignette, expressed as 16 columns, one column for each of the 16 elements, respectively. When the element was present in the particular vignette the cell was given the value ‘1’ When the element was absent from the particular vignette the cell was given the value ‘0’. The final set of columns showed the rating, and the response time (RT) in 100ths of a second.

The data collected must be transformed for subsequent analysis by OLS (ordinary least-squares) regression [11]. OLS will relate the presence/absence of the 16 elements (Table 5) to the dependent variable.. The scale is set up to allow for several dependent variables:

R5x – good concession, neighborhood accepts. The rating of 5 transformed to 100, ratings of 1,2,3 and 4 transformed to 0.

R3x – cannot decide. The rating of 3 transformed to 100, rating of 1,2 4 or 5 transformed to 0.

R54x – good builder concession. Rating of 5 or 4 transformed to 100, rating of 1,2 or 3 transformed to 0

R52x – neighborhood accepts. Rating of 5 or 2 transformed to 100, rating of 4,3 or 1 transformed to 0.

R41x – neighborhood rejects. Rating of 4 or 1 transformed to 100, rating of 5, 3, or 2 transformed to 0

R21x – poor builder concession. Rating of 2 or 1 transformed to 100, rating of 5,4 or 3 transformed to 0.

After the transformation was made, a vanishingly small random number was added to the newly created transformed variable in order to add the needed variability to allow the OLS regression to ‘run’, and not ‘crash’. When the OLS regression encounters a dependent variable with no variability, the analysis crashes. The very small number (<10-4) is a prophylactic measure which ensures against crashes.

Table 5: Parameters for linear models for the total panel relating the presence/absence of the 16 elements to the binary dependent variables and to response time (RT). The elements are sorted by the coefficient for R54.
TAB 5

Step 9: Use OLS Regression to Relate the Presence/Absence of the 16 Elements to the Newly Created Binary Dependent Variables

The OLS regression is run on the full set of 2424 cases, 24 cases or observation for each of the 101 respondents. The equation is simple, showing the degree to which each of the 16 elements ‘drives’ the newly created binary scale, as well as how the elements drive response time.

Dependent variable = k1A1 + k2A2 +… k16D4

The equation does not have an additive constant. Previous analyses incorporated the additive constant as the 17th term of the equation. Although somewhat more statistically ‘rigorous’, estimating the additive constant created problems in the comparison of the coefficients across groups, and across studies. Analysis of the coefficients estimated with versus without the additive constant in the equation showed that the coefficients were of different values, as expected, but strongly and positively correlated with each other. Strong performing elements were strong whether estimated with an additive constant or without an additive constant. Table 5 shows the coefficients for the different binary dependent variables, and the response time. The top of Table 5 shows the meaning of the dependent variable. For this study, the key dependent variable will be R54x, a good concession from the builder, but it is instructive to consider all of the binary dependent variables and the response time. Most concessions offered by the builder were seen to be positive. Coefficients for R54 equal or greater than 21 are shown in shaded cells. Despite the strong performance of most elements, however, there is no sense of a pattern in the mind of the respondents. The coefficients are close together, hovering around 21, some coefficient lower, some coefficients higher.

Table 5 shows a ‘flatness’ of rating value across the elements. Of course, in the absence of anything else the researcher could simply look at the strong performing elements, and stop there, listing out these elements, as well as listing the. Table 5 does not reveal a clear relation between strength of performance and long response time.

Uncovering Different Ways of Thinking about the Topic Through Mind-set Segmentation

A hallmark of Mind Genomics is that people differ from each other in the way that they think about a topic, with these different ways not necessarily being random person to person variation. Rather, many studies suggest that when it comes to the topic of the everyday world, people’s different opinions about aspects of the topic appear to form clearly distinct groupings, mind-sets in the language of Mind Genomics, clusters in the language of statistics [12]. These differences in the way people think about topics is clear when we deal with products, especially food, but also many of the products and services that we purchase and consume [13]. The differences emerge in responses to social issues, and clearly emerge in the law, except perhaps for one topic, murder, where these mind-sets do not seem to loom large [14]. With the prevalence of mind-sets in the population, can we find these mind-sets in the population of our 101 respondents who are dealing with the issue of their response to builder concessions with regard to building of a community of stand-alone houses in a community. The large number of high positive coefficients for the 16 elements in Table 5 (Total Panel; R54x) presents us with an interesting possibility, namely that all of the elements are positive, viz., that all of the builder concessions appear to be good ones. Faced with this somewhat flat distribution of coefficients from a low of +17 to a high of +23 for R54x (good concession), will this case of builder concession become an example of how there are no clear mind-set?. The possibility is certainly real. Nothing dictates that every issue should comprise within it radically different mind-sets. Attitudes about builder concessions may be shared by all people. Table 6 shows the outcome of clustering the 101 respondents, first into two clusters or mind-set, then into three clusters or mind-sets. The method of clustering, k-means, divides the 101 respondents by the pattern of their 16 coefficients. The distance between any two respondents is defined as (1 – Pearson R, or correlation coefficient). The Pearson R ranges between a value of 1 when two sets of objects, e.g., coefficients, align perfectly, viz. are parallel, going in the precise same direction, and a value of -1 when two sets if objects move in opposite direction. The k-means clustering technique is purely mathematical, attempting to satisfy several criteria at the same time [15].

Table 6: Results from the segmentation of respondent on the basis of R54x, builder provides good concessions. The criteria for ‘strong performing’ element has been increased from the conventional value of 21 to a more stringent value of 25+ in order to allow for clearer definition of the nature of the mind-sets.
TAB 6

The clustering was done on the coefficients for R54, viz., perception that the builder concessions are good. One could also do the clustering on the basis of R52, acceptance of the builder concessions, but for this paper we focus only on R54x. Table 6 shows a great number of positive coefficients, magnitude 21+. The coefficient value of 21 may be too lenient a criterion. In Table 6 we highlight the coefficients of 25+, making the criterion more stringent. The two-mind-set solution can be more easily interpreted than the three-mind-set solution. With this more stringent criterion in place the mind-sets may be interpreted as:

Mind-Set 1 of 2 – Focus on a pleasant environment for both people and wildlife

Mind-Set 2 of 2 – Focus on traffic as well as maintaining the local environment.

Coming to an Agreement

The relative flatness of the data in terms of range, along with the strong performance of many of the elements in terms of how good the respondents feel about the builder concessions generates a situation not typical to Mind Genomics. For most topics dealt with in previous studies, the experiment presented above have shown clearly different mind-sets. Perhaps the only case where there has not been clear and strong differences between or among mind-sets has been the case of murder [14]. Yet, here we have the situation of most elements being positive. The issue now evolves to selecting the best element from the total panel, C3. Orient houses away from potential noise sources, such as major roads or industrial areas, to minimize noise impact on residents. The wisdom of selecting C3 is confirmed by listing the strong performing elements for both mind-sets, as is done in Table 7. The table shows the strong performing elements for both mind-sets. C3 is common to both mind-sets and thus should be the key concession accepted by the local community. In addition, the negotiation might consider two other requests from the builder, in order to satisfy the two mind-sets:

Mind-Set 1: D1    Create nesting areas, bird boxes, and other structures to encourage wildlife to thrive within the golf course environment.

Mind-Set 2: C4    Establish a community noise complaint resolution process, where residents can voice their concerns, and ensure that their issues are addressed promptly and effectively.

The benefit of a Mind Genomics experiment in this case emerges as a way to find ‘second best’ ideas that will work for the different mind-sets.

Table 7: Selecting the best single concession (C3) and one additional concession to satisfy each mind-set more deeply.
TAB 7

How Good are the Ideas the Ideas – Index of Divergent Thought (IDT)

A continuing issue in Mind Genomics revolves around the topic of the elements, specifically are the elements ‘good’ or ‘poor’. This question is relevant, indeed increasingly so, as the ability of people to think critically seems to be diminishing. Certainly, the pre-AI days showed that the effort to create four questions ended up being a frustrating experience, and a clear stumbling block to the use of Mind Genomics. It was only after the introduction of AI in the form of the Idea Coach that the task became easier. Let us now merge the use of AI with the specific topic dealt with here, viz., the issues regarding the concessions offered by a builder. The elements were developed in conjunction with AI. The data suggest a large number of strongly positive elements. In order to quantify the true strength of the ideas, a computational method should be developed which accounts for the strength of the elements, as well as the proportion of the population among which the elements perform strongly. Thus, the underlying ‘thinking’ becomes much more impressive when the elements perform strongly, viz., have high coefficients, with large groups in the population. In contrast, when elements perform strongly, but only among a small size group of respondents in the population, we can say that the thinking is not quite as good. Table 8 shows the computations leading up to the IDT, the index of divergent thought. The IDT provides one empirical way to measure the strength of performance. The IDT ends up being the square root of the weighted sum of square of all the elements with positive coefficients, across six groups: total panel, the two mind-sets, and the three mind-sets, respectively. Typical results in the past have ranged from a low near 55 and a high near 75. The 87 generated in this study suggests that the thinking is particularly good, perhaps aided by the fact that the strong performing elements because there are no counter-current patterns generated by mind-set with opposing ideas. That is, the basic ideas are good, that good performance reinforced by the similar patterns of mind-sets which differ only slightly from each other.

Table 8: Computation of the IDT, Index of Divergent Thought.

TAB 8

Deeper Thinking about Mind-sets for R54 (Good Builder Concessions) Using AI Summarization

The final analysis for this rich set of data regarding a local community issue comes from the AI summarization of the strong performing elements for R54 (good builder concessions), done for the two mind-sets. Table 9 shows the summarization, based upon a series of queries submitted to AI (Idea Coach), which looked only at the elements with coefficients of 21 or higher for the mind-set, for dependent variable R54. The AI provides the researcher with what ends up being a ‘second pair of eyes.’

Table 9: AI summarization of the strong performing elements for the two mind-sets, based upon the coefficients for R54 (Good concession from the builder).
TAB 9(1)

TAB 9(2)

TAB 9(3)

Do Open Ended Comments Give Any Deeper Insight into the Mind-sets

After the respondent finished rating all 24 vignettes, the respondent was presented with the instruction to answer the following question by writing one or more sentences: How does being a judge about this negotiation between builder and community make you feel? Table 10 shows the AI summarization of the open ends, with slight editorial changes by the authors to make the summarization more relevant to parties in a negotiation. The summarization was done by QuillBot, an AI editor [16]. The differences between the mind-sets emerge in Table 10, but once again the differences are a matter of ‘shading’ rather than of radically different points of view.

Table 10: AI summarization of the open-ended question.

TAB 10

Discussion and Conclusions

The goal of this paper, dealing with a local property development issue, represents a new direction for Mind Genomics, one perhaps frequently encountered in legal and professional circles, rather than in research papers. The original efforts of Mind Genomics were based in the effort to understand the preferences of people for the ‘stuff’ of everyday life, whether products or services. The almost universal finding from all of the Mind Genomics experiments was the emergence of a limited number of clearly defined mind-sets. When the research moved to political polling [13] or to social research of serious problems [17] clearly different mind-set once again emerged. It is only with problems of the local community that we see the absence of such strong mind-sets. The mind-sets do emerge, as they must with statistical processing forcing them out of the data. However, the mind-sets are similar to each other in the response to most of the messages. It is only the ‘shading’ of the responses where we find differences, and where we struggle to come out with these different groups. The subtlety of point of view of such issues has already been recognized, although not in the language of Mind Genomics [18-22]. As we go through these results, the question now emerges as to how to treat differences of opinion in the situations where the mind-sets reflect modest quantitative differences, shadings of opinion rather than striking differences. It may well be that in many situations dealing with negotiations, the different offerings brought by the parties are almost all equally acceptable. In such cases Mind Genomics may reveal an entirely new opportunity to study the way people make decisions, not so much in the world of preference patterns but rather in the world of graduated ‘give and take’, the world of subtleties in negotiation, rather than dramatic differences in thinking about a topic.

References

  1. Lawson AE (2000) The generality of hypothetico-deductive reasoning: Making scientific thinking explicit. The American Biology Teacher 62: 482-495.
  2. Seyfi S, Michael Hall C, Fagnoni E (2019). Managing world heritage site stakeholders: A grounded theory paradigm model approach. Journal of Heritage Tourism 14: 308-324.
  3. Moskowitz HR (2012) ‘Mind Genomics’: The experimental, inductive science of the ordinary, and its application to aspects of food and feeding. Physiology & Behavior 107: s 606-613.
  4. Moskowitz HR, Gofman A, Beckley J, Ashman H (2006) Founding a new science: Mind Genomics. Journal of Sensory Studies, 21: 266-307.
  5. Kennedy C, Blumenthal M, Clement S, Clinton JD, Durand C, et al. (2018) An evaluation of the 2016 election polls in the United States. Public Opinion Quarterly 82: 1-33.
  6. Porretta S, Gere A, Radványi D, Moskowitz H (2019) Mind Genomics (conjoint analysis): The new concept research in the analysis of consumer behaviour and choice. Trends in Food Science & Technology 84: 29-33.
  7. Gofman A, Moskowitz H (2010) Isomorphic permuted experimental designs and their application in conjoint analysis. Journal of Sensory Studies 25: 127-145.
  8. Hardy MA (1993) Regression with dummy variables (Vol 93). Sage.
  9. Moskowitz HR, Martin D (1993) How computer aided design and presentation of concepts speeds up the product development process. In ESOMAR Marketing Research Congress. Pg: 405.
  10. Teubner T, Flath CM, Weinhardt C, Christof Tl. (2023) Welcome to the era of ChatGPT, the prospects of large language models. Business & Information Systems Engineering Pg: 95-101.
  11. Craven BD, Islam SM (2011) Ordinary least-squares regression. The SAGE Dictionary of Quantitative Management Research. Pg: 224-228.
  12. Talevich JR, Read SJ, Walsh DA, Iyer R, Chopra G (2017) Toward a comprehensive taxonomy of human motives. PloS one 12. [crossref]
  13. Moskowitz HR, Gofman A (2007) Selling Blue Elephants: How to Make Great Products That People Want Before They Even Know They Want Them. Pearson Education.
  14. Moskowitz HR, Wren J, Papajorgji P (2020) Mind Genomics and the Law. LAP LAMBERT Academic Publishing.
  15. Pham DT, Dimov SS, Nguyen CD (2005) Selection of K in K-means clustering. Proceedings of the Institution of Mechanical Engineers, Part C: Journal of Mechanical Engineering Science 219: 103-119.
  16. Fitria TN (2021) QuillBot as an online tool: Students’ alternative in paraphrasing and rewriting of English writing. Englisia: Journal of Language, Education, and Humanities, 9: 183-196.
  17. Zemel R, Attila Gere, Petraq Papajorgji, Howard Moskowitz (2019) Young Americans reacting to statements about Palestine & Israel: A Mind Genomics exploration. Ageing Science and Mental Health Studies, 3: 1-12.
  18. Pacione M (2013) Private profit, public interest and land use planning—A conflict interpretation of residential development pressure in Glasgow’s rural–urban fringe. Land Use Policy, 32: 1-77.
  19. Pinto Â, Pinto T, Praça I, Vale Z, Faria P (2018) Clustering-based negotiation profiles definition for local energy transactions. In 2018 IEEE International Conference on Communications, Control, and Computing Technologies for Smart Grids (SmartGridComm), October, 1-5.
  20. Song Y, Knaap GJ (2007). Quantitative classification of neighbourhoods: The neighbourhoods of new single-family homes in the Portland Metropolitan Area. Journal of Urban Design 12: 1-24.
  21. Stevens SS (2017) Psychophysics: Introduction to its perceptual, neural and social prospects. John Wiley.
  22. Joshua MDuke(2004)Institutions and land-use conflicts: Harm, dispute processing, and transactions.Journal of Economic Issues 38: 227-252.
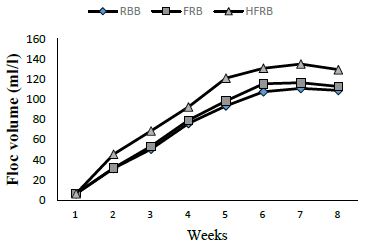
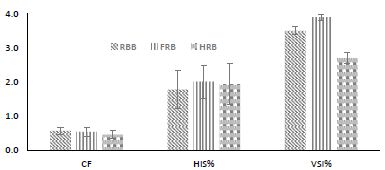
Fluorescence Theranostic PROTACs: A New Frontier for Real-Time ERα Degradation and Breast Cancer Therapy

DOI: 10.31038/EDMJ.2024832

Introduction

Breast cancer, particularly ERα-positive (ERα+) breast cancer, remains a major clinical challenge despite advancements in targeted therapies. Traditional treatments are limited by drug resistance and side effects, necessitating the development of novel therapeutic strategies. PROTACs (Proteolysis Targeting Chimeras) have emerged as a groundbreaking approach, offering targeted protein degradation. The recent development of fluorescence theranostic PROTACs opens new possibilities for both real-time imaging and therapeutic intervention in ERα+ breast cancer.

Key Findings

This research introduces a novel class of fluorescence theranostic PROTACs designed for real-time visualization and degradation of ERα. These compounds exhibit dual functionality, allowing for simultaneous monitoring of ERα levels and degradation within live cells. Key features include:

  • High specificity for ERα, ensuring minimal off-target effects.
  • Real-time imaging capability, enabling dynamic monitoring of ERα degradation in live cells.
  • Enhanced degradation efficiency, overcoming limitations of existing ERα-targeting therapies.

Significance

The integration of fluorescence imaging with targeted degradation represents a significant advancement in theranostics, particularly for breast cancer. This approach not only facilitates precise treatment but also provides critical insights into the dynamics of protein degradation in cancer cells. Moreover, the potential to monitor therapeutic efficacy in real time could revolutionize personalized cancer treatment.

Future Directions

Future research will focus on optimizing the pharmacokinetics of these theranostic PROTACs and exploring their application in vivo. Additionally, expanding this approach to target other oncogenic proteins could broaden its therapeutic potential across various cancer types.

Conclusion

Fluorescence theranostic PROTACs offer a promising new tool for the treatment and study of ERα+ breast cancer. By combining diagnostic and therapeutic functions, they represent a significant step toward more effective and personalized cancer therapies.

Avoiding the Pitfalls of Confounding: A Practical Guide to Mitigating Bias in Real-World Data (RWD) Studies

DOI: 10.31038/JCRM.2024731

Abstract

Background: The use of real-world data (RWD) provides several advantages to randomized clinical trials (RCT), including a larger sample size, longer duration, availability of multiple comparators and clinical endpoints, and lower costs. A main drawback of the use of RWD versus RCT are potential biases due to known, but also hidden confounders that can distort the results of RWD based studies.

Objective: Development of a method to demonstrate the robustness of results of RWD studies by quantitively evaluating the potential impact of hidden confounders on the results of already completed studies.

Methods: The already published study of comparative effectiveness of dimethyl fumarate (DMF) in multiple sclerosis versus different alternative therapies [1] is used to re-evaluate their results in the presence of a strong hidden confounder. To estimate the impact of these potential confounders we evaluate known confounders on a similar dataset as Braune et al. [1]. The sensitivity of these results is assessed using the methodology of by Lin et al. [2].

Results: The findings of the effectiveness analysis of Braune et al. qualitatively remain accurate – even in presence of potential large hidden confounders. Only very large, therefore unlikely hidden confounders could reverse the results of the RWD study tested.

Conclusions: Potential biases in RWD need to be actively dealt with but should not lead to the automatic dismissal of consideration of RWD, since these biases can be addressed quantitatively. Our approach of quantitative bias analyses showed that the robustness of the results can be objectively demonstrated by quantitatively evaluating the impact of an hidden confounding bias on the statistical significance of the null hypothesis tested. If identified effects are robust to large hidden confounding biases, RWD can deliver valid insights which cannot be obtained in RCTs due to their methodological limitations.

Keywords

Sensitivity analysis, Systematic review, Unmeasured confounding, Unobserved confounding, Propensity score matching, Multiple sclerosis, Observational data, Registry

Introduction

Clinical research increases the number of diagnostic and therapeutic options in many medical fields, and even difficult-to-treat neurological diseases, such as multiple sclerosis, have seen substantial recent progress [3]. This leads to the availability of numerous drug comparators for a new treatment entering the field. Because drug approval by FDA and EMA is based on usually two phase III RCTs with a limited number of active comparators, it is obvious that these pivotal trials do not provide sufficient evidence on comparative effectiveness covering the entire available spectrum of drugs for a given indication. Further limitations of RCTs are limited sample sizes, short duration of the trials, and patient populations that are not representative of the real world (e.g. over-sampling of younger individuals). RWD can be based on large cohorts of actual patients and studied over a larger time span. Less frequent adverse events are likely to remain undetected in RCTs (see, for example, the withdrawal of rofecoxib from the market as discussed by Bresalier et. al.) [4]. An additional benefit of RWD is the lower cost per obtained data point, once appropriate IT systems are in place [5]. Evidence from real world data (RWD) thus gains importance to fill this knowledge gap, reflected also in the ongoing initiatives by the regulatory authorities in the US (FDA 2021) [6] and Europe (see Bakker et al.) [7]. To support medical insights pre-specification of study design and data reliability is important [8].

If results from RWD based comparative effectiveness studies shall be part of regulatory decision-making processes [9], medical guidelines, and recommendations, then the quality of patient-level data, data management and analysis, and outcome reporting must match standards established by RCT [10]. The issue of lack of randomization in RWD studies can be tackled by propensity score matching, enabling similar baseline characteristics of patient cohort despite the absence of randomization in real-world treatment settings [11]. Alternative methods are also available [12]. However, even after such matching, several potential biases must be addressed if RWD are employed for comparative effectiveness analyses. We herein review these biases and provide a framework to evaluate the robustness of RWD results in the presence of potential hidden confounders.

Our work is based on several previous efforts to address confounding biases: Zhang et al. [13,14] reviewed statistical methods for the confounding bias in real-world data; Groenwold [15] simulated the impact of multiple unmeasured confounders, while Popat et al. [16] showed how biases due to data missingness, poorer real-world outcomes and confounding can be quantified. Sensitivity analysis can be found in He et al. [17]. Mathur and VanderWeele [18] argued that meta-analyses can produce misleading results if the primary studies suffer from confounder bias. Recently, Leahy et al. [19] presented a quantitative bias analysis to assess the impact of confounding. While their study focused on the question how strong a confounder would need to be to reverse the results (e.g., see a protective effect where there is harm), our work focuses on the question how strong a confounder can be tolerated without leading to an incorrect rejection of the null hypothesis. We developed a method that can indicate when a reasonably likely hidden confounder may cause a result to be significant, while the comparison would not lead to a significant result if the confounder were to be removed. We believe that this question is of great practical relevance for many working in the field of RWD analysis; evaluation the impact of hidden confounders systematically can prevent false interpretation of spurious results.

To determine the impact of a potential hidden confounder bias, we firstly rely on known confounders to estimate the necessary effect size of a hidden, potentially strong confounder, to distort study results (i.e., evaluating if the null hypothesis is still rejected after the confounder has been accounted for). For the test case in this manuscript, we choose already published RWD in the field of multiple sclerosis, employed in a comparative effectiveness study by Braune et al. [1]. In the field of multiple sclerosis, confounding factors in RWD have been thoroughly evaluated and identified [20]. Known biases have been described in prior work in multiple sclerosis RWD [21].

Background: Biases in RWD

A bias in medical data might lead to incorrect models and results, potentially harming patients. In the following we discuss major biases in RWD and how they are managed. Table 1 provides a summary of these biases along the data analysis process.

Table 1: Discussion of Biases

tab 1

Data collection is prone to errors. Physician’s or patient’s reports may be (systematically) incorrect, creating a so-called observer bias, resp. recall bias. Both biases are measurement biases and cannot be corrected from an analytical perspective. Continuous tracking of the patient and standardized, quantifiable recording procedures in-time can reduce this bias, and IT platforms with automated data integrity and feasibility checks can improve data capturing quality, as employed in the case of the data base used in our example [22,23].

At the other end of the data analysis process, the output itself might be biased. Reporting bias is the most prominent output bias. It occurs when the reporting of research findings depends on their direction and nature. Studies with no significant effects rarely get published. To avoid this bias, all analyses must be pre-planned in a study protocol, which should be registered before any analyses are carried out (preferably for RWD-based studies in the ISPOR RWE registry; see ISPOR, 2021) [24].

The core element of the data analysis process is the aggregation of data (Table 1). The strongest biases usually appear in that category, leading to skewed data and reporting of spurious effects. Sampling bias (also known as selection bias) and detection biases are the most prominent biases in that category. An example of the detection bias is that physicians might be more likely to look for diabetes in obese patients than in skinny patients. As a result, one may observe an inflated estimate of diabetes prevalence among obese patients. To prevent the detection bias, core data elements need to be evaluated for a broad spectrum of individuals in a systematic manner. Selection bias occurs when the patients are assigned to different treatments in a non-random procedure. Here individual factors, like doctors´ experience or attitudes of doctors and patients, but also systemic factors like care algorithms or differences in availability results in the selection of a skewed treatment selection. Conclusions drawn from such a population sample cannot be generalized to the overall population.

Detection and selection biases can lead to (hidden) confounder bias. In RCT these biases are controlled for by inclusion and exclusion criteria as well as randomized assignment to interventional trials arms. In medical RWD-based studies many confounders, such as gender, age, physical condition, and others are known, depending on the field. The lack of randomization can be compensated by using a cohort matching technique such as pairwise propensity score matching of Rosenbaum and Rubin [25] employing these known confounders. For a non-mathematical introduction see [26-28]. Practical guidance is given by Loke and Mattishent [11]. Still the challenge of controlling the impact of hidden confounders remain, which is discussed in the following sections.

Confounding Bias

Example

A confounding bias occurs when an attribute (confounder) which is not included in the model influences (some of) the treatment as well as the output. In other words, the relationship between the treatment and the outcome is distorted by the confounder. Assume, for example, that patients who smoke tend to get a certain treatment, and smoking results in a higher disease activity, but smoking is not captured as relevant factor. This scenario leads to an underestimation of the treatment’s efficacy (Figure 1).

fig 1

Figure 1: Example of confounding bias. Smoking (S) correlates with treatment choice (T) and response (Y).

To avoid such misjudgments, we need to account for all possible confounders. For example, a medical registry should contain standard attributes (e.g., age, gender, duration of disease, kind and duration of therapies, disease progression). Additionally, it cannot be ruled out that hidden confounders have an impact. It is difficult to evaluate the impact of these confounders, due to their invisible nature. Lin et al. [2] suggested a method to assess the sensitivity of regression results in the presence of hidden confounders. The following subsection shows how results with confidence intervals can be derived assuming a hidden confounder.

Theory Confounding Bias

Let Y∈{0,1} be a binary response variable (such as disease progression) and X∈{0,1} is the application of a certain treatment. Some covariates Z (e.g., age, gender) are measured while U∈{0,1} is a hidden binary confounder (assumed to be independent of Z). Let the probabilities of the hidden confounder differ in the treatment and the control group P(U=1|X=0)=p0 and P(U=1|X=1)=p1. If the probabilities are identical, the treatment group and the control group are equally affected by the confounder, such that the estimation of the treatment effect remains unbiased.

Consider the log linear model Pr⁡(Y=1│X,Z,U)=exp(α+βX+γU+θ’Z). As the hidden confounder is not estimated, the observed model Pr⁡(Y=1│X,Z)=exp(α*+β* X + θ*’Z) leads to estimates α*, β*, θ* which are potentially biased from the true parameters α, β, θ. Lin et al. found that the relationship between the observed treatment coefficient β* and the actual treatment coefficient β was given by

formula 1

with Γ=eγ being the relative risk of disease associate with the hidden confounder U. Similar results can be found for the logistic regression and for more general (such as normal distributed) confounders [2].

Real-world Application

Known Confounders

To determine the possible impact of hidden confounders, it is helpful to first evaluate the known confounders. This obviously depends on the context of the study. As the initial population of Braune et al. [1] was not available on patient level, we use a current data cut of the German NeuroTransData (NTD) Multiple Sclerosis registry, including patients with same inclusion characteristics as in the previously published population.

Our real-world application investigates relapse activity of patients with MS (PwMS). To estimate the impact of known confounders, we utilized a cross-sectional dataset sourced from the inception of the year 2022 (index date beginning of 2022) including 5679 active PwMS being on therapy on either Fingolimod, Interferon, Natalizumab or Ocrelizumab. Our binary depended variable states if there are relapses in the previous year or not (yes/no). We run a logistic regression of relapses on known established confounders (gender, age, Expanded Disability Status Scale (EDSS) at index date, number of treatments before index date and time since diagnosis to index date), as suggested by Karim et al. [20]. The result is given in Table 2.

Table 2: Results of logistic regression model of the event of a relapse on known confounders: Gender (female), Age (age), Expanded Disability Status Scale (EDSS), number of DMTs before index date (n.treatment) as well as time since diagnosis of MS in years (time.yrs). The point estimate is given as well as the standard deviation (Std.Error) and the corresponding p-value (Pr(>|z|)).

Estimate

Std. Error

Pr(>|z|)

(Intercept)

-0.1451

0.1176 0.2176

female***

0.2156 0.0631

0.0006

age***

-0.0217

0.0028 <0.0001

EDSS_score***

0.1391 0.0206

<0.0001

n.treatments

-0.0294

0.0230 0.2012

time.yrs

0.0052 0.0105

0.6200

The most important confounder is gender. Based on our data, women have 24% (e0.2156=1.24) greater relative risk of relapses compared to men. 10 years increasing age leads to a 20% reduction of the relative risk. An EDSS score higher by one unit increases the relative risk by 15%.

Controlling these confounders as well as hidden confounders becomes crucial, if RWD are employed to comparatively analyze effectiveness of several drugs in a certain indication. While propensity score matching baseline variables can control for aggregation biases in RWD, still hidden confounders continue to challenge the robustness especially of comparative results.

Let there be a hidden confounder with a strong negative effect on the outcome. Assume first that it is equally distributed between all treatments. In this case, the confounder affects the treatment outcomes of different disease modifying therapies (DMTs) in relapsing remitting multiple sclerosis (RRMS) with the same magnitude in each treatment group, and the estimated efficacy of the treatments will be unbiased. Suppose now that the hidden confounder is more frequent in one treatment group than the other. Even if two treatments have a similar efficacy, one treatment will seem to be worse than the other.

It is crucial to determine how unequal known confounders are distributed, which is shown in Table 3 for each of the four DMT evaluated. For the therapies fingolimod (FTY), interferons (IFN), natalizumab (NAT) and ocrelizumab (OCR) the share of females, share of higher disability represented by higher EDSS (Expanded Disability Status Scale, mean EDSS score above the group mean 2.2), share of high age (age above the group mean of 39 years) is given. The share of females is relatively equally distributed over all therapies ranging from 62% to 76%, similar for the higher EDSS score (50% to 69%). The largest deviation in distribution is given for higher age, ranging from 37% to 59%.

Table 3: Distribution of well-known confounders (gender, above average EDSS score of 2.2 and above average age of 39 years) given different treatments fingolimod (FTY), interferon-ß (IFN), natalizumab (NAT), ocrelizumab (OCR). The strongest difference between treatment populations can be seen for above average age, ranging from 37% (NAT) to 59% (OCR).

Share (%)

FTY IFN NAT

OCR

Female

73%

73% 76% 62%

Higher EDSS

60% 50% 64%

69%

Higher age

53%

47% 37%

59%

In summary, well-known confounders in the field of MS treatments are found to increase the odds of responding to different DMTs by up to 25% and might be slightly unequal distributed (e.g. 40% to 60%) in different treatment groups. With this information, we can now check the results of previous findings in the literature in the presence of a potential hidden, hidden confounder.

Hidden (Potential) Confounders

For this exercise, we consider the results from the paper of Braune et al. [1]. The authors analyzed the comparative effectiveness of delayed-release dimethyl fumerate (DMF) against other treatments in patients with relapsing-remitting multiple sclerosis (RRMS) using propensity score matching. The results supported the superior effectiveness of DMF compared to interferons (IFN), glatiramer acetate (GA) and teriflunomide (TERI) and showed similar effectiveness to fingolimod (FTY). The pairwise comparisons of the paper are shown in the blue plot in Figure 2 (based on Figure 1 in Braune et al.). For IFN, GA and TERI, the rate ratio is significantly below 1, indicating better results for DMF.

fig 2

Figure 2: Hazard rate ratio of DMF vs. comparator. Rate ratios below 1 favor DMF.

Blue dots show hazard rate ratio as given in Braune et al. [1]. Orange triangles represent ratios given a large hidden confounder (p0=0.4,p1=0.6,Γ=2). The population of the therapies interferon-ß (IFN), glatiramer acetate (GA), teriflunomide (TERI), fingolimod (FTY) and the FTY (European) label are shown.

The propensity score matching accounts for the known established confounders such as sex, age, EDSS, disease duration, number of DMTs, and number of relapses in the past 12 and 24 months. While these are certainly the most influential confounders (Karim et al.) [20], an impact of additional hidden confounders cannot be excluded. Using the analysis described above, one can test if the results of Braune et al. [1] still hold in the presence of a hidden confounder. We know from our considerations above that common well-known confounders increase the odds by up to 25%. Consider an example of an extremely large confounder increasing the odds by 100% – or equivalently four perfectly correlated hidden confounders, each increasing the relative risk by 25%. In that case, we model the binary confounder with Γ=2. Note, that if the confounder appears at an equal rate in both groups (e.g. p0=p1), the measured comparative effectiveness is unbiased. Hence, assume that the hidden confounder is far more present in the comparator group (p1=0.6) than in the DMF group (p0=0.4 ). Given our analysis of known confounders in the previous section, a more unequal distribution of the hidden confounder in between the comparator and treatment group appears unlikely.

In such a scenario, the hidden confounder leads to an increase of effectiveness difference improperly in favor of DMF. We use the methodology presented by Lin et al. [2] to adjust for that effect. Figure 2 (orange triangles) presents the results in the presence of such an hidden confounder. For direct comparison also see Table 4.

Table 4: Hazard rate ratio for relapse activity during treatment with DMF vs. comparator including confidence intervals* (CI) excluding and including the adjustment of a binary confounder. The population of the therapies interferon-ß (IFN), glatiramer acetate (GA), teriflunomide (TERI), fingolimod (FTY) and the FTY (European) label are shown.

Comparison vs. DMF

Hazard Rate (CI)
as published

Hazard Rate (CI)
after confounder adjustment

IFN

0.59 (0.42,0.83)

0.68 (0.48,0.94)

GA

0.65 (0.48, 0.87)

0.74 (0.55,0.99)

TERI

0.56 (0.37,0.86)

0.64 (0.42,0.98)

FTY

0.73 (0.52, 1.02)

0.83 (0.60,1.17)

FTY label

0.94 (0.52,1.72)

1.08 (0.59,1.97)

* Note that the presented confidence bands differ slightly to the referenced paper due to different estimation procedures.

Because the impact of the hidden confounder leads to worse results for the comparator group (lower rate ratios), the rate ratios increase after the adjustment. To highlight IFN, the rate ratio increases from 0.59 to 0.68. Still, the qualitative conclusions of Braune et al. [1] that DMF has a higher efficiency than IFG, GA and TERI and similar efficiency to FTY remains, and the null hypothesis of equal effects of these two treatments is correctly rejected.

An arbitrarily strong hidden confounder can, of course, always change the results. See Table 5 for a comparison between DMF and IFN with hidden confounder Γ=2 and different distributions p0, p1 in the treatment and comparator group. For an equal distribution of the hidden confounder in the DMF and IFN population, i.e. p0=p1, the hazard ratio is given by 0.59 (as found by Braune et al.) [1] as both groups are equally exposed to the confounder. For a moderate divergence in both groups, e.g. em>p0=0.4, p1=0.6 the rate ratio is given (as mentioned before) by 0.68. For strong difference between both groups, with the DMF group being free of the hidden confounder (p0=0) and the confounder group suffering strongly of the confounder (p1>0.7) the effectiveness of DMF compared to the comparator reverses after the adjustment. IFN would then actually be more effective than DMF and only appear worse due to the hidden confounder. As Braune et al. [1] already control for all major known confounders, it seems unlikely that such a hidden confounder with such a massive impact exists. Note that the treatment differences of Braune et al. [1] further increase when the DMF group is more exposed to the confounder than IFN group, e.g. p0>p1.

Table 5: point estimates and confidence bands for hazard ratios for dimethylfumarat (DMF) vs. interferon-ß (IFN) adjusting for a hidden confounder with Γ=2 given the frequency of the confounder in the DMF group (p0) and the comparator group (p1). Result remains significant for italic cases.

p1=0.0

p1=0.2 p1=0.4 p1=0.6 p1=0.7 p1=0.8

p1=1.0

p0=0.0

0.59 (0.43,0.83)

0.71 (0.51,0.99) 0.83 (0.6,1.16) 0.95 (0.68,1.32) 1.01 (0.72,1.4) 1.07 (0.77,1.49)

1.19 (0.85,1.65)

p0=0.2

0.49 (0.35,0.69)

0.59 (0.43,0.83) 0.69 (0.5,0.96) 0.79 (0.57,1.1) 0.84 (0.6,1.17) 0.89 (0.64,1.24) 0.99 (0.71,1.38)

p0=0.4

0.42 (0.3,0.59) 0.51 (0.36,0.71) 0.59 (0.43,0.83) 0.68 (0.49,0.94) 0.72 (0.52,1) 0.76 (0.55,1.06)

0.85 (0.61,1.18)

p0=0.6

0.37 (0.27,0.52)

0.44 (0.32,0.62) 0.52 (0.37,0.72) 0.59 (0.43,0.83) 0.63 (0.45,0.88) 0.67 (0.48,0.93) 0.74 (0.53,1.03)

p0=0.8

0.33 (0.24,0.46) 0.4 (0.28,0.55) 0.46 (0.33,0.64) 0.53 (0.38,0.73) 0.56 (0.4,0.78) 0.59 (0.43,0.83)

0.66 (0.47,0.92)

For some fixed confounder size Γ we can observe when the result loses significance. Figure 3 presents a graph for two different strengths of the confounder Γ∈(2.0,3.0). On the axis the frequency of the confounder in the comparator group (x-axis) and DMF group (y-axis) is given. The crosses indicate the maximum identified inequality in the distribution of the known confounders age, gender and EDSS between treatments (see also Table 3).

The practically most relevant question is under which circumstances the results of Braune et al. lose significance. For a certain confounder strength and inequality in the groups the significance of the found results by Braune et al. will not hold anymore. A confounder with Γ=1.2 (not shown in Figure 3) is too weak and cannot destroy the significance. That is noteworthy, because a 20% increase in relative risk is about the effect size found for the strongest known confounder (gender). An hidden confounder with Γ=2 impact the significance of the result, if the confounder is far more present in the comparator group (e.g. p1>0.2) than the DMF group (e.g. p0=0). For very large confounders the results could be reversed. A confounder with strength Γ=3.0 and a similar occurrence as the risk factor age would lead to the result being not significant anymore.

fig 3 new

Figure 3: Illustration of threshold at which IFN loses significance to DMF for different strength of the hidden confounder with Γ∈(2.0,3.0) and different distribution of the confounder in the dimethylfumarat (DMF) group (p0) and the comparator interferon-ß (IFN) group (p1).

Summary and Conclusion

Findings in RWD can be distorted by several biases, including the confounding bias. We herein show how the methodology presented by Lin et al. can be applied in practice to analyze the significance of results in the presence of potential hidden confounders. First, we determined the effect size and distribution of known confounders. Our results underline the strong impact of the known confounders in multiple sclerosis, in line with previous reports (Karim et al.) and provide a quantitative base for the evaluation of the impact of hidden confounders. This analysis showed that a potential hidden confounder would have to exceed the impact of known confounders to such an extent, that its existence can be ruled out with almost certain probability. The method employed allows for different assumptions of equal and unequal distributions in the groups compared to understand the necessary strengths of hidden confounders to distort study results in different scenarios. Firstly, it is tested if the results hold in the presence of an hidden confounder as large as the known confounder. Then a threshold corridor can be defined, indicating quantitatively the limits of strengths of hidden confounder necessary for study results to lose their statistical significance. Considering previous work in this field, this method adds a new dimension by evaluating if the null hypothesis is still rejected after the confounder has been accounted for.

The presented method has some limitations. The first is the distribution assumption of the confounder. Lin et al. show that the method holds for binary and normally distributed confounders. For more extreme distributions with heavy tails, the applied correction might be insufficient. We further assume that hidden (or unmeasured) confounders have a similar distribution and strength as known confounders. However, if there is evidence that there are hidden confounders that are very unevenly distributed in the treatment populations or the hidden confounders might be of extreme strength, the method presented should not be applied.

The approach presented herein to battle the confounder bias can help increase the robustness and reliance of results from RWD. If observed effects are significant and the presented sensitivity analysis can show the robustness of the results in presence of a substantial confounding bias, decision makers can be more confident to rely on real-world evidence. RWD should thus not be dismissed a priori due to the “ghost of confounding,” because this ghost can be kept in check by quantitative methods shown herein applied to large-scale and robust datasets.

References

  1. Braune S, Grimm S, van Hövell P, Freudensprung U, Pellegrini F, et al. (2018) Comparative effectiveness of delayed-release dimethyl fumarate versus interferon, glatiramer acetate, teriflunomide, or fingolimod: results from the German Neuro Trans Data registry. Journal of Neurology 265: 2980-2992. [crossref]
  2. Lin DY, Psaty BM, Kronmal RA (1998) Assessing the sensitivity of regression results to unmeasured confounders in observational studies. Biometrics 948-963. [crossref]
  3. Braune S, Rossnagel F, Dikow H, Bergmann A (2021) The impact of drug diversity on treatment effectiveness in relapsing-remitting multiple sclerosis (RRMS) in Germany between 2010 and 2018: Real-world data from the German NeuroTransData Multiple sclerosis registry. BMJ Open [crossref]
  4. Bresalier RS, Sandler RS, Quan H, Bolognese JA, Oxenius B, et al. (2005) Cardiovascular Events Associated with rofecoxib in a Colorectal Adenoma Chemoprevention Trial. The New England Journal of Medicine 352: 1092-1102. [crossref]
  5. O’Leary CP, Cavender MA (2020) Emerging opportunities to harness real world data: An introduction to data sources, concepts, and applications. Diabetes Obes Metab 22: 3-12. [crossref]
  6. FDA (2021) Real-World Evidence. Office of the Commissioner. https://www.fda.gov/science-research/science-and-research-special-topics/real-world-evidence. Accessed April 27, 2023.
  7. Bakker E, Plueschke K, Jonker CJ, Kurz X, Starokozhko V, Mol PG (2023) Contribution of Real-World Evidence in European Medicines Agency’s Regulatory Decision Making. Clin Pharmacol Ther 113: 135-151. [crossref]
  8. Mahendraratnam N, Mercon K, Gill M, Benzing L, McClellan MB (2021) Understanding Use of Real-World Data and Real-World Evidence to Support Regulatory Decisions on Medical Product Effectiveness. Clinical Pharmacology & Therapeutics 111: 150-154. [crossref]
  9. Gray CM, Grimson F, Layton D, Pocock S, Kim J (2020) A Framework for Methodological Choice and Evidence Assessment for Studies Using External Comparators from Real-World Data. Drug safety 43. [crossref]
  10. Baumfeld AE, Reynolds R, Caubel P, Azoulay L, Dreyer NA (2020) Trial designs using real-world data: The changing landscape of the regulatory approval process. Pharmacoepidemiology and Drug Safety. [crossref]
  11. Loke YK, Mattishent M (2020) Propensity score methods in real-world epidemiology: A practical guide for first-time users. Diabetes Obes Metab 22: 13-20. [crossref]
  12. Varga AN, Guevara Morel AE, Lokkerbol J, van Dongen JM, van Tulder MW, et al. (2023) Dealing with confounding in observational studies: A scoping review of methods evaluated in simulation studies with single‐point exposure. Statistics in medicine 42. [crossref]
  13. Zhang X, Faries DE, Li H, Stamey JD, Imbens GW (2018) Addressing unmeasured confounding in comparative observational research. Pharmacoepidemiol Drug Saf 27: 373-382. [crossref]
  14. Zhang X, Stamey JD, Mathur MB (2020) Assessing the impact of unmeasured confounders for credible and reliable real-world evidence. Annu Rev Public Health 5.
  15. Groenwold RHH, Sterne JA, Lawlor DA, Moons KG, Hoes AW, et al. (2016) Sensitivity analysis for the effects of multiple unmeasured confounders. Ann Epidemiol 26. [crossref]
  16. Popat S, Liu SV, Scheuer N, Hsu GG, Lockhart A, et al. (2022) Addressing challenges with real-world synthetic control arms to demonstrate the comparative effectiveness of Pralsetinib in non-small cell lung cancer. Nat Commun 13: 3500. [crossref]
  17. He W, Fang Y, Wang H (2023) Real-World Evidence in Medical Product Development. Springer Nature.
  18. Mathur MB, VanderWeele TJ (2022) Methods to Address Confounding and Other Biases in Meta-Analyses: Review and Recommendations. Annual Review of Public Health 43: 19-35. [crossref]
  19. Leahy TP, Kent S, Sammon C, Groenwold RH, Grieve R, et al. (2022) Unmeasured confounding in nonrandomized studies: quantitative bias analysis in health technology assessment. J Comp Eff Res 11: [crossref]
  20. Karim ME, Pellegrini F, Platt RW, Simoneau G, Rouette J, et al. (2022) The use and quality of reporting of propensity score methods in multiple sclerosis literature: A review. Mult Scler 28: 1317-1323. [crossref]
  21. Kalincik T, Butzkueven H (2016) Observational data: Understanding the real MS world. Mult Scler 22: 1642-1648. [crossref]
  22. Bergmann A, Stangel M, Weih M, van Hövell P, Braune S, et al. (2021) Development of Registry Data to Create Interactive Doctor-Patient Platforms for Personalized Patient Care, Taking the Example of the DESTINY System. Digit. Health 3: 633427. [crossref]
  23. Wehrle K, Tozzi V, Braune S, Roßnagel F, Dikow H, et al. (2022) Implementation of a data control framework to ensure confidentiality, integrity, and availability of high-quality real-world data (RWD) in the NeuroTransData (NTD) registry. JAMIA Open 5: ooac017. [crossref]
  24. ISPOR (2021) Real-World Evidence Registry. https://www.ispor.org/strategic-initiatives/real-world-evidence/real-world-evidence-registry. Accessed April 27, 2023.
  25. Rosenbaum PR, Rubin DB (1983) The Central Role of the Propensity Score in Observational Studies for Causal Effects. Biometrika 70.
  26. Franchetti Y (2022) Use of Propensity Scoring and Its Application to Real-World Data: Advantages, Disadvantages, and Methodological Objectives Explained to Researchers Without Using Mathematical Equations. J Clin Pharmacol 62. [crossref]
  27. Cohen JA, Trojano M, Mowry EM, Uitdehaag BM, Reingold SC, et al. (2020) Leveraging real-world data to investigate multiple sclerosis disease behavior, prognosis, and treatment. Mult Scler 26.
  28. Lin KJ, Rosenthal GE, Murphy SN, Mandl KD, Jin Y, et al. (2020) External validation of an algorithm to identify patients with high data-completeness in electronic health records for comparative effectiveness research. Clinical Epidemiology 12: 133. [crossref]

Technology in Healthcare – Using Digital Resources to Improve Education in Oncology Research

DOI: 10.31038/IJNM.2024541

Introduction

Onboarding and induction processes are crucial for integrating new members into any professional team, particularly in specialised and complex fields like oncology health research. This abstract highlight the creation of a digital induction guide designed to facilitate a smoother transition for new members joining an oncology research team within the National Health Service (NHS). The emphasis on technology-driven solutions reflects the broader trend in healthcare towards digitisation and the use of innovative tools to enhance educational and training processes.

Background

Working in oncology health research presents unique challenges and opportunities. The field is characterised by its dynamic nature, with ongoing advancements in cancer treatment and research methodologies. New team members that join an oncology research team often face a steep learning curve, not only in understanding the scientific and clinical aspects of oncology but also in navigating the organisational structure and workflows of their new environment. Recognising these challenges, the need for a structured and effective induction system became apparent. Feedback from previous team members indicated that a cohesive onboarding/induction process could significantly enhance their integration into the team and their overall job satisfaction. This feedback served as a catalyst for the development of the induction guide described in this abstract.

Methods

The creation of the induction guide involved several key steps, each aimed at maximising the effectiveness of the resource:

1. Platform Selection

A digital platform was chosen to host the guide, allowing for interactive elements such as videos and hyperlinks to external resources. This decision was driven by the need to engage users more effectively than traditional paper-based guides, which can often be dull and difficult to navigate.

2. Content Development

The content of the guide was carefully curated from credible sources to ensure accuracy and relevance. Given the complexity of oncology research, the information was structured to be easily digestible, with complex concepts broken down into simpler segments using animations and other visual aids.

3. Design and User Experience

A significant emphasis was placed on the design of the guide to make it visually appealing and user-friendly. Vibrant colours and an intuitive layout were employed to capture and maintain the reader’s interest. The guide’s format was optimised for mobile devices, enabling users to access it on the go.

4. Feedback Mechanisms

To ensure the guide remains relevant and effective, a feedback loop was established. Readers are encouraged to provide anonymous feedback via a brief survey, which is used to continuously refine and update the content.

5. Sustainability and Accessibility

The guide was designed in an electronic format to minimise environmental impact by reducing the need for printed materials. Additionally, the digital format allows for easy updates as new information becomes available. A QR code was also implemented to facilitate easy access to the guide.

Results

The implementation of the induction guide has yielded positive results across several dimensions:

1. Seamless Integration

The guide has significantly improved the integration of new members into the oncology research team. By introducing the guide during the first week of induction, it lays a solid foundation for ongoing learning and professional development.

2. Enhanced Accessibility

The guide’s digital format ensures that it is easily accessible to all team members, regardless of their location. Users can quickly revisit the guide on their handheld devices whenever needed, making it a convenient and reliable resource. A quiz game was also added to aid users to assess their knowledge whilst adding a competitive component to make it enjoyable.

3. Positive User Feedback

Feedback from users has been overwhelmingly positive. The interactive and colourful nature of the guide has been particularly appreciated, with many users noting that it makes the learning process more enjoyable and less intimidating.

4. Multipurpose Tool

In addition to its primary function as an induction guide, the resource has also been repurposed as an educational tool for ongoing research activities. This dual functionality enhances its value to the team and underscores the versatility of digital resources in healthcare education.

5. Continuous Improvement

The feedback mechanism embedded in the guide has proven to be an effective tool for continuous improvement. By regularly collecting and analysing user feedback, the team can make informed decisions about updates and enhancements to the guide. How did you find this guide (Figures 1 and 2).

fig 1

Figure 1: How did you find this guide?

fig 2

Figure 2: Do you think the tumour group/area you work in would benefit from something similar to this guide, that is more specific?

Discussion

The success of the induction guide reflects broader trends in healthcare and education, where digital tools are increasingly being used to enhance learning and training processes. The use of technology in this context offers several advantages over traditional methods:

1. Interactivity and Engagement

Digital platforms allow for the incorporation of interactive elements that can significantly increase user engagement. Videos, animations, and hyperlinks to external resources provide a richer learning experience compared to static text.

2. Flexibility and Accessibility

The ability to access educational resources on mobile devices is a key advantage in today’s fast-paced work environments. This flexibility allows team members to learn at their own pace and revisit material as needed, which can be particularly beneficial in a field as complex as oncology research.

3. Sustainability

The move towards digital resources aligns with broader sustainability goals by reducing the reliance on printed materials. This not only minimises waste but also allows for the easy updating of content, ensuring that the information remains current and relevant.

4. Feedback and Adaptation

The integration of feedback mechanisms into digital resources enables continuous improvement. By regularly updating the guide based on user feedback, the resource remains relevant and effective over time, ensuring that it meets the evolving needs of the team.

5. Cost-Effectiveness

While there may be initial costs associated with the development of digital resources, these are often offset by the long-term savings achieved through reduced printing costs and the ability to easily update content without the need for reprinting (Table 1).

Table 1: Feedback survey results

Date

Do you have any suggestions for improvements?

29/08/2023  
29/08/2023 It was very explanatory and captured everything one needs to know about beginning research
29/08/2023 Great slideshow and very detailed, definitely provides a holistic overview of working in research, thank you for taking the time to make this resource!
29/08/2023 Just a correction on a name but other than that, it was great.
29/08/2023  
29/08/2023  
29/08/2023  
01/11/2023 nil
24/01/2024 no
02/02/2024 Perfect
12/03/2024  
15/07/2024 I thoroughly enjoyed the presentation! It provided valuable insights into the team and gave an overview of clinical trials. I also appreciated and was interested at the end where current trials conducted at RFH were outlined. The slides were very easy to follow and also were designed nicely. o suggestion for improvements!

Conclusion

The development and implementation of a digital induction guide for new members of an oncology research team based in a NHS trust has proven to be a highly effective strategy for improving the onboarding/induction process. The guide’s interactive, accessible, and user-friendly design has been well-received by users, who have praised its ability to make the learning process more engaging and less daunting. Moreover, the guide’s utility extends beyond its initial purpose, serving as an ongoing educational resource for the entire team. This multipurpose functionality underscores the value of investing in digital resources for healthcare education. As the field of oncology research continues to evolve, the need for effective training resources will only grow. The success of this induction guide demonstrates the potential of digital tools to meet this need, providing a model that can be adapted and applied in other areas of healthcare and beyond.

Future Directions

Looking ahead, there are several potential areas for further development and improvement of the induction guide:

1. Expansion of Content

As oncology research continues to advance, there will be a need to regularly update and expand the content of the guide. This could include new sections on emerging research areas, advanced treatment modalities, and updates on clinical trial protocols.

2. Integration with Other Training Resources

The guide could be integrated with other training resources, such as online courses, webinars, and virtual simulations, to provide a 29/08/2023 01/11/2023 nil 24/01/2024 no 02/02/2024 Perfect 12/03/2024 15/07/2024 I thoroughly enjoyed the presentation! It provided valuable insights into the team and gave an overview of clinical trials. I also appreciated and was interested at the end where current trials conducted at RFH were outlined. The slides were very easy to follow and also were designed nicely. o suggestion for improvements! Do you have any suggestions for improvements? Date more comprehensive educational experience. This could help to reinforce key concepts and provide opportunities for hands-on learning in a virtual environment.

3. Customisation for Different Roles

While the current guide is designed for a general audience, there may be value in creating customised versions for different roles within the oncology research team. For example, separate guides could be developed for clinical researchers, laboratory technicians, and administrative staff, each tailored to the specific needs and responsibilities of these roles.

4. Data Analytics

By leveraging data analytics, the team could gain deeper insights into how the guide is being used and identify areas for improvement. For example, data on which sections are most frequently accessed, or where users tend to spend the most time, could inform decisions about content updates and enhancements.

Broader Implications

The success of this digital induction guide has broader implications for the use of technology in healthcare education and training. As the healthcare landscape continues to evolve, there will be an increasing need for innovative solutions that can keep pace with the rapid advancements in medical knowledge and practice. Digital resources, such as the induction guide described in this abstract, offer a promising way to meet this need. By providing flexible, accessible, and engaging learning experiences, these tools can help to ensure that healthcare professionals are well-equipped to navigate the complexities of their roles and contribute to the ongoing advancement of their fields. Moreover, the principles underlying the development of this guide—such as the importance of interactivity, user feedback, and sustainability—can be applied to other areas of healthcare education. Whether in medical schools, clinical training programs, or continuing professional development courses, the use of digital tools has the potential to transform the way healthcare professionals learn and develop their skills.

Conclusion

In conclusion, the digital induction guide developed for the oncology research team represents a significant step forward in the use of technology to enhance healthcare education. By leveraging the power of digital platforms, the guide provides a user-friendly, engaging, and effective resource for new team members, helping to facilitate their integration into the team and supporting their ongoing professional development. As healthcare continues to embrace digital transformation, resources like this induction guide will play an increasingly important role in ensuring that professionals are well-prepared to meet the challenges of their roles. The success of this project serves as a testament to the value of digital tools in healthcare education and offers a model that can be adapted and applied in a wide range of settings.

The Parliamentary Assembly of the Union for the Mediterranean: Evaluation of Its Work and Challenges

DOI: 10.31038/PSYJ.2024643

Abstract

This research aims to evaluate the works and challenges of the Parliamentary Assembly of the Union for the Mediterranean (PA-UfM). The Union for the Mediterranean and The Parliamentary Assembly of the Union for the Mediterranean are the two most important regional cooperation tools in the Euro-Mediterranean area. The origin of the Euro-Mediterranean commit to the cooperate is “The Barcelona Process”, an initiative launched in 1995 to promote cooperation and dialogue between the European Union (EU) and countries in the Mediterranean region.

To achieve the evaluation of its work, we study the political recommendations that have been made in the plenary sessions of the PA-UfM in the period 2014-2024; we have studied the agenda of the Spanish rotating presidency of the PA-UfM; and evaluated the results of the Conferences of Presidents of the PA-UfM member parliaments (Summit of Speakers).

The methodology of this study is quantitative, and it combines techniques of analysis of content, the technique of the participant observation and study case,

Keywords

Euro-Mediterranean partnership, Barcelona process, Regional cooperation, Stability, democracy, Union for the Mediterranean, Parliamentary Assembly of the Union for the Mediterranean

Introduction

The Parliamentary Assembly of the Union for the Mediterranean is the parliamentary debate forum for the representatives of the parliaments of the 42 states that make up the Union for the Mediterranean. Since the creation of the Union for the Mediterranean (2008), this alliance between the member states of the European Union and 16 States on the southern and eastern shores of the Mediterranean have wanted to have a parliamentary dimension that would give continuity to the regional integration project that defined in the Barcelona Process established in 1995. The initial form of inter-parliamentary cooperation was the Euro-Mediterranean Parliamentary Forum, which was first convened in 1998. Delegates from the European Parliament and the national parliaments of the EU Members and Southern Mediterranean partners attended this forum. The European Parliament initiated the Forum’s conversion into a genuine Euro-Mediterranean Parliamentary Assembly (EMPA) through a resolution. In 2002, the fifth Euro-Mediterranean Conference of Foreign Ministers in Valencia approved this resolution. Following, the EMPA’s inaugural sitting was held in Greece in March 2004. At the sixth plenary session, held in Amman in March 2010, EMPA’s name was changed to Parliamentary Assembly of the UfM (PA-UfM). This name emphasizes the PA-UfM’s unique role as the parliamentary body of the UfM, with a focus on democratic control and its consultative role.

Methodology

The methodology of this research is quantitative. It combines techniques of analysis of content, the technique of the participant observation because one of the two authors was a member of the PA-UfM, and study case, focusing specifically in the Parliamentary Assembly of the Union for the Mediterranean.

Hypothesis

The hypothesis of this study are the followings:

H1. Final recommendations (2014-2024) of the plenary session of PAUFM are sensitive to the geopolitics of the moment rather than long-term strategic lines.

H2. As for the agenda of the Spanish presidency, it tends to give continuity to the Moroccan agenda for the points of contact between the two countries regarding the issue of regular and irregular immigration.

H3. The Summit of speakers should be a structured forum to define the work of the parliamentary assembly during a certain period of time.

Theoretical and Contextual Framework

The Euro-Mediterranean Region and its Partnership

The Mediterranean has traditionally been a regional meeting point for state and interstate actors who, despite sharing problems, strengths, and weaknesses, do not share rhythms of political, economic and social development. It is precisely the desire to share and collaborate between these various actors at the regional level that the Barcelona Process (1995) launched the Euro-Mediterranean partnership project. The European Council noted in Lisbon in June 1992 that, like the Middle East, the southern and eastern shores of the Mediterranean were crucial to the EU’s security and social stability [1].

The Euro-Mediterranean Partnership, also known as the Barcelona Process, is a cooperative framework that aims to promote stability and prosperity in the Mediterranean region. It was launched in 1995 in Barcelona, Spain, by the European Union (EU) and 12 Mediterranean countries: Algeria, Cyprus, Egypt, Israel, Jordan, Lebanon, Malta, Morocco, Palestinian Authorities, Syria, Tunisia, Turkey [2].

The partnership [3] was based on three main pillars:

  1. Political and Security Dialogue: This pillar focuses on promoting peace, stability, and security in the region through political dialogue and cooperation on issues such as conflict prevention, counterterrorism, and non-proliferation of weapons of mass destruction.
  2. Economic and Financial Partnership: this pillar aims to enhance economic integration and development in the region by promoting trade liberalization, investment, and economic reforms. It includes initiatives such as the Euro-Mediterranean Free Trade Area (EUROMED FTA) and financial assistance programs.
  3. Social, Cultural, and Human Partnership: this pillar aims to foster mutual understanding, dialogue, and cooperation among peoples and cultures of the Euro-Mediterranean region. It includes initiatives to promote cultural exchange, education, civil society participation, and human rights.

Over the years, the Euro-Mediterranean Partnership has faced challenges, including political tensions, economic disparities, and security threats [4]. However, it remains an important framework for promoting cooperation and addressing common challenges in the Euro-Mediterranean region, and especially after the institutionalization process that entails the foundation of the Union for the Mediterranean (UfM) and the Parliamentary Assembly of the Union for the Mediterranean (PA-UfM).

Some authors have discussed whether the institutionalization strategies of a regional partnership such as the Euro-Mediterranean are effective if they are not accompanied by agreed policy declarations and the focus of the respective problems of the northern and southern countries with solutions that come directly from the affected countries [5-7]

The Union for the Mediterranean (UfM)

The Union for the Mediterranean (UfM) is an intergovernmental organisation that brings together 43 countries to strengthen regional cooperation and dialogue through specific projects and initiatives that address inclusive and sustainable development (Esseghir & Haouaoui Khouni, 2014), stability and integration in the Euro-Mediterranean area. The Union for the Mediterranean (UfM) was launched at the Paris Summit for the Mediterranean in 2008. As a direct continuation of the Barcelona Process (1995), the launch of the UfM in 2008 was the reflection of its member states who shared political commitment to enhance the Euro-Mediterranean Partnership.

It was in the context of the Euro-Mediterranean Partnership meeting of foreign ministers, held in Valencia on 22–23 April 2002, that it was decided ‘to recommend the creation of a Euro-Med Parliamentary Assembly’, which will only include members of the European Parliament (MEPs) and parliamentarians from the southern shores

The organization has always undertaken a diverse range of projects and initiatives to promote inclusive regional sustainable development and integration [8]. The main focus is on women’s rights, job creation, fostering cross-country connectivity efforts and addressing environmental and climate emergencies. It also prioritizes grant schemes and programmes to encourage entrepreneurship and job opportunities for young people, recognizing their crucial role in shaping the region’s future [9].

The headquarters of the UfM is in BCN and its 43 member states are the followings: Albania, Algeria, Austria, Belgium, Bosnia and Herzegovina, Bulgaria, Croatia, Cyprus, Czech Republic, Denmark, Egypt, Estonia, Finland, France, Germany, Greece, Hungary, Ireland, Israel, Italy, Jordan, Latvia, Lebanon, Lithuania, Libya, Luxemburg, Malta, Mauritania, Monaco, Montenegro, Morocco, The Netherlands, North Macedonia, Palestine, Poland, Portugal, Romania, Slovakia, Slovenia, Spain, Sweden, Syria, Tunisia and Turkey.

Regarding the structure of the UfM we should mention [10]:

Senior Officials

The Member States meet on a regular basis at the level of Senior Officials from the Ministries of Foreign Affairs. The Senior Officials Meetings (SOM) provide the framework to discuss the current regional context, coordinate the work of the UfM Secretariat and endorse new development projects to which the UfM label is given.

The Co-Presidency

The UfM works on the basis of the principle of co-ownership. So do, and since 2012, there is a Northern and Southern co-presidency.

Secretariat

It was established in 2010 in Barcelona. It is the first permanent structure dedicated to the implementation of this partnership. It ensures operational follow-up of the regional priorities and supports the implementation of region-wide cooperation projects and initiatives.

Parliamentary Assembly of the UfM (PA-UfM)

It is considered the parliamentary body of the UfM, although it has its all functioning process ad total autonomy.

The methodology of work used by the UfM is based on three main tools: policy (building common thematic agendas), platforms (fostering regional dialogue) and projects (translating the policy dimension into tangible impact).

The Parliamentary Assembly of the UFM (PA-UfM)

As mentioned above, since the creation of the UfM it was clear that the unique way of creating an effective and real regional integration process, was with a parliamentary assembly. The initial form of inter-parliamentary cooperation was the Euro-Mediterranean Parliamentary Forum, which was first convened in 1998. Delegates from the European Parliament and the national parliaments of the EU Members and Southern Mediterranean partners attended this forum.

The European Parliament initiated the Forum’s conversion into a genuine Euro-Mediterranean Parliamentary Assembly (EMPA) through a resolution. In 2002, the fifth Euro-Mediterranean Conference of Foreign Ministers in Valencia approved this resolution. Following, the EMPA’s inaugural sitting was held in Greece in March 2004. At the sixth plenary session, held in Amman in March 2010, EMPA’s name was changed to Parliamentary Assembly of the UfM (PA-UfM). This name emphasizes the PA-UfM’s unique role as the parliamentary body of the UfM, with a focus on democratic control and its consultative role.

The following countries have parliamentarians in the PA-UfM: Albania, Algeria, Austria, Belgium, Bosnia and Herzegovina, Bulgaria, Croatia, Cyprus, Czech Republic, Denmark, Egypt, Estonia, Finland, France, Germany, Greece, Hungary, Ireland, Israel, Italy, Jordan, Latvia, Lebanon, Lithuania, Luxemburg, Malta, Mauritania, Monaco, Montenegro, Morocco, The Netherlands, Palestine, Poland, Portugal, Romania, Slovakia, Slovenia, Spain, Sweden, Syria, Tunisia, Turkey

Considering its functions the PA-UfM provides parliamentary impetus, input and support for the consolidation and development of the Euro-Mediterranean Partnership; It expresses its views on all issues relating to the Partnership, including the implementation of the association agreements; and finally adopts resolutions or recommendations, which are not legally binding, addressed to the UfM and its members.

Regarding the structure we should mention:

Assembly

Plenary Session

The meeting of all the parliamentarians which represent their respective countries.

Standing Committees

The PA-UfM has five standing committees which indicate the focus areas of the Parliamentary Assembly. These committees are responsible for monitoring their respective thematic areas of the Euro-Mediterranean partnership and meet at least once a year. Each committee consists of 56 members, of which 28 are from the Mediterranean partner countries, 19 are from EU national Parliaments, and nine are members of the European Parliament. Each parliamentary committee elects a chairperson and three vice-chairpersons that serve a two-year term.

Working Groups

There are currently two working groups. On the one hand, “The Working Group on Financing of the Assembly and Revision of the Rules of Procedure” which discusses and revises the PA-UfM Rules of procedures and financial regulation. On the other one, “The Working Group on the post-Covid economy in the Mediterranean” which works systematically analysing the post covid situation in the Mediterranean region.

Permanent Secretariat

It assists the Assembly and its bodies in the preparation, proper management, and follow-up of their work. It is coordinated and managed by the Secretary-General. Its headquarters is in Rome.

Bureau

It is responsible for coordinating the work of the Assembly. It is the body responsible to represent the Assembly for matters regarding relations with the other institutions. The Bureau of the PA-UfM consists of four members appointed for a four-year mandate: two appointed by the Southern Mediterranean partner countries, one appointed by the EU national parliaments and one appointed by the European Parliament. The European Parliament is a permanent member of the Bureau.

Presidency

The Assembly shall be chaired by one of the members of the Bureau, in rotation and on an annual basis, thus ensuring parity and alternate South/North presidencies. The three other members of the Bureau shall be Vice-Presidents.

The Summit of Speakers

The Speakers of Parliament of each member country of the PA-UfM gather annually for the Summit of Speakers.

As a north- south forum, the Assembly brings together 44 parliaments — the 43 parliaments of the countries in the Union for the Mediterranean, and the European Parliament. The Assembly consists of 278 members:

138 Members come from the northern shore of the Mediterranean, made up of 49 members from the European Parliament and 81 members from the EU’s 27 national parliaments (three members per country) and 8 members from the four European Mediterranean partner countries (Albania, Bosnia and Herzegovina, Monaco and Montenegro, with two members each).

140 members represent the southern shore: 130 members from the ten founding Mediterranean partners (13 members per parliament) and 10 members from the Mauritanian parliament.

Study Case

As mentioned before, the Parliamentary Assembly of the UfM was a crucial tool to work effectively for a real regional cooperation. In this investigation we wanted to focus specifically in three main aspects to qualify PA-UfM as an effective tool: the final political recommendations from plenary sessions; the agenda of the Spanish presidency of the PA-UfM; the Summit of Speakers.

Final Recommendations from Plenary Sessions

In this section we want to study the final recommendations from the plenary sessions in the period 2014-2024. Each plenary session makes generally three types of recommendations: political, economic, and cultural. Those that are approved are incorporated into the “final recommendations” document that concludes each plenary session. Moreover, every plenary session is focused in one thematic issue.

Note the Assembly decides by consensus. The quorum is the majority of the delegations plus one within each of the two components of the Assembly, that is, the European and Mediterranean components. Alternatively, when it is not possible for the Assembly to adopt its decisions by consensus, it will adopt its decisions by a qualified majority of at least 2/3 of the votes of the members present from each of the two shores of the Mediterranean, in the presence of at least half plus one of the members of both components of the Assembly. Although the resolutions of the Assembly are not legally binding they are politically valuable.

It should be noted that the plenary meetings that were held in the period studied (2014-2024) were eight. More specifically, the annual meeting scheduled for 2020 in Antalya (Turkey) had to be cancelled due to the pandemic and was held on December 3 and 4, 2021 in Brussels under the presidency of the European Parliament. Little news was recorded about this meeting even under the impact of the health crisis. In 2022 and 2023, plenary sessions of the PA-UfM were not held due to the impact of the global health crisis caused by the Covid-19 virus.

In the next figure you can find a summary of the most important political recommendations from plenary sessions of the PA-UfM:

Plenary session

Place Thematic issue

Political recommendations

10th Amman 2014 corruption in Europe and the southern Mediterranean countries post-2011 Tackling corruption and facilitating asset recovery.
11th Lisbon2015 Human Rights, migrations, and terrorism – Promoting human rights- Securing the safety of migrants in the Mediterranean

-Fighting against terrorism

– creation of a special internet platform for ‘Euro-Mediterranean inter-parliamentary cooperation’

12th Tangier2016 building a better intercultural Mediterranean anchorage for shared development in terms of peace and security and for sustainable development that takes into consideration climate change and protection of the environment in the Mediterranean. -stability and security.-Condemns terrorism and violent extremism.

-Refugees and conflicts: Syria, Iraq and Libya

-Support the establishment of the Government of National Unity in Libya as the sole legitimate government.

-Concerned about the deteriorating human rights situation in Egypt and calls on Egyptian authorities to respect their obligations.

13th Rome 2017 Employment in the EM area, in a context of sustainable development Concern about a lack of a global and effective strategic line. It invites us to analyse successes and failures nine years after the constitution of the Parliamentary Assembly of the Union for the Mediterranean.-Stability and security of the Mediterranean.

-Firmly condemns all terrorist acts that represent a common threat to both shores of the Mediterranean.

– improve the governance of the UfM by holding annually in Barcelona a ‘Regional UfM Forum’

-Collective response to Migration.

-encourage the revival of regional integration in the Southern Mediterranean, in particular the Arab Maghreb Union.

-Improve the social integration and employability of young people.

-Water supplies: Gaza desalinisation plant project, project to decontaminate Lake Bizerte in Tunisia and the European Investment Bank’s recent support, worth 70 million euros, for the EuroMediterranean University

14th Cairo2018 countering terrorism in EM region -combating terrorism and preventing violent extremism.-Condemning all sorts of violence and terrorism acts.

-Urges the UfM member states to strengthen judicial and police cooperation and the exchange of data and information in the field of combating terrorism.

– permanent network for exchange of information and best practices between anti-terrorist partner centres in the Mediterranean countries.

-combating the trafficking of weapons.

– UfM member states to improve the monitoring of suspicious financial movements

– the urgent need to improve young people’s social integration and employability

15th Strasbourg 2019 The challenges of migrants and refugees in the Mediterranean -shared management of the migration phenomenon and therefore greater cooperation and solidarity among the countries involved.-addressing the root causes of migration, hence the need to provide young people with adequate training. -the fight against traffickers and the importance of rescues at sea.

-the impact of migrants and refugees on host societies.

-awareness of the impact of migration on the countries of the southern shore, which from transit countries have become countries of arrival.

-Palestinian refugees who have been living outside their country for seventy years.

16th Antalya2020. Postponed until December 2021 due to the Covid-19 Pandemic. Multiculturalism and xenophobia. COVID-19 pandemic, regional conflicts, migration, jobs opportunities and education.
16th bis On-lineFebruary 2021 The fight against climate change in the Mediterranean Region Global joint approach at an Euro-Mediterranean level to common challenge.Adoption of the New Agenda for the Mediterranean.

Renewed partnership with the Southern Mediterranean countries

17th Rabat2024 The Rabat Spirit -condemned violence in Gaza and West Bank, insisting on a need of a ceasefire.-Reactivate Israeli-Palestinian peace process.

-Threat of terrorist groups taking advantage of instability in some areas of the Mediterranean region.

-Climate change, health security, migration issues and human trafficking

Source: own elaboration based on data available in www.paumf.org

From the analysis of the contents of the resolutions and political recommendations of the PA-UfM plenary sessions analyzed, we can highligh:

  • There is not a multi-year work plan that defines a coherence or common thread in the work of the plenary sessions analyzed.
  • The topics discussed and the resolutions approved were raised each year in the light of current political, economic and social issues. Prevailing: fight against corruption, fight against terrorism, legal migration policies, human rights, climate change, impact of the Covid-19 virus pandemic, education, job opportunities, human trafficking, and rescues of migrants at sea, judicial and police cooperation between Member States. It is detected that the topics discussed in a plenary session do not have follow-up or evaluation in the following plenary session.
  • Current political issues and regional crises prevail in the resolutions depending on the years. Thus, in the years analyzed there were statements about the hope for political changes in the region (in reference to the so-called Arab Spring), concern about the deterioration of human rights in Egypt, a call for support for the Government of the National Union of Libya, concern for refugees from Syria, Iraq and Libya, reactivation of the Israel-Palestine conflict following the Hamas terrorist attacks on the Israeli population on October 7, 2023 and the subsequent Israeli military offensive on the Gaza Strip.
  • In the various plenary sessions of the PA-UfM, concern has been expressed about the lack of a global and effective strategic line in the work of the Parliamentary Assembly. Thus, in the 2017 plenary session, the criticism was expressed explicitly and in the following terms:
    “Concern about a lack of a global and effective strategic line. It invites us to analyze successes and failures nine years after the constitution of the Parliamentary Assembly of the Union for the Mediterranean.”
  • For a better governance of the UfM, in 2017 the plenary session proposed and supported the holding of an annual meeting of Foreign Ministers of the Member States in Barcelona under the format of “Regional UfM Forum”. Without replacing the meetings of Heads of State and Government, this new form of governance was intended to streamline dialogue between the parts and the decision-makers. In recent years, the highest and most operational level of meeting of the Governments of the Member States occurs through the annual ministerial meetings held annually in the month of November in Barcelona. To date, eight UfM Regional Forums have been held.
  • The “south-south” regional integration of the Mediterranean has been another of the lines on which the plenary sessions have repeatedly positioned themselves. Today, the “south-south” integration of the countries on the southern shore of the Mediterranean is in a phase of paralysis.
  • In some cases, the PA-UfM has stopped supporting specific development projects of some member states such as water supplies, Gaza desalination plant project, the project to decontaminate Lake Bizerte in Tunisia and the European Investment Bank’s recent support, for the Euro-Mediterranean University). Given the distrust of diligent and compliant use of public funds allocated to the projects, the Parliamentary Assembly has appointed reporters to study and monitor the projects. These types of speakers in some UfM projects are the maximum expression of the “parliamentaryization” of the decisions made by an eminently intergovernmental policy.

The Agenda of the Spanish Presidency of the PA-UfM

Initially, the presidency of the Congreso de los Diputados, which is also the presidency of the Cortes Generales (joint meeting of the Congress of Deputies and the Senate), should chair the Parliamentary Assembly of the Union for the Mediterranean in the period 2022-2023. This was publicly announced in July 2020 under the presidency of Meritxell Batet. According to the rotation criteria between countries in the north and south of the Mediterranean, the president of the Congreso de los Diputados is part of the bureau of the PA-UfM in the period 2020-2024. Due to the health crisis of the Covid-19 pandemic and a long cycle of repeating general elections between 2019 and 2023, the Spanish presidency of the PA-UfM was postponed until early 2024. This meant that the previous presidency of the president of the Moroccan Parliament, Rachid Talbi El Alami, extended his mandate beyond the planned deadlines.

Francina Armengol, the president of Congreso de los Diputados since August 17, 2023, assumed the presidency of the PA-UfM on February 16, 2024 in Rabat at the closing of the 17th Plenary Session of the PA-UfM. President Armengol assumed her position for a period of one year. In President Armengol’s speech before the plenary session of the UfM meeting in Rabat, she highlighted the priorities of her presidency: “the need to establish peace, reduce economic disparities between the North and the South, fight against climate change and better manage the migration issue”. On the same day, February 16, 2024, the president of Congreso de los Diputados published a message on social network X in the following terms:

“It is an honor to assume the presidency of the Parliamentary Assembly of the Union for the Mediterranean, a great opportunity to continue strengthening ties of international cooperation in the region. We work as a network for a peaceful Mediterranean that protects human rights and guarantees equal opportunities for all people, wherever they are born and wherever they live. Thank you for the welcome and for passing the baton, Rachid Talbi Alami”.

At the time of writing this research, three months after the assumption of the presidency, there is no reference to the Spanish rotating presidency of the PA-UfM either on the PA-UfM website or on the Spanish Parliament website. At this point, the poor political momentum that has so far been given to the rotating Spanish presidency of the PA-UfM must be highlighted. It should be noted that on June 6-9, 2024, elections to the European Parliament will be held in the different member states of the European Union. This will mean a paralysis of the European Parliament’s involvement in the PA-UfM for a period of several months. Until the new European Parliament is formed and its 720 members take office, and the parliamentary delegations are formed, the PA-UfM will remain inactive. All of this could lead to the celebration of the next plenary session of the PA-UfM until autumn. This should not be an excuse for the priorities of the Spanish presidency and for not updating the public information of the respective websites of the PA-UfM and Congreso de los Diputados.

The Summit of Speakers

The Speakers of Parliament of each member country of the PA-UfM meet annually for the Summit of Speakers. Although the availability of the information is very poor, here we expose some information of the lasts Summit of Speakers:

Speakers summit

Date and place Thematic issue

Comments and main conclusions

1st Amman, 2014 Corruption in Europe and the southern Mediterranean countries post-2011 Document not available.
2nd Lisbon2015 Human Rights, migrations and terrorism Document not available.
3th Tangier2016 Building a better intercultural Mediterranean anchorage for shared development in terms of peace and security and for sustainable development. Document not available.
4th Rome,2017 Employment in the EM area, in a context of sustainable development Document not available.
5th Cairo (Egypt), 2018 Countering terrorism in EM region Document not available.
6th Strasbourg,2019, Challenges of migrants and refugees in the Mediterranean Antonio Tajani, President of the European Parliament, and Dimitris Avramopoulos, EU Commissioner for MigratioN attended the Summit. They underlined the importance to address current migration challenges with a joint Euro-Mediterranean approach.-The resulting resolution of the Summit did not include any reference to the Global Compact for Migration, adopted at the end of 2018. This followed the line of dissonances within EU member states, which was particularly visible during EU-LAS Ministerial meeting on Foreign Affairs on February 4, 2019 in which Hungary’s veto did not allow for a common European position on migration.
7Th Brussels, videoconference, 2021 Fight against climate change in the Mediterranean region -It was adopted a declaration taking stock of some of the most pressing consequences of global warming and a changing environment on both shores of the Mediterranean.-Singularly, a member of the Delegation of the Croatian Parliament to the Parliamentary Assembly of the Union for the Mediterranean and envoy of the Speaker of Parliament Marko Pavić participated at the Summit.
8th Rabat, 2024 The Rabat Spirit The declaration includes:-A call for giving to the economic dimension to priority.

-A call for a greater commitment of the PA-UfM member states with enforcing policy coordination between them.

-A condemn of violence in Gaza and West Bank, insisting on a need of a ceasefire.

-Reactivate Israeli-Palestinian peace process.

-Threat of terrorist groups taking advantage of instability in some areas of the Mediterranean region.

-Climate change, health security, migration issues and human trafficking

Source: own elaboration based on data available in www.paumf.org

From the analysis of the data presented in the table above, we see that the lack of searchable data is evident, a fact that has not allowed us to do a more exhaustive analysis of the content of the “Summit of Speakers”. In any case, and considering the little information we have, the “Summit of Speakers” positions itself on the same topics that were discussed in the plenary session but making statements with a more institutional tone.

In any case, the formula of the annual “Summit of Speakers” meeting of the member parliaments of an international parliamentary assembly, is a common practice that improves the coordination mechanisms and the political momentum of the parliamentary dimension of the international organization. In this sense, it is worth pointing out other already consolidated experiences such as the meeting of presidents of parliaments of the member states of the Council of Europe. These meetings have been held since 1975 and the meeting takes place every two years, alternating a meeting in Strasbourg, headquarters of the Council of Europe, and a meeting in the capital of the State that at that time held the presidency of the Council of Ministers of the international pan-european organization. The Conference of speakers of the EU Parliaments (EUSC) is another stable coordination platform between the presidents of the national parliaments of the EU member states. Detailed information on the documentation and conclusions of each conference of presidents of the EU member states is found in the European Parliament’s database. It should be noted that all members of the EUSC are also members of the conference of presidents of the Parliamentary Assembly of the Union for the Mediterranean. The conference of presidents of the member states of the European Economic Communities (precedent of the EU) met for the first time in Italy, specifically in Rome, on January 11, 1963. The next meeting took place ten years later in France, at the Paris meeting of 1973. Meetings took place in 1975 until 1978. The 1980 meeting was not held and since 1981 and without interruption there has been an annual meeting of presidents of parliaments of the Member States.

These meetings have a permanent secretariat based on the respective international organizations, the Council of Europe and the European Parliament, and a thread of continuity and coherence can be seen in their work.

Conclusions and Hypothesis Validation

Conclusions

Since the creation of the Parliamentary Assembly of the Union for the Mediterranean in March 2004 in Athens, it has become a new forum for parliamentary dialogue involving the parliamentary delegations of all EU Member States and the member states of the UfM of its southern shore. It is the only international parliamentary forum where parliamentary delegations from Israel and Palestine have historically met. Their work has contributed to deepening a common Euro-Mediterranean policy.

Despite this, the approaches and expectations of the parliamentary delegations have been divergent at various times. While for the parliaments of the Member States of the European Union it is basically a forum for debate on the EU’s neighbourhood policy with its southern border, for the countries of North Africa and the Middle East it has been considered as the forum for debate on a regional integration policy. It is worth remembering that before the existence of the UfM, the Barcelona Process of 1995 promoted a regional integration policy in areas such as the economy, education or free trade that only involved states with territories bathed by the Mediterranean Sea. This divergence of expectations and the desire to integrate countries from central and northern Europe into the PA-UfM has braked the rhythm of the regional integration that marked the Barcelona Process. The level of collaboration and parliamentary discussion with the countries of the EU’s eastern partnership has never reached the level of institutionality of the UfM.

From the analysis of the PA-UfM plenary sessions held in the period 2014-2024, we can conclude that:

  • There is a no consistent and evaluable multiannual work program that has allowed relevant progress in the work of Euro-Mediterranean parliamentary diplomacy.
  • The political pronouncements of each plenary session are often related to crisis situations in one of the Member States or geopolitical situations that mark the political agenda of the moment.
  • The main aspects addressed in the years analysed are: fight against corruption, fight against terrorism, legal migration policies, human rights, climate change, impact of the Covid-19 virus pandemic, education, job opportunities, human trafficking, rescues of migrants at sea and judicial and police cooperation between Member States.
  • The UfM parliamentary assembly itself has been aware of its crisis of consistency and structuring of its work when in one of its resolutions from the Rome session of 2017 it expressed its “concern about the lack of a strategic and global line of work” in their jobs.
  • The Parliamentary Assembly promoted in a resolution of its 2017 plenary session the celebration of the annual meeting of the “Regional UfM Forum”. This represents the annual meeting in November of each year in Barcelona of the ministers of Foreign Affairs of the different member states. It is a space for political promotion of the Euro-Mediterranean agenda in the absence of meetings of Heads of State and Government initially provided for in the institutional design of the UfM.
  • The permanent Secretary General of the UfM and its deputy secretaries regularly participate in the plenary sessions of the PA-UfM to report on the sectorial policies they promote to comply with intergovernmental agreements.
  • The PA-UfM took a step forward in its consolidation as a forum for monitoring and controlling the policies of the Secretariat and intergovernmental conferences, when in 2017 created the figure of rapporteurs to monitor sectorial policies developed with public funds from the EU and to avoid potential bad practices. This is one of the most outstanding exercises of parliamentary control and accounting of the UfM that the PA-UfM has achieved.

The access to information, accounting, and transparency regarding the work of the PA-UfM has much room for improvement. Several public documents are not available on the PA-UfM website and the website itself is not updated regarding the rotating presidency of the PA-UfM. The Permanent Secretariat of the PA-UfM is based in Rome and according to the information provided by the official website, the position of Secretary General has been vacant since June 2021. Precisely, the news of a vacancy notice of the PA-UfM remains on the official website so, with no news saying that the position has been filled. The lack of dynamization of the work by the secretariat can explain the lack of information and impetus in the works of the organisation.

As mentioned, the Spanish rotating presidency of the PA-UfM was assumed by the president of the Congreso de los Diputados, Francina Armengol, on February 16, 2024. Beyond the political declaration made by the new president on the day of her election, there is no information about the priorities of the presidency neither on the PA-UfM website (which still announces the February 2024 meeting) nor on the website of the Congreso de los Diputados and its sections dedicated to the presidency or international affairs. With the elections to the European Parliament taking place from June 6 to 9, 2024, it is foreseeable that the new delegation of Members of the European Parliament to the PA-UfM will not be appointed until autumn 2024, which means that a few months of inactivity for the PA-UfM are expected. Initially, it was planned that the presidency of Congreso de los Diputados would assume the rotating presidency of the PA-UfM in the period 2022-2023, but due to the institutional paralysis caused by the effects of the Covid-19 pandemic and the situation of early elections in Spain in 2023, the Spanish presidency was not assumed until February 2024. Meanwhile, the presidency of the Moroccan parliament did extend beyond its natural term.

The conference of presidents of parliaments of the Member States of the Parliamentary Assembly of the Union for the Mediterranean (Summit of Speakers) has been held since 2014 and met uninterruptedly from 2014 to 2019. The year 2020 was not held due to the Covid-19 pandemic. The year 2021 was carried out electronically and did not meet again until February 2024. The conference of presidents of the parliaments of the member states of the PA-UfM is an instrument of coordination and political impetus for the parliamentary dimension of the work of the Union for the Mediterranean. It is worth highlighting the analysis of the conferences studied and the contents of their statements:

  • The mere fact of the meeting of the presidents of the PA-UfM member states already represents a positive framework for promoting the parliamentary dimension of the UfM. However, a long-term work plan that coordinates the work of the different rotating presidencies cannot be identified.
  • The vacancy in the position of general secretary of the PA-UfM since 2021 has undoubtedly had an impact on the coordination capacity and political momentum of the Summit of Speakers meetings.
  • Access to information on the resolutions of Summit of Speakers meetings is not available on the PA-UfM website or on the website of the European Parliament in their editions from 2014 to 2018. Only content from the years 2019, 2021 and 2024 are available.
  • Other meetings of presidents of Parliaments of Member States of international organizations demonstrate more systematized practices and a multi-year work program. Thus, the conference of presidents of parliaments of Member States of the Council of Europe, which has been held biannually since 1979, and the conference of presidents of the Member States of the EU, which has been held annually since 1981, are two examples of consolidated and well-structured meetings. Considering that the presidents of the parliaments of the EU Member States are also members of the PA-UfM Summit of Speakers, the good practices of the meeting of EU presidents could serve as a basis for increasing the organization, visibility, planning and monitoring of the Summits of Speakers.

Validation of Hypothesis

Considering the information and analysis offered in this research and regarding the hypothesis previously mentioned, we consider que can validate H1 and partially validate H2 and H3.

  • Final political recommendations (2014-2024) of the plenary session of PA-UfM are sensitive to the geopolitics of the moment rather than long-term strategic lines. We consider that we can validate this hypothesis after analysing the contents of the political recommendations of the Plenary sessions. Issues such as political statements about terrorist attacks and regional conflicts are typical. It is difficult to find any ambitious and long-term plan approved by the Assembly in the years studied.
  • As for the agenda of the Spanish presidency, it tends to give continuity to the Moroccan agenda for the points of contact between the two countries regarding the issue of regular and irregular immigration. We consider that the lack of information about Spanish presidency of PA-UfM don’t allow us to validate the hypothesis, however, looking at the bilateral political positions of Spain and Morocco in the field of immigration, a shared agenda can be detected between them.

H3. The Summit of speakers should be a structured forum to define the work of the parliamentary assembly during a certain period of time. We consider that this hypothesis can be partly validated due to the lack of information available about the “Summit of Speakers”, but also due to the lack of internal structuring of these meetings at the highest level between the speakers of the respective state parliaments members.

References

  1. Gillespie R (2011) The Union for the Mediterranean: An Intergovernmentalist Challenge for the European Union? JCMS: Journal of Common Market Studies 49: 1205-1225.
  2. Stavridis S (2002) The Parliamentary Forum of the Euro-Mediterranean Partnership: An Assessment. Mediterranean Politics 7: 30-53.
  3. Edwards G, Philippart E (1997) The Euro-Mediterranean Partnership: Fragmentation and Reconstruction. European Foreign Affairs Review 2: 465-489.
  4. Youngs R (Ed.) (2017) Twenty Years of Euro-Mediterranean Relations. Routledge
  5. Esseghir A, Haouaoui Khouni L (2014) Economic growth, energy consumption and sustainable development: The case of the Union for the Mediterranean countries. Energy 71: 218-225.
  6. Schäfer I (2007) The Cultural Dimension of the Euro‐Mediterranean Partnership: A Critical Review of the First Decade of Intercultural Cooperation. History and Anthropology 18: 333-352.
  7. Stavridis S (2008) The Euro-Mediterranean Partnership (EMP): Perspectives from the Mediterranean EU Countries Mediterranean Politics 13: 1.
  8. Colefice A (2016) Parliamentary Diplomacy and the Arab Spring: Evidence from the Parliamentary Assembly of the Mediterranean and the European Parliament. Mediterranean Quarterly 27: 100-118.
  9. Bicchi F (2012) The Union for the Mediterranean, or the Changing Context of Euro-Mediterranean Relations. The Union for the Mediterranean Routledge.
  10. Balfour R (2009) The Transformation of the Union for the Mediterranean. Mediterranean Politics 14: 99-105.

Prevalence of Temporomandibular Joint Ankylosis in a Sample of Yemeni Population

DOI: 10.31038/JDMR.2024721

Abstract

Background and Aim: Temporomandibular joint ankylosis (TMJA) is a fusion of the head of the mandibular condyle to the glenoid fossa of temporal bone at the skull base. This fusion is either fibrous, osseous, or fibro-osseous. The objective of this study is to determine the prevalence of TMJ ankylosis.

Material and Methods: This retrospective cross-sectional study was carried out in all patients who admitted in maxillofacial departments in the period January 2018 to September 2022 in Al-Thawra, Al-Gumhouri, 21 September, Al-Kuwait, Modern European Hospital, and University of Science and Technology Hospital, all these hospitals in Sana’a city. This study was based on data taken from patients’s files that include: age, gender, date of operation, etiology, side of ankylosis, type of radiograph, type of ankylosis, and type of treatment.

Results: Among the 55 patients, 63.6% were male and 36.4% were female. The mean (SD) age of patients was 15.27 <0x7E> 10.02 years (age range 4 to 55 years). Trauma was the most common cause of TMJ ankylosis (85.5%). Unilateral ankylosis was more common than bilateral; in unilateral right and left sides of TMJ, ankylosis was in equal frequency (14,50%).. A CT scan was the most radiographic x-ray used for the diagnosis of TMJ ankylosis (74.5%). Osseous ankylosis (34.5%) was the most frequent type, followed by fibroosseous (32.7%) and fibrous (21.8%). Gap arthroplasty was the most common type of treatment (29.1%).

Conclusions: In this study we revealed that the ankylosis was more prominent in males because males were more susceptible to trauma, which was the most common cause of TMJ ankylosis. A CT scan was the most radiographic x-ray used for the diagnosis. Cases of unilateral ankylosis were more than bilateral. Osseous ankylosis was the most frequent type. Gap arthroplasty was the most common type of treatment.

Keywords

Temporomandibular joint ankylosis (TMJA), Prevalence, Sana’a, Yemen

Introduction

The fusing of the mandibular bone’s condyle to the temporal bone’s glenoid fossa at the base of the skull is known as temporomandibular joint (TMJ) ankylosis [1]. It can develop at any age, but it is more frequent in children under the age of ten [2,3]. TMJ is regarded as the cornerstone of craniofacial integrity, so ankylosis in children causes mandibular disturbances because malocclusion from growth period results in distressing conditions like poor oral hygiene, impaired speech, difficulty chewing, facial disfigurement, compromised airway, and psychological stress [4]. Clinical manifestations of TMJA depend on the age at which ankylosis onset, the period of TMJA persistence, and whether the ankylosis is unilateral or bilateral. When it affects children before their growth has stopped, it causes severe problems in mastication, digestion, speech, and oral hygiene [5,6]. Clinical manifestations in unilateral ankylosis: facial asymmetry, the mandible and chin deviated to the affected side, the face on the affected side is roundness and fullness, and the lower border of the mandible on the affected side has a concavity that ends in a well-defined antegonial notch. Whereas in bilateral ankylosis, the mandible is symmetrical but small in size (retrognathic/micrognathic), there is an inability to open the mouth progresses by a gradual decrease in interincisal opening, “bird face” deformity with receding chin and the patient has a convex profile, the neck-chin angle may be reduced or almost completely absent, the antegonial notch is well defined bilaterally, and class II malocclusion can be noticed [7].

Additionally, in severe cases of TMJA, it can move the tongue posteriorly and reduce the size of the oropharyngeal airway, which can eventually cause upper airway obstruction and obstructive sleep apnea syndrome (OSAS). As a result, growing children often present a triad of symptoms, as follows: TMJ ankylosis, micrognathia, and OSAS [8]. TMJ ankylosis can be intraarticular or true and extraarticular or false. Most commonly, intraarticular ankylosis appears after trauma or infection, whereas in extraarticular type it occurs by a large variety of other disorders, including myogenic, neurogenic, and inflammatory processes, as well as bone and soft tissue tumors [9]. TMJ ankylosis has several etiological causes, including trauma, local and systemic inflammatory conditions, neoplasm, and TMJ infection. Trauma and infection are the most frequent causes [10].

Under general anesthesia, surgery is the preferred method of treating TMJ ankylosis, and there are many techniques for intubation of ankylosis patients, such as blind awake intubation, retrograde intubation, fiberoptic intubation, and tracheostomy intubation [11]. The management objectives in TMJA are the removal of the ankylotic mass, restoring the shape and function of the joint, allowing mouth opening, relief of upper airway obstruction, and prevention of recurrence [1]. Regarding the ideal treatment for TMJA, there are different procedures between surgeons, and there is no specific treatment. Recurrence still represents the main challenge in the management of TMJ ankylosis, as has been explored and developed by many authors [12]. A variety of operative procedures are used to treat TMJA, but none have been universally accepted. The operative procedures include gap arthroplasty, interpositional arthroplasty, and resection of the ankylotic mass, followed by reconstruction of the ramus-condyle unit with autogenous or alloplastic grafts [13]. This fusion is either fibrous, osseous, or fibro-osseous. The objective of this study is to determine the prevalence of TMJ ankylosis.

Methodology

Study Design

A retrospective cross-sectional study was conducted in Sana’a city in Yemen.

Study area

The study was conducted in Al-Thawra, Al-Gumhouri, 21 September, Al-Kuwait, University of Science and Technology, Modern European Hospital, in Sana’a city. These hospitals are the main referral hospitals in Yemen; they are three public, one military, and two private. Most maxillofacial surgeons are worked in these hospitals, and most TMJ ankylosis cases are referred to these hospitals.

Study Population

This study was carried out in all patients who admitted in maxillofacial departments in the period January 2018 to September 2022 and who were diagnosed with TMJ ankylosis and underwent surgical treatment. Patients associated with other facial fractures, patients who had TMJ disorder other than ankylosis, and patients that had files with incomplete data were excluded.

Data Collection

In this study, information was obtained from the patient’s archives or/and soft copies who were admitted for TMJ ankylosis in the oral and maxillofacial surgery departments of the targeted hospitals and reviewed and collected for the last five years. In Al Kuwait hospital, and after completing the entry procedures to the statistics departments, we found that there is no special section for the maxillofacial surgery. It was necessary to search in all departments of surgery, and about 1200 files for the maxillofacial surgery were obtained. The result was to get 15 cases of TMJ ankylosis. The same was in all government hospitals that were investigated, because there is no data stored in the electronic system. Also, we found 30 cases of TMJ ankylosis in Al Thawra Hospital, 4 cases in September 21 hospitals, and 6 cases in Modern European Hospital. In some patients’s files, the relatives don’t know about the cause of TMJ ankylosis, so they are added as unknown in the result and discussion. In the University of Science and Technology Hospital, there was no data about TMJ ankylosis because of an error in the system, and in Al-Gumhouri Hospital, there are no cases of TMJ ankylosis.

Data Processing and Analysis

Data was coded, entered into the computer, processed, edited, and analyzed using Excel 2010 and the Statistical Package for Social Science (SPSS) version 25, which was used to conduct the appropriate tests for the study, as the following tests were used: frequencies and percentages, chi-square test to measure the relationship between the variables of the study.

Ethical Committee

Ethical approval was obtained from the Medical Ethics Committee of the Faculty of Dentistry, Sana’a University.

Results

The study reveals that the majority of respondents were male, accounting for 30.9% of the total. The age distribution was dominated by those aged 10-15, followed by those aged 16-20, 12.7% over 25, and the least common age group (ages 21-25). Hospitals were the most frequent, with Al-Thawra Hospital having the highest number of respondents (54.5%). The most common etiology of ankylosis was trauma (85.5%), followed by bipolar and unilateral (49.1%). The most common type of radiography was CT scan (74.5%), followed by panoramic and CT scan (18.2%), and panoramic (7.3%). The most common type of ankylosis was osseous (34.5%), followed by fibrous (32.7%), and the least common type was unknown (10.9%). The study also revealed that the majority of respondents had a type of ankylosis, with the majority of respondents having a fibrous type (Tables 1-15).

Table 1: Frequency Distribution–Age of Respondents

tab 1

Table 2: Frequency Distribution–Gender of Respondents

tab 2

Table 3: Frequency Distribution– Hospital

tab 3

Table 4: Frequency Distribution– Etiology of ankylosis

tab 4

Table 5: Frequency Distribution– Side of ankylosis

tab 5

Table 6: Frequency Distribution– Side of unilateral

tab 6

Table 7: Frequency Distribution – Type of radiography

tab 7

Table 8: Frequency Distribution– Type of ankylosis

tab 8

Table 9: Frequency Distribution– Type of treatment

tab 9

Table 10: Relationship between side of ankylosis and gender

tab 10

Table 11: Relationship between side of unilateral and gender

tab 11

Table 12: Relationship between type of ankylosis and gender

tab 12

Table 13: Relationship between side of ankylosis and age

tab 13

Table 14: Relationship between side of unilateral and age

tab 14

Table 15: Relationship between type of ankylosis and age

tab 15

Discussion

In this study, the age of the patients ranged from 4-55 years with a mean age of 15.27 <0x7E> 10.02, and the frequency of TMJ ankylosis was highest in the second decade (47.3%), followed by the first decade (30.9%). The finding of the most frequently occurring age group was the same with the studies conducted in Pakistan [6], Egypt [14], and Ethiopia [15]. In contrast, a study in Sudan revealed that most of the cases were in the first decade of the age [1]. The majority of patients in this study were male, 35 (63.6%), and this is similar to studies in Nigeria [2], Ethiopia [16], and Brazil [10], where male cases were predominant. This result can be explained by the fact the fact that the males are more likely to be injured than the females because of their high-risk activities and are more susceptible to trauma.

This study shows that the greatest number of cases were in Al Thawra 30 (54.5%) because it’s considered the largest hospital in receiving cases in Sana’a city, followed by Al-Kuwait Hospital 15 (27.3%).

The current study revealed that trauma was the most common cause of TMJ ankylosis, representing (85%) of all cases, and these resemble previous studies in Pakistan [6], India [17,18], and South Africa [19], in which trauma was the most common cause of TMJ ankylosis. In the current study, there were no ankylosis cases due to infection. This was in contrast to many studies that revealed the infection is one of the most common causes of ankylosis among children and adult patients [20,21].

In this study, the frequency of unilateral (right or left) ankylosis (50.9%) was slightly higher than bilateral, and this resembles result findings in studies from China [22], Pakistan [6], Brazil [10], and India [23], while the current study found the right side TMJ ankylosis was equal to the left side TMJ ankylosis 14 (50%).

The current study showed that CT scan was the most radiographic x-ray used for diagnosis of TMJ ankylosis (74.5%), and this was similar to the results of other studies [24,25]. Followed by a panoramic and CT scan (18.2%), and a panoramic x-ray was the least used x-ray for the diagnosis TMJ ankylosis (7.3%).

About a type of ankylosis frequency in this study, three different types of ankylosis were identified: osseous 19 (34.5%) and represent the greatest number of cases due to most patients presented late probably because of ignorance, poverty, and lack of easy access to treatment, followed by fibroosseous ankylosis (32.7%) and fibrous ankylosis (21.8%). These results were similar to previous studies done in Delta Nile, Egypt [26]. In the current study, there is an association between the type of ankylosis and age, in which all cases of fibrous ankylosis were found in children under the age 15 (p = 0.049).

In the current study, the gap arthroplasty was the most commonly done procedure (29.1%), and this agrees with many of the previous studies in India [27], Ethiopia [28], and South Africa [19]. Gap arthroplasty is the most commonly done procedure due to its simplicity, low surgical cost, and short operating time, but it has disadvantages of short ramus height, pseudoarticulation, anterior open bite in bilateral cases, premature occlusion on the affected side and open bite on the contralateral side in unilateral cases, decreased postoperative range of motion, and increased risk of reankylosis [28], followed by physiotherapy under sedation (15.3%), and this type of treatment is found in cases of fibrous ankylosis in Al Tharwa hospital. Interpositional arthroplasty cases were 8 (14.5%); this procedure is preferred by a lot of surgeons due to reducing the risk of recurrence of ankylosis, restoring the vertical height of the ramus, and preventing open bites when using interpositional arthroplasty in treatment cases of bilateral TMJ ankylosis [29]. In the cases of coronoidectomy for the same side of ankylosis, there were 2 cases in the condylectomy procedure and also 2 cases in the gap arthroplasty procedure, which represents 3.6% in each type of treatment, and this agrees with [10]. The type of treatment group with coronoidectomy on the other side that is used in condylectomy, gap arthroplasty, and interpositional arthroplasty procedures. The number of cases was 1 in each procedure and represented (1.8%) in each procedure, respectively; this resembles a previous study in Brazil [10]. Also, there was only 1 case of interpositional arthroplasty with coronoidectomy on the same side (1.8%). The last type of treatment group was interpositional arthroplasty with costochondral graft or total joint replacement with costochondral graft, which was 2 cases and represents (3.6%); this is similar to that reported by Mabongo and Karriem (2014) [19]. The costochondral graft is the optimal method for reconsteruction of TMJ, especially in children due to a chance for growth of a mandible.

Conclusion

The study explores the demographics, etiology, radiographic diagnosis, types of ankylosis, and surgical treatments of TMJ ankylosis in Yemen. It reveals a high incidence of trauma, with the second decade being the most common age group. The most common type is osseous ankylosis, followed by fibroosseous and fibrous ankylosis. The study also highlights the need for further research to develop more effective treatments. Thefindings underscore the need for improved diagnosis and treatment of this challenging condition.

Recommendation

The text emphasizes the importance of raising awareness about TMJ ankylosis among healthcare professionals and the public, implementing preventive measures, encouraging early diagnosis and treatment, and implementing standardized protocols. It also calls for increased availability of specialized healthcare facilities, further research for more effective treatments, and improved patient data archiving methods.

Limitations

The current study’s limitations include the scarcity of data in patient files, the unwillingness of certain hospitals to collaborate with us in order to meet the study’s objectives, and the challenges associated with gathering data from old hospital archives.

Data Availability

The accompanying author can provide the empirical data that were utilized to support the study’s conclusions upon request.

Acknowledgments

The authors would like to thank Yemen and the Faculty of Dentistry at Sana’a University for their kind cooperation.

Dispute of Interest

There are no conflicts of interest in regard to this project.

Author’s Contributions

Dr. Basheer Saeed Mohammed Khalid: Formal analysis, conceptualization, data organization, and clinical and laboratory examinations to obtain a master’s degree in Oral and Maxillofacial Surgery. Professor Sam Abd Alkarem Da’er: Methodology, formal analysis, visualization. Other authors supervised the clinical part of the work. All authors reviewed the article and approved the final version.

References

  1. ELTOHAMI Y, ABUAFFAN A, ALSAGH R, MOHAMED H, ALI A (2017) Temporomandibular joint ankylosis pattern, causes, and management among a sample of Sudanese children. Den Craniofac Res 2: 1.
  2. BELLO SA, OLOKUN BA, OLAITAN AA, AJIKE SO (2012) Aetiology and presentation of ankylosis of the temporomandibular joint: report of 23 cases from Abuja, Nigeria. British Journal of Oral and Maxillofacial Surgery 50: 80-84. [crossref]
  3. KUMAR N, SARDANA R, KAUR R, JAIN A (2016) Intraoperative mandibular nerve block with peripheral nerve stimulator for temporomandibular joint ankylosis. Journal of Clinical Anesthesia 35: 207-209. [crossref]
  4. ANYANECHI C, OSUNDE O, BASSEY G (2015) Use of oral mucoperiosteal and pterygo-masseteric muscle flaps as interposition material in surgery of temporomandibular joint ankylosis: A comparative study. Annals of Medical and Health Sciences Research 5: 30-35. [crossref]
  5. TANRIKULU R, EROL B, GöRGUN, B., SöKER M (2005) The contribution to success of various methods of treatment of temporomandibular joint ankylosis (a statistical study containing 24 cases) Turk J pediatr 47: 261-265. [crossref]
  6. HOSSAIN MA, SHAH SAA, BISWAS R S R (2014) Frequency of temporomandibular joint ankylosis in various age groups with reference to etiology. Chattagram Maa-O-Shishu Hospital Medical College Journal 13: 17-20.
  7. DE LEEUW R, KLASSER G D (2018) Orofacial pain: guidelines for assessment, diagnosis, and management, Quintessence Publishing Company, Incorporated Hanover Park, IL, USA.
  8. ANDRADE N, KALRA R, SHETYE S (2012) New protocol to prevent TMJ reankylosis and potentially life threatening complications in triad patients. International journal of oral and maxillofacial surgery 41: 1495-1500. [crossref]
  9. SU-GWAN K (20010. Treatment of temporomandibular joint ankylosis with temporalis muscle and fascia flap. International Journal of Oral and Maxillofacial Surgery 30: 189-193. [crossref]
  10. VASCONCELOS BCDE, PORTO GG, BESSA-NOGUEIRA RV (2008) Temporo mandibular joint ankylosis. Revista Brasileira de Otorrinolaringologia 74: 34-38. [crossref]
  11. ENTERLEIN G, BYHAHN C (2013) Practice guidelines for management of the difficult airway: update by the American Society of Anesthesiologists task force. Der Anaesthesist 62: 832-835.
  12. MANGANELLO-SOUZA L, MARIANI P (2003) Temporomandibular joint ankylosis: report of 14 cases. International Journal of Oral and Maxillofacial Surgery 32: 24-29. [crossref]
  13. MEHROTRA D, PRADHAN R, MOHAMMAD S, JAISWARA C (2008) Random control trial of dermis-fat graft and interposition of temporalis fascia in the management of temporomandibular ankylosis in children. British Journal of Oral and Maxillofacial Surgery 46: 521-526. [crossref]
  14. ELGAZZAR R, ABDELHADY A, SAAD K, ELSHAAL M, HUSSAIN M.et al (2010a) Treatment modalities of TMJ ankylosis: experience in Delta Nile, Egypt. International Journal of Oral and Maxillofacial Surgery 39: 333-342. [crossref]
  15. GAROMA G, DEJENE D, UMA G (2022) Temporomandibular joint ankylosis; aetiology, pattern and treatment. J Dent Health Oral Disord Ther 13: 33-37.
  16. TEFERA T (2019) Incidence, clinical presentation and surgical management of Temporomandibular Joint ankylosis: A 5 year retrospective study. Scientific Archives of Dental Sciences 2: 2-14.
  17. MISHRA N, SHARMA NK, DHIMAN N K, JAISWARA C, TIWARI P. et al (2021) Temporomandibular joint ankylosis: A tertiary center-based epidemiological study. National Journal of Maxillofacial Surgery 12: 392. [crossref]
  18. GUPTA VK, MEHROTRA D, MALHOTRA S, KUMAR S, AGARWAL G G et al (2012) An epidemiological study of temporomandibular joint ankylosis. National Journal of Maxillofacial Surgery 3: 25. [crossref]
  19. MABONGO M, KARRIEM G (2014) Temporomandibular joint ankylosis: evaluation of surgical outcomes. J Dent Med Sci 13: 60-66.
  20. KABAN LB, BOUCHARD C, TROULIS MJ (2009a) A protocol for management of temporomandibular joint ankylosis in children. Journal of Oral and Maxillofacial Surgery 67: 1966-1978. [crossref]
  21. MOVAHED R, MERCURI L G (2015b) Management of temporomandibular joint ankylosis. Oral and Maxillofacial Surgery Clinics 27: 27-35. [crossref]
  22. CHEN S, HE Y, AN JG, ZHANG Y (2019a) Recurrence-related factors of temporomandibular joint ankylosis: a 10-year experience. Journal of Oral and Maxillofacial Surgery 77: 2512-2521. [crossref]
  23. KALPANA T, LAM RM (2021) Clinical study of temporomandibular joint ankylosis & its management. International Journal of Surgery 5: 246-250.
  24. KAVIN T, JOHN R, VENKATARAMAN S S (2012) The role of three-dimensional computed tomography in the evaluation of temporomandibular joint ankylosis. Journal of Pharmacy & Bioallied Sciences 4: S217. [crossref]
  25. SHETTY P, THOMAS A, SOWMYA B (2014) Diagnosis of temporomandibular joint (TMJ) ankylosis in children. Journal of Indian Society of Pedodontics and Preventive Dentistry 32: 266-270. [crossref]
  26. ELGAZZAR RF, ABDELHADY AI, SAAD KA, ELSHAAL MA., HUSSAIN M M., et al (2010b) Treatment modalities of TMJ ankylosis: experience in Delta Nile, Egypt. Int J Oral Maxillofac Surg 39: 333-42. [crossref]
  27. JAIN G, KUMAR S, RANA AS, BANSAL V, SHARMA P. et al (2008) Temporomandibular joint ankylosis: a review of 44 cases. Oral and Maxillofacial Surgery 12: 61-66. [crossref]
  28. DANDA A.K, RAMKUMAR S, CHINNASWAMI R (2009) Comparison of gap arthroplasty with and without a temporalis muscle flap for the treatment of ankylosis. Journal of Oral and Maxillofacial Surgery 67: 1425-1431. [crossref]
  29. BANSAL S, VERMA DK, RAI M, SORAKE A, KAUR C (2019) Gap arthroplasty or interpositional arthroplasty for the management of TMJ ankylosis? A prospective randomized comparative multicenter clinical trial. Journal of Maxillofacial and Oral Surgery 18: 567-571. [crossref]