Monthly Archives: June 2018

The Need of Sealants in Oral Health

DOI: 10.31038/JDMR.2018111

Abstract

A good oral health education program starts from early ages, and the most important time to initiate this it is when the first permanent tooth (the first permanent molar) erupts, and it lies on a correct diet and hygiene habits, including a healthy diet, a correct brushing technique, and a preventive therapeutic approach. The beneficial effect of a preventive program is a good oral health and the therapeutic approach is the dental sealing. Of course it is important to motivate small patients to maintain a good oral health, through the correct use of oral hygiene products, individual brushing techniques, and good eating habits. The prevention programs and the children’s receptiveness in maintaining proper oral hygiene can improve the oral health. If there is good communication between the physician and the patient then we can talk about the triad: theoretical presentation, practical exercises and individual biofilm removal techniques, which are indispensable factors in achieving an appropriate oral health status. When dental education programs can’t provide the proper prophylaxis of caries lesion, especially at the occlusal surfaces of molars and premolars with deep and retentive pits and grooves, dental sealing is an ideal option.

Keywords

Dental Plaque, Dental Sealing, Tooth Decay, Plaque Indexes, Biofilm

Introduction

Risk assessment for the disease development is an essential component of any oral disease prevention program. Susceptibility risks can be determined by various methods including the person, the whole community and of course the teeth, and all dental surfaces. Tooth decay is a bacterial-dependent disease so dental sealing is a preventive measure that can be implemented when the patient is at risk. There are many risk factors that can influence the formation of carious lesions which includes the eating habits and dental hygiene habits, regarding brushing techniques in sense of frequency and time of dental brushing. Of course that periodic consultation and early detection of caries are also important factors that hold the key of success in dental health. Oral disorders, starting from the incipient lesions and leading to the most complicated clinical cases, depend on many factors including the dietetic and hygiene habits of the patient. When talking about dietetic habits, the evolution of the carious lesion depends to a great extent, of the presence in the diet of sugars, carbohydrates (juices) etc., but also it depends on regular meals without eating between meals. Also, an important factor in the appearance and evolution of the carious lesion is the patient’s hygiene habits, such as how he performs dental brushing, how many times a day, etc. In other words good hygiene habits must be learned from an early age, and this can be done through dental education programs, which can be implemented in schools. Tooth brushing is an essential part of an effective dental education program, and achieving optimal oral health depends on the efficiency of the method used to remove the biofilm from the surface of the teeth. Tooth brushing aims, to remove, by mechanical means, the food residues and the biofilm from dental surfaces. The efficiency of the biofilm removal depends on several factors: the time of dental brushing, its frequency, the technique used, the tools used, and the quality of the toothpastes. Associating oral hygiene with a healthy diet will help reduce the risk of carious lesions.

Even if all of these rules are respected by patients, this may not be enough, if the teeth have deep and retentive pits and fissures, because the toothbrush bristle can’t get inside those grooves, and clean the biofilm, which can accumulate and determine the lesion on the occlusal surface of the premolars and molars. Dental sealing is considered by the World Health Organization to be a major factor in the prevention of carious lesions, especially in schools with children from low-income families, so through dental sealing programs it can be reduce the incidence of caries, especially when focusing on sealing permanent molars in children. Preventive dental sealing treatment has a beneficial effect on the patient, from all points of view. Maintaining a good oro-dental health is one of the most important therapeutic attitudes in all dentistry branches. The most beautiful feeling as a dentist is when he succeeds in motivating the patient about oral health, because it is easier to prevent than to treat a disease.

Methods & Materials

In our study we conducted a preventive school program, which included theoretical presentation, practical exercises, individual biofilm removal techniques and dental sealing. We randomly selected a group of 107 children who received specialized consultations. So, the study was conducted on a group of 107 patients, with age range between 6–8 years, from an urban school, class 0 and 1 students. We evaluated the ways in which living habits, influence the oral health, so we gathered data about hygiene habits and eating habits. In this part of the study, we evaluated the foods that the patient usually consumes and which may have repercussions on oral health, but also if the patient consumes sugars, sweet snacks, carbohydrate beverages, sweets (chocolate), fruits, fats and vegetables, and the way they do it. (Figure 1)

JDMR-18-101-Onisei Doina Romania_F1

Figure 1. Eating habits.

It is noted that from the entire group of patients, the majority of children consume carbonated beverages, which is not suited for a good oral health status. However, a very small percentage of children do not consume carbonated beverages. Drinking this kind of beverage, is not a good thing for oral health, especially if dental brushing is not done right after, so we have gathered data on sweets consumption, and we noticed that all children in the batch eat sweets except for one boy, which is worrying in the absence of dental brushing. It’s a concerning result for children’s oral hygiene, but if teeth brushing is performed after eating sweets, then the oral health of small children will not be affected. We next correlated the data on fruit consumption, which is a part of the category of foods that are beneficial to both the oro-dental health and the health of the whole organism. It is observed that most of the patients included in the lot consume fruits, almost in the same way that they consume carbonated beverage (Figure1). The data collected about fat consumption, which, at some point is beneficial to dental health, but can also have a negative effect to oral health, is as follow: an increased percentage of patients consume non-fat foods, and a small number of patient have fat in the diet. The consumption of vegetables, which are recognized as being good for oral health, is found in more than half of the patients; in fact a third does not consume them against the two-thirds who consume them. This result is a positive one, because there are more children who consume vegetables, but it would have been better if that number would have been even higher.

After correlating all the outcomes on the patients’ diet, we assessed the way in which the small children consume sugars, so we evaluated whether eating sugary foods is done between or during meals (Figure 2).

JDMR-18-101-Onisei Doina Romania_F2

Figure 2. Eating habits-consumed sugars.

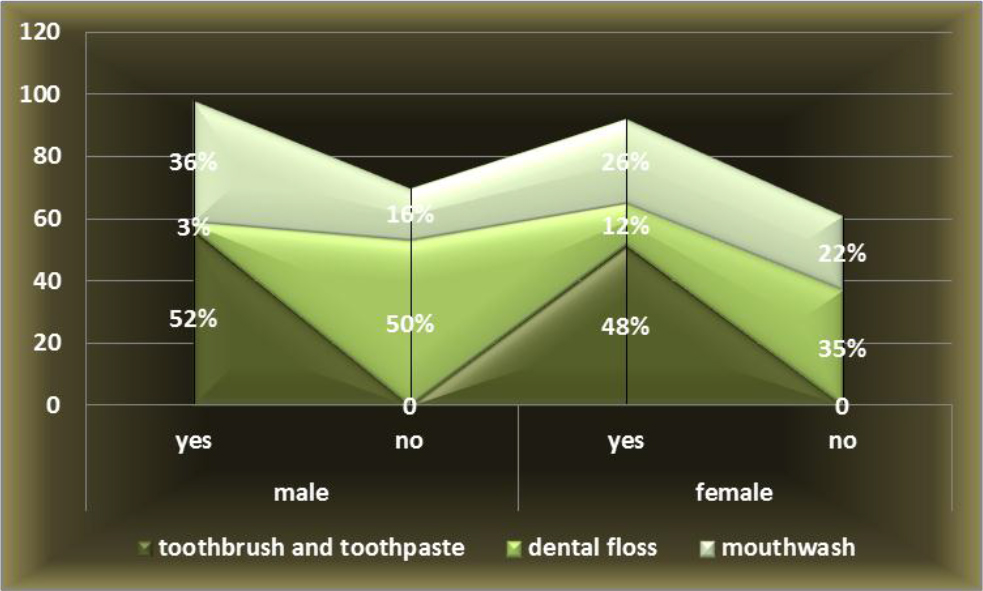
Sugar is consumed between meals by most patients in the group, regardless of gender, representing a high percentage, 63%, with a total of 67 patients, compared with 40 patients who consume sugar during meals, representing 37% of the children. This result is not satisfactory because the consumption of sugary foods increases the risk of carious lesions in absence of dental brushing after consumption. We have noticed that patients or their parents give a great importance to oral hygiene products by choosing different products on the market but they do not put as much emphasis on the brush technique and its frequency. It is noted that all patients include in their hygiene habits, the toothbrush and toothpaste to perform everyday dental brushing. Most of the patients tend to complete their daily dental hygiene with the mouth wash, which chemically removes the biofilm from dental surfaces, so there was a 62% of children, male and female that uses mouthwash, this being a relatively satisfactory percentage, but it would have been better if this percentage were higher. Regarding dental floss, things are different, and it appears that 85% of patients do not use it. This result is not satisfactory one because the use of dental floss reduces the risk of carious lesions on the proximal surfaces of the teeth (Figure 3).

JDMR-18-101-Onisei Doina Romania_F3

Figure 3. Products used in dental hygiene habits.

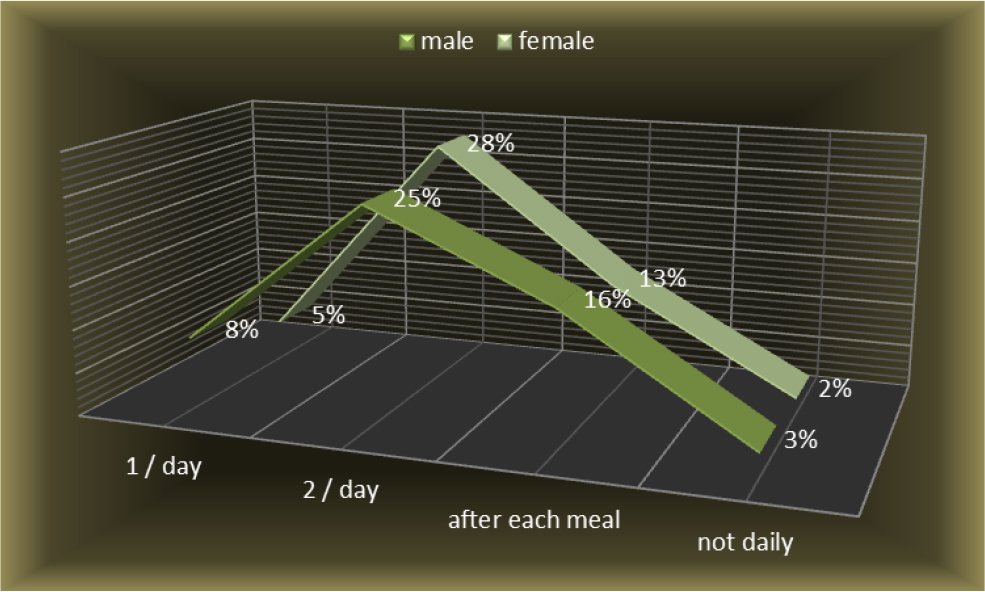
Although all the patients included in the study use the toothpaste and the toothbrush, a special importance should be given to the frequency of dental brushing. It is noted that most patients perform dental brushing twice a day, accounting for 57 patients of both sexes, namely 28% of male patients and 25% of female patients, followed by 29% of patients performing dental care after each meal, 13% patients performing dental brushing once a day, and the smallest percentage is 5% representing patients who do not perform dental brushing every day (Figure 4).

JDMR-18-101-Onisei Doina Romania_F4

Figure 4. The frequency of dental brushing.

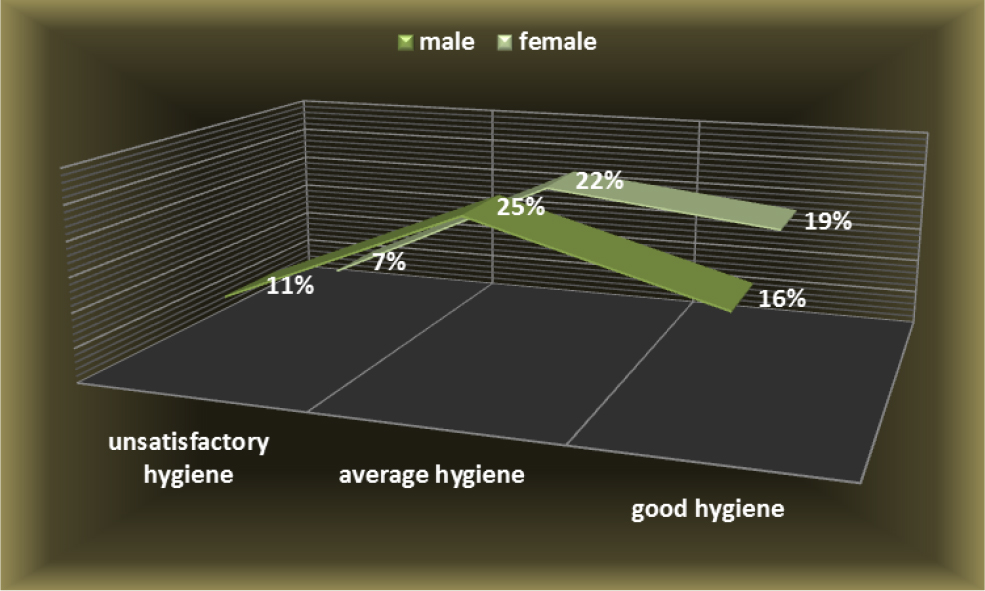
Following the correlation of all the results obtained so far, the tendency of the entire group of patients relating to oral hygiene habits and diet habits are in ascending parameters, towards good oral health, but some improvements should be made. The gaps that still exist in the habits of the patients had repercussions on oral health, so initial patient evaluation did not necessarily have good results. In the initial examination of the patients, they presented different degrees of oral hygiene, as can be seen in the chart below, 11% boys and 7% girls were with unsatisfactory hygiene, 25% boys and 22% girls, had an average grade of hygiene and good hygiene was achieved by 16% boys and19% of the girls. According to the chart below (Figure 5), the majority of patients, 47%, had average oral hygiene, followed by the 35% with good hygiene, and the lowest percentage was for unsatisfactory hygiene, 18%.

JDMR-18-101-Onisei Doina Romania_F5

Figure 5. The degree of oral hygiene.

The idea deduced from this series of arguments or findings is that the percentage of patients with unsatisfactory grade of hygiene was 18% patients, and 82% of children had average or good hygiene (Figure5). By correlating all data relating to dietary habits, dental brushing with its frequency, the auxiliary means used in removing dental plaque and the evaluation of oral hygiene, we tried to relate them to the incidence of caries in permanent teeth of this children, namely the first molars.

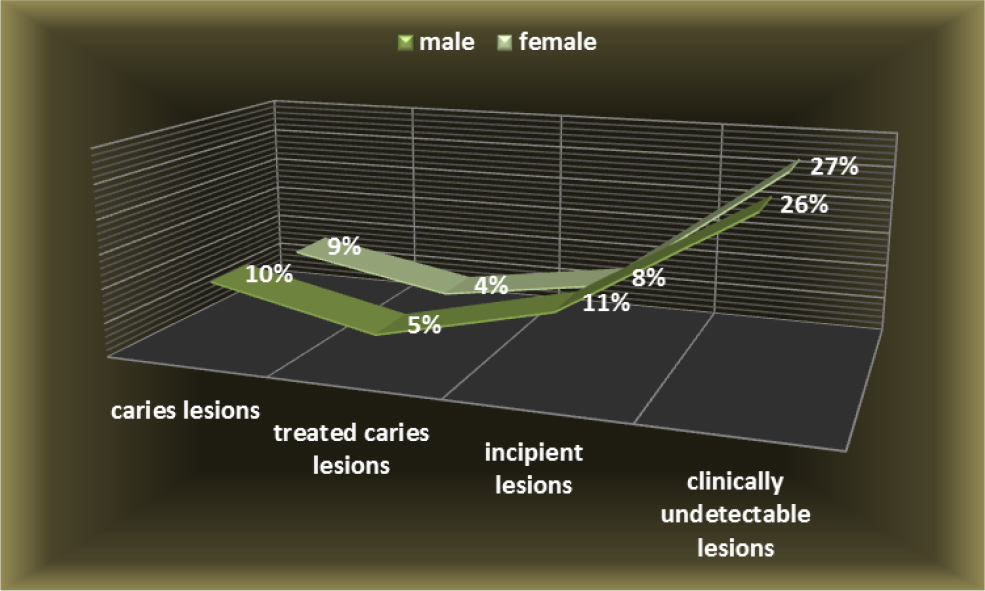
From the data provided in the graph below (Figure 6), it is found that a number of 226 teeth are without lesions or with clinically undetected lesions and it represents 53% of teeth, more than half of the teeth examined. Also we found that 19% of the molars had incipient lesions. Tooth decay was present in an28% of the molars examined, but 9% of molars were treated before our examination, and 19% still presented caries lesions. In other word we can say that tooth decay was present in 15% of males and 13% females.

JDMR-18-101-Onisei Doina Romania_F6

Figure 6. Incidence of caries lesions at first molars.

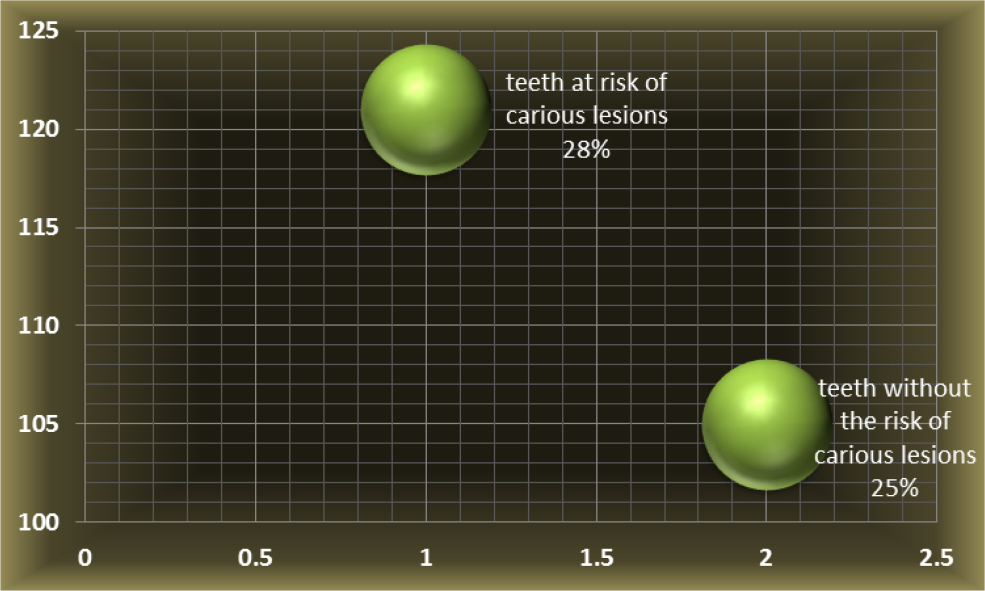
From the category of teeth with no clinically detectable lesions, 121 of them had a risk of carious lesions, representing 28% of the whole teeth we examined, and it is shown in the chart below (Figure 7).This percentage does not differ significantly from that of teeth without risk to caries, which is 25% of examined teeth.

JDMR-18-101-Onisei Doina Romania_F7

Figure 7. Teeth at risk of carious lesions.

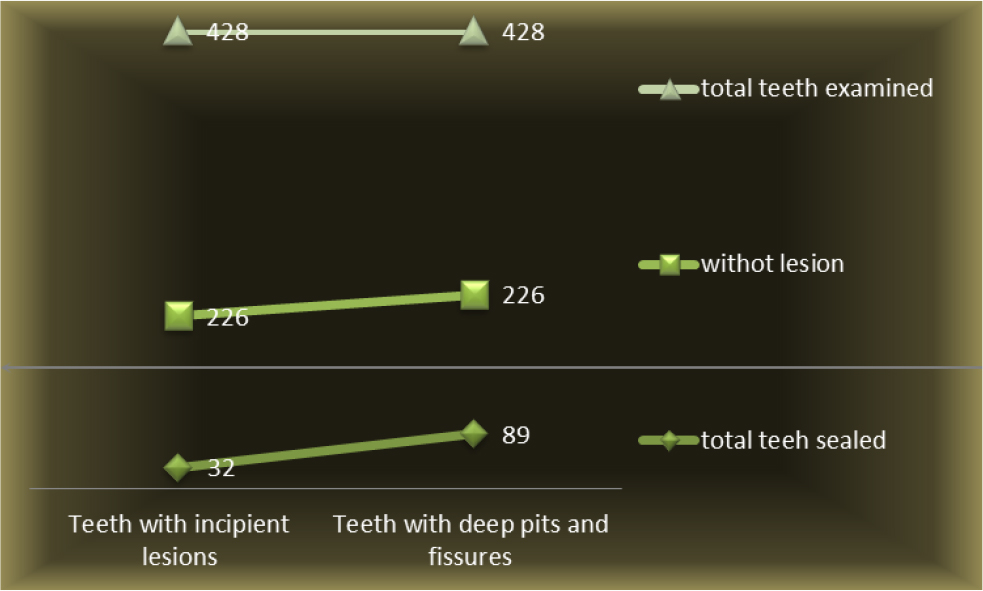
The fact that there is not a very big difference between these percentages suggests that there is a high risk of tooth decay among children with age range between 6–8 year old. Following the results of the incidence of carious lesions and the risk of their occurrence, all the teeth presenting a risk of carious lesions have been sealed. Those teeth also presented deep retentive pits and fissures on the occlusal surfaces or incipient lesions, undetectable on X-ray, in the form of demineralized enamel, shown as white spots. Teeth sealed who presented deep retentive pits and fissures were 89 and there were 32 teeth sealed with white spots, incipient lesions, undetectable on X-ray, in the form of demineralized enamel. From the whole number of teeth that had dental sealing there were 74 % with deep and retentive pits and fissures, and 26% of teeth sealed were with white spots. (Figure 8)

JDMR-18-101-Onisei Doina Romania_F8

Figure 8. Teeth examined and sealed.

From the graph above, it is noted that the total number of 428 teeth examined, only 226 did not show treated or untreated dental lesions, so only this half was evaluated for dental sealing. The other half who experienced lesions with or without treatment was examined and either the incorrect dental restorations were replaced or the present lesions were treated. From the evaluated teeth for dental sealing, which is, half of the teeth evaluated and examined in the entire group of patients, the need for dental sealing was at half of them. This means that of the 226 teeth evaluated in terms of prophylactic and preventive treatment, 121 teeth, permanent first molars, had an indication of sealing.

The teeth which received dental sealing were half of the total teeth not affected by lesions, and this is a very high number, because in fact, these teeth actually have a tooth decay predisposition, and in the absence of dental sealing they lose their morpho structural integrity. Following control, 6 months after application, most of the seals remained unchanged, however 3 dental seals were no longer present on the teeth, and in the control after 1 year, 5 teeth lost their sealing. The loss of dental sealing may vary, depending on whether the patients followed the indication for a good oral health or simply because of local factors. It is noted that the number of un affected dental sealing is high, so the purpose of prevention is met. There was also an improvement in oral health through better diet habits and oral hygiene habits with better brushing techniques and increasing brushing frequency, and also using more auxiliary means for removing the biofilm.

Conclusion

Dental sealing has had a good result because as long as it remained in the pits and fissures, its preventive purpose was fulfilled. The need for dental sealing, as shown in our study is quite high, and depends on many factors, such as better brushing techniques, increasing brushing frequency, using more auxiliary means such as dental floss and mouthwash, in removing the biofilm, through both local as well as general means.

References

  1. American Academy of Pediatric Dentistry (2012) Guideline on caries-risk assessment and management for infants, children, and adolescents. Pediatr Dent 34: 118–125.
  2. Amin HE1 (2008) Clinical and antibacterial effectiveness of three different sealant materials. J Dent Hyg 82: 45. [crossref]
  3. Dye BA, Mitnik GL, Iafolla TJ, Vargas CM (2017) Trends in dental caries in children and adolescents according to poverty status in the United States from 1999 through 2004 and from 2011 through 2014. J Am Dent Assoc 148: 550–565. [crossref]
  4. Dye BA, Thornton-Evans G, Li X, Iafolla TJ (2015) Dental caries and sealant prevalence in children and adolescents in the United States, 2011–2012. NCHS Data Brief 191: 1–8. [crossref]
  5. Griffin SO1, Gray SK, Malvitz DM, Gooch BF (2009) Caries risk in formerly sealed teeth. J Am Dent Assoc 140: 415–423. [crossref]
  6. Lile IE, Freiman PC, Hosszu T, Vasca E, Vasca V, et al. (2015) A Subsidiary Physical Research of Glass Ionomers. Jurnal Medical Aradean 52: 175–179.
  7. Tagliaferro EP, Pardi V, Ambrosano GM, Meneghim Mde C, da Silva SR, et al. (2011) Occlusal caries prevention in high and low risk schoolchildren. A clinical trial. Am J Dent 24: 109–114. [crossref]
  8. Tellez M, Gray SL, Gray S, Lim S, Ismail AI (2011) Sealants and dental caries: dentists’ perspectives on evidence-based recommendations. JADA 142: 1033–1040.
  9. Vaida L, Moldovan L, Lile IE, Todor BI, Porumb A, et al. (2015) A Comparative Study on Mechanical Properties of Some Thermoplastic and Thermo Set Resins Used for Orthodontic Appliances, MaterialePlastice 52: 364–367
  10. Wright JT, Tampi MP, Graham L (2016) Sealants for preventing and arresting pit-and-fissure occlusal caries in primary and permanent molars: a systematic review of randomized controlled trials a report of the American Dental Association and the American Academy of Pediatric Dentistry. JADA 147: 631–645.

Assessment of Quality and Safety of Medical Care in Russia

DOI: 10.31038/NAMS.2018131

Abstract

Goals: This study is aimed to analyze the results of external audits in medical facilities in Russia.

Design: Analysis of the results of audits in terms of the sections: “Epidemiologic safety. Preventing and Controlling Healthcare Associated Infections”, “Drug safety. Pharmacovigilance”, “Control of quality and safety of medical devices circulation”, and “Surgical safety. Preventions of risks associated with surgical intervention” in medical facilities of Russia.

Setting: 10 medical facilities in which the quality management system had not been implemented before.

Results: Nowadays the absence of unified approaches to the management of quality and safety of medical care is one of the most complicated and debatable issues in the medical society in Russia. Within the framework of this study, we have analyzed the results of external audits of quality and safety of medical care conducted in accordance with several sections of the Guidelines in medical facilities in which the quality management system had not been implemented before. The lowest level of conformity (15,9%) was found for the “Epidemiologic safety. Preventing and Controlling Healthcare Associated Infections”. The organizational problems were found in medical devices circulation, microbiologic monitoring systems, and systems of registration and collection of information concerning severe and unexpected adverse drug reactions. The practice of audits in medical facilities revealed essential structural problems with medical care quality and safety management in Russia.

Key words

medical care, Russia, audit, quality and safety, quality management system

Introduction

Nowadays the absence of unified approaches to the management of quality and safety of medical care is one of the most complicated and debatable issues in the medical society. There is no developed unified regulatory standard for management of medical care in medical facilities in Russia now.

In order to solve this problem, in 2015 Federal State Budgetary Institution “Center for Monitoring and Clinical and Economic Expert Evaluation” of Federal Service for Surveillance in Healthcare developed Roszdravnadzor’s Practical Guidelines (Recommendations) on the internal system of quality and safety control of medical care in medical facilities [1]. These Guidelines became the prototype of the national safety and quality healthcare standard for hospitals in Russia. The Guidelines were developed with due consideration of the requirements of current worlds standards: Joint Commission International Standards for Hospital (USA), National Safety and Quality Health Service Standards (Australia), Canadian Council on Health Services Accreditation (Canada), and others.

The Guidelines provided the basis for the System of the voluntary certification of medical facilities “Quality and Safety of Medical Care”, which was registered in 2016 [3].

Audit is the form of evaluation of the conformity of the medical facility to the requirements of the Guidelines [4]. Audits are to be carried out by specialists from a separate independent organization who are experts in the field.

This system implies external evaluations (audits) of medical facilities regarding the compliance with the requirements of the Guidelines.

The Guidelines include the following main fields of concern:

  1. Human resources management;
  2. Patient Identification;
  3. Epidemiologic safety. Preventing and Controlling Healthcare Associated Infections;
  4. Drug safety. Pharmacovigilance;
  5. Control of quality and safety of medical devices circulation;
  6. Emergency care in inpatient facilities;
  7. Managing clinical responsibility. Patient internal and external transfer;
  8. Surgical safety. Preventions of risks associated with surgical intervention;
  9. Blood management;
  10. Safe environment for the delivery of care. Patient care management. Preventing and managing falls, pressure injuries;

Methods

In this article, we will analyze the results of external audits of quality and safety of medical care conducted in accordance with several sections of the Guidelines in medical facilities in which the quality management system had not been implemented before. The audits were carried out by multidisciplinary work groups of experts under the supervision of experts from the Federal State Budgetary Institution “Center for Monitoring and Clinical and Economic Expert Evaluation” of Federal Service for Surveillance in Healthcare by the unified procedure based on the Guidelines.

Within the framework of this study, we have analyzed the results of audits carried out in terms of the following sections: “Epidemiologic safety. Preventing and Controlling Healthcare Associated Infections”, “Drug safety. Pharmacovigilance”, “Control of quality and safety of medical devices circulation”, and “Surgical safety. Preventions of risks associated with surgical intervention”.

The assessment sheet for these sections includes the list of criteria combined into groups. The assessment system is binary; it determines the conformity or non-conformity to one or another criterion. The non-conformity to any criterion in the group is the reason to consider the whole group of parameters non-conforming. For example, when evaluating the requirement concerning the availability of the microbiology testing system the experts checked the conformity to the following criteria: availability of an own microbiology laboratory or an agreement, necessary conditions for material sampling 24 hours per day, 7 days per week, 365 days per year, including the availability of transport media, thermostats and procedures of material sampling for all possible cases for a certain medical facility, personnel’s knowledge of procedures (interviewing) and practical skills (observation), and following the procedures, which was assessed using the method of studying medical records, and the criteria of timeliness of getting the results of cultures and their proper use for changing the empiric regimen of antimicrobial therapy for another regimen taking into account the sensitivity. Only positive answers to all the questions provided a positive result of evaluation according to one (!) requirement.

The sources of information described on the Figure 1.

NAMS 2018-103-Igor Russia_F1

Figure 1. Sources of information

The article uses the results of external audits of medical facilities, which are super specialty hospitals that deliver both elective and emergency care including high-tech medical care. The average hospital bed capacity was 500 beds (up to 1000); the average number of the personnel (both healthcare professionals and allied health personnel) was about 2000 people in each facility. The main criterion for choosing a medical facility for this study was the fact that there was not the quality management system based on the ISO 9000 standards.

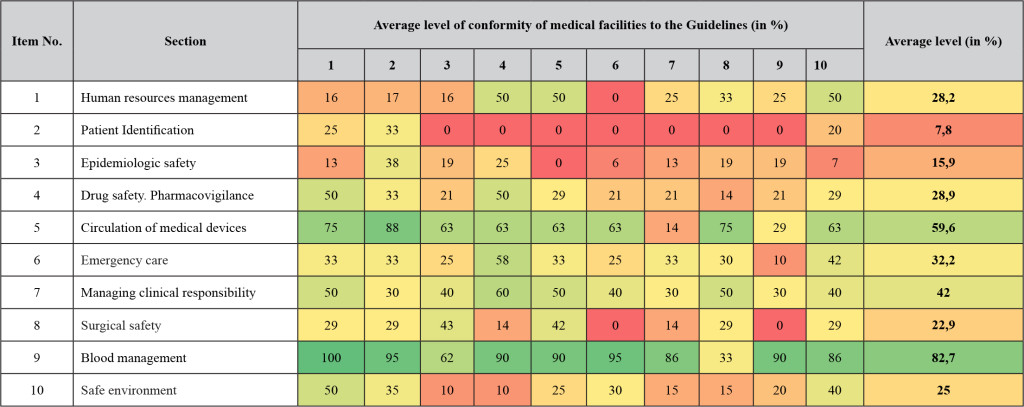
The summarized results of audits are shown in the Table 1.

Table 1. summarized results of audits

NAMS 2018-103-Igor Russia_F2

Initiators of conducting audits were the authorities of medical facilities. All the members of expert teams adhered to the principles of privacy and goodwill. Experts made a point of the fact that the authorities of the medical facilities in question had ensured the personnel that they would not be punished after the audit in any case which made the personnel more open. According to the conditions of the agreement between medical facilities and Federal State Budgetary Institution “Center for Monitoring and Clinical and Economic Expert Evaluation” of Federal Service for Surveillance in Healthcare the experts had access to all the rooms of the facilities and to all medical and organizational records.

Results

As it is shown in Table 1, the lowest level of conformity (15,9%) was found for the “Epidemiologic safety. Preventing and Controlling Healthcare Associated Infections” section. Almost all medical facilities in question had no effective microbiologic monitoring systems, no microbiology studies, and prudent use of antimicrobial drugs was not provided there. It is also necessary to make profound changes in revealing, recording, registration and analysis of infections associated with healthcare delivery.

When evaluating the “Surgical safety” section (the level of conformity – 22,9%), experts found organizational problems. For example, all the medical facilities in question have no functional surgical safety management system: a surgical check-list, procedures of transferring clinical responsibility in a post-surgery period, evaluation of anesthesia and pain management effectiveness in a post-surgery period were not developed and are not used. Many facilities do not use pain assessment scales which help to customize approaches to pain management.

The “Drug safety” section has the level of conformity equal to 28,9%. All the medical facilities in question have no effective systems of registration and collection of information concerning severe and unexpected adverse drug reactions. The labeling of vials with infusion solutions did not conform to the established criteria. There are still unsolved problems with the knowledge of procedures and the quality of verbal drug administration. Moreover, it is almost impossible to assess the conformity of the drug selection and dosage to clinical recommendations (treatment protocols) as there are no such recommendations at most workplace, though they can be found in the federal electronic medical library.

The procedure for medical devices circulation is assessed in the “Circulation of medical devices” section and has the level of conformity equal to 59,6%. Organizational problems with medical devices circulation were revealed during audits. In 9 of the 10 investigational medical facilities the system of medical devices circulation quality and safety monitoring is fragmentary, and a system approach is not used properly. The personnel are not being trained regarding issues of medical devices circulation quality and safety, and no internal audits are conducted. The personnel of medical facilities do not work properly with instruction manuals of medical devices. The requirements for correct use, maintenance, storage and disposal stated by manufacturers are just partially adhered to in all the assessed medical facilities.

Conclusion

The practice of conducting audits in medical facilities, where the quality management system had not been implemented before, revealed essential structural problems with medical care quality and safety management. The approach to the assessment of the medical care quality described in the Guidelines gives the opportunity to assess a medical facility in an integrated manner.

In contrast with the approved Russian practice of evaluating mainly submitted documents, the assessment in accordance with the Guidelines helps to reveal system problems based on several sources of information (profound observation over the processes of medical care, interviewing the personnel and patients). The evaluation process is more successful when the expert is maximally immersed in the clinical environment instead of documents.

The importance of studying the issues of epidemiologic, drug and surgical safety, the issues of medical devices circulation, the importance of management of risks associated with these spheres of medical care have met with support of the medical personnel and are regarded promising in Russia.

The further use of the Guidelines will help to improve approaches to solving these problems in order to change the situation for the better.

References

  1. Proposals for arrangement of inner quality and safety control of medical activity in medical organization (hospital) // Bulletin of Roszdravnadzor. — 2016. — N 2. — P. 35, 36.
  2. Ivanov I.V., Shvabskii O.R., Minulin I.B., Shchesyul A.G. Medical activity: quality and safety // Standards and Quality. – 2017. – N 3. – P.72–74.
  3. Ivanov I.V., Shvabskii O.R., Minulin I.B., Emanuel A.V. Audit as a tool of healthcare quality assessment // Standards and Quality. – 2017. – N 11. – P.27–29.
  4. Ivanov I.V., Shvabskii O.R., Minulin I.B., Shcheblykina A.A. Results of audits of quality and safety of medical activity in hospital. // Quality Management in Healthcare. – 2018. – N 1. – P. 18–22.

Drug discovery: science and/or art?

DOI: 10.31038/JPPR.2018112

Editorial

Pharma companies have been among the most profitable ones at least until the new era of the Info companies like Google, but are still quite interesting, and in fact not so different in principle: it is always question of information, a drug is useful to restore the lost info in an organism, trying not to override to much of what it is still working!

One of the reason for such healthy and wealthy attitude is that drug discovery is not obvious nor simple nor cheap nor fast, as a rule: a good chemical could imply a fortune even in the few years of validity of the patent. A thorough knowledge of pathophysiology is required in order to design biochemistry able to heal without damaging to much. Intuition and experience are paramount, but nowadays at least a couple of approaches are keen to help.

On one side, machine learning, able to identify the statistical properties of the known, may be of great help in forecasting at least simple but necessary properties of the candidate drug, like hydrophilic or hydrophobic behavior.

On the other side, esascale high performance computing is nowadays able to assist physical chemists in simulate and forecast the properties of a big molecule taking into account the properties of every single atom composing its structure.

Such approaches, nowadays seen as opposite, probably because inherited by different communities not sharing a common background, are instead keen to be complementary, as often in science and even in life, when almost perfect but still not sufficient great approaches are combined.

The best would of course be to have an algorithm already able to combine both, but this is still a kind of Graal in the minds of the many scientist both theoreticians and in other applications, dreaming of, and/or working on, such important direction, that would imply quite a revolution not just in drug discovery

Pharmacokinetics of Acetaminophen in the Hypothalamus of Rats Based on in vivo Microdialysis

DOI: 10.31038/JPPR.2018111

Abstract

To explore the studying method for pharmacokinetics in the target site of drugs, the pharmacokinetic process of acetaminophen in the hypothalamus of rats was investigated. Male Sprague-Dawleyrats were anaesthetized and secured in a stereotaxic frame. A microdialysis probe was implanted into the hypothalamus and perfused with artificial cerebrospinal fluid at a flow rate of 2 µL/min. Adaptation for 1 h, rats were administrated with acetaminophen (150 mg/kg, i.p.) and microdialysates were collected continuously at 12-min intervals for 6 h. The acetaminophen concentrations in microdialysates were determined by HPLC-Ultraviolet detection (HPLC-UV), and the concentration-time profile and pharmacokinetic parameters of acetaminophen were calculated by DAS software. The results showed that the concentration-time curve of acetaminophen in the hypothalamus of rats was fitted to a one-compartment open model. The main pharmacokinetic parameters t1/2, Tmax, Cmax and AUCinf were (1.95 ± 0.59) h, (1.26 ± 0.22) h, (11.39 ± 2.17) µg/mL and (58.04 ± 18.39) µg·h/mL, respectively. In conclusion, by means of in vivo microdialysis approach, the pharmacokinetic process of acetaminophen in the hypothalamus of rats is investigated and an experimental method for studying pharmacokinetics of drugs in the target site is established, which is simple, feasible and reliable.

Keywords

Acetaminophen, HPLC, in vivo Microdialysis, Pharmacokinetics, Rats

Introduction

In pharmacokinetic studies, the traditional method is to measure drugs or their metabolites concentrations in blood, and calculate pharmacokinetic parameters based on the plasma drug and/or its metabolite concentrations, which are used for guiding drug administration and dosing regimens in clinic. However, the biochemical events and pharmacological effects do not usually take place in the bloodstream, but in target organs and/or tissues [1, 2]. Therefore, it is unreasonable to use the plasma drug or its metabolite concentration to in place of the target organ/tissue drug concentration for calculating pharmacokinetic parameters. For example, a study by Konings et al. [3] found that the 5-Fuorouracil concentrations in the extracellular fluid (ECF) of tumors were lower than the unbound plasma concentrations. Furthermore, especially for central nervous system (CNS) drugs, there exists significant difference between the plasma drug concentration and the CNS drug concentration because of the influence of the blood-brain barrier (BBB). Bostrom et al. [4] showed that the unbound concentrations of oxycodone in brain were higher than those in blood, due to the presence of active influx of oxycodone at the BBB.

Acetaminophen, (N – (4 – Hydroxyphenyl) acetamide), an antipyretic-analgesic drug, is widely used for the treatment of mild pain and fever. The mechanism of acetaminophen hypothermia is not fully understood, but is assumed to be related to inhibit cyclooxygenase in the CNS [5, 6] and the target site locates in the hypothalamus [7]. At recommended therapeutic doses, acetaminophen is safe and effective, however, excessive intake of acetaminophen may cause acute liver failure and even death [8–10]. And acetaminophen overdose is a major cause of liver injury in the USA and Europe [8]. Hence, more accurate and precise pharmacokinetics data of acetaminophen in the CNS (target site) should be obtained. However, so far little research has been done on the pharmacokinetics of acetaminophen at the target site.

Microdialysis, a semi-invasive probe-based sampling technique, is able to measure the unbound drug or endogenous substance concentrations in the ECF of target tissues [11], which is widely used to pharmacokinetics, metabolic as well as tissue distribution studies [1, 12, 13]. Moreover, compared with traditional sampling methods such as tissue biopsy, saliva sampling, skin blister, etc., microdialysis is currently the most appropriate, highly efficient and well-established sampling method [12, 14, 15]. The purpose of this study is to utilize the microdialysis method coupled with high performance liquid chromatography-Ultraviolet detection (HPLC-UV) to analyze the pharmacokinetic process of acetaminophen in the ECF of rats’ hypothalamus. And the results would provide suitable references for the clinical development of dosing schedules of acetaminophen. At the same time, it may also establish a new studying method for pharmacokinetics of drugs in the target tissue.

Materials and Methods

Chemicals

Acetaminophen was purchased from Anhui Yongan Pharmaceutical Co. Ltd. Urethane (ethyl carbamate) and propylene glycol were obtained from Shanghai Chemical Reagent Co. Ltd (Shanghai, China) and Hunan Erkang Pharmaceutical Co. Ltd. (Hunan, China), respectively. HPLC-grade methanol andacetic acid were purchased from Tianjin Fu Chen Chemical Reagent Factory (Tianjin, China) and Nanjing Chemical Reagent Co. Ltd. (Nanjing, China), respectively. Artificial cerebrospinal fluid (aCSF) included KCl 3.0 mM, MgCl2 1.0 mM, CaCl2 1.3 mM, NaCl 140 mM, Na2HPO4 2.0 mM and NaH2PO4 0.2 mM. Purified water from an AHJZ water purification system was used throughout the experiment. All other chemicals and reagents were of analytical grade.

Animals

Healthy male Sprague-Dawley rats, weighing 250–320g, were purchased from Qing Longshan Animal Breeding Laboratory (Nanjing, China). All animals had free access to food and tap water and were housed at a constant temperature (25 ± 2°C) with a relative humidity (60 ± 2%) under a 12 h light/dark cycle. All experimental protocols were performed in accordance with the principles of animal use and care approved by the ethnical committee of Wannan Medical College.

Chromatographic System

The chromatographic analysis was carried out on Agilent 1100 LC system (Agilent, USA), coupled to an ultraviolet detection (G1314A). The chromatographic system was used under the following condition: Ultimate XB-C18 column (4.6 × 150 mm, particle size 5μm, USA); mobile phase consisting of phosphate buffer-methanol-glacial acetic acid (90: 10: 0.25, v/v/v) at a flow rate of 1.0 mL/min; injection volume of 20 µL; Column temperature of 25°C and UV detection at 248 nm.

Microdialysis System

The microdialysis system consisted of a microinjection pump (KD Scientific, USA) connected to a 5.0 mL plastic syringe (Hamilton, USA), a MAB 85 fraction collector (Stockholm, Sweden) and a microdialysis probe (EICOM, Japan) which was inserted into the target site.

Preparation of Standard Solutions and Quality Control Samples

The acetaminophen was dissolved in aCSF for obtaining standard final concentrations of 0.25, 0.5, 2.5, 5.0, 10.0, 25.0 µg/mL. Quality control (QC) samples with low (0.5 µg/mL), medium (5.0 µg/mL) and high (25 µg/mL) were also prepared. And then 20 µL of microdialysate samples were injected into the chromatographic system for analyzing.

Selectivity, Linearity and Sensitivity

The selectivity was determined by comparing the chromatograms of blank aCSF sample, blank aCSF spiked with acetaminophen, and microdialysate sample obtained after administration of acetaminophen. To calculate the linearity, the calibration curve with six points in the range of 0.25–25.0 µg/mL was built using peak area of acetaminophen versus acetaminophen concentration. The limit of detection (LOD) was defined as the lowest concentration of analyte and calculated by signal/noise (S/N) ratio equal to 3.

Precision and Relative Recovery

Inter- and intra-day precision were calculated from replicate analysis (n = 5) of QC samples for microdialysate samples, on five consecutive days. The relative recovery was also determined by analyzing the same QC samples in replicate analysis (n = 5). The relative recovery (mean ± SD) was estimated by comparing the measured concentrations to the known concentrations. The relative standard deviation (R.S.D.%) was used to judge the precision.

In vivo Microdialysis Experiment

After rats (n = 5) were anaesthetized by the 20% urethane solution (1.2 g/kg, i.p.) and placed in a stereotaxic apparatus, a microdialysis probe was implanted stereotaxically into the hypothalamus zone (from lambda 4.0 mm posterior, 1.0 mm lateral, 8.0 mm ventral) according to the atlas of George Paxinos & Charles Wastson[16]. The probe was perfused with aCSF solution at a flow rate of 2 μL/min by a microinjection pump. After the probe was allowed to equilibrate for 1 h, the rat was treated with acetaminophen (150 mg/kg, i.p.). Then, the microdialysate samples were collected at 12-min intervals (24 µL) for 6 h and preserved at – 40°C refrigerator until analysis.

Recovery of Microdialysis Probes

The in vivo microdialysis probe recovery was determined by using a retrodialysis method [17]. For in vivo recovery, the microdialysis probe was implanted into the hypothalamus zone (above mentioned) of urethane anaesthetized rats. The microdialysis probe was perfused with aCSF solution containing acetaminophen (0.5, 5 and 10 µg/mL, respectively) at a constant flow rate of 2 μL/min by a microinjection pump. Following equilibration 1 h after probe implanted, microdialysates were collected at 12 min intervals for 1 h. And the concentrations of acetaminophen in the perfusate (Cin) and dialysate (Cout) were determined by the HPLC-UV system. The in vivo recovery was calculated by following equation: R = 1 – (Cout/Cin) × 100%.

Pharmacokinetics data

The concentrations of acetaminophen in rat microdialysates were determined from the calibration curve. The actual concentration in the ECF of hypothalamus (CHypo) were calculated from the concentrations in microdialysates (CMdia) by following equation: CHypo= CMdia/R. The observed data was used for the calculation of pharmacokinetic parameters by a one-compartment model method using DAS2.0 software. The main pharmacokinetic parameters: elimination of half-life (t1/2), peak time (Tmax), peak concentration (Cmax), and area under the concentration-time curve (AUClast, AUCinf), etc., were determined. The results are presented as mean ± standard deviation (mean ± SD). All data were analyzed by SPSS 13.0 software.

Results

Selectivity, Linearity and Sensitivity

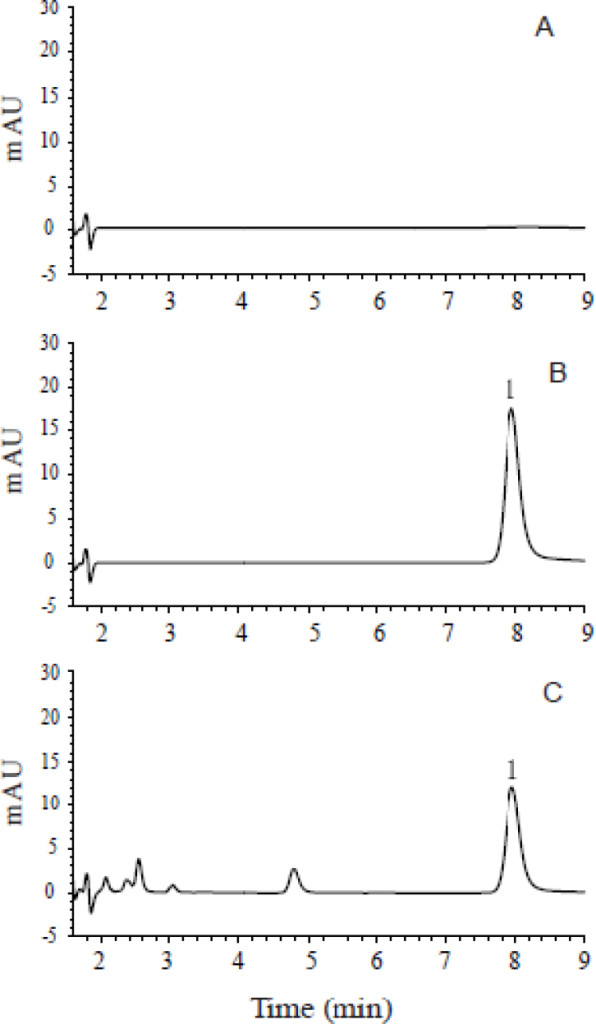
The acetaminophens retention time was 7.9 min. The high selectivity was proved by the absence of interfering peak of endogenous compounds around the retention time of acetaminophen (Fig. 1). The calibration curve for acetaminophen in microdialysates (0.25–25.0 µg/mL) was fitted to a linear equation which was A = 57.467 C – 1.9726 (r = 0.9993, n = 5), where A represents the peak area of acetaminophen, and C represents the concentration of acetaminophen. The LOD of acetaminophen for the microdialysate method was 0.25 µg/mL.

JPPR 2018-101-Zong-Yuan Hong China-F1

Figure 1. Chromatograms of (A) blank aCSF sample, (B) blank aCSF spiked with acetaminophen (peak 1), and (C) microdialysate sample obtained after administration of acetaminophen (peak 1). aCSF, artificial cerebrospinal fluid.

Precision and Relative Recovery

The inter- and intra-day precision and the relative recovery of the method were shown in Table 1. The inter- and intra-day precision of QC samples were 2.13%, 3.98% ,4.78%, and 2.56%, 3.44%, 6.37%, respectively. The relative recoveries of QC samples were 99.13 ± 2.17%, 99.53 ± 3.49% and 98.20 ± 5.24%, respectively. These results showed that the method had good precision and accuracy.

Recovery of Microdialysis Probe

The probe recovery determined by retrodialysis was showed in Table 2. At the concentrations of 0.5, 5.0 and 10.0 µg/mL (n = 5), the average recovery rate of microdialysis probe was 18.3%.

Table 1. The recovery rate and precision of acetaminophen in ECF (mean ± SD, n = 5)

Marked Conc. (µg/mL)

Measured Conc. (µg/mL)

Relative recovery rate (%)

Precision (RSD, %)

Inter-day

Intra-day

25.0

24.78 ± 0.54

99.13 ± 2.17

2.13%

2.56%

5.0

4.98 ± 0.17

99.53 ± 3.49

3.98%

3.44%

0.5

0.49 ± 0.03

98.20 ± 5.24

4.78%

6.37%

All means presented are arithmetic.

ECF: Extracellular fluid; SD: Standard deviation; Conc.: Concentration; RSD: Relative standard deviation.

Table 2. The recovery rate of microdialysis probe (mean ± SD, n = 5)

 Cin (μg/mL)

 Cout (μg/mL)

 R (%)

0.50

0.41 ± 0.00

18.27 ± 0.02

5.00

4.08 ± 0.00

18.34 ± 0.02

10.00

8.17 ± 0.00

18.28 ± 0.01

All means presented are arithmetic.

SD, standard deviation; Cin, concentration in perfusate; Cout, concentration in dialysate.

Pharmacokinetic Process of Acetaminophen

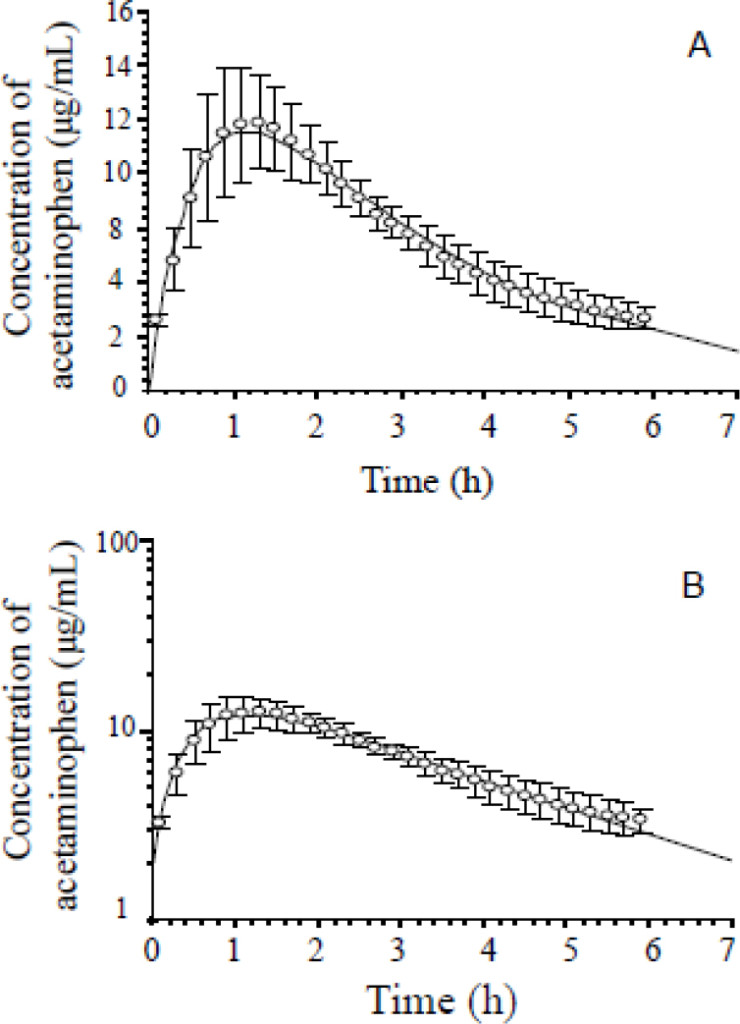
The mean concentration vs. time profile of acetaminophen in the ECF of rats’ hypothalamus after administration (150 mg/kg. i.p.) was presented in Figure 2. The concentration-time curve of acetaminophen was fitted to a one-compartment open model, and the main pharmacokinetic parameter estimates were t1/2 = (1.95 ± 0.59) h, Tmax = (1.26 ± 0.22) h, Cmax = (11.39 ± 2.17) μg/mL, AUClast = (42.93 ± 5.39) μg·h/mL and AUCinf = (58.04 ± 18.39) μg·h/mL, as shown in Table 3.

JPPR 2018-101-Zong-Yuan Hong China-F2

Figure 2. Mean C-T curves of acetaminophen in the hypothalamus extracellular fluid of rats after administration of acetaminophen (150 mg/kg, i.p., n = 5). (A) arithmetical C-T curve, (B) logarithmic C-T curve. C-T, concentration-time, error bars indicate standard deviation.

Table 3. Main pharmacokinetic parameters of acetaminophen (150 mg/kg, i.p.) in the ECF of rats (mean ± SD, n = 5)

Parameter

Hypothalamus

t1/2 (h)

1.95 ± 0.59

Cmax (μg/mL)

11.39 ± 2.17

AUClast (μg·h/mL)

42.93 ± 5.39

AUCinf ( μg·h/mL)

58.04 ± 18.39

Tmax (h)

1.26 ± 0.22

All means presented are arithmetic.

ECF, extracellular fluid; SD standard deviation; t1/2, terminal elimination half-life, Cmax, maximum concentration; AUClast, area under the concentration–time profile to the last measurable concentration; AUCinf, area under the concentration–time profile from the time of dosing extrapolated to infinity; tmax, time to reach maximum concentration.

Discussion

In the present study, we used in vivo microdialysis sampling method combined with HPLC-UV to investigate the pharmacokinetics process of acetaminophen in the hypothalamus of rats which is the target site (active-site ) of acetaminophen, and obtained some main pharmacokinetic parameters, such as t1/2, Tmax, Cmax, etc. Compared with data in plasma (t1/2, Tmax and Cmax were 1.20 ± 0.30 h, 0.58 ± 0.13 h and 97.09 ± 11.08 μg/mL, respectively), the t1/2 of acetaminophen in the hypothalamus was prolonged significantly, indicating that acetaminophen eliminated more slowly in the hypothalamus. While the Tmax in the hypothalamus was 2-fold longer than that in plasma, suggesting the delayed distrib ution of acetaminophen into the hypothalamus, which might be attributed to the presence of the BBB. It is apparent that the Cmax in plasma was higher than that in the hypothalamus as the acetaminophen concentration in plasma consisted of the free (unbound) and bund concentrations of acetaminophen. All these results suggested that there were significant differences in pharmacokinetic processes between the plasma and target organs/tissues.

In general, the biochemical events and pharmacological effects do not usually take place in the bloodstream, but in target tissues [1, 2]. And active site concentrations of unbound substances are better predictors of drug effects than total plasma or whole tissue concentrations. This is partly due to the presence of active transporters at tissues, but is also due to differences in plasma protein binding and non-specific tissue binding [11]. The active-site concentrations can be defined as the concentrations of unbound, pharmacologically active substances at the site of action. In contrast, the total concentrations of the drug in plasma ⁄ organ ⁄ tissue also include the protein- or tissue-bound molecules that are pharmacologically inactive [11].

Traditionally, plasma and whole tissue concentrations are used as predictors of effects and side effects, as well as calculating pharmacokinetic parameters because of their ease of sampling, while the concentrations of unbound drug in tissue are more difficult to measure. But just as mentioned above, better predictors of drug effects are the active site concentrations of unbound substances. The results in the present study suggested that there were significant differences between pharmacokinetic parameters based on the plasma drug concentrations and active-site drug concentrations, implicating that the dosing schedule of acetaminophen in clinic should be designed according to the pharmacokinetic parameters based on the active-site drug concentration for decreasing acetaminophen-causing side effects, i.e. hepatotoxicity. Therefore, it is not accurate and precise to calculate pharmacokinetic parameters using the plasma or whole tissue concentrations for dosing schedule of drugs in clinic.

With the introduction of microdialysis, the first technique with which unbound concentrations could be easily measured in vivo. Compared with plasma or tissue sampling, the in vivo microdialysis method possesses many advantages. Firstly, in vivo microdialysis method can obtain the active site concentrations of unbound drugs [1], which can more accurately predict drug effects and calculate pharmacokinetic parameters. Secondly, the microdialysate samples obtained by in vivo microdialysis method can be directly detected by HPLC or HPLC/MS/MS because only low-molecular weight substances can be diffusible through the semi-permeable membrane [2, 18]. Yet, before detecting, the plasma or tissue samples must be dealt with by series of pretreatment, such as protein precipitation, homogenization and centrifugation, etc. These procedures were relatively complex and resulted in unreliable drug concentrations. Finally, in vivo microdialysis method can be continuously sampling without loss of the body fluid during the experiment [19], especially small animals such as mice, rats, etc. In brief, in vivo microdialysis is a simple, feasible and reliable sampling method, which is of unique advantages in pharmacokinetics study.

For in vivo microdialysis method, it is essential to obtain the recovery rate of probe for determining the actual concentration of endogenous drugs or substances, which is determined by several factors such as physicochemical properties of the analyte, semi-permeable membrane materials, diffusion coefficient and temperature [20–23]. The flow rate of microdialysis probes is also a significant factor on the recovery rate of probe increasing with lower flow rate [20]. Generally, the perfusate is usually at a flow rate from 0.1 to 5.0 μL/min. In this study, taking several factors, such as sample volume, sampling time and sensitivity to detect the analyte, into account, we thought that the ideal flow rate was 2 μL/min. Moreover, there are many methods to calibrate the recovery rate of probe, for instance, retrodialysis method [17], external standard method [24], internal standard method [25] and zero-net flux method [26]. In this study, the recovery rate of probe was determined by using the retrodialysis method, the most common calibration method.

This study provided one sample of in vivo microdialysis applications in acquiring drug concentration at the target sites for studying pharmacokinetics in rats. In fact, in vivo microdialysis has been also widely applied in humans for obtain unbound drug or endogenous substance concentrations in the ECF of target tissues/organs. La Favor et al. [27] successfully utilized microdialysis to measure in vivo reactive oxygen species in human skeletal muscle, demonstrating the feasibility of measuring both in vivo H2O2 and superoxide in the extracellular environment of human skeletal muscle. Simmel et al. [28] provided the proof of principle of long-term subcutaneous microdialysis in humans in which they developed a special setting to ensure good clinical practice compliance, tolerability, and convenience for participants and personnel. Moreover, Prolonged microdialysis sampling over several days has been used for endogenous compounds and/or drugs in humans in neonatal [29–31] and adult [32–35] diabetic patients, in patients admitted for breast reconstruction with transverse rectus abdominis muscle flaps after mastectomy [36], in patients with ischemic heart disease [37], and in patients for neurochemical monitoring or on the neurosurgical ICU [38]. Hence, unquestionably, with the development of experimental science and technology, in vivo microdialysis would be more wide and deep application in basic and clinical pharmacokinetics studies.

Conclusion

Our results reveal that there are significant differences between pharmacokinetic parameters based on the plasma drug concentration and the active-site drug concentration, implicating that the dosing schedule of drugs in clinic should be designed according to the pharmacokinetic parameters based on the active-site drug concentration. And this study provides a simple, feasible and reliable experimental method for studying pharmacokinetics of drug in the target.

Acknowledgement: This work was supported in part by grants-in-aid for the National Natural Science Foundation of China (81671318, 81171255) and the Programs for Science and Technology Development of Anhui Province (1501041157).

Conflict of interest: All authors declare no conflict of interest

Ethical approval: All experimental protocols were performed in accordance with the principles of animal use and care approved by the ethnical committee of Wannan Medical College.

References

  1. Azeredo FJ, Dalla Costa T, Derendorf H (2014) Role of microdialysis in pharmacokinetics and pharmacodynamics: current status and future directions. Clin Pharmacokinet 53: 205–212. [crossref]
  2. Chaurasia CS, Müller M, Bashaw ED, Benfeldt E, Bolinder J, et al. (2007) AAPS-FDA Workshop White Paper: Microdialysis Principles, Application and Regulatory Perspectives. Pharmaceu Res 24: 1014–1025.
  3. Konings IR, Sleijfer S, Mathijssen RH, de Bruijn P, van Dam LM, et al. (2011) Increasing tumoral 5-fluorouracil concentrations during a 5-day continuous infusion: a microdialysis study. Cancer Chemother Pharmacol 67: 1055–1062.
  4. Bostrom E, Simonsson US, Hammarlund-Udenaes M (2006) In vivo blood-brain barrier transport of oxycodone in the rat: indications for active influx and implications for pharmacokinetics/pharmacodynamics. Drug Metab Dispos 34: 1624–1631.
  5. Larsen FS, Wendon J (2014) Understanding paracetamol-induced liver failure. Intensive Care Med 40: 888–890. [crossref]
  6. Botting R, Ayoub SS (2005) COX-3 and the mechanism of action of paracetamol/acetaminophen. Prostagland Leukot Essent Fatty Acids 72: 85–87.
  7. Yang BF, Su DF (2013) Pharmacology. Beijing: People’s Medical Publishing House.
  8. Lancaster EM, Hiatt JR, Zarrinpar A (2015) Acetaminophen hepatotoxicity: an updated review. Arch Toxicol 89: 193–199. [crossref]
  9. Lee WM (2008) Acetaminophen-related acute liver failure in the United States. Hepato Rese Official J of the Japan Society of Hepatology 38: S3.
  10. Larson AM, Polson J, Fontana RJ, Davern TJ, Lalani E, et al. (2005) Acetaminophen-induced acute liver failure: results of a United States multicenter, prospective study. Hepatology 42: 1364–1372.
  11. Hammarlund-Udenaes M (2009) Active-site concentrations of chemicals – are they a better predictor of effect than plasma/organ/tissue concentrations?. Basic & clinical pharmacology & toxicology 106: 215–220.
  12. Deitchman AN, Heinrichs MT, Khaowroongrueng V, Jadhav SB, Derendorf H, et al. (2017) Utility of Microdialysis in Infectious Disease Drug Development and Dose Optimization. AAPSJ 19: 334–342. [crossref]
  13. Joukhadar C, Müller M (2005) Microdialysis: current applications in clinical pharmacokinetic studies and its potential role in the future. Clin Pharmacokinet. 44: 895–913.
  14. Jadhav SB, Khaowroongrueng V, Derendorf H (2016) Microdialysis of Large Molecules. J Pharm Sci 105: 3233–3242. [crossref]
  15. Brunner M, Langer O (2006) Microdialysis versus other techniques for the clinical assessment of in vivo tissue drug distribution. Aaps J 8: 263–271.
  16. Paxinos G, Wastson C (1997) The Rat Brain in Stereotaxic Coordinates. San Diego: Academic Press.
  17. Ma ZQ, Tao F, Fang H, Xu T, Hong ZY, et al. (2013) Pharmacokinetics of tramadol hydrochloride in the extracellular fluid of mouse frontal cortex studied by in vivo microdialysis. Yao Xue Xue Bao 48: 406–410.
  18. Johansen MJ, Newman RA, Madden T (1997) The use of microdialysis in pharmacokinetics and pharmacodynamics. Pharmacotherapy 17: 464–481. [crossref]
  19. Zhuang L, Xia H, Gu Y, Derendorf H, Li Y, et al. (2015) Theory and Application of Microdialysis in Pharmacokinetic Studies. Curr Drug Metab 16: 919–931. [crossref]
  20. Kho CM, Enche Ab Rahim SK, Ahmad ZA, Abdullah NS (2017) A Review on Microdialysis Calibration Methods: the Theory and Current Related Efforts. Molecular neurobiology. 54: 3506–3527.
  21. Sun H, Bungay PM, Elmquist WF (2001) Effect of capillary efflux transport inhibition on the determination of probe recovery during I n vivo microdialysis in the brain. J Pharmacol ExpTher 297: 991–1000.
  22. Khan SH, Shuaib A (2001) The technique of intracerebral microdialysis. Methods 23: 3–9. [crossref]
  23. Lange D, Boer D, Breimer DD (2000) Methodological issues in microdialysis sampling for pharmacokinetic studies. Advanced Drug Delivery Reviews 45: 125–148.
  24. Kit Lee MK (2013) Crosstalk the Microdialysis in Scientific Research: from Principle to its Applications. Pharmaceutica Analytica Acta 05: 276–295.
  25. Larsson CI (1991) The use of an “internal standard” for control of the recovery in microdialysis. Life Sci 49: 73–78. [crossref]
  26. Song Y, Lunte CE (1999) Comparison of calibration by delivery versus no net flux for quantitative in vivo microdialysis sampling. Anal Chimica Acta 379: 251–262.
  27. La Favor JD, Anderson EJ, Hickner RC (2014) Novel method for detection of reactive oxygen species in vivo in human skeletal muscle. Physiol Res 63: 387–392. [crossref]
  28. Simmel F, Kirbs C, Erdogan Z, Lackner E, Zeitlinger M, et al. (2013) Pilot investigation on long-term subcutaneous microdialysis: proof of principle in humans. AAPSJ 15: 95–103. [crossref]
  29. [crossref] Horal M, Ungerstedt U, Persson B, Westgren M, Marcus C (1995) Metabolic adaptation in IUGR neonates determined with microdialysis–a pilot study. Early Hum Dev 42: 1–14.
  30. Baumeister FA, Rolinski B, Busch R, Emmrich P (2001) Glucose monitoring with long-term subcutaneous microdialysis in neonates. Pediatrics 108: 1187–1192. [crossref]
  31. Holzinger A, Bonfig W, Kusser B, Eggermann T, Muller H, et al. (2006) Use of long-term microdialysis subcutaneous glucose monitoring in the management of neonatal diabetes A first case report. Biol neonate 89: 88–91.
  32. Bolinder J, Ungerstedt U, Arner P (1992) Microdialysis measurement of the absolute glucose concentration in subcutaneous adipose tissue allowing glucose monitoring in diabetic patients. Diabetologia 35: 1177–1180.
  33. Bolinder J, Ungerstedt U, Arner P (1993) Long-term continuous glucose monitoring with microdialysis in ambulatory insulin-dependent diabetic patients. Lancet 30 342: 1080–1085.
  34. Hashiguchi Y, Sakakida M, Nishida K, Uemura T, Kajiwara K, et al. (1994) Development of a miniaturized glucose monitoring system by combining a needle-type glucose sensor with microdialysis sampling method. Long-term subcutaneous tissue glucose monitoring in ambulatory diabetic patients. Diabetes care 17: 387–396.
  35. Lutgers HL, Hullegie LM, Hoogenberg K, Sluiter WJ, Dullaart RP, et al. (2000) Microdialysis measurement of glucose in subcutaneous adipose tissue up to three weeks in type 1 diabetic patients. Neth J Med 57: 7–12.
  36. Edsander-Nord A, Röjdmark J, Wickman M (2002) Metabolism in pedicled and free TRAM flaps: a comparison using the microdialysis technique. Plast Reconstr Surg 109: 664–673. [crossref]
  37. Kennergren C, Mantovani V, Lonnroth P, Nystrom B, Berglin E, et al. (1999) Monitoring of extracellular aspartate aminotransferase and troponin T by microdialysis during and after cardioplegic heart arrest. Cardiology 92: 162–170.
  38. During MJ, Fried I, Leone P, Katz A, Spencer DD, et al. (1994) Direct measurement of extracellular lactate in the human hippocampus during spontaneous seizures. J Neurochem 62: 2356–2361.

Tamoxifen, Uterine Corpus Cancer and Breast Cancer

DOI: 10.31038/CST.2018332

Abstract

Background: In 2017 we described 5-year histological and disease-free survival data from a series of 429 patients with cancers of the uterine corpus (UCC), observing similar percentages to those described in the medical literature. The only difference we found with other published studies was a slightly lower percentage of serous carcinomas (SC) in the Western countries, but similar to the 3% of all SC in Japan [1]. The objective of this study was to evaluate the prognosis of uterine corpus cancer and the influence of tamoxifen on the histological types of uterine body cancer, and their long-term survival (20 year follow-up).

Methods: Two series of patients were included in this study: [1] 429 patients with uterine corpus cancer and [2] 1385 patients with breast cancer. The second group included 1057 patients who had been treated with tamoxifen and 328 who had not been treated. All women had been diagnosed at the same Hospital (General University Hospital of Vigo). Crossing both series, we observed that 51 women were diagnosed with both uterine and breast neoplasias.

Previously, we had excluded those cases of breast cancer (n = 1051) at the time of closing the data collection as we were not certain whether or not they had received hormonal treatment. We compared histological types of corpus uterine cancer for women with and without a prior diagnosis of breast cancer. Age of diagnosis, uterine tumor stage, histological cell type, histological grade, treatment and time 20 year free disease were analyzed using Kaplan-Meier and log-rank test analysis.

Results: Women diagnosed with UCC with a personal history of a previous breast cancer treated with tamoxifen had UCC with significantly more undifferentiated histological types than those with UCC who had not received tamoxifen: with a significantly higher proportion of uterine papillary serous carcinomas (3.2 % vs. 1.9 %), clear cell (6.4 % vs. 3.7 %), indifference carcinoma (3.2% vs. 0.8%) and sarcomas (9.7% vs. 3,7%) compared to those without a personal history of breast cancer (p < 0.001). There were no differences with regards FIGO Stage uterine corpus cancer with and without breast cancer history (p > 0.05). The 20-years free of disease survival in patients with endometrial adenocarcinoma was significantly decreased in women with tamoxifen breast cancer history (p = 0.04).

Conclusions: In this study, our data showed that women with uterine corpus cancer who had a personal history of breast cancer treated with tamoxifen had an increased risk of developing more aggressive UCCs and a lower 20-years free of disease survival. The odds ratio was 2.4. We think that a regular uterine endometrial and myometrial follow-up in the very long term is necessary in women diagnosed with breast cancer and treated with tamoxifen.

Keywords

breast cancer (BC), FIGO (International Federation of Gynecology and Obstetrics), endometrial adenocarcinoma, serous carcinoma (SC), tamoxifen, uterine corpus cancer (UCC), uterine papillary serous carcinoma (UPSC)

Introduction

Tamoxifen remains a first-line adjuvant treatment for premenopausal breast cancer patients with estrogen receptor-α (ERα) positive tumors, and is often prescribed to postmenopausal females with ERα+ tumors. Tamoxifen functions as an antagonist to ERα and blocks its signaling pathway in ERα+ breast cancer cells. Tamoxifen has been prescribed to millions of females for breast cancer prevention and/or treatment. However, tamoxifen is also known to significantly enhance the risk of developing endometrial lesions, including hyperplasia, polyps, carcinomas, and sarcoma [2].

Previous case-controlled studies have shown that tamoxifen has allowed for an increase in the survival of women with breast cancer, reducing the risk of relapse after 5 years of treatment, but it was potentially carcinogenic to the endometrial tissue [3–4]. In one of the largest population studies done by Chen et al. In 2013, on 74,280 breast cancer patients, the use of tamoxifen for more than three years or in patients older than 35 years of age was associated with a significant increased risk for developing endometrial cancer, with odds ratios of 2.94 and 4.08 respectively [5].

Breast cancer treatment with tamoxifen and its association with a higher risk for uterine corpus cancer has been recognized for many years now, but its long-term effect has not been clearly recognized nor monitored. Some studies have found a small incremental increase in the risk ratio for endometrial carcinoma in postmenopausal breast cancer patients treated with tamoxifen over 5 years [5,6], while other studies have found that the risk ratio for developing endometrial carcinoma while on tamoxifen is similar to that when using other type of estrogens [7].

A few studies have associated the use of tamoxifen with the development of low level tumors [8,9] that in the majority of the cases are state I FIGO, low level and histological subtypes similar to those detected in women non using tamoxifen [10]. However, an increasing number of studies have found that women who received tamoxifen for breast cancer, have an increased risk of more aggressive endometrial cancers, with more non-endometrioid types, in more advanced stages [3,4] and with worse prognosis [11].

According to Hoogendoorn et al. [12], tamoxifen-associated tumors have less favorable histological features and are more agresive and with a worse survival rate after 3 years (82% versus 93% p = 0.0001). These tumors in long-term tamoxifen users were also more often steroid receptor-negative. Previously, Bergman et al. [13] had associated the long-term use of tamoxifen (2–5 years) to a higher incidence of malignent mixed mesodermic tumors (carcinomas) or sarcomas of the endometrium (15.4% versus 2.9% p≥0.02). Similar results have been published by Narod [11] and Lasset [14].

These conflicting reports in the literature may be a result of heterogeneous cohorts and an insufficient long-term follow-up with the patients. The objective of our study was to analyze the prognostic of the uterine corpus cancers and the influence of tamoxifen on the histological types of these types of cancers and patients’ long-term survival.

Materials And Methods

An observational prospective-retrospective and longitudinal study was conducted at General University Hospital in Vigo (Spain), in patients diagnosed with uterine corpus cancer (UCC) and breast cancer (BC) from November 1984 through September 2010. A total of 1814 patients were included in this study and in-situ breast cancers were not included. The tamoxifen minimum use required for this study was 3 years. The age of diagnosis, uterine tumor stage (FIGO, Staging 2009), histological type, tamoxifen treatment and time free disease were recorded. To analyze this study cohort and determine the 20-year disease-free specific survival, Chi-squared test and Kaplan-Meier analysis with log-rank test were performed. All statistical analysis were made using the Statistical Package for the Social Sciences (SPSS Inc., Chicago, Illinois, USA) version 22.0 for Windows.

Results

Crossing two series of patients diagnosed with UCC (n = 429) and another with BC (n = 1385) we observed that fifty-one women (n = 51) were diagnosed with both neoplasias, uterine and breast (Table 1). Our data showed that two thirds of these patients were diagnosed with UCC post breast cancer diagnosis, mostly associated with a previous treatment with tamoxifen.

Table 1. Patients (n = 51) diagnosed with both cancers: uterine corpus (UCC) and breast (BC)

UCC before

breast cancer

UCC synchronous to

breast cancer

UCC after

breast cancer

15 (29.4 %)

1 (1.9 %)

35 (68.6 %)

NO tamoxifen

no tamoxifen

tamoxifen treatment

4 (11.4 %)

31 (88.6 %)

In our study we analyzed 1385 breast cancer cases, with 76.3% of these patients (n = 1057) receiving tamoxifen treatment and 23.7% (n=328) not receiving it. Our data indicated that 31 of the 1057 patients (2.9%) developed UCC post-Tamoxifen treatment, whereas only 4 of the 328 patients (1.2%) developed UCC without treatment with tamoxifen. Therefore, we found an unusual ratio for breast cancer patients treated with tamoxifen and uterine corpus cancer of 2.4 (p = 0.05)

When we studied the different histological types and uterine tumor stages by FIGO 2009, the patients were classified into three groups: (a) 51 patients with both types of cancers (uterine and breast cancer), (b) 31 patients with uterine corpus cancer after treatment with tamoxifen for breast cancer and (c) 372 patients diagnosed with uterine corpus cancer only, no breast cancer (Table 2). Our data indicated that groups a and b had a significantly higher proportion of uterine papillary serous carcinomas (UPSC), clear cell (CC), indifference carcinoma and sarcomas compared to uterine cancer only (5.9% and 3.2 % vs. 1.9% for UPSC, 5.9% and 6.4 % vs. 3.7 for CC, 1.9% and 3.2 % vs. 0.8% for indifferent and 13.7% and 9.7 % vs. 3.7% for sarcomas; p < 0.001). However, there were not differences with regards to the FIGO Stage uterine corpus cancer with and without breast cancer (p > 0,05)

Table 2. Histological types of Uterine corpus cancer with and without breast cancer. Uterine-only breast with tamoxifen were included inside the Uterine-breast group for the counting on total cases ( 51 + 372 = 423)

Histology

Uterine-breast

a (n = 51)

Uterine- only breast with Tamoxifen

b (n = 31)

Uterine only

c (n = 372)

Total

(n= 423)

Endometrioid

33 (64,7%)

23 (74,2 %)

321 (86,3%)

354

UPSC

3 (5,9%)

1 (3,2 %)

7 (1,9%)

10

Clear cell

3 (5,9%)

2 (6,4 %)

14 (3,7%)

17

Indifferent

1 (1,9%)

1 (3,2 %)

3 (0,8%)

4

Sarcoma

7 (13,7%)

3 (9,7 %)

14 (3,7%)

21

Others

4 (7,8%)

1 (3,2 %)

13 (3,5%)

17

Total

100%

100%

100%

p < 0,001

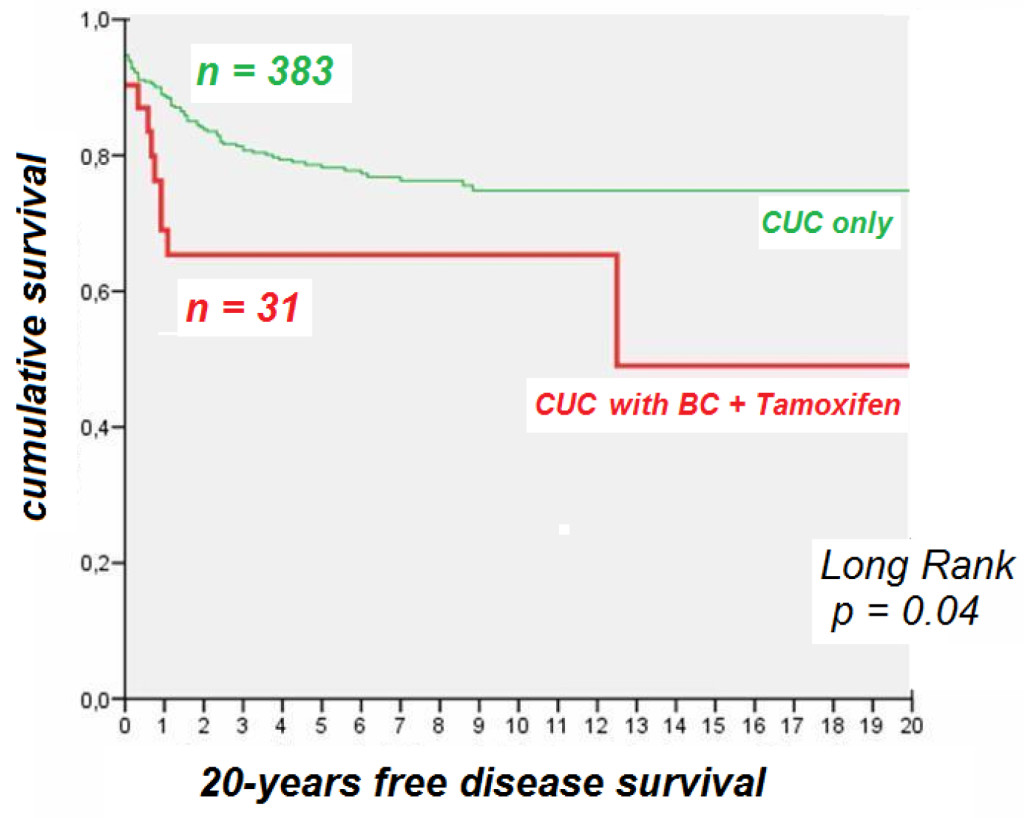
Finally, to evaluate whether the use of tamixofen could influence the prognosis of UCC at long term, we followed a 20 year free disease survival of 383 women with UCC only, and we compared it with the same time period for the 31 women diagnosed with UCC after being treated with tamixofen for breast cancer (Figure 1). Our data clearly indicated that the cumulative survival rate was significatively lower in women with uterine corpus cancer after breast cancer treated with tamoxifen, with a decrease of survival of 20% after 2 years and 40% after 12 years, compared with a slower pace 20% decrease in women with UCC only after 20 years.

CST 2018-112-JorgeCameselleSpain_F1

Figure 1. The 20-years disease free survival in patients with uterine corpus cancer (UCC) and UCC and breast cancer (BC) treated with tamoxifen.

Discussion

Breast, ovarian, and uterine corpus cancers are common female cancers and categorized as hormone-related diseases. The recent population-based study carried by Chen et al. in Taiwan to test the hypothesis of bidirectional associations among these cancers found similar results to our study [15]. Using a cohort of 110,112 cases with primary female cancers including uterine corpus cancer (11,146 cases), ovarian cancer (12,139 cases), or breast cancer (86,827 cases) from the Taiwan Cancer Registry from 1979 to 2008, the pairwise risks of second cancer among uterine corpus, ovary, and breast cancer cases were evaluated. A reciprocal relationship was found for these three female cancers, particularly most prominent between uterine and ovarian cancers, followed by breast and uterine cancers as well as breast and ovarian cancers. The overall risk of second cancers was highest within the first 5 years after the diagnosis of primary cancer. The bidirectional relationships suggest common risk factors among these three female cancers.

Our data showed that women with breast cancer and tamoxifen use had a relative risk of 2.4 to develop UCC when compared with women who didn’t use it. We also found that women with prior history of breast cancer and treated with tamoxifen were more likely to be diagnosed with a uterine corpus cancer of high risk (high histologic grade and no endometrioid types) as compared to those with uterine corpus cancer without prior breast cancer. One possible explanation for this difference could be the existence of a genetic association between breast and papillary serous cancers, as described by Horneich et al. in 1999 [16] but an association to the use of tamoxifen is a very plausible alternative. Our study found a significantly higher number (88.6%) of uterine corpus cancers developed in breast cancer patients after treatment with tamoxifen compared to the lower number (11.4%) of uterine corpus cancers developed in women who have had breast cancer without tamoxifen treatment. This difference could be due to the hormone-dependent characteristics linked to breask cancer and uterine cancer, as found previously in other studies [2,5] or the oncogenic effect of tamoxifen [17].

Bernstein at al in 1999 also found that the risk of endometrial cancer increased greatily in women with more than 5 years exposure to tamoxifen when compared to less than 5 years and nonusers [18]. In our study we found that in patients treated with tamoxifen, 15 endometrial adenocarcinomas appeared during the frst 5 years and 15 more tumors during the next 15 years, whereas carcinosarcomas were not detected during the first 5 years, and only 2 tumors appeared during the next 15 years. Only one case of leiomiosarcoma was detected after 6 years of breast cancer diagnosis (data not shown). It is important to highlight that when we evaluated the endometrial adenocarcinomes for histological subtypes, we observed the most aggresive types (serous and clear cell) in the 3 cases of women who have been treated with tamoxifen for breast cancer (Table 2)

Chronologically, the relative risk to develop an endometrial cancer is higher at two points: between the second and fifth year and between the 9th and 10th year after a breast cancer diagnosis. Therefore these data suggest that women with breast cancer treated with tamoxifen should be monitored for longer periods of time due to their higher risk to develop more aggresive types of uterine corpus cancer many years after ending their treatment, although these cancers could also be due to their association with increased age.

If we evaluate a 20-years disease free survival instead of a 3–5 year period, considering that the tumors can develop several years after ending the treatment with tamoxifen, our data support the fact that the survival rate at those two time periods is significatively different, decreasing overtime for women who underwent this treatment
(Figure 1). By continuing to studying the long term survival at 20 years, we were able to evaluate more precisely the long-term effect of tamoxifen, as already suggested in other studies [5, 15, 19–22]. Based on these data, we believe that it is neccesary to create an increased awareness among gynecological health providers. Regular follow-ups, pelvic examinations and uterine endometrial screening may play a very important role for endometrial carcinoma early diagnosis in women who have undergone treatment with Tamoxifen for breast cancer, and it might decrease the risk incident for uterine cancer in the long term.

Our study shows that women with uterine corpus cancer (UCC) who have had a personal history of breast cancer treated with tamoxifen, have an increased risk of developing more aggressive UCC overtime, and a lower 20-years free disease survival rate. Therefore We highly suggest that a specific uterine endometrial and myometrial follow-up in the very long term is necessary and will help to improve the lives of women diagnosed with breast cancer and treated with tamoxifen.

References

  1. Cameselle-Teijeiro JF, Valdés-Pons J, Cameselle-Cortizo L, Fernández-Pérez I, Lamas González MJ, et al. (2017) Tumours of the Uterine Corpus: A Histopathological and Prognostic Evaluation Preliminary of 429 Patients. J Clin Med Exp Images 1: 11–19.
  2. Hu R, Hilakivi-Clarke L, Clarke R (2015) Molecular mechanisms of tamoxifen-associated endometrial cancer (Review). Oncology Letters 1495–1501.
  3. van Leeuwen FE, Benraadt J, Coebergh JW, Kiemeney LA, Gimbrere CH, Otter R, et al. Risk of endometrial cancer after tamoxifen treatment of breast cancer. Lancet 343: 448–452.
  4.  Swerdlow AJ, Jones ME; British Tamoxifen Second Cancer Study Group (2005) Tamoxifen treatment for breast cancer and risk of endometrial cancer: a case-control study. J Natl Cancer Inst 97: 375–384. [crossref]
  5. Chen JY, Kuo SJ, Liaw YP, Avital I, Stojadinovic A, et al. (2014) Endometrial Cancer Incidence in Breast Cancer Patients Correlating with Age and Duration of Tamoxifen Use: a Population Based Study. Journal of Cancer 5: 151–155.
  6. Vogel VG, Costantino JP, Wickerham DL, Cronin WM, Cecchini RS, et al. (2006) Effects of tamoxifen vs raloxifene on the risk of developing invasive breast cancer and other disease outcomes: the NSABP Study of Tamoxifen and Raloxifene (STAR) P-2 trial. JAMA 295: 2727–2741. [crossref]
  7. Eltabbakh GH, Mount SL (2001) Tamoxifen and the female reproductive tract. Expert Opin Pharmacother 2: 1399–1413. [crossref]
  8. Neven P, De Mylder X, van Belle Y, van-Hooff I, Vanderick G (1998) Longitudinal hysteroscopic follow-up during tamoxifen treatment. Lancet 351: 36.
  9. Deligdisch L, Kalir T, Cohen CJ, de Latour M, Le Bouedec G, Penault-Llorca F (2000) Endometrial histopathology in 700 patients treated with tamoxifen for breast cancer. Gynecol Oncol 78: 181–186.
  10. Peters-Ingl C, Frank W, Danmayr E, Frield HP, Leodolter S Medl M (1999) Association between endometrial cancer and tamoxifen treatment of breast cancer. Breast Cancer Res Treat 54: 255–260.
  11.  Narod SA, Pal T, Graham T, Mitchell M, Fyles A (2001) Tamoxifen and risk of endometrial cancer. Lancet 357: 65–66. [crossref]
  12. Hoogendoorn WE, Hollema H, van Boven HH, Bergman E, de Leeuw-Mantel G, Platteel I, et al. Comprehensive Cancer Centers TAMARISK-group: Prognosis of uterine corpus cancer after tamoxifen treatment for breast cancer. Breast Cancer Res Treat 112: 99–108.
  13. Bergman L, Beelen ML, Gallee MP, Hollema H, Benraadt J, Van Leeuwen FE (2000) Risk and prognosis of endometrial cancer after tamoxifen for breast cancer. Comprehensive Cancer Centres ALERT Group. Assessment of Liver and Endometrial cancer Risk following Tamoxifen. Lancet 356: 881–887.
  14. Lasset C, Bonadona V, Mignotte H, Brémond A (2001) Tamoxifen and risk of endometrial cancer. Lancet 357: 66–67. [crossref]
  15. Chen MC, Lee KD, Lu CH, Wang TY, Huang SH, Chem CY (2018) Bidirectional association among female hormone-related cancers: breast, ovary and utery corpus. Cancer Medicine 2018 (Apr): 1–8.
  16. Hornreich G, Beller U, Lavie O, Renbaum P, Cohen Y, Levy-Lahad E (1999) Is uterine serous papillary carcinoma a BRCA1-related disease? Case report and review of the literature. Gynecol Oncol 75: 300–304.
  17. Burke TW, Tortolero-Luna G, Malpica A, Baker W, Whittaker L, Johnson E, et al. Endometrial hyperplasia and endometrial cancer. Obstet Gynecol CIin North Am 1996; 23: 411–456.
  18. Bernstein L, Deapen D, Cerhan JR, Schwartz SM, Liff J, McGann-Maloney, et al. (1999) Tamoxifen therapy for breast cancer and endometrial cancer risk. J Natl Cancer Inst 91: 1654–1662.
  19. Valdes-Pons J (2011) Breast cancer endometrial pathology (doctoral thesis). Santiago de Compostela: Santiago de Compostela University ISBN 978–84–9887–726–7.
  20. Spanos WJ Jr, Peters LJ, Oswald MJ (1986) Patterns of recurrence in malignant mixed müllerian tumor of the uterus. Cancer 57: 155–159. [crossref]
  21. Pierce SR, Stine JE, Gehrig PA, Havrilesky LJ, Secord AA, et al. (2017) Prior breast cancer and tamoxifen exposure does not influence outcomes in women with uterine papillary serous carcinoma. Gynecologic Oncology 144: 53 -535.
  22. Varras M, Polyzos D, Akrivis Ch (2003) Effects of tamoxifen on the human female genital tract: review of the literature. Eur J Gynaecol Oncol 24: 258–268. [crossref]

Challenges in Nutritional Clinical Research: How Can Adaptive Design Be of Help

DOI: 10.31038/NRFSJ.2018112

Abstract

Traditional randomized controlled clinical trial designs pose a number of particular challenges for nutrition research. For instance, small effect size and large variability of the response is very common and there is often a limited amount of early development data to inform the design of confirmatory trials. Individual nutrients often interact with different physiological processes and they require the interaction with other nutrients to act in the most beneficial way. This makes it difficult to delineate physiological beneficial effects of nutritional ingredients or products. In the past decades, the use of adaptive clinical trial designs has emerged as a promising methodology for early identification of signals related to clinical benefits of an intervention or for optimizing trials’ chances of success. We believe that adaptive designs can, as it has been the case for drug development, help in improving significantly some aspects of the nutrition research. In this article, the application of adaptive design methods in nutritional clinical trials is discussed in terms of benefits, challenges and recommendations. This article aims to be a practical and comprehensive review on the topic, to raise awareness and stimulate an adaptive design mindset toward investigators, scientific community and trial statisticians in the field of nutrition.

Keywords

Clinical research in nutrition; Randomized clinical trial; Adaptive design; Flexible trials; Nutrition specificities; Interim analysis; Group sequential design; Sample Size Re-assessment; Seamless trials; Simulation guided clinical trials

1. Introduction

In clinical research and development, adequate well-controlled clinical trials using valid study designs are essential for demonstrating causal relationship with the experimental intervention and obtaining substantial evidence on the safety and efficacy [1]. The clinical trial process is lengthy and costly, but necessary to ensure a fair and reliable assessment of the intervention under investigation.

     In the early 2000s, it was recognized that increasing investment in biomedical research has not resulted in a proportional increased success rate of pharmaceutical/clinical development. The United Sates (US) Food and Drug Administration (FDA) kicked off the Critical Path Initiative to identify possible causes and provide solutions. In 2006, the FDA released a Critical Path Opportunities List that outlines six broad topic areas to bridge the gap between the quick pace of new biomedical discoveries and the slower pace at which those discoveries are currently developed into therapies. Among these broad topic areas, the FDA called for advancing innovative trial designs and especially for the use of prior experience or accumulated information in trial design. Many researchers interpreted this as an encouragement by the FDA of the use of adaptive design methods or Bayesian approaches in pharmaceutical/clinical development. As a result, the FDA published a first draft guidance on Adaptive Clinical Trial Designs in 2010. The use of adaptive trial designs in clinical research and development has become very popular since then. Adaptive designs provide the opportunity to modify certain aspects of the trial design whilst the study is still ongoing, without violating the quality and the integrity of the data. The use of adaptive design in clinical trials is attractive because of its flexibility and efficiency for early identifying signals of clinical benefit of an intervention. They help increase the probability of success of the clinical investigation, better reflect real clinical practice, and offer ethical advantages in making early decisions with respect to both efficacy and safety of the intervention.

Nowadays, nutritional interventions are developed to demonstrate the maintenance/improvement of physical and mental well-being or the prevention of nutrition-related diseases. Research in the field of nutrition has grown substantially in the past decade. Technological breakthroughs and research discoveries have greatly increased the scope of targeted health benefits and has even attracted pharmaceutical companies, especially in the area of functional food. Today nutrition research is facing challenges similar to pharmaceutical research, with respect to cost and complexity of clinical trials, but nutritional clinical trials have also very specific challenges and obstacles to overcome. Nutrition-based interventions can lead to significant public health advances, but require an approach that takes into account the specificities of nutritional research. We believe that adaptive designs can, as it has been the case for drug development, help in improving significantly some aspects of the nutrition research.

In this article, the application of adaptive design methods in nutritional clinical trials is discussed in terms of benefits, challenges and recommendations. This article aims to be a practical and comprehensive review on the topic, to raise awareness and stimulate an adaptive design mindset toward investigators, scientific community and trial statisticians in the field of nutrition. Concrete guidelines and key literature references are given as a first base to adaptive approach, in order to maximize success of implementation and prevent inappropriate use of the methodology for those who are not familiar with the topic. First, a general overview of adaptive clinical trial designs is presented. The following section outlines then the challenges in nutrition clinical trials and, for some aspects, discuss the opportunity of applying adaptive design methodology. Some key considerations, consolidated from literature review and authors’ experience, for the implementation of flexible designs in the nutritional field are detailed in last section.

2. What is Adaptive Clinical Trial Design?

In conventional trial designs, the study progresses in a lock-step fashion. Once the objective(s) of the trial is (are) clear, key decisions need to be made to set up the trial design: choose relevant outcomes, set a hierarchy of parameters in line with the trial strategy, define the target population, select an appropriate dose regimen, decide on the hypothesis used for sample size, plan upfront the statistical analysis with appropriate missing data and multiple testing strategy etc. These discussions on critical aspects of the trial are made according to the available information during the trial preparation phase. After incorporating all the decisions in the trial protocol, the study moves into the execution phase. Once trial execution is completed, data are locked for the next phase: analyses and sharing of results.

     Some would argue that this is how we always did and should do clinical trials. To be provocative, authors argue that this is somehow like driving a car with the eyes closed. You plan your trip and you decide to go from point A to B (design thinking), you draw precisely your itinerary on a map (protocol writing) without forgetting to fuel your car (sample size). But then once on the road (trial execution), you will drive from A to B the eyes half-closed. Game is set. Few driving adaptations are sometimes made (protocol amendment) but you follow mainly your map, not really what’s happening on the road. And major events can be ignored, because you do not see them. Adaptive trial design suggests, if well anticipated during the planning of your trip, to open the eyes and adapt your driving.

The idea of adaptive design methods in clinical trials is to allow certain flexibility for identifying any signal, pattern/trend, and preferably best (optimal) clinical benefits of an intervention during the conduct of the clinical trial (after the review of accumulated data available). Appropriate flexibility allows the modification of the study design as the clinical trial continues, for achieving the study objectives accurately and reliably with a higher probability of success and in a more efficient way compared to traditional fix design.

2.1  Definition of Adaptive Design

An adaptive design can be defined as a design that allows adaptations to trial and/or statistical procedures of the trial after its initiation without undermining the validity and integrity of the trial [2]. An adaptation is referred to as a modification or a change made to trial and/or statistical procedure before, during, and after the conduct of a clinical trial. By definition, adaptations that are commonly employed in clinical trials can be classified into the categories of prospective (or by design) adaptations, concurrent (or ad hoc) adaptations, and retrospective adaptations. Thus, alternatively, with the emphasis on the feature of by design adaptations only (rather than ad hoc adaptations), the US Pharmaceutical Research Manufacturer Association (PhRMA) Working Group on Adaptive Design refers to an adaptive design as a clinical trial design that uses accumulating data to decide on how to modify aspects of the study as it continues, without undermining the validity and integrity of the trial [3]. An adaptive design is also considered as a flexible design [4, 5]. In February 2010, the US FDA circulated a draft guidance on adaptive design clinical trials. The FDA draft guidance defines an adaptive design as a study that includes a prospectively planned opportunity for modification of one or more specified aspects of the study design and hypotheses based on analysis of (usually interim) data from subjects in the study [1]. The term prospective is emphasized to refer to the adaptations planned before data were examined in an unblinded manner. Analyses of the accumulating study data are performed at prospectively planned time points within the study, with or without formal statistical hypothesis testing. In practice, the design does not change, as flexibility is part of the design.

2.2 Types of Adaptive Design

Depending upon the types of adaptations employed, adaptive designs can be classified into the following types: 1- adaptive randomization design, 2- group sequential design, 3- sample size re-estimation design, 4- drop-the-losers (or pick- the-winner) design, 5- adaptive dose finding design, 6- biomarker-adaptive design, 7- adaptive treatment-switching design, 8- hypothesis-adaptive design, 9- adaptive seamless trial design (e.g., a phase I/II design in early phase of clinical development or a phase II/III design in late phase of clinical development), 10- multiple adaptive design. Detailed information regarding the classification and these adaptive designs with their commonly considered advantaged and limitation can be found in [6, 7]. To explain briefly a few: a group sequential design allows for prematurely stopping a trial due to safety, futility and/or efficacy. A sample size re-estimation design allows for sample size adjustment or re-estimation. A drop-the-losers design is a design that allows dropping the inferior intervention group. Adaptive seamless design combines objectives traditionally addressed in 2 or more separate trials into a single trial. An adaptive-hypotheses design allows modifications or changes in hypotheses. Group sequential design, adaptive dose finding design, and adaptive seamless design (also known as two-stage adaptive seamless design) are probably the most commonly employed adaptive trial designs in clinical research and development. Sample size reassessment has also received great attention during the last decade. Most recently, biomarker-adaptive (or biomarker-driven) trial design has become very popular for clinical research and development of precision medicine.

In the 2010 FDA draft guidance, adaptive designs are classified into two categories: well-understood designs and less well-understood designs. Well-understood design refers mainly to the study designs with planned modifications based on an interim analysis that either need no statistical correction or for which the statistical methods for data analysis (i.e. properly accounting for the analysis-related multiplicity issues) are well established. Such adaptive design methods include the classical group sequential design with the adaptations of stopping the trial early due to safety, futility and/or efficacy and approaches using overall/blinded outcome data, baseline data, or efficacy unrelated outcome data. Moreover, they have been employed in clinical research for years and the regulatory agencies have built sufficient experience to evaluate this class of adaptive designs. Less well-understood designs, on the other hand, are the study designs whose statistical properties are not yet established and/or fully understood. Less well-understood adaptive design methods usually involve unblinded interim analyses to estimate the intervention effect(s). For example: unblinded interim analyses may include adaptive randomization based on relative intervention group responses, sample size re-estimation based on effect size estimates at interim, and modification of the patient population based on treatment-effect estimates. Most importantly, the regulatory agency has limited experience in evaluating the validity and integrity of these adaptive design approaches.

     Nowadays the classification made in the 2010 guidance issued by Center for Drug Evaluation and Research (CDER) and Center for Biologics Evaluation and research (CBER) of the FDA is commonly accepted, used and discussed in the literature. However, the draft guidance issued in 2015 by CBER and the Center for Devices and Radiological Health (CDRH) do not use this classification [8]. With a growing literature and FDA exposure with regard to less well-understood design, some complex adaptation such as unblinded sample size re-estimation are becoming better understood and already showed record of positive regulatory acceptation [9].

2.3  Benefits, limitations and requirements: General considerations

Possible benefits for the use of adaptive design methods in clinical trials include 1- the correction of wrong assumptions made at the beginning of the trial such as power calculation for sample size, 2- the selection of the most promising option early with limited number of subjects available at interim, 3- the use of emerging external information (e.g. recent publications regarding safety and tolerability of the intended dose regimen) and 4- the opportunity to react earlier to a surprise that is either positive (e.g., strong efficacy or clinical benefits) or negative (e.g., safety concern or futility), to shorten the development time and consequently speed up development process of the test intervention [10]. The use of adaptive design methods provides a second chance to modify or re-evaluate the trial after reviewing data from the trial itself at interim look. It allows the integration of knowledge gained from within the trial and enables at the earliest time point an appropriate decision making. It increases the information value generated per resource unit invested. Introducing planned flexibility can make a trial more efficient but also more ethical [11–13].

Compared to a fix design implementation, an adaptive design requires additional efforts during the planning, implementation, trial execution, analysis and valorization of results. It requires careful planning with input from a cross functional team. During the implementation and execution, it requires specific operational considerations compared to a traditional design. A close collaboration and coordination is needed between different functions during the course of the study, especially at the time of the interim analysis.

     Underlying theoretical complexity of adaptive design implies a solid statistical foundation and a careful interpretation of the results. Overall, major adaptations or modifications to a trial, could 1- introduce operational bias/variation to data collection, 2- result in a shift in the target population in terms of either location or scale parameter, and/or 3- lead to inconsistency between hypothesis to be tested and the corresponding statistical test. Consequently, one may not be able to answer to the medical/scientific questions that the original trial intended to answer. In addition, complex adaptive designs require a strong statistical expertise, an adequate infrastructure and /or external partnerships to guaranty the validity and integrity of the trial.

     The use of adaptive trial designs must not undermine the validity and integrity of the intended trial. Integrity refers to maintaining consistency and confidentiality of data during the conduct of the trial, independently of trial duration or number of adaptations [2, 3]. Validity refers to the minimization of biases that may be introduced after adaptations made to the trial, ensuring reproducibility, accuracy and precision of results coupled with inference that correctly accounts for all adaptations. Adaptations based on blinded analyses at the interim can largely reduce or completely avoid potential bias, and potential difficulties can be addressed prospectively if sufficient time is allocated during the planning phase of the trial.

2.4  Regulatory Perspectives

Since the release of the FDA draft guidance on adaptive design clinical trials [1], the use of the adaptive design methods in clinical trials is moving in the right direction. Yet, there is still a long way to go until all of the scientific issues from clinical, statistical, and regulatory perspectives are addressed properly. According to the draft guidance, the sponsors are encouraged to gain experience through the implementation of adaptive design methods in early phase trials and/or exploratory studies. For confirmatory trials involving a less well-understood adaptive design, the communication between sponsors and the regulatory agencies during the planning stage is recommended. Thus, it has been suggested that the escalating momentum for the use of adaptive design methods in clinical trials should proceed with caution [10]. Meanwhile, valid statistical methods for less well-understood adaptive designs with various adaptations should be developed to prevent the possible misuse and/or abuse of the adaptive design methods in clinical trials.

3. Nutrition Clinical Trials: opportunities and challenges for adaptive designs

Nutrition interventions mainly focus on maintaining health by reducing risk factors that predispose to the development of a disease. When designing a trial, maintaining health (i.e. reaching homeostasis of a physiological system at an optimal “healthy” level) as opposed to treating a disease (i.e. correcting a physiological process that is dysfunctional) demands from clinical nutrition scientists an approach that is different from a drug development way of thinking [14,15]. For example, maintaining normal blood pressure by reducing a risk factor will need a different test hypothesis with adapted endpoints and statistical analysis as compared to treating patients with diagnosed hypertension. Population selection and sub-group identification also require special attention. The difference between health and disease can be seen as a continuum [15]. It is often not easy to select a clear-cut and appropriate spectrum of the study population for which the desired health benefit of a nutrition intervention will be measurable and relevant from a public health perspective. Active compounds of nutritional interventions are often complex to investigate. In its most complex forms, nutritional interventions can contain living organisms like probiotic bacteria, supplements with mixtures of multiple ingredients and/or can consist of substantial modifications of the diet in general [16]. With regard to nutritional product interventions, they often contain ingredients that are already present in the daily food intake. Multiple components of the intervention may target different physiological pathways and their combined effect does not necessarily equal the sum of the effect of the individual ingredients; significant positive or negative interactions may occur. Nutrients are usually beneficial within a specific dose range and often, the intake of other nutrients needs to be optimized before the benefit of the nutrient under investigation can be established [14, 15 and 17]. When designing a clinical trial, challenges in capturing multiple physiological effects of nutrients and quantifying the level of interaction between multiple components of an intervention make it difficult to clearly identify at early stage the expected beneficial effects and related mechanism of action. It also complicates dose finding and makes it difficult to demonstrate the isolated benefit of the intervention. In practice, attempts to capture additive, synergistic or overlapping physiological effects often lead to clinical trials with multiple heterogeneous endpoints and the associated design challenges of multiplicity and appropriate sample size calculation. Small effect sizes of interventions are rather the rule than the exception. Most of the accepted endpoints for clinical trials are validated for the development of products that are intended to treat diseases; their usefulness in the target healthy population for nutritional claims is often questionable and rarely validated.

     Substantiating health benefits for nutritional interventions poses a number of challenges. We believe that this research framework requires exploratory trials with optimized design. In the present section, we selected 3 aspects of nutrition clinical research that create significant opportunities, but also limitation, for the application of adaptive designs in nutrition clinical research. The discussions addressed here can be applied in both academic and industry sponsored nutrition clinical research. Further reading on nutrition research specifically can be found with [14–19].

3.1  Limited learning phase in nutrition clinical development

Although the application of Good Clinical Practice guidelines and a strict follow up of study subjects are not negotiable, it is a fact that side effects and safety issues are less prevalent with nutrition compared to pharmaceutical interventions. This allows for a more flexible and faster clinical development process. In return, this leads to a more limited early learning phase and there are far less early development data available to inform the design of confirmatory studies. In such a context, there is a higher level of uncertainty and risk associated with the choice of the primary endpoint, the expected effect size and the variability of the response, but also with regard to the right dose of the active ingredients or the appropriate targeted population. It commonly leads to study designs attempting to answer multiple heterogeneous objectives. This increases the complexity of the trials, requiring very careful consideration of the sample size and tailor made statistical solutions to control the false positive error rate due to multiple hypotheses testing. Also, the often used approach of associating exploratory endpoints by nature to confirmatory objectives into a single trial can create a particular challenge with respect to controlling the statistical risks. Statistical requirements for confirmatory objectives trials are more stringent than for exploratory ones, and with such “one phase “ clinical trials one may need to find a good balance to control statistical risks without penalizing too much the trial.

This lack of learning phase is a good opportunity for a “learn and confirm” approach allowed by adaptive design methodology. In this context, different “learn and confirm” strategies can be used in a seamless way allowing to condense several phases of development, usually investigated in different trials, into one single adaptive trial with one protocol. The learning(s) and the confirmatory phase(s) are separated by interim looks with decision-making, thereby reducing the clinical development time and increasing the efficiency by combining information obtained from subjects of several phases in the final analysis. This inferential seamless approach (to differentiate from operational seamless) can be used in development for 1- selecting the most promising regimen of an intervention (according to the dose or duration for example) in the first exploratory stage, and 2- be able to conclude on the efficacy of the intervention in its most optimal form in the confirmatory stage. An example of phase II, III, IV adaptive design is described in [20]. An overview of seamless methods together with recommendations can be found in [21, 22]. See [12] for a discussion on opportunities of adaptivity in drug discovery and development process.

     Addressing multiple questions in the same trial may lead to complex adaptations with the associated challenges of controlling the Type I error and obtaining reliable and unbiased estimates. Adaptive trials are not a panacea for every uncertainty of the planning phase. In practice, it is important to make a realistic list of possible adaptations that takes into consideration the statistical, operational and regulatory constraints. Another aspect, not to be underestimated, is the fact that complex adaptations require non-negligible upfront preparation. Sometimes, it will be more beneficial to proceed in a lock step fashion and take the necessary time to explore the multitude of information that can be generated by a first exploratory trial, information that will be used later on to inform the design of a confirmatory trial.

3.2  Small effect size and large variability in the response to the intervention

In general, the beneficial effects of a nutrition intervention are small compared to what can be expected from a pharmaceutical compound. The expected beneficial effect is often close to the “noise” threshold of biological variability, which makes it more difficult to detect a significant difference. Most nutritional interventions target a generally healthy population, which substantially limits the margin for improvement when compared to a diseased population.

     Nutrition related-traits vary significantly between individuals. Dietary habits, lifestyle and constitutional factors generally change over time and vary between different cultures, populations and age groups. This results in a large inter and intra-individual variability with respect to nutrition requirements and response to nutritional intervention.

     These factors lead to the necessity of large trials, sufficiently powered to demonstrate a small health benefit against a large background variability. In addition, one would need to quantify or control the impact of numerous confounding factors related to environmental, behavioral and biological differences.

In some circumstances, small effect size with uncertainty on the hypothesis used to design the trial can set the scene for the use of Group Sequential Design (GSD) and/or Sample Size Re-assessment (SSR) strategy. The group sequential approach could provide the option to decrease the final sample size through realistic futility or efficacy boundaries. One could start with a conservative hypothesis designing the trial and decision rules at interim in such a way that the trial can be stopped earlier if the interim analysis reveals significant positive results (efficacy boundary crossed), or negative results (futility boundary crossed, safety concern or benefit/risk ratio not clearly favorable). Another approach could be to rely on a pure SSR strategy where the initial sample size of the trial is calculated based on optimistic hypotheses. Then one would upgrade the sample size at interim if the initial target is too optimistic but results are promising enough to invest in a larger sample size. A choice between GSD and SSR needs to take into account multiple aspects, including results of simulations. A relevant definition of positive, negative or promising results at interim and the selection of appropriate decision/success criteria are also critical aspects to decide on upfront the trial execution.

     Handling heterogeneity by increasing the sample size is one option. It is also possible to limit interventions to those subjects that are more likely to benefit from it. Enrichment strategies represent an attractive approach to address the challenge of heterogeneity [23]. For example: by using predictive markers as inclusion criteria or identifying a more responsive subgroup during the trial. The latter approach is called predictive enrichment and, while controlling the type I error, can substantially improve the power of the trial.

3.3 Different interests from different stakeholders: How to reconcile demands from regulatory authorities, the scientific community and the consumers

The regulatory environment for nutrition is substantially different from the one for medicinal products. Health Claims for (functional) foods are subject to a variety of regulations depending on the category to which the product belongs, e.g. food, dietary supplement, or medical food. Harmonization of regulatory requirements between countries is progressing but is less advanced than the regulations for drugs, especially regarding requirements for conducting clinical trials prior to the product launch. These aspects influence significantly the choice of study design and statistical methodology needed to build robust and reliable evidence that can convince different regulatory authorities. Other key stakeholders are the medical/nutrition scientific community and consumers. While the first group is more interested in the outcomes from a public health perspective, the consumers are primarily looking for a direct personal benefit for their health. In order to succeed in this complex landscape, evidence generated from a clinical research plan needs to be built through a multistage process that requires input from commercial, scientific and regulatory experts, with a critical need to achieve acceptance by the consumers [24, 25].

This environment where decision-making is subject to various short and midterm constraints and for which health benefits are often only detectable on the long term, is not always well adapted to the development of clinical trials deployed in a lock step fashion. Adaptive designs may help to improve the efficiency of a clinical research plan by improving flexibility, rapidity to get to the results and ability to integrate external sources of information.

     However speeding up the course of a trial is not always possible. The option for trial adaptation can become limited when the intervention duration is much longer than the recruitment period of the trial or when the endpoint of interest is assessed late in the trial process. For example demonstrating the benefit of nutrition in chronic conditions and/or as preventative measure is a long-term objective; and the lag time in observing a clinical benefit of a nutritional intervention often dictates a long trial duration. In this case, an adaptive design strategy relying on early readouts with biomarkers can still be interesting.

     Last, a more flexible and faster development process will not solve all the aspects of a complex and dynamic research environment. The different interests from the different stakeholders also impact the timeframe of development. A consumer will expect a rapid effect on his wellbeing and is less likely to adhere to a product if it takes months or years to see the difference. An improvement on the public health level, also requires a long-term strategy. It is often very difficult or impossible to combine objectives that take substantially different timeframes to achieve into the same clinical trial.

4. Adaptive Clinical Trials in practice: points to consider

To overcome some of the challenges in nutrition clinical trials, the use of adaptive design methods may be useful. In light of nutrition research specificities described before and to facilitate the understanding and implementation of successful adaptive designs in the nutritional field, this section aims at highlighting some general considerations and practical recommendations gained from academic and industry experience in the use of adaptive clinical trials over the past years.

4.1  Upfront assessment of trial strategies

Designing and implementing flexible trials usually requires more upfront preparation than traditional fix trial designs. It is strongly recommended that the rational, acceptability, feasibility, and potential impacts of the envisaged adaptations are carefully evaluated at the planning stage. In practice, the clinical trial team is encouraged to evaluate different trial options comparing scientific aspects, statistical operating characteristics, operational feasibility, bias implication, chance of success, timelines, possibility of messaging/communication but also financial implications. It is important to include in the assessment plausible clinical trial scenarios, covering pessimistic, expected, and optimistic cases. Furthermore, the trial design scenarios should not only cover flexible features but should also include an appropriate traditional fix design. In case the adaptive trial can replace several traditional trials, assessment should be done in light of an overall clinical development plan.

This evaluation will allow to weigh potential benefits against the challenges and the extra effort required by flexible design implementation. When comparing all various aspects of the trial options, the conclusion could be that implementing an adaptive design is not the most beneficial solution. Even if the solution of a fix design is finally retained, this assessment is generally highly beneficial for the trial or the clinical development plan.

Some of the elements mentioned above are detailed in the next sections. Further consideration on the planning phase of an adaptive trial can be found in [6, 26, 27].

4.2. Clinical trial simulations: quantitative assessment of design performance

There are many uncertainties before and after a trial adaptation. There is also a concern that performance of less well-understood designs is not well known because statistical methods are not yet fully developed. Clinical trial simulations should be conducted at the planning stage of the clinical trial to address these concerns and to provide enough evidence for informed decisions on the design of the trial.

Clinical trial simulation is a process that uses computing to mimic the conduct of a clinical trial by creating virtual patients to extrapolate (or predict) clinical outcomes for each of them [28]. When the adaptations are prospective, simulations could help in assessing biases and explore ways to correct them. It allows to fine-tune adaptation rules and evaluate the operating characteristics, validity, robustness and chance of success of the adaptive trial under various clinical trial assumptions. For example, the statistician could simulate clinical trials with different ranges of intervention effect or expected heterogeneity, drop out pattern and different timing of interim analysis. It is important to do this simulation exercise not only in case of an adaptive design, but also for the corresponding fixed trial design. It is likely that no design will be optimal for all aspects investigated and the cross functional team will have to define quantitative and measurable criteria on which to base design optimization (26).

Simulation and modeling activity leads to more carefully-thought trials [26, 27] and, in the last decade, has played an increasingly key role in improving efficiency of clinical trials. This process enables the project team to reflect deeply on the trial design and how the success of the trial should be defined. It helps in crystalizing discussions around quantitative measures on design performance rather than subjective points of view, raising earlier than usual technical and practical considerations that are too often lately addressed during the execution phase of the trial. The simulation exercise, being the only way to ensure appropriate design characteristics for complex adaptations, should be also performed when implementing well-understood adaptive design where operating characteristics can be derived analytically.

Readers can read more on what consists trial simulation in [26, 29 and 30].

4.3  Statistical perspective, from the design to analysis

Valid statistical methods are necessary to ensure the success of a clinical trial. Some topics have met with major controversy and can trigger – not only statistical – complex debates. Even if “ready-made” statistical/design solutions exist, it is important that the trial statistician invests time to really understand these methods in the context of the research project, with their pros and cons. The literature on the topic is large and still growing. Also, the statistician must be able to translate design features into understandable practical considerations that could be relevant to other functions in the clinical trial team. This is critical to facilitate the discussions during the assessment of different design options.

     Even for a single adaptive feature, there is no one-fits-all method. For example, if there are uncertainties on the assumptions made at the design stage, the trial statistician may want to investigate solutions that would allow changes on the sample size during the trial. There are many sample size modification strategies. First, the trial statistician will have to investigate and compare different approaches such as fully sequential, group sequential and sample size reassessment strategy. For the latter, one may have to choose between blinded sample size re-estimation for assessing the variability of the response or unblinded sample size re-estimation to assess the effect size of the intervention at interim. Each of these approaches underline different clinical trial strategies and has it own technical challenges and operational implications. Suppose that the trial team plans an unblinded sample size re-estimation: other layouts of methodological decisions will need to be discussed such as the method of re-estimation. According to the trial setting, some methods could be less conservative or more powerful than others in terms of sample size consumption. These aspects could be assessed with the help of simulations. The team could target also different objectives among, for example: 1- maintaining observed intervention effect (i.e., scientifically meaningful difference), 2- achieving conditional power targeting the original effect or 3- reaching desired reproducing probability. Challenges for the method of controlling type I error at the final stage could also influence the choice of the re-assessment methods as we can choose to either 1- perform non-standard analysis by modifying the test statistics or p-value boundaries or 2- perform a standard analysis at the end but state conditions under which sample size could be increased. The considerations highlighted above do no address the full picture of the sample size re-estimation methodology. These are just suggestions of first layouts of thinking to highlight the inherent technical complexities behind one single adaptation. A comprehensive summary on sample size re-estimation can be found in [31, 32].

Major adaptations or modifications to a trial, could 1- introduce operational bias/variation to data collection 2- result in a shift in the target population in terms of either location or scale parameter, and 3- lead to inconsistency between hypothesis to be tested and the corresponding statistical test. It is always interesting to investigate differences in results across stages (before and after adaptation) seeking for potential bias that might have been introduced. This investigation needs to be supported by statistical, operational and scientific views to delineate any bias from a natural drift of the trial population [26, 33 and 34].

     Overall, results obtained from complex adaptations are important to be scrutinized by the scientific community, especially when dealing with population enrichment or endpoints selection. It is important to be aware that under complex adaptive designs, valid statistical tests and the corresponding inferences are often difficult, if not impossible, to obtain. A major concern is the protection of Type I error rate, as naïve analysis in the presence of multiple looks and data driven changes usually inflates the false positive rate. For some adaptations, another statistical concern is how to obtain reliable parameter estimates, confidence intervals and correct p-values, combining data from subjects included prior and post interim looks [35, 36]. Note that adaptive designs conducted in early development do not necessarily require to meet the same statistical target or requirements than late phase confirmatory trials: they may focus less on the control of type I error, but more on obtaining unbiased estimates of the intervention effect.

4.4. Strategy for clinical operations: efficiency and bias control

Achieving the benefits of adaptive trials requires an effective operational strategy. Reasonable logistics effort and technological infrastructure should be in place for maintaining the integrity, quality, validity and efficiency of the intended adaptive trial. Operational bias can adversely affect critical decision making during the conduct of a trial (1) as well as the final interpretation of results. It is suggested to develop upfront a bias management plan that aims to identify, alleviate or eliminate, and control the operational biases.

To be able to make informed decisions at interim, data must be collected, monitored, cleaned, aggregated and analyzed with minimal delay. This can be greatly facilitated by electronic data capture (EDC) and real time data access. Compared to traditional design one will need to increase frequency of monitoring, data cleaning and study protocol deviations review. This effort has a cost, and this effort is part of an equation including timelines and resources. The goal for the interim analysis is: to get accurate and reliable data, in a timely fashion, with the right amount of effort. As “100% cleaned data” can be very difficult/impossible to meet, the team needs to focus on getting the best possible quality data, knowing the strengths and the potential limitation of the data. Careful consideration should be put on safety and data that are critical for decision-making at interim.

Selection of qualified study sites and appropriate supply structure is key to address potential recruitment and logistics challenges. For costly and/or complicated nutrition interventions, packaging and supply need to be optimized, especially when the design allows for dropping the inferior groups, for adaptive randomization or for sample size re-assessment. While assessing the feasibility of the adaptive trial design, expected recruitment rate is crucial in choosing the appropriate timing of the interim analysis.

The use of adaptive design methods may introduce so-called operational bias and/or variation, especially after the review of interim data. “All monitoring has potential action thresholds, whether implicit or explicit, and lack of action will generally imply that such threshold has not been reached” [37]. Operational bias often occurs when information extracted from an ongoing trial impacts the participant pool, investigator behavior, or other clinical aspects that affect the conduct of the trial, in such a way that conclusions about important safety or clinical benefit parameters are biased. To limit the possible inferences from observation of any mid-trial changes, one solution is to limit upfront information shared and give the right level of access to information to the right persons. Although the statistical details are key for the success of the adaptation, the protocol can stay general on the decision making rules. Details can be left for other documents with a more limited circulation (non-accessible for trial participants and extended project team), such as simulation reports and interim Statistical Analysis Plan. Some type of adaptations are more sensitive than others to the problem of information convey, and potential bias that may arise should be taken into consideration and balanced against integrity and interpretability of the trials. More details on this particular aspect can be found in [37].

Procedural considerations need also to be thought of upfront during the planning phase. This refers to the decision process and dissemination of information. Pivotal aspects to address are the establishment of clear data, information and decision flows, and the implementation of a Data Monitoring Committee (see next section).

Further consideration on operational challenges can be found in [37–39].

4.5. Data Monitoring Committee (DMC)

For adaptive clinical trials, it is strongly suggested that an independent DMC is established to serve as a guardian for integrity, quality, and validity of the intended clinical trial. The DMC, independent of any activities related to clinical operations of the study, is composed of experienced medical, scientific and statistical members. It is important to ensure that all relevant expertise is represented in the committee; but it seems advisable that the analysis, review and decision making roles remain in the hands of a limited number of individuals [37]. Depending on the study objectives and needs of the sponsor, the primary responsibility of the independent DMC is to ensure the validity and integrity of the clinical trial by performing ongoing safety monitoring, as well as by being involved in an interim analysis for evaluation of health benefits. The independent DMC performs its function and activity according to a written charter, which is usually developed and approved by the sponsor, the investigator and the DMC. This charter outlines the “rules of the game” by describing clear decision rules in order to avoid subjective and inappropriate decision by the DMC; acknowledging the fact that the DMC could take critical decisions based on unexpected trial events not anticipated in the charter. In practice, there is a separate team supporting the functions and activities of the DMC. The DMC support staff is responsible for performing an unblinded interim analysis and presenting the results to the DMC.

The most critical issue regarding the DMC is its true independence. To ensure the integrity/success of the clinical trial, the DMC must remain independent of the project team in order to provide a fair and unbiased recommendation based on the interim data. It should be noted that there is a discussion regarding whether we should add an additional burden on a existing DMC or establishing a separate DMC in order to monitor scientific validity and integrity of the clinical trials utilizing adaptive design methods.

Further reading on the role and responsibilities of the DMC can be found in [1, 40–43].

4.6. Computational solution

Statistical methods for the design and analysis of adaptive trials often pose computational challenges which result in the need of appropriate software solutions. Through academic and industry contribution, progress has been made on developing computational solutions in the last decade. Commercial software packages providing tools for planning, simulation, and analysis are available such as ADDPLAN and East. Existing SAS procedures are limited to the design and analysis of group sequential design, but SAS macros or SAS/IML macros can be found for example in [44, 45]. A simple search on the CRAN (Comprehensive R Archive Network) reveals an interesting number of packages, including simulation features. Great scope of R-programs, together with SAS programs, can be found also in [46]. A complete review of existing solutions is beyond the scope of this section; helpful reviews on this topic can be found in [47, 48].

Computational solution deploying new statistical methodology, addressing more complex adaptations or increasing the efficiency of existing solutions, can take time to be implemented and be available for the trial statistician. Often in practice, homemade programming is required to develop a tailor-made solution.

5. Concluding Remarks

Although introducing flexibility during the conduct of nutrition clinical trials is very attractive, 3 major questions inevitably arise. First, does the scientific and statistical validity of the trial remain intact after the intended modifications? Second, does the adapted design still meet the regulatory requirements to demonstrate the targeted nutritional health benefit? Third, does the clinical trial still address its original objectives after significant modification of the trial procedures? These questions should not only be addressed at the individual trial level, but it would be desirable that the regulatory and scientific communities develop guidelines on how to use the adaptive design methods in the nutrition clinical research and development process. Adaptive design methods have been used with records of success in the review/approval process of pharmaceutical products. However, the use of adaptive design methods in clinical trials conducted in nutritional research is not yet well established. The authors hope that this manuscript will contribute to a better understanding and acceptance of adaptive design methodology by the scientific community of nutrition research and will help in designing more efficient and ethical clinical trials.

     We acknowledge that walking the path of Adaptive Design will not be without obstacles, especially for clinical teams that are not routinely involved in this type of designs. Implementation and execution of adaptive designs represent a number of operational and technical difficulties that are not always easy to overcome. These issues, as well as a more general resistance to change, have hampered concrete adoption of the methodology in the past. See [27, 49 and 50] for an industry and academic perspective on the topic. Nevertheless, experience gained from concrete and meaningful implementations of flexible designs in other research areas should greatly help a beneficial transition to the adaptive mindset for nutrition research. For an organization, aiming to upgrade its environment to suit adaptive design implementation and execution, it will require to substantially review its existing clinical trial practices. Soliciting the assistance of experienced external partners (Contract Research Organization or academic group) may help to accelerate the progress through the learning curve. Readers are encouraged to go through references pointed in this manuscript, it should be of a great help if one wants to progress and raise its awareness on several aspects of flexible designs.

“A good design is the one that provides scientific validity and integrity and uses information derived from patients in the most intelligent way to make appropriate inferences at the earliest time point”[26]. Adaptive clinical trial designs with a “learn and confirm” approach fit perfectly to this definition. Using the information per subject in the most intelligent way, the methodology can have a great transformational impact on nutrition research. In addition, increased awareness of adaptive design seems to contribute to a better implementation and execution of traditional trials [27]. Indeed, recommendations for a successful implementation of adaptive design such as, the need of a well prepared planning phase, the assessment of trial options with a cross functional team, simulation-based evaluation of trial operating characteristics, quantitative comparison of design options, efficient data collection and cleaning, the need to optimize procedural and logistics plans, play also an important role in the success of traditional clinical trial designs.

     However, it should be clear that adaptive designs will not provide the solution to all the challenges of nutritional clinical trials. It should be part of a broad mindset that does not limit itself to randomized clinical trials as the sole evidence to demonstrate health benefits of nutrition. In the past decade, the range of targeted health benefits explored through nutrition intervention has significantly widened. This fast growing ambition is outpacing the rate of development of clinical trial methodologies that are adequately tailored to the needs of nutrition research. Although randomized clinical trials will remain the cornerstone for clinical evidence, nutritional clinical research could substantially benefit from other types of methodologies. In that respect, we can mention epidemiological studies (i.e. large observational studies and cohorts), pragmatic/large simple trial approach, N=1 trials, data mining technics, Bayesian approach, modeling and simulation of clinical trials and translational statistics. Also an increased level of fundamental research to better understand the physiology of nutrition and the development of better predictive health related biomarkers are needed. They will not only complement the evidence from adaptive design trials but will provided important knowledge that will allow better informed adaptive designs for clinical trials in nutrition research.

     Innovation in clinical research methodology will be essential to further improve the future standards for nutritional health benefit research. Together with evidence from other research methodologies, adaptive design methods and mindset offer an important opportunity to substantially raise the level of nutritional health benefit evidence beyond what is possible with traditional randomized controlled trials.

Acknowledgement

We thank Andreas Rytz (Statistician, Nestlé Research) for his in-depth review of the manuscript and constructive comments. We thank Stephane Collet (Head of clinical operation, Nestlé Research) for having supported this work from the beginning. We thank all the people from the Nestlé Clinical Development Unit that have contributed directly or indirectly to the progress of this manuscript.

 The author’s responsibilities were as follows — JT initiated the manuscript idea, wrote the manuscript and had primarily responsibility for the final content of the manuscript. All authors significantly contributed to the writing, provided critical intellectual content and were involved in the outlining, drafting, reviewing and in the final approval of the manuscript.

Authors have no conflicts of interest to disclose.

Sources of support: No financing to disclose

Clinical Trial Registry number: Not applicable

Health research reporting checklist, participant flow chart: Not applicable

Abbreviations:

US

United Sates

FDA

Food and Drug Administration

PhRMA

Pharmaceutical Research Manufacturer Association

CDER

Center for Drug Evaluation and Research

CBER

Center for Biologics Evaluation and research

GSD

Group Sequential Design

SSR

Sample Size Re-assessment

CRAN

Comprehensive R Archive Network

References

  1. U.S. Department of Health and Human Services, Food and Drug Administration, Center for Drug Evaluation and Research, Center for Biologics Evaluation and Research (2010). Draft guidance for industry: Adaptive design clinical trials for drugs and biologics. Rockville.
  2. Chow SC, Chang M, Pong A (2005) Statistical consideration of adaptive methods in clinical development. J Biopharm Stat 15: 575–91.
  3. Gallo P, Chuang-Stein C, Dragalin V, Gaydos B, Krams M, Pinheiro J (2006) PhRMA Working Group. Adaptive designs in clinical drug development–An executive summary of the PhRMA working group. J Biopharm Stat 16: 275–83.
  4. European Medicines Agency, Committee for Medicinal Products for Human Use (CHMP). Point to consider on Methodological issues in confirmatory clinical trials with flexible design and analysis plan. CPMP/EWP/2459/02. London, UK, 2002.
  5. European Medicines Agency, Committee for Medicinal Products for Human Use (CHMP). Reflection paper on Methodological issues in confirmatory clinical trials with flexible design and analysis plan. CPMP/EWP/2459/02. London, UK, 2006.
  6. Chow SC, Chang M (2008) Adaptive design methods in clinical trials – a review. Orphanet J Rare Dis 3: 11.
  7. Chow SC, Chang M (2011) Adaptive design methods in clinical trials. 2nd ed. New York, NY: Chapman and Hall/CRC Press, Taylor and Francis.
  8. U.S. Department of Health and Human Services, Food and Drug Administration, Center for Devices and Radiological Health, Center for Biologics Evaluation and Research (2015) Draft guidance for industry and food and drug administration staff: Adaptive designs for medical device clinical studies. Rockville.
  9. Miller E, Gallo P, He W, Kammerman LA, Koury K, Maca J,et al. (2017) DIA’s Adaptive Design Scientific Working Group (ADSWG): Best practices case studies for “less well-understood” adaptive designs. Ther Innov Regul Sci 51: 77–88.
  10. Chow SC, Corey R (2011) Benefits, challenges and obstacles of adaptive clinical trial designs. Orphanet J Rare Dis 6: 79. [crossref]
  11. Krams M, Sharma A, Dragalin V, Burns DD, Fardipour P, Padmanabhan SK, Perevozskaya I, Littman G, Maguire R. Pharm Med 3: 139–48.
  12. Bretz F, Branson M, Burman CF, Chuang-Stein C, Coffey CS (2009) Adaptivity in drug discovery and development. Drug Dev Res 70: 169–90.
  13. Legocki LJ, Meurer WJ, Frederiksen S, Lewis RJ, Durkalski VL, et al. (2015) Clinical trialist perspectives on the ethics of adaptive clinical trials: A mixed-methods analysis. BMC Med Ethics 16: 27.
  14. Blumberg J, Heaney RP, Huncharek M, Scholl T, Stampfer M, et al. (2010) Evidence-based criteria in the nutritional context. Nutr Rev 68: 478–484. [crossref]
  15. Gallagher AM, Meijer GW, Richardson DP, Rondeau V, Skarp M, et al. (2011) International Life Sciences Institute Europe Functional Foods Task Force. A standardised approach towards PROving the efficacy of foods and food constituents for health CLAIMs (PROCLAIM): Providing guidance. Br J Nutr 106: 16–28.
  16.  Schmitt JA, Bouzamondo H, Brighenti F, Kies AK, Macdonald I, et al. (2012) The application of good clinical practice in nutrition research. Eur J Clin Nutr 66: 1280–1281. [crossref]
  17. Heaney RP (2008) Nutrients, endpoints, and the problem of proof. J Nutr 138: 1591–1595. [crossref]
  18. Welch RW, Antoine JM, Berta JL, Bub A, de Vries J, et al. (2011) Guidelines for the design, conduct and reporting of human intervention studies to evaluate the health benefits of foods. Br J Nut 106 : 3–15.
  19. Hébert JR, Frongillo EA, Adams SA, Turner-McGrievy GM, Hurley TG, et al. (2016) Perspective: Randomized controlled trials are not a panacea for diet-related research. Adv Nutr 7: 423–32.
  20. Filozof C, Chow SC, Dimick-Santos L, Chen YF, Williams RN, et al. (2017) Clinical endpoints and adaptive clinical trials in precirrhotic nonalcoholic steatohepatitis: Facilitating development approaches for an emerging epidemic. Hepatol Commun 1: 577–85.
  21. Maca J, Bhattacharya S, Dragalin V, Gallo P, Krams M (2006) Adaptive seamless phase II/III designs – Background, operational aspects, and examples. Drug Inf J 4: 463–73.
  22. Chow SC, Lin M (2015) Analysis of two-stage adaptive seamless trial design. Pharm Anal Acta 6: 341.
  23. U.S. Department of Health and Human Services, Food and Drug Administration, Center for Drug Evaluation and Research, Center for Biologics Evaluation and Research, Center for Devices and Radiological Health (2012) Draft guidance for industry: Enrichment strategies for clinical trials to support approval of human drugs and biological products. Rockville.
  24. Jones PJH, Jew S (2007) Functional food development: Concept to reality. Trends Food Sci Technol 18: 387–90.
  25. Siró I, Kápolna E, Kápolna B, Lugasi A (2008) Functional food. Product development, marketing and consumer acceptance–a review. Appetite 51: 456–467. [crossref]
  26. Gaydos B , Anderson KM, Berry D, Burnham N, Chuang-Stein C, et al. (2009) Good practices for adaptive clinical trials in pharmaceutical product development. Drug Info J 43: 539–56.
  27. Quinlan J, Gaydos B, Maca J, Krams M (2010) Barriers and opportunities for implementation of adaptive designs in pharmaceutical product development. Clin Trials 7: 167–173. [crossref]
  28. Li HI, Lai PY (2010) Clinical trial simulation. In: Chow SC. Encyclopedia of Biopharmaceutical Statistics. 3rd ed. New York, NY: Chapman and Hall/CRC Press, Taylor and Francis 282–84.
  29. Burton A, Altman DG, Royston P, Holder RL (2006) The design of simulation studies in medical statistics. Stat Med 25: 4279–4292. [crossref]
  30.  Westfall PH, Tsai K, Ogenstad S, Tomoiaga A, Moseley S, et al. (2008) Clinical trials simulation: a statistical approach. J Biopharm Stat 18: 611–630. [crossref]
  31. Chuang-Stein C, Anderson K, Gallo P, Collins S (2006) Sample size re-estimation: A review and recommendations. Drug Info J 40: 475–84.
  32. Pritchett YL, Menon S, Marchenko O, Antonijevic Z, Miller E, et al. (2015) Sample size re-estimation designs in confirmatory clinical trials – Current state, statistical considerations, and practical guidance. Stat Biopharm Res 7: 309–21.
  33.  Gallo P, Chuang-Stein C (2009) What should be the role of homogeneity testing in adaptive trials? Pharm Stat 8: 1–4. [crossref]
  34. Chow SC, Chang M (2003) Protocol amendment. In: Chow SC, Chang M. Adaptive design methods in clinical trials. 2nd ed. New York, NY: Chapman and Hall/CRC Press, Taylor and Francis, 2011: 23–38.
  35. Brannath W, Koenig F, Bauer P. Improved repeated confidence bounds in trials with a maximal goal. Biom J 45: 311–24.
  36. Posch M, Koenig F, Branson M, Brannath W, Dunger-Baldauf C, et al. (2005) Testing and estimation in flexible group sequential designs with adaptive treatment selection. Stat Med 24: 3697–714.
  37. Gallo P (2006) Operational challenges in adaptive design implementation. Pharm Stat 5: 119–124. [crossref]
  38. Quinlan JA, Krams M (2006) Implementing adaptive designs logistical and operational considerations. Drug Inf J 40: 437–44.
  39. He W, Gallo P, Miller E, Jemiai Y, Maca J, et al. (2017) Addressing challenges and opportunities of “less well-understood” adaptive designs. Ther Innov Regul Sci 51: 60–68.
  40. International Conference on Harmonisation Expert Working Group (1998) ICH harmonized tripartite guideline: statistical principles for clinical trials. Federal Register 63: 49583–98.
  41. European Medicines Agency, Committee for Medicinal Products for Human Use (CHMP (2005). Guideline on Data Monitoring Committees. CHMP/EWP/5872/03. London, UK.
  42. U.S. Department of Health and Human Services, Food and Drug Administration, Center for Biologics Evaluation and Research, Center for Drug Evaluation and Research, Center for Devices and Radiological Health (2006) Guidance for clinical trial sponsors: Establishment and operation of clinical trial data monitoring committees. Rockville, MD: FDA.
  43. Herson J (2016) Data and safety monitoring committees in clinical trials. 2nd ed. Boca Raton, FL: Chapman and Hall/CRC Press, Taylor & Francis.
  44. Bretz F, Koenig F, Brannath W, Glimm E, Posch M (2009) Adaptive designs for confirmatory clinical trials. Stat Med 28: 1181–1217. [crossref]
  45. Menon SM, Zink RC (2015) Modern approaches to clinical trials using SAS®: Classical, adaptive, and Bayesian methods. Cary, NC: SAS Institute.
  46. Chang M (2014) Adaptive design theory and implementation using SAS and R. 2nd ed. Boca Raton, FL: Chapman and Hall/CRC Press, Taylor and Francis.
  47. Tymofyeyev Y (2014) A review of available software and capabilities for adaptive designs. In: He W, Pinheiro J, Kuznetsova OM. Practical considerations for adaptive trial design and implementation. NewYork, NY: Springer 139–55.
  48. Bauer P, Bretz F2,3, Dragalin V4, König F1, et al. (2016) Twenty-five years of confirmatory adaptive designs: opportunities and pitfalls. Stat Med 35: 325–347. [crossref]
  49. Coffey CS, Levin B, Clark C, Timmerman C, Wittes J, et al. (2010) Overview, hurdles, and future work in adaptive designs: Perspectives from a National Institutes of Health-funded workshop. Clin Trials 9: 671–80.
  50. Morgan CC, Huyck S, Jenkins M, Chen L, Bedding A, et al. (2014) Adaptive Design: Results of 2012 survey on perception and use. Ther Innov Regul Sci 48: 473–81.

A Parallel Randomised Controlled Trial of Single Dose Vitamin D3 Versus Daily Supplementation with Pentavite in Infants with Vitamin D Deficiency

DOI: 10.31038/IMROJ.2018332

Abstract

The main aim for the trial involving infants of mothers with Vitamin D Deficiency was to compare two treatment modalities that being, A single dose of Vitamin D3 of 50,000 units vs a daily dose of 400 units for 4 weeks. In addition, the secondary finding was that incidence of true Vitamin D deficiency in the infants born to mothers with Vitamin D deficiency. We were able to demonstrate that a significant percentage of infants born to mothers with Vitamin D deficiency had been treated with Vitamin D during the pregnancy did in fact have more Vitamin D levels in the normal range. As a result, this reduced the number of potential infants that were able to be enrolled in the study. We were able to identify 93 infants with Vitamin D deficiency using the definition of a level Vitamin D to a less than 75 nmol per litre. The mean Vitamin D level at birth in the Pentavite group was slightly higher than the Vitamin D3 group.

Keywords

Vitamin D deficiency; hypocalcaemia; Pentavite; Caucasian and non-Caucasian infants

Introduction

Vitamin D has been progressively linked to a variety of disease conditions in children over the last decade. Its role in bone mineralisation has long been recognised. More recently Vitamin D deficiency has been associated with increased prevalence of allergic reactions [1]. It has also been reported that higher vitamin D intake offers protection against episodes of wheeze in children under 5 Years [2].

In addition, a strong correlation has been reported between Vitamin D deficiency and cardiovascular disease [3]. Furthermore, the risk of developing type 1 diabetes and systemic lupus erythematosis has been linked with low early intake of Vitamin D [4, 5]. The importance of Vitamin D supplementation in preterm infants is well documented. Its role in prevention of hypocalcaemia during rapid bone growth is of primary importance as well as prevention of reduced bone mineralisation with potential for rickets. It is reported that sun exposure of the body up to 15 minutes in lightly pigmented adults may generate up to 20,000 units of Vitamin D3 over 24 hours whereas those with darker pigmentation may require 5 – 10 times the exposure for a similar result [6, 7].

Sun avoidance for infants may compromise Vitamin D levels. In addition, breast milk has very low levels of Vitamin D. The place of Vitamin D supplementation in term infants is less clear. The issue has risen in prominence with recognition of the significant percentage of pregnant women who have been found to be Vitamin D deficient [8]. In a Cochrane review [9] in 2002 it was noted that data regarding ideal Vitamin D requirements in pregnancy are limited. In addition, women with darker skin would likely need additional Vitamin D supplements.

An association between umbilical cord 25 -OH-D levels and head circumference at 3 and 5 months postnatal age has also been reported [10]. Another study reported increased bone mineralisation in children at 9 years where higher maternal Vitamin D levels were recorded during pregnancy [11]. Infants of African- American mothers who are breast fed only without formula supplements are at greater risk of Vitamin D deficiency for reasons previously stated [12].

In their article Jain et al., [13] report Vitamin D deficiency and insufficiency in healthy term breast fed 3-month-old infants and their mothers. There is however lack of consensus on a definition of true Vitamin D insufficiency. They recommend maternal supplements, increased sun exposure for the mother and possibly routine supplementation for infants.

Wagner et al., [14] report significant and prolonged increases in Vitamin D levels through to 7 months in infants given an oral Vitamin D3 supplement.

It has become an accepted practice among many paediatricians to give a single dose of 50,000 units of Vitamin D 3 to infants of Vitamin D deficient mothers. The evidence for this practice is not well established. In addition, there is the possibility that a large dose of Vitamin D3 given to an infant who has an already high Vitamin D level could lead to acute Vitamin D intoxication.

This study aimed to;

  1. determine the incidence of Vitamin D deficiency in babies born to mother with low Vitamin D levels detected in pregnancy who were on supplemental Vitamin D, and,
  2. compare mean serum Vitamin D levels at 6 weeks after a single dose Vitamin D3 50,000 units with those of oral Pentavite (400 u Vit D) given daily for 6 weeks.

Methods

We performed a randomised controlled trial in newborn infants of Vitamin D deficient mothers to compare a single 50,000 unit dose of Vitamin D3 (Single dose group) with daily Pentavite (daily dose group). Infants were enrolled from August 2012 to October 2014.

Women who had been identified at about 12 weeks gestation with vitamin D levels < 75 nmol/L were selected. All were prescribed vitamin D supplements. At the birth of their infant (>36 weeks) informed consent was obtained to determine the infant’s vitamin D levels using either cord blood or the Newborn Screening Test.

Infants with levels in the normal range were noted and infants with levels less than 75 mmol/s were randomised by sealed envelopes to receive either the single dose group or the daily dose group. Repeat Vitamin D levels were then obtained from each group at 6 weeks.

Demographic and clinical data were collected on maternal age, sex of neonate, ethnic background, evidence of vomiting of bolus vit D, questioning for compliance with daily vit D supplementation, use of vitamin D supplementation by single bolus group.

Sample size and statistical analysis

The primary outcome measures were the proportion in each group attaining normal vitamin D levels (>75 nMol/L) at 6 weeks and the mean change per group in vitamin D level between day 3 and 6 weeks. It was estimated that 40 infants per group would have 80% power at the 5% significance level to show a difference of at least 20% between the two groups in the proportion achieving normal Vitamin D levels at 6 weeks.

We performed an intention to treat analysis. Mean changes in vitamin D levels between groups were compared using t-tests and logistic regression was used to determine associations between successful outcome (Vitamin D reaching normal levels) and clinic-demographic variables.

Results

The flow diagram for study recruitment is shown in Figure 1. A total of 267 Vitamin D deficient mothers were treated during their pregnancy. Table 1 shows the ethnicity and Vitamin D status at birth of the infants of these mothers. There was no significant difference in the proportion of Caucasian and non-Caucasian infants with Vitamin D ≤75 nmol/L at birth (p=0.37).

IMROJ2018-126-SimonA.CostelloAustralia_F1

Figure 1. Flow Diagram for Vitamin D trial.

Table 1a. Ethnicity of infants of Vitamin D deficient mothers (n = 267).

Caucasian

Non-Caucasian

Total

Vitamin D >75 nmol/Ll

126 (65.1%)

48 (69.6%)

174

Vitamin D ≤ 75 nmol/L

54 (36.4%)

39 (30.4%)

93 (34.8%)

Total

180

87

267

Table 1b. Baseline characteristics of each group.

Characteristic

Single dose Vitamin D3 group (n=49)

Pentavite group
(n=44)

Male / Female

24/25

21/23

Caucasian/Non-Caucasian

26/23

28/16

Mean (SD) vitamin D level (nmol/L )

50.40 (13.33)

57.41 (11.88)

SD: Standard Deviation

The overall incidence of Vitamin D deficiency in the two treatment groups of non-Caucasian background was 39 out of 87 i.e, 44.8%. In the Caucasian population the incidence was 54 out of 180 i.e, 30%. The 93 infants with low Vitamin D levels were randomised to treatment groups – 49 to the single dose group and 44 to the daily dose group. The baseline characteristics of the two groups is shown in Table 1. The mean vitamin D level at birth was higher in the Pentavite group (Figure 2).

IMROJ2018-126-SimonA.CostelloAustralia_F2

Figure 2. Vitamin D levels at birth by group.

Seven infants in the single dose group and 5 in the daily dose group did not attend for the 6 weeks review and were lost to follow-up. At 6 weeks 72 of the 81 infants (88.9%) had achieved normal vitamin D levels (Table 2). The single dose Vitamin D3 group were more likely to have achieve normal levels that the Pentavite group (97.6% single dose group vs 79.5% Pentavite group) (OR 10.58; 95% confidence interval (CI) 1.26, 89.08) (Figure 3). The single dose group also showed a greater mean change from birth to 6 weeks (Figure 4).

IMROJ2018-126-SimonA.CostelloAustralia_F3

Figure 3. Change in Vit D levels birth to 6 weeks.

IMROJ2018-126-SimonA.CostelloAustralia_F4

Figure 4. Mean Vit D levels ± SD.

Table 2. Results by group.

Six weeks outcomes

Single dose Vitamin D3 group (n =42)

Pentavite group
(n=39)

Percent achieving normal levels

97.6

79.5

Mean (SD) level at 6 weeks (nmol/L)

110.10 (21.44)

93.79 (21.33)

Mean (SD) change from birth (nmol/L)

59.69(23.94)

36.38 (17.62)

SD: Standard Deviation

All infants given a bolus dose tolerated it; no vomiting was reported. Supplemental Vit D administration was not reported by mothers at the 6-week review.

Conclusion

In conclusion we recommend the following management for women identified as Vitamin D deficient during pregnancy;

  1. Vitamin D supplementation during pregnancy.
  2. Obtain a Vitamin D level on the infant soon after delivery.
  3. Give 50,000 of Vitamin D3 orally as a single dose which will ensure adequate Vitamin D levels are achieved through to at least 6 weeks of age.

Acknowledgement: Ethics approval for this study was obtained from the Cabrini Human Research Ethics Committee.

References

  1. Litonjua AA, Weiss ST (2007) Is vitamin D deficiency to blame for the asthma epidemic? J Allergy Clin Immunol 120: 1031–1035. [Crossref]
  2. Camargo CA Jr, Rifas-Shiman SL, Litonjua AA, Rich-Edwards JW, Weiss ST, et al. (2007) Material intake of vitamin D during pregnancy and risk of recurrent wheeze in children at 3 years of age. Am J Clin Nutr 13(3): 788–795. [Crossref]
  3. Kendrick J, Targher G, Smits G, Chonchol M (2009) 25-Hydroxyvitamin D deficiency is independently associated with cardiovascular disease in the Third National Health and Nutrition Examination Survey. Atherosclerosis. 205: 255–260. [Crossref]
  4. Hyppönen E, Läärä E, Reunanen A, Järvelin MR, Virtanen SM (2001) Intake of vitamin D and risk of type 1 diabetes: a birth-cohort study. Lancet 358: 1500–1503. [Crossref]
  5. Kamen DL, Cooper GS, Bouali H, Shaftman SR, Hollis BW, et al. (2006) Vitamin D deficiency in systemic lupus erythematosus. Autoimmun Rev 5: 114–117. [Crossref]
  6. Matsuoka LY, Wortsman J, Haddad JG, Kolm P, Hollis BW (1991) Racial pigmentation and the cutaneous synthesis of vitamin D. Arch Dermatol 127: 536–538. [Crossref]
  7. Matsuoka LY, Wortsman J, Hollis BW (1990) Suntanning and cutaneous synthesis of vitamin D3. J Lab Clin Med 116: 87–90. [Crossref]
  8. Bischoff-Ferrari HA1 (2011) Vitamin D: role in pregnancy and early childhood. Ann Nutr Metab 59: 17–21. [Crossref]
  9. Mohamed K, Gulmezoglu AM (2002) Vitamin D supplementation in pregnancy. The Cochrane Library. Oxford, United Kingdom. Update software.
  10. Brooke OG, Butters F, Wood C (1981) Intrauterine vitamin D nutrition and postnatal growth in Asian infants. Br Med J (Clin Res Ed) 283: 1024. [Crossref]
  11. Javaid MK, Crozier SR, Harvey NC, Gale CR, Dennison EM, et al. (2006) Maternal vitamin D status during pregnancy and childhood bone mass at age 9 years: a longitudinal study. Lancet 367: 36–43. [Crossref]
  12. Kreiter SR, Schwartz RP, Kirkman HN Jr, Charlton PA, Calikoglu AS, et al. (2000) Nutritional rickets in African American breast-fed infants. J Pediatr 137: 153–157. [Crossref]
  13. Jain V, Gupta N, Kalaivani M, Jain A, Sinha A, et al. (2011) Vitamin D deficiency in healthy breastfed term infants at 3 months & their mothers in India: seasonal variation & determinants. Indian J Med Res 133: 267–273. [Crossref]
  14. Wagner CL, Howard C, Hulsey TC, Lawrence RA, Taylor SN, et al. (2010) Circulating 25-hydroxyvitamin d levels in fully breastfed infants on oral vitamin d supplementation. Int J Endocrinol 2010: 235035. [Crossref]

Hypopituitarism after treatment of haemophagocytic syndrome associated with Epstein-Barr virus -positive aggressive natural killer cell leukemia

DOI: 10.31038/IMROJ.2018331

Abstract

INTRODUCTION: Haemophagocytic syndrome is a life-threatening clinical syndrome, which can lead to tissue damage and progressive systemic organ failure. But there was no report on hypopituitarism induced by haemophagocytic syndrome.

PURPOSE: Here we reported one case of hypopituitarism after treatment of haemophagocytic syndrome associated with Epstein-Barr virus -positive aggressive natural killer cell leukemia. After haemophagocytic syndrome control, the patient felt too weak, tired and dizzy to sit up, he also had symptom of depression, loss of appetite, polyuria and hypotension. Lab tests found Low hormone levels, including thyroid stimulating hormone, free tri-iodothyronine, free thyroxine, testosterone. adrenocorticotropic hormone stimulation test showed was abnormal. So, the patient was diagnosed as hypopituitarism.

DISCUSSION: HLH is a life-threatening clinical syndrome, and the illness is so serious that physicians focus all their attention on disease treatment, ignoring the hypopituitarism. We reviewed pathologic mechanisms of haemophagocytic syndrome associated with Epstein-Barr virus -positive aggressive natural killer cell leukemia inducing hypopituitarism. The cytokine storm might play an important role in pathologic process of hypopituitarism induced by haemophagocytic syndrome. This is first report on hypopituitarism after treatment of haemophagocytic syndrome associated with Epstein-Barr virus -positive aggressive natural killer cell leukemia.

Key words

hypopituitarism, haemophagocytic syndrome, cytokine storm

Introduction

Hypopituitarism is defined as insufficiency of one or more pituitary hormones owing to a lesion in the hypothalamic–pituitary region. This disease is an uncommon disease with a prevalence of ~46 per 1 00 000 [1]. The pituitary gland has two lobes. Six hormones are produced within the anterior lobe: growth hormone, adrenocorticotropic hormone (ACTH), the gonadotropins follicle stimulating hormone (FSH), luteinising hormone, thyroid stimulating hormone (TSH), and prolactin. The posterior pituitary lobe contains two hormones, oxytocin and antidiuretic hormone (ADH).

The most common cause of hypopituitarism was related to a sellar mass, which is nonfunctioning pituitary macroadenoma. Hypopituitarism might occur because of pituitary surgery and/or pituitary radiotherapy. Other less prevalent causes of hypopituitarism included radiation and traumatic brain injury. Rarely, vascular diseases also could induce hypopituitarism, such as pituitary apoplexy, Sheehan’s syndrome, subarachnoid hemorrhage and aneurysm. More rarely, inflammatory processes such as lymphocytic hypophysitis have been associated with hypopituitarism.

Haemophagocytic syndrome (hemophagocytic lymphohistiocytosis, HLH) is a life-threatening clinical syndrome that is characterized by fever, organomegaly, and pancytopenia [2]. Primary HLH may result from genetic defects. Secondary HLH may be acquired with infectious, neoplastic, autoinflammatory, autoimmune, and immunodeficiency etiologies. Here we reported one case of secondary HLH associated with Epstein-Barr virus (EBV)-positive aggressive natural killer cell leukemia(ANKL), the patient developed into hypopituitarism, after secondary HLH associated with EBV-positive ANKL was controlled. This is the first report on hypopituitarism induced by HLH, and we reviewed the cytokine storm might be responsible for pathologic mechanisms of HLH inducing hypopituitarism.

Case Report

A previously healthy 24-year-old man was brought to the hepatology department in our hospital with recurrent fever, yellow sclera for 6 days since July 22, 2017. His social history was negative for high-risk sexual behavior, ethanol and drug abuse. His family history was noncontributory. Physical examination revealed temperature of 39.5°C, nodal tachycardia with normal blood pressure and breaths, splenomegaly without superficial lymph node enlargement. The laboratory data revealed abnormal liver function studies with aspartate aminotransferase(AST) 181.3 units/L (normal: < 40 units/L), alanine aminotransferase (ALT) 233.8 units/L (normal: < 41 units/L), total bilirubin 135.3umol/L(3.4–20 umol/L), normal alkaline phosphatase. The laboratory data also revealed leukopenia [1.95 × 10⁹/L (normal: 3.5–9.5 × 10⁹/L)], neutrophil deficiency [0.48 × 10⁹/L (normal: 1.8–6.3 × 10⁹/L)], thrombocytopenia [97 × 109/L (normal: 100–300 × 109/L)] with normal level of haemoglobin and normal coagulation function. Erythrocyte sedimentation rate was normal and C-reactive protein levels were increasing [46.9mg/L < normal: < 10) ]. The level of interleukin 6 increased to 93pg/ml(normal: < 7). Doppler ultrasound of his abdomen showed moderate splenomegaly. Computed tomography of his chest showed normality. After admission, she was empirically started on meropenem and vancomycin for febrile neutropenia and treatment of liver protection. Fever was not controlled, and the patient developed into pancytopenia. In August 1, the laboratory data revealed leukopenia (1.74 × 10⁹/L), thrombocytopenia (29 × 109/L), decreased level of haemoglobin(HB) [90g/L (normal: 120–160)] and decreased level of fibrinogen [1.1g/L (normal: 2–4)]. His ferritin level was greater than 50,000 ug/L < normal: 30–400), and interleukin 6 level was more than 597pg/ml. Blood cultures were negative. An initial autoimmune workup revealed normality. Viral workup, by IgM antibody and viral titers, was negative for human immunodeficiency virus, hepatitis A, B, and C, herpes simplex virus, herpes zoster, parvovirus, cytomegalovirus, hantavirus, puumala virus, and adenovirus. Epstein-Barr virus (EBV)-DNA copy number is increasing, EBV-DNA in peripheral blood mononuclear cell (PBMC) is 2.77 × 10⁵/L (normal: 500/L), EBV-DNA in blood plasma is 8.46 × 10³/L(normal: 500/L). The patient was diagnosed HLH and was transferred to hematology department. Than he received bone marrow puncture, bone marrow aspiration revealed there were 6% prolymphocyte like cells. Flow cytometric analysis of bone marrow revealed that 7.4% nucleated cells were abnormal immunophenotyp natural killer (NK) cells (CD45bri+, CD56bri+, Ki67+, CD16-, CD57-, cCD3-, CD158b-, CD158ah-, TCRrd-, TCRab-) (Figure 1). Perforin and CD107a tests showed normality. Finally, he was diagnosed aggressive ANKL [3] and secondary HLH according to HLH diagnostic criteria [5], then he immediately received the treatment according to according to HLH-2004 treatment protocol [4] in August 2, but this patient did not receive treatment of ciclosporin because of abnormality of liver function. This patient received treatment of plasmapheresis and ruxolitinib(Jakafi) (5mg bid). After 13 days of treatment the patient had no fever, his total bilirubin dropped to 58 umol/L and level of fibrinogen restored to normality. But the patient felt too weak, tired and dizzy to sit up. Symptoms also included depression and loss of appetite. His blood pressure is as low as 80/40mmHg, and he peed more than 4000ml a day. These do not arouse the attention of physicians. Symptoms was simply explained as disease itself, the low blood pressure was simply explained as postural hypotension, the cause of urorrhagia was simply explained as no fever. Then the patient received chemotherapy of GemOx protocol (Gemcitabine 1000mg/m2 d1 d15, oxaliplatin 100mg/m2 d1 d15). After 30 days of treatment his ferritin level dropped to 2762 ug/L, both of EBV-DNA copy number in PBMC and blood plasma were negative. The level of interleukin 6 decreased to 56pg/ml (normal: < 7). Flow cytometry did not detect aggressive NK cell. His symptoms are not improving, so he was suspected of having hypopituitarism and pituitary hormone levels were tested. Hypopituitarism was confirmed on a subsequent testing of pituitary hormone levels (Table 1). ACTH stimulation test showed was abnormal, with a sub optimal response to 0.25mg ACTH with a level of 245 ug/L after 30 min and 366 ug/L after 60 min (a low baseline cortisol concentration of 24.01 ug/L). A pituitary magnetic resonance imaging (MRI) enhancement scanning was then performed, there was no manifestation of tumor infiltration. The patient received euthyrox, midodrine and prednisone.

JCRM2018-104-WeiHuangChina_F1

Figure 1. Phenotypic abnormalities of NK cells detected by a multicolor flow cytometric

Table 1. Pituitary and other hormone levels

Serum

Level

Range

Units

thyroid stimulating hormone

0.053

0.35–4.94

uIU/ml

free tri-iodothyronine

1.32

1.71–3.71

pg/ml

free thyroxine

0.62

0.7–1.48

ng/dl

testosterone

0.36

1.75–7.8

ng/ml

prolactin

12.05

2.64–13.13

ng/ml

adrenocorticotrophic hormone

1.93

1.6–13.9

pmol/L

cortisol

21.92

60.2–184

ug/L

Discussion

There was no report on hypopituitarism caused by HLH, there was no report on hypopituitarism caused by EBV, and there was no report on hypopituitarism caused by ANKL. The patient was healthy before he was sick. HLH associated with EBV-positive ANKL was inferred causing hypopituitarism. How to understand hypopituitarism after treatment of HLH associated with EBV-positive ANKL? From the pathophysiological process of HLH we can explain why he had hypopituitarism.

Haemophagocytic syndrome is a life-threatening disease with immune regulatory disorder. The underlying common mechanism is a defect in granule mediated cytotoxicity, which is important in killing cells [6]. The perforin plays an important role in the homoeostasis of dendritic cells and restrict T-cell activation by antigen presentation [7]. Perforin and CD107a tests are more sensitive and no less specific compared with NK cytotoxicity testing for screening for genetic HLH, and perforin and CD107a tests should be considered for addition to current genetic HLH criteria [8]. This patient had normal level of perforin and CD107a, which suggested that he was secondary HLH, not primary HLH. The uncontrolled activation of dendritic cells and restrict T-cell produces an exaggerated inflammatory response, which is called cytokine storm. The cytokine storm is characterized by hypersecretion of proinflammatory cytokines such as interferon γ, tumor necrosis factor α (TNFα), interleukin-1, interleukin-4, interleukin-6, interleukin-8, interleukin -10, and interleukin-18 [9]. This cytokine storm could pathogenically have a bearing on the development of the main clinical and laboratory features of HLH [10], leads to tissue damage and progressive systemic organ failure, which can be partly prevented by antibody of cytokines, such as interleukin 6, interleukin 18 [11,12]. In this case, the high level of interleukin 6 showed the cytokine storm.

In rare cases, inflammatory processes have been associated with hypopituitarism, although the common cause of hypopituitarism is pituitary adenoma, treatment with pituitary surgery or radiotherapy cancer, trauma and vascular injury. Autoimmune hypophysitis (AH) is a chronic inflammatory disease, which is characterized by infiltration of T and B lymphocytes in the pituitary gland. A growing number of reports of hypophysitis was accompanied by anti-cancer immunotherapy, such as programmed cell death protein 1 (PD-1) inhibitors and cytotoxic T-lymphocyte antigen 4 (CTLA-4) inhibitors [13]. In the mouse model of AH there was increased levels of interferon-γ and interleukin-17, which may participate in pathogenic mechanism of AH [14]. There were reports about hypopituitarism during the treatment of hepatitis C virus infection with IFN-alpha [15,16]. So, we have reason to believe that cytokine storms may be involved in the pathologic process of hypophysitis.

Although there was no report on hypopituitarism caused by HLH, CNS involvement is a frequent finding at HLH onset [17]. In addition, either at presentation or during the course of HLH, CNS disease has been reported in 30–73% of all HLH [18]. This patient had no central symptom, hypopituitarism might be sign of CNS involvement of HLH.

Viral infections are also a rare cause of hypopituitarism. The current reports showed that the viruses causing hypopituitarism included human immunodeficiency virus (HIV) [19–22], hanta virus [23], puumala virus [24], newcastle disease virus [25]. Except CMV virus, other virus test is negative in this case. There was no report on EBV causing hypopituitarism. EBV infection played important role in ANKL and HLH, and ANKL was easy to develop into HLH. So, we thought the immediate cause of hypopituitarism was HLH.

In addition to pituitary adenomas, there were other tumors that could cause hypopituitarism, such as pituitary lymphoma [26, 27]. A pituitary magnetic resonance imaging (MRI) enhancement scanning excluded the pituitary tumor in this case.

In a word, this is first report on hypopituitarism after treatment of haemophagocytic syndrome associated with EBV-positive ANKL. The cytokine storm might play an important role in pathologic process of hypopituitarism.

Competing interests: No competing interests as defined by Molecular Medicine, or other interests that might be perceived to influence the results and discussion reported in this paper.

Funding: This work was supported by grants from the National Natural Science Foundation of China (No. 81770164).

Acknowledgements: We thank the patient and his family for their participation in this study.

References

  1. Higham CE, Johannsson G, Shalet SM (2016) Hypopituitarism. Lancet 388: 2403–2415. [Crossref]
  2. Jordan MB, Allen CE, Weitzman S et al (2011) How I treat hemophagocytic lymphohistiocytosis. Blood 118: 4041–4052. [Crossref]
  3. Li Y, Wei J, Mao X et al (2016) Flow Cytometric Immunophenotyping Is Sensitive for the Early Diagnosis of De Novo Aggressive Natural Killer Cell Leukemia (ANKL): A Multicenter Retrospective Analysis. PLoS One 11: e0158827. [Crossref]
  4. Henter JI, Horne A, Aricó M et al (2007) HLH-2004: diagnostic and theraputic guidelines for haemophagocytic lymphohistiocytosis. Pediatr Blood Cancer 48: 124 – 131. [Crossref]
  5. Ramos-Casals M, Brito-Zerón P, López-Guillermo A et al (2014) Adult haemophagocytic syndrome. Lancet 383: 1503–1516. [Crossref]
  6. Arceci RJ (2008) When T cells and macrophages do not talk: the hemophagocytic syndromes. Curr Opin Hematol 15: 359–367. [Crossref]
  7. Chen M, Felix K, Wang J (2012) Critical role for perforin- and Fas dependent killing of dendritic cells in the control of inflammation. Blood 119: 127–136. [Crossref]
  8. Rubin TS, Zhang K, Gifford C et al (2017) Perforin and CD107a testing is superior to NK cell function testing for screening patients for genetic HLH. Blood 129: 2993–2999. [Crossref]
  9. Sumegi J, Barnes MG, Nestheide SV et al (2011) Gene expression profi ling of peripheral blood mononuclear cells from children with active hemophagocytic lymphohistiocytosis. Blood 117: e151–160. [Crossref]
  10. Canna SW, Behrens EM (2012) Not all hemophagocytes are created equally: appreciating the heterogeneity of the hemophagocytic syndromes. Curr Opin Rheumatol 24: 113–118. [Crossref]
  11. Chen F, Teachey DT, Pequignot E et al (2016) Measuring IL-6 and sIL-6R in serum from patients treated with tocilizumab and/or siltuximab following CAR T cell therapy. J Immunol Methods 434: 1–8. [Crossref]
  12. Chiossone L, Audonnet S, Chetaille B et al (2012) Protection from inflammatory organ damage in a murine model of hemophagocytic lymphohistiocytosis using treatment with IL-18 binding protein. Front Immunol 3: 239. [Crossref]
  13. Sidhu P, Menzies AM, Long G et al (2017) Radiological manifestations of immune-related adverse effects observed in patients with melanoma undergoing immunotherapy. J Med Imaging Radiat Oncol 61: 759–766. [Crossref]
  14. Lin HH, Gutenberg A, Chen TY et al (2017) In Situ Activation of Pituitary-Infiltrating T Lymphocytes in Autoimmune Hypophysitis. Sci Rep 7: 43492. [Crossref]
  15. Ridruejo E, Christensen AF, Mando OG (2006) Central hypothyroidism and hypophysitis during treatment of chronic hepatitis C with pegylated interferon alpha and ribavirin. Eur J Gastroenterol Hepatol 18: 693–694.[Crossref]
  16. Concha LB, Carlson HE, Heimann A et al (2003) Interferon induced hypopituitarism. Am J Med 114: 161–163. [Crossref]
  17. Deiva K, Mahlaoui N, Beaudonnet F et al (2012) CNS involvement at the onset of primary hemophagocytic lymphohistiocytosis. Neurology 78: 1150–1156.[Crossref]
  18. Jovanovic A, Kuzmanovic M, Kravljanac R et al (2014) Central nervous system involvement in hemophagocytic lymphohistiocytosis: a single-center experience. Pediatr Neurol 50: 233–237. [Crossref]
  19. Rochira V, Guaraldi G (2017) Growth hormone deficiency and human immunodeficiency virus. Best Pract Res Clin Endocrinol Metab 31: 91–111. [Crossref]
  20. Diazzi C, Brigante G, Ferrannini G et al (2017) Pituitary growth hormone (GH) secretion is partially rescued in HIV-infected patients with GH deficiency (GHD) compared to hypopituitary patients. Endocrine 55: 885–898. [Crossref]
  21. Kim J, Mooradian AD (2000) Hyperinsulinemic hypoglycemia associated with possible hypopituitarism in a patient with acquired immunodeficiency syndrome. Endocr Pract 6: 453–455. [Crossref]
  22. Nduwayo L, Nsabiyumva F, Osorio Salazar C et al (1992) Endocrinological aspects of acquired immunodeficiency syndrome (AIDS). Med Trop (Mars). 52: 139–143.
  23. Jost C, Krause R, Graninger W et al (2009) Transient hypopituitarism in a patient with nephropathia epidemica. BMJ Case Rep 2009: bcr02.2009.1538.
  24. Forslund T, Saltevo J, Anttinen J et al (1992) Complications of nephropathia epidemica: three cases. J Intern Med 232: 87–90.[Crossref]
  25. Blalock JE, Smith EM (1985) A complete regulatory loop between the immune and neuroendocrine systems. Fed Proc 44: 108–111. [Crossref]
  26. Kozáková D, Macháleková K, Brtko P et al (2008) Primary B-cell pituitary lymphoma of the Burkitt type: case report of the rare clinic entity with typical clinical presentation. Cas Lek Cesk 147: 569–573. [Crossref]
  27. Liu JK, Sayama C, Chin SS et al (2007) Extranodal NK/T-cell lymphoma presenting as a pituitary mass. Case report and review of the literature. Neurosurg. 107: 660–665.