Abstract
The paper presents a new way to understand problems in a rapid, transnational fashion. The approach defines a problem, uses artificial intelligence to select our aspects of the problem which ‘tell a story’, and then uses artificial intelligence to select four answers to each question. These sixteen questions are combined by experimental design into permuted sets of 24 vignettes, each vignette set up for a unique experimental design with the desired mathematical properties, valid at the level of a single individual.. Within an hour, the same study was run in 14 countries, 20 respondents per country. The analysis shows how OLS (ordinary least squares regression)creates ‘grand models’ showing how the different answers (elements) drive two types of responses (emotional, rational, respectively), and how other information about the respondents (country, gender, age) can be used to augment the knowledge by revealing the part-worth contribution of each of the 14 countries, two genders, and five age groups. The approach also lends itself to uncovering mind-sets in the population. As a demonstration, the approach was run in one evening with 280 respondents analyzed in a few hours, showing the potential for creating early-stage knowledge-driven databases to explore any topic of human decision making.
Keywords
Schizophrenia; Typical antipsychotic drug; Atypical antipsychotic drug; Extrapyramidal symptoms; Tardive Dyskinesia; Medication induced movement disorder
Introduction
A cursory look of any newspaper, any news channel, or of course conversations among friends will quickly reveal the focus of people on the problems of the world. Not only do one’s personal problems clamor for discussion, but also problems that seem to be insolvable. These ever-present problems become the grist for conversations, most of which do not lead anywhere. We might say about world problems the same thing that Mark Twain said about the weather, namely ‘everyone talks about it, but no one does anything about it.’
Of course, whereas we realize the futility of talking about problems that we cannot solve, billions of dollars are spent by countries, by international bodies such as the United Nations, and by many hundreds, if not thousands, of NGO’s (non-governmental organizations). These organizations study the problem, often seemingly doing so ad infinitum, make recommendations, and occasionally actually implement their recommendations.
What is missing in much of these efforts is a rapid way of getting suggestions about solving the problems, doing so inexpensively, rapidly, with some sense of the response of real people to the policies and actions recommended. By the foregoing we mean simply that the standard long methods may be the traditional way to deal with these problems, but today’s methods to understand people’s points of views, really their minds, and to measure their responses to alternative ideas, potential solutions, has developed into a technology that asks for use dealing with world problems.
Part of the problem may be traced back to the world of academics, and specifically to the world of science as the scientist deals with issues of human behavior and human opinion. The academic world has evolved to look for the hallmarks of solid, possibly irrefutable evidence, such evidence emerging from ‘tight’ research protocols, hypothesis statement at the start of the study, and powerful statistics to ensure that the research either confirms the ingoing hypothesis, or falsifies it [1]. There is room for observational research, and even the use of statistics to substantiate the findings, but there observational research is often considered ‘less scientific,’ more a matter of educated observation than real science.
In the middle of this divided world, strong science on the one side guided experiments, and observations research on th other, enters the emerging science of Mind Genomics. The objective of this emerging science is to use simple, but powerful experiments to understand how people make decisions. Mind Genomics itself comprises simply the creation of experimental designs specifying combinations of messages, creation of these combinations by combining phrases (test stimuli), evaluation of these combinations by people, and then the estimation of what each messages does to drive the rating assigned by a person (respondent) to the different combinations.
The original vision of Mind Genomics was to create an easy-to- use research template, one which allow the researcher to quantify the importance of the different messages as drivers of human judgment. Mind Genomics was created from the realization that when it comes to the way people make judgments, it is often counterproductive and simply wrong to present ideas/messages to a person, one at a time, make a measurement (e.g., respondent rating importance). Messages are not experienced one at a time, out of context. Experiences comprise combinations of features. It is better to imitate experience through combinations which are ‘somewhat more real’ than to force people to judge one idea at a time.
Mind Genomics and Its Augmentation by Artificial Intelligence
Mind Genomics is an emerging science with origins in psychology, statistics, and consumer research. The objective of Mind Genomics is to quantify how people make decisions about the world of the everyday.
We are accustomed to human interest stories about decision making, especially when there is a surprise factor, such as the fact that we tend to believe what agrees with our prejudices (so-called confirmation bias), and that we can get a good idea of the number pieces of candy in a big bowl by averaging the guesses of many hundreds of thousands of people (so-called wisdom of the crowd). These are interesting stories, sometimes surprising, sometimes not, but they are not particularly useful for decision making just being stories. The stories are interesting, but more important are methods to arrive at how people think about topics.
Mind Genomics approaches the topic of thinking about an issue using simple methods, specifically showing a person a combination of features, getting a rating of that combination, doing the same ‘operation’ many times with different combinations, and finally estimating the contribution of each item in the combination, each particular message. Mind Genomics works by creating specific combinations of features, rather than combining them at random. The features are combined by what statisticians call an ‘experimental design’. The design specifies the different combinations. By creating specific combinations viz., those prescribed by the experimental design, I becomes possible to estimate the number of ratings points contributed by each message or element.
The third contribution, consumer research, tells us how to run the study, how to present the information to the respondent, how to make the topic seem like a survey, and how to look at the answers from the point of view of a person’s everyday mind. Consumer research moves beyond traditional psychology, the science, and towards the specifics of psychology in the life of the everyday
The actual process of Mind Genomics has been explicated in various papers, some going back almost 20 years [2,3]. The approach is not new. What has evolved has been the recognition of practical issues, such as the need to have simple, short experiments, with quick set up, quick execution, rapid and automatic statistical analysis, and ‘next steps to make the results come alive after the research has been done and reported. The rationale for speed and low cost emerges from the history of applications by author Moskowitz over the past twenty five years. It has become obvious during the evolution of Mind Genomics that it is difficult to develop ideas (viz., thinking), that the world of research has become overly accepting of ‘slow and steady but absolutely correct’, and that more often than not the design of a study takes so long for technical and personal reasons that the real miracle is that the study is executed at all. Quite often the process implodes because it’s difficult to think of the test stimuli, reach consensus, and then agree upon the test specifics. The notion of DIY, do-it-yourself research is now becoming increasing well accepted, but as far back as 22 years ago the notion of a DIY version of Mind Genomics was already presented to the public, and evidence of implementation presented at that time [4].
Mind Genomics emerged from the world of application, from the world of realistic timelines, and from a world where those who needed the technology really make good use of it, rather than those who were simply interested in a technology to burnish one’s resume. It is in this spirit that the current study was run, a spirit of exploring ideas, not the spirit of ‘filling a hole’ in the literature [5] but rather to explore new limits on what could be done.
The process of Mind Genomics is straightforward, following these steps.
- Select a topic. The topic should involve human decision making at some level, because the Mind Genomics project will focus on the different aspects of the way people make decisions.
- For the topic select four The questions should tell a ‘story’. It is at this step that research often breaks down, simply because in today’s world education and scientific research fail to teach people about how to ask questions which tell a story. The increasingly narrow focus on specifics, viz. intellectual reductionism, which manifests itself as researchers become more focused, more sophisticated, narrows the scope of the topic until the researcher cannot really ‘feel’ the bigger picture as a motivation for the study. People do understand the bigger picture, but often have a difficult time filling out the picture.
For those new to a topic, the Mind Genomic program (www. BimiLeap.com) incorporates an AI component called Idea Coach. The researcher who wants coaching and AI to set up the four questions writes a small paragraph about the topic and what is being sought, doing so in a specific screen on the program. The AI then returns with up to 30 questions. It is best to involve Idea Coach several times, and then select the four questions which best tell the story in questions. Idea Coach need not remain shackled with one description. The researcher can invoke Idea Coach several times with the same basic description, obtaining different questions, and can also change the description.
For each question, the researcher is instructed to provide four answers to each question. Typically the task of providing answers to questions ends up being a great deal easier than generating the questions in the first place. This difference may well be due to the way people are educated. Students are taught to answer questions, the questions being provided by a second party. For those individuals who wish to avail themselves of the built in access to AI, one can request Idea Coach to provide sets of up to 15 answers to each question. Again, one can interrogate the AI several times to get a sense of the different possible answers.
The researcher now writes a short introduction to the topic, so that the respondent will understand what is being presented. This orientation will appear on each page, introducing the test stimulus. As shown below, the introduction is deliberately made to be short, conveying little information. The rationale for the short, incomplete introduction is the desire to have the specific test phrases generate the primary communication. The orientation can be thought of as a way of creating coherence among the test stimuli.
The research has the option to ask up to eight questions, each question offering up to eight answers, with the respondent instructed to select the ‘appropriate’ one answer for each question. These classification questions allow the respondent to define the respondent in terms of WHO the respondent is, what the respondent THINKS about a topic, and what the respondent DOES. These eight questions, along with standard questions of gender and age enable the researcher to understand the respondent in terms of standard types of questions.
Underlying the Mind Genomics program is a built-in experimental design, specifically created to allow different numbers of independent variables. The underlying experimental designs, developed and patented by author HRM are set up so that they can be permuted [6], viz., different ‘daughter designs’ be created, each having the same underlying mathematical structure. These daughter designs are structurally identical, having a specific number of independent variables (the questions), an equal number of levels (the answers), all of the answers being present an equal number of times. The design for the study presented here comprises four questions, four answers for each question, and 24 combinations. The combinations are called vignettes. Each vignette comprises 2-4 answers, at most one answer from a question. The design ends up with each answer (aka ‘element’) appearing five times in 24 vignettes, absent 19 times. Each question thus contributes to 20 vignettes, and does not contribute to four vignettes. The result is that the vignettes are incomplete, allowing for the use of OLS (ordinary least squares) regression [7], and the estimation of the absolute values of the coefficients.
One of the key issues is research is the desire to minimize random variability in the experiment, and by doing so let the actual ‘signal’ come through, instead of the signal being lost in the ‘noise’. Typically, this is done by having many measurements of the same stimuli, viz., many people evaluating the same set of vignettes. That strategy is called replication to reduce variation, and comes from the world of statistics. Mind Genomics works in a different manner, more in the spirit of the MRI (magnetic resonance imaging). The aforementioned experimental design, comprising 24 vignettes, is set up to allow the analysis of the data from one respondent. The desire now is to strengthen the signal. Another way to strengthen signal is to take different pictures, in the way that the MRI does. Mind Genomics allows for those different pictures, by the strategy of permuting the experimental design, without changing the mathematical properties. Permutation means simply moving around the labelling of answers. In the original design an answer could have been called A1. The underlying experimental design combines these answer as described above, to create a set of 24 combinations. Permutation allows the creation of an entirely different set of vignettes, albeit with the same mathematical properties. These desirable properties are that the 16 elements (answers) are statistically independent of each other, and that the data from each respondent can be analyzed separately by OLS regression. As we will see below, these properties provide a unique opportunity to increase the power of the data to reveal patterns with relatively few respondents.
- The researcher creates a set of rating questions on a Likert scale. The scale is anchored at both ends to evaluate feeling on an ‘aspect’ felt by the respondent upon reading the test stimulus (e.g., 5 = agree 1 = disagree; 5 = will be successful vs. 1 = will not be successful). It is in the structure of the rating scale that allows the respondent to communicate one’s feeling about the test stimuli. In recent studies, author HRM has used a number of two dimensional scales, allowing the researcher to explore the topic more deeply. The two dimensional scale is structured as follows:
- The researcher specifies the nature of the respondent (called panel composition), and selects the number of respondents to participate.
- The researcher launches the By launching is meant that the BimiLeap program either returns with a link to be sent directly to respects (called self-sourcing), works with a preferred supplier directly through a credit card, or sends the link to a specialist to recruit specific types of respondents who would otherwise be very difficult to recruit (e.g., physicians for medical studies).
- The respondents receive email invitations, containing a short note and the link to the The respondents participate in the study, which typically lasts 3-4 minutes on the computer. The study can be done with a smartphone, a tablet, or a personal computer. The respondent needs only to have an internet connection.
- The BimiLeap program analyzes the data, producing a report, which includes as its main aspect the parameters of model or equations relating the presence/absence of the elements as it affects the specific dependent
- Prasad V, Jena AB (2013) Prespecified falsification end points: can they validate true observational associations? JAMA 309: 241-242. [crossref]
- Moskowitz HR, Gofman A (2007) Selling Blue Elephants: How to Make Great Products That People Want Before They Even Know They Want Pearson Education.
- Moskowitz HR, Gofman A, Beckley J, Ashman H (2006) Founding a new science: Mind Journal of Sensory Studies 21: 266-307.
- Moskowitz HR, Gofman A, Itty B, Katz R, Manchaiah M, et al. (2001) Rapid, inexpensive, actionable concept generation and optimization: the use and promise of self-authoring conjoint analysis for the food service Food Service Technology 1: 149-167.
- Gallouj F, Zanfei A (2013) Innovation in public services: Filling a gap in the Structural Change and Economic Dynamics 27: 89-97.
- Gofman A, Moskowitz H (2010) Isomorphic permuted experimental designs and their application in conjoint Journal of Sensory Studies 25: 127-145.
- Huang FL (2018) Multilevel modeling and ordinary least squares regression: how comparable are they? The Journal of Experimental Education 86: 265-281.
- Alarabeed W (2021) Youth in post-conflict reconstruction: The case of the Gaza Strip. In Youth Civic Engagement and Local Peacebuilding in the Middle East and North Africa 97-108.
- Al-Najar H, Khalil H, Rahayu YS (2019) High unemployment records of graduated students in the development of urban agriculture in the Gaza Strip. Indonesian Journal of Science and Technology 4: 196-203.
- Fares F, Taha DS, Sayad ZTE (2018) Achieving public participation in inaccessible areas using virtual reality a case study of Beit Hanoun–Gaza–Palestine. Alexandria Engineering Journal 57: 1821-1828.
- Roy S (1994) Separation or integration: closure and the economic future of the Gaza Strip Middle East Journal 48: 11-30.
- Shehab A, Alnajar TM, Hamdia MH (2020) A study of the effectiveness of E-learning in Gaza Strip during COVID-19 pandemic: The Islamic University of Gaza “case study”. In Proceedings of the 3rd Scientia Academia International Conference (SAICon-2020), Kuala Lumpur, Malaysia 26-27.
- Likas A, Vlassis N, Verbeek JJ (2003) The global k-means clustering Pattern Recognition 36: 451-461.
- Moskowitz HR, Bernstein R (2000) Variability in hedonics: Indications of world- wide sensory and cognitive preference Journal of Sensory Studies 15: 263-284.
i) 5 = Yes for Aspect 1 AND Yes for Aspect 2
ii) 4 = Yes for Aspect 1 BUT No for Aspect 2
iii) 3 = Cannot answer or No opinion
iv) 2 = No for Aspect 1 BUT Yes for Aspect 2
v) 1 = No for Aspect 1 AND No for Aspect 2
A Worked Example – Efforts to Improve the Israel- Palestine Conflict with Efforts in Gaza
The origin of this study emerged from a conversation with experts on the Israel-Palestine situation, and the desperate need to educate Gaza youth in technology. The precise question was ‘what type of benefits from Internet technology would be welcomed by the Palestinian population’. The question grew in its complexity from finding the benefits which would appeal to understanding whether the Palestinian respondents were like-minded in their response. That second soon morphed into the question of what would be the response of other people who would learn about the program in Gaza. Would respondents in other countries feel the same as respondents in Palestine? The literature on education opportunities in Gaza is relatively sparse, and the topic of internet-based education is just emerging [8-12].
The foregoing issue could have been solved by doing small sale studies of the same topic in Palestine, and in other countries, with the inevitable adjustments for the country, the desire to change the language, the respondent qualifications, and so forth. From the discussions emerged the interest in whether a small scale, affordable, easily, and rapidly executable study could be done in several countries in precisely the same way, with the entire set of studies analyzed as one study. What could be learned by creating a template to do cross- national executions of the same study? Could a new approach be developed to understand the world’s response to a specific topic, creating in its wake a usable database? And, most important, could this new approach be scaled to offer an advanced in understanding the minds of people>
The study reported here represents what may well be the first attempt to create the foregoing described database. The word is ‘attempt’ because the effort was done in a way which paralleled what might be done in those cases where funds are hard to acquire, where time to solution (viz., database) is minimal, and where the topic is totally new to the researcher, who must use methods like artificial intelligence to tackle the problem.
Select the Topic
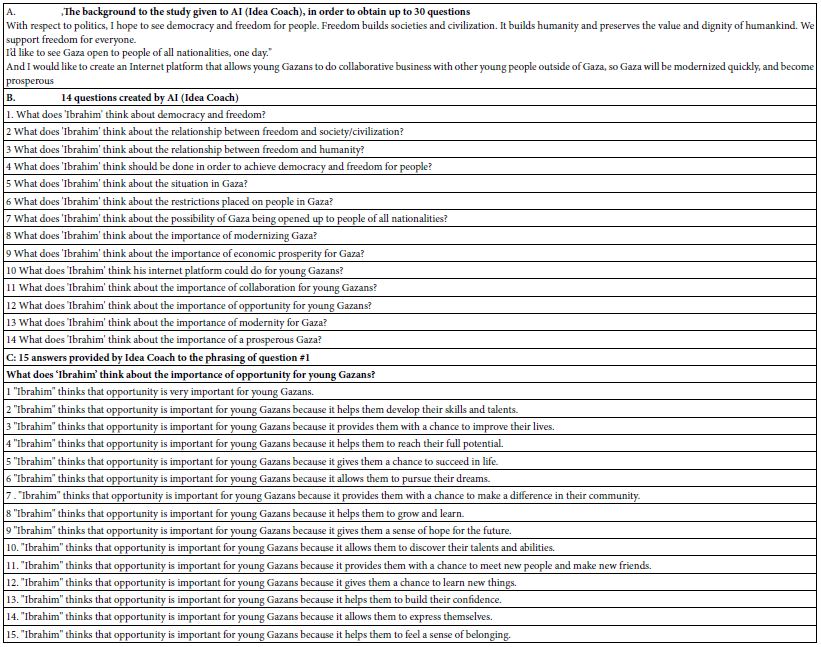
The topic was ‘response to a proposal to help the Gaza economy grow by providing training in computer technology, especially technology linked closely with Internet-based efforts. It was not sufficient to teach the Palestinian youth. The effort had to focus on Internet based efforts. Section A of Table 1 presents the background given to Idea Coach.
Create Four Questions
Section B of Table 1 presents the first iteration to create the four questions. The Idea Coach process was run three times, each time with the same input (Section A). Each of the three iterations produced different numbers of questions, as well as different questions, although some questions repeated.
Table 1: Input to AI and output from AI to create the four questions, and the four answers to each question
Create Four Answers for Each Question
Section C presents 15 answers to question #1, as created by Idea Coach. Idea Coach was run twice for each of the four questions. From the two runs emerged the four good questions.
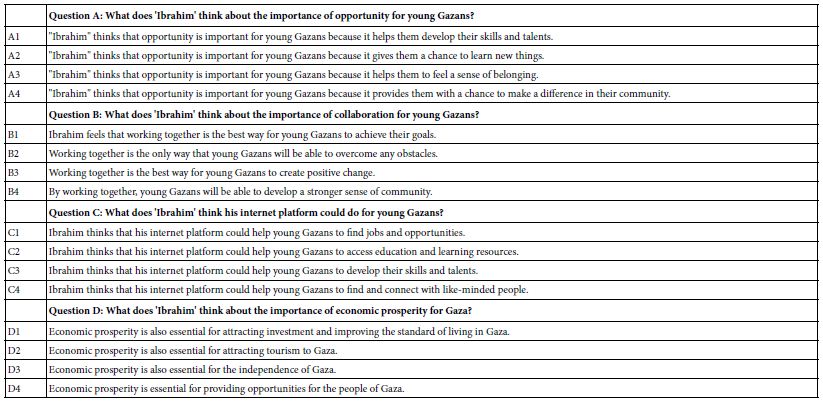
Table 2 presents the four final questions, and the four answers to each question. The questions and answers emerged from the Idea Coach program, but in many cases were slightly edited by the researchers.
Table 2: Finally array of four questions and four answers to each question
Step 4: Create Classification Questions
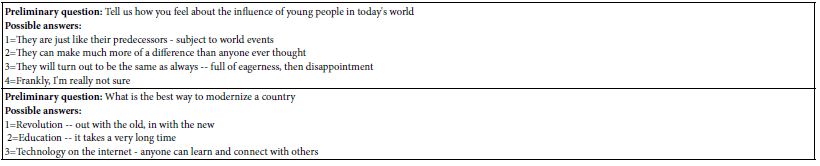
Traditional research often focuses on how people think about topics. Although Mind Genomics is technically an experiment, as will be shown below, there is room in the protocol to ask classificaiton questions in order to learn mor about the respondent. The Mind Genomics interview builds in two ‘self-profiling’ classification questions, on gender, and on age respectively. In addition, however, there is room in the Mind Genomics experiment (described below) to ask an additional eight questions, each question having up to eight answers. The respondent answers these self-profiling classifications at the start of the experiment. Table 3 presents the questions and answers to the questions. Note that these questions will not be used in the analysis for this particular introductory paper, but they can be used to great advantage in studies of this type. The reason is that there would be simply too much information to deal with in the space of a short paper.
Table 3: The two optional self-profiling questions, created by the researcher, in addition to the standard questions of gender and age
Step 5: Create the Orientation Paragraph and the Rating Scale
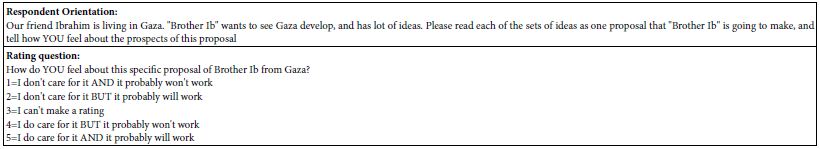
Table 4 (top portion) shows the paragraph, which is deliberately vague. As note before, the orientation paragraph simply sets the context. It is left for the actual elements to convey the specific information. Table 4 (bottom portion) shows the rating scale. The rating scale has two dimensions, collapsed into one scale. The dimensions are ‘care’ and ‘work’.’ The five points show different combinations of caring (an emotional response) and belief that it will work (a cognitive response).
Table 4: The respondent orientation (top) and the five point binary response scale
Step 6: Execute the Study on the Internet
The BimiLeap program provides the researcher with the option of selecting either members from on-line panels world-wide, or providing one’s own respondents. In this case, the researcher opted to have BimiLeap provide respondents, specifically 20 respondents from each of 14 countries. To make the ‘fielding’ of the study possible, the researcher duplicated the study, to create 14 identical studies, all in English, differing only in the name of the study, which was the country.
An on-line panel aggregator, Luc.id, a strategic partner, recruited and invited respondents from each country to participate in the study for that country. The objective was to provide exactly 20 respondents from each country. In some countries, there were a few more than 20 respondents who ended up participating. Once the respondent in a country numbered 20, the remaining respondent data were eliminated.
It is important to note that Step 6 is almost automated, providing a series of identical studies, to be given to different groups in the same general population. In this study the general population is respondents in different countries. It is also important to keep in mind that the respondents in each country will end up being considered part of one big set. Thus, across the 280 respondents, there would be 280 different permutations tested, these being permutations of the same basic design. To summarize, the large study with all 280 respondents can be considered to be one big study, with 14 country subgroups.
As a matter of record, it took less than one hour for each study to complete. Luc.id sends out ‘waves’ of invitations, with a few minutes or more between waves. The study does not close until it has obtained the requisite data from the specified group of 20 respondents, whoever they may be. The field execution could take as short of 10 minutes to acquire all the data. Sometimes, in the case of a shortfall, the Luc.id system waits 30+ minutes and send out a new invitation.
Step 7: Combining the Data into One Large Data Set
For subsequent analyses, the data were combined. Each country contributed 480 rows of data, each row corresponding to a respondent and a vignette. Each row, in turn, comprised the country, the respondent identification number, rating on the self-profiling classification (including age and gender, but also the answers to the two additional self-profiling questions shown in Table 4). The remainder of the row comprises 16 columns, one column for each element, as well as two final columns for the dependent variables, the rating assigned, and the response time. The coding for the 16 element columns was ‘1’ when the element was present in the vignette, and ‘0’ was absent from the vignette. The rating was the 1-5 scale, and the response time was recorded to the first decimal place, tenths of seconds. Step 7 prepares the data for analysis.
Step 8: Transform the Data
Researchers usually feel comfortable with Likert scales, like a 1-5 or 1-9 scale, etc. With respondents the Likert scale if often accompanied by anchor points, so that the respondent ‘knows’ what the scale points mean. In contrast, users of research do not feel as comfortable with these Likert Scales, often asking ‘how do interpret a 3.7?’ or some such question. A common practice over the past century has been and remains to ‘transform’ the rating scale to something which makes the user of the data feel comfortable. This transformation usually becomes something of the order like ‘ratings of 1-3 are transformed to 0 to denote lack of …, whereas ratings of 4-5 are transformed to 100 to denote presence of…’. The exact numerical criteria are left to the researcher. However, the end goal is to divide the scale into two halves, based upon a meaningful criterion, and then assign one end the value ‘0’ to denote ‘lack of ’ and to assign the other end the value ‘100’ to denote presence of.
In this study, there were two transformation. The first was ‘Feel’ with ratings of 5 and 4 transformed to 100, versus ratings of 3,2,1 transformed to 0. The second was ‘Work’ with ratings of 5 and 2 transformed to 100, versus ratings of 4,3,1 transformed to 0. These transformations accord with the language of the scale, picking up the two sides of the scale (feel, work).
Step 9: Create an Equation for the Total Panel, Based Only on the Ratings
The step uses the standard statistical method of OLS (ordinary least-squares regression). The equation relates the presence/absence of the 16 elements to the binary transformed variable. The equation is written as:
![]()
DV is the dependent variable. The dependent variable, DV, may be R54, the transformed rating which takes on the value 100 when the rating is 5 or 4. Or the dependent variable may be R52, which takes on the value 100 when the rating is 5 or 2.
K0 is the additive constant, an estimate of value of DV when all of the elements (A1-D4) take on the value ‘0’, viz, when all of the elements are absent from the vignette. Thus the additive constant can be considered a baseline. For instance the additive constant is the likelihood that the respondent will select the rating 5 or 4 (for DV = R54), in the absence of elements. The reality is that the underlying experimental design ensures that all vignettes comprise 2-4 elements. Thus, the additive constant can be considered to be a baseline.
The coefficients k1-k16 show the additive (positive coefficients) or subtract effect (negative coefficients) when the element is inserted into the vignette. For the study here, we focus only on the positive coefficients. The negative coefficients are ambiguous. They can refer to the loss of positive responses because the respondent actually felt negative (viz., for R54, ‘Care’ ratings of 1 and 2), or the rating 3 (viz., cannot decide). We focus here on the element which ‘drives’ the [positive rating. It is in those elements where the story is to be found.
Step 10: Results from the Total Panel for Care (Table 5) and for Work (Table 6)
Table 5 (first data column labelled Total) shows the additive constant and the 16 elements for rating R54, ‘Care’) Similarly, Table 6 (first data column labeled Total) shows the additive constant and the coefficients for the 16 elements for rating R54 (‘Work’).
Table 5: Models relating elements to ‘Care’ (dependent variable = 5 and 4)
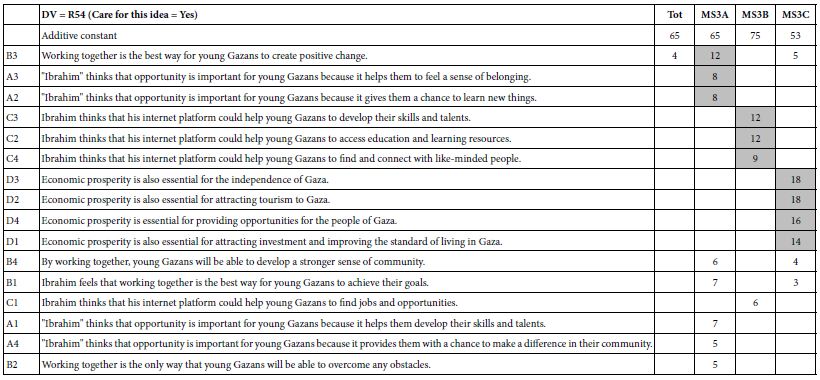
Table 6: Models relating elements to ‘Work’ (dependent variable = 5 and 2)
The first thing we notice is that the additive constant is higher for ‘care for it’, and lower for ‘will work’ (65 vs. 52). This means that although people like what they hear (emotional response), when they think about this strategy actually working, they are substantially less positive.
The second thing we see for the total panel is that very few elements have positive coefficients of 2 or higher, and none have strong positive coefficients of 8 or higher. This finding may be disappointing, the reality is that the ‘flatness’ of the result is probably due to different groups of people, with different points of view, competing with each other. A visual analogy might be a still pool, but with water rushing into that still pool from different directions. The water streams cancel each other out, even though we don’t yet realize that.
Step 10: Identify Mind-sets by Clustering, and then Create a Separate Equation for Each Mind-Set
The creation of questions for the total panel, whether for R54 (care for it) or from R52 (will work) revealed that only a few elements generated positive coefficients, and no element performed ‘strongly’, defined as a coefficient of +8 or higher.
If the poor performance is due to different ‘groups’ or mind-set in the population who have different ways of thinking about what is presented, then how does the researcher operationally disentangle these groups, these mind-sets. The question is even more relevant when the topic is entirely new, or when the researcher wants to explore a well-explored topic, but in a new way. The problem becomes a conundrum when these different ways of considering a problem are thought of as opposite groups, who data cancel each other. There is no ingoing idea of the number of such mind-sets for data, nor the nature of each mind-set, nor even how big the mind-set may be. Each data set is different, with its own granular set of elements, its own set of respondents and so forth. How can the learning from the data be extended to mind-sets in an automatic manner, independent of any a priori knowledge?
The answer to the question about discovering underlying mind-sets emerges from statistical methods known as clustering [13]. Clustering refers to a class of statistical techniques, purely mathematical in nature, which seeks patterns in data so that the individuals in a dataset can be allocated to different, usually mutually exclusive, and exhaustive groups. These groups are called ‘segments’. In the language of Mind Genomics these groups are called ‘mind-sets. The mind-sets are obtained mathematically, and then interpreted in a post-hoc way by the researcher, based on commonalities among the members in each mind-set.
For this specific type of study, so-called 4×4 (four questions, four answers for each question), Mind Genomics clusters the respondent by the pattern of their individual set of 16 coefficients, independent of any other information about the respondent. Recall that the underlying experimental design prescribed a specific set of 24 combinations, in which each of the 16 elements appears five times in the 24 vignettes and is absent 19 times. Furthermore, the experimental design ensures that the 16 elements are statistically independent of each other, and that a vignette can contain at most one element or answer from a question, never two or more answers. This design ensures that the data generated by each individual respondent can be analyzed by ordinary least-squares (OLS) regression, in the same way that the data from the total panel are analyzed. OLS regression returns with an additive constant, and 16 coefficients for the respondent.
The embedded k-means clustering program computes the Pearson correlation, R, between each pair of respondents, based on the 16 coefficients for each respondent. The Pearson correlation measures the strength of the linear relation between two sets of observations, varying from a +1 for perfect linear co-variation, to -1 to perfect inverse linear co-variation. The k-means clustering program defines the ‘distance’ or ‘dissimilarity’ between two respondents as the quantity (1- Pearson R). With this measure of ‘distance’ the underlying algorithm assigns each of the 280 respondents first into two mutually exclusive and exhaustive groups (two segments, or two mind-sets), and then, starting from the beginning, into three mutually exclusive and exhaustive groups. The criterion for the mathematical solution is to minimize the distance between respondents within a group, and at the same time maximize the distance between the 16 centroids for two groups, or maximize the distance among the 16 centroids for three groups.
Clustering methods are heuristic, with results only approximate. They give a qualitative sense of the possibly different mind-sets among people. The researcher using the clustering should make every effort to minimize the number of mind-sets (parsimony), while at the same time selecting an array of mind-sets which tells a meaningful story from each mind-set (interpretability). Both requirements are subjective, not fixed in stone, and rely upon the judgment of the analyst.
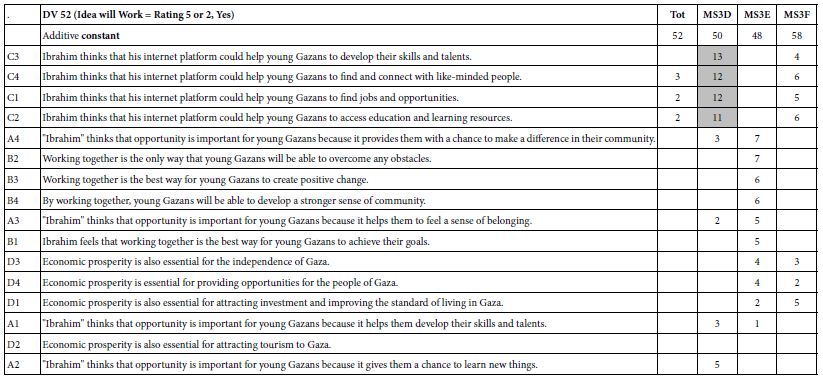
The clustering was done twice, first on the basis of the 16 coefficients estimated for each respondent, with the dependent variable being R54 (the coefficients for ‘care’ for this idea; generating MS3A, MS3B, MS3), and then again on the basis of the different set of 16 coefficients estimated when the dependent variable was R52 (the coefficients for ‘will work’; generating MS3D, MS3E, MS3F). The clustering thus considered the two variables as different from each other, even though the two variables
It is with clustering based on the coefficients that the ‘stories’ begin to emerge. Rather than being stuck with data with a great number of blanks, that we observe for the total panel, the stories are clear when the clustering is done. Furthermore, clustering based on the coefficients tend to be more meaningful, more interpretable than clustering based on the more conventional variables answered directly by respondents, such as geo-demographics (WHO), what a person says about what they believe (THINK), or what a person does (BEHAVIOR).
When we cluster on the basis of emotion (Care, DV = R54) we find these three mind-sets, based upon the strong performing elements in cluster or mind-set.
Table 5: Clustering based on ‘care’
MS3A = Focus on ‘working together’ to create positive change MS3B = Focus on education and development of skills
MS3B = Focus on improved economic outlook. Table 6: Clustering base d on ‘work’
Only one mind-set shows strong responses,MS3D
MS3D = The Internet will help the young Gazans develop skills, and connect with like-minded people. This mind-set strongly believes in the efficacy of the four elements.
MS3E = The Internet will be a positive force for change. MS3E does not strongly believe in this, however, but these ended up as the strongest performing elements.
MS3F = The internet will give opportunities for improvement, education, and investment. MS3F does not, however, believe strongly in these elements, although it begin with the highest additive constant (58), viz., the highest level of starting belief that the Internet will be a positive force.
Step 11: Incorporating Self-profiling as Moderating Variables for More Insights
What happens, when we want to augment our predictor set, moving beyond the 16 elements. Suppose we wish to look at the model for the Total Panel, or the model for mind-set, but while looking at the model, measure the additional ‘effect’ of country, gender, age, or even order of testing vignette (viz., effect attributable to the vignette being in positions 1-12 versus effect attribute to the vignette being in positions 13-24).
This question moves in a different direction than has been the custom for analyzing Mind Genomics data. The traditional way has been to run separate models for each subgroup, such as what has been done for the two sets of mind-sets Tables 5 and 6 show the totally separate analyses, first for the respondents, and then only for the respondent in the different mind-sets.
We could repeat the analysis, running a separate model by each country, a separate model by each gender, a separate model by each age group, and indeed, a separate model for each subgroup defined by the open ended question. This effort could be done but might end up being very confusing.
The approach introduced here introduces new ‘dummy’ models, 14 for country, two for gender, five for age, and two for test order. Each vignette is defined by the respondent’s membership in country (1 for yes, 0 for no), by membership in gender, by membership in age group, and by order of appearance in the 24 vignettes (first group v second group). The OLS regression treats this information as new variables, moderating variables estimated in the same equation.
When we do the additional we know that the respondent has to have a country, gender, age, and that the vignette has to have been presented in positions 1-12 or positions 13-24, respectively. In order for the OLS (ordinary least squares) regression to run without error, the independent variables must all be statistically independent. That statistical independent for the 16 elements is ensured by the underlying experimental design, and furthermore ensured at the level of the individual respondent. This NOT the case when we come to the classification variables. For every vignette there must be one country, one age, one gender, and one test order. Furthermore when we know the condition of any 13 countries we automatically know the condition of the 14th country. The same knowledge occurs when we know one gender. We automatically know the status of the other gender, and so forth.
The answer to making the self-profiling classifications independent is to deliberately leave one of the classification options out of the predictor occasion. Thus one of the answers must be held out for test order (select order 1,) country (select UAE), one gender (select Female), one for age (select age 16-21). It does not matter which of the classification answers is held out, because the coefficients will be all relative to the one held out. The regression returns with the additive constant, the 16 coefficients for the 16 elements, respectively, 13 coefficients for country with the coefficient for UAE set automatically to 0, the coefficient for male set to 0, the coefficient for age 16-21 set to 0, and the coefficient for order = 1 (first 12 vignettes) set to 0. The coefficients for these four variables are relative.
Now, consider the results in Table 7, the ‘enhanced models’ for the dependent variable ‘care’ (R54). The UAE is held at 0. Take Mexico for example. When that is done, Mexico generates a coefficient of +8 meaning that an addition 8% of the respondents would be expected to rate the vignette 5 or 4. Now consider the opposite. Let Mexico be held out, and thus assigned the weight of 0. Then we would expect the coefficient for the UAE still to be 8 points lower, and so the coefficient for the UAE would be -8. The differences among the coefficients for the same variable (e.g., country) remain the same, but they change in magnitude depending upon which classification variables selected to be the ‘references’, viz., not appear as predictors in the regression equation, and their coefficients set to 0.
Table 7: Augmented models, for R54 (care), showing parameter for modes run for Total, and for the three mind-sets
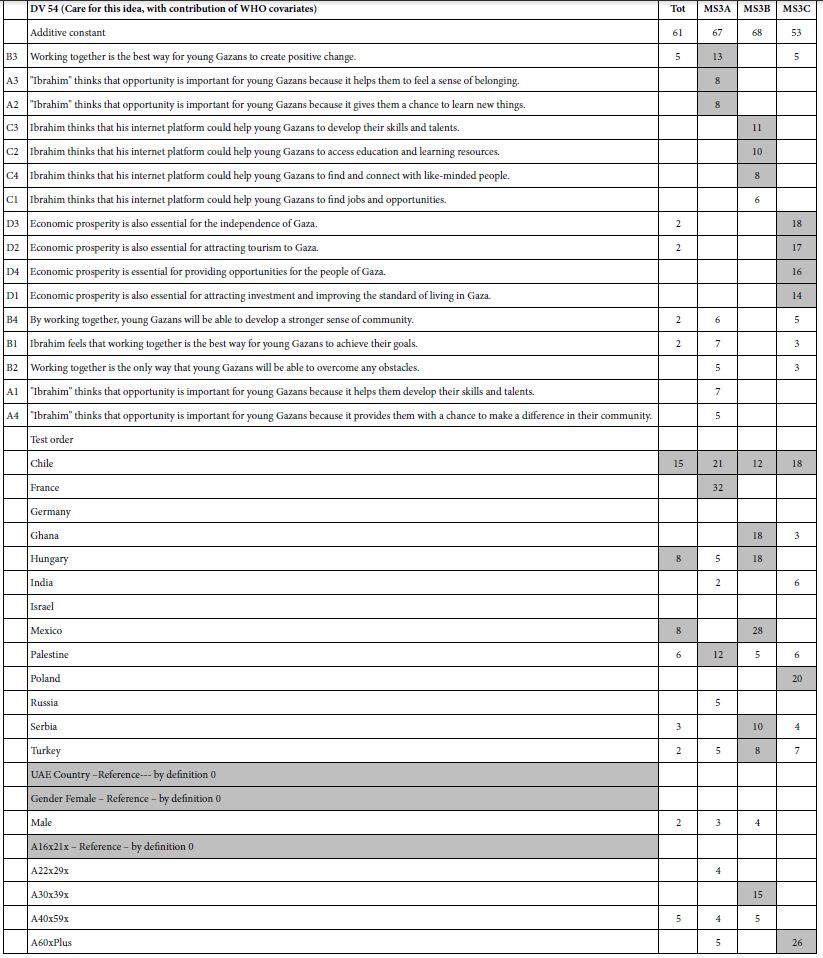
Table 7 shows us the enhanced models for R54 (appeals to me). Table 9 shows the enhanced models for R52 (work). Again only positive coefficients are shown. Furthermore, the entire equation is re- estimated with these new sets of 13 country predictors (UAE held out as the reference), one for gender predictor (female held out), and four age predictors (age 16-21 held out) and one order predictor (order 1, vignettes 1-12(,
The key insight comes from the Total Panel. Chile, Hungary, and Mexico care strongly for the idea. Ghana and Serbia think the effort will work. Gender makes no difference. Age makes a difference, not so much for R54 (CARE), but for R52 (will work) (Table 8).
Table 8: Augmented models, for R54 (work), showing parameter for models run for Total, and for the three mind-sets
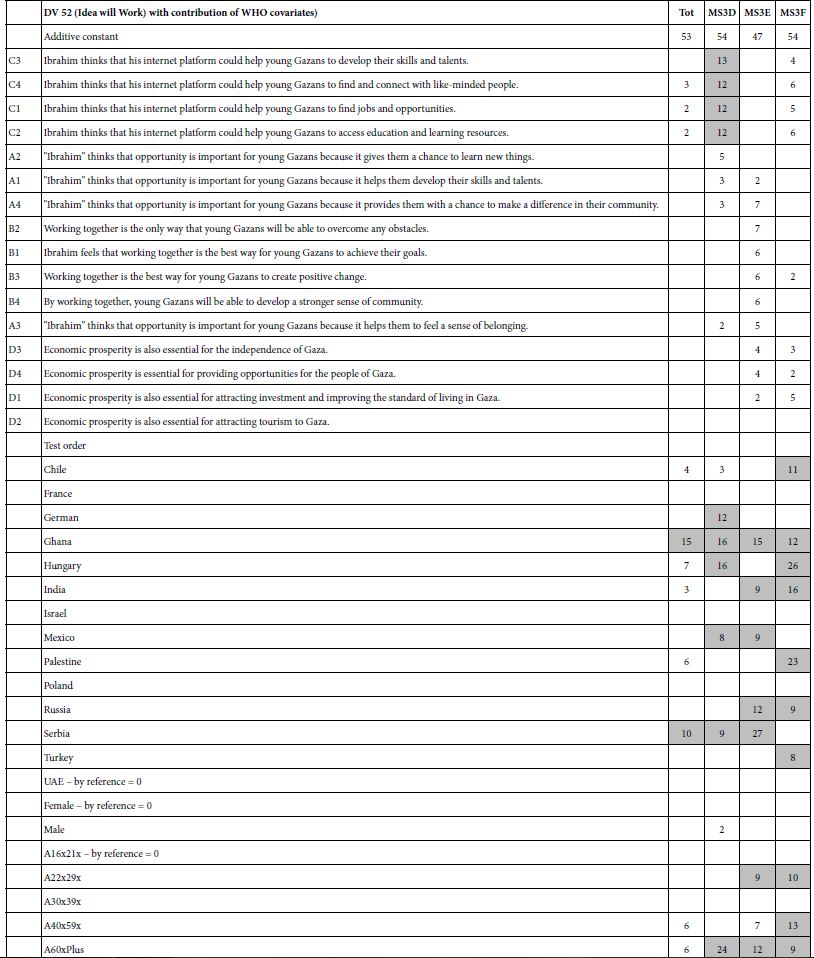
In general, the insights emerging from the augmented model are suggestive of effects, but do not pinpoint the effects as the models directly created for each country, for each age, for both orders, and for both genders. By giving up the specific, however, the augmented sense of predictors provides a general, simply summarized effect of country, gender, age, and order.
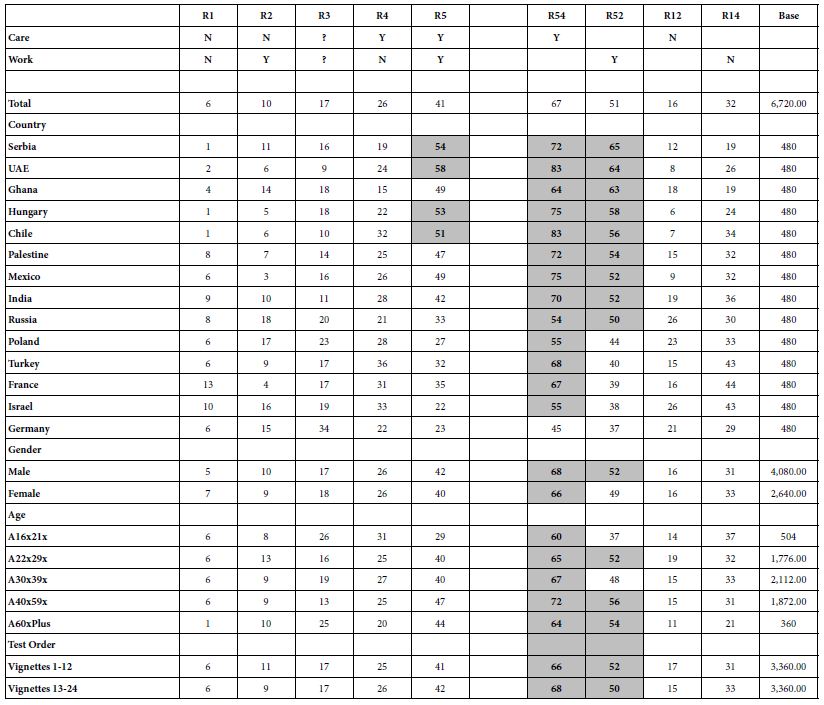
Step 12: Looking for Insights without Knowing What Elements Mean
Up to now we have been looking at the data with full knowledge of what the elements ‘mean.’ That is, the test stimuli, the vignettes, comprise elements which have meaning. We don’t infer what is happening from trying to guess the nature of the stimuli to which the respondents react. We KNOW what the stimuli mean. Let us turn the analysis around 180 degree. Without knowing what the elements actually mean, let us attempt to understand the nature of differences across country, gender, age, and order of testing.
Table 9 shows what we would be left with were the elements in the study had no ‘cognitive richness’, viz., no meaning. Were we interested, we could do many different analyses, although the learning would be relatively superficial, requiring us to infer what might be happening. The only information we have available to us is the pattern of the responses themselves. There are clearly group differences, with the largest differences emerging for country. In contrast, by working both with cognitively meaningful elements and with meaningful differences among respondents, we can more deeply understand what might be happening, either by using the countries (and other predictors) as co- variates when we create models, or actually creating models for each country, each gender, or each age, respectively.
Table 9: Patterns of ratings by country, gender, age. Numbers in the body of the table show the frequency of the rating(s) by key subgroup
Discussion and Conclusions
The development of Mind Genomics in the early 1990’s recognized that experimental design applied to ideas could provide a powerful way to create databases of the mind for a variety of topics [2]. These early studies were done before the Internet became popular, and were analyzed by a systematized approach to reveal how people make decisions. One of the first studies, on coffee, was done in different countries around the world, in collaboration with early adopters of Mind Genomics, members of ESOMAR (World Society of Market Research). The study revealed four mind-sets across the participating countries, with these mind-sets emerging after the data were analyzed independent of country, to obtain the basic mind-sets. Only after the trans-national study was done and the global mind-sets extracted were the country of origin of the respondents determined [14].
That pioneering study suggested that with the proper technology to set up, execute, and analyze experiments, it would someday become possible to run identical transnational studies on virtually any topic that involved human decision making. The early study on coffee took about three months to design, execute, and analyze, not so much because the data required the time, but because the logistic required — individual thinking about the elements, cooperation in the execution of the study, and then the careful analysis of new-to-the-work type of data, and out-of-the-box thinking about mind-set segmentation.
The more than 25 years since the presentation of that pioneering study at the ESOMAR Congress in Turkey, 1996, has seen this early trans-national approach evolve from an effortful study to one that can be done in the space of a few hours, for a little more than $1,000 or so. The effort to think of ideas has been shifted to artificial intelligence, whether better or worse. The study implementation has been enhanced by the creation of an automatic system, www.BimiLeap.com, and the easy, fast, and inexpensive execution on the web.
The result of the foregoing, as shown in this study about the Internet in Gaza, can be presented the next day. More importantly, however, this transnational study can be iterated half a dozen times in less than a week, often in a few days, allowing the interested party to explore different aspects of the Internet, different aspects of Gaza, or different aspects of the combination as perceived by the world. And finally, most important, in the spirit of what has been shown here, virtually any topic can be chosen, deeply explored, populated with issues and answers, and iterated several times resulting in a unique, timely, relevant data base about the mind of people where judgment is relevant.
Acknowledgements
The authors would like to thank their many colleagues and friends for the opportunity to develop these ideas through patient discussion.
References