Abstract
The textile wastewaters could not be treated effectively with conventional treatment processes due to high polyphenol and aromatic compounds and colour content. In this study, by doping of NiCO2O4 to Bi2O2CO3 the generated NiCO2O4to Bi2O2CO3nanocomposite was used for the photocatalytic oxidation of COD components (CODtotal, CODdissolved, CODinert), color, organophenols and organoaromatic compounds from a textile industry wastewaters (TW) at different operational conditions such as, at different photooxidation times (5 min, 15 min, 30 min, 60 min, 80 min and 100 min), at diferent NiCO2O4ratios (0.5wt% , 1wt%, 1.5wt%, 2wt%), at different NiCO2O4 / Bi2O2CO3nanocomposite concentrations (1, 5, 15, 30 and 45 mg/L), under 10, 30, 50 and 100 W solar irradiations, respectively. The maximum CODtotal, CODinert, total flavonols, total aromatic amines (TAAs) and color photooxidation yields were 99%, 92%, 91%, 98% and 99% respectively, under the optimized conditions, at 30 mg/L Ni/BiO nanocomposite with a Ni mass ratio of 1.5 wt% under 50 W UV (ultraviolet) light, after 60 min photooxidation time, at 25°C. The photooxidation yields of kaempferol (KPL), quercetin (QEN), patuletin (PTN), rhamnetin (RMN) and rhamnazin (RHAZ) from flavonols and 2-methoxy-5-methylaniline (MMA), 2,4-diaminoanisole(DAA); 4,40-diamino diphenyl ether (DDE), o-aminoazotoluene (OAAT), and 4-aminoazobenzol (AAB) from polyaromatic amines were > 82%.The pollutants of textile industry wastewater were effectively degraded with Ni doped BiO nanocomposite.
Keywords
Flavonols; Nickel cobaltite NiCO2O4 nanocomposite; bismuth subcarbonate (Bi2O2CO3) nanocomposite; Photooxidation; Polyaromatic amines; Ultraviolet (UV) light irradiation.
Biographical notes
Delia Teresa Sponza is a Professor at the Department of Environmental Engineering, Engineering Faculty, Dokuz Eylül University,İzmir, Turkey. She graduated her MSc and PhD degrees from Dokuz Eylül University, Turkey, in Environmental Engineering. Her research interests are environmental microbiology,environmental sciences and toxicity. She has published a number ofresearch papers at the national and international journals.
Rukiye Oztekin is a Researcher at the Department of Environmental Engineering, Engineering Faculty, Dokuz Eylül University, İzmir, Turkey. She graduated her MSc and PhD degrees from Dokuz Eylül University, Turkey, in Environmental Engineering. Her research interestsinclude environmetal sciences and toxic industrial wastewater treatment.
Introduction
Textile industry is one of those industries that consume large amounts of water in the manufacturing process [1] and, also, discharge great amounts of effluents with synthetic dyes to the environment causing public concern and legislation problems. Synthetic dyes that make up the majority (60–70%) of the dyes applied in textile processing industries [2] are considered to be serious health risk factors. Apart from the aesthetic deterioration of water bodies, many colorants and their breakdown products are toxic to aquatic life [3] and can cause harmful effects to humans [4,5]. Several physico-chemical and biological methods for dye removal from wastewater have been investigated [6-8] and seem that each technique faces the facts of technical and economical limitations [7]. The traditional physical, chemical and biologic means of wastewater treatment often have little degradation effect on this kind of pollutants. On the contrary, the technology of nanoparticulate photodegradation has been proved to be effective to them. Compared with the other conventional wastewater treatment means, this technology has such advantages as: (1) wide application, especially to the molecule structure-complexed contaminants which cannot be easily degraded by the traditional methods; (2) the nanoparticles itself have no toxicity to the health of our human livings and (3) it demonstrates a strong destructive power to the pollutants and can mineralize the pollutants into carbondipxide (CO2) and water (H2O) [9].
Bi2O2CO3 has gained much attention due to its promising photocatalytic activity for wastewater treatment [10-12]. Although Bi2O2CO3 has been widely studied in the photocatalytic degradation of wastewater, little attention has been poured to investigate the microwave catalytic performance of Bi2O2CO3 for microwave catalytic oxidation degradation of wastewater, up to now. At the same time, the magnetic NiCO2O4 has intriguing advantages, such as excellent microwave absorption performance, low cost, magnetically separable property, and high stability [13]. To the best of our knowledge, NiCO2O4-Bi2O2CO3 composite as microwave catalyst for degradation o more semiconductor photocatalysts have been found to be capable of photocatalytic degradation of organic macromolecular contaminants in wastewater [14, 15]. Therefore, photocatalytic degradation has become the most environmentally friendly, energy-saving, and efficient water pollution treatment method. In view of the fact that the traditional photocatalysts (such as TiO2) have large band gap energy and low response to visible light, their application is greatly limited. Among these miconducting photocatalysts, bismuth molybdate (Bi2MoO6) as a ternary oxide compound of Aurivillius phase becomes one of the promising materials. This is because it has a unique layered structure sandwiched between the perovskite octahedral (MoO4)2−sheets and bismuth oxide layers of (Bi2O2)2+ [16-18]. Its dielectric property, ion conductivity, and catalytic performance have obvious advantages in bismuth-based semiconductors [19, 20]. Nevertheless, the light absorption property of the pure Bi2MoO6 primarily appears in the ultraviolet light region, which is only a small part of the solar spectra. Meanwhile, it presents a high recombination rate of electronhole
pairs in the process of photocatalytic reaction [21]. Therefore, researchers have improved the performance of Bi2MoO6 by means of
morphology controlling, semiconductor compounding, and doping modification [22]. Among these measures, doping has proven to be an effective method to ameliorate the surface properties of photocatalysts and enhance photocatalytic performance.
It was reported that carbon-doped Bi2MoO6 exhibited significantly enhanced and stable photocatalytic properties compared with Bi2MoO6 [23], which carbon replaced the O2−anion in the lattice of Bi2MoO6, resulting in lattice expansion and grain diameter reduction, enhancement of specific surface area [24]. prepared Graphene-Bi2MoO6 (G-Bi2MoO6) hybridphotocatalysts by a simple one-step process, and an increase in photocatalytic activity was observed for G-Bi2MoO6 hybrids compared with pure Bi2MoO6 under visible light. Xing et al., (2017) reported the photocatalytic activity of 0.5% Pd–3C/BMO was robustly enhanced about 5-fold for Rhodamine B (RhB) degradation within 40 min under UV + visible light irradiation and 29-fold for O-phenylphenol (OPP) degradation within 120 min under visible light irradiation in comparison with pristine Bi2MoO6, respectively. [25] prepared a B-doped Bi2MoO6 photocatalyst with hydrothermal method by using HBO3 as a dopant source. It was found that B-doping increases the amount of Bi5+ and oxygen vacancies, so that the visible light absorption of catalyst is stronger, and the band gap energy is lower, which significantly improves the photocatalytic activity of Bi2MoO6. [26] successfully synthesized sulfur-doped copper-cobalt bimetal oxide by coprecipitation method, which significantly improved the catalytic performance and stability of the catalyst. [27] fabricated Bi2MoO6 surface co-doped with Ni2+ and Ti4+ ions through an incipient-wetness impregnation technology and calcination method, with the results suggesting Ni2+ and Ti4+ codoping increases visible-light absorption by Bi2MoO6 and promotes the separation of photogenerated charge carriers. Density functional theory calculations and systematical characterization results revealed that Biself-doping could not only promote the separation and transfer of photo generated electron-hole pairs of Bi2MoO6 but also alter the position of valence and conduction band without changing its preferential crystal orientations, morphology, visible light absorption, as well as band gap energy [28, 29] synthesized pure and various contents of Ce3+ doped Bi2MoO6 nano structures by a facile hydrothermal method. The 0.5%Ce3+ doped Bi2MoO6 exhibitsthe best photocatalytic activity of 96.6% within 20 min for RhB removal.
The photocatalytic performance of NiCO2O4-doped Bi2MoO6 nanoparticles has not been investigated extensively for the removals of aromatics and polyphenols from a textile industry. In this work, the phsicochemical properties of NiCO2O4 doped Bi2O2CO3 nanocomposite was investigated using microscope (SEM), transmission electron microscopy (TEM), Fourier transform infrared spectroscopy (FT-IR), X-ray photoelectron spectroscopy (XPS), photoluminescence spectra (PL), N2 adsorption–desorption, elemental mapping, Raman and diffused reflectances pectra (DRS) analysis. The photocatalytic oxidation of pollutant parameters [COD components (CODtotal, CODdissolved, CODinert), flavonols (kaempferol, quercetin, patuletin, rhamnetin and rhamnazin), polyaromatic amines (2-methoxy-5-methylaniline, 2,4-diaminoanisole, 4,40-diamino diphenyl ether, o-aminoazotoluene, and 4-aminoazobenzol) and color] from the TW at different operational conditions such as, at increasing photooxidation times (5 min, 15 min, 30 min, 60 min, 80 min and 100 min), at diferent Ni mass ratios (0.5wt% , 1wt%, 1.5wt%, 2wt%), at different Ni-BiO photocatalyst concentrations (1, 5, 15, 30 and 45 mg/L), at different pH ranges (4, 6, 8, 10) under 10, 30, 50 and 100 W UV light irradiations, respectively, were investigated .
Materials and methods
Raw wastewater
The characterization of raw TW was given in Table 1.
Table 1. Characterization values of TW at pH=5.7 (n=3, mean values ± SD). (SD: standard deviation; n: the repeat number of experiments in this study).
|
Parameters |
Values |
||
|
Minimum |
Medium |
Maximum |
|
|
pH |
5.00 ± 0.18 |
5.27 ± 0.19 |
6.00 ± 0.21 |
|
DO (mg/L) |
1.30 ± 0.05 |
1.40 ± 0.05 |
1.50 ± 0.05 |
|
ORP (mV) |
85.00 ± 2.98 |
106.00 ± 3.71 |
128.00 ± 4.48 |
|
TSS (mg/L) |
285.00 ± 9.98 |
356.00 ± 12.46 |
430.00 ± 15.05 |
|
TVSS (mg/L) |
192.00 ± 6.72 |
240.00 ± 8.40 |
290.00 ± 10.15 |
|
CODtotal (mg/L) |
931.70 ± 32.61 |
1164.60 ± 40.76 |
1409.20 ± 49.32 |
|
CODdissolved (mg/L) |
770.40 ± 26.96 |
962.99 ± 33.71 |
1165.22 ± 40.78 |
|
TOC (mg/L) |
462.40 ± 16.18 |
578.00 ± 20.23 |
700.00 ± 24.50 |
|
BOD5 (mg/L) |
251.50 ± 8.80 |
314.36 ± 11.00 |
380.38 ± 13.31 |
|
BOD5/CODdis |
0.26 ± 0.01 |
0.33 ± 0.012 |
0.40 ± 0.014 |
|
Total N (mg/L) |
24.80 ± 0.87 |
31.00 ± 1.09 |
37.51 ± 1.31 |
|
NH4-N (mg/L) |
1.76 ± 0.06 |
2.20 ± 0.08 |
2.66 ± 0.09 |
|
NO3-N (mg/L) |
8.00 ± 0.28 |
10.00 ± 0.35 |
12.10 ± 0.42 |
|
NO2-N (mg/L) |
0.13 ± 0.05 |
0.16 ± 0.06 |
0.19 ± 0.07 |
|
Total P (mg/L) |
8.80 ± 0.31 |
11.00 ± 0.39 |
13.30 ± 0.47 |
|
PO4-P (mg/L) |
6.40 ± 0.22 |
8.00 ± 0.28 |
9.68 ± 0.34 |
|
SO4-2 (mg/L) |
1248.00 ± 43.70 |
1560.00 ± 54.60 |
1888.00 ± 66.10 |
|
Color (1/m) |
70.90 ± 2.48 |
88.56 ± 3.10 |
107.20 ± 3.75 |
|
Flavonols (mg/L) |
30.9 ± 1.08 |
38.6 ± 1.35 |
46.1 ± 1.61 |
|
Flavonols |
|
|
|
|
Kaempferol |
4.2 ± 0.20 |
5.7 ± 0.2 |
7.2 ± 0.3 |
|
Quercetin |
7.3 ± 0.26 |
9.2 ± 0.32 |
11.1 ± 0.4 |
|
Patuletin |
8.3 ± 0.30 |
10.3 ± 0.36 |
12.2 ± 0.43 |
|
Rhamnetin |
6.0 ± 0.21 |
7.2 ± 0.25 |
8.4 ± 0.3 |
|
Rhamnazin |
5.1 ± 0.18 |
6.15 ± 0.22 |
7.2 ± 0.25 |
|
TAAs (mg benzidine/L) |
891.84 ± 31.21 |
1038 ± 36.33 |
1183.8 ± 41.43 |
|
Polyaromatics |
|
|
|
|
2-methoxy-5-methylaniline |
128.5 ± 4.5 |
134.6 ± 4.71 |
140.6 ± 4.92 |
|
2,4-diaminoanisole |
250.2 ± 8.76 |
275.8 ± 9.7 |
301.3 ± 10.6 |
|
4,40-diamino diphenyl ether |
146.54 ± 5.13 |
156.0 ± 5.5 |
165.4 ± 5.8 |
|
o-aminoazotoluene |
265.4 ± 9.3 |
293.6 ± 10.3 |
321.7 ± 11.3 |
|
4-aminoazobenzol |
101.2 ± 3.54 |
178 ± 6.23 |
254.8 ± 8.92 |
Chemical structure of flavonols and poliaromatics present in the TW
The structure of flavonols in the TW was shown in Figure 1. The structure of polyaromatics in the TW was given Figure 2.
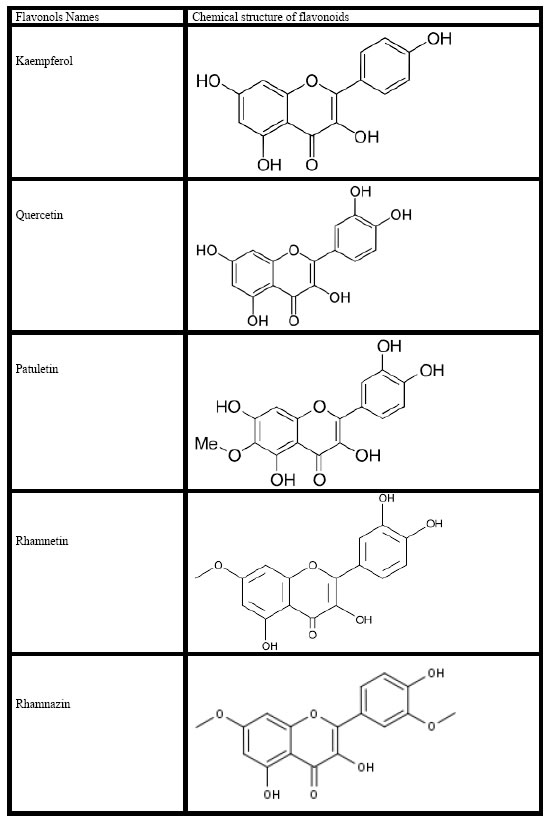
Figure 1. Chemical structure of flavonoids in the TW.
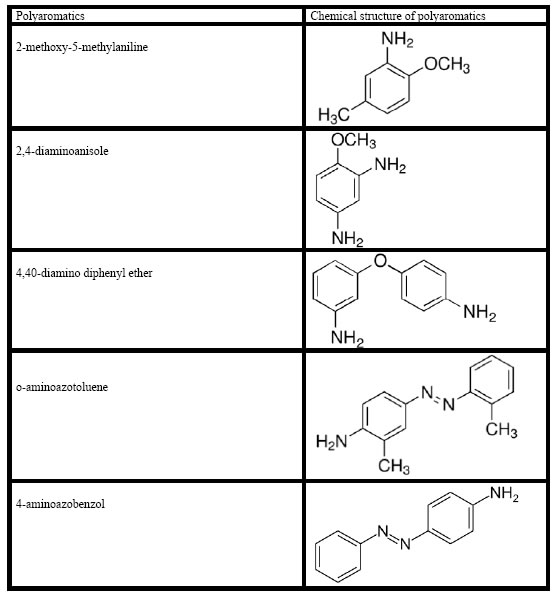
Figure 2. Chemical structure of polyaromatics in the TW
Preparation of photocatalysts
Ni-doped BiO nano particles were prepared by co-precipitation method using nickel nitrate hexahydrate [Ni(NO3)2.6H2O] (Analytical grade, Merck ) and Bismuthnitrate hexahydrate [Bi(NO3)2·6H2O] (Sigma, Aldrich) as the precursors of nickel and bismuth, respectively. Ni(NO3)2.6H2O and sodium carbonate anhydrous (Na2CO3) were dissolved separately in double distilled H2O to obtain 0.5 mol/Lsolutions. Nickel nitrate solution (250 mL of 0.5 mol/L) was slowly added into vigorously stirred 250 mL of 0.5 mol/L Na2CO3 solution. Nickel nitrate in the required stoichiometry was slowly added into the above solution and a white precipitate was obtained. The precipitate was filtered, repeatedly rinsed with distilled H2O and then washed twice with ethanol. The resultant solid product was dried at 100°C for 12 h and calcined at 300°C for 2 h. BiO particles were also prepared by the same procedure without the addition of nickel nitrate solution. The doping Ni mass ratios of Bismuth are expressed as wt%.
X-Ray diffraction (XRD) analysis
XRD patterns of the samples are going to carry out using a D/Max-2400Rigaku X-ray powder diffractometer operated in the reflection mode with Cu Ka (λ = 0.15418 nm) radiation through scan angle (2θ) from 20° to 80°.
Scanning electron microscopy (SEM) analysis
The morphological structures of the Ni-BiO nanocomposites before photocatalytic degradation with UV light irradiations and after photocatalytic degradation with UV by means of a SEM.
Fourier transform infrared spectroscopy (FTIR)analysis
The FTIR spectra of Ni, BiO and Ni-BiO samples were measured with FTIR spectroscopy measurements.
Photocatalytic degradation reactor
A 2 L cylinder kuvars glass reactor was used for the photodegradation experiments in the TW under different UV powers, at different operational conditions. 1000 mL TW was filled for experimental studies and the photocatalyst were added to the cylinder glass reactor. The photocatalytic reaction was operated with constant stirring during the photocatalytic degradation process. 10 mL of the reacting solution were sampled and centrifugated (at 10000 rpm) at different time intervals.
Used chemicals
Ni(NO3)2.6H2O (Analytical Grade, Merck, Germany) and Bi(NO3)3·6H2O (Analytical grade, Merck, Germany) were used as nickel and bismuth sources, respectively. Na2CO3 was purchased from Merck (Analytical grade). Helium, He(g) (GC grade, 99.98%) and nitrogen, N2(g) (GC grade, 99.98%) was purchased from Linde, (Germany). Kaempferol (99%), quercetin (99%), patuletin (99%), rhamnetin (99%), rhamnazin (99%), 2-methoxy-5-methylaniline (99%), 2,4-diaminoanisole (99%), 4,40-diamino diphenyl-ether (99%), o-aminoazotoluene (99%), 4-aminoazobenzol (99%) were purchased from Aldrich, (Germany).
Analytical methods
pH, T(°C), ORP, DO, BOD5, CODtotal, CODdissolved, total suspended solids (TSS), Total-N, NH3-N, NO3-N, NO2–N, Total-P and PO4-P measurements were monitored following the Standard Methods 2310, 2320, 2550, 2580, 4500-O, 5210 B, 5220 D, 2540 D, 4500-N, 4500-NH3, 4500-NO3, 4500-NO2 and 4500-P [30]. Inert COD was measured according to glucose comparison method [31]. The samples were analyzed by high pressure liquid chromatography (HPLC) with photodiode array and mass spectrometric detection using an Agilent 1100 high performance liquid chromatography system consisting of an automatic injector, a gradient pump, a Hewlett–Packard series 1100 photodiode array detector, and an Agilent series 1100 VL on-line atmospheric pressure ionization electrospray ionization mass spectrometer to detect flavonols namely kaempferol, quercetin, patuletin, rhamnetin, rhamnazin and polyaromatics namely, 2-methoxy-5-methylaniline, 2,4-diaminoanisole, 4,40-diamino diphenyl-ether, o-aminoazotoluene, 4-aminoazobenzol, respectively. All the metabolites were measured in the same HPLC by mass spectrometric detections. Operation of the system and data analysis were done using ChemStation software, and detection was generally done in the negative ion [M − H]– mode, which gave less complex spectra, although the positive ion mode was sometimes used to reveal fragmentation patterns—especially patterns of sugar attachment. Separation of flavonol components was made on a Vydac C18 reversed phase column (2.1 μm dia. × 250 mm long; 5-μm particle size). Columns were eluted with acetonitrile-water gradients containing 0.1% formic acid in both solvents. The quality of the raw (un-treated) and photooxidated wastewater were determined by measuring the absorbances of the supernatans at wavelengths varying between 200 nm, 250 nm, 300 nm, 350 nm and 540 nmusing an Aquamate Termoelectron Corporation UV-vis spectrophotometer.
Measurement of photonic efficiency (lr) of Ni doped BiO
The relative photonic efficiency of the catalyst is obtained by comparing the photonic efficiency of Ni-doped BiO with that of the standard photocatalyst (BiO). In order to evaluate lr, a solution of 1-Methylcyclopropene-MCP (40 mg/L) with a pH of 10 was irradiated with 100 mg of BiO and Ni-doped BiO for 60 min. From the degradation results, Ir was calculated as follows (Eq. 1).

Operational conditions
Under 10-30-50 and 100 W UV light powers the photocatalytic oxidation of the pollutant parameters in the TW at different operational conditions such as at increasing Ni mass ratios in the Ni-BiOnanocomposite(0.5wt% , 1wt%, 1.5wt%, 2wt%), at increasing photooxidation times (5 min, 15 min, 30, 60 min, 80 min and 100 min), at different Ni-BiOphotocatalyst concentrations (1, 5, 15, 30 and 45 mg/L), under acidic, neutral and basic conditions, respectively.
All the experiments were carried out following the batch-wise procedure. All experiments were carried out three times and the results were given as the means of triplicate sampling with standard deviation (SD) values.
Results and analysis
XRD Analysis results
The powder XRD patterns of BiO and Ni-doped BiO with different lanthanum mass ratios are shown in Figure 3. The XRD patterns of all the Ni-doped BiO catalysts are almost similar to that of BiO, suggesting that there is no change in the crystal structure upon Ni loading. This also indicates that Ni+2 is uniformly dispersed on BiO nanoparticles in the form of small Ni2O2 cluster. However the Ni-doped samples have a wider and lower intense diffraction peaks than pure BiO. Moreover, the XRD peaks of Ni-doped BiO continuously get broader with increasing the Ni loading up to a mass ratio of 2%wt.
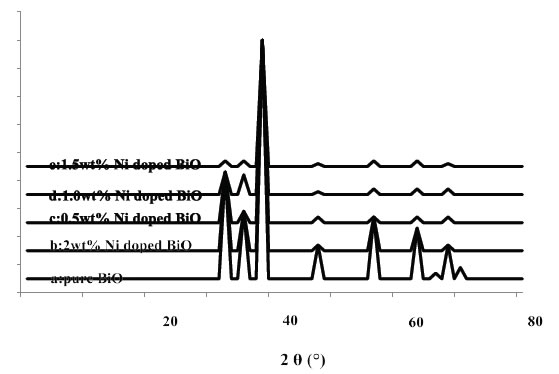
Figure 3. XRD patterns of BiO and Ni doped BiO (a) pure BiO, (b) 2 wt% Ni doped BiO, (c) 0.5wt% Ni doped BiO, (d) 1.0wt% Ni doped BiO, and (e) 1.5wt% Ni doped BiO.
SEM Analysis results
The morphology of nanocomposite particles is analyzed by SEM. Figure 4 shows that the nanocomposite material is partly composed of clusters containing composite nanoparticles adhering to each other with a mean size of around 20-80 nm before photooxidation process (Figure 4a) while the size increased to 24-86 nm after photooxidation (Figure 4b) with intermediates and remaining not photodegraded pollutants.
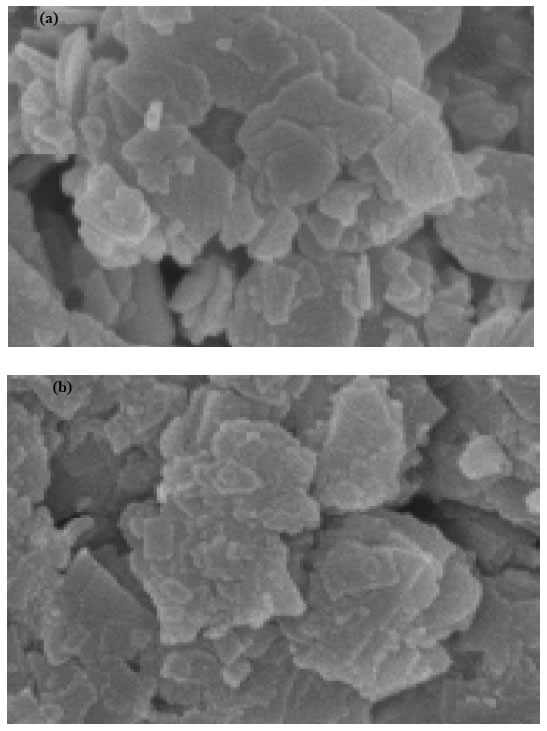
Figure 4. SEM micrographs of pure and nickel modified BiO, (a) pure BiO at 25°C, (b) Ni doped BiO at 25°C.
FTIR Analysis results
Figure 5 shows the FTIR spectrum of BiO and Ni-doped BiO, BiO powder synthesized under laboratory conditions. The peak between 400 and 700 cm-1 give the information of Bi–O and Ni–Bi–O on the FTIR spectra. The peak at 437–455 cm-1 give the information about stretching vibration of crystalline hexagonal zinc oxide (Bi–O stretching, vibration) and the peaks from 902 to 1020 cm-1 are attributed to the bond between lanthanum and oxygen (Ni–O). The broad peak between 3400 to 3900 cm-1 indicate the OH groups, due to the H2O which indicates the existence of atmospheric H2O adsorbed on the surface of nanocrystalline powder. An absorption band and a peak have been observed at 2350 cm-1, respectively, which arises from the absorption of atmospheric CO2 on the metal cations.
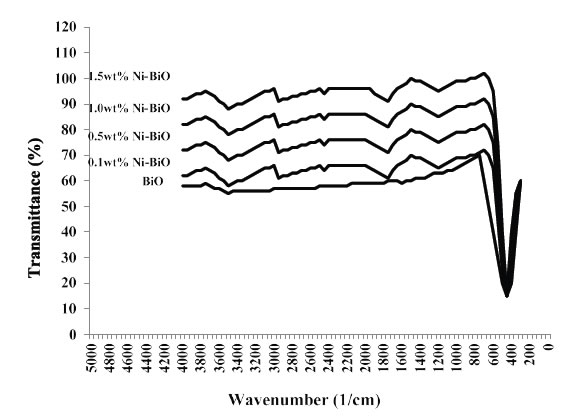
Figure 5. FTIR Spectra of pure BiO and Ni-doped BiO nanoparticles, with different concentration of dopant
Results and Discussions
Effect of increasing Ni-BiOnanocomposite concentrations on the removals of TW pollutants
The effects of increasing Ni-BiO nanocomposite concentrations (1 mg/L, 5 mg/L, 15 mg/L, 30 mg/L and 45 mg/L), on the photocatalytic oxidation of polutant parameters in the TW was investigated. The preliminary studies showed that the maximum removal of COD with 20 mg/L Ni-BiO nanocomposite was 89% with 70 min photooxidation time at pH=7.8 with 40 W UV power (Data not shown). Based on these yields the operational conditions for photocatalytic time were choosen as 60 min at a power of 50 W and at a pH of 8. The maximum photocatalytic oxidation removals for all pollutants in the TW were observed at 30 mg/L Ni-BiO nanocomposite concentrations, at pH=8.0, after 60 min photooxidation time and at 25°C at a power of 50 W (Figure 6). Removal efficiencies slightly decreased at 45 mg/L Ni-BiO nanocomposite concentration, because over load of surface area of Ni-BiO nanocomposites (Figure 6). This limiting the power of UV irradiation. Lower photo-removal efficiencies was measured for 1, 5, and 15 mg/L Ni-BiO concentrations due to low surface areas in the nanocomposite. On the contrarily, the surface area is high at 30 mg/L Ni-BiO nanocomposite concentrations. Therefore, the maximum photodegradation yield was observed in this nanocomposite concentration. The CODtotal, CODinert, total flavonols, total aromatic amines and color removals increased linearly as the Ni-BiO nanocomposite concentrations were increased from 1 mg/L up to 5 mg/L, to 15 mg/L, and up to 30 mg/L, respectively (Table 2 and Figure 6). Furher increase of nanocomposite concentration to 45 mg/L affect negatively the all the pollutant yields. The reason for this is the optimum amount of catalyst increases the number of active sites on the photocatalyst surface, which in turn increase the number of OH● and superoxide radicals (O2– ●) to degrade pollutant parameters (COD components, flavonols, polyaromatics, color). When the concentration of the catalyst increases above the optimum value, the degradation decreases due to the interception of the light by the suspension [32]. reported that as the excess catalyst (turbidity) prevent the illumination of light, OH●, a primary oxidant in the photocatalytic system decreased and the efficiency of the degradation reduced accordingly. Furthermore, the increase in catalyst concentration beyond the optimum may result in the agglomeration of catalyst particles; hence, the part of the catalyst surface becomes unavailable for photon absorption, and thereby, photocatalytic oxidation efficiency decreases [33]. Maximum CODtotal, CODinert, total flavonols, TAAs and color removal efficiencies were obtained after 60 min photooxidation process with yields of 99%, 92%, 91%, 98% and 99%, respectively, at pH=8.0, at 30 mg/L Ni-BiO nanocomposite concentration at 50 W power and at 25°C (Figure 6). Flavonols such as kaempferol, quercetin, patuletin, rhamnetin, rhamnazin removal efficiencies were 87%, 88%, 90%, 87% and 85% respectively, after 60 min photooxidation time, at pH=8.0, at 30 mg/L Ni-BiO nanocomposite concentration and at 25°C temperature (Table 2). Polyaromatic amines such as, 2-methoxy-5-methylaniline, 2,4-diaminoanisole, 4,40-diamino diphenyl ether, o-aminoazotoluene, 4-aminoazobenzol removal efficiencies after photooxidation process were 93%, 95%, 87%, 84% and 82%, respectively, after 60 min photooxidation time, at pH=8.0, at 30 mg/L Ni-BiO nanocomposite concentration at 50 W UV power and at 25°C (Table 2).
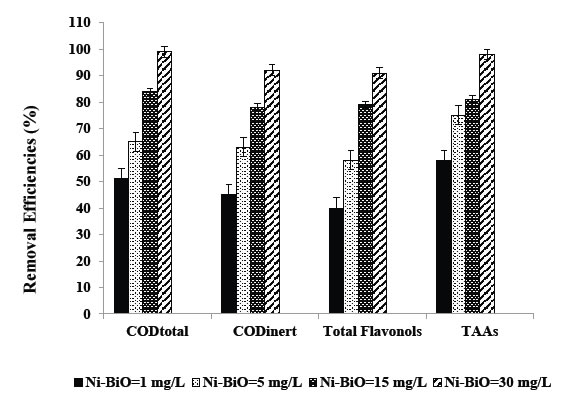
Figure 6. Removal efficiencies of CODtotal, CODinert, total flavonols and TAAs at Ni-BiO=1 mg/L, BiO=5 mg/L, BiO=15 mg/L and BiO=30 mg/L.
Table 2. Effect of increasing Ni-BiO nanocomposite concentrations on the TW during photooxidation process after 60 min, at 50 W UV irradiation, at pH=8.0, at 25°C.
|
Parameters |
Removal efficiencies (%) |
|||||
|
Ni-BiO concentrations (mg/L) |
||||||
|
1 |
5 |
15 |
30 |
45 |
||
|
CODtotal |
51 |
65 |
84 |
99 |
79 |
|
|
CODinert |
45 |
63 |
78 |
92 |
76 |
|
|
CODdissolved |
50 |
64 |
82 |
98 |
80 |
|
|
Color |
62 |
69 |
85 |
99 |
83 |
|
|
Total flavonols |
40 |
58 |
79 |
91 |
72 |
|
|
Flavonols |
|
|
|
|
|
|
|
Kaempferol |
35 |
57 |
72 |
87 |
65 |
|
|
Quercetin |
36 |
61 |
73 |
88 |
67 |
|
|
Patuletin |
37 |
62 |
79 |
90 |
74 |
|
|
Rhamnetin |
38 |
56 |
72 |
87 |
64 |
|
|
Rhamnazin |
34 |
53 |
71 |
85 |
66 |
|
|
TAAs |
58 |
75 |
81 |
98 |
77 |
|
|
Polyaromatics |
|
|
|
|
|
|
|
2-methoxy-5-methylaniline |
55 |
66 |
83 |
93 |
79 |
|
|
2,4-diaminoanisole |
54 |
71 |
79 |
95 |
73 |
|
|
4,40-diamino diphenyl ether |
52 |
58 |
68 |
87 |
63 |
|
|
o-aminoazotoluene |
49 |
65 |
75 |
84 |
72 |
|
|
4-aminoazobenzol |
47 |
62 |
76 |
82 |
70 |
|
Kaempferol metabolies such as, 3-O-[2-O,6-O-bis(α-L-rhamnosyl)-( β-D-glucosyl] quercetin, 3-O-[6-O-(α-L -rhamnosyl)-( β-D- glucosyl]quercetin, 3-O-{2-O-[6-O-(p-hydroxy-trans-cinnamoyl)-{ )-, β-D-glucosyl]- á-L-rhamnosyl}kaempferol decreased from 5.7 mg/L to 0.86 mg/L, from 5.7 mg/L to 1.08 mg/L, from 5.7 mg/L to 1.25 mg/L, respectively, after 60 min photooxidation time, at pH=8.0, at 30 mg/L Ni-BiO nanocomposite concentration at 50 W UV power and at 25°C (Table 3). Quercetin metabolites such as, 3-O-[6-O-( α-L -rhamnosyl)- )-(β-D-glucosyl]quercetin, 3-O-{2-O-[6-O-(p-hydroxy-trans-cinnamoyl)-( β-D -glucosyl]– á-L-rhamnosyl}quercetin reduced from 9.2 mg/L to 1.28 mg/L, from 9.2 mg/L to 2.30 mg/L, respectively, after 60 min photooxidation time, at pH=8.0, at 30 mg/L Ni-BiO nanocomposite concentration at 50 W UV power and at 25°C (Table 3). Patuletin metabolites such as, (E)-ascladiol, (Z)-ascladiol dropped off from 10.3 mg/L to 1.55 mg/L, from 10.3 mg/L to 1.85, respectively, after 60 min photooxidation time, at pH=8.0, at 30 mg/L Ni-BiO nanocomposite concentration at 50 W UV power and at 25°C (Table 3). Rhamnetin metabolites such as, methyl quercetin, tetrahydroxy-7-methoxyflavone decreased from 7.2 mg/L to 1.15 mg/L, from 7.2 mg/L to 1.44 mg/L, respectively, after 60 min photooxidation time, at pH=8.0, at 30 mg/L Ni-BiO nanocomposite concentration at 50 W UV power and at 25°C (Table 3). Rhamnazin metabolites such as, Rhamnazin-3-0-β-D-glucopyranosyl-(l →5)- α-L-arabinofuranoside, Rhamnazin-3-O-β-D- glucopyranosyl-(l—»5)-[β-D-apiofuranosyl-(-1→2)]-α -L-arabinofuranoside reduced from 6.5 mg/L to 1.42 mg/L, from 6.5 mg/L to 1.66 mg/L, respectively, after 60 min photooxidation time, at pH=8.0, at 30 mg/L Ni-BiO nanocomposite concentration at 50 W UV power and at 25°C (Table 3).
Table 3. The metabolites of flavonols in the TW.
|
Flavonoids |
Flavonoids metabolites |
Influent concentrations (mg/L) |
Effluent Concentrations (mg/L) |
Removal efficiencies (%) |
|
Kaempferol |
3-O-[2-O,6-O-bis(α-L-rhamnosyl)-( ß-D-glucosyl]-quercetin |
5.7 |
0.86 |
85 |
|
|
3-O-[6-O-(α-L -rhamnosyl)-( ß-D- glucosyl]quercetin |
5.7 |
1.08 |
81 |
|
|
3-O-{2-O-[6-O-(p-hydroxy-trans-cinnamoyl)-{ )-, ß-D-glucosyl]- á-L-rhamnosyl}kaempferol |
5.7 |
1.25 |
78 |
|
Quercetin |
3-O-[6-O-(α-L -rhamnosyl)- )-( ß-D-glucosyl]quercetin |
9.2 |
1.28 |
86 |
|
|
3-O-{2-O-[6-O-(p-hydroxy-trans-cinnamoyl)-( ß-D -glucosyl]– á-L-rhamnosyl}quercetin |
9.2 |
2.30 |
75 |
|
Patuletin |
(E)-ascladiol |
10.3 |
1.55 |
85 |
|
|
(Z)-ascladiol |
10.3 |
1.85 |
82 |
|
Rhamnetin |
Methyl quercetin |
7.2 |
1.15 |
84 |
|
|
Tetrahydroxy-7-methoxyflavone |
7.2 |
1.44 |
80 |
|
Rhamnazin |
Rhamnazin-3-0-ß-D-glucopyranosyl-(l →5)-α-L- |
6.15 |
1.42 |
77 |
|
|
Rhamnazin-3-O-ß-D- glucopyranosyl-(l—»5)-[ß-D-apiofuranosyl-(-1→2)]-α -L-arabinofuranoside |
6.15 |
1.66 |
73 |
2-methoxy-5-methylaniline metabolite such as, 5-nitro-o-toluidine decreased from 134.6 mg/L to 36.34, after 60 min photooxidation time, at pH=8.0, at 30 mg/L Ni-BiO nanocomposite concentration at 50 W UV power and at 25°C (Table 4). 2,4-diaminoanisole such as, 4-acetylamino-2-aminoanisole, 2,4-diacetylaminoanisole reduced from 275.8 mg/L to 22.06 mg/L, from 275.8 mg/L to 38.61 mg/L, respectively, after 60 min photooxidation time, at pH=8.0, at 30 mg/L Ni-BiO nanocomposite concentration at 50 W UV power and at 25°C (Table 4). 4,40-diamino diphenyl ether metabolites such as, N,NI-diacetyl-4,4I-diaminobenzhydrol, N,NI-diacetyl-4,4 I –diaminophenylmethane dropped off from 156 mg/L to 28.08 mg/L, from 156 mg/L to 40.56 mg/L, respectively, after 60 min photooxidation time, at pH=8.0, at 30 mg/L Ni-BiO nanocomposite concentration at 50 W UV power and at 25°C (Table 4). o-aminoazotoluene metabolites such as, hydroxy-OAT (I), 4′-hydroxy-OAAT, 2′-hydroxymethyl-3-methyl-4-aminoazobenzene, 4, 4′-bis(otolylazo)-2, 2′ -dimethylazoxybenzene decreased from 293.6 mg/L to 58.72 mg/L, from 293.6 mg/L to 79.27 mg/L, from 293.6 mg/L to 85.14 mg/L, from 293.6 mg/L to 117.44 mg/L, respectively, after 60 min photooxidation time, at pH=8.0, at 30 mg/L La-ZnO nanocomposite concentration at 50 W UV power and at 25°C (Table 4). 4-aminoazobenzol metabolites such as phenylhydroxylamine, nitrosobenzol reduced from 178 mg/L to 39.16 mg/L, from 178 mg/L to 44.5 mg/L, respectively, after 60 min photooxidation time, at pH=8.0, at 30 mg/L Ni-BiO nanocomposite concentration at 50 W UV power and at 25°C (Table 4).
Table 4. The metabolites of polyaromatic amines in the TW.
|
Polyaromatic amines |
Polyaromatic amines metabolites |
Influent concentrations (mg/L) |
Effluent Concentrations (mg/L) |
Removal efficiencies (%) |
|
2-methoxy-5-methylaniline |
5-nitro-o-toluidine |
134.6 |
36.34 |
87 |
|
2,4-diaminoanisole |
4-acetylamino-2-aminoanisole |
275.8 |
22.06 |
92 |
|
|
2,4-diacetylaminoanisole |
275.8 |
38.61 |
86 |
|
4,40-diamino diphenyl ether |
N,NI-diacetyl-4,4I-diaminobenzhydrol |
156 |
28.08 |
82 |
|
|
N,NI-diacetyl-4,4 I -diaminophenylmethane |
156 |
40.56 |
74 |
|
o-aminoazotoluene |
hydroxy-OAT (I) |
293.6 |
58.72 |
80 |
|
|
4′ -hydroxy-OAAT |
293.6 |
79.27 |
73 |
|
|
2′ -hydroxymethyl-3-methyl-4-aminoazobenzene |
293.6 |
85.14 |
71 |
|
|
4, 4′-bis(otolylazo)-2, 2′ -dimethylazoxybenzene |
293.6 |
117.44 |
60 |
|
4-aminoazobenzol |
Phenylhydroxylamine |
178 |
39.16 |
78 |
|
|
Nitrosobenzol |
178 |
44.5 |
75 |
[34] researched the photocatalytic activity of pure and Ni+2-doped BiO samples for the degradation of Rhodamine B (RhB). The effect of Ni+2 doping concentration on the photocatalytic activity of RhB wasalso investigated. 9 g/L Ni+2-doped BiO with a mass ratio of 2wt% had high photocatalytic efficiency [34]. 4-nitrophenol degradation was studied in the presence of Ni doped BiO nanoparticles with a Ni mass ratio of 4% [35]. 78.26% 4-nitrophenol removal was observed the aforementioned nanocomposite after 195 min photodegradation time and at 30 W UV light irradiation at pH=8 [35]. 68.57% Acid Yellow 29 55% Coomassie Brilliant Blue G250 and 37.27% Acid Green 25 degradations was obtained after 120 min of irradiation in the presence of 0.9% Ni-doped BiO, at 500 W UV light irradiation, under atmospheric oxygen, at 25°C, respectively [36]. The color and pollutant yields obtained in our study exhibited higher yields compared to the studies given above with low Ni-BiO nanocomposite concentrations.
Effect of increasing Ni mass ratios on 30 mg/L Ni doped BiO nanocomposite for photodegradation of TW pollutants
Were researched the effects of different La mass ratios (0.5wt%, 1wt%, 1.5wt% and 2wt% ) in 30 mg/L Ni-BiO nanocomposite concentrations on the photooxidation yields of all pollutants in the TW during photooxidation experiments. Maximum CODtotal, CODinert, total flavonols, TAAs and color removal efficiencies were 99%, 92%, 91%, 98% and 99%, respectively, after 60 min photooxidation time, at pH=8.0, at 1.5wt% Ni mass ratio and at 25°C (Table 5 and Figure 7). Removal efficiencies increased as the Ni mass ratio in the Ni doped BiO nanocomposite were increased from 0.5wt% to 1wt% and to 1.5wt%. Maximum removal efficiencies was measured at 1.5wt% Ni mass ratio in the nanocomposite. The photocatalytic degradation efficiency of BiO nanoparticles increases with an increase in the Ni loading and shows a maximum activity at 1.5 wt%. Then decreases in photooxidation yield was observed on further Ni doping (to 2 wt%). The reason of this can be explained as follows: excessive amounts of dopants can retard the photocatalysis process, because excess amount of dopants deposited on the surface of BiO increases the recombination rate of free electrons and energized holes, thus inhibiting the photodegradation process. Hence, further increase in Ni doping to 2wt% results in the decrease of photocatalytic degradation efficiency.
Table 5. Effect of increasing Ni mass ratios on the TW during photooxidation process after 60 min, at 50 W UV irradiation, 30 mg/L Ni-BiO nanocomposite concentrations, at pH=8.0, at 25°C.
|
Parameters |
Removal efficiencies (%) |
|||
|
Ni mass ratios (%) |
||||
|
0.5wt% |
1wt% |
1.5wt% |
2wt% |
|
|
CODtotal |
46 |
71 |
99 |
80 |
|
CODinert |
40 |
69 |
92 |
74 |
|
CODdissolved |
45 |
70 |
98 |
78 |
|
Color |
57 |
76 |
99 |
81 |
|
Total flavonols |
35 |
64 |
91 |
75 |
|
Flavonols |
|
|
|
|
|
Kaempferol |
30 |
63 |
87 |
68 |
|
Quercetin |
31 |
67 |
88 |
69 |
|
Patuletin |
32 |
68 |
90 |
75 |
|
Rhamnetin |
33 |
62 |
87 |
68 |
|
Rhamnazin |
30 |
60 |
85 |
67 |
|
TAAs |
53 |
81 |
98 |
77 |
|
Polyaromatics |
|
|
|
|
|
2-methoxy-5-methylaniline |
50 |
72 |
93 |
69 |
|
2,4-diaminoanisole |
49 |
77 |
95 |
75 |
|
4,40-diamino diphenyl ether |
47 |
64 |
87 |
64 |
|
o-aminoazotoluene |
44 |
71 |
84 |
70 |
|
4-aminoazobenzol |
41 |
70 |
82 |
66 |
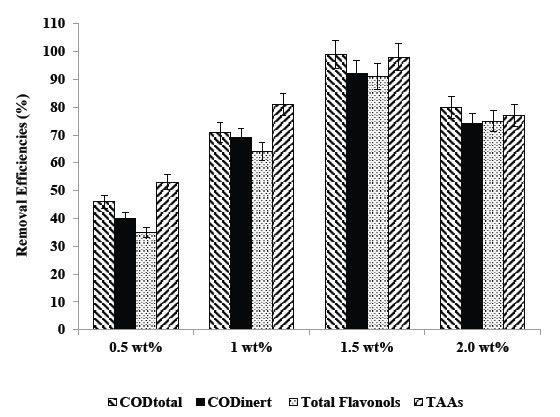
Figure 7. Removal efficiencies of CODtotal, CODinert, total flavonols and TAAs at 0.5wt%, 1wt%, 1.5wt%, and 2 wt% Ni mass ratio.
The synthesized Ni-doped BiO catalyst possesses smaller particle size distribution than pure BiO nanoparticles. Apart from their small size, as Ni+2 was doped in BiO, more surface defects are produced as reported by [37]. Consequently, the migration of the photo-induced electrons and holes toward surface defects is reasonable [37]. Thus, the separation efficiency of the electron–hole pairs of Ni-doped BiO with more oxygen defects should be more than that of the pure BiO nanoparticles. Therefore, the enhancement in the photocatalytic degradation efficiency of Ni doping BiO increases due to small particle size and higher defect concentration compared to BiO alone.
UV absorbances of Ni-doped BiO
The UV–vis absorption spectra of BiO and Ni-doped BiO are shown in Figure 8. It can be clearly seen from Figure 8. The maximum absorbance shifts is 410 nm for pure nano BiO while the maximum absorbance of Ni-doped BiO with a Ni mass ratio 0.5wt% is observed at a wavelentgh of 380 nm. The wave of absorbance of Ni-doped BiO also increases gradually with increasing the Ni loading and is much higher as compared to that of pure BiO. This could be mainly attributed to the quantum size effect as well as the strong interaction between the surface oxides of Bi and Ni. These observations strongly suggest that the Ni doping significantly affects the absorbance properties.
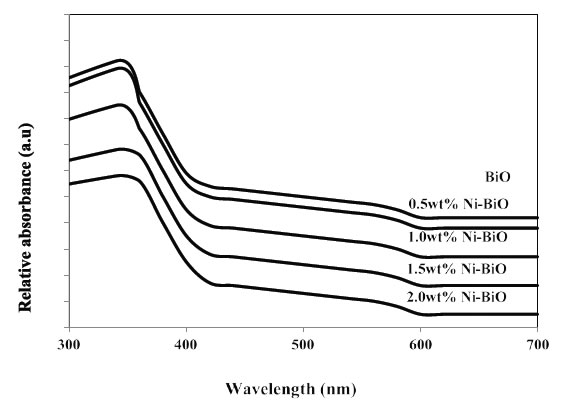
Figure 8. UV-vis absorption spectra of Ni doped BiO catalysts
The strong UV band gap emission (375–395 nm) results from the radiative recombination of an excited electron in the conduction band with the valence band hole. The broad visible or deep-trap state emissions (410–440 nm and 540–580 nm) are commonly defined as the recombination of the electron-hole pair from localized states with energy levels deep in the band gap, resulting in lower energy emission. These deep-trap emissions indicate the presence of defects or oxygen vacancies of BiO nanostructures [38]. Since the band gap excitation of electrons in BiO or Ni-doped BiO with 254 nm can promote electrons to the conduction band with high kinetic energy, they can reach the solid-liquid interface easily, suppressing electron–hole recombination in comparison with 365 nm. Hence, the observation of low rate at 254 nm is therefore unexpected [39]. The UV band gap emission of Ni-doped BiO nanostructures was increased between 380 and 410 nm after the photocatalytic process of pollutant parameters. The results show that 1.5 wt% Ni-doped BiO has maximum activity as compared to other photocatalysts.
Effect of increasing photooxidation time on the photooxidation yields of pollutants in the TW
Six different photooxidation times (5 min, 15 min, 30 min, 60 min, 80 min and 100 min) was examined during photocatalytic oxidation of the pollutants in the TW. To determine the optimum time for maximum removals these pollutant parameters in the TW. The maximum photocatalytic oxidation removals was observed at 60 min photooxidation time, at pH=8.0 using 30 mg/L Ni doped BiO with a La mass ratio of 1.5wt% at an UV power of 50 W (Figure 9). The removals of CODtotal, CODinert, total flavonols, total aromatic amines and color were found to increase linearly with increase in retention time from 5 min up to 80 min. A further increase in retention time to and 100 min lead to a decrease in yields of pollutant parameters. In other words the removal efficiencies of pollutant parameters (COD components, flavonols, polyaromatics, color) decreased for photooxidation time > 60 min since at long irradiation times since the surface energy of Ni doped – BiO decreases [40]. The photooxidation can form small molecules such as H2O, carbonmonoxide (CO), CO2 and benzene etc. after long irradiation; it will lead to the decrease of the polar groups and the oxygen content of pollutant surface. The dispersive component of surface energy, the density of polymer surface has great influence on dispersivity of pollutants in the TW. However, the rate of photodegradation of Ni doped-BiO blends increases with the increase of irradiation time, and is higher than that of photocrosslinking after long irradiation time, leading to the decrease of the density of the polymer surface and the dispersivity of COD, dyes and other pollutants to Ni doped–BiO [41]. The photooxidation can form small molecules such as H2O, CO, CO2 and benzene etc. after long irradiation; it will lead to the decrease of the polar groups and the oxygen content of polymer surface, therefore the dispersivity decreaeses resulting in low photooxidation yields [41]. Aromatic and phenolic metabolites which would adsorb strongly onto titania surface and block significant part of photoreactive sites.
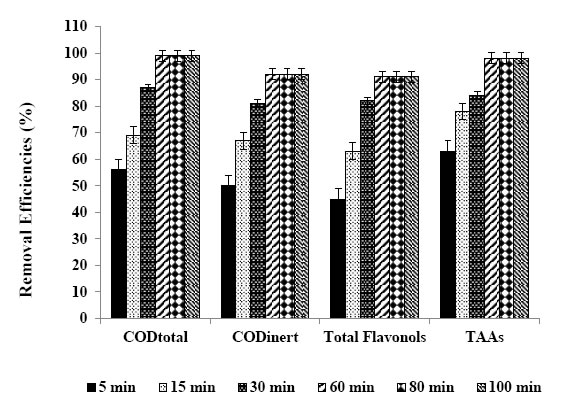
Figure 9. Removal efficiencies of CODtotal, CODinert total flavonols and TAAs after 5, 15, 30, 60, 80 and 100 min retention times.
The maximum CODtotal, CODinert, total flavonols, total aromatic amines and color removal efficiencies were 99%, 92%, 91%, 98% and 99%, respectively, after 60 min photooxidation time, at 1.5 wt% Ni mass ratio in 30 mg/L Ni-BiO nanocomposite concentration, at pH=8.0 and at 25°C under 50 W irradiation (Table 6). Also, flavonols such as kaempferol, quercetin, patuletin, rhamnetin, rhamnazin removal efficiencies were 87%, 88%, 90%, 87% and 85%, respectively (Table 6). The photooxidation removals of polyaromatic amines such as, 2-methoxy-5-methylaniline, 2.4-diaminoanisole, 4.40-diamino diphenyl ether, o-aminoazotoluene, 4-aminoazobenzol were 93%, 95%, 87%, 84% and 82%, respectively, after 60 min at pH=8.0 and at 25°C (Table 6). Kaempferol, quercetin, patuletin, rhamnetin, rhamnazin concentrations decreased from 5.7 to 0.741 mg/L, from 9.2 to 1.104 mg/L, from 10.3 to 1.03 mg/L, from 7.2 to 0.936 mg/L, from 6.15 to 0.923 mg/L, respectively. 2-methoxy-5-methylaniline, 2.4-diaminoanisole, 4.40-diamino diphenyl ether, o-aminoazotoluene, 4-aminoazobenzol concentrations decreased from 134.6 to 9.422 mg/L, from 275.8 to 13.79 mg/L, from 156 to 5.46 mg/L, from 293.6 to 10.28, from 178 to 6.23 mg/L, respectively.
Table 6. Effect of increasing photooxidation time on the TW during photooxidation process, at 50 W UV irradiation, at pH=8.0, 30 mg/L Ni-BiO nanocomposite concentrations, 1.5 wt% Ni mass ratio, at 25°C.
|
Parameters |
Removal efficiencies (%) |
|||||
|
5 |
15 min |
30 |
60 |
80 |
100 min |
|
|
CODtotal |
56 |
69 |
87 |
99 |
99 |
99 |
|
CODinert |
50 |
67 |
81 |
92 |
92 |
92 |
|
CODdissolved |
55 |
68 |
85 |
98 |
98 |
98 |
|
Color |
67 |
74 |
88 |
99 |
99 |
99 |
|
Total flavonols |
45 |
63 |
82 |
91 |
91 |
91 |
|
Flavonols |
|
|
|
|
|
|
|
Kaempferol |
40 |
61 |
75 |
87 |
86 |
86 |
|
Quercetin |
41 |
65 |
77 |
88 |
86 |
85 |
|
Patuletin |
41 |
66 |
81 |
90 |
89 |
89 |
|
Rhamnetin |
43 |
61 |
74 |
87 |
85 |
84 |
|
Rhamnazin |
39 |
58 |
72 |
85 |
84 |
84 |
|
TAAs |
63 |
78 |
84 |
98 |
98 |
98 |
|
Polyaromatics |
|
|
|
|
|
|
|
2-methoxy-5-methylaniline |
60 |
71 |
86 |
93 |
93 |
92 |
|
2,4-diaminoanisole |
59 |
75 |
82 |
95 |
94 |
94 |
|
4,40-diamino diphenyl ether |
57 |
62 |
71 |
87 |
79 |
78 |
|
o-aminoazotoluene |
55 |
69 |
78 |
84 |
82 |
80 |
|
4-aminoazobenzol |
51 |
62 |
75 |
82 |
81 |
79 |
The color yields obtained in this study for TW are higher than the studies given below: [42] investigated the effects of Bi0.95Ni0.05O and Bi0.90Ni0.10O on the treatment of Methylene Blue (MB) dyestuff removal under 18 UV irradiation for 1 h. 81% color yields were observed for the aforementioned Ni-Bi-O nanocomposites, respectively [42]. [43] found 80% color yields based on Reactive Black 5 after 60 min irradiation time under 90 W irradiation using Bi-Ni nanocomposite.
Effect of increasing UV powers on the yields of pollutants in the TW
In this study, four UV light powers were used (10 W, 30 W, 50 W and 100 W) to detect the optimum UV irradiation power for maximum photo-removal of the pollutant parameters in the TW using 30 mg/L Ni doped BiO nanocomposite with a Ni mass ratio of 1,5%w. The maximum photocatalytic oxidation removals was observed at 50 W UV light irradiation, at pH=8.0, after 30 min photooxidation time and at 25°C (Table 7 and Figure 10). The CODtotal, CODinert total flavonols, total aromatic amines and color were found to increase linearly with increase in UV light irradiation from 10 W, up to 30 W, up to 50 W, respectively (Table 7 and Figure 10). Further increase of UV power up to 100 W did not affect positively the pollutant yields. Maximum CODtotal, CODinert, total flavonols, TAAs and color removal efficiencies after photooxidation process were 99%, 92%, 91%, 98% and 99%, respectively, for the aforementioned operational conditions (Figure 10). Flavonols such as kaempferol, quercetin, patuletin, rhamnetin, rhamnazin removal efficiencies were 87%, 88%, 90%, 87% and 85%, respectively, after 60 min photooxidation time, at 50 W UV light, at pH=8.0, at 30 mg/L Ni-BiO nanocomposite concentration and at 25°C (Table 7). Polyaromatic amines such as, 2-methoxy-5-methylaniline, 2, 4-diaminoanisole, 4, 40-diamino diphenyl ether, o-aminoazotoluene, 4-aminoazobenzol removal efficiencies after photooxidation process were 93%, 95%, 87%, 84% and 82%, respectively (Table 7).
Table 7. Effect of increasing UV light irradiations on the TW during photooxidation process after 60 min, at 30 mg/L Ni-BiO photocatalyst concentration, at pH=8.0, at 25°C.
|
Parameters |
Removal efficiencies (%) |
|||
|
UV light irradiation |
||||
|
10 W |
30 W |
50 W |
100 W |
|
|
CODtotal |
49 |
82 |
99 |
97 |
|
CODinert |
43 |
76 |
92 |
90 |
|
CODdissolved |
48 |
81 |
98 |
96 |
|
Color |
60 |
83 |
99 |
99 |
|
Total flavonols |
38 |
76 |
91 |
90 |
|
Flavonols |
|
|
|
|
|
Kaempferol |
33 |
70 |
87 |
87 |
|
Quercetin |
34 |
71 |
88 |
86 |
|
Patuletin |
35 |
78 |
90 |
89 |
|
Rhamnetin |
36 |
70 |
87 |
87 |
|
Rhamnazin |
33 |
71 |
85 |
85 |
|
TAAs |
56 |
79 |
98 |
96 |
|
Polyaromatics |
|
|
|
|
|
2-methoxy-5-methylaniline |
53 |
81 |
93 |
92 |
|
2,4-diaminoanisole |
52 |
77 |
95 |
93 |
|
4,40-diamino diphenyl ether |
50 |
66 |
87 |
86 |
|
o-aminoazotoluene |
47 |
73 |
84 |
81 |
|
4-aminoazobenzol |
45 |
71 |
82 |
80 |
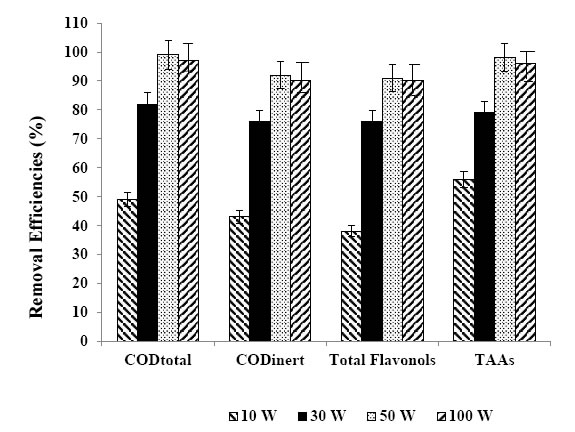
Figure 10. Removal efficiencies of CODtotal, CODinert, total flavonols and TAAs at 10 W, 30 W, 50 W and at 100 W.
The UV power determines the extent of light absorption by the semiconductor catalyst at a given wavelength. During initiation of photocatalysis, electron–hole formation in the photochemical reaction is strongly dependent on the optimum light intensity [44]. In this study, as the UV power increase from 10 W up to 50 W might favor a high-level surface defects, which account for the increase in the defect emission relative to the UV emission as reported by [39]. Higher UV powers > 50 W decrease the defects in the surface of the nanoparticle by disturbing the active holes.
Effect of increasing pH values on the pollutant yields in the TW
The effects of increasing pH values (4.0, 6.0, 8.0 and 10.0) on the photocatalytic oxidation of polutant parameters in TW was examined by considering the solubility of BiO nanoparticles in acidic as well as in highly basic solutions. The maximum photocatalytic oxidation removals was obtained at pH=8.0, after 60 min photooxidation time with a Ni mass ratio 1.5wt% using 30 mg/L Ni-BiO nanocomposite concentration at 50 W UV power (Table 8 and Figure 11). In acidic medium, less photocatalytic degradation of pollutant parameters (COD components, flavonols, polyaromatics, color) was observed. The extent of photocatalytic degradation of polutant parameters was found to increase with increase in initial pH to 8.0 and a decrease in maximum photocatalytic degradation was found at pH 10. The possible explanation of this is that the pH at zero point charge (zpc) of BiO is 9.0 ± 0.3 [45]. Below pH 8.0, active sites on the positively charged catalyst surface are preferentially covered by pollutant molecules. Thus, surface concentration of the polutant parameters (COD components, flavonols, polyaromatics, color) is relatively high, while those of OH– and OH● are low. Hence, photocatalytic degradation decreases at acidic pH. On the other hand, above pH 8.0, catalyst surface is negatively charged by means of metal-bound OH–, consequently the surface concentration of the polutant parameters (COD components, flavonols, polyaromatics, color) is low, and OH● is high. In addition, polutant parameters are not protonated above pH 8.0. The electrostatic repulsion between the surface charges and Ni doped BiO nanocomposite hinders the amount of polutant parameters and the adsorption, consequently surface concentration of the polutant parameters decreases, which results in the decrease of photocatalytic degradation at pH 10.0. In conclusion, pH 8.0 can provide moderate surface concentration of polutant parameters which react with the holes to form OH●.
Table 8. Effect of increasing pH values on the TW during photooxidation process, at 50 W UV irradiation, after 60 min, at 25°C.
|
Parameters |
Removal efficiencies (%) |
|||
|
pH values |
||||
|
pH=4.0 |
pH=6.0 |
pH=8.0 |
pH=10.0 |
|
|
CODtotal |
53 |
74 |
99 |
72 |
|
CODinert |
47 |
72 |
92 |
70 |
|
CODdissolved |
52 |
73 |
98 |
71 |
|
Color |
64 |
79 |
99 |
77 |
|
Total flavonols |
42 |
68 |
91 |
66 |
|
Flavonols |
|
|
|
|
|
Kaempferol |
37 |
66 |
87 |
64 |
|
Quercetin |
38 |
70 |
88 |
68 |
|
Patuletin |
39 |
71 |
90 |
69 |
|
Rhamnetin |
40 |
66 |
87 |
64 |
|
Rhamnazin |
45 |
62 |
85 |
60 |
|
TAAs |
60 |
83 |
98 |
81 |
|
Polyaromatics |
|
|
|
|
|
2-methoxy-5-methylaniline |
57 |
76 |
93 |
74 |
|
2,4-diaminoanisole |
56 |
80 |
95 |
78 |
|
4,40-diamino diphenyl ether |
54 |
67 |
87 |
65 |
|
o-aminoazotoluene |
52 |
74 |
84 |
72 |
|
4-aminoazobenzol |
50 |
65 |
82 |
63 |
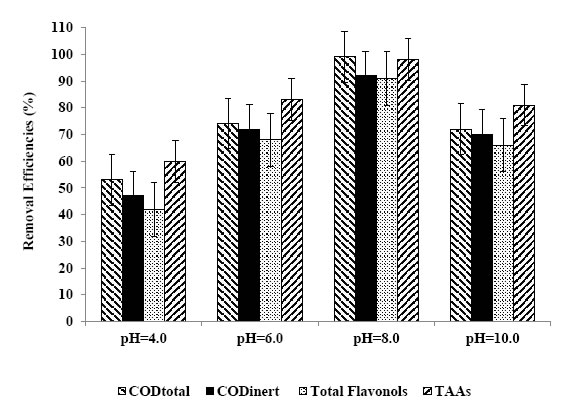
Figure 11. Removal efficiencies of CODtotal, CODinert, total flavonols and TAAs at pH=4.0, pH=6.0, pH=8.0, pH=10.0.
Photocatalytic oxidation mechanisms of Ni doped BiOnanocomposite
The higher activity of Ni doped BiO can beattributed to successful e−–h+ separation and production of ●O2− and OH●. Ni-modified BiO sample manifests the highest efficiency, which may be explained by the highest number of O2 vacancies (related to the different charge and electronegativity of Ni and Bi ions) and as a result of stronger adsorption of OH−ions onto the BiO surface [46]. This favors the formation of OH● by reaction of hole and OH−. The OH● and photogenerated ●O2−has extremely strong non-selective oxidants lead to the degradation of the organic pollutant at the surface of Ni modified BiO [41]. The photocatalytic degradation mechanism starts with the illumination of BiO nanoparticles and production of electron–hole pairs in Eq. (2):
![]()
Major roles of metal ions in this study are to increase the concentration of BiO on the surface of the catalyst and to prolong the individual life-time of electrons and holes and hence, inhibit their recombination. The ability of Ni+3 to scavenge photogenerated electrons is as follows: (Eq. 3):
![]()
However, stabilities of Ni+3 ions may be disturbed in their reduced forms (Ni+2). This can be achieved by transferring the trapped electron to O2 [Eq. (4)]:
![]()
The produced O2−● is responsible from the generation of OH●, known as highly reactive electrophilic oxidants [Eqs. (5-7)]:

In the meantime, photogenerated holes may react with H2O molecules and produce OH● (Eq. 8):
![]()
The color removal by photooxidation of dyes reactions were given in Eqs (9-14):
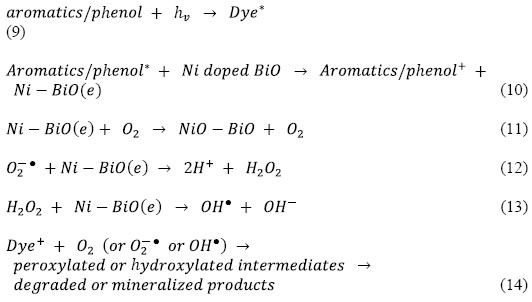
Thus, loading of metal ions such as Ni on the surface of BiO matrix can suppress the recombination of photoinduced charge carriers either with only electron capture ability or with steps forward to produce OH●. For Ni–BiO, electron accepting ability, production of more OH●, the highest surface roughness value and the higher dark adsorption capacity result in pronounced photoactivity. The decay profile of the products includes the subsequent attacks of OH●, known as highly reactive electrophilic oxidants. The main reaction pathway (60% of OH●) is the addition of the OH● to the double bond of the azo group, resulting in the rapid disappearance of color; however, addition to the aromatic ring also occurs (40% of OH●) [47, 48]. Further OH● attacks and the increment in OH● concentration in the solution increase the yield of OH–adduct in the degradation progress of each product. The opening of the dye aromatic rings due to consecutive oxidation reactions leads to low-molecular weight compounds [49].
Photonic efficiency of Ni doped BiO
In order to evaluate the relative photonic efficiency (Ir), a solution of MCP (40 mg/L) adjusted to pH 10 was irradiated with 100 mg BiO (Merck) and Ni-doped BiO, separately. The relative photonic efficiencies of light of wavelengths 254 and 365 nm for BiO and Ni-doped BiO are presented in Table 9. For comparison, the relative photonic efficiency of TiO2 is also presented in Table 9. The relative photonic efficiencies of Ni-doped BiO are greater as compared to those of BiO and TiO2, revealing the effectiveness of metal-doped systems. It is also interesting to note that the relative photonic efficiency for Ni-doped BiO for light of wavelength 254 nm are much higher as compared to that for 365 nm. The results are in good agreement with degradation and mineralization studies. Comparing the high efficiency of Ni doped BiO catalysts with standard BiO and TiO2 catalyst, the photocatalytic efficiency of 1.5 wt% Ni-doped BiO is higher as compared to that of BiO and TiO2 and other Ni doped BiO nanacomposites.
Table 9. Comparison of relative photonic efficiencies in the photodegradation of pollutants in TW by BiO and Ni-doped BiO photocatalysts (*)
|
Parameters |
Relative photonic efficiency (Ir) |
|
|
256 nm |
370 nm |
|
|
Pure BiO |
1.01 ± 0.001 |
0.79 ± 0.01 |
|
0.1wt% Ni–BiO |
1.09 ± 0.01 |
0.93 ± 0.01 |
|
0.5 wt% Ni–BiO |
1.28 ± 0.02 |
0.94 ± 0.01 |
|
1.0wt% Ni–BiO |
2.59 ± 0.01 |
2.22 ± 0.01 |
|
1.5wt% Ni–BiO |
2.98 ± 0.01 |
2.25 ± 0.01 |
|
2wt% Ni–BiO |
1.02± 0.01 |
1.98 ± 0.01 |
|
Commercial BiO |
1.02 ± 0.01 |
1.02 ± 0.01 |
|
TiO2 |
1.38 ± 0.01 |
1.03 ± 0.01 |
(*): pH 5; UV = 8 lamps; ë = 254 and 365 nm; 50 W UV power, 60 min photooxidation time
Reusability of Ni doped BiO
As shown in Figure 12, after the first cycle of photocatalytic oxidation within 60 min, 99% of the Ni doped BiO with a mass ratio of 1.5wt% was recovered. After three cycles, the phoooxidation ability of Ni doped BiO nanocomposite was retained at 93% of the original value. After 8th cycles the nanocomposite was reatined at 80%. One of the reasons for the slight decline in photooxidation is that the surface of the reused photocatalysts may exist with some low residual substances which did not occupy the photocatalytic sites and did not block the adsorption. The presence of Ni significantly changed the binding site of the pollutant molecules. It is possible that the oxygen atom in Ni-BiO was bound to the dopant Ni [50]. The speedily recovering of the photodegradation capacity of Ni doped BiO for pollutans photodegradation will benefit to their photocatalytic activity.
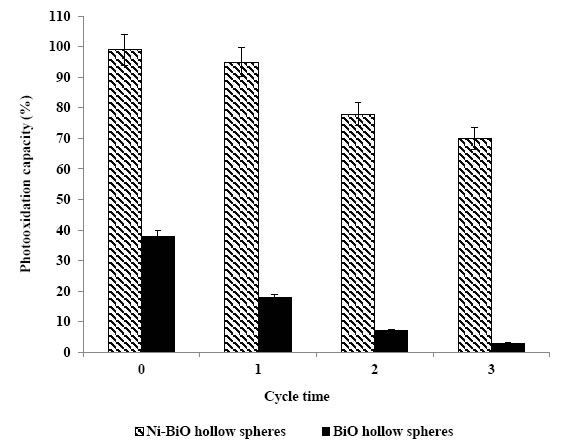
Figure 12. The reusability of Ni doped BiO
Conclusions
By using 30 mg/L Ni-BiO with a Ni mass ratio of 1.5w% the CODtotal, CODinert, flavonols, polyaromatics and color were photodegraded with yields as high as 82-99% within 60 min photooxidation time, at 25°C under 50 W UV power, at pH=8.0. The addition of Ni to BiO lead to enhance the photocatalytic activity by increasing the total surface area. The flavonoids and polyaromatic amines and their metabolites in the TW were firstly determined photodegraded with high rates and photonic efficiency using 30 mg/L Ni-BiO with a Ni mass ratio of 1.5w% at pH 8.
References
- Lin SH, Chen ML (1997) Treatment of textile wastewater by chemical methods for reuse.Water Research31: 868-876.
- Van der Zee FP, Bouwman RHM, Strik DP, Lettinga G, Field JA (2001) Application of redox mediators to accelerate the transformation of reactive azo dyes in anaerobic bioreactors.Biotechnology and Bioengineering75: 691-701.[Crossref]
- Chung KT, Stevens SEJ (1993) Degradation of azo dyes by environmental microorganisms and helminthes.Environmental Toxicology and Chemistry 12: 2121-2132.
- Weisburger JH (2002) Comments on the history and importance of aromatic and heterocyclic amines in public health.Mutation Research-Fundamental and Molecular Mechanisms of Mutagenesis506: 9-20.[Crossref]
- Oliveira DP, Carneiro PA, Sakagami MK, Zanoni MVB, Umbuzeiro GA (2007) Chemical characterization of a dye processing plant effluent–identification of the mutagenic components.Mutation Research-Fundamental and Molecular Mechanisms of Mutagenesis626: 135-142.
- Robinson T, McMullan G, Marchant R, Nigam P (2001) Remediation of dyes in textile effluent: a critical review on current treatment technologies with a proposed alternative.Bioresource Technology77: 247-255.[Crossref]
- Van der Zee FP, Villaverde S (2005) Combined anaerobic–aerobic treatment of azo dyes—a short review of bioreactor studies.Water Research39: 1425-1440.[Crossref]
- Roosta M, Ghaedi M, Shokri N, Daneshfar A, Sahraei R, Asghari A (2014) ‘Experimental design based response surface methodology optimization of ultrasonic assisted adsorption of safaranin o by tin sulfide nanoparticle loaded on activated carbon. Spectrochimica Acta – Part A: Molecular and Biomolecular Spectroscopy 122: 223-231.
- Tavakkoli H, Moayedipour T (2014) Fabrication of perovskite-type oxide La0.5Pb0.5MnO3 nanoparticles and its dye removal performance. Journal of Nanostructure in Chemistry4: 116-124.
- Qi X, Zhou J, Yue Z, Gui Z, Li L (2003) Auto-combustion synthesis of nanocrystalline LaFeO3.Materials Chemistry and Physics78: 25-29.
- Deganello F, Marcì G, Deganello G (2009) Cipate–nitrate auto-combustion synthesis of perovskite-type nanopowders: A systematic approach.Journal of the European Ceramic Society29: 439-450.
- Jadhav LD, Patil SP, Chavan AU, Jamale AP, Puri VR (2011)Solution combustion synthesis of Cu nanoparticles; a role of oxidant-to-fuel ratio.Micro & Nano Letters6:812-815.
- Shea LE, McKittrick J, Lopez OA, Sluzky E (1996) Synthesis of red-emitting, small particle size luminescent oxides using an optimized combustion process.Journal of the American Ceramic Society 79: 3257-3265.
- Dong SY, Feng JL, Fan MH, Pi Y, Hu L, et al. (2015) Recent developments in heterogeneous photocatalytic water treatment using visible light-responsive photocatalysts: A review.RSC Advances5: 14610-14630.
- Wang HL, Xu LJ, Liu CL, Lu Y, Feng Q, et al. (2019) Composite magnetic photocatalyst Bi5O7I/MnxZn1-xFe2O4:Hydrothermal-roasting preparation and enhanced photocatalytic activity.Nanomaterials 9: 118-131.
- Li HH, Li KW, Wang H (2009) Hydrothermal synthesis and photocatalytic properties of bismuth molybdate materials.Materials Chemistry and Physics116: 134-142.
- Ren J, Wang W, Shang M, Sun S, Gao E (2011) Heterostructured bismuth molybdate composite: Preparation and improved photocatalytic activity under visible-light irradiation.ACS Applied Materials & Interfaces 3: 2529-2533. [Crossref]
- Zhang T, Huang JF, Zhou S, Ouyang HB, Cao LY,et al. (2013) Microwave hydrothermal synthesis and optical properties of flower-like Bi2MoO6 crystallites.Ceramics International39: 7391-7394.
- Meng XC, Zhang ZS (2016) Bismuth-based photocatalytic semiconductors: Introduction, challenges and possible approaches.Journal of Molecular Catalysis A-Chemical423: 533-549.
- Jia YL, Ma Y, Tang JZ, Shi W (2018) Hierarchical nanosheet-based Bi2MoO6 microboxes for efficient photocatalytic performance.Dalton Transactions47: 5542-5547.
- Zhou TF, Hu JC, Li JL (2011) Er3+ doped bismuth molybdate nanosheets with exposed {010} facets and enhanced photocatalytic performance.Applied Catalysis B: Environmental110: 221-230.
- Wang QY, Lu QF, Wei MZ, Wei M, Guo E, et al. (2018) ZnO/-Bi2MoO6 heterostructured nanotubes: Electrospinning fabrication and highly enhanced photoelectrocatalytic properties under visible-light irradiation.Journal of Sol-Gel Scıence and Technology85: 84-92.
- Zhong Y, He ZT, Chen DM, Hao D, Hao W, (2019) Enhancement of photocatalytic activity of Bi2MoO6 by fluorine substitution.Applications of Surface Science467: 740-748.
- Wang PF, Ao YH, Wang C, Hou J, Qian J (2012) A one-pot method for the preparation of graphene- Bi2MoO6 hybrid photocatalysts that are responsive to visible-light and have excellent photocatalytic activity in the degradation of organic pollutants.Carbon50: 5256-5264.
- Wang M, Han J, Guo PY, Sun MZ, Zhang Y, et al. (2018) Hydrothermal synthesis of B-doped Bi2MoO6 and its high photocatalytic performance for the degradation of Rhodamine B.Journal of Physics and Chemistry of Solids 113: 86-93.
- Chen C, Liu L, Guo J, Zhou LX, Lan YQ (2019) Sulfur-doped copper-cobalt bimetallic oxides with abundant Cu (I): A novel peroxymonosulfate activator for chloramphenicol degradation.Chemical Engineering Journal361: 1304-1316.
- Wang J, Sun YG, Wu CC, Cui Z, Rao PH(2019) Enhancing photocatalytic activity of Bi2MoO6 via surface co-doping with Ni2+ and Ti4+ ions.Journal of Physics and Chemistry of Solids129: 209-216.
- Ding X, Ho WK, Shang J, Zhang LZ (2016) Self doping promoted photocatalytic removal of no under visible light with Bi2MoO6: Indispensable role of superoxide ions.Applied Catalysis B: Environmental182: 316-325.
- Zhang XH, Zhang HR, Jiang HT, Yu F, Shang ZR (2019) Hydrothermal synthesis and characterization of Ce3+ doped Bi2MoO6 for water treatment.Catalysis Letters1-11.
- Eaton AD, Clesceri LS, Rice EW, Greenberg AE, Franson MAH (2005) Standard Methods for the Examination of Water and Wastewater’, Ed. by Franson MAH, (21th ed.), American Public Health Association (APHA), American Water Works Association (AWWA), Water Environment Federation (WEF), American Public Health Association (APHA) 800 I Street, NW, Washington, DC: 20001-3770, USA.
- Germirli F, Orhon D, Artan N (1991) Assessment of the initial inert soluble COD in industrial wastewater.Water Science and Technology 23: 1077-1086.
- Sun J, Qiao L, Sun S, Wang G (2008) Photocatalytic degradation of orange g on nitrogen-doped TiO2 catalysts under visible light and sunlight irradiation.Journal of Hazardous Materials 155: 312-319.[Crossref]
- Huang M, Xu C, Wu Z, Huang Y, Lin J, et al. (2008) Photocatalytic discolorization of methyl orange solution by Pt modified TiO2 loaded on natural zeolite.Dyes and Pigments77: 327-334.
- Jia T, Wang W, Long F, Fu Z, Wang H, Zhang Q (2009) Fabrication, characterization and photocatalytic activity of La-doped ZnO nanowires.Journal of Alloys and Compounds484: 410-415.
- Khatamian M, Khandar AA, Divband B, Haghighi M, Ebrahimiasl S (2012) Heterogeneous photocatalytic degradation of 4-nitrophenol in aqueous suspension by Ln (La3+, Nd3+ or Sm3+) doped ZnO nanoparticles.Journal of Molecular Catalysis A: Chemical365: 120-127.
- Raza W, Haque MM, Muneer M (2014) Synthesis of visible light driven ZnO: characterization and photocatalytic performance. Applications of Surface Science322: 215-224.
- Zheng Y, Chen C, Zhan Y, Lin X, Zheng Q, et al. (2007) Luminescence and photocatalytic activity of ZnO nanocrystals: correlation between structure and property.Inorganic Chemistry 46: 6675-6682.
- Bohle DS, Spina CJ (2009) Cationic and anionic surface binding sites on nanocrystalline zinc oxide: surface influence on photoluminescence and photocatalysis.Journal of the American Chemical Society131: 4397-4404.
- Selvam NCS, Vijaya JJ, Kennedy LJ, (2013) Comparative studies on influence of morphology and La doping on structural, optical, and photocatalytic properties of zinc oxide nanostructures.Journal of Colloid and Interface Science407: 215-224.
- Fox MA, Dulay MT (1993) Hetereogeneous photocatalysis.Chemical Reviews93: 341-357.
- Korake PV, Dhabbe RS, Kadam AN, Gaikwad YB, Garadkar KM (2014) Highly active lanthanum doped ZnO nanorods for photodegradation of metasystox.Journal of Photochemistry and Photobiology B-Biology130: 11-19.
- Suwanboon S, Amornpitoksuk P, Bangrak P, Muensit N (2013) Optical, photocatalytic and bactericidal properties of Zn1-xLaxO and Zn1-xMgxO nanostructures prepared by a sol–gel method.Ceramics International39: 5597-5608.
- Kaneva N, Bojinova A, Papazova K, Dimitrov D (2015) Photocatalytic purification of dye contaminated sea water by lanthanide (La3+, Ce3+, Eu3+) modified ZnO.Catalysis Today252: 113-119.
- Cassano AE, Alfano OM (2000) Reaction engineering of suspended solid heterogenous photocatalytic reactors.Catalysis Today58: 167-197.
- Anandan S, Vinu A, Venkatachalam N, Arabindoo B, Murugesan V (2006) Photocatalytic activity of ZnO impregnated Hâ and mechanical mix of ZnO/Hâ in the degradation of monocrotophos in aqueous solution.Journal of Molecular Catalysis A: Chemical256: 312-320.
- Anandan S, Vinu A, Mori T, Gokulakrishnan N, Srinivasu P, et al. (2007) Photocatalytic degradation of 2,4,6-trichlorophenol using lanthanum doped ZnO in aqueous suspension.Catalysis Communications8: 1377-1382.
- Joseph JM, Destaillats H, Hung H, Hoffmann MR (2000) The sonochemical degradation of azobenzene and related azo dyes: rate enhancements via fenton’s reactions.Journal of Physical Chemistry A104: 301-307.
- Spadaro JT, Isabelle L, Renganathan V (1994) Hydroxyl radical mediated degradation of azo dyes: evidence for benzene generation.Environmental Science & Technology28: 1389-1393.
- Galindo C, Jacques P, Kalt A (2000) Photodegradation of the aminobenzene Acid Orange 52 by three advanced oxidation processes: UV/H2O2, UV/TiO2 and VIS/TiO2: comparative mechanistic and kinetic investigations.Journal of Photochemistry and Photobiology A-Chemistry 130: 35-47.
- Pala RGS, Metiu H (2007) The structure and energy of oxygen vacancy formation in clean and doped, very thin films of ZnO.Journal of Physical Chemistry C111: 12715-12722.
- Battle PD, Cheetham AK, Goodenough JB (1979)A neutron diffraction study of the ferrimagnetic spinel NiCO2O4.Materials Research. Bulletin14: 1013-1024.
- Roosta M, Ghaedi M, Daneshfar A, Darafarin S, Sahraei R,et al. (2014b) Simultaneous ultrasound-assisted removal of sunset yellow and erythrosine by ZnS:Ni nanoparticles loaded on activated carbon: optimization by central composite design.Ultrasonics Sonochemistry21: 1441-1450.
- Verma S, Joshi HM, Jagadale T, Chawla A, Chandra R, et al. (2008) Nearly monodispersed multifunctional NiCO2O4 spinel nanoparticles: magnetism, infrared transparency, and radio frequency absorption.The Journal of Physical Chemistry C112: 15106-15112.
- Wu Z, Zhu Y, Ji X (2014) NiCO2O4-based materials for electrochemical supercapacitors.Journal of Materials Chemistry A2: 14759-14772.
- Xing YX, Zhan J, Liu ZL,Du CF (2017) Steering photoinduced charge kinetics via anionic group doping in Bi2MoO6 for e_cient photocatalytic removal of water organic pollutants.RSC Advances7: 35883-35896.