Abstract
In the presented study, three different marine fish species were collected from four locations along the coastal waters of Andhra Pradesh. The samples were analysed using Hand-held XRF. Concentrations of ten elements (As, Cd, Cu, Fe, Mn, Se, Zn, Ca, K and Mg) were quantified in muscle, liver and gill tissues of Rastrelliger kanagurta, Euthynnnus affinis and Saurida tumbil collected from Visakhapatnam harbour, Kakinada harbour, Pudimadaka and Bheemili. There was a clear spatial variation in the concentration of elements collected from different locations. However, significant differences in elemental concentrations among the three studied species and tissues were observed and these may be related to different accumulation patterns of the species. The results showed that concentrations of As and Cd were above the threshold limits. However, the exposure for the population depends on their dietary habits and continued exposure to the heavy metals may cause adverse effects.
Keywords
Marine fish, HHXRF, Heavy metal
Introduction
During the last few years, aquatic ecosystems have been affected by various types of contaminations due to garbage and effluents delivering by different sectors like domestic, agricultural, commercial, and pharmaceutical and other industrial activities of human beings living around the coastal lines. In recent years [1], much attention has been paid to study about health benefits of essential elements (Fe, Zn, Cu, Mn) derived from fishes of the marine environment due to consumption of sea fishes and change in their concentration due to pollution impact causing associated health hazards besides the accumulation of non-essential elements or heavy metals (Hg, Cd, Pb) in the fishes. Nutritionists consider fish products to be a major source of quality protein, vitamins, minerals and long-chain polyunsaturated fatty acids (omega-3), docosahexaenoic acid (DHA) and also contain organic and inorganic micronutrients like vitamin D, selenium etc. [2]. Fishes are recommended mainly to the elderly, infant’s brain and nerves function, cardiac patients i.e., abnormal heart strokes and those with digestive problems due to their reduced energy levels and higher mineral content [3]. Consuming fish may decrease the risk of depression, Alzheimer’s disease, arthritis and diabetes etc. On the other hand, Toxicologists tend to regard aquatic pollution as a major vector for non-essential elements like Hg, Cd, Pb accumulation [4]. These elements are mainly present in marine environments due to industrial wastewater loads, soil erosion, municipal sewage discharges from rural and urban areas, agricultural land runoff [5]. Natural phenomena such as earthquakes, landslides, tornadoes, cyclones, and weathering of rocks also contribute towards heavy elements contribution for pollution. The contaminated water is the major source of elements bioaccumulation in the various vital organs (Liver, Kidney, gills) of the fish. Discharge of agricultural wastes like agrochemicals, Organic matter and industrial wastewater without pre-treatment into lakes, rivers and oceans resulting in an increase of non-essential elemental concentration in such water environments exhibiting damage on aquatic life [6]. Elemental pollutants as particles, elemental ions; inorganic and organic compounds in rivers and oceans also damage aquatic life [7,8]. Heavy elements, which especially collected in the organs of fishes, such as spleen and kidneys may be transmitted and accumulated in human organs through their consumption [9] and can cause a risk of kidney, brain and nervous system damage to human beings. Therefore, the introduction of non-essential elements into the food chain threatens human health and also to aquatic life. Essential elements may also become toxic to the human body if their intake is higher than the standard values of WHO [10].
The consumption of fish is significant for human beings living in coastal areas like Visakhapatnam and constitutes an important component in the intake of food items. Hence, continuous monitoring and analysing elemental concentration levels in fish belong to coastal areas became vital to understand the pollution impact on human beings those who consume frequently or regularly. Research on the detection of elements in fishes of these coastal areas is important because elemental concentration could cause growth disorders, reproductive disorders, immune suppression and histopathological alteration in the gills, kidney, liver and skin, as well as abnormalities in fish bones [11]. The health hazards associated with the consumption of contaminated fishes are up to 20-40 times greater than those associated with contaminated drinking water [12]. This is because fish have the ability to contain elemental concentration up to ten times higher than the observed environmental value [13]. Thus, fish may be considered biological indicators of elemental pollution and as a potential risk factor if contaminated fish are consumed by human beings. Absorption of elemental ions takes place through the skin, gills and digestive tract of fishes, which are transmitted to other parts of the body through the blood [14]. Muscles have been widely analysed for elemental concentration as they constitute the most edible portion of fish that poses a risk to human health who consumes them [15]. However, the liver, gills and kidneys collect the elements more effectively than the muscles since they are active metabolic tissues and primary organs for accumulating the majority of elements in fish [16]. The concentration level of elements in the gills indicate their concentration presented in the water in which the fish are found, and the liver’s concentration represents the retention of the elements, whereas the muscle is not regarded to be active tissue in the accumulation of elements [17]. Many organizations like the United States Food and Drug Administration (USFDA), the Food and Agriculture Organization (FAO) and the World Health Organization (WHO) have established limitations for human consumption of trace elements. The FAO/WHO Committee on Food Additives has set the provisional values of tolerable weekly intake (PTWI) and the dietary intakes of food additives and certain food contaminants. These specific values are significant for the safety levels of these elements in humans [18].
Materials and Methods
Samples Collection and Preparation
In the present study, three marine fishes commonly consuming by the people of Andhra Pradesh namely (Rastrelliger kanagurta (22-24 cm, TL), Euthynnus affinis (28-32 cm, TL) and Saurida tumbil (30-34 cm, TL) were collected freshly from four locations of coastal waters namely Visakhapatnam harbour (Geographical coordinates (17.6958° N, 83.3025° E), Kakinada harbour (16°58′30″N, 82°16′44″E), Pudimadaka fish landing centre (17.4927° N, 83.0028° E) and Bheemili fish landing centre (17.890382°N 83.455465°E). The sample collection areas along the coastal waters of Andhra Pradesh are shown in Figure 1. Photographs of the collected marine fishes belong to the Visakhapatnam harbour is presented in Figure 2. These fishes were individually packaged into polythene bags, stored in an ice box and brought to the laboratory. The selected species were collected three times during the winter season. The collected fishes were washed with distilled water and carefully dissected to obtain the muscle, gills and liver of the fish; subjected for determination of elemental concentrations accumulated in the respective parts. These samples were then kept at around -20°C in a deep freezer overnight in the laboratory. The frozen samples were lyophilized in a microprocessor-controlled freezing method. The lyophilization works at around -50°C which absorbs water molecules from the samples, drains off the samples making them completely dry. Then the dried specimens were ground using agate mortar and pestle to obtain fine powder with minimal contamination. The samples were kept separately with unique identification number in airtight packets.
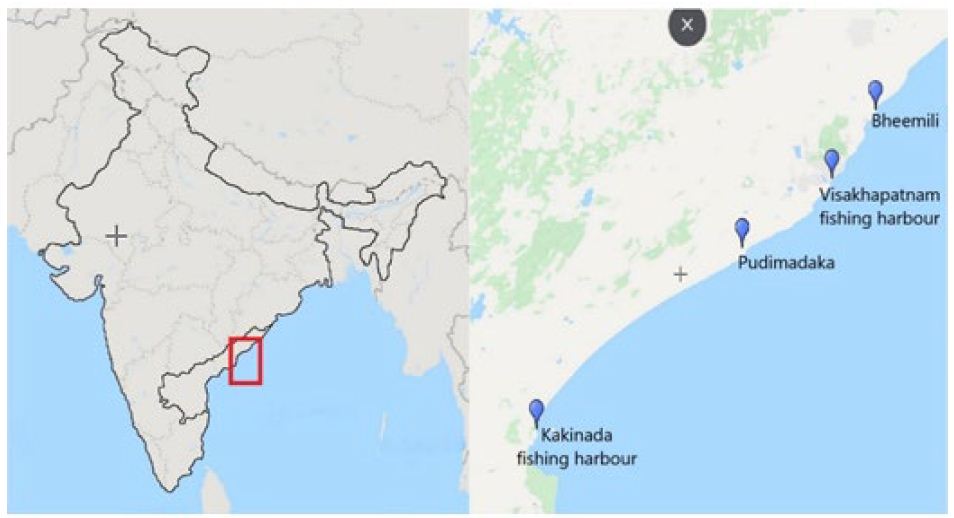
Figure 1: Sample collection areas along the coastal waters of Andhra Pradesh
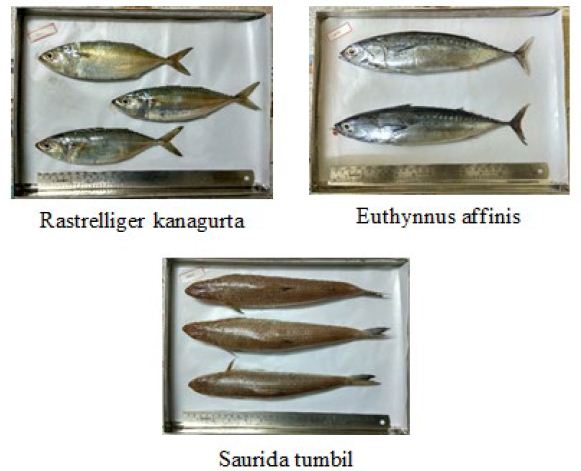
Figure 2: Fish Samples collected at Vishakapatnam fishing harbour
Experimental Method
The experimental work was carried out in BARC (Division of Nuclear Physics), Mumbai with Hand-held XRF (HHXRF) technique. In the XRF spectrometer, samples were excited by the X-rays emanating from an X-ray tube (Rh X-ray tube) having enough energy for ejecting electrons from various inner shells belonging to the atoms in the specimen. The vacancies in the inner shells of atoms are then occupied by electrons coming from the outer shells of the atoms causing the emission of characteristic X-rays; conventionally it can be referred to as X-ray fluorescence (XRF). In HHXRF, a silicon drift detector (SDD) was employed for the measurement of X-ray energies. The Silicon Drift Detector (SDD) contains graphene window that enables the detection of low Z elements (Al, S and P). These low Z elements usually cannot be detected by the conventional XRF system which uses a beryllium window. The powdered samples were placed in a cubic box and irradiated by Rhodium X-ray tube. Spectrum has been obtained for each sample in twenty seconds. The energy of the beams used for beam 1 is between 12 and 36 keV, whereas for beam 2, it varies between 0 to 12 KeV [19]. The HHXRF experimental set-up is as shown in Figure 3. The validity of the HHXRF set up was performed by analyzing Certified reference material (CRM) obtained from European Commision – Joint Research Centre, Institute for Reference Materials and Measurements – (ERMBB422 – Fish muscle) – was used for quantification of the elements and verifying the reliability of the data obtained by the present system.
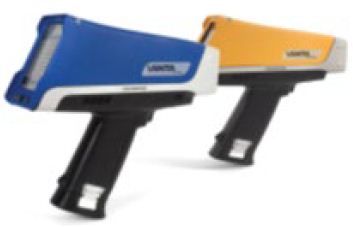
Figure 3: HHXRF set up
Results and Discussion
Concentrations of accumulated elements namely As, Cd, Cu, Fe, Mn, Se, Zn, Ca, K and Mg in different tissues belong to the fishes collected from four different locations are determined by using the obtained spectra. The observed results relating to the fishes collected from Visakhapatnam fishing harbour are compared with those collected from Kakinada fishing harbour, Pudimadaka, Bheemili as displayed in the Table 1. There is a clear spatial variation in the concentration of elements collected from different locations, however significant differences in elemental concentrations among the three studied species are observed; which may be related to different accumulation patterns of the species. The obtained XRF spectrum of the certified reference material (ERMBB422) is shown in Figure 4. The correlation coefficients among the evaluated average concentration values of various elements observed due to the three species are computed and shown in Tables 2-4.
Table 1: Concentrations of elements present in three different fish species collected at four locations
|
Element |
Species | Tissue | Visakhapatnam | Kakinada | Pudimadaka |
Bheemili |
|
As |
Rastrelliger kanagurta | Muscle | BDL | BDL | BDL | BDL |
| Liver | 6.0 ± 4.4 | 8.3 ± 5.8 | 5.3 ± 4.0 | BDL | ||
| Gills | 9.3 ± 6.7 | BDL | BDL | BDL | ||
| Euthynnus affinis | Muscle | 11.0 ± 2.8 | 5.3 ± 0.6 | 7.3 ± 4.9 | BDL | |
| Liver | 45.5 ± 2.1 | 15.7 ± 2.1 | 28.0 ± 16.5 | 37.7 ± 26.3 | ||
| Gills | 6.7 ± 4.6 | 2.7 ± 2.1 | 7.5 ± 0.7 | BDL | ||
| Saurida tumbil | Muscle | 4.0 ± 2.6 | BDL | 2.7 ± 2.1 | 4.3 ± 3.2 | |
| Liver | 17.0 ± 2.8 | 14.3 ± 10.1 | 18.0 ± 14.1 | 11.0 ± 4.4 | ||
| Gills | 7.3 ± 4.9 | 16.0 ± 11.3 | BDL | 12.7 ± 3.8 | ||
|
Cd |
Rastrelliger kanagurta | Muscle | 29.5 ± 4.9 | 25.7 ± 3.1 | 23.0 ± 5.0 | 30.0 ± 1.4 |
| Liver | 31.5 ± 10.6 | 29.0 ± 5.3 | 22.7 ± 3.8 | 29.0 ± 9.9 | ||
| Gills | 11.7 ± 8.1 | 15.0 ± 10.4 | 13.7 ± 9.8 | 15.3 ± 11.0 | ||
| Euthynnus affinis | Muscle | 28.0 ± 2.6 | 26.3 ± 3.5 | 25.3 ± 5.7 | 15.3 ± 11.0 | |
| Liver | 42.3 ± 11.2 | 38.7 ± 16.2 | 35.3 ± 4.2 | 14.3 ± 10.1 | ||
| Gills | BDL | BDL | BDL | 15.0 ± 10.4 | ||
| Saurida tumbil | Muscle | 25.5 ± 3.5 | 21.7 ± 3.2 | 27.5 ± 6.4 | 25.3 ± 2.5 | |
| Liver | 31.0 ± 7.0 | 23.0 ± 2.8 | 27.0 ± 5.7 | 12.3 ± 8.4 | ||
| Gills | BDL | 15.7 ± 11.5 | 15.0 ± 10.4 | 15.0 ± 10.4 | ||
|
Cu |
Rastrelliger kanagurta | Muscle | BDL | BDL | BDL | BDL |
| Liver | 52.5 ± 16.3 | 69.3 ± 24.5 | 66.0 ± 33.4 | 47.5 ± 16.3 | ||
| Gills | 35.3 ± 24.8 | BDL | BDL | BDL | ||
| Euthynnus affinis | Muscle | 11.0 ± 7.8 | 14.5 ± 6.4 | 6.0 ± 4.4 | BDL | |
| Liver | 58.0 ± 45.6 | 81.3 ± 31.5 | 38.7 ± 18.8 | 44.3 ± 30.9 | ||
| Gills | 8.3 ± 5.8 | BDL | BDL | BDL | ||
| Saurida tumbil | Muscle | BDL | BDL | BDL | BDL | |
| Liver | 39.7 ± 21.6 | 42.7 ± 30.6 | 48.0 ± 7.1 | 21.0 ± 4.0 | ||
| Gills | BDL | BDL | BDL | BDL | ||
|
Fe |
Rastrelliger kanagurta | Muscle | 113.7 ± 47.3 | 94.7 ± 24.0 | 106.7 ± 14.5 | 97.5 ± 3.5 |
| Liver | 1574.0 ± 596.8 | 1538.7 ± 567.0 | 1910.7 ± 593.7 | 1311.5 ± 509.8 | ||
| Gills | 1304.0 ± 1304.2 | 950.3 ± 325.4 | 595.7 ± 98.0 | 550.0 ± 69.3 | ||
| Euthynnus affinis | Muscle | 193.0 ± 174.0 | 287.0 ± 87.9 | 177.3 ± 98.9 | 45.3 ± 31.8 | |
| Liver | 1628.7 ± 1638.4 | 3430.0 ± 1841.3 | 2097.0 ± 2065.0 | 2090.0 ± 1524.2 | ||
| Gills | 519.0 ± 70.7 | 589.7 ± 128.2 | 4047.7 ± 5345.8 | 302.0 ± 209.6 | ||
| Saurida tumbil | Muscle | BDL | 13.3 ± 9.2 | BDL | BDL | |
| Liver | 940.0 ± 546.5 | 1383.3 ± 858.2 | 1382.0 ± 745.3 | 748.3 ± 212.1 | ||
| Gills | 487.0 ± 208.1 | 450.3 ± 111.1 | 518.5 ± 157.7 | 418.7 ± 269.1 | ||
|
Mn |
Rastrelliger kanagurta | Muscle | 23.7 ± 16.7 | BDL | BDL | 17.0 ± 12.1 |
| Liver | 19.3 ± 13.6 | BDL | 37.0 ± 9.9 | 35.5 ± 9.2 | ||
| Gills | 41.0 ± 7.1 | 53.5 ± 3.5 | 57.0 ± 5.7 | 70.5 ± 14.8 | ||
| Euthynnus affinis | Muscle | BDL | BDL | BDL | 18.3 ± 12.7 | |
| Liver | 17.0 ± 12.1 | 20.3 ± 14.4 | 40.5 ± 0.7 | BDL | ||
| Gills | 72.5 ± 38.9 | 52.3 ± 9.1 | 104.5 ± 53.0 | 20.7 ± 14.2 | ||
| Saurida tumbil | Muscle | 17.0 ± 12.1 | 18.7 ± 13.3 | 15.0 ± 10.4 | 26.3 ± 1.2 | |
| Liver | 24.0 ± 16.5 | 15.3 ± 11.0 | BDL | BDL | ||
| Gills | 88.0 ± 10.5 | 68.3 ± 1.2 | 93.0 ± 41.0 | 75.7 ± 23.0 | ||
|
Se |
Rastrelliger kanagurta | Muscle | BDL | BDL | 1.5 ± 0.7 | BDL |
| Liver | 15.0 ± 11.3 | 17.7 ± 10.8 | 21.7 ± 10.7 | 20.0 ± 15.6 | ||
| Gills | 15.3 ± 13.8 | 7.7 ± 2.5 | 5.7 ± 1.2 | 8.0 ± 2.8 | ||
| Euthynnus affinis | Muscle | 3.7 ± 2.1 | 6.0 ± 3.0 | 5.3 ± 4.9 | BDL | |
| Liver | 26.7 ± 20.4 | 16.7 ± 11.7 | 26.3 ± 13.8 | 2.7 ± 2.1 | ||
| Gills | 10.5 ± 3.5 | 8.3 ± 3.1 | 6.3 ± 2.9 | 1.7 ± 1.2 | ||
| Saurida tumbil | Muscle | BDL | BDL | 1.5 ± 0.7 | BDL | |
| Liver | 2.7 ± 1.2 | 2.7 ± 1.2 | 2.0 ± 1.4 | 1.7 ± 0.6 | ||
| Gills | BDL | 1.7 ± 1.2 | BDL | 1.7 ± 1.2 | ||
|
Zn |
Rastrelliger kanagurta | Muscle | 113.7 ± 82.6 | 87.3 ± 31.8 | 76.3 ± 1.2 | 59.0 ± 1.4 |
| Liver | 326.0 ± 36.8 | 334.7 ± 101.6 | 312.7 ± 116.2 | 263.5 ± 72.8 | ||
| Gills | 618.7 ± 681.0 | 262.3 ± 14.6 | 269.7 ± 40.4 | 305.0 ± 8.5 | ||
| Euthynnus affinis | Muscle | 56.7 ± 9.1 | 61.7 ± 16.5 | 47.3 ± 4.7 | 20.3 ± 14.4 | |
| Liver | 577.7 ± 270.8 | 568.3 ± 290.8 | 835.3 ± 512.6 | 295.7 ± 205.5 | ||
| Gills | 286.3 ± 117.0 | 359.3 ± 71.0 | 290.7 ± 54.8 | 88.3 ± 61.2 | ||
| Saurida tumbil | Muscle | 43.3 ± 8.4 | 35.3 ± 0.6 | 34.5 ± 4.9 | 36.0 ± 1.0 | |
| Liver | 198.7 ± 64.3 | 176.7 ± 38.1 | 145.5 ± 37.5 | 130.7 ± 14.0 | ||
| Gills | 172.0 ± 7.5 | 167.0 ± 4.6 | 147.0 ± 4.2 | 159.7 ± 18.5 | ||
|
Ca |
Rastrelliger kanagurta | Muscle | 0.78 ± 1.14 | 0.08 ± 0.01 | 0.07 ± 0.02 | 0.06 ± 0.05 |
| Liver | 0.10 ± 0.10 | 0.09 ± 0.03 | 0.06 ± 0.01 | 0.05 ± 0.04 | ||
| Gills | 4.02 ± 3.47 | 7.11 ± 0.55 | 7.16 ± 1.41 | 5.00 ± 4.33 | ||
| Euthynnus affinis | Muscle | 0.05 ± 0.02 | 0.10 ± 0.08 | 0.07 ± 0.02 | 0.02 ± 0.01 | |
| Liver | 0.16 ± 0.05 | 0.18 ± 0.13 | 0.79 ± 0.71 | 0.02 ± 0.02 | ||
| Gills | 8.87 ± 0.98 | 7.79 ± 0.52 | 6.79 ± 1.01 | 2.96 ± 2.05 | ||
| Saurida tumbil | Muscle | 0.69 ± 0.91 | 0.15 ± 0.07 | 0.06 ± 0.07 | 0.22 ± 0.10 | |
| Liver | 0.08 ± 0.06 | 0.05 ± 0.03 | 0.04 ± 0.04 | 0.03 ± 0.01 | ||
| Gills | 6.46 ± 0.83 | 5.49 ± 0.33 | 3.93 ± 3.48 | 5.04 ± 0.59 | ||
|
K |
Rastrelliger kanagurta | Muscle | 1.33 ± 0.41 | 2.13 ± 1.17 | 2.54 ± 0.88 | 1.80 ± 1.56 |
| Liver | 1.15 ± 1.00 | 1.63 ± 0.38 | 1.85 ± 0.48 | 1.05 ± 0.91 | ||
| Gills | 1.30 ± 0.75 | 0.82 ± 0.03 | 0.79 ± 0.08 | 0.54 ± 0.47 | ||
| Euthynnus affinis | Muscle | 2.26 ± 0.10 | 2.08 ± 0.42 | 2.62 ± 0.10 | 1.42 ± 0.99 | |
| Liver | 1.81 ± 0.18 | 1.90 ± 0.39 | 1.79 ± 0.23 | 1.22 ± 0.84 | ||
| Gills | 0.55 ± 0.20 | 0.67 ± 0.17 | 0.65 ± 0.13 | 0.50 ± 0.34 | ||
| Saurida tumbil | Muscle | 2.85 ± 0.29 | 2.35 ± 0.41 | 1.71 ± 1.50 | 2.81 ± 0.14 | |
| Liver | 5.84 ± 7.66 | 1.19 ± 0.24 | 0.65 ± 0.60 | 1.30 ± 0.19 | ||
| Gills | 0.99 ± 0.08 | 1.02 ± 0.08 | 0.60 ± 0.52 | 1.16 ± 0.22 | ||
|
Mg |
Rastrelliger kanagurta | Muscle | 0.62 ± 0.43 | BDL | BDL | BDL |
| Liver | BDL | BDL | 0.72 ± 0.50 | 0.76 ± 0.53 | ||
| Gills | 0.83 ± 0.58 | 1.77 ± 0.06 | 2.50 ± 0.26 | 1.63 ± 1.46 | ||
| Euthynnus affinis | Muscle | 0.66 ± 0.46 | 0.53 ± 0.37 | BDL | BDL | |
| Liver | BDL | BDL | 0.72 ± 0.50 | BDL | ||
| Gills | 0.89 ± 0.62 | 1.03 ± 0.91 | 1.61 ± 1.12 | 0.67 ± 0.46 | ||
| Saurida tumbil | Muscle | BDL | BDL | BDL | BDL | |
| Liver | 0.67 ± 0.46 | 0.74 ± 0.66 | 0.64 ± 0.45 | 0.72 ± 0.50 | ||
| Gills | 0.78 ± 0.54 | 1.10 ± 1.05 | 0.83 ± 0.72 | 0.67 ± 0.46 |
BDL: below detection limit.
Concentration of As, Cd, Cu, Fe, Mn, Se and Zn are in ppm.
Concentration of Ca, K and Mg are in %.
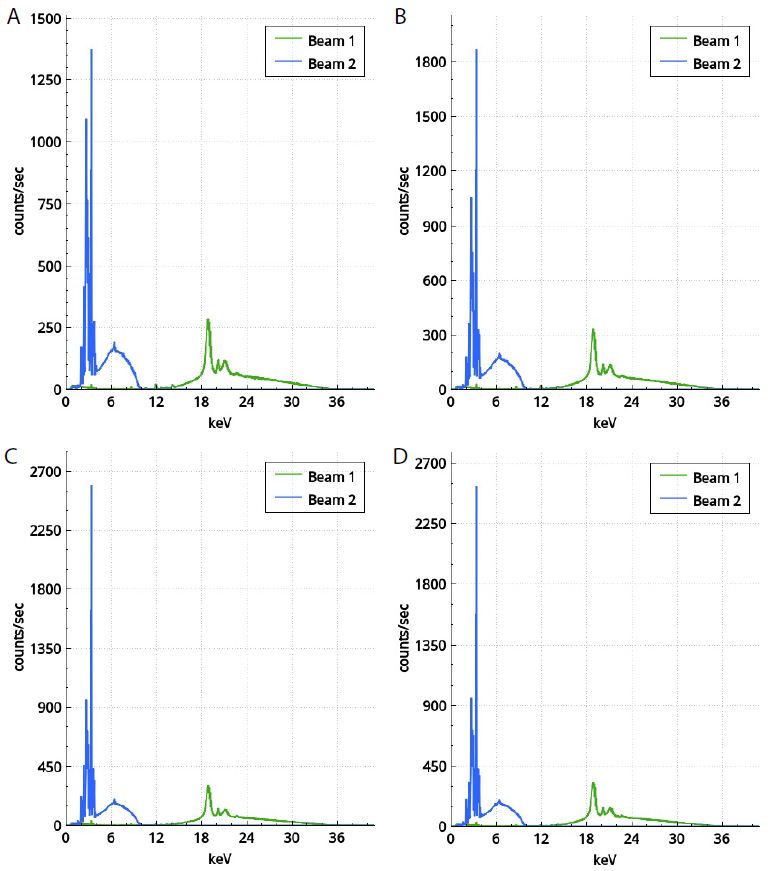
Figure 4: Spectra of muscle tissue of Rastrelliger kanagurta collected from Visakhapatnam (a), Kakinada (b), Pudimadaka (c) and Bheemili (d)
Table 2: Correlation between elements present in tissues of Rastrelliger kanagurta
|
As |
Cd | Cu | Fe | Mn | Se | Zn | Ca | K |
Mg |
|
| As |
1 |
|||||||||
| Cd |
-0.537 |
1 |
||||||||
| Cu |
-0.499 |
0.555 |
1 |
|||||||
| Fe |
-0.882 |
-0.011 | 0.746 |
1 |
||||||
| Mn |
0.508 |
-0.833 | -0.259 |
-0.023 |
1 |
|||||
| Se |
-0.535 |
0.473 | 0.505 | 0.936 | -0.716 |
1 |
||||
| Zn |
0.770 |
-0.506 | -0.653 | 0.721 | 0.330 | 0.485 |
1 |
|||
| Ca |
0.736 |
-0.861 | -0.755 | -0.055 | 0.820 | -0.525 | 0.361 |
1 |
||
| K |
-0.290 |
0.408 | 0.721 | -0.238 | -0.748 | 0.002 | -0.453 | -0.700 |
1 |
|
| Mg |
1 |
-0.643 | -0.963 | -0.351 | 0.785 | -0.923 | -0.094 | 0.886 | -0.718 |
1 |
Table 3: Correlation between elements present in tissues of Euthynnus affinis
|
As |
Cd | Cu | Fe | Mn | Se | Zn | Ca | K |
Mg |
|
| As |
1 |
|||||||||
| Cd |
0.192 |
1 |
||||||||
| Cu |
0.610 |
0.519 |
1 |
|||||||
| Fe |
0.284 |
0.532 | 0.944 |
1 |
||||||
| Mn |
-0.660 |
0.196 | -0.929 | 0.398 |
1 |
|||||
| Se |
0.564 |
0.864 | 0.571 | 0.338 | -0.405 |
1 |
||||
| Zn |
0.558 |
0.705 | 0.708 | 0.609 | -0.060 | 0.888 |
1 |
|||
| Ca |
-0.496 |
-0.295 | -0.345 | 0.087 | 0.796 | -0.169 | 0.037 |
1 |
||
| K |
0.134 |
0.522 | -0.066 | -0.148 | -0.582 | 0.215 | -0.027 | -0.789 |
1 |
|
| Mg |
-0.253 |
0.205 | -0.101 | 0.815 | 0.910 | -0.060 | 0.162 | 0.677 | -0.569 |
1 |
Table 4: Correlation between elements present in tissues of Saurida tumbil
|
As |
Cd | Cu | Fe | Mn | Se | Zn | Ca | K |
Mg |
|
| As |
1 |
|||||||||
| Cd |
-0.140 |
1 |
||||||||
| Cu |
0.889 |
0.832 |
1 |
|||||||
| Fe |
0.531 |
0.503 | 0.873 |
1 |
||||||
| Mn |
0.254 |
-0.853 | -1.000 | -0.367 |
1 |
|||||
| Se |
0.555 |
0.510 | 0.547 | 0.660 | -0.498 |
1 |
||||
| Zn |
0.839 |
-0.241 | 0.463 | 0.546 | 0.533 | 0.678 |
1 |
|||
| Ca |
0.080 |
-0.643 | 0.382 | -0.487 | 0.934 | -0.407 | 0.450 |
1 |
||
| K |
-0.010 |
0.628 | 0.015 | 0.023 | -0.557 | 0.562 | -0.090 | -0.431 |
1 |
|
| Mg |
0.008 |
-0.429 | -0.501 | -0.483 | 0.311 | -0.327 | 0.031 | 0.548 | -0.271 |
1 |
From the evaluated results that displayed in the Table 1, comprehensively one can draw the following statements:
- As expected, accumulation levels of heavy metals namely arsenic and cadmium belonging to Visakhapatnam fishing harbour are higher relative to other places indicating higher pollution levels as commercial activities and anthropogenic garbage discharge are more than other places leading to more exposure to pollution
- In the case of nutritional elements such as copper (Cu) and iron (Fe) concentration levels are found to be more in the fish species collected from Kakinada fishing harbour followed by Pudimadaka (Saurida tumbil and Rastrelliger kanagurta for Cu and Fe respectively).
- Se, Zn and Ca contents were found in higher concentrations among the fish species belonging to Visakhapatnam fishing harbour followed by Pudimadaka
- Detection of Mn, K and Mg seems to be higher in the species related to Pudimadaka when compared with the other places.
- Fish species belonging to Bheemili are reflecting no nutritional elements higher relative to other places.
- Though the commercial activities due to domestic transport and international export of goods besides thrown of garbage by local habitants are higher, some of the nutritional elements and antioxidants at Kakinada fishing harbour and Visakhapatnam fishing harbour found to be higher, indicating the need to develop effective pollution management systems at these places.
Detection of Heavy Metals
Arsenic
Arsenic (As) is widely distributed in the environment as a result of anthropogenic and naturally occurring processes. This is a trace element that is potentially toxic to all living beings; however, its toxicity varies based on its different chemical forms [20]. The United States Food and Drug Administration [21] reported that seafood products including fish constitute 90% of overall exposure to arsenic. Accumulated arsenic concentration among various tissues of the selected species of fish taken from the above-mentioned locations are analysed for monitoring the level of pollution and the obtained concentrations found to vary between 2.7 ± 2.1 ppm to 45.5 ± 2.1 ppm. The highest concentration is detected in the liver tissue of Euthynnus affinis species collected from Visakhapatnam. However, the arsenic level is below the limit of detection relating to the muscle tissue of Rastrelliger kanagurta belong to all the locations. It is also clear that the concentration of all the tissues pertaining to Rastrelliger kanagurta related to Bheemili is below the detection limit. The Australia New Zealand Food Standards Code [22] states that the maximum allowable concentration of As is 2.0 mg/kg ww. The species Euthynnus affinis was collected in Visakhapatnam (assuming that the muscle is the only edible part) exceeded the ANZFA recommended value (9.6 mg/kg) dw (assumed to be 79% moisture). The EPA has established 1.3 mg/kg of arsenic in fresh water fish tissue as the basis for protecting human health [23]. The maximum concentration of As in fish according to Brazilian legislation is 1.0 mg/kg [24]. Sharif et al. [25] investigated the concentration of arsenic in tropic marine fish species from Bangladesh with reported values varied between 2.84 and 3.92 mg/kg dw.
Cadmium
Cadmium also considered as one of the toxic elements that could present in fish organs at higher concentrations [26]. It leads to chronic toxicity although it occurs at a concentration level of 1 mg/kg [27]. Christensen et. al [28] considered cadmium to be potentially more hazardous than other metals. The National Health and Medical Research Council (ANHMRC) standard for Cd concentration in seafood products in Australia is 2.0 mg/kg [29], while the authorities of Western Australia suggested 5.5 mg/kg concentration for Cd [30]. Under Spanish legislation Cd concentrations are limited to 1 mg/kg [31]. The maximum concentration of Cd for fish laid down by Brazilian legislation amounts to 1.0 mg/kg [32]. The concentration of Cd in fish samples in this study varies from 11.7 ± 8.1 ppm to 42.3 ± 11.2 ppm. The liver of Euthynnus affinis that collected from Visakhapatnam is found to show the highest level of cadmium. Based on the results obtained in the present experimental study; it can be understood that the observed Cd in fishes collected from all the four locations exceeds the aforementioned standard values and longer period of Cd accumulation in fishes may be hazardous to health.
Detection of NUTRITIONAL Elements
Copper
Copper is vital and necessary for synthesizing of haemoglobin [33]. Its deficiency may cause disorders in blood and nervous system in adults [34]. However, high consumption of Cu would result in adverse health effects [35]. The observed concentration of Cu in the present study ranges from 6.0 ± 4.4 ppm to 81.3 ± 31.5 ppm, however, it was found to be less than the limit of detection in muscle tissues of Rastrelliger kanagurta and Saurida tumbil related to all the three locations of the present study. The liver tissue of Euthynnus affinis that belong to Kakinada is found to have the highest level of Cu. The maximum permitted Cu limit proposed by FAO and ANHMRC is 30 mg/kg fresh weight [36,37]. The UK Food Standards Committee report states that the Cu content of food must be less than 20 mg/kg wet weight [38]. Legislation has also been passed in some countries about the maximum permissible Cu concentration in meals. For instance, Turkish law has set the Cu concentration as 5 mg/kg, while Spanish law suggested the concentration of 20 mg/kg ww [39]. The Australian Food Standard Code has set a maximum level of Cu to 10 mg/kg ww [40]. Taking into account the water content of 79% of fish muscles, no species studied exceeded prescribed limits of different agencies (assuming the muscle as the only edible part).
Iron
Iron deficiency frequently results with anaemia causing reduced levels of working capacity besides impaired mental development. The recommended daily allowance for children and adults (males and females) is 11 mg/day and 18 mg/day, respectively [41]. The concentration levels of iron in the present study ranges in between 13.3 ± 9.2 ppm to 4047.7 ± 534.5 ppm. The highest concentration of Fe is found in gills of Euthynnus affinis that procured from Pudimadaka. Earlier Karadede et al. [42] and Chale [43] observed values of iron concentration are 200.86 µg/g and 125 µg/g respectively. Reported these data are exhibiting fair agreement with the values of Iron observed in the present studies. The values for iron reported by Tariq et al. [44] and Asharaf et al. [45] are 0.782 to 4.217 and 1.550 to 6.715 µg/g respectively. These values are lower than the present values of iron. Iron is a mineral and essential for life. An adequate dietary intake of iron is extremely important in reducing anaemia. The deficiency of iron occurs when there is a high demand for it, e.g., while growing, in pregnancy periods and during menstrual loss, the intake usually is not adequate or contains minerals that prevent iron from being absorbed [46]. The low bioavailability of iron is regarded as a major factor leading to its deficiency in many countries.
Manganese
Manganese is used in iron alloys, electric coils, dry battery cells and glass ceramics etc. which may be regarded as the mains sources of pollution of the manganese. While manganese is a low-toxicity element, it has significant biological interest. There are no established manganese limits in the fish samples. The obtained Mn concentration in the present work ranges in the range 15.0 ± 10.4 ppm to 104.5 ± 53.0 ppm. The highest level of Mn is found in gills of Euthynnus affinis that collected from Pudimadaka while the lowest concentration found be in muscle tissue of Saurida tumbil procured from Pudimadaka. However, it is not detected in muscle tissue of Euthynnus affinis that collected from Visakhapatnam, Kakinada and Pudimadaka. Manganese can be present in any body tissue that has contributed to the functioning of many organic systems. Manganese is required to support normal immune function, to regulate blood glucose levels and cellular energy, digestion, reproduction, bone growth and even as a cellular antioxidant [47]. Although elevated levels of Mn can cause toxicity in humans, no RDA was established. The US National Academy of Sciences [48] determined adequate intakes (AI) of Mn as 2.3 and 1.8 mg/day for adult males and females respectively. The observed Mn concentration is consistent with the values for the fish collected from the Gumti River in Bangladesh [49].
Selenium
Selenium is an essential trace element for living organisms as a nutrition. It is known as an antioxidant and protection agent against toxic elements, heart disease and cancer. Selenium deficiency may cause multiple pathologic conditions. However, depending upon the concentration, it may also become toxic to humans, certain plants and animals [50]. In the present study, the observed concentration of Se the analysed samples ranged from 1.5 ± 0.7 ppm to 26.7 ± 20.4 ppm. However, the concentration of Se is below the detection limit in the muscle tissue of Rastrelliger kanagurta and Saurida tumbil that collected from Visakhapatnam, Kakinada and Bheemili. The RDA for adult men and women is 55 mg per day [51]. In Brazil, no maximum level of Se in fish is established.
Zinc
Being heavy metal, Zn has the tendency to bioaccumulate in fatty tissue of marine fish and known to impact their reproductive physiology [52]. Chronic exposure to Zn and Cu has been reported as related to Parkinson’s disease [53] and they may act on their own or together for a period of time to cause the illness [54]. The concentration of Zn in the muscle tissue of Rastrelliger kanagurta is much higher than the other two species collected from all the four locations of the present study. The liver of Euthynnus affinis that belongs to Pudimadaka is found to have highest level of Zn while the lowest concentration observed in muscle tissue of Euthynnus affinis procured from Bheemili. The quantity of Zn found in all fish samples is well below 1000 mg/kg standard established by ANHMRC [55,56] and WHO [56]. Zinc is a significant trace element of human nutrition and in a wide range of biochemical functions of human metabolism. The deficiency of Zn in humans leads to many disorders, but excessive consumption can cause adverse effects [57]. The RDA for Zn intake is 11 mg/day and 8 mg/day for men and women up to age 19, respectively, and Tolerable Upper Level of Intake (UL) is 40 mg/d for that age group [58].
Calcium
Ca is extremely essential to human body and is required to build teeth and healthy bones. It affects the coagulation of the body, stimulates muscles and nervous systems; works as a cofactor of vitamin D and also for the functioning of the parathyroid gland. Muscles cannot contract without calcium. Calcium is vital to regulate heart rate, maintains normal blood pressure and allows the control of electrical impulses in the brain [59]. The concentration of Ca in the present study ranges in between 0.02 ± 0.01 %. to 8.87 ± 0.98 %. The highest concentration of Ca is found in the gills of Euthynnus affinis that collected from Visakhapatnam while the lowest concentration observed in the muscle and liver tissues of Euthynnus affinis procured from Bheemili. The recommended levels of individual intake of Ca for adults (19 y to 50 y) is 1000 mg/d and tolerable upper intake level is 2.5 g/d. [60].
Potassium
Potassium (K) is very important for the cells, and without it one would not be able to survive. It is mainly found in intracellular fluids. Potassium stimulates neural impulses; muscular contractions and is significant for maintaining osmotic pressure. Potassium regulates the acid-alkaline balance of the body, stimulates the functioning of the kidneys and adrenals, and also helps in the conversion of glucose into glycogen. It is necessary for biosynthesis of proteins. Potassium is the third most abundant mineral in the human body [59]. The recommended mean intake of K is 2300 mg/day in adult females and 3100 mg/day in adult males. The concentration of K in the present study lies in the range 0.50 ± 0.34 % to 5.84 ± 7.66 %. The concentration of K is found highest in the liver tissue of Saurida tumbil collected from Visakhapatnam and lowest concentration found in the gills of Euthynnus affinis that brought from Bheemili.
Magnesium
Magnesium is required for over 300 bio-chemical reactions in human body. It helps in the maintenance of normal nerve and muscle functions, supports the healthy immune system, maintains a stable heart rate, and is useful for bones to stay strong. It is also required to adjust blood sugar levels. It helps to produce energy and protein. In the present study, the Mg concentration ranges from 0.53 ± 0.37 % to 2.50 ± 0.26 %. The highest concentration is found in the gills of Rastrelliger kanagurta that belong to Pudimadaka while the lowest concentration is obtained in the muscle tissue of Euthynnus affinis that collected from Kakinada. The recommended levels of individual intake of Mg for males (19-30 y) is 400 mg/d; above 31 y allowed to take 420 mg/d; in case of females (19-30 y) it is 310 mg/d while beyond 31 y 320 mg/d may be taken up. The tolerable upper intake level is 350 mg/d for all the adults beyond 19 y.
Statistical Analysis
The Pearson correlation coefficients among the heavy metals observed related to Rastrelliger kanagurta, Euthynnus affinis and Saurida tumbil were calculated and shown in Tables 2, 3 and 4 respectively. A strong correlation between any two elements suggests a common absorption mechanism, or a common source and may also be a lack of metabolism regulation. For Rastrelliger kanagurta, arsenic (As) found to show significant positive correlation with Mg (1), Ca (0.736) Zn (0.77) and strong negative correlation with Fe (-0.882). Similarly, Cd also showing strong negative correlation with Ca (-0.861) and Mn (-0.833). Copper is exhibiting positive correlation with Fe (0.746) and K (0.721) while indicating strong negative correlation with Mg (-0.963) and Ca (-0.755). Fe showed strong positive correlation with Se (0.936) and Zn (0.721). Mn indicating strong positive correlation with Ca (0.820) and Mg (0.785) and moderate negative correlation with K (-0.748) and Se (-0.716). Se showed strong negative correlation with Mg (-0.923). Ca found to show strong positive correlation with Mg (0.886) and moderate negative correlation with K (-0.7). K exhibits moderate negative correlation with Mg (-0.718). For Euthynnus affinis, cadmium (Cd) indicating strong positive correlation with Se (0.864) and Zn (0.705). Cu showed strong positive correlation with Fe (0.944) and Zn (0.708) and strong negative correlation with Mn (-0.929). Fe exhibited strong positive correlation with Mg (0.815). Mn indic ating strong positive correlation with Mg (0.910) and Ca (0.796). Se showed strong positive correlation with Zn (0.888) while Ca exhibited moderate negative correlation with K (-0.789).
In the case of Saurida tumbil, strong positive correlation has been obtained between As-Cu (0.889), As-Zn (0.839), Cd-Cu (0.832), Cu-Fe (0.873), Mn-Ca (0.934) and a strong negative correlation also been observed between Cd-Mn (-0.853) and Cu-Mn (-1).
The results obtained through the statistical analysis are shown in Tables 2-4 for the fishes Rastrelliger kanagurta, Euthynnus affinis, Saurida tumbil respectively. Based on the linkages/association of heavy metals with the nutritional elements that observed in this correlation studies, the following statements can be made for the interpretation of observed data.
- The observed arsenic (As) concentration of Rastrelliger kanagurta, Euthynnus affinis and Saurida tumbil is beyond the threshold value and strongly assosiated with nutritional elements Mg, Cu and Zn. Cadmium (Cd) is also associated with Mn, Ca, Se and Cu. So, these heavy metals toxicological impact not only show directly but also affect indirectly through the nutritional elements on consumers.
- Among the three fishes studied in the present investigations, As is associated significantly showing positive correlation with the nutritional elements namely Zn and Cu in the Saurida tumbil fish species and Mg in the case of Rastrelliger kanagurta. Some nutritional elements such as Fe, Se, Mn etc. found to show positive correlation with arsenic in one fish species while those elements exhibiting negative correlation or assosication exhibiting antagonish behaviour in the other fish species. This type of behaviour may be understood on the lines of physiology and metabolic system of respective fish species. Hence this type of results show indirect effect on consumers by the nutritional elements due to the As and Cd contents.
- Copper (Cu) is showing positive correlation with iron (Fe) and negative association with Mn in all the three fishes studied in the present studies. Similarly Mn is exhibiting positive correlation with calcium (Ca) and Mg in all the fishes, further Ca also found to show positive association with Mg for all the fish species.
- Interestingly important nutritional elements found to reflect useful behaviour with the presence of them relating with one another in all the fishes.
Conclusion
Concentrations of ten elements (As, Cd, Cu, Fe, Mn, Se, Zn, Ca, K and Mg) are quantified in the muscle, liver and gill tissues of Rastrelliger kanagurta, Euthynnus affinis and Saurida tumbil collected from Visakhapatnam harbour, Kakinada harbour, Pudimadaka and Bheemili. There is a clear spatial variation in the concentration of observed elements related to the fish species/samples collected from different locations. In the present study, significant differences in elemental concentrations have been observed in three fish species and these may be related to different accumulation patterns of the species besides anthropogenic garbage, industrial effluents, variation in local climatic conditions that show impact on the various elements/metals’ accumulation in water, which in turn might enter into fish organs. The evaluated results are showing the higher levels or concentrations of As and Cd accumulation beyond the threshold limits of them. However, exposure is a function of dietary habits of consumers and continued exposure to these heavy elements can lead to adverse effects.
Acknowledgment
The authors would like to thank DST-SERB, New Delhi for the financial support in the form of a project.
Conflicts of Interest
The authors do not have any relevant financial or non-financial competing interest.
References
- Amal H, Azza K (2014) Determination of metals in tuna species and bivalves from Alexandria, Egypt. The Egyptian Journal of Aquatic Research 40: 9-17.
- Afonso C, Lourenco HM, Cardoso C, Bandarra NM, Carvalho ML, et al. (2013) From fish chemical characterization to the benefit- risk assessment-part A. Food Chem 137: 99-107. [crossref]
- Cahu C, Salen P, Lorgeril M de (2004) Farmed and wild fish in the prevention of cardiovascular diseases: assessing possible differences in lipid nutritional values. Nutrition, Metabolism and Cardiovascular Diseases 14: 34-41. [crossref]
- Guérin T, Sirot V, Volatier JL, Leblanc JC (2007). Organotin levels in seafood and its implications for health risk in high-seafood consumers. Science of the Total Environment 388: 66-77. [crossref]
- Altundag H, Dundar MS (2009) Determination of thallium after preconcentration on amberlite IR-120 by ICP-MS. Fresenius Environmental Bulletin 18: 98-101.
- Aydemir F, Altundag H, Imamoglu M (2012) Removal of Cr (VI) from aqueous solution by hazelnut husk carbon. Fresenius Environmental Bulletin 21: 3589-3594.
- Ozparlak H, Arslan G, Arslan E, (2012) Determination of some metal levels in muscle tissue of nine fish species from Beys,ehir Lake, Turkey. Turkish Journal of Fisheries and Aquatic Sciences 4: 761-770.
- Dundar MS, Altundag H (2002) Heavy metal determinations of house dusts in Adapazari City, Turkey after Earthquake. Trace Elements and Electrolytes 19: 55-58.
- Altundag H, Dundar MS, Dogancı S, Celik M, Tuzen M (2013) The use of a sequential extraction procedure for heavy metal analysis of house dusts by atomic absorption spectrometry. Journal of AOAC International 96: 166-170.
- Celik U, Oehlenschlager J (2007) High contents of cadmium, lead, zinc and copper in popular fishery products sold in Turkish supermarkets. Food Control 18: 258-261.
- Vitek T, Spurny P, Mares J, Zokova A (2007) Acta Vet. Brno 76.
- Foran JA (1990) Toxic substances in surface waters. Environ Sci Technol 24:604-608.
- Yilmaz F, Ozdemir N, Demirak A, Tuna AL (2006) Heavy metal levels in two fish species Leuciscus cephalus and Lepomis gibbosus. Food Chem 100: 830-835.
- Khan B, Hizbullah K, Said M, Tariq K (2012). Heavy metals concentration trends in three fish species from Shah Alam River (Khyber Pakhtunkhwa Provine, Pakistan). Journal of Natural and Environmental Sciences 3: 1-8.
- Rajeshkumar S, Liu Y, Zhang X, Ravikumar B, Bai G, et al. (2008) Studies on seasonal pollution of heavy metals in water, sediment, fish and oyster from the Meiliang Bay of Taihu Lake in China. Chemosphere 191: 626-638.
- Chovanec A, Hofer R, Schiemer F (2003) Chapter 18 fish as bioindicators, in: trace metals and other contaminants in the environment. Elsevier, pg: 639-676.
- Alhashemi AH, Sekhavatjou MS, Kiabi BH, Karbassi AR (2012). Bioaccumulation of trace elements in water, sediment, and six fish species from a freshwater wetland, Iran. Microchemical journal 104: 1-6.
- Cot-Committee on Toxicology (2004), Advise on fish consumption: Benefits and risks. Food standards Agency and the Department of Health. Norwich, UK.
- Paul S, Joseph D, Majumdar M (2021) Health risk assessment of Macro, Trace-elements and heavy metal in various Indian Antidiabetic Polyherbal formulations. Sci. Pollut. Res. 28: 40929-40937. [crossref]
- Devesa V, Vélez D, Montoro R (2008). Effect of thermal treatments on arsenic species contents in food. Food and Chemical Toxicology 46: 1-8. [crossref]
- USFDA (1993) Guidance document for arsenic in shellfish (pg: 25-27). Washington, DC: US Food and Drug Administration.
- ANZFA (2011) Australian and New Zealand Food Standards Code, Standard 1.4.1- Contaminants and Natural Toxicants (F2011C00542).
- Burger J, Gochfeld M (2005) Heavy metals in commercial fish in New Jersey. Environmental Research, 99: 403-412. [crossref]
- ANVISA (1998) Agência Nacional de Vigilância Sanitária. Portaria Ns.
- Sharif AKM, Alamgir M, Krishnamoorthy KR, Mustafe AI (1993b) Determination of Arsenic, Mercury, Selenium and Zinc in Tropical Marine Fish by Neutron Activation. Journal of Radioanalytical and Nuclear Chemistry 170: 299-307.
- Türkmen M, Türkmen A, Tepe Y, Töre Y, & Ates A (2009). Determination of metals in fish species from Aegean and Mediterranean Seas. Food Chemistry 113s.
- Friberg L, Piscator M, Nordberg Gs (1971). Cadmium in the Environment. Cleveland, Ohio: The Chemical Rubber Co, Press.
- Christensen FC, Olson EC (1957) Cadmium poisoning; report of a fatal case, with discussion of pathology and clinical aspects. Archives of Industrial Health 16: 8-13. [crossref]
- Plaskett D, Potter IC (1979). Heavy metal concentrations in the muscle tissue of 12 species of teleost from Cockburn Sound, Western Australia. Australian Journal of Marine and Freshwater Research 30: 607-616.
- Demirak A, Yilmaz F, Tuna AL, Ozdemir N (2006) Heavy metals in water, sediment and tissues of Leciscuscephalus from a stream in southwestern Turkey. Chemosphere 63: 1451-1458. [crossref]
- ANVISA (1998) Agência Nacional de VigilânciaSanitária. Portaria N.
- Sivaperumal P, Sankar TV, Nair PGV (2007). Heavy metal concentrations in fish, shellfish and fish products from internal markets of India vis-a-vis international standards. Food Chemistry 102: 612-620.
- Dabbaghmanesh H, Salehi NM, Siadatan J, Omrani GR (2011). Copper concentration in a healthy urban adult population of Southern Iran Mohammad. Biological Trace Element Research 144: 217-224. [crossref]
- Gorell JM, Johnson CC, Rybicki BA, Peterson EL, Kortsha GX, et al. (1997) Occupational exposures to metals as risk factors for Parkinson’s disease. Neurology 48: 650-658. [crossref]
- Bebbington GN, Mackay NJ, Chvojka R, Williams RJ, Dunn A, et al. (1977). Heavy metals, selenium and arsenic in nine species of Australian commercial fish. Australian Journal of Marine and Freshwater Research 28: 277-286.
- Dural M, Goksu MZL, Ozak AA (2007) Investigation of heavy metal levels in economically important fish species captured from the Tuzla lagoon. Food Chemistry 102: 415-421.
- Cronin M, Davies IM, Newton A, Pirie JM, Topping G, et al. (1998). Trace metal concentrations in deep sea fish from the North Atlantic. Marine Environmental Research 45: 225-238.
- Demirak A, Yilmaz F, Tuna AL, Ozdemir N (2006) Heavy metals in water, sediment and tissues of Leciscuscephalus from a stream in southwestern Turkey. Chemosphere 63: 1451-1458. [crossref]
- Alam MGM, Tanaka A, Allinson G, Laurenson LJB, Stagnitti F, et al. (2002) A comparison of trace element concentrations in cultured and wild carp (Cyprinus carpio) of Lake Kasumigaura, Japan. Ecotoxicology and Environmental Safety 53: 348-354. [crossref]
- Schümann K, Ettle T, Szegner B, Elsenhans B, Solomons NW (2007). On risks and benefits of iron supplementation recommendations for iron intake revisited. Journal of Trace Elements in Medicine and Biology 21. [crossref]
- Karadede H, Oymak, SA, Ünlü E (2004) Heavy metals in mullet, Liza abu, and catfish, Silurustriostegus, from the Atatürk Dam Lake (Euphrates), Turkey. Environ. Int. 2004, 183–188.
- Chale FMM (2002) Trace metal concentrations in water, sediments and fish tissue from Lake Tanganyika. Total Environ 299: 115-121. [crossref]
- Tariq J, Jaffar M, Ashraf M (1994) Trace metal concentration, distribution and correlation in water, sediment and fish from the Ravi River, Pakistan. Res. 19: 131-139.
- Ashraf M, Tariq J, Jaffar M (1991) Contents of trace metals in fish, sediment and water from three freshwater reservoirs on the Indus River, Pakistan. Res. 12: 355-364.
- Lynch SR, Baynes RD (1996) Deliberations and evaluations of the approaches, endpoints and paradigms for iron dietary recommendations. American Institute of Nutrition 2404S, 2409S.
- Aschner J, Aschner M (2005). Nutritional aspects of manganese homeostasis. Molecular Aspects of Medicine 26: 353-362. [crossref]
- National Academy of Sciences (2001) Dietary Reference Intakes for vitamin A, vitamin K, arsenic, boron, chromium, copper, iodine, iron, manganese, molybdenum, nickel, silicon, vanadium, and zinc. A report of the panel on micronutrients, subcommittees on upper reference levels of nutrients and of interpretation and use of dietary reference intakes, and the standing committee on the scientific evaluation of dietary reference intakes. Washington DC: National Academy Press.
- Amin MN, Begum A, Mondal MGK (2011) Trace element concentrations present in five species of freshwater fish of Bangladesh. Bangladesh journal of scientific and industrial research 46: 27-32.
- Al-Saleh I (2000). Selenium status in Saudi Arabia. Journal of Trace Elements in Medicine and Biology 14.
- Institute of Medicine (2001) Dietary reference intakes for vitamin C, vitamin E, selenium, and carotenoids. Food and Nutrition Board. Washington, DC: The National Academies Press.
- Ghosh BB, Mukhopandhyay MK, Bagchi MM (1985). Proc. National Seminar on Pollution Control and Environmental Management (pg: 194-199).
- Gorell JM, Johnson C C, Rybicki BA, Peterson EL, Kortsha GX, et al. (1997). Occupational exposures to metals as risk factors for Parkinson’s disease. Neurology 48: 650-658. [crossref]
- Prasad AS (1983) The role of Zinc in gastrointestinal and liver disease. Clinics in Gastroenterology 12: 713-741. [crossref]
- Bebbington GN, Mackay NJ, Chvojka R, Williams RJ, Dunn A, et al. (1977). Heavy metals, selenium and arsenic in nine species of Australian commercial fish. Australian Journal of Marine and Freshwater Research 28: 277-286.
- Cliton HI, Ujagwung GU, Michael H (2008) Trace metals in the tissues and shells of TympanotonusFuscatus var. Radula from the Mangrove Swamps of the Bukuma Oil Field, Niger Delta. European journal of Scientific Research 24: 468-476.
- Scherz H, Kirchhoff E (2006). Trace elements in foods: zinc contents of raw foods – a comparison of data originating from different geographical regions of the world. Journal of Food Composition and Analysis 19.
- Institute of Medicine (2001) Dietary reference intakes for vitamin C, vitamin E, selenium, and carotenoids. Food and Nutrition Board. Washington, DC: The National Academies Press.
- Garbunov AV, Lyapunov SM, Okina OI, Frontasyeva MV, Pavlov SS, Nuclear and related analytical techniques in ecology: Impact of geological factors on the balance of trace elements in the human organism.
- Allison A, Yates PhD, Rdsandra A, Schlicker PhD, Carol W, et al. (1998) Dietary Reference Intakes: The New Basis for Recommendations for Calcium and Related Nutrients, B Vitamins, and Choline. Journal of the American Dietetic Association. 98: 699-706. [crossref]