DOI: 10.31038/MIP.2022333
Abstract
The purpose of this study was to evaluate the reproducibility of results yielded using a macELISA for detection of llergen specific IgE in dogs and cats when run by ten different individuals in seven separate affiliated laboratories. Samples of 24 different sera samples were independently evaluated in each laboratory by differing operators in a single blinded fashion. For evaluations completed by multiple operators in a single laboratory, the average inter-operator variance was calculated to be 7.9% (range=6.5%-9.0%). The average intra-assay variance among reactive assay calibrators in all laboratories was 7.3% (range=2.8%-17.6%). The overall inter-assay inter-laboratory variance evident with reactive calibrators was consistent among laboratories and averaged 15.7% (range 14.8%-16.7%). All laboratories yielded similar profiles and magnitudes of responses for replicate unknown samples; dose response profiles observed in each of the laboratories were indistinguishable. Correlation of EAU observed for individual allergens between and among all laboratories was strong (r>0.85, p<0.001). Collectively, the results demonstrated that ELISA for measuring allergen specific IgE is reproducible, and documents that consistency of results can be achieved not only in an individual laboratory, but among different operators and between laboratories using the same ELISA.
Keywords
IgE, ELISA, Proficiency, Atopy, Allergy, Immunotherapy, Cross-reactive Carbohydrate
Introduction
Stallergenes Greer maintains a proficiency monitoring program for laboratories that routinely run macELISA [1] for evaluation of allergen specific IgE in serum samples. The foundation for this program is based on the desire for inter-laboratory standardization and quality control measures that ensure the uniformity, consistency, and reproducibility of results among laboratories that perform the assays. This program is designed to evaluate the proficiency of laboratories and ensures that individual operators yield consistent and reproducible results. The inaugural proficiency evaluations, initiated in 2009 and repeated in 2010, in six different laboratories documents that inter-laboratory standardization and quality control measures in the veterinary arena are on the immediate forefront and that uniformity, consistency, and reproducibility of results between laboratories is achievable [2]. Similarly, reproducibility of results among different laboratories was documented in the subsequent proficiency evaluations completed in 2013 [3], 2016 [4], 2018 [5], 2019 [6], 2020 [7], and 2021 [8]. The results presented herein summarize the comparative results observed in the affiliate laboratories for the most recent proficiency evaluations that were completed in 2022. The 2022 proficiency evaluation is the fourth documentation of the assay reproducibility since adopting a cross- reactive carbohydrate inhibitor in the sample diluent [6-9].
Materials and Methods
All serum samples, buffers, coated wells, calibrator solutions, and other assay components were aliquants of the respective lots of materials manufactured at Stallergenes Greer’s production facilities (located in Lenoir, NC, USA) and supplied as complete kits to the participating laboratories along with the exact instructions for completing the evaluations.
Participating Laboratories
Seven independent Veterinary Reference Laboratories (VRLs) participated in the 2022 proficiency evaluation of macELISA. Participating laboratories included three separate IDEXX laboratories located in Memphis, Tennessee, Kornwestheim, Germany, and Markham, Ontario Canada. Other affiliated European laboratories that participated in this evaluation included Agrolabo (Scarmagno, Italy), Laboratories LETI Pharma (Barcelona, Spain), and Ceva Biovac (Beaucouzé, France). Stallergenes Greer Laboratories (Lenoir, NC) served as the prototype for evaluation of the macELISA; the 2022 evaluations included results reported by four separate and independent operators. Because the performance characteristics of macELISA in Stallergenes Greer’s VRL have been well documented for use over an extended period [1-8], all results observed in the other participating laboratories were compared directly with the results observed in Stallergenes Greer’s reference laboratory.
Serum Samples
Separate pollen and mite reactive serum pools or non-reactive sera pools were prepared from cat and dog serum samples that previously had been evaluated using the macELISA for detection of allergen specific IgE. The reactivity of each sera pool ranged from nonreactive to reactive for multiple pollen or mite allergens. These sera pools and admixtures of the pools were used to construct a specific group of samples that exhibited varying reactivity to the allergens included in the evaluation panel. Twenty-four samples were included in the blinded evaluation conducted by each laboratory. Identical replicates of the high, low, and negative controls routinely used in the assay were also included as unknown samples. Also included in the array of samples was a five tube three-fold serial dilution of a highly pollen reactive pool, diluted into non-reactive sera, which served to document the dose response evident within the assay. All samples were stored at -20 °C for the interim between testing.
Calibrators
Mite reactive calibrator solutions of predetermined reactivity in the macELISA were prepared as three-fold serial dilutions of a sera pool highly reactive to Dermatophagoides farinae, Acarus siro, and Tyrophagus putrescentiae. Replicates of each were evaluated in each assay run and served as a standard response curve for normalizing results observed with the various samples. All results were expressed as ELISA Absorbance Units (EAU) which are background-corrected observed responses expressed as milli absorbance.
Buffers
The buffers used throughout have been previously described [1- 8], and included: a) well coating buffer: 0.05 M sodium carbonate bicarbonate buffer, pH 9.6; b) wash buffer: phosphate buffered saline (PBS), pH 7.4, containing 0.05% Tween 20, and 0.05% sodium azide; c) reagent diluent buffer: PBS, pH 7.4, containing 1% fish gelatin, 0.05% Tween 20 and 05% sodium azide. The buffer used for dilution of serum samples was identical to the reagent diluent buffer, but it has been supplemented (2.5 mG/mL) with a cross-reactive carbohydrate inhibitor derived from the carbohydrate components present in bromelain (BROM-CCD) [9]. BROM-CCD was prepared in house and remains a proprietary product of Stallergenes Greer (Lenoir, NC, USA).
Allergen Panel
The allergen panel was a 24 allergen composite derived from the array of allergens that are included in the specific panels routinely evaluated in the various laboratories; the composite allergen panel consisted of 4 grasses, 6 weeds, 6 trees, 5 mites, and 3 fungi. The protocol for coating and storage of wells has been previously described [1-8]. Immulon 4HBH flat bottom 12 well strip assemblies (Thermo Electron Corporation, Waltham, MA) were used throughout and served as the solid phase for all assays. The individual extracts were diluted in bicarbonate buffer (pH 9.6) and 100 µL was added to each assigned well. Following overnight incubation at 4-8°C, the wells were washed with PBS, blocked with 1% monoethanolamine (pH 7.5) then air dried and stored at 4-8°C in Ziploc bags until used.
Sample Evaluations – macELISA
The operational characteristics and procedures for the macELISAs have been previously described [1-8]. Following incubation of allergen coated wells with an appropriately diluted serum sample, allergen-specific IgE is detected using a secondary antibody mixture of biotinylated monoclonal anti-IgE antibodies, streptavidin alkaline phosphatase as the enzyme conjugate, and p-nitrophenylphosphate (pNPP) as substrate reagent. Specific IgE reactivity to the allergens is then estimated by determining the absorbance of each well measured at 405 nM using an automated plate reader. All results are expressed as ELISA Absorbance Units (EAU), which are background-corrected observed responses expressed as milli absorbance [1].
Statistics
A coefficient of variation was calculated as the ratio of standard deviation and means of the responses observed for the calibrator solutions within different runs in multiple laboratories. Pearson’s correlation statistic was used for inter-laboratory comparison among individual allergens. Statistical analyses were conducted using EXCEL (2016; Microsoft; Redmond, WA, USA).
Results
The assay variance (% CV) observed with the calibrator solutions in the different laboratories are presented in Table 1 and are representative of the assay reproducibility in the various laboratories. The average intra-assay % CV among positive calibrators (#1-5) was 7.3% (range=2.8%-17.6%); differences among laboratories or between assays and within assay runs were not detected. No substantial difference in results among various operators were revealed. The average inter-operator variance documented for Stallergenes Greer technicians was calculated to be 7.9% (range=6.5%-9.0%). Increased intra-assay variability was evident with the background ODs (average 9.2%; range 4.8%-22.5%). A negative response is classified as anything with an EAU below 150 [1]. Any analysis of results below this threshold, especially when looking at %CV and relative differences, should be done cautiously.
Table 1: Calculated variance of macELISA calibrator solutions observed with different laboratory runs by multiple operators during the 2021 Proficiency evaluation.
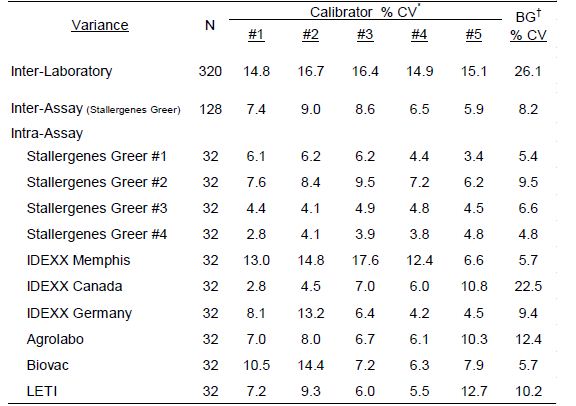
*Calibrator #1 is prepared as a dilution of a sera pool which is highly reactive to mite allergens; Calibrators #2 – #5 are prepared as a serial 3-fold dilution of calibrator #1.
†Background responses observed with diluent in place of serum sample.
To evaluate the strength of association with the magnitude of EAU results observed for each allergen among the different laboratories a Pearson’s correlation coefficient was determined (Microsoft Excel 2016) for each laboratory pair. Because the macELISA is designed to yield comparable responses in dog and cat samples, comparison of results among affiliate laboratories included both cat and dog samples as a single population of sera samples [5-8]. These results (Table 2) demonstrate that good inter-laboratory correlation (r>0.80; p<0.001) is evident between the results observed in Stallergenes Greer laboratory and those observed in six affiliate laboratories for all pollen, mite, and fungi allergens. The overall correlation of results observed in the various laboratories are summarized in Table 3; a very strong correlation (r>0.90, p<0.001) was demonstrated between and among the results of the participating laboratories.
Table 2: Inter-laboratory correlation of macELISA results observed with individual allergens in Stallergenes Greer Laboratory and the results observed in the individual affiliate laboratories.
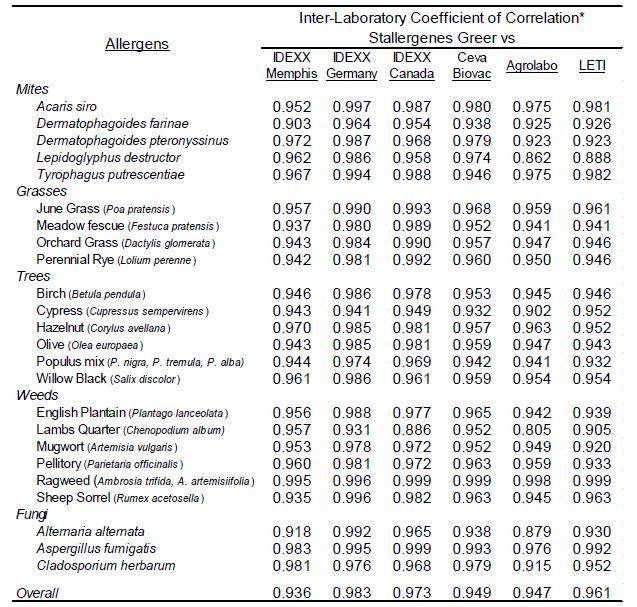
*Pearson Correlation Coefficient (r); Good Correlation (r > 0.8, p<0.001)
Table 3: Inter-laboratory correlation of macELISA results observed among individual affiliate laboratories
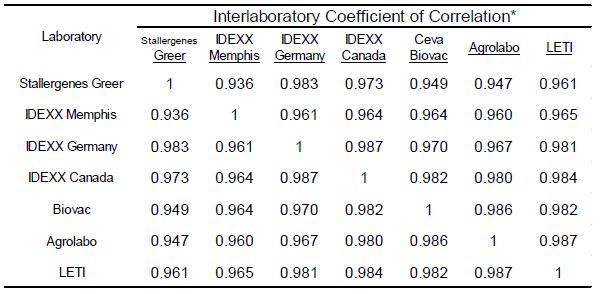
*Pearson Correlation Coefficient (r); Good Correlation (r > 0.8, p<0.001)
For an evaluation of the dose response in this ELISA, a five tube three-fold serial dilution of a reactive dog sera pool was prepared using a negative cat sera pool as diluent. Each of the dilutions was then evaluated by all of the participating laboratories as unknown independent samples. Similar responses were yielded by all of the laboratories and the results observed within the various laboratories are encompassed by the acceptable variance limits [1-3] (±20%) established for macELISA. Further, the magnitude of responses observed in each laboratory was reduced in direct proportion to dilution. Consequently, the dose responses for the individual allergens are presented as aggregate responses. The results presented in Figure 1 confirm the sera pool was highly reactive to mites as well as grass, weed, and tree pollen allergens, but it was not reactive to fungi. To be expected, the magnitude of responses observed in each laboratory was reduced in direct proportion to dilution. Results from the final tube in the dilution scheme yielded results that were indistinguishable from negative responses, indicating a dilution extinction of detectable response [9-14].
References
- Lee KW, Blankenship KD, McCurry ZM, Esch RE, et al. (2009) Performance characteristics of a monoclonal antibody cocktail-based ELISA for detection of allergen-specific IgE in dogs and comparison with a high affinity IgE receptor-based ELISA. Vet Dermatol 20: 157-64. [crossref]
- Lee KW, Blankenship KD, McCurry ZM, Kern G, et al. (2012) Reproducibility of a Monoclonal Antibody Cocktail Based ELISA for Detection of Allergen Specific IgE in Dogs: Proficiency Monitoring of macELISA in Six US and European Vet. Immunol Immunopathol 148: 267-275. [crossref]
- Lee, W, Blankenship, K, McKinney, B, Kern, G, et al. (2015) Proficiency monitoring of monoclonal antibody cocktail-based enzyme-linked immunosorbent assay for detection of allergen-specific immunoglobulin E in dogs. Journal of Veterinary Diagnostic Investigation 27: 461-469. [crossref]
- Lee K, Blankenship K, McKinney B, Kern G, et al. (2017) Continued Proficiency Monitoring of Monoclonal Antibody Cocktail-Based Enzyme-Linked Immunosorbent Assay for Detection of Allergen Specific Immunoglobulin E in Dogs – 2016. Microbiol Immunol Pathol 1: 1-10. [crossref]
- Lee K, Blankenship K, McKinney B, Kern G, et (2018) Proficiency Monitoring of Allergen Specific IgE macELISA – 2018. Microbiol Immunol Pathol 2: 1-6. [crossref]
- Enck K, Lee K, Blankenship K, McKinney B, et (2019) Proficiency Monitoring of Allergen-Specific IgE macELISA – 2019. Microbiol Immunol Pathol 3: 1-6. [crossref]
- Enck K, Kee K, McKinney B, et (2020) Proficiency Monitoring of Allergen-Specific IgE macELISA – 2020. Inter J Vet Biosci 4: 1-7. [crossref]
- Smith M, Enck K, McKinney B, et al. (2021) Proficiency Monitoring of Allergen- Specific IgE macELISA – Inter J Vet Biosci 5: 1-8. [crossref]
- Lee KW, Blankenship KD, McKinney BH, Morris, DO (2020) Detection and Inhibition of IgE for cross-reactive carbohydrate determinants evident in an enzyme linked immunosorbent assay for detection of allergen specific IgE in the serum of dogs and Vet Dermatol 31: 439-e116. [crossref]
- DeBoer DJ, Hillier A (2001) The ACVD task force on canine atopic dermatitis (XVI): laboratory evaluation of dogs with atopic dermatitis with serum-based “allergy” Vet Immunol Immunopathol 81: 277-87. [crossref]
- Gorman NT, Halliwell, REW (1989) Atopic In: Halliwell REW, Gorman NT. ed. Veterinary Clinical Immunology, 232-52. WB Saunders, Philadelphia.
- Griffin CE, DeBoer DJ (2001) The ACVD task force on canine atopic dermatitis (XIV): clinical manifestation of canine atopic Vet Immunol Immunopathology 81: 255-69. [crossref]
- Griffin CE, Hillier A (2001) The ACVD task force on canine atopic dermatitis (XXIV): allergen-specific immunotherapy Vet Immunol Immunopathol 81: 363-83. [crossref]
- Tijssen P (1993) Processing of data and reporting of results of enzyme In: Burdon, RH, van Knippenberg PH, editors. Practice and Theory of Enzyme Immunoassays 385-421. Elsevier, Amsterdam.